SITUACIÓN Y FUTURO DE LOS CÍTRICOS EN EL MERCADO...
50
SITUACIÓN Y FUTURO DE LOS CÍTRICOS EN EL MERCADO EUROPEO ABRIL 2019
Transcript of SITUACIÓN Y FUTURO DE LOS CÍTRICOS EN EL MERCADO...

SITUACIÓN Y FUTURO DE LOS CÍTRICOS EN EL MERCADO EUROPEO
A B R I L 2 0 1 9

F U N D A D O E N 1 9 3 1 M U R C I A , E S PA Ñ A
E M P R E S A FA M I L I A R D E 3 ª G E N E R A C I Ó N
5 0 PA Í S E S 1 , 3 0 0 M € FA C T U R A C I Ó N A N U A L
I N T E G R A C I Ó N E 2 E C O M P L E TA
A M P L I O P O R TA F O L I O C O N G R A N E X P E R I E N C I A E N C Í T R I C O S Y U VA D E M E S A
I M P U L S A D O P O R L A I N N O VA C I Ó N Y L A T E C N O L O G Í A
ÍNDICE:
- I M P O R TA N C I A D E L M E R C A D O E U R O P E O PA R A P E R Ú
- P R E S E N T E Y F U T U R O D E L C O N S U M O D E C Í T R I C O S E N E U R O PA
- T E N D E N C I A S D E L C O N S U M I D O R
- P E R S P E C T I VA D E L O S R E TA I L E R S E U R O P E O S

IMPORTANCIA DEL MERCADO EUROPEO PARA PERÚ

30,06734,819
46,180
64,172
46,738
68,202
78,083
89,24693,301
113,427115,122
127,788
166,615
188,275
0
20,000
40,000
60,000
80,000
100,000
120,000
140,000
160,000
180,000
200,000
2004 2005 2006 2007 2008 2009 2010 2011 2012 2013 2014 2015 2016 2017 2018 2019
TOTAL EXPORTACIÓN (TM) vs AÑO
E VO LU C I Ó N D E L A S E X P O RTA C I O N ES D E C Í T R I CO S D ES D E P E R Ú

280 4457,834 14,415 3,785
7,538 9,893 7,464 9,453 8,504 6,314 10,377 16,685
18,79618,745
21,652 21,397
28,80323,095
36,42539,652
47,06652,288
71,32175,127
91,121
113,651
132,316
10,49812,150
15,822 19,75318,204
21,82925,671
31,65127,937
29,205
25,45920,877
23,924 19,397
0
10,000
20,000
30,000
40,000
50,000
60,000
70,000
80,000
90,000
100,000
110,000
120,000
130,000
140,000
2004 2005 2006 2007 2008 2009 2010 2011 2012 2013 2014 2015 2016 2017 2018
CÍTRICOS (TM) vs AÑO
Naranja Mandarina Tangelo Clementina Toronjas L. Sutil L. Tahiti
D ES G LO S E P O R C AT EG O R Í A D E L A S E X P O RTA C I O N ES P E R UA N A S

67.665.659
40.332.509
24.633.970
14.482.594
10.288.613
7.659.908
6.820.954
3.046.893
1.719.617
1.401.697
1.248.752
1.220.952
- 5 10 15 20 25 30 35 40 45 50 55 60 65 70
ESTADOS UNIDOS
REINO UNIDO
HOLANDA
CANADA
CHINA
CHILE
RUSIA
IRLANDA
PANAMA
REP. DOMINICANA
COLOMBIA
COSTA RICA
Millones Kg’s
TOTALES 2018
D ES G LO S E P O R PA Í S D E L A S E X P O RTA C I O N ES P E R UA N A S

-
5
10
15
20
25
30
35
40
45
50
M. Tempranas Clementina M. Tardías Tangelos Naranjas Toronjas L. Sutil L. Tahiti Limon
PAÍS POR ESPECIE 2018 (Kg)
ESTADOS UNIDOS REINO UNIDO HOLANDA CANADA CHINA CHILE RUSIA IRLANDAMillones (kg)
D ES G LO S E P O R ES P EC I E Y PA Í S D E L A S E X P O RTA C I O N ES P E R UA N A S
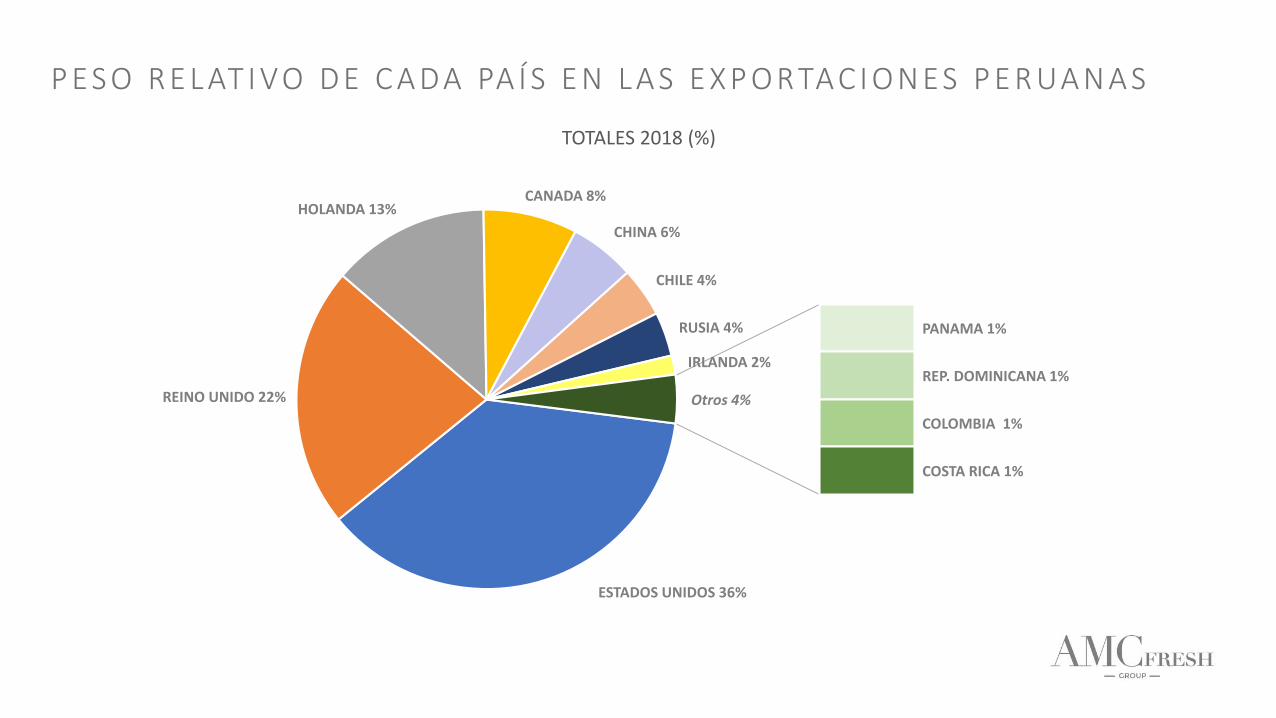
ESTADOS UNIDOS 36%
REINO UNIDO 22%
HOLANDA 13%CANADA 8%
CHINA 6%
CHILE 4%
RUSIA 4%
IRLANDA 2%
PANAMA 1%
REP. DOMINICANA 1%
COLOMBIA 1%
COSTA RICA 1%
Otros 4%
TOTALES 2018 (%)
P ES O R E L AT I VO D E C A DA PA Í S E N L A S E X P O RTA C I O N ES P E R UA N A S
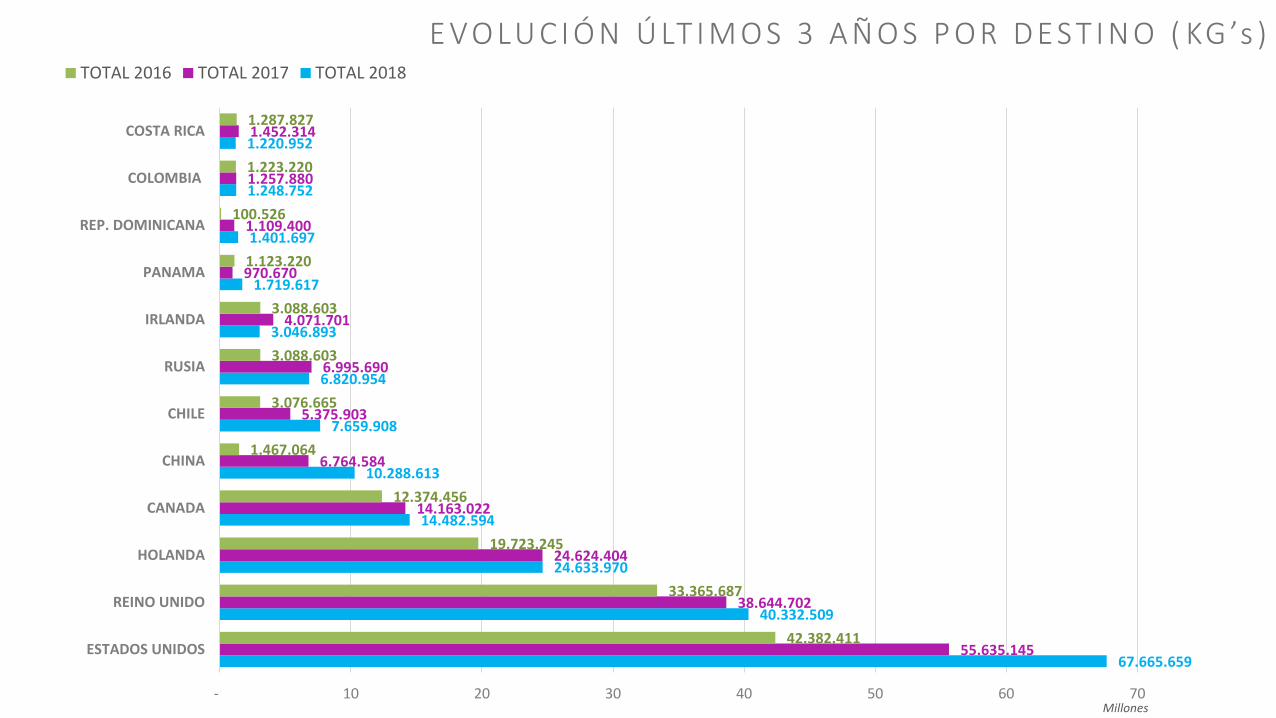
67.665.659
40.332.509
24.633.970
14.482.594
10.288.613
7.659.908
6.820.954
3.046.893
1.719.617
1.401.697
1.248.752
1.220.952
55.635.145
38.644.702
24.624.404
14.163.022
6.764.584
5.375.903
6.995.690
4.071.701
970.670
1.109.400
1.257.880
1.452.314
42.382.411
33.365.687
19.723.245
12.374.456
1.467.064
3.076.665
3.088.603
3.088.603
1.123.220
100.526
1.223.220
1.287.827
- 10 20 30 40 50 60 70
ESTADOS UNIDOS
REINO UNIDO
HOLANDA
CANADA
CHINA
CHILE
RUSIA
IRLANDA
PANAMA
REP. DOMINICANA
COLOMBIA
COSTA RICA
Millones
TOTAL 2016 TOTAL 2017 TOTAL 2018
E VO LU C I Ó N Ú LT I M O S 3 A Ñ O S P O R D EST I N O ( KG ’s )
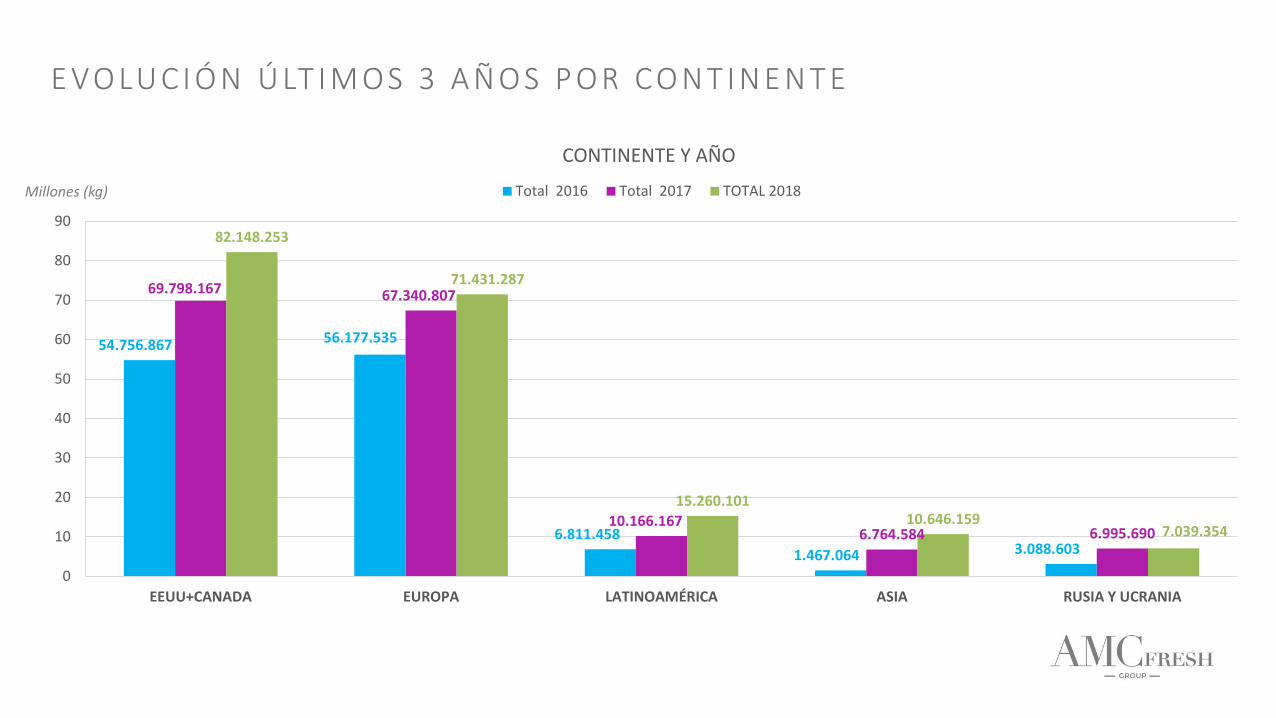
Millones (kg)
54.756.867 56.177.535
6.811.458
1.467.064 3.088.603
69.798.167 67.340.807
10.166.1676.764.584 6.995.690
82.148.253
71.431.287
15.260.10110.646.159
7.039.354
0
10
20
30
40
50
60
70
80
90
EEUU+CANADA EUROPA LATINOAMÉRICA ASIA RUSIA Y UCRANIA
CONTINENTE Y AÑO
Total 2016 Total 2017 TOTAL 2018
E VO LU C I Ó N Ú LT I M O S 3 A Ñ O S P O R CO N T I N E N T E
PRESENTE Y FUTURO DEL CONSUMO DE CÍTRICOS EN EUROPA

C R EC E N L A S I M P O RTAC I O N ES E U RO P EA S D E F R U TA S Y V E R D U R A S

11,4 MILLONES TM
+2,6% CAGR 2013-2018
E L CO N S U M O D E C Í T R I CO S E N E U RO PA A S C E N D I Ó A 1 1 , 4 M I L LO N ES T M E N 2 0 1 8
Source: USDA. Unión Europea-28

11,4
1,9
10,1
43,7
0,2
A S I A ES E L CO N T I N E N T E M Á S G R A N D E E N CO N S U M O D E C Í T R I CO S
Source: USDA.
4,2
MILLONES TM POR REGIÓN
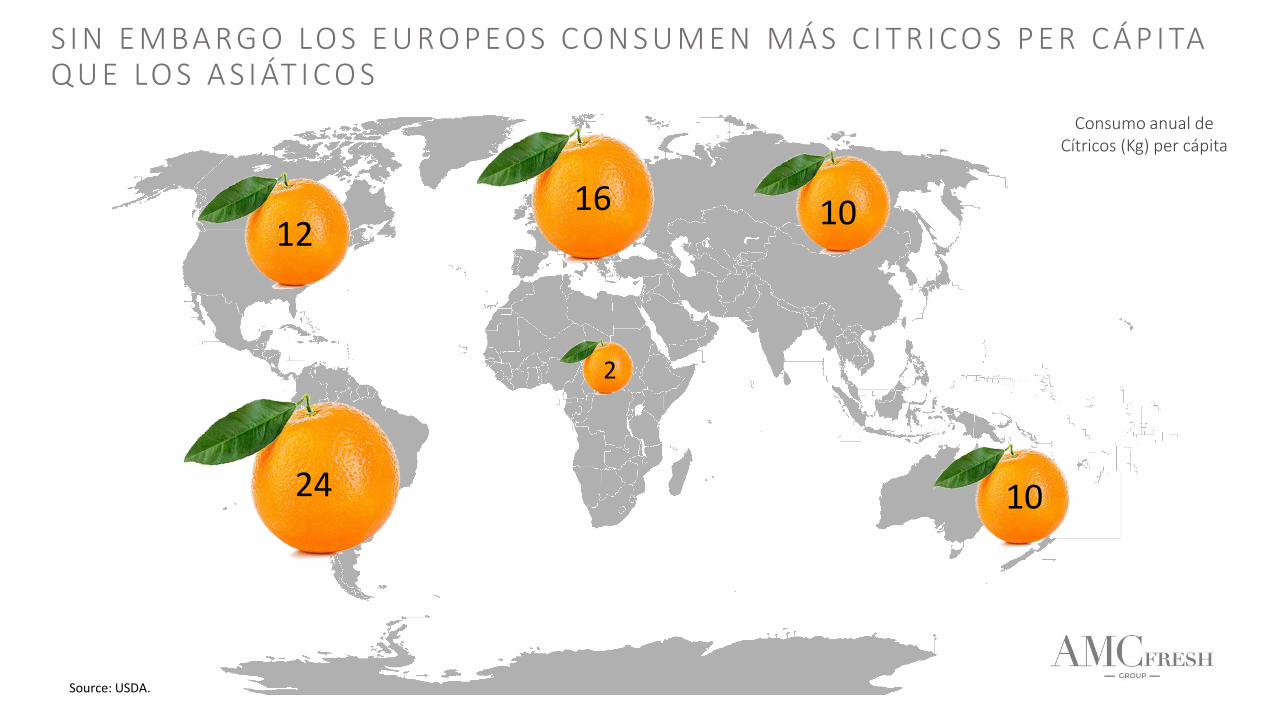
S I N E M BA RG O LO S E U RO P EO S CO N S U M E N M Á S C I T R I CO S P E R C Á P I TA Q U E LO S A S I ÁT I CO S
Source: USDA.
Consumo anual de Cítricos (Kg) per cápita
12
2
24
10
10
16

+2,6% +3,2%
AMBOS CONTINENTES CRECEN A UN RITMO S IMILAR
CAGR 2013 -2018Consumo de Cítricos
Source: USDA.
+2,2%
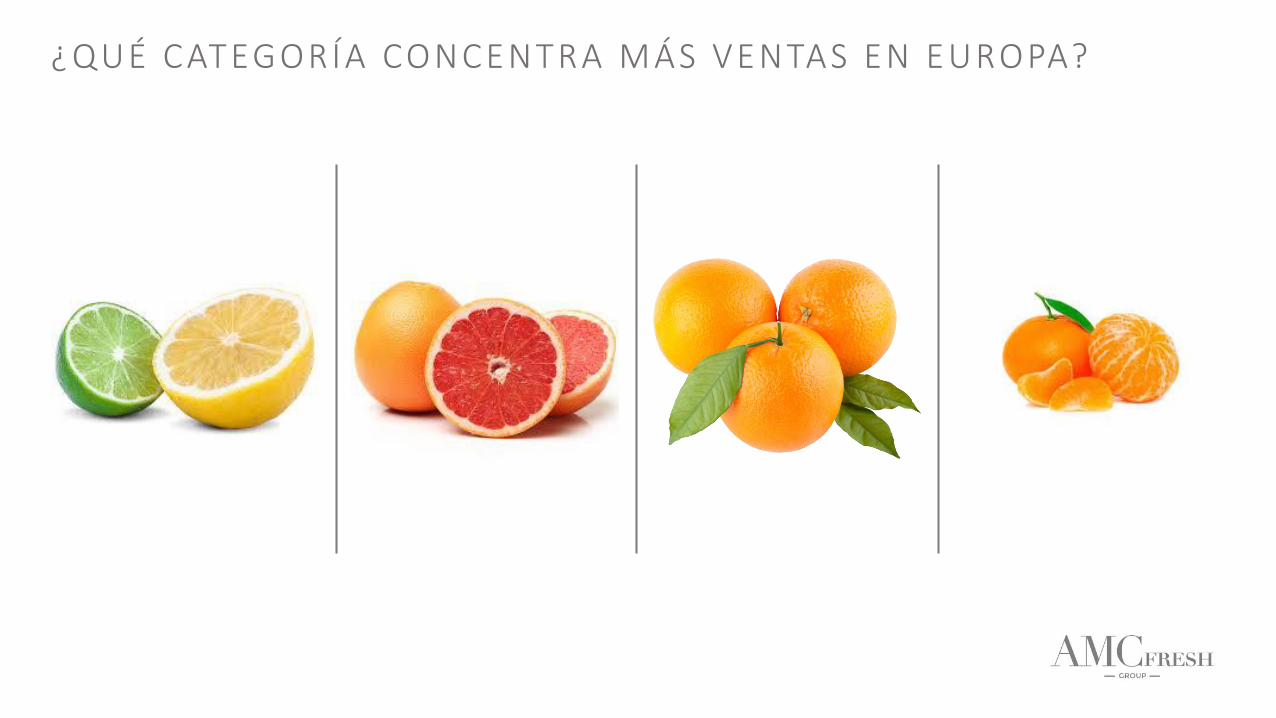
¿QUÉ CATEGORÍA CONCENTRA MÁS VENTAS EN EUROPA?

51%EUROPA ADORA
LAS NARANJAS
29%
16% 4%
NARANJAS MANDARINAS
LIMONES / LIMA POMELO
Source: USDA. Unión Europea-28
% Consumo anual (volumen) de cítricos en Europa
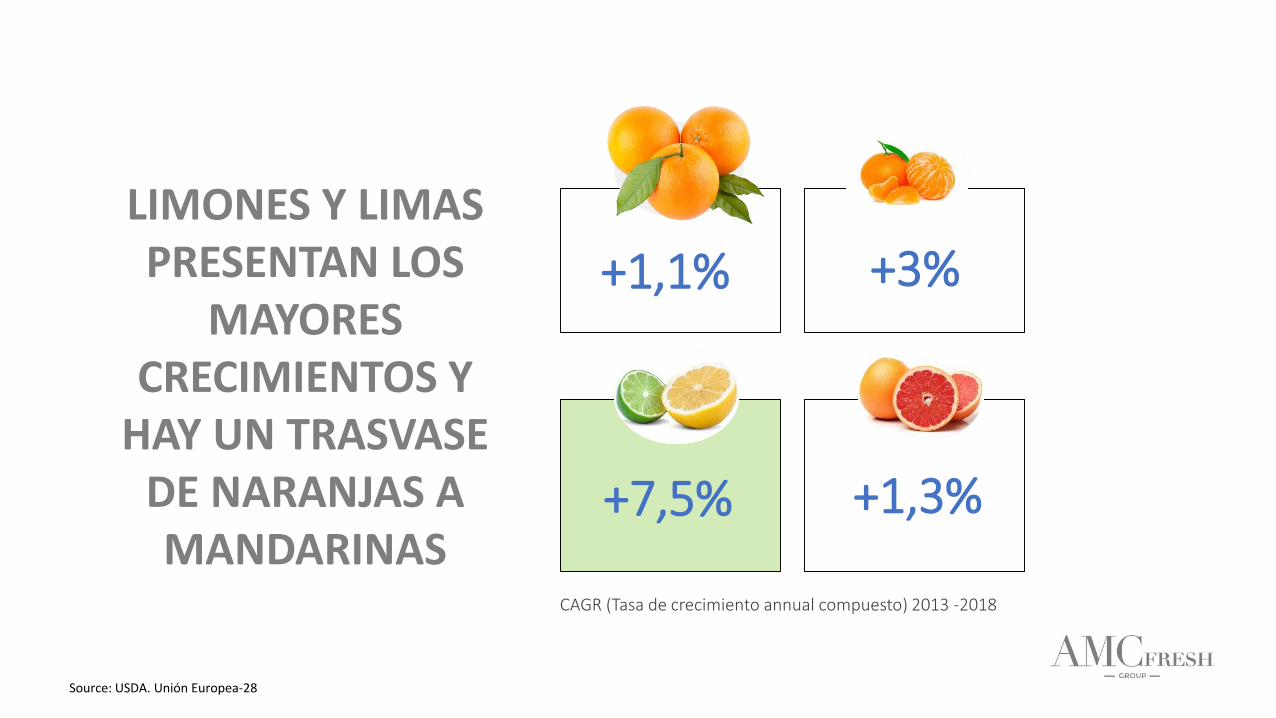
+1,1%
LIMONES Y LIMAS PRESENTAN LOS
MAYORES CRECIMIENTOS Y
HAY UN TRASVASE DE NARANJAS A MANDARINAS
+3%
+7,5% +1,3%
CAGR (Tasa de crecimiento annual compuesto) 2013 -2018
Source: USDA. Unión Europea-28

EVOLUCIÓN DE LAS CATEGORÍAS EN LA ÚLT IMA DÉCADA
Consumo de cítricos en la Unión Europea – 000 MT
Source: USDA. Unión Europea-28
2006 2007 2008 2009 2010 2011 2012 2013 2014 2015 2016 2017 2018
European Union 9.581 10.424 10.598 10.366 9.810 10.023 9.616 10.089 10.491 10.415 11.304 10.805 11.454
Naranjas 5.060 5.772 5.869 5.717 5.324 5.536 5.382 5.549 5.333 5.407 5.950 5.735 5.874
Mandarinas 2.724 2.753 2.930 2.812 2.720 2.711 2.493 2.848 3.206 2.988 3.265 2.892 3.306
Limones / Limas 1.359 1.404 1.364 1.395 1.386 1.377 1.333 1.275 1.537 1.582 1.691 1.733 1.829
Pomelos 438 495 435 442 380 399 408 417 415 438 398 445 445
El consumo de limones y limas ha aumentado un 34% desde el 2008 y han pasado de suponer un 13% del consumo de cítricos hace 10 años a un 16% en la actualidad.
El consumo de mandarinas ha aumentado un 13% desde el 2008 y han pasado de suponer un 27% del consumo de cítricos hace 10 años a un 29% en la actualidad.
El consumo de naranjas es el más importante y se ha mantenido estable, pero ha perdido cuota frente a otras categorías (del 55% al 51% del consumo de cítricos).

0
200
400
600
800
1000
1200
1400
1600
1800
2000
2008 2009 2010 2011 2012 2013 2014 2015 2016 2017 2018
EL CONSUMO DE L IMONES Y L IMA SE HA ACELERADO EN LOS ÚLT IMOS 5 AÑOS EN EUROPA
Consumo de cítricos en la Unión Europea – 000 MT y % variación vs año anterior
Source: USDA. Unión Europea-28
El crecimiento de su uso como ingrediente en “Fresh food” (mermeladas, bollería, dulces, ensaladas) y el auge del Gin&Tonic, agua con limón y otros cocktails ha aumentado su consumo en los últimos años
0
1000
2000
3000
4000
5000
6000
7000
2008 2009 2010 2011 2012 2013 2014 2015 2016 2017 2018
0
500
1000
1500
2000
2500
3000
3500
2008 2009 2010 2011 2012 2013 2014 2015 2016 2017 2018
+21% +3%+7% +2% +6%
+14%
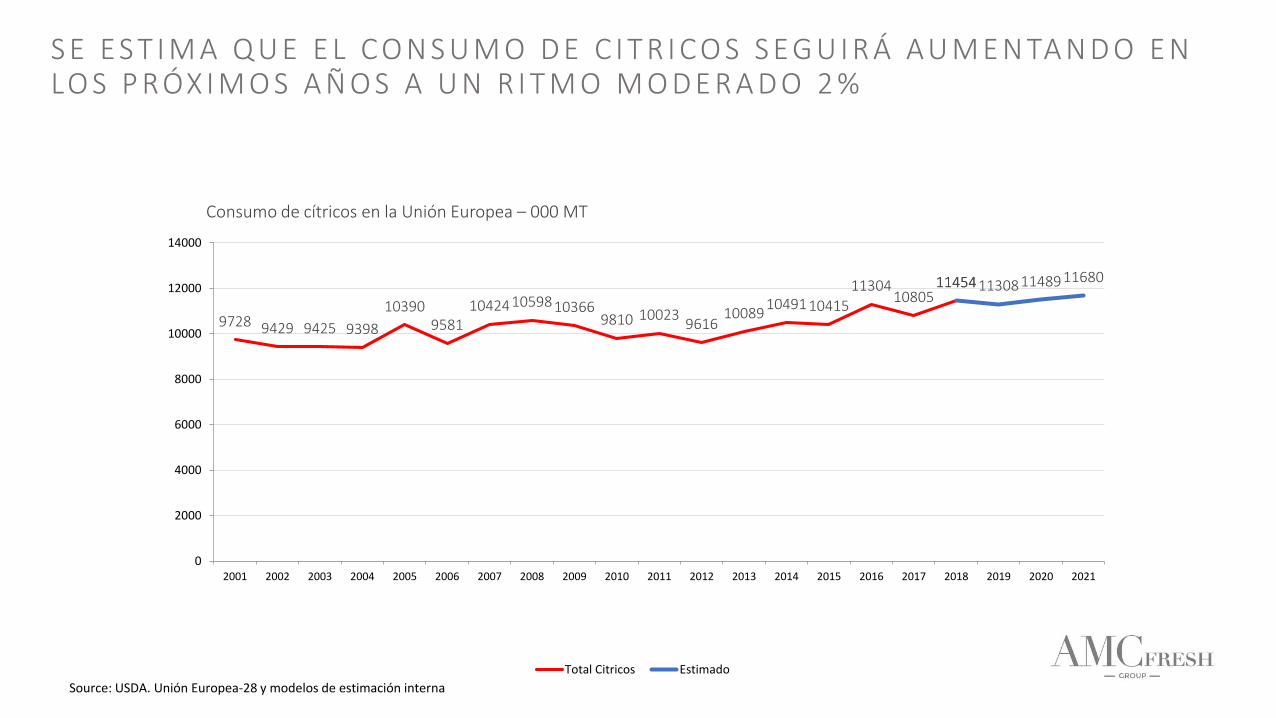
9728 9429 9425 9398
103909581
1042410598103669810 10023
961610089
1049110415
1130410805
1145411454113081148911680
0
2000
4000
6000
8000
10000
12000
14000
2001 2002 2003 2004 2005 2006 2007 2008 2009 2010 2011 2012 2013 2014 2015 2016 2017 2018 2019 2020 2021
Total Citricos Estimado
S E E S T I M A Q U E E L C O N S U M O D E C I T R I C O S S E G U I R Á AU M E N TA N D O E N LO S P RÓX I M O S A Ñ O S A U N R I T M O M O D E R A D O 2 %
Source: USDA. Unión Europea-28 y modelos de estimación interna
Consumo de cítricos en la Unión Europea – 000 MT

PERSPECTIVASA FUTURO POR
CATEGORÍA El consumo de naranjas frescasse mantiene estable y pierdecuota en favor de mandarinas
para uso “On the Go”
Source: USDA, MAPA, BMEL, FAS y análisis interno
Se prevee un aumento del consumo en línea con el auge de
la producción
Su tendencia positiva continuaráen los próximos años.
El consumo actual per cápita es 3 kg en la Unión Europea.
El consumo de pomelos permanecerá estable en los
próximos años, siendo la categoría de menor consumo
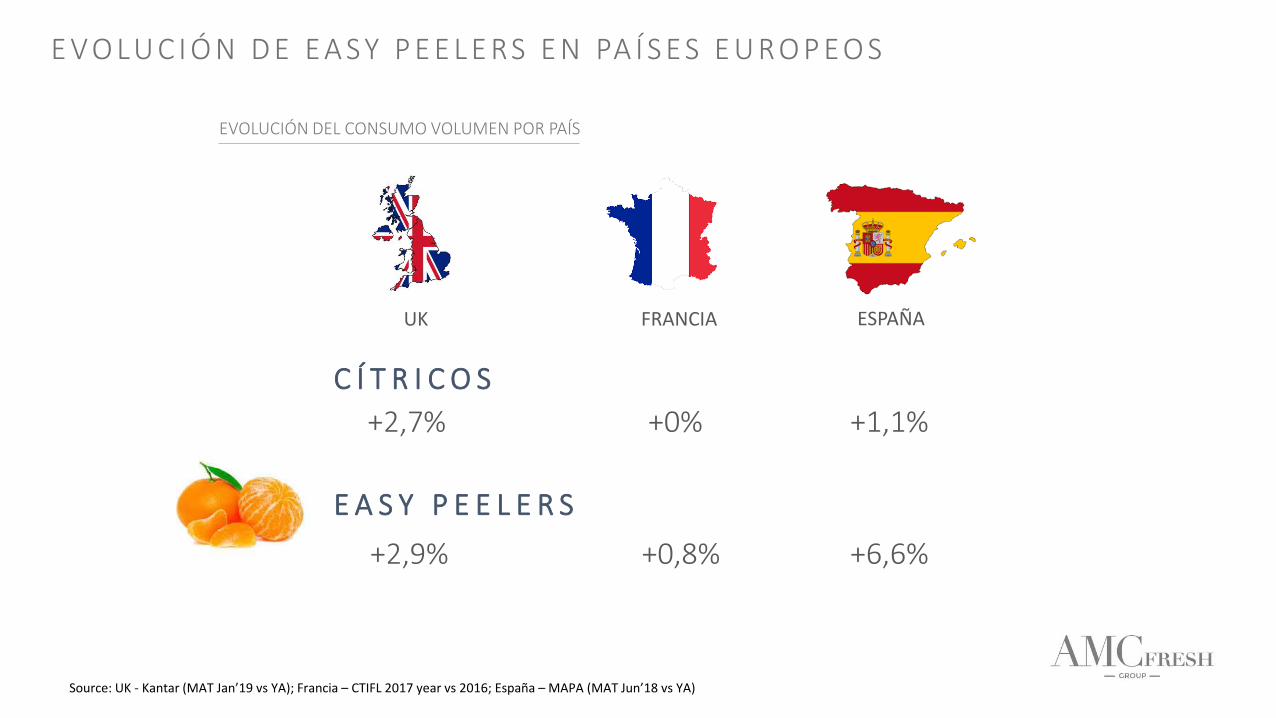
E V O LU C I Ó N D E E A S Y P E E L E RS E N PA Í S E S E U RO P EO S
C Í T R I C O S
+2,7%
E A S Y P E E L E R S
+2,9%
Source: UK - Kantar (MAT Jan’19 vs YA); Francia – CTIFL 2017 year vs 2016; España – MAPA (MAT Jun’18 vs YA)
EVOLUCIÓN DEL CONSUMO VOLUMEN POR PAÍS
+0%
+0,8%
UK FRANCIA
+1,1%
+6,6%
ESPAÑA

UK- CONSUMO DE CITRICOS (Millones kg)
LO S E U RO P EO S S O N D I F E R E N T E S E N E L C O N S U M O.
Mientras que el mercado inglés consume cítricos todo el año, en otros países del sur la demanda en verano es baja debido a la competencia de las frutas de temporada.
En España se sustituye el consumo de mandarinas por melón y sandía durante el verano.
Source: Kantar Panel para UK ( de Oct 2017 a Sep 2018) y Datos del MAPA para España (de Abr 2017 a Marzo 2018)
227
469
29
320
Mandarinas
Naranjas
H.Norte (Oct-Mar) H.Sur (Abr-Sep)
ESPAÑA- CONSUMO DE CITRICOS (Millones kg)
56
8
59
10
Limón
Pomelo
ESPAÑA- CONSUMO DE CITRICOS (Miles kg)
139
47
96
45
Mandarinas /Satsumas
Naranjas
H.Norte (Oct-Mar) H.Sur (Abr-Sep)
30
12
30
13
Limón /Lima
Pomelo
UK - CONSUMO DE CITRICOS (Miles kg)

TENDENCIAS DEL CONSUMIDOR
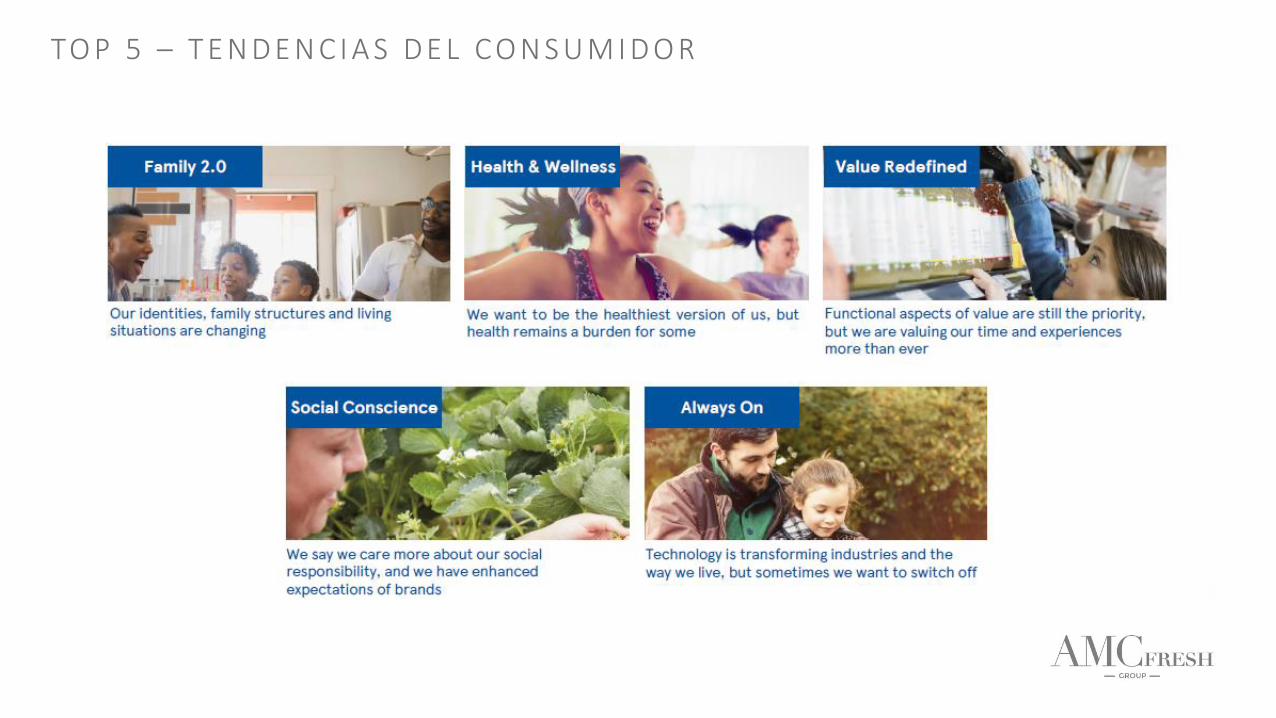
TO P 5 – T E N D E N C I A S D E L C O N S U M I D O R
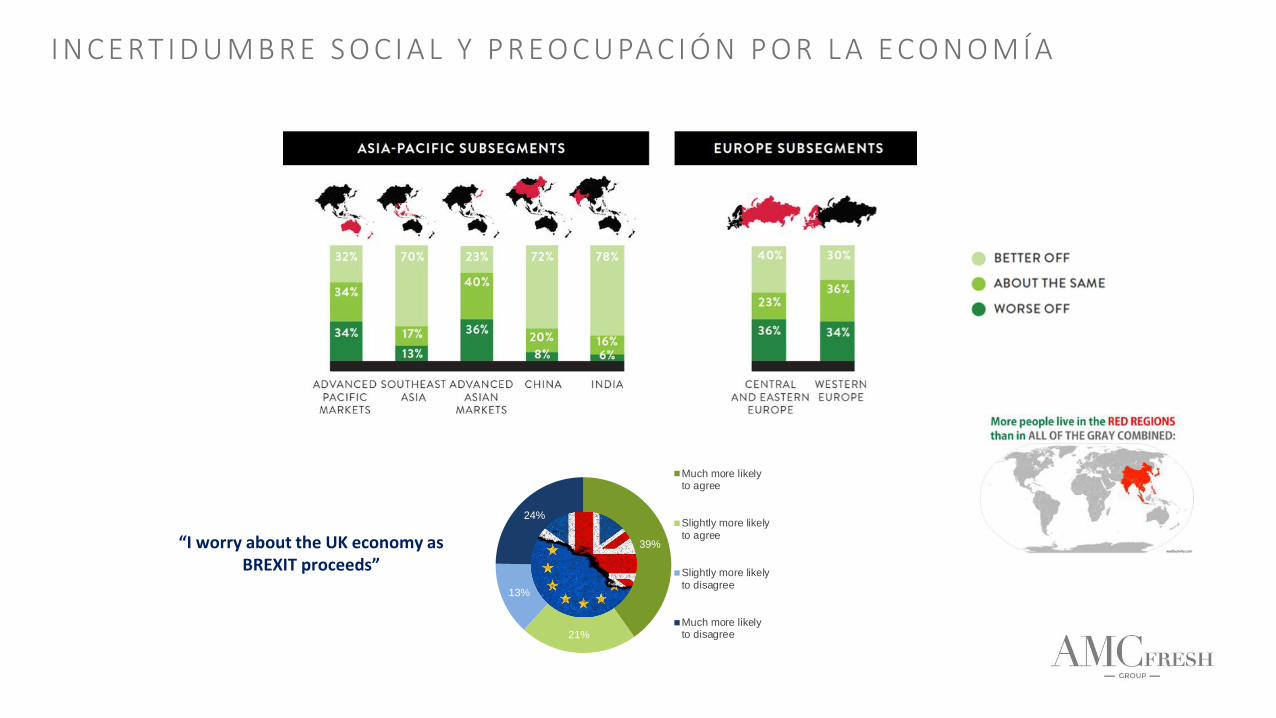
39%
21%
13%
24%
Much more likelyto agree
Slightly more likelyto agree
Slightly more likelyto disagree
Much more likelyto disagree
“I worry about the UK economy as BREXIT proceeds”
I N C E RT I D U M B R E S O C I A L Y P R EO C U PA C I Ó N P O R L A E C O N O M Í A

ETIQUETAS – FREE FROM
Los consumidores buscan etiquetas claras y quitar todos aquellosingredientes innecesarios (Conservantes, colorantes…)
Hay un auge de las categorías Free-From: las categorías sin lactosa y sin gluten crecen por encima del total mercado
TRANSPARENCIA
El origen de los productos, su trazabilidad y la historia que hay detrás de ellos se ha convertido en un factor importante en las decisiones de compra
PLANT- BASED
El número de productos plant-based ha aumentado su presencia en losRetailers, provocado por el aumento de la preocupación por la salud
PURO Y NATURAL
Los consumidores buscan productos naturales y puros, cada vez más. Estaes la principal motivación por la que compran producto orgánico o ecológico, que a su vez se asocial con un producto más sano y sabroso.
ON THE GO
Sin tiempo para nada, todos aquellosproductos que nos ahorren tiempo y ademásestén ligados al concepto salud evolucionanfavorablemente (Fruta cortada, berries….)
EXPERIENCIAS ÚNICAS
Los consumidores buscan productosdiferenciados que les permitan vivir experienciasúnicas. Y están dispuestos a pagar por ello un precio más alto.
M Á X I M O I N T E R É S E N C O N S U M I R P RO D U C TO S S A LU DA B L E S
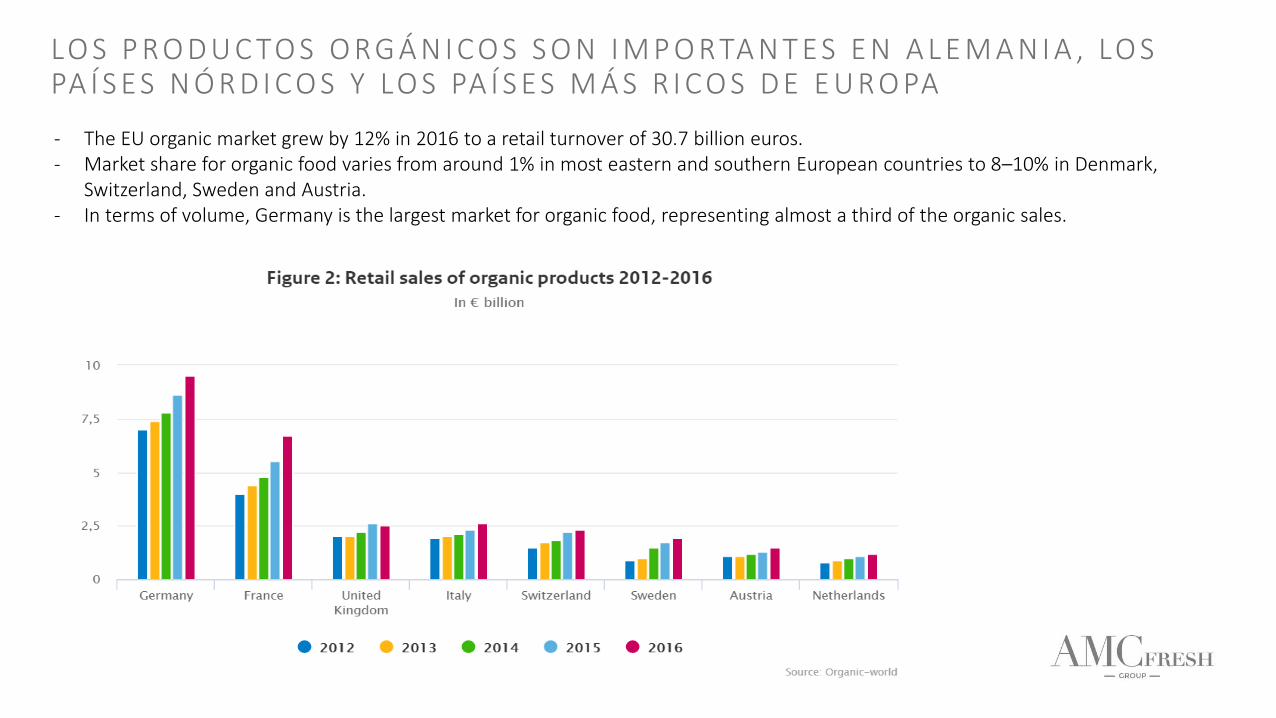
LO S P RO D U C TO S O RG Á N I C O S S O N I M P O RTA N T E S E N A L E M A N I A , LO S PA Í S E S N Ó R D I C O S Y LO S PA Í S E S M Á S R I C O S D E E U RO PA
- The EU organic market grew by 12% in 2016 to a retail turnover of 30.7 billion euros.- Market share for organic food varies from around 1% in most eastern and southern European countries to 8–10% in Denmark,
Switzerland, Sweden and Austria. - In terms of volume, Germany is the largest market for organic food, representing almost a third of the organic sales.

© IGD 2018 Page 32Source: ShopperVista, Feb’18-Apr’18. Base: 1,193 British supermarket and hypermarket shoppers
64%
47%
38%36%
26%
17%
57%
37% 36%
29%
44%
10%
It was more convenient It has a good choice ofproducts
It was quicker and easier It has good quality products It helps me to save money It is more enjoyable to shop
RAZONES PARA LA ELECCIÓN DE TIENDA
Supermarkets and hypermarkets All grocery stores
R E D E F I N I C I Ó N D E L VA LO R
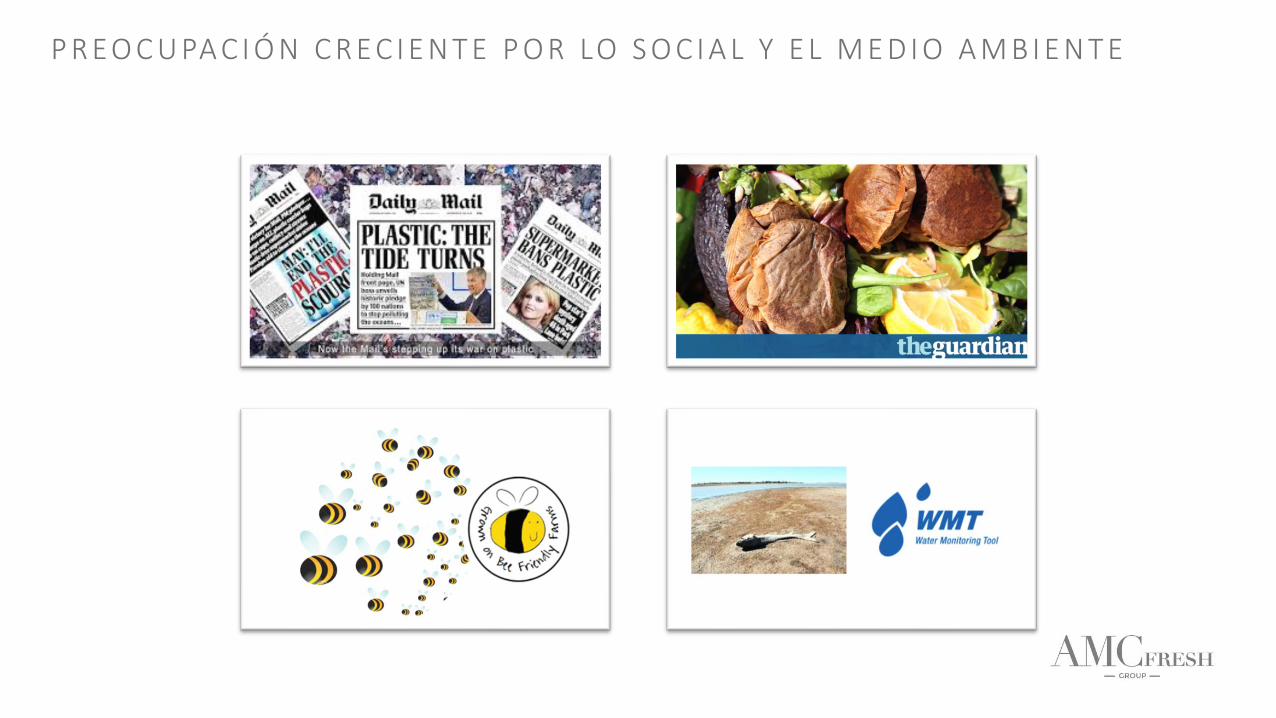
P R EO C U PA C I Ó N C R E C I E N T E P O R LO S O C I A L Y E L M E D I O A M B I E N T E

61% 59%50% 47% 45% 43%
30% 28% 26%
% consumers who have ever purchased these products / services on line
No puedo comprobar frescura No puedo ver la calidad No puedo tocar el producto, olerlo…
Off line
4,9%
On line
18,4%
Global forecast growth CAGR (2017-2022)
1. Nielsen- the quest for convenience report 2018; Future opportunities in FMCG Ecommerce 2018
S I E M P R E C O N E C TA D O S , AU G E D E L C O M E RC I O O N L I N E P E RO …

PERSPECTIVA DE LOS RETAILERS EUROPEOS
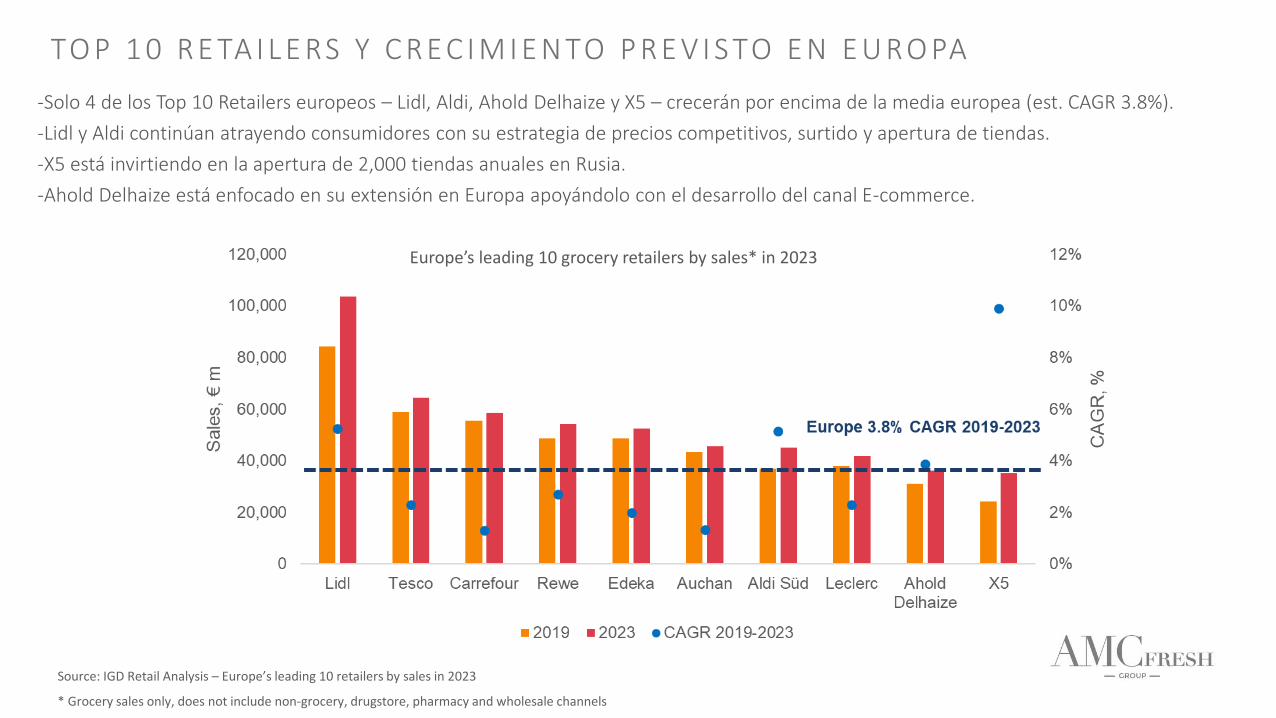
TO P 1 0 R E TA I L E RS Y C R E C I M I E N TO P R E V I S TO E N E U RO PA
Source: IGD Retail Analysis – Europe’s leading 10 retailers by sales in 2023
* Grocery sales only, does not include non-grocery, drugstore, pharmacy and wholesale channels
-Solo 4 de los Top 10 Retailers europeos – Lidl, Aldi, Ahold Delhaize y X5 – crecerán por encima de la media europea (est. CAGR 3.8%).
-Lidl y Aldi continúan atrayendo consumidores con su estrategia de precios competitivos, surtido y apertura de tiendas.
-X5 está invirtiendo en la apertura de 2,000 tiendas anuales en Rusia.
-Ahold Delhaize está enfocado en su extensión en Europa apoyándolo con el desarrollo del canal E-commerce.
Europe’s leading 10 grocery retailers by sales* in 2023

C U OTA D E M E RC A D O D E LO S P R I N C I PA L E S R E TA I L E RS E U RO P EO S
27,8%25,5%
20,2%
21%15,2%
18,1% 17,5%
15,2%
16,2%
24,3%
El Retailer #1 en cada país supera el 20% de cuota de mercado en valor en FMCG.
Cada país es liderado por un retailer diferente.
Source: Kantar, IRI, GKF. 2018 Year value sales, except for Germany 2017

Tesco launches more value brands and drives lower prices
Sainsbury’s makes £150m investment in price
¿ C Ó M O R E S P O N D E N L A S C A D E N A S A L A S T E N D E N C I A S ?
P R E O C U PA C I Ó N P O R L A E C O N O M Í A – P R E C I O S B A J O S …
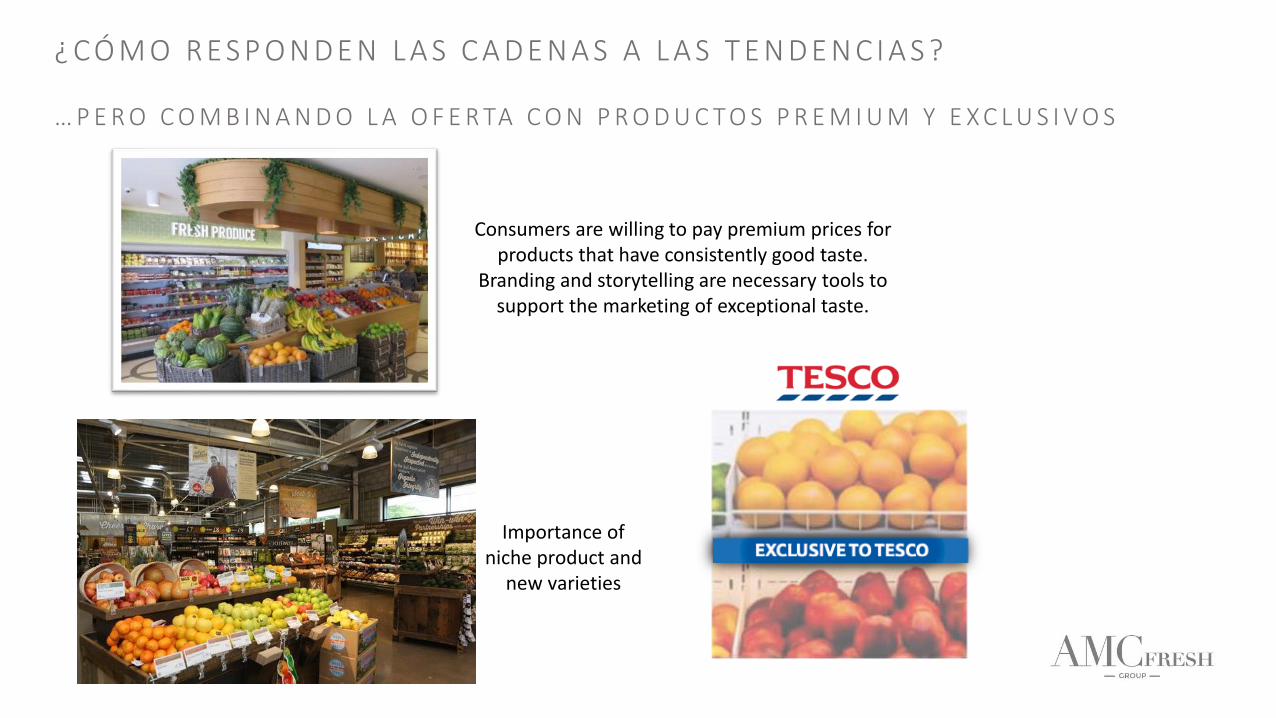
¿ C Ó M O R E S P O N D E N L A S C A D E N A S A L A S T E N D E N C I A S ?
… P E R O C O M B I N A N D O L A O F E R TA C O N P R O D U C T O S P R E M I U M Y E X C L U S I V O S
Consumers are willing to pay premium prices for products that have consistently good taste.
Branding and storytelling are necessary tools to support the marketing of exceptional taste.
Importance of niche product and
new varieties

Nuevas misionesde compra
Influencers y sponsorship
Fomentaralimentossaludables
Conectar con losniños
¿ C Ó M O R E S P O N D E N L A S C A D E N A S A L A S T E N D E N C I A S ?
S A L U D Y B I E N E S TA R

Conectar con los niños
Los retailers europeos fomentan hábitossaludables en los niños. Un númerocreciente de retailers en Europa ofrecenfruta gratis a los niños en las tiendas.Tesco, Morrison, M&S en UK; Lidl enBélgica y Holanda; Albert Heijn’s enAlemania….
Tesco lanzó ‘Free fruit for kids’ en Julio 2016 y actualmentetienen activa la campaña enmás de 800 tiendas
Albert Heijn’s en Bélgica y Alemania
Lidl en Bélgica y HolandaKroger en USA
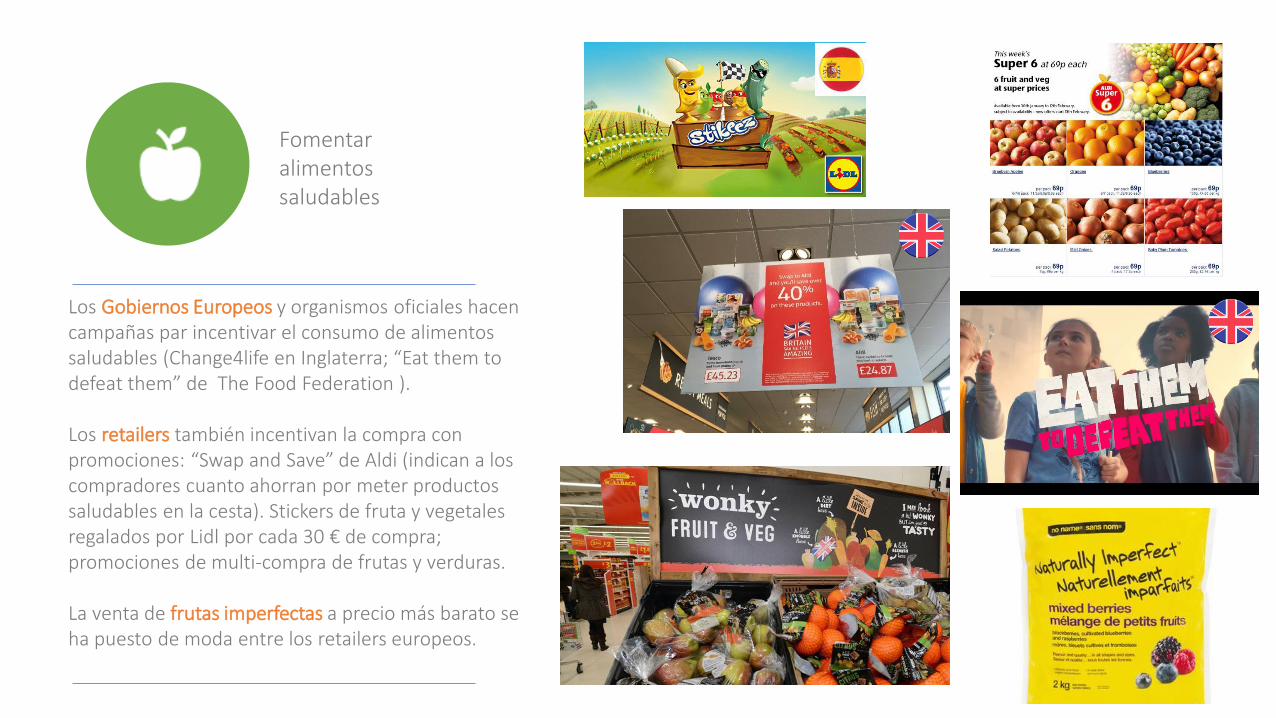
Fomentar alimentos saludables
Los Gobiernos Europeos y organismos oficiales hacen campañas par incentivar el consumo de alimentos saludables (Change4life en Inglaterra; “Eat them to defeat them” de The Food Federation ).
Los retailers también incentivan la compra con promociones: “Swap and Save” de Aldi (indican a los compradores cuanto ahorran por meter productos saludables en la cesta). Stickers de fruta y vegetales regalados por Lidl por cada 30 € de compra; promociones de multi-compra de frutas y verduras.
La venta de frutas imperfectas a precio más barato se ha puesto de moda entre los retailers europeos.

Influencers y sponsorship
Los retailers europeos hacen uso de famosos e influencers para sus campañas de consumo de frutas y verdurasy patrocinan equipos nacionales de deporte
Lidl patrocina la Liga de Balonmano de Dinamarca
Rema 1000 patrocina la Liga de Balonmano de Noruega
Nuevas misiones de compra
Los retailers europeos se enfocan en las misiones de compra de salud.
ICA ofrece a sus clientescuidados primarios a travésde su clínica “Min Doctor”
Lidl lanzó el año pasado enFinlandia una tienda on line,
enfocada en superfoods, vitaminas y suplementos
alimenticios.

@
¿ C Ó M O R E S P O N D E N L A S C A D E N A S A L A S T E N D E N C I A S ?
S O S T E N I B I L I D A D Y H A C E R L O C O R R E C T O
CERTIFICACIONES, FOOD SAFETY, GLOBAL GAP, ETI…HUELLA DE CARBONO, HUELLA HÍDRICA…

@

¿ C Ó M O R E S P O N D E N L A S C A D E N A S A L A S T E N D E N C I A S ?
A U G E D E L C O M E R C I O O N L I N E

¿ C Ó M O R E S P O N D E N L A S C A D E N A S A L A S T E N D E N C I A S ?
I N T E R A C C I Ó N C O N E L C L I E N T E Y C O M U N I C A C I Ó N

© IGD 2018 Page 48
FOOD-TO
-GO(11%)
Source: IGD Research
Help me save time
Ocado’s new meal list function allows shoppers to create ingredients’ lists for
their favourite meals
Help me be healthier
Asda is working with Foodmaestro to offer
personalised filtering for allergens, intolerances,
diets and lifestyles
Help me try new things
Unilever’s Recipedia is a voice activated Amazon
Alexa, helps shoppers look for recipes, specific
ingredients or to meet dietary / nutritional needs
Help me make the right choices
Co-op development to show shoppers the journey
of fresh produce from source to shelf
¿ C Ó M O R E S P O N D E N L A S C A D E N A S A L A S T E N D E N C I A S ?
A S I S T E N T E S P E R S O N A L E S I N T E L I G E N T E S

GRACIAS

CONTACTO:
DAV I D. A L B A @ A M C F R E S H G RO U P I N N O VAT I O N .C O M