Investigación - Sistemas de Informacion Geografica y los cambios de la escena musica en Australia y...
11
GSR_3 Geospatial Science Research 3. School of Mathematical and Geospatial Science, RMIT University December 2014 “A band on every corner”: Using historical GIS to describe changes in the Sydney and Melbourne live music scenes Sarah Taylor 1 , Colin Arrowsmith 1 and Nicole Cook 2 1 School of Mathematical and Geospatial Science, RMIT University, Australia 2 Department of Resource Management and Geography, The University of Melbourne, Australia Email: [email protected] Key words: Historical GIS; historical geodatabase; live music; Melbourne; Sydney Abstract This paper demonstrates the use of historical Geographic Information Systems (historical GIS) to investigate live music in Sydney and Melbourne. It describes the creation of a tailored historical geodatabase built from samples of gig listings (comprising dates, locations, and performer names), and how this historical geodatabase offers insight into the changing dynamics of performers and venue locations. The major findings from the analyses using the developed historical geodatabase are that neither city showed a decline in live music performance or performer numbers, but Melbourne increased at a greater rate than Sydney. Further, the spatial concentration within Melbourne has been far greater than that for Sydney. While Melbourne has expanded numerically but shrunk spatially, Sydney has experienced a geographic dispersion of performances throughout the study period. Introduction This paper demonstrates the use of historical Geographic Information Systems (historical GIS) to investigate live music in Sydney and Melbourne. It describes the creation of a tailored historical geodatabase built from samples of gig (concert) listings comprising dates, locations, and performer names. It then presents descriptive statistics and thematic maps derived from this historical geodatabase, demonstrating how this offers insight into the changing dynamics of live music performers and venue locations. Live music and GIS are not a common combination of subject and methodology, but this is neither for lack of data nor a lack of academic interest in the relationships between music and place. The persistent, but never one- to-one, relationship between music and place has been the subject of several dedicated studies (Bennett & Peterson 2004; Connell & Gibson 2003; Krims 2007; Whiteley, Bennett & Hawkins 2004). The case of live music presents a particularly literal manifestation of music and place, given that live music performances are defined by particular performers, locations and times. Examples of research that make maps of music are still something of a novelty, but this is changing with the gradual opening up of GIS into non-traditional subjects and data types (see: Chrisman 2005; Cope & Elwood 2009; Gibson, Brennan-Horley & Warren 2010). Parallels can be found in recent examples which investigate creative industries such as cinema, art, and fashion specifically as spatial data (Brennan-Horley & Gibson 2009; Cooper & Gregory 2011; Currid & Williams 2010; Shaw 2013; Verhoeven, Bowles & Arrowsmith 2009). For GIS within research on music specifically, there is a noticeable variation in scale and data type: Lashua (2011) and Cohen (2012) use hand drawn qualitative maps by Liverpool musicians, while Florida et al (2010) use quantitative US Census and business data. These different data approaches reflect differences in focus and overarching framework (in these cases, ethnography or economics respectively), but share a common recognition of the usefulness of maps in understanding changes in music activity. By focusing on changes to live music, this paper, and the wider research project from which it draws, is motivated by similar aims and strategies to those found within examples of historical GIS. Historical GIS refers simply to the use of GIS and related techniques within historical research. This has grown from near obscurity in the 1990s and now comprises not so much a distinct linear field of enquiry but a large and diverse collection of
-
Upload
promocionmusicales -
Category
Education
-
view
223 -
download
2
Transcript of Investigación - Sistemas de Informacion Geografica y los cambios de la escena musica en Australia y...
GSR_3 Geospatial Science Research 3.
School of Mathematical and Geospatial Science, RMIT University December 2014
“A band on every corner”: Using historical GIS to describe changes in the Sydney and Melbourne live music scenes
Sarah Taylor1, Colin Arrowsmith1 and Nicole Cook2
1School of Mathematical and Geospatial Science, RMIT University, Australia
2Department of Resource Management and Geography, The University of Melbourne, Australia
Email: [email protected]
Key words: Historical GIS; historical geodatabase; live music; Melbourne; Sydney Abstract This paper demonstrates the use of historical Geographic Information Systems (historical GIS) to investigate live music in Sydney and Melbourne. It describes the creation of a tailored historical geodatabase built from samples of gig listings (comprising dates, locations, and performer names), and how this historical geodatabase offers insight into the changing dynamics of performers and venue locations. The major findings from the analyses using the developed historical geodatabase are that neither city showed a decline in live music performance or performer numbers, but Melbourne increased at a greater rate than Sydney. Further, the spatial concentration within Melbourne has been far greater than that for Sydney. While Melbourne has expanded numerically but shrunk spatially, Sydney has experienced a geographic dispersion of performances throughout the study period. Introduction This paper demonstrates the use of historical Geographic Information Systems (historical GIS) to investigate live music in Sydney and Melbourne. It describes the creation of a tailored historical geodatabase built from samples of gig (concert) listings comprising dates, locations, and performer names. It then presents descriptive statistics and thematic maps derived from this historical geodatabase, demonstrating how this offers insight into the changing dynamics of live music performers and venue locations. Live music and GIS are not a common combination of subject and methodology, but this is neither for lack of data nor a lack of academic interest in the relationships between music and place. The persistent, but never one-to-one, relationship between music and place has been the subject of several dedicated studies (Bennett & Peterson 2004; Connell & Gibson 2003; Krims 2007; Whiteley, Bennett & Hawkins 2004). The case of live music presents a particularly literal manifestation of music and place, given that live music performances are defined by particular performers, locations and times. Examples of research that make maps of music are still something of a novelty, but this is changing with the gradual opening up of GIS into non-traditional subjects and data types (see: Chrisman 2005; Cope & Elwood 2009; Gibson, Brennan-Horley & Warren 2010). Parallels can be found in recent examples which investigate creative industries such as cinema, art, and fashion specifically as spatial data (Brennan-Horley & Gibson 2009; Cooper & Gregory 2011; Currid & Williams 2010; Shaw 2013; Verhoeven, Bowles & Arrowsmith 2009). For GIS within research on music specifically, there is a noticeable variation in scale and data type: Lashua (2011) and Cohen (2012) use hand drawn qualitative maps by Liverpool musicians, while Florida et al (2010) use quantitative US Census and business data. These different data approaches reflect differences in focus and overarching framework (in these cases, ethnography or economics respectively), but share a common recognition of the usefulness of maps in understanding changes in music activity. By focusing on changes to live music, this paper, and the wider research project from which it draws, is motivated by similar aims and strategies to those found within examples of historical GIS. Historical GIS refers simply to the use of GIS and related techniques within historical research. This has grown from near obscurity in the 1990s and now comprises not so much a distinct linear field of enquiry but a large and diverse collection of
2
applied examples These include cinema (Klenotic 2011; Verhoeven, Bowles & Arrowsmith 2009), crime (Johnson, SD 2010), meat production (Robichaud & Steiner 2010) and gay and lesbian history (Brown & Knopp 2008). Amongst this are several champions who bring together compilations and call attention to the merits of GIS within historical research (DeBats & Gregory 2011; Gregory & Healey 2007; Knowles 2000, 2005). Knowles, introducing one such compilation, sees a commonality of interest in “the use of geographical evidence to understand the shaping influence of geography on history…[and] use of GIS to re-examine historical interpretations or to illuminate historical events” (Knowles 2005, p. 8). Gregory, Ian and Ell (2007) also point to the practical benefits GIS can bring to historical research as a database technology, by making it possible to handle data which is both spatial and temporal. Similarly, the use of GIS presented in this paper is motivated by a desire to understand a particular historical subject (live music), and since live music is inherently spatial but also changeable the practical advantages of handling both temporal and spatial data are evident. Hence, while many of the techniques described here are found in GIS more generally, examples of historical GIS are the primary methodological precedents. The focus of this paper is the changing extent and nature of live music scenes in Sydney and Melbourne. Since the early 2000s, music scene participants in Australian cities have shown increased literacy in the web of policy issues relating to saving live music – the idea of live music thriving, or growing, is set in the past (Barrett 2012; Emery 2012; Lobato 2006; Schaefer 2014; Walker 2012). Concern about decline is often described in spatial narratives: closures of music venues, noise complaints, competition for space, or changing neighbourhood composition (see: Burke & Schmidt 2009; Gibson & Homan 2004). Amidst these accounts, there are differentiations within and between cities, as well as over time. These differing outcomes in growth or decline are difficult to account for in an entirely temporal narrative, but can also provide clues to the broader nature of change. The Melbourne live music scene is currently described as both thriving and under threat. In government, media and industry output it is reported upon positively as a “music city” in terms of aggregate live music activity (Arts Victoria 2011; Boulton 2013; Music Victoria 2012). But it is also home to activism based on concern about decline in music venues. The 2010 Save Live Australian Music (SLAM) rally drew thousands of protestors to the Melbourne CBD (Levin 2010), and prompted the formation of Music Victoria (Music Victoria 2010). The organizational impetus for the SLAM rally came initially from the (temporary) closure of the Tote Hotel, which had hosted live music since 1980 (Homan 2011). Similarly, in 2004, concerns for the Esplanade Hotel in St Kilda had sparked planning policy intervention (Shaw 2005a, 2005b). By contrast, Sydney is often described as a more extreme example of a depleted music scene, and an example of what not to do (Burke & Schmidt 2009; Purcell 2009). Shane Homan has extensively documented the policy frameworks which hastened the transition away from Sydney’s pub rock peak in the early 1980s (Homan 2000, 2003). A sense of decline in Sydney live music opportunities was noted in both the 2003 Vanishing Acts report (Johnson, B & Homan 2003) and the 1993 Stayin’ Alive NSW report (Ausmusic 1993). In addition, a variety of qualitative accounts point to Sydney in the 1990s as an increasingly inhospitable music scene (Casimir 1990; Cochrane 1993; Purcell 2009). The title of this paper refers to a 1997 song (“there’s a band on every corner, but I play in my room”) by The Whitlams, a music group strongly identified with inner city Sydney (Carroll & Connell 2000; Giuffre 2009). Lead singer Tim Freedman was by the late 1990s singing bleakly about changes to his home city. Speaking on radio in 1997, Freedman commented that Melbourne had “a bigger sense of community, in pubs and being part of a crowd”, while inner city Sydney had been “scattered to the wind” (Australian Music Show, Triple J, September 3rd 1997, quoted in Carroll and Connor (2000)). Interviews with Sydney musicians for the wider research project from which this paper is drawn are consistent with this tone. By contrast, musicians who were active in Melbourne during the 1990s report relative ease finding performance opportunities and a visible music scene, if not great personal success. Several musicians reported leaving Sydney in this timeframe and migrating to Melbourne.
“Things changed a lot between when I first moved to Sydney and when I realised I wanted to get out... Every venue shut down, essentially, or discarded music …To actually play was a horrible experience. It was like you were getting yelled at by the venue for putting your gear in the wrong place…So when we first got to Melbourne the first thing I noticed was you got a rider [complimentary drink]. Which was huge, I was just like, “I can’t believe this!”” - Musician active in Sydney in the 1990s (interview March 2014)

3
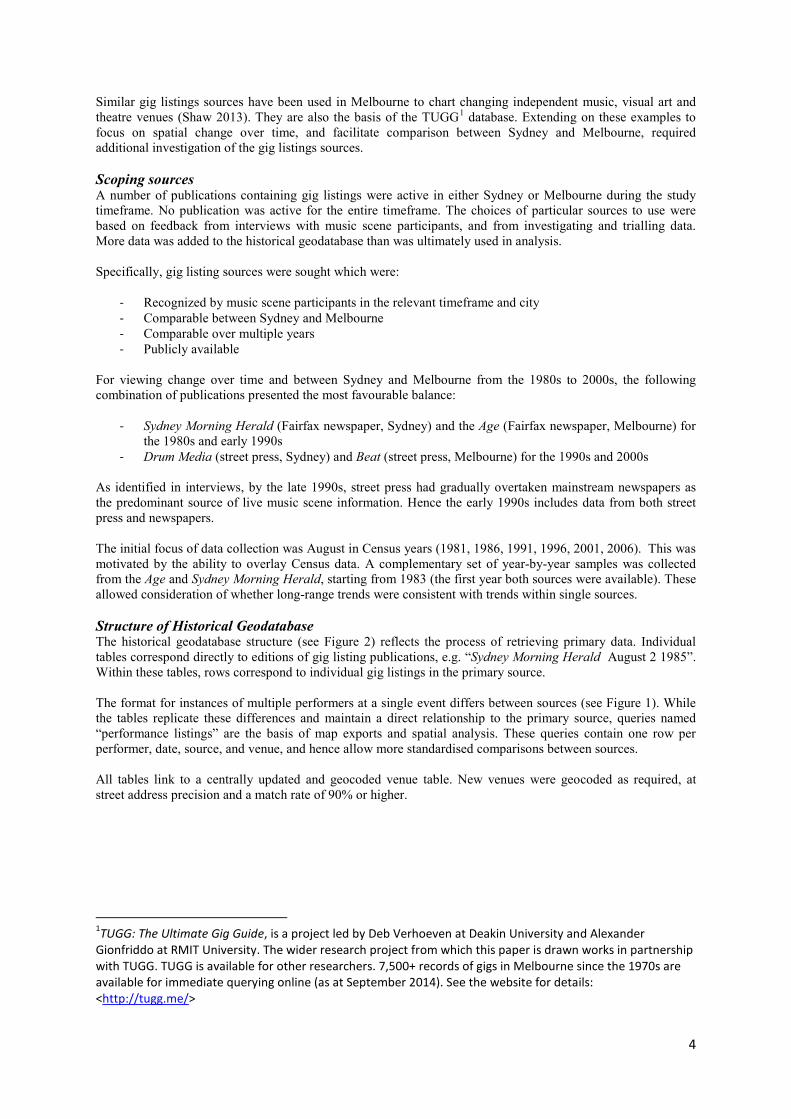
These differing accounts invite several questions. What happened to make Sydney a hostile place for musicians in the 1990s? Why is Melbourne live music described simultaneously as thriving and under threat? Does the experience of decline relate simply to continuous venue closures, or fewer live music performances? The use of historical GIS recognizes the spatial narratives already threading through these questions, and can bring a “forest through the trees” calibration to the on-the-ground accounts from music scene participants. The bulk of this paper describes the data sourcing and database practicalities of implementing this approach. This is followed by the presentation and discussion of descriptive statistics and thematic maps, which provide new insights on the nature of decline in live music in Sydney and Melbourne. While the wider research project aims to synthesize various qualitative and quantitative analysis techniques on a larger scale, the results presented here form an abridged example of the novel possibilities of using historical GIS to investigate live music. Method Developing the Historical Geodatabase A tailored historical geodatabase was created to enable investigation of live music performances in Sydney and Melbourne across time. The target timeframe was chosen to encapsulate the transition from the “heyday” to more recent years (early 1980s to mid-2000s). Like other historical geodatabases, the development process comprised a significant part of the research time. However, the basic concept was resilient: dates and locations are found in abundance in the primary data, so that transforming this to an historical geodatabase was a matter of leveraging, rather than adding, data. The challenge was in keeping to a manageable scale. This meant selecting data sources recognized and meaningful to music scene participants, but also able to be structured in comparable samples to focus on spatial change over time. Gig Listings Gig listings were chosen as the primary source for the historical geodatabase. “Gig listings” is an Australian music scene vernacular term for the printed notifications of forthcoming concerts found in the weekly entertainment section of newspapers or the “street press” (free weekly music magazines distributed in particular cities, see: Brennan 2007). A page of gig listings is comparable in appearance to a TV or cinema guide (see example Figure 1). Their common elements are date, venue and performer name/s.
Figure 1: Examples of gig listings
4
Similar gig listings sources have been used in Melbourne to chart changing independent music, visual art and theatre venues (Shaw 2013). They are also the basis of the TUGG1 database. Extending on these examples to focus on spatial change over time, and facilitate comparison between Sydney and Melbourne, required additional investigation of the gig listings sources. Scoping sources A number of publications containing gig listings were active in either Sydney or Melbourne during the study timeframe. No publication was active for the entire timeframe. The choices of particular sources to use were based on feedback from interviews with music scene participants, and from investigating and trialling data. More data was added to the historical geodatabase than was ultimately used in analysis. Specifically, gig listing sources were sought which were:
- Recognized by music scene participants in the relevant timeframe and city - Comparable between Sydney and Melbourne - Comparable over multiple years - Publicly available
For viewing change over time and between Sydney and Melbourne from the 1980s to 2000s, the following combination of publications presented the most favourable balance:
- Sydney Morning Herald (Fairfax newspaper, Sydney) and the Age (Fairfax newspaper, Melbourne) for the 1980s and early 1990s
- Drum Media (street press, Sydney) and Beat (street press, Melbourne) for the 1990s and 2000s As identified in interviews, by the late 1990s, street press had gradually overtaken mainstream newspapers as the predominant source of live music scene information. Hence the early 1990s includes data from both street press and newspapers. The initial focus of data collection was August in Census years (1981, 1986, 1991, 1996, 2001, 2006). This was motivated by the ability to overlay Census data. A complementary set of year-by-year samples was collected from the Age and Sydney Morning Herald, starting from 1983 (the first year both sources were available). These allowed consideration of whether long-range trends were consistent with trends within single sources. Structure of Historical Geodatabase The historical geodatabase structure (see Figure 2) reflects the process of retrieving primary data. Individual tables correspond directly to editions of gig listing publications, e.g. “Sydney Morning Herald August 2 1985”. Within these tables, rows correspond to individual gig listings in the primary source. The format for instances of multiple performers at a single event differs between sources (see Figure 1). While the tables replicate these differences and maintain a direct relationship to the primary source, queries named “performance listings” are the basis of map exports and spatial analysis. These queries contain one row per performer, date, source, and venue, and hence allow more standardised comparisons between sources. All tables link to a centrally updated and geocoded venue table. New venues were geocoded as required, at street address precision and a match rate of 90% or higher.
1TUGG: The Ultimate Gig Guide, is a project led by Deb Verhoeven at Deakin University and Alexander Gionfriddo at RMIT University. The wider research project from which this paper is drawn works in partnership with TUGG. TUGG is available for other researchers. 7,500+ records of gigs in Melbourne since the 1970s are available for immediate querying online (as at September 2014). See the website for details: <http://tugg.me/>
5
Figure 2: Simplified database structure
Descriptive statistics and thematic maps For the data presented in this paper, a subset query of performance listings was produced from the historical geodatabase, comprising single editions from the same time of year. This query was exported to ArcGIS and converted to point features. From this data, the following descriptive statistics were generated:
- Count of individual performance listings per edition - Average Nearest Neighbour results for performance listings in each edition (Greater Melbourne or
Greater Sydney) - Count of individual performers per edition
Average Nearest Neighbour (Average NN) provides a relatively simple descriptive spatial statistic as a discussion point. Average Nearest Neighbour measures the average distance between points in a given area (see: Haworth, Bruce & Iveson 2013; Ord & Getis 1995). It is a measure of clustering, and can be compared to the expected value for a random distribution of points within the same area, or, in this case, to the results for the same area in different years. A decreasing Average NN value over time is indicative of clustering. To complement these descriptive statistics, thematic maps were produced to represent the number of performance listings per venue in each edition, with larger symbol sizes corresponding to venues with more performances. For this paper, three maps are presented for each city, taken from data in the start, middle and end point of the target timeframe. Together, these outputs provide an introductory description of the changing dynamics – frequency and location - of live music performances, venues, and performers, in equivalent samples over time in Sydney and Melbourne.
6
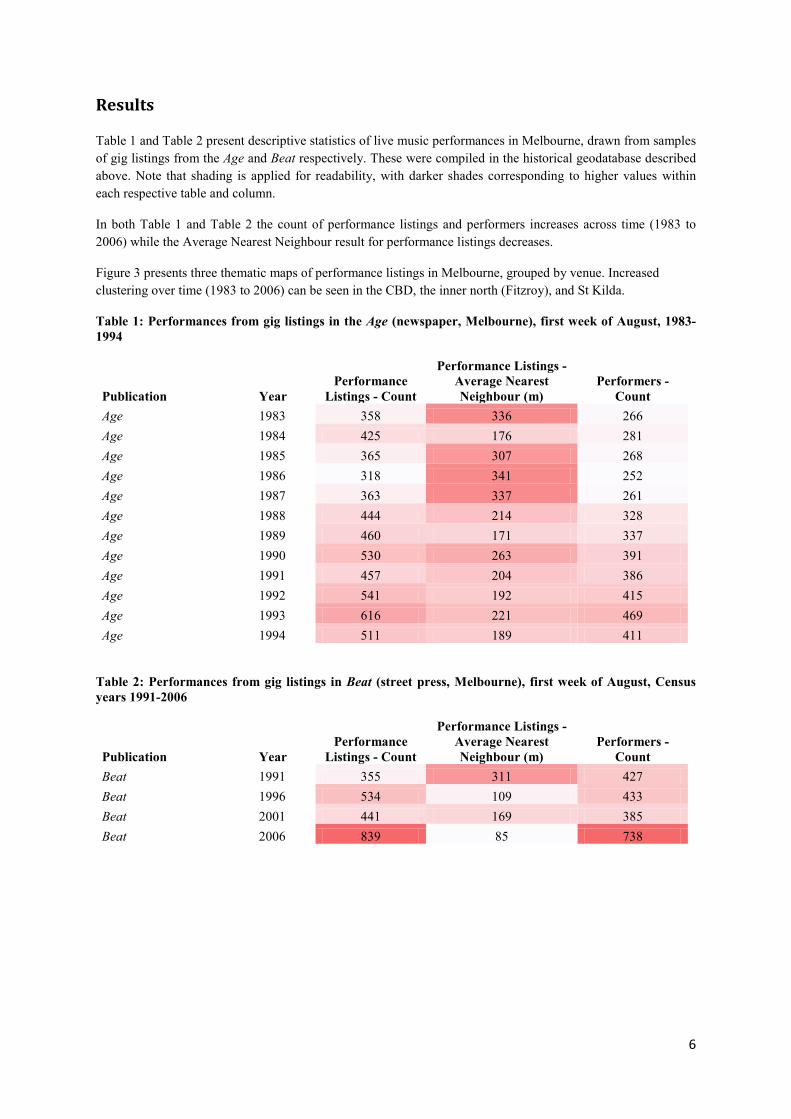
Results Table 1 and Table 2 present descriptive statistics of live music performances in Melbourne, drawn from samples of gig listings from the Age and Beat respectively. These were compiled in the historical geodatabase described above. Note that shading is applied for readability, with darker shades corresponding to higher values within each respective table and column.
In both Table 1 and Table 2 the count of performance listings and performers increases across time (1983 to 2006) while the Average Nearest Neighbour result for performance listings decreases.
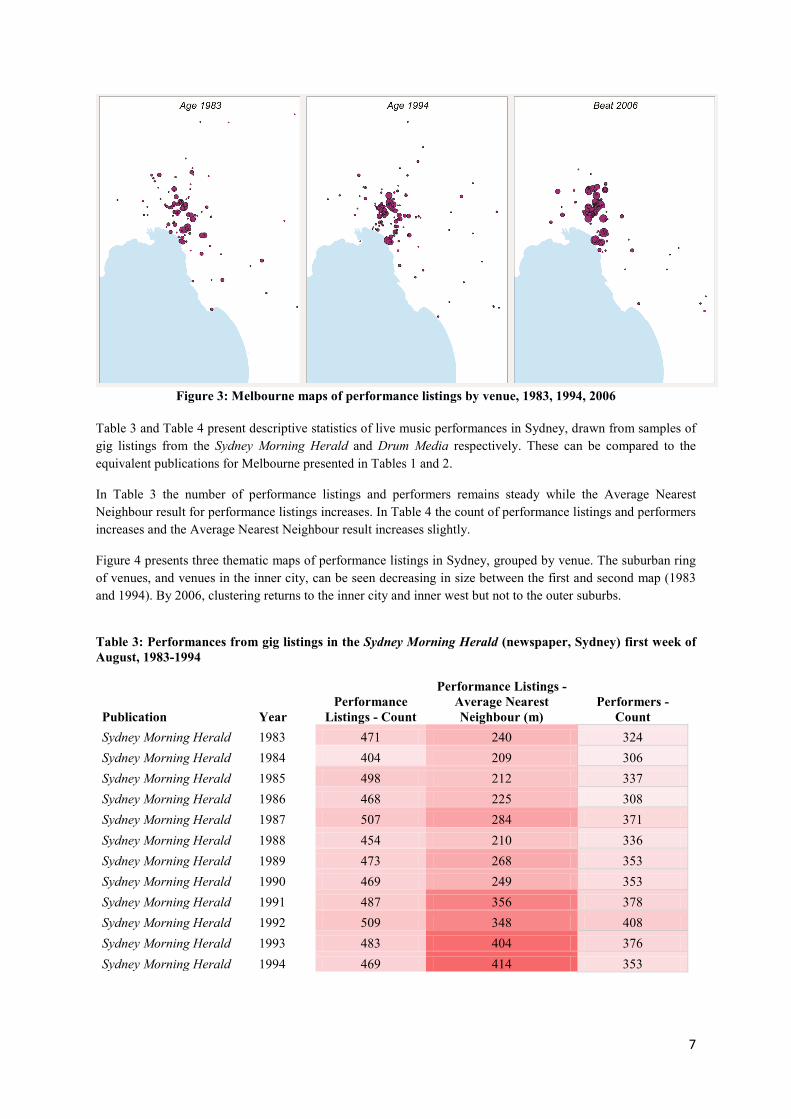
Figure 3 presents three thematic maps of performance listings in Melbourne, grouped by venue. Increased clustering over time (1983 to 2006) can be seen in the CBD, the inner north (Fitzroy), and St Kilda.
Table 1: Performances from gig listings in the Age (newspaper, Melbourne), first week of August, 1983-1994
Publication Year Performance
Listings - Count
Performance Listings - Average Nearest Neighbour (m)
Performers - Count
Age 1983 358 336 266 Age 1984 425 176 281 Age 1985 365 307 268 Age 1986 318 341 252 Age 1987 363 337 261 Age 1988 444 214 328 Age 1989 460 171 337 Age 1990 530 263 391 Age 1991 457 204 386 Age 1992 541 192 415 Age 1993 616 221 469 Age 1994 511 189 411
Table 2: Performances from gig listings in Beat (street press, Melbourne), first week of August, Census years 1991-2006
Publication Year Performance
Listings - Count
Performance Listings - Average Nearest Neighbour (m)
Performers - Count
Beat 1991 355 311 427 Beat 1996 534 109 433 Beat 2001 441 169 385 Beat 2006 839 85 738
7
Figure 3: Melbourne maps of performance listings by venue, 1983, 1994, 2006
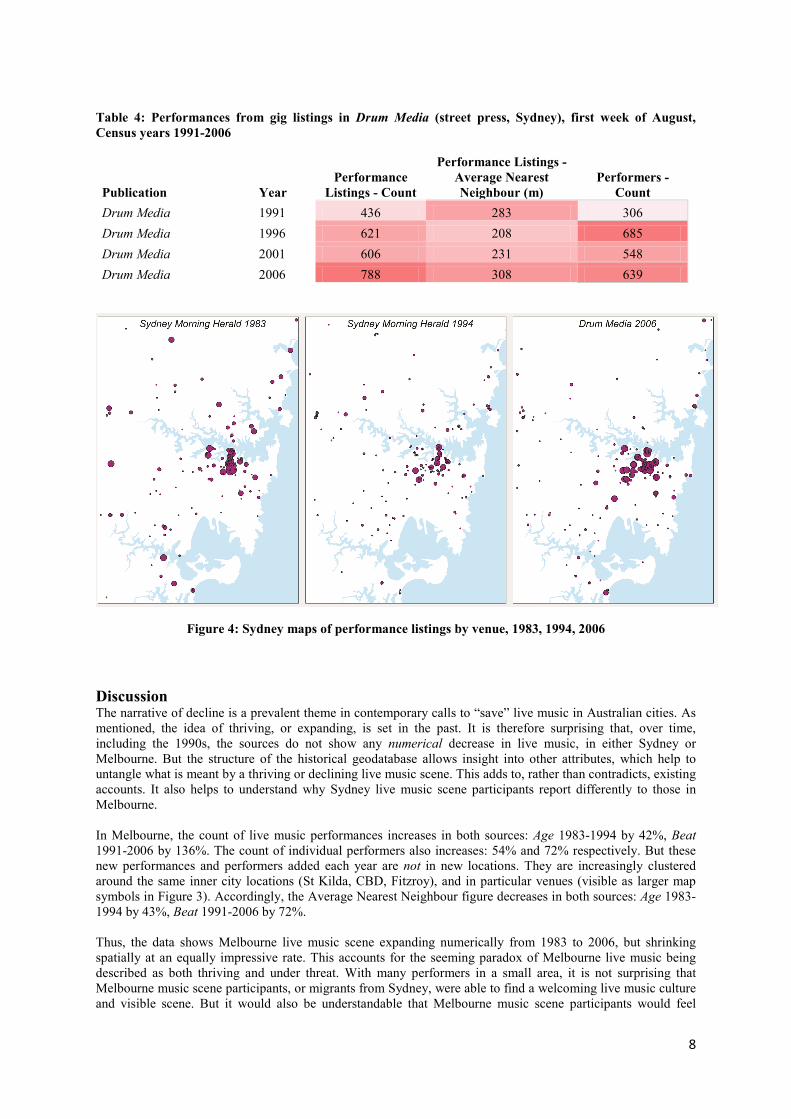
Table 3 and Table 4 present descriptive statistics of live music performances in Sydney, drawn from samples of gig listings from the Sydney Morning Herald and Drum Media respectively. These can be compared to the equivalent publications for Melbourne presented in Tables 1 and 2.
In Table 3 the number of performance listings and performers remains steady while the Average Nearest Neighbour result for performance listings increases. In Table 4 the count of performance listings and performers increases and the Average Nearest Neighbour result increases slightly.
Figure 4 presents three thematic maps of performance listings in Sydney, grouped by venue. The suburban ring of venues, and venues in the inner city, can be seen decreasing in size between the first and second map (1983 and 1994). By 2006, clustering returns to the inner city and inner west but not to the outer suburbs.
Table 3: Performances from gig listings in the Sydney Morning Herald (newspaper, Sydney) first week of August, 1983-1994
Publication Year Performance
Listings - Count
Performance Listings - Average Nearest Neighbour (m)
Performers - Count
Sydney Morning Herald 1983 471 240 324 Sydney Morning Herald 1984 404 209 306 Sydney Morning Herald 1985 498 212 337 Sydney Morning Herald 1986 468 225 308 Sydney Morning Herald 1987 507 284 371 Sydney Morning Herald 1988 454 210 336 Sydney Morning Herald 1989 473 268 353 Sydney Morning Herald 1990 469 249 353 Sydney Morning Herald 1991 487 356 378 Sydney Morning Herald 1992 509 348 408 Sydney Morning Herald 1993 483 404 376 Sydney Morning Herald 1994 469 414 353
8
Table 4: Performances from gig listings in Drum Media (street press, Sydney), first week of August, Census years 1991-2006
Publication Year Performance
Listings - Count
Performance Listings - Average Nearest Neighbour (m)
Performers - Count
Drum Media 1991 436 283 306 Drum Media 1996 621 208 685 Drum Media 2001 606 231 548 Drum Media 2006 788 308 639
Figure 4: Sydney maps of performance listings by venue, 1983, 1994, 2006
Discussion The narrative of decline is a prevalent theme in contemporary calls to “save” live music in Australian cities. As mentioned, the idea of thriving, or expanding, is set in the past. It is therefore surprising that, over time, including the 1990s, the sources do not show any numerical decrease in live music, in either Sydney or Melbourne. But the structure of the historical geodatabase allows insight into other attributes, which help to untangle what is meant by a thriving or declining live music scene. This adds to, rather than contradicts, existing accounts. It also helps to understand why Sydney live music scene participants report differently to those in Melbourne. In Melbourne, the count of live music performances increases in both sources: Age 1983-1994 by 42%, Beat 1991-2006 by 136%. The count of individual performers also increases: 54% and 72% respectively. But these new performances and performers added each year are not in new locations. They are increasingly clustered around the same inner city locations (St Kilda, CBD, Fitzroy), and in particular venues (visible as larger map symbols in Figure 3). Accordingly, the Average Nearest Neighbour figure decreases in both sources: Age 1983-1994 by 43%, Beat 1991-2006 by 72%. Thus, the data shows Melbourne live music scene expanding numerically from 1983 to 2006, but shrinking spatially at an equally impressive rate. This accounts for the seeming paradox of Melbourne live music being described as both thriving and under threat. With many performers in a small area, it is not surprising that Melbourne music scene participants, or migrants from Sydney, were able to find a welcoming live music culture and visible scene. But it would also be understandable that Melbourne music scene participants would feel
9
vulnerable, both as individual performers and as a community of interest. The closure of a single large, long running venue would be notable to many performers: e.g. the Tote Hotel, Esplanade Hotel, or the Punters Club (see: Schaefer 2014). This spatially tempered expansion also helps to understand both positive and negative accounts of contemporary Melbourne live music. In spite of increasing live music activity, the dynamics in the 1980s suggest that performers played more often and in more varied locations. This is consistent with interviews, in which 1980s relate playing multiple shows per week, sometimes on the same night, and on opposite sides of town. Through the late 1980s and the 1990s, Melbourne suburban live music circuits shrank, and even inner city areas such as South Melbourne, Richmond and South Yarra declined in activity (this is consistent with maps presented in Shaw 2013). Hence, the thriving live music scene reported upon for contemporary Melbourne (Arts Victoria 2011; Music Victoria 2012) comprises more musicians, in a smaller area, playing less often, than in the past. The desirability of this is outside the scope of this paper, but the outputs of the historical geodatabase do present novel insights into how the Melbourne live music scene has adapted and survived. Sydney presents more mixed results. It does not lose live music in the 1990s as much as its accounts might suggest. But it does not grow numerically in performances or performers at the same rate as Melbourne. Nor does it present the spatial concentration that appears to be both the strength and weakness of Melbourne live music. The Sydney Morning Herald 1983-1994 shows very little variation in numbers of performances and performers across the entire sample period, but the Average Nearest Neighbour figure increases steadily, to a total increase of 73%. Given the increasing population and economic activity in Sydney in the 1990s (see: O'Neill & McGuirk 2002), as well as the increase in live music exhibited in Melbourne in the Age in the same timeframe, this can be viewed as a stagnation, consistent with (although less dramatic than) other accounts of Sydney in the 1990s. Drum Media shows greater spatial concentration than the Sydney Morning Herald. But this also does not exhibit the spatial contraction of Melbourne over multiple years. It increases in performers and performances from 1991 to 2006 (80% and 108% respectively), with Average Nearest Neighbour figure remaining steady. Further, thematic maps of Sydney live performances grouped by venue (Figure 4) visualize live music continuing in the city through the 1990s, but scattering spatially. The prominent ring of suburban venues in the 1983 map is absent by the 1994 map. These correspond to the popular “beer barns”, which were the mainstay of the Sydney Oz Rock scene and (often drink driving) punters in the early 1980s, and which by 1993 were reported as having “all but disappeared” (Ausmusic 1993). Further, the live music activity visible in inner city Sydney in the 1983 map does not disappear by 1994, but does visibly shrink in concentration. The Sydney inner city live music scene by the 1990s is constituted less of single venues hosting live music often (e.g. the Sydney Trade Union Club in the 1980s), than by many venues hosting live music only occasionally. This is consistent with accounts of musicians competing for space with alternate uses of pub space, and the experience of “putting your gear in the wrong place.” In spite of not “all venues closing” in Sydney in the 1990s, the patterns in Sydney are consistent with the general tone of dispersal and fragmentation found in existing accounts of Sydney live music in this timeframe (“scattered to the wind”). With the large suburban circuits of the 1980s closing, and no equal and opposite recovery of the inner city venues to take their place (as in Melbourne), it is not surprising that Sydney musicians found Melbourne a more visible live music scene in the 1990s. But, of course, rumours of the death of Sydney music have been exaggerated, and by 2006, the Sydney inner city scene does appear to be recovering and consolidating, albeit with the loss of outer suburban venues. The reasons behind these changes to Sydney and Melbourne live music are the subject of wider research, including the wider research project from which this paper is drawn. What is evident from these results, however, is that the accounts of decline do not relate solely to reduced numbers of live music venues or performances, but also to measures of contraction or dispersal. The historical geodatabase described in this paper is able to leverage the historical and spatial data already present in gig listings, and is able to sit alongside existing qualitative accounts of live music in Sydney and Melbourne. This adds a new, and explicitly spatial, dimension to understanding what is meant by growth and decline in live music.
References Arts Victoria 2011, The economic, social and cultural contribution of venue-based live music in
Victoria.
10
Ausmusic 1993, Stayin’ alive NSW. September–December 1993., Ausmusic, Port Melbourne, Vic. Barrett, P 2012, 'Rock of ages', The Age, viewed October 26, 2012
<http://www.theage.com.au/entertainment/music/rock-of-ages-20121016-27pdd.html>. Bennett, A & Peterson, RA 2004, Music scenes: Local, translocal and virtual, Vanderbilt University
Press. Boulton, M 2013, 'Heart beats in our city', Sydney Morning Herald, November 18th 2011. Brennan-Horley, C & Gibson, C 2009, 'Where is creativity in the city? Integrating qualitative and GIS
methods', Environment and planning. A, vol. 41, no. 11, p. 2595. Brennan, M 2007, 'This place rocks! The Brisbane street press, local culture, identity and economy',
Continuum: Journal of Media & Cultural Studies, vol. 21, no. 3, pp. 433-44. Brown, M & Knopp, L 2008, 'Queering the Map: The Productive Tensions of Colliding
Epistemologies', Annals of the Association of American Geographers, vol. 98, no. 1, pp. 40-58.
Burke, MI & Schmidt, A 2009, 'The Death and Life of Great Australian Music: planning for live music venues in Australian Cities', paper presented to State of Australian Cities.
Carroll, J & Connell, J 2000, ''You Gotta Love This City': The Whitlams and inner Sydney', Australian Geographer, vol. 31, no. 2, pp. 141-54.
Casimir, J 1990, 'Seeking live rock's soul', Sydney Morning Herald, August 24th 1990. Chrisman, N 2005, 'Full circle: More than just social implications of GIS', Cartographica: The
International Journal for Geographic Information and Geovisualization, vol. 40, no. 4, pp. 23-35.
Cochrane, P 1993, 'The Rocky, Rocking Road', Sydney Morning Herald, August 7th 1993, p. 46. Cohen, S 2012, 'Bubbles, Tracks, Borders and Lines: Mapping Music and Urban Landscape', Journal of
the Royal Musical Association, vol. 137, no. 1, pp. 135-70. Connell, J & Gibson, C 2003, Sound Tracks: Popular Music Identity and Place, Routledge. Cooper, D & Gregory, IN 2011, 'Mapping the English Lake district: A literary GIS', Transactions of the
Institute of British Geographers, vol. 36, no. 1, pp. 89-108. Cope, M & Elwood, S 2009, Qualitative GIS: a mixed methods approach, Sage. Currid, E & Williams, S 2010, 'The geography of buzz: art, culture and the social milieu in Los Angeles
and New York', Journal of Economic Geography, vol. 10, no. 3, pp. 423-51. DeBats, DA & Gregory, IN 2011, 'Introduction to historical GIS and the study of urban history', Social
Science History, vol. 35, no. 4, pp. 455-63. Emery, P 2012, 'Quincy McLean: From Scrap Museum To SLAM', viewed 18/2/2014,
<http://www.messandnoise.com/articles/4433609>. Florida, R, Mellander, C & Stolarick, K 2010, 'Music scenes to music clusters: the economic
geography of music in the US, 1970–2000', Environment and planning. A, vol. 42, no. 4, p. 785.
Gibson, C, Brennan-Horley, C & Warren, A 2010, 'Geographic Information Technologies for cultural research: cultural mapping and the prospects of colliding epistemologies', Cultural Trends, vol. 19, no. 4, pp. 325-48.
Gibson, C & Homan, S 2004, 'Urban Redevelopment, Live Music and Public Space', International Journal of Cultural Policy, vol. 10, no. 1, pp. 67-84.
Giuffre, L 2009, ''There's No Aphrodisiac Like Newtown': The Evolving Connection to Place in the Music of the Whitlams', Transforming Cultures eJournal, vol. 4, no. 1.
Gregory, IN & Healey, RG 2007, 'Historical GIS: structuring, mapping and analysing geographies of the past', Progress in Human Geography, vol. 31, no. 5, pp. 638-53.
Haworth, B, Bruce, E & Iveson, K 2013, 'Spatio-temporal analysis of graffiti occurrence in an inner-city urban environment', Applied Geography, vol. 38, no. 0, pp. 53-63.
Homan, S 2000, 'Losing the local: Sydney and the Oz Rock tradition', Popular Music, vol. 19, no. 1, pp. 31-49.
11
---- 2003, The mayor's a square: live music and law and order in Sydney, Local Consumption Publications, Sydney.
---- 2011, '“I Tote and I Vote”: Australian live music and cultural policy', Arts Marketing: An International Journal, vol. 1, no. 2, pp. 96-107.
Johnson, B & Homan, S 2003, 'Vanishing acts: an inquiry into the state of live popular music opportunities in New South Wales| NOVA. The University of Newcastle's Digital Repository'.
Johnson, SD 2010, 'A brief history of the analysis of crime concentration', European Journal of Applied Mathematics, vol. 21, no. 4-5, pp. 349-70.
Klenotic, J 2011, 'Putting Cinema History on the Map: Using GIS to Explore the Spatiality of Cinema', Explorations in New Cinema History: Approaches and Case Studies, pp. 58-84.
Knowles, AK 2000, 'Special Issue: Historical GIS: The spatial turn in social science history', Social Science History, vol. 24, no. 3, pp. 451-70.
---- 2005, 'Emerging trends in historical GIS', Historical Geography, vol. 33, no. 1, pp. 7-13. Krims, A 2007, Music and urban geography, CRC Press. Lashua, BD 2011, 'An atlas of musical memories: popular music, leisure and urban change in
Liverpool', Leisure/Loisir, vol. 35, no. 2, pp. 133-52. Levin, D 2010, 'Melbourne's March For The Ages', Mess + Noise, viewed 13/2/2013,
<http://m.messandnoise.com/articles/3882468>. Lobato, R 2006, 'Gentrification, cultural policy and live music in Melbourne', Media International
Australia, Incorporating Culture & Policy, no. 120, p. 63. Music Victoria 2010, It’s official: Live music does not cause violence, Music Victoria,
<http://www.musicvictoria.com.au/assets/media_releases/mediarelease-oct6.pdf>. ---- 2012, Victorian Live Music Census 2012, Music Victoria and City of Melbourne. O'Neill, P & McGuirk, P 2002, 'Prosperity along Australia's Eastern Seaboard: Sydney and the
geopolitics of urban and economic change', Australian Geographer, vol. 33, no. 3, pp. 241-61.
Ord, JK & Getis, A 1995, 'Local spatial autocorrelation statistics: distributional issues and an application', Geographical analysis, vol. 27, no. 4, pp. 286-306.
Purcell, C 2009, 'The day the music died', Sydney Morning Herald, <http://www.smh.com.au/news/entertainment/music/the-day-the-music-died/2009/12/29/1261982306603.html>.
Robichaud, A & Steiner, E 2010, 'Trail of Blood: The Movement of San Francisco’s Butchertown and the Spatial Transformation of Meat Production, 1849-1901', Spatial History Lab, vol. 8, p. 2012, <https://web.stanford.edu/group/spatialhistory/cgi-bin/site/pub.php?id=31>.
Schaefer, R 2014, 'The Punters Club Remembered: Pt 1', Mess + Noise, viewed 15/8/2014, <www.messandnoise.com/articles/4129579>.
Shaw, K 2005a, 'Gentrification and the inner city blues', in CS Long, Kate; Merlo, CM (ed.), Suburban Fantasies: Melbourne Unmasked Australian Scholarly Publishing pp. 20-49.
---- 2005b, 'The Place of Alternative Culture and the Politics of its Protection in Berlin, Amsterdam and Melbourne', Planning Theory & Practice, vol. 6, no. 2, pp. 149-69.
---- 2013, 'Independent creative subcultures and why they matter', International Journal of Cultural Policy, vol. 19, no. 3, pp. 333-52.
Verhoeven, D, Bowles, K & Arrowsmith, C 2009, 'Mapping the Movies', Digital Tools in Media Studies: Analysis and Research-An Overview, p. 69.
Walker, C 2012, 'History is made at night: Live music in Australia', Platform Papers, no. 32, pp. 2-60. Whiteley, S, Bennett, A & Hawkins, S 2004, Music, space and place: popular music and cultural
identity, Ashgate Publishing.


![Melbourne es una ciudad australiana, capital y mayor ciudad del estado de Victoria.[1] Fue la capital de Australia entre 1901 y 1927, cuando se trasladó.](https://static.fdocuments.ec/doc/165x107/5665b4f21a28abb57c95014c/melbourne-es-una-ciudad-australiana-capital-y-mayor-ciudad-del-estado-de-victoria1.jpg)


![ms.sapientia.roAustralian Control Conference, 2011 pp. 167 — 172, Melbourne, Australia. (IEEE Xplore) [CBDI-7] L. Márton, Detection of overload generated faults in robot manipulators](https://static.fdocuments.ec/doc/165x107/6108f7c5d6a09e15f935470e/ms-australian-control-conference-2011-pp-167-a-172-melbourne-australia-ieee.jpg)