High-growth firms and innovation in European countries · vakia, Lituania, Errumania, Bulgaria,...
28
Ekonomiaz N.º 90, 2.º semestre, 2016 High-growth firms and innovation in European countries Este artículo analiza el efecto de la innovación en una empresa de rápido crecimiento (HGF). Los microdatos pertenecen a la Community Innovation Survey 2008, facilitada por Eurostat, y cubre el período 2006-2008 para 15 países europeos. Clasificamos estos países en dos grupos de acuerdo al gasto empresarial en I+D sobre el PIB: los líderes (Alemania, Eslo- venia, República Checa, Noruega, Portugal, España e Italia) y los rezagados (Estonia, Hun- gría, Eslovaquia, Lituania, Rumanía, Bulgaria, Letonia y Chipre). Las empresas en los países líderes invierten más en I+D, pero la presencia de HGF es más moderada que en los países rezagados. Nuestros principales resultados muestran que los determinantes de la innova- ción y de ser una empresa HGF son diferentes entre los países europeos. En los países líde- res, la presencia de empresas HGF está relacionada con las inversiones en I+D y la innova- ción, mientras que, en los países rezagados, depende directamente del tamaño de la empresa y la tasa de turbulencia del conjunto de la economía. En una visión de conjunto, nuestros resultados arrojan luz sobre los diferentes ecosistemas empresariales en los países de la Unión Europea. Artikulu honek aztertzen du hazkunde azkarreko enpresan (HGF ingelesez) berrikuntzak duen eragina. Mikro-datuak Eurostatek emandako Berrikuntzari buruzko 2008ko Erkidego Inkes- takoak dira. Inkesta horrek 2006-2008 aldia jaso-tzen du Europako 15 herrialdeetarako. Euro- pako herrialdeak bi taldetan sailkatu ditugu BPGaren gainean enpresek egiten duten G+B gas- tuaren arabera: buruan dauden herrialdeak (Alemania, Eslovenia, Txekiar Errepublika, Norvegia, Portugal, Espainia eta Italia) eta atzean dauden herrialdeak (Estonia, Hungaria, Eslo- vakia, Lituania, Errumania, Bulgaria, Letonia eta Zipre). Buru diren herrialdeetan, HGBko en- presen agerpena B+G eta berrikuntza inbertsioekin erlazionatuta dago; aitzitik, herri atzeratue- tan, agerpen hori enpresak duen tamaninaren eta ekonomia osoaren nahaste-tasaren araberakoa da.Oro har ikusita, gure emaitzak lagungarri dira Europar Batasuneko herrialdeetako enpresa- ekosistemak ezagutzeko. This paper analyses the effect of innovation on a high-growth firm (HGF). The micro-data belongs to the Community Innovation Survey 2008 provided by Eurostat covering the period 2006-2008 for 15 European countries. We classify the EU countries in two groups according to the share of business R&D on GDP: leader countries (Germany, Slovenia, Czech Republic, Norway, Portugal, Spain and Italy) and laggard countries (Estonia, Hungary, Slovakia, Lithuania, Romania, Bulgaria, Latvia and Cyprus). Firms in leader countries are more prone to invest in R&D but the presence of HGFs is more moderated than firms in laggard countries. Our main results show that the drivers to innovate and become a HGF differ across European countries. In leader countries, the HGF firms presence is related to R+D inversions and innovation, whereas in laggard countries depend directly on the size of the firm, as well as the turbulence rate in the economy as a whole. All in all, our results show light on the different entrepreneurial ecosystems of the European Union member countries.
Transcript of High-growth firms and innovation in European countries · vakia, Lituania, Errumania, Bulgaria,...

Ekonomiaz N.º 90, 2.º semestre, 2016
High-growth firms and innovation in European countries
Este artículo analiza el efecto de la innovación en una empresa de rápido crecimiento (HGF). Los microdatos pertenecen a la Community Innovation Survey 2008, facilitada por Eurostat, y cubre el período 2006-2008 para 15 países europeos. Clasificamos estos países en dos grupos de acuerdo al gasto empresarial en I+D sobre el PIB: los líderes (Alemania, Eslo-venia, República Checa, Noruega, Portugal, España e Italia) y los rezagados (Estonia, Hun-gría, Eslovaquia, Lituania, Rumanía, Bulgaria, Letonia y Chipre). Las empresas en los países líderes invierten más en I+D, pero la presencia de HGF es más moderada que en los países rezagados. Nuestros principales resultados muestran que los determinantes de la innova-ción y de ser una empresa HGF son diferentes entre los países europeos. En los países líde-res, la presencia de empresas HGF está relacionada con las inversiones en I+D y la innova-ción, mientras que, en los países rezagados, depende directamente del tamaño de la empresa y la tasa de turbulencia del conjunto de la economía. En una visión de conjunto, nuestros resultados arrojan luz sobre los diferentes ecosistemas empresariales en los países de la Unión Europea.
Artikulu honek aztertzen du hazkunde azkarreko enpresan (HGF ingelesez) berrikuntzak duen eragina. Mikro-datuak Eurostatek emandako Berrikuntzari buruzko 2008ko Erkidego Inkes-takoak dira. Inkesta horrek 2006-2008 aldia jaso-tzen du Europako 15 herrialdeetarako. Euro-pako herrialdeak bi taldetan sailkatu ditugu BPGaren gainean enpresek egiten duten G+B gas-tuaren arabera: buruan dauden herrialdeak (Alemania, Eslovenia, Txekiar Errepublika, Norvegia, Portugal, Espainia eta Italia) eta atzean dauden herrialdeak (Estonia, Hungaria, Eslo-vakia, Lituania, Errumania, Bulgaria, Letonia eta Zipre). Buru diren herrialdeetan, HGBko en-presen agerpena B+G eta berrikuntza inbertsioekin erlazionatuta dago; aitzitik, herri atzeratue-tan, agerpen hori enpresak duen tamaninaren eta ekonomia osoaren nahaste-tasaren araberakoa da.Oro har ikusita, gure emaitzak lagungarri dira Europar Batasuneko herrialdeetako enpresa-ekosistemak ezagutzeko.
This paper analyses the effect of innovation on a high-growth firm (HGF). The micro-data belongs to the Community Innovation Survey 2008 provided by Eurostat covering the period 2006-2008 for 15 European countries. We classify the EU countries in two groups according to the share of business R&D on GDP: leader countries (Germany, Slovenia, Czech Republic, Norway, Portugal, Spain and Italy) and laggard countries (Estonia, Hungary, Slovakia, Lithuania, Romania, Bulgaria, Latvia and Cyprus). Firms in leader countries are more prone to invest in R&D but the presence of HGFs is more moderated than firms in laggard countries. Our main results show that the drivers to innovate and become a HGF differ across European countries. In leader countries, the HGF firms presence is related to R+D inversions and innovation, whereas in laggard countries depend directly on the size of the firm, as well as the turbulence rate in the economy as a whole. All in all, our results show light on the different entrepreneurial ecosystems of the European Union member countries.

197
Ekonomiaz N.º 90, 2.º semestre, 2016
Agustí Segarra Blasco*
Mercedes Teruel CarrizosaElisenda Jové Llopis
Universitat Rovira i Virgili
Table of contents
1. Introduction
2. Literature review
3. Database and statistical descriptive
4. Econometric methodology
5. Results
6. Conclusions
Bibliographic references
Appendix
Palabras clave: Empresas de rápido crecimiento, crecimiento empresarial, actividad innovadora.
Keywords: High-growth firms, firm growth, innovation activity.
JEL codes: L11, L25, O30.
1. INTRODUCTION
During last decades, Europe has performed deficiently in generating innovative high-growth firms (henceforth HGFs) that quickly become global leaders in com-parison with other economies located in the technological frontier. Recently, this gap has generated an increasing concern between European institutions. According-ly, policymakers have shown increasing interest in fostering fast growing innovative firms as they are seen as a key driver of economic growth and employment. Hence, HGFs have attracted increasing interest since it is suggested that they contribute sig-nificantly to create new jobs, to foster the industrial productivity and to ensure a sustainable aggregate economic growth.
* Acknowledgements: This paper is part of the research done with the financial support of theConsolidated Group of Research 2014-SGR-1395, Xarxa de Referència en Economia Aplicada(XREAP), the competitive project ECO2015-68061-R funded by the Ministry of Economics andCompetitiveness Spanish Government and by European funds from FEDER. We are grateful toVerònica Gombau and Anna Rovira for her research support. The usual disclaimer applies.

AGUSTÍ SEGARRA / MERCEDES TERUEL / ELISENDA JOVÉ
198
Ekonomiaz N.º 90, 2.º semestre, 2016
In line with this, the Horizon 2020 framework proposes a new enterprise policy which adopts a systematic approach in order to foster SMEs’ capacity to innovate and to generate new jobs. The new European enterprise policy aims to generate en-vironmental factors that promote firm’s competitiveness which drive productivity growth, internationalization, innovation and investment in order to create jobs with higher levels of education1.
Concerning the effects of HGFs on the employment growth and the economic growth, scholars have paid attention to the tent-shaped distribution of firm growth where a small group of firms located in the heavy tails grows faster than their counterparts (Bottazzi and Secchi, 2006; Bottazzi et al., 2011). This group of firms has attracted the attention of researchers due to their economic contribu-tions. First, they create most new jobs (Birch and Medoff, 1994; Davidsson and Henrekson, 2002; Delmar et al. 2003; Acs and Mueller, 2008; Acs, 2011; Coad et al., 2014a; Daunfeldt and Halvarsson, 2015). Second, they exert spillover effectswhich are beneficial to the growth of other firms (Mason et al., 2009). Third, HGFs contribute to the creation of knowledge (Colombelli et al., 2014)2. Fourth, from a social point of view, they employ the young, less educated, immigrants and long-term unemployed individuals (Coad et al., 2014b).
Consequently, policymakers have created different initiatives to support HGFs in order to capture their potential capacity to be a driver of job creation, innovation and economic growth (Acs et al., 2008; OECD, 2002). However, the capacity thatan economy has to reinforce HGFs is limited. In fact, at European level the different initiatives to promote the presence of HGFs in Europe have failed to catch up the share of HGFs in US. This difference may be in part explained by the lack of young innovative companies (YICs) which largely become HGFs (Veugelers and Cincera, 2015). In fact, the relationship between HGFs and YICs has been recently pointed out by Decker et al. (2016)3. However, the existence of imperfect information may cause government failures by focusing their policies in a selected group of «winners» to the detriment of all SMEs.
1 According to Joint Declaration on a horizontal EU SME policy, 5 April 2016, there are more than 21 million SMEs in the EU, that represent 99.8% of all European firms, 67% of employment and 58% of gross added value.
2 Using data for 335 firms from UK, Germany, France, Sweden, Italy, and the Netherlands between 1988 and 2005, Colombelli et al. (2014) analyse the impact of HGFs in the knowledge creation process. These authors find that «HGFs are key actors in the creation of new technological knowledge, and showing also that firms that achieve higher than average growth focus on exploration based on familiar technology.”
3 According to Decker et al. (2016), «if rapid firm-level growth reflects efficient movement of labour toward high-productivity producers, then reductions in the number and impact of such firms may be a cause for concern.»

HIGH-GROWTH FIRMS AND INNOVATION IN EUROPEAN COUNTRIES
199
Ekonomiaz N.º 90, 2.º semestre, 2016
Given the current interest of Europe to promote HGFs and innovation4, there seems necessary to show light on the relationship between innovation and firm growth. In fact, it is crucial to analyse the pattern of HGFs across countries (Bravo-Biosca, 2010, 2011). A scarce number of studies have tackled with the behaviour of HGFs at country level. Some exceptions are Schreyer (2000); Bravo-Biosca (2010, 2011); Hölzl (2009), Navaretti et al. (2014) and Teruel and de Witt (forthcoming). However, the majority of these works have aggregated level. Hence, an analysis at firm level may be more informative of the firm performance and its linkages at mac-roeconomic level.
In line with Hölzl (2009), we analyse the data from Community Innovation Survey (henceforth CIS). However, here we consider the simultaneous behaviour of research, innovation and HGFs at firm level. The entrance in the EU of new coun-tries with a technological gap may accelerate their process of technological catch-up, but also their growth activity. Hence, we aim to analyse HGFs in countries with a large investment in R&D in comparison with those with a lower level. Our assump-tion is that the heterogeneous market structure and R&D effort among European countries have generated HGFs with different R&D and innovation patterns.
With this purpose in mind, we focus on the behaviour of two groups of coun-tries according to R&D investment effort. Here, we aim to analyse the different be-haviour of HGFs in reference with their innovation activity. Given the recent find-ings from Decker et al. (2016) and Audretsch et al. (2014), we may expect that there are unobserved characteristics which affect simultaneously the innovation perfor-mance and the probability of becoming a HGF.
Our database is drawn from the CIS between 2006 and 2008 for 15 European countries. After the dataset treatment, our sample contains 67,279 firms. Accord-ing to the features of our data, we apply a biprobit model to take into account the simultaneity between the innovation output and the probability that a firm be-comes a HGF. With this methodology we control for the unobserved characteris-tics that may potentially affect simultaneously that a firm becomes a HGF, but it also innovates. Our results show that the drivers of HGFs in countries with a low business R&D effort differ from HGFs located in countries with a high business R&D effort.
The article makes several contributions. First, we use a database that covers 15 Eu-ropean countries that allow us to observe the differences between high and low R&D intensive countries. Second, we consider the simultaneous relationship between the innovation inputs and the innovation outputs on the probability to become a HGF.
The structure of the article is the following. The second section reviews the empirical literature of HGFs. The third section presents our database and the
4 See European Commission (2011).

AGUSTÍ SEGARRA / MERCEDES TERUEL / ELISENDA JOVÉ
200
Ekonomiaz N.º 90, 2.º semestre, 2016
main statistical descriptive. The fourth section shows the econometric methodolo-gy. The fifth section reports our main results and the final section presents our concluding remarks.
2. LITERATURE REVIEW
2.1. HGFs: concept and stylized facts
Birch’s (1979) work was the starting point to observe the contribution of a group of firms which were contributing more than their counterparts. According with his findings, small firms where contributing more to the job creation. De-spite the criticisms to his work (see Haltiwanger et al., 2013), his research consti-tutes a point of reference in the literature of HGFs. Furthermore, the tent-shaped distribution of firm growth has risen the attention to a small group of firms locat-ed in the heavy tails that grow faster than their counterparts (Bottazzi and Secchi, 2006; Bottazzi et al., 2011).
The wide interest in the phenomenon of HGFs has generated that the delimita-tion of the concept is far from easy. In that sense, Parker et al. (2010) point out the lack of a commonly accepted denomination used for ‘high-growth’ firms. In this re-gard, the literature has referred to fast-growth firms (Deutschmann, 1991; Storey, 1994; Almus, 2002); high-growth impact firms (Acs et al., 2008), high-growth firms (Schreyer, 2000), «superstar» fast-growth firms (Coad and Rao, 2008), rapidly ex-panding firms (Schreyer, 2000), and gazelles (Birch, 1981, among others).
At empirical level, there are also differences. First, firm growth is a multidimen-sional phenomenon (Delmar et al., 2003) which may be measured in terms of sales, employment, profit, productivity and added value. Second, HGFs are identified ac-cording with different measures. They may be identified as a certain share of the fastest growing firms (often 5% or 10%) during a period, using the Eurostat-OECD measure which considers HGFs as firms with at least ten employees in the starting year, and an annualized employment growth larger than 20% during a 3-year period (Eurostat-OECD, 2007), or the Birch index which is a mixture between absolute and relative growth rates (Birch, 1981). Finally, the evidence shows that firms classified as HGFs with one measure may differ according with another measure (Daunfeldt et al., 2014). Hence, each variable and measure has advantages and disadvantages de-pending on the policy focus and they will be more appropriate according with the purpose of analysis.
Synthetically, the main stylized facts of the HGFs phenomena are the following5: 1) a small share of firms become HGFs; 2) they are present at all sectors (Schreyer,
5 For a review, see Henrekson and Johansson (2010), Coad et al. (2014a) and Moreno and Coad (2015), among others.
HIGH-GROWTH FIRMS AND INNOVATION IN EUROPEAN COUNTRIES
201
Ekonomiaz N.º 90, 2.º semestre, 2016
2000); 3) they are more present among young firms6; 4) there is a low persistence of HGFs (Delmar et al. 2013)7 or in other words HGFs are «one hit wonders» (Daun-feldt and Halvarsson, 2015); 5) small HGFs tend to have more organic growth, while large HGFs grow more with mergers and acquisitions; 6) they are more R&D inten-sive (Segarra and Teruel, 2014; Coad et al., 2016)8; 7) HGFs usually export more than they counterparts (Parsley and Halabisky, 2008; Mason and Brown, 2010); 8) they show a larger internationalization and integration in global value chains (Ma-son and Brown, 2010; Du and Temouri, 2015); 9) they have more human capital (Daunfeldt et al., 2015).
2.2. The empirical evidence at country level
According to the Schumpeterian theory of creative destruction, HGFs may be a revulsive for the innovation and growth of countries. Their capacities to generate new jobs and to exploit their competitive advantages represent a shake-out in the market distribution. Consequently, policymakers have focused their attention in HGFs. However, according with a recent survey from Mason and Brown (2013) and Brown and Mawson (2015), the theoretical basis that have generated current public governmental policies are supported on incorrect theories9. The authors suggest that policies should base on the «dynamic capabilities» instead of the traditional re-source-based views. They suggest that «growth accelerators should become much less resource based and more ‘competency-based’. Therefore, assistance to help with the external orientation of the firm will be important». In part, this mistake is due to the high potential growth of high-tech sectors (see Daunfeldt et al., 2015).
While promoting HGFs may be difficult at country level, the challenge is still more prominent for wider regions such as the EU. For instance, the European Com-mission has applied policies to SMEs HGFs10. In an economic context where countries differ in terms of their technological gap, their economic growth and their institution-al and market structures, it is necessary to analyse the differences of HGFs at country level. According to Daunfeldt et al. (2015) the fact that «conditions may differ across countries and over time» may cause the disparity of non-homogenous results of the impact of R&D on firm growth. The issue is relevant given that the allocation of the
6 In fact, authors such as Schreyer (2000), Delmar et al. (2003), Haltiwanger et al. (2013) and Daunfeldt et al. (2014) have pointed that it is age and not size the variable which most affect firm growth.
7 However, Hölzl (2014) points out that it depends on the growth measure.8 According with Mazzucato and Parris (2015), «HGF have the most to gain from increasing their R&D intensity. However, the benefits of investing in R&D are conditional on the competitive environment, even for firms in the top growth quantiles».9 The authors point out that there are some misconceptions based on the fact that «HGFs will predomi-nantly emerge from the stock of high-tech firms within an economy» and the fact that «high growth poten-tial NTBFs confront certain ‘market failures’».
10 See European Commission (2010, 2011).

AGUSTÍ SEGARRA / MERCEDES TERUEL / ELISENDA JOVÉ
202
Ekonomiaz N.º 90, 2.º semestre, 2016
scarce public budget must be addressed to the most convenient firms. However, Bra-vo-Biosca (2010, 2011) points out to the necessity that policies must address structural reforms at country level that remove barriers to entry and growth (product, labour, land and financial barriers)11 to overcome differences across countries.
From a territorial perspective, SMEs become HGFs more frequently in innova-tive ecosystems such as clusters and other business networks promoting innovation and value chains. Hence, new innovation policies can stimulate the appearance of HGFs locally by supporting firm’s initiatives and sectorial clusters activities to drive greater growth through collaborative actions.
Consequently, it seems necessary to adopt a country level approach to evaluate HGFs. However, the majority of the empirical evidence has focused in a particular country, while scarce contributions have analysed the behaviour of HGFs across countries. The most outstanding articles are those from Schreyer (2000), Hölzl (2009), Bravo-Biosca (2010, 2011), Navaretti et al. (2014) and Teruel and de Wit (forthcoming).
Using data from five OECD countries and Quebec, Schreyer (2000) analyses the pattern of HGFs at industry level between 1980s and 1990s. His results show that HGFs are more technology intensive than the average firm. Furthermore, this au-thor observes that HGFs are found in all industries and regions. Concerning the R&D effort, HGFs are more R&D intensive. Finally, he confirms that HGFs account for a disproportionately large share of job creation.
Later Bravo-Biosca (2010, 2011) analyses the industrial behaviour of 12 OECD countries between 2002 and 2005. He focuses on the relationship between TFP growth and the dynamics of the growth distribution. He finds two interesting find-ings. First, countries with larger share of firms which remain static show a lower productivity growth in a country. Second, countries with a higher share of shrinking and growing firms show a faster productivity growth. Both authors, Schreyer (2000) and Bravo-Biosca (2010, 2011), observe a stylized fact in EU: firms are more static in EU than in US. According with these authors, this is the reason why Europe shows a lower productivity growth at the aggregate level.
Teruel and de Witt (forthcoming) explore data from 17 OECD countries be-tween 1999 and 2005. They focus on the incidence of macroeconomic determinants of three driving forces of high growth, such as the entrepreneurship, institutional settings, and opportunities for growth. Results highlight the importance of the en-trepreneurship to increase the presence of HGFs in a country and the existence of institutional obstacles such as the labour market protection and the administrative barriers.
11 Bravo-Biosca (2010) considers that the causes of differences across countries are related to the role of institutions and the barriers of growth.

HIGH-GROWTH FIRMS AND INNOVATION IN EUROPEAN COUNTRIES
203
Ekonomiaz N.º 90, 2.º semestre, 2016
Due to the inherent difficulties in accessing business-level data simultaneously in several countries, only Hölzl (2009) explores the behaviour of HGFs at firm level for different countries. Using data from the CIS for 16 countries for the period 1998-2000, this author analyses the determinants across countries that a firm becomes a HGF. Af-ter applying a matching procedure, he estimated quantile regressions to analyse the determinants of firm growth. The main result is that HGFs show a larger R&D intensi-ty than non-HGFs in countries closer to the technological frontier.
More recently, for a sample of French, Italian and Spanish manufacturing firms with more than ten employees in the period from 2001 to 2008, Navaretti et al. (2014) apply a quantile methodology to analyse the determinants of firm growth. These authors find that the number of employees in R&D activities and graduates is positively correlated with the firm growth in the largest quantiles, while product and process innovations only have a significant positive incidence for the lowest quan-tiles.
Our database is similar to Hölzl (2009) but with more restricted information and for the period 2006-2008. Nevertheless, we consider the unobserved characteris-tics that may potentially affect simultaneously that a firm becomes a HGF, but it also innovates. As we have seen previously, there is empirical evidence that HGFs show a larger R&D and innovation intensity. However, there is no evidence on the underlying relationship. In that sense, we consider that HGFs depend on the inno-vation activity, and where their capacity to innovate depends on the R&D activity.
3. DATABASE AND STATISTICAL DESCRIPTIVE
3.1. CIS data and country clusters criteria
The empirical application was carried out using the Community Innovation Survey (CIS), in particular, we use the CIS 2008 wave which covers the period 2006–2008. The CIS is a harmonized survey at firm level that provides information on firm’s innovation behaviour, type of innovators, sectors and size classes. CIS surveys are carried out every two years by EU member states as well as several other non-EU countries (e.g. Norway, Iceland). Although most of European countries participate in each CIS survey, data are only available for a limited set of EU members’ states. Hence, scholars must focus their work on a restricted sample of countries. Despite these limitations of data availability, this paper analyses the determinants of HGFs using an extensive sample of firms belonging to 15 countries: Bulgaria, Cyprus, Czech Republic, Estonia, Germany, Hungary, Italy, Latvia, Lithuania, Norway, Por-tugal, Romania, Slovakia, Slovenia and Spain.
The main advantage of the CIS data is that it contains detailed information on the innovation behaviour at the firm level in much greater detail than in other data-sets. Thus, CIS data makes it possible to study the innovation behaviour of HGFs

AGUSTÍ SEGARRA / MERCEDES TERUEL / ELISENDA JOVÉ
204
Ekonomiaz N.º 90, 2.º semestre, 2016
and, in general, of SMEs. Additionally, the CIS data are internationally comparable based on a common survey questionnaire and methodology, which makes the co-rresponding data set suitable for cross-country comparison.
Table 1. COUNTRY DISTRIBUTION OF FIRM SAMPLES
CountryBusiness
R&D (% GDP)
Number of firms
Number of firms
(%)
HGFs(%)
Sales growth
06-08 (%)
Country group 1 -leaders
Germany 1.84 4,028 5,99 10,80 15,15
Slovenia 1.07 1,594 2,37 19,45 22,56
Czech Republic 0.91 3,812 5,67 23,08 26,05
Norway 0.87 2,449 3,64 19,19 22,41
Portugal 0.76 4,578 6,80 13,30 12,11
Spain 0.74 19,316 28,71 12,76 8,77
Italy 0.60 8,219 12,22 8,80 5,77
Total group 1 7 countries 43,996 65,40% 13,36 11,90
Country group 2 -laggards
Estonia 0.56 2,710 4,03 16,09 12,81
Hungary 0.53 3,207 4,77 20,11 20,72
Slovakia 0.20 1,011 1,50 41,54 49,13
Lithuania 0.19 825 1,23 22,42 22,00
Romania 0.18 5,680 8,44 24,30 24,49
Bulgaria 0.15 8,821 13,11 32,32 38,66
Latvia 0.15 444 0,66 20,05 15,06
Cyprus 0.11 585 0,87 22,74 28,92
Total group 2 8 countries 23,283 34,60% 26,36 28,89
Total firms 67,279 100%
Source: CIS 2008, Eurostat, own calculation. HGF High-growth firms. Business R&D: Expenditures on R&D performed by the business sector. Unit: % of GDP. Source: Eurostat.
We should also point out that CIS 2008 database has some drawbacks for the analysis of firm growth. First, CIS data is a cross-sectional dataset. In fact, analysing HGFs time-series data would allow us to investigate further questions, for instance,
HIGH-GROWTH FIRMS AND INNOVATION IN EUROPEAN COUNTRIES
205
Ekonomiaz N.º 90, 2.º semestre, 2016
which share of them continues growing fast, or which role the firm life cycles plays in the high-growth phenomenon. Second, CIS data has little financial information, which is a crucial variable for firm growth. Thus, we cannot use it to answer the question whether HGFs growth fast because they are already more profitable than the average firm, or whether they grow fast in order to achieve above average profi-tability. Third, some questions are «subjective». In this regard, the assessment of the innovation has a qualitative dimension and its proxies depend partially on the per-sonal appreciation of the respondents. And fourth, although the CIS provides com-parable innovation data for European countries, the country coverage varies subs-tantially depending on the indicators considered.
Finally, our database was subject to a filtering process. First, we selected firms from the manufacturing and service sectors (including high-tech and low-tech sec-tors). Second, we restricted observations to those with a growth or decline of sales and employees smaller than 250% per year in order to control the presence of out-liers. Although the filtering process reduced the initial database from 125,496 to 67,279 firms, the sample improved in the consistency of the data.
After the filtering process and according to the share of expenditures on R&D per-formed by the business sector on GDP during the period 2008, we group the 15 Euro-pean countries into two categories. The first group (leader cluster) comprises a set of countries: six EU members (Germany, Slovenia, Czech Republic, Portugal, Spain and Italy) and a country that is member of the European Economic Area (Norway). All of them have been integrated on the EU project for many years, but Slovenia and Czech Republic that were integrated in 2004. These countries are close to the technological frontier where the share of business R&D on GDP is higher than 0.6 percent. In con-trast, the second group comprises eight laggards EU members (Estonia, Hungary, Slo-vakia, Lithuania, Romania, Bulgaria, Latvia and Cyprus). All of them were integrated in 2004 in the EU, except two (Romania and Bulgaria) that were integrated in 2007. All of these countries were characterised by showing lower shares of business R&D on GDP and being far enough of the technological frontier of EU. The first group inclu-des 43,996 firms and the second one 23,283 firms.
3.2. HGF indicators
Departing from this final selection of firms, we identify HGFs. We adopt the cri-teria adopted by OECD and Eurostat in the Manual on Business Demography Sta-tistics (Eurostat-OECD 2007) which defines HGFs as: «All enterprises with average annualised growth in employees (turnover) greater than 20% a year, over a 3-year pe-riod, and with 10 employees at the beginning of the observation period».
Both of the most frequently used measures -sales and employment growth- have advantages and disadvantages. One drawback of the sales variable is inflation (Delmar et al., 2003). Given that policy makers are concerned with reducing the

AGUSTÍ SEGARRA / MERCEDES TERUEL / ELISENDA JOVÉ
206
Ekonomiaz N.º 90, 2.º semestre, 2016
unemployment rate, employment is generally considered to be an interesting mea-sure of firm growth (Storey, 1994). However, employment growth is highly affec-ted by increases in labour productivity (Delmar et al., 2003) and by the distance from the sectorial minimum efficient scale that enables them to survive (Sutton, 1997). On the other hand, it would be difficult to apply a consistent HGF thres-hold across all countries participating in the data collection. In fact, the countries with a larger share of SMEs and young firms will have more probabilities to have a larger percentage of HGFs than those countries with a larger share of large and mature firms.
Following this definition, we considered a HGF as a firm with a turnover growth equal or superior to the 20% between the years 2006 and 2008. In general, the empirical literature applies different HGF measures such as sales and emplo-yees. However, the CIS information provided by Eurostat does not offer the num-ber of employees (this variable is recoded between three size classes: firms with 10–49, 50–249 and 250 and more employees) but CIS data offers the turnover. Consequently, our definition of HGFs will base on growth in terms of sales. Hen-ce, we deflated this variable, as well as the rest of monetary variables, by an indus-trial price index.
Our final data has 67,279 firms, of which 12,020 (17.87 %) were HGFs. In the cluster of countries close to the technological frontier the percentage of HGFs are 13.36 %. In contrast, in the laggard group this percentage increase up to 26.36 %. The difference among the percentage of HGFs in both groups of firms may be ex-plained in part by the fact that firms in laggard countries are taking benefit by the fact that these countries are still in a process of economic convergence and also with market structures which are weaker.
3.3. Statistical descriptive
Here we offer the main features that distinguished HGFs between the two coun-try clusters that we have taken into account in this study. In particular, Table 2 pre-sents descriptive statistics for the two country groups, leaders versus laggards’ coun-tries. The main characteristics that distinguish HGFs in both groups of countries are the following:
a) The presence of HGFs is higher in countries classified as laggards than inleaders. In particular, the percentage of HGFs in laggards doubles to leaders.
b) Despite the above result, the probability of being an innovative firm is hig-her among the most dynamic countries (leader group), in terms of innova-tion, than in the other countries (laggard group). In addition, firms that be-long to the first group are more prone to invest in R&D, both internal andexternal, cooperate in R&D projects and perform acquisitions of machineryand other hardware more frequently.

HIGH-GROWTH FIRMS AND INNOVATION IN EUROPEAN COUNTRIES
207
Ekonomiaz N.º 90, 2.º semestre, 2016
Table 2. DESCRIPTIVE STATISTICS BY COUNTRY GROUPS (mean values)
Whole sample
Country group 1
Country group 2
Mean difference
HGF 0.1786 0.1336 0.2636 0.1299***(0.0030)
Innovative 0.5551 0.6175 0.4376 -0.1799***(0.0039)
Innovation input
intRD 0.2602 0.3350 0.1187 -0.2163***(0.0034)
extRD 0.1277 0.1616 0.0638 -0.0977***(0.0026)
Machinery 0.2879 0.2949 0.2749 -0.0199***(0.0036)
Sources of information
Internal 0.2259 0.2689 0.1449 -0.1239***(0.0033)
Market 0.2205 0.2503 0.1644 -0.0855***(0.0033)
Institutional 0.0402 0.0496 0.0224 -0.0272***(0.0015)
Other 0.0664 0.0745 0.0509 -0.0236***(0.0020)
Innovation output
TechInnov 0.4488 0.5060 0.3410 -0.1649***(0.0039)
Non-TechInnov 0.4083 0.4632 0.3048 -0.1584***(0.0039)
Individual characteristics
Size
Size <50 0.5730 0.5862 0.5484 -0.0378***(0.0040)
Size 50-249 0.3210 0.3010 0.3591 0.0511***(0.0037)
Size >249 0.1056 0.1126 0.0923 -0.0202***(0.0024)
Group 0.2885 0.3359 0.1988 -0.1371***(0.0036)
Cooperation 0.1607 0.1825 0.1196 -0.0629***(0.0029)
Public funds
Regional 0.0670 0.0997 0.0051 -0.0946***(0.0019)
National 0.0823 0.1056 0.0383 -0.0672***(0.0022)
EU 0.0342 0.0356 0.0316 -0.0040***(0.0014)
Export 0.5290 0.5628 0.4652 -0.0976***(0.0040)
Aggregate determinants
Birth rate 21.02 17.29 28.07 10.78***(0.1251)
Observations 67,297 43,996 23,283
Source: CIS 2008, Eurostat, own calculation. HGF: high-growth firms. Country group 1: Czech Republic, Germany, Italy, Norway, Portugal, Spain and Slovenia. Country group 2: Bulgaria, Cyprus, Estonia, Hungary, Latvia, Lithuania, Romania and Slovakia. Note: Comparison of the two samples by the statistical t-test.*** Significant at 1%
AGUSTÍ SEGARRA / MERCEDES TERUEL / ELISENDA JOVÉ
208
Ekonomiaz N.º 90, 2.º semestre, 2016
Tab
le 3
. D
ESC
RIP
TIV
E S
TA
TIS
TIC
S O
F H
FG
S A
ND
NO
N-H
GF
S B
Y C
OU
NT
RY
GR
OU
PS
(mea
n v
alu
es)
Who
le s
amp
leC
oun
try
gro
up 1
Co
untr
y g
roup
2M
ean
diff
eren
ce
HG
FsN
on-
HG
FsH
GFs
No
n-H
GFs
HG
FsN
on-
HG
FsH
GFs
Inno
vativ
e0.
5505
0.55
620.
6716
0.60
910.
4345
0.43
86-0
.237
0***
(0.0
088)
Inno
vati
on
inp
ut
intR
D0.
2396
0.26
470.
3776
0.32
850.
1073
0.12
28-0
.270
3***
(0.0
073)
extR
D0.
1275
0.12
780.
1911
0.15
700.
0666
0.06
28-0
.124
5***
(0.0
059)
Mac
hine
ry0.
2916
0.28
710.
3188
0.29
120.
2656
0.27
82-0
.053
1***
(0.0
082)
Sour
ces
of i
nfo
rmat
ion
Inte
rnal
0.22
590.
2260
0.30
210.
2638
0.15
290.
1421
-0.1
492*
**(0
.007
5)
Mar
ket
0.22
080.
2205
0.27
420.
2466
0.16
970.
1626
-0.1
045*
***(
0.00
75)
Inst
itutio
nal
0.04
300.
0396
0.06
220.
0477
0.02
450.
0216
-0.0
376*
**(0
.003
6)
Oth
er0.
0740
0.06
470.
0865
0.07
270.
0620
0.04
70-0
.024
4***
(0.0
047)
Inno
vatio
n o
utp
ut
Tech
Inno
v0.
4437
0.45
000.
5505
0.49
910.
3414
0.34
09-0
.209
1***
(0.0
088)
No
n-Te
chIn
nov
0.41
990.
4059
0.53
520.
4521
0.30
940.
3031
-0.2
257*
**(0
.008
7)
…/…

HIGH-GROWTH FIRMS AND INNOVATION IN EUROPEAN COUNTRIES
209
Ekonomiaz N.º 90, 2.º semestre, 2016
Ind
ivid
ual c
hara
cter
istic
s
Size
S
ize
<50
0.59
310.
5688
0.58
570.
5863
0.60
020.
5298
0.01
44(0
.008
9)
S
ize
50-2
490.
3136
0.32
280.
3104
0.29
960.
3166
0.37
440.
0061
(0.0
084)
S
ize
>24
90.
0931
0.10
830.
1037
0.11
400.
0830
0.09
57-0
.020
6***
(0.0
053)
Gro
up0.
2797
0.29
040.
3696
0.33
070.
1935
0.20
07-0
.176
1***
(0.0
80)
Co
op
erat
ion
0.17
610.
1574
0.23
310.
1747
0.12
150.
1189
-0.1
116*
**(0
.006
8)
Pub
lic fu
nds
Reg
iona
l0.
0596
0.06
860.
1159
0.09
720.
0057
0.00
49-0
.110
2***
(0.0
042)
Nat
iona
l0.
0836
0.08
210.
1309
0.10
170.
0384
0.03
83-0
.092
4***
(0.0
049)
EU
0.03
910.
0332
0.04
600.
0340
0.03
240.
0313
-0.0
136*
**(0
.003
5)
Exp
ort
0.45
630.
5449
0.52
710.
5684
0.38
840.
4927
Ag
gre
gat
e d
eter
min
ants
Birt
h ra
te25
.65
20.0
120
.63
16.7
730
.45
27.2
2-0
.138
6***
(0.0
090)
Ob
serv
atio
ns12
,020
55,2
595,
881
38,1
156,
139
17,1
44
Sour
ce: C
IS 2
008,
Eur
ost
at, o
wn
calc
ulat
ion.
H
GF
hig
h-g
row
th fi
rms.
C
oun
try
gro
up 1
: Cze
ch R
epub
lic, G
erm
any,
Ital
y, N
orw
ay, P
ort
ugal
, Sp
ain
and
Slo
veni
a. C
oun
try
gro
up 2
: Bul
gar
ia, C
ypru
s, E
sto
nia,
Hun
gar
y, L
atvi
a, L
ithua
nia,
Ro
man
ia a
nd S
lova
kia.
N
ote
: Co
mp
aris
on
of t
he t
wo
sam
ple
s b
y th
e st
atis
tical
t-t
est.
***
Sig
nific
ant
at 1
%.
…/…
AGUSTÍ SEGARRA / MERCEDES TERUEL / ELISENDA JOVÉ
210
Ekonomiaz N.º 90, 2.º semestre, 2016
…/…
c) Firms that belong to country group 1 introduce more innovations, both te-chnological and non-technological, and receive more public funds that theircounterparts.
d) Finally, laggard countries have a higher birth rate compared to the othercountries, which might be explained due to increasing presence of HGF inthese countries. The existence of more HGFs may be due to the fact thatthey are in a process of economic convergence but also to the characteristicsof market structure where there is a larger predominance of small andyoung firms.
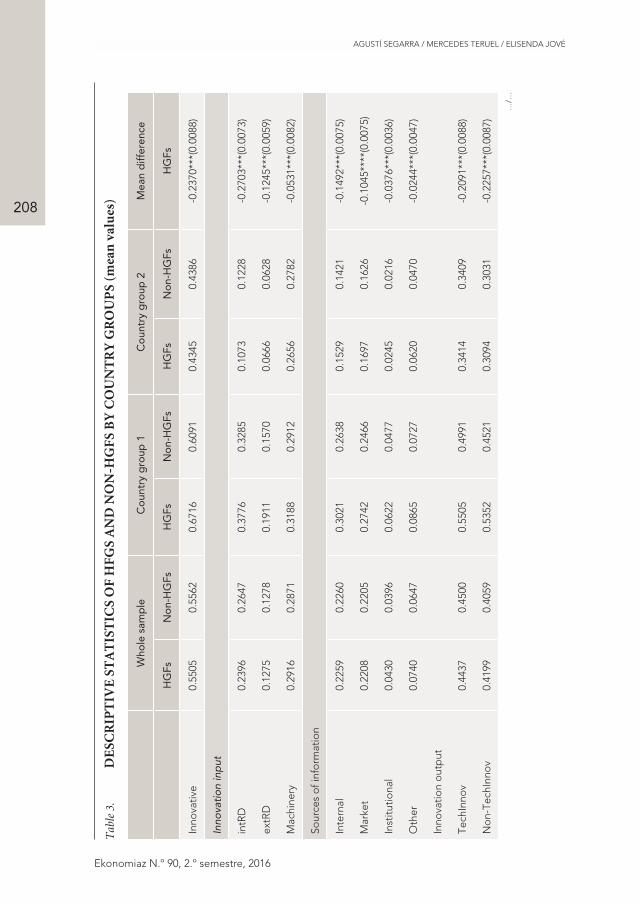
Table 3 shows the statistical descriptive of HGFs and Non-HGFs among both groups of countries. The main characteristics can be summarised in the fo-llowing aspects:
a) HGFs in laggard countries are less prone to invest in R&D and to cooperate inR&D projects than HGFs in the countries close to the technological frontier.
b) HGFs in the laggard countries are smaller, dominated by firms with lessthan 50 employees.
c) HGFs in laggard countries are less oriented to international markets, since theypresent a lower percentage of exports in comparison with leader countries.
d) While the picture for the HGFs in leader countries seems to be that they aremore innovative firms that carry out both technological and non-technologicalinnovations, firms that often cooperate in R&D projects firms that are, orien-ted to international markets and with better access to public subsidies in R&D.
e) In general, regardless we compare HGFs and Non-HGFs there are not signi-ficant differences (both groups show similar innovative patters, similar in-novative effort, and propensity to innovate). However, HGFs in laggardcountries are smaller and they export less than Non-HGFs.
f) In comparison with Non-HGFs, HGFs in leader countries are more innova-tive, they are more prone to invest more in R&D and cooperate in R&Dprojects, they use more frequently the different sources of information, andthey have more likelihood to receive public funds. However, they tend toexport less than Non-HGFs.
4. ECONOMETRIC METHODOLOGY
In order to analyse the relationship between the innovation activity and the pro-bability of becoming a HGF, we apply a bivariate probit procedure. Our approach is based on the model labelled as CDM model (Crépon, et al., 1998) where a firm’s in-novation effort has an impact on the capacity to innovate. And finally the innova-tion effort will have an impact on the firm performance measured in productivity.
HIGH-GROWTH FIRMS AND INNOVATION IN EUROPEAN COUNTRIES
211
Ekonomiaz N.º 90, 2.º semestre, 2016
Since we have a cross-section our estimations will not be able to capture the impact of innovation on the probability of being a HGF but the interrelationships. Hence, we adapt the CDM model and we consider a simultaneous model where the innova-tion inputs, innovation outputs and the capacity of the firm to become a HGF are interrelated.
By applying the bivariate probit regression model to estimate jointly the pro-pensity to innovate and the capacity to become a HGF we will be able to control for unobserved common determinants12.
Innovativeit = X´i,t b11 + g11 intRDi,t + g12 extRDi,t + g13 Machineryi,t + Z´i,t b12 + e1i,t
Eq. [1]
HGFit = X´i,t b21 + g21 TechInnovi,t + g22 Non - TechInnovi,t + e2i,t
Eq. [2]
and where
Eq. (3)
Equation (1) measures the probability that a firm innovates depending on a set of determinants common in the current literature13. Innovative is a dummy variable that takes the value 1 if the firm reports having introduced new or significantly im-proved technological or non-technological innovations between 2006 and 2008. As explanatory variables which are specific in this equation we include the innovation inputs such as whether the firm invests in internal R&D (intRD), external R&D acti-vity (extRD) and in machinery (Machinery) and a set of explanatory variables (Z) which belong to the different sources of information for innovation activities such as whether the firm considers important the information from sources within the
12 The probability of innovating and the probability of becoming a HGF must be estimated simultane-ously, since there may be unobserved characteristics that explain the capacity of firms to innovate and their capacity to become a HGF (see for instance Segarra and Teruel, 2014; Coad et al., 2016). Also, Decker et al., (2016) has recently pointed out the relationship between the presence of YICs and HGFs. Furthermore, the uncertainty associated with the innovation output depends also on unobservable firm-specific risk factors, which may affect also the capacity of a firm to introduce its goods in the mar-ket and, consequently, it may affect the capacity to become a HGF. In other words, there may be vari-ables such as the access to financial resources, human resources with capacity to innovate and introduce their capacity in the market, among others. The bivariate probit model takes the correlations between the likelihood of innovating and the probability a firm becomes a HGF. The bivariate probit estimation, where we assume normality of the error terms, provides a correlation parameter that yields information about the co-variation of the error terms of the two estimations.
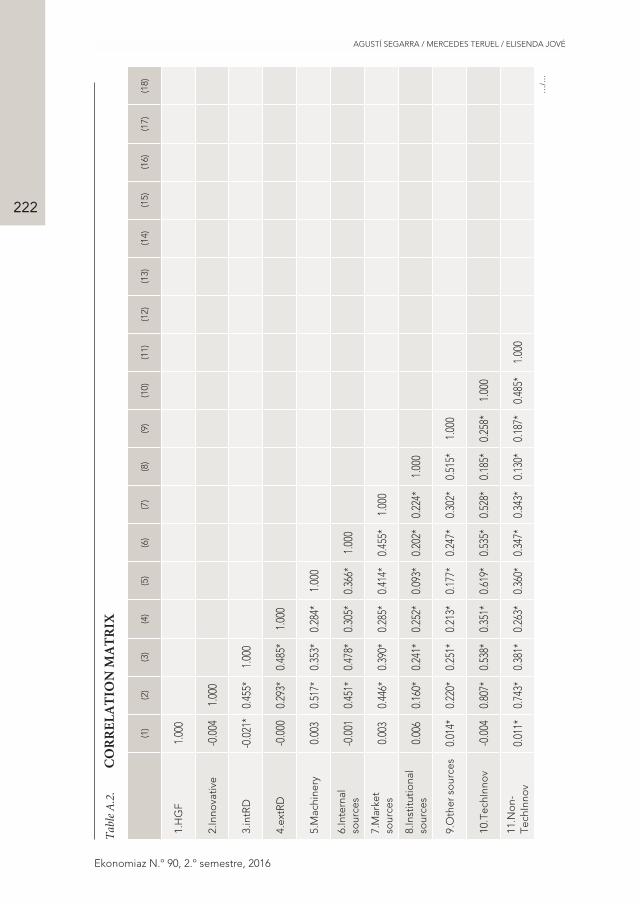
13 Please, check the variables definitions in Table A.1 and Table A.2 for the correlation matrix.
AGUSTÍ SEGARRA / MERCEDES TERUEL / ELISENDA JOVÉ
212
Ekonomiaz N.º 90, 2.º semestre, 2016
enterprise or group (Internal sources), from suppliers, clients, competitors or private R&D institutions (Market sources), from universities, public research organizations or technology centres (Institutional sources), and from conferences, scientific reviews or professional associations (Other sources).
Equation (2) estimates the probability of being a HGF (HGF is a dummy varia-ble which indicates if the firm is a HGF measured in terms of sales or not) depen-ding on whether the firm introduces technological (TechInnov) or non-technologi-cal innovations (Non-TechInnov) during the period 2006-2008.
Furthermore, both equations introduce different common sets of control varia-bles (X). First, we introduce firm characteristics such as firm size (dummies that identify firms between 50 and 249 employees and those with 250 or more emplo-yees), if the firm belongs to a group, if the firm exports or cooperates, and if it has received public funds (at regional, national or EU level). Finally, we include some macroeconomic variables such as the birth entry rate, country dummies and secto-ral dummies.
We assume that ei are independently and identically distributed and hence theyfollow a normal density function. The correlation coefficient between the disturban-ces (r) accounts for the possible existence of omitted or unobservable factors that affect simultaneously the decision to innovate and the likelihood of becoming a HGF. If r is equal to 0, the probability of becoming a HGF will not be correlated with the error term in Equation (1) and the probability of innovating will not be affected by the error term in Equation (2). While if r is different from 0, a joint es-timation is required to obtain consistent estimates. Our results show that the coeffi-cient r is significantly different to 0 when we estimate simultaneously all the coun-tries. However, when we split up according with our two categories of countries the parameter is not significant. We present the joint results but our results remain si-milar when we estimate the equations independently.
5. RESULTS
This section reports the estimated parameters of the determinants of the pro-bability to innovate and to be a HGF in terms of sales. Table 4 offers the estima-tions for the whole database and for both country groups considered in this pa-per. Our empirical results suggest, as might be expected, that the likelihood of innovating depends closely on investments in internal R&D, purchases of machi-nery and participation in cooperative R&D projects. With respect to the relation-ship between innovation and the probability to become a HGF our results su-ggest that technological and non-technological innovations are not really decisive determinants. However, firms belonging to leader countries show a positive rela-tionship between introducing non-technological innovations and the probability of becoming a HGF.
HIGH-GROWTH FIRMS AND INNOVATION IN EUROPEAN COUNTRIES
213
Ekonomiaz N.º 90, 2.º semestre, 2016
Given these relationships we can conclude that while success in innovation is closely related to previous investments in R&D, to be a HGF is not associated with the innovative activity at firm level while other variables will show an impact.
With respect to other factors affecting the probability of being an innovative firm, the main results are the following. First, firms between 50 and 249 are more prone to innovate. However, for the largest firms the relationship is negative in the leader countries, while the relationship is positive among the laggard countries. Se-cond, belonging to a group shows a positive relationship with the innovative capaci-ty of the firm, especially in the group of laggard countries. Third, firms that coope-rate and export show a greater correlation of being an innovative firm in both groups of countries. Fourth, regional public funds seem to be important to introdu-ce technological and non-technological innovations.
Furthermore, public funds from the EU seem to show a positive relationship with the probability to be an innovative firm in the group of laggard countries. Fina-lly, internal, market and other sources of information are the most important sour-ces of information for innovation activities across all technology country groups. All in all, our results seem to show that firms’ innovation activity in both groups of cou-ntries is ruled by different models innovation stages.
Regarding the other factors that affect the probability of becoming a HGF the differences between both country groups are relevant. First, our results confirm pre-vious empirical evidence on the negative relationship between firm size and the pro-bability of being a HGF. Hence, small firms have a larger propensity to become a HGF. Second, firms that belong to a group or they cooperate show also a positive association with the likelihood of becoming a HGF. However, both variables are not significant for the group of leaders while only the variable Cooperation is significant for firms located in the laggard countries. Third, the export activity has a significant negative relationship with being a HGF. Our result is not able to confirm the pre-vious evidence which shows that firms with international activity will have a larger likelihood of being a HGF. We must have in mind that our data does not have tem-poral lags so we are not capturing the causal relationship.
Concerning the access to public funds, in general there is a positive relationship between firms that have received public funds at regional and national level and the probability of being a HGF. However, these relationships are only significant among firms in leader countries. Finally, we observe that the probability of being a HGF is positively associated with the existence of high business dynamics. Our result may point out that those countries with a larger firm entry rate may have a larger percenta-ge of firms which become HGF. This may be linked with the fact that they are coun-tries with higher market opportunities or that there are more competitive pressure.

AGUSTÍ SEGARRA / MERCEDES TERUEL / ELISENDA JOVÉ
214
Ekonomiaz N.º 90, 2.º semestre, 2016
Table 4. BIVARIATE PROBIT OF THE PROBABILITY OF INNOVATING AND THE PROBABILITY OF BECOMING A HGF
Whole database Country group 1 Country group 2
Probability of becoming a HGF
Innovation output
TechInnov 0.0247 0.0296 0.0154(0.015) (0.020) (0.024)
Non-TechInnov 0.0987*** 0.1274*** 0.0356(0.017) (0.021) (0.029)
Individual characteristics
Size
Size: 50-249 -0.0534*** -0.0313 -0.0788***
(0.014) (0.019) (0.022)
Size>249 -0.1524*** -0.1545*** -0.1420***
(0.024) (0.030) (0.038)
Group 0.0284* 0.0271 0.0304
(0.016) (0.019) (0.027)
Cooperation 0.0405** 0.0333 0.0615*
(0.020) (0.024) (0.035)
Public funds
Regional 0.1058*** 0.0949*** 0.0423
(0.027) (0.028) (0.130)
National 0.0570** 0.0658** 0.0047
(0.025) (0.028) (0.054)
EU -0.0333 -0.0385 -0.0026
(0.034) (0.043) (0.057)
Exports -0.0649*** -0.0693*** -0.0530**
(0.014) (0.018) (0.022)
Aggregate determinants
Birth rate 0.0024*** 0.0028** 0.0029***
(0.001) (0.001) (0.001)
Constant -1.4161*** -1.5574*** -0.3975***
(0.035) (0.043) (0.031)
Probability of innovate
Innovation input
intRD 0.5856*** 0.6124*** 0.7200***
(0.025) (0.026) (0.093)
extRD -0.0661* -0.0824** 0.4417***
(0.037) (0.038) (0.152)
Machinery 1.4730*** 1.2294*** 1.9164***
(0.022) (0.026) (0.040)
…/…
…/…

HIGH-GROWTH FIRMS AND INNOVATION IN EUROPEAN COUNTRIES
215
Ekonomiaz N.º 90, 2.º semestre, 2016
Whole database Country group 1 Country group 2
Individual characteristics
Size
Size: 50-249 0.1690*** 0.1413*** 0.2154***
(0.015) (0.018) (0.026)
Size>249 0.0466 -0.0978*** 0.3695***
(0.028) (0.034) (0.049)
Group 0.0416** 0.0104 0.1757***
(0.017) (0.020) (0.035)
Cooperation 0.6797*** 0.6427*** 0.6536***
(0.038) (0.041) (0.093)
Exports 0.2185*** 0.2596*** 0.1076***
(0.014) (0.016) (0.026)
Public funds
Regional 0.2510*** 0.3053*** 5.6923***
(0.045) (0.044) (0.176)
National -0.0445 -0.0321 -0.0082
(0.046) (0.048) (0.151)
EU 0.1541* -0.0726 0.5645***
(0.080) (0.086) (0.200)
Sources of information
Internal 0.9539*** 0.9731*** 0.7016***
(0.029) (0.030) (0.080)
Market 0.9701*** 0.9047*** 1.1532***
(0.030) (0.032) (0.082)
Institutional -0.3454*** -0.4136*** -0.1607
(0.077) (0.082) (0.212)
Others 0.4415*** 0.38433*** 0.7485***
(0.066) (0.072) (0.161)
Aggregate determinants
Birth rate -0.0005 -0.0012 0.0012
(0.007) (0.001) (0.001)
Constant -0.8893*** -0.8911*** -0.6938***
(0.042) (0.042) (0.034)
r -0.0230* -0.0136 -0.0235
(0.012) (0.016) (0.020)
Wald test of χ2 14648.84 8502.38 5489.57
0.000 0.000 0.000
Observations 67,279 43,996 23,283
Source: CIS 2008, Euroestat, own calculation. HGF: high-growth firms.
Country group 1: Czech Republic, Germany, Italy, Norway, Portugal, Spain and Slovenia. Country group 2: Bulgaria, Cyprus, Estonia, Hungary, Latvia, Lithuania, Romania and Slovakia.
Estimations control for country and sector dummies. *; **; *** indicate levels of significance equal to 10, 5 and 1 %. Robust standard errors in parentheses.
…/…
AGUSTÍ SEGARRA / MERCEDES TERUEL / ELISENDA JOVÉ
216
Ekonomiaz N.º 90, 2.º semestre, 2016
6. CONCLUSIONS
Since the current economic recession, the European governments and the Euro-pean Commission have shown an increasing interest in creating a favourable envi-ronment for innovation and generation of firms with high growing potential. Hen-ce, this paper examines in depth the role that innovation plays to firms become HGFs. The CIS 2008 data provided by Eurostat covers most of the EU countries. Our country selection is based on an extensive sample of 67,279 innovative firms from 15 European countries distributed in two samples. The first sample includes 43,996 innovative firms from leader countries, and the second one includes 23,283 innovative firms from laggard countries. The aim of this study is to find the main stylized facts that define the relationship between R&D and innovation activities of European firms and their capacity to become HGFs.
The descriptive analysis confirms that HGFs are present in all the countries, although the amount of firms and their features considerably differ. The relative macroeconomic position of the country just like the technology nature and the mar-ket structure of the industry greatly define the capacity of the firms to become HGFs. In our analysis we show that leader countries have fewer HGFs but their dri-ving forces are related to the R&D activities -firms are especially high growth inno-vative firms-, while the laggard countries have more HGFs driven by important bu-siness opportunities. These opportunities are provided by the catching-up process that these countries are experiencing towards the leading European countries. Most of these countries were recently satellite economies under the Soviet Union hege-mony, which were finally joined to the EU during 2004 and 2007 with a considera-ble gap regarding previous EU country members.
In summary, in laggard countries HGFs are less oriented to international mar-kets with smaller and underinvestment in R&D projects and little access to public subsidies than their counterparts in leader countries. Also in laggard countries, when we compare HGFs and Non-HGFs the differences between both groups are little in terms of innovative patterns, however in terms of size and export propensity HGFs are smaller and less export oriented than Non-HGFs. On the other hand, in leader countries we observe that HGFs are more innovating than Non-HGFs. They are more prone to invest in R&D and cooperate with R&D projects, they use more frequently the different sources of information and are more likely to receive public funds. Nevertheless, HGFs tend to export less than Non-HGFs.
Related to the determinants of the likelihood of innovating and becoming a HGFs, we should say that the capacity to innovate depends closely on investments in internal R&D, the purchase of machinery and the participation in cooperative R&D projects of the innovative firms. However, related to the link between innovation and the probability to become a HGF, our results suggest that technological and non-technological innovations are not really decisive determinants.
HIGH-GROWTH FIRMS AND INNOVATION IN EUROPEAN COUNTRIES
217
Ekonomiaz N.º 90, 2.º semestre, 2016
Other factors that affect the probability to innovate are the following: middle size firms -between 50 and 249 employees- are more prone to innovate; belonging to a group shows a positive impact on the innovative capacity of the company, espe-cially in the laggard countries group; firms which export show a greater capacity to innovate; and regional public funds seem to be important to introduce technologi-cal and non-technological innovations. In conclusion, our results seem to show that firms’ innovation activity in leaders and laggards countries is ruled by different mo-del innovation stages.
Regarding the factors that affect the probability of becoming a HGF, the diffe-rences between both country groups are relevant. The results confirm the previous empirical evidence on the negative relationship between firm size and the probabili-ty of being a HGF. The most relevant stylized facts obtained are the following: small firms have a higher propensity to become a HGF; firms that belong to a group take advantage of becoming a HGF; and the export activity has a significant negative re-lationship about being a HGF. This final result is not able to confirm the previous evidence which shows that firms with international activity will have more likeli-hood of being a HGF, it is probably because our data does not have temporal lags so we are not capturing the causal relationship.
This paper highlights the evidence that the amount and, above all, the profile of HGFs are different between countries. The macro, sectorial and technological con-ditions are determinant keys about HGFs’ features. In our analysis, we have found that in seven leader European countries the rate of HGFs is lower and they are more innovative HGFs, however in eight laggard European countries the rate of HGFs is higher and they invest less in innovation activities.
During these years, the European Commission together with states and regional governments share the goal to foster the creation and the survival of HGFs. This re-quires create the appropriate atmosphere to facilitate the emergence of new business projects that generate qualified high risk job opportunities and ensure the economic growth of the European countries. To achieve these objectives European Commis-sion and the European governments improve the conditions in order to support the creation of HGFs. Up to now, frameworks such as «Promoting innovative and high growth firms» have taken an excessive simple and homogeneous vision. Studies like this one can help to understand that the European reality is much more complex. Therefore, in front of a complex reality we need an appropriate public policy in or-der to achieve the suggested aims.
AGUSTÍ SEGARRA / MERCEDES TERUEL / ELISENDA JOVÉ
218
Ekonomiaz N.º 90, 2.º semestre, 2016
Acs, Z. J. (2011): «High-impact firms: Gazelles revi-sited», in Fritsch, M. (ed.), Handbook of re-search on entrepreneurship and regional develop-ment: National and regional perspectives, Edward Elgar Publishing, 133–174, Chelten-ham.
Acs, Z. J. and Mueller, P. (2008): «Employ-ment effects of business dynamics: Mice. Ga-zelles and Elephants», Small Business Econo-mics, 30(1): 85–100.
Acs, Z., Parsons, W. and Tracy, S. (2008): «High-impact firms: Gazelles revisited», Uni-ted States Small Business Administration. Offi-ce of Advocacy 328.
Almus, M. (2002): «What characterizes a fast-growing firm?», Applied Economics, 34(12): 1497-1508.
Audretsch, D. B., segarra, a. and teruel, m. (2014): «Why don’t all young firms invest in R&D?», Small Business Economics, 43(4): 751-766.
Birch, D. L. (1979): The job generation process, Massachusetts Institute of Technology, Cam-bridge.
— (1981): «Who Creates Jobs?», The Public Inter-est, 65: 3-14.
Birch, D. and Medoff, J. (1994): «Gazelles», in Lewis, C.S. and Alec, R. L. (ed.), Labor mar-kets, employment policy and job creation, West-view Press, 159–167, Boulder.
Bottazzi, G. and Secchi, A. (2006): «Explaining the distribution of firm growth rates», RAND Journal of Economics, 37(2): 235-256.
Bottazzi, G., coad, A., Jacoby, N. and Secchi, A. (2011): «Corporate growth and industrialdynamics: Evidence from French manufactu-ring», Applied Economics, 43(1): 103-116.
Bravo-Biosca, A. (2010): Growth dynamics ex-ploring business growth and contraction in Eu-rope and the US. NESTA, London.
— (2011): «A look at business growth and con-traction in Europe», NESTA, working paper 11/02, London.
Brown, R. and Mawson, S. (2015): «Targeted support for high growth firms: Theoretical constraints, unintended consequences and fu-ture policy challenges», Environment and Planning C Government and Policy, XX: 1-21.
Coad, A., Daunfeldt, S.O., Johansson, D., Hölzl, W. and Nightingale, P. (2014a): «High-growth firms: introduction to the spe-cial section», Industrial and Corporate Change, 23(1): 91–112.
Coad, A., Daunfeldt, S. O., johansson, d. and wennberg, k. (2014b): «Whom do high-growth firms hire?», Industrial and Corporate Change, 23(1): 293-327.
Coad, A. and Rao, R. (2008): «Innovation and firm growth in high-tech sectors: A quantile regression approach», Research Policy, 37(4): 633-648.
Coad, A., Segarra, A. and Teruel, M. (2016): “Innovation and firm growth: does firm age play a role?», Research Policy, 45: 387-400.
Colombelli, A., Kraft, J. and Quattraro, F. (2014): «High-growth firms and technological knowledge: do gazelles follow exploration or exploitation strategies?», Industrial and Cor-porate Change, 23(1): 261-291.
Crépon, B., Duguet, E. and Mairesse, J. (1998): «Research, innovation and productivi-ty: An econometric analysis at the firm level», Economics of Innovation and New Technology, 7: 115–58.
Daunfeldt, S.O. and Halvarsson, D. (2015): «Are high-growth firms one-hit wonders? Evi-dence from Sweden», Small Business Econo-mics, 44: 361-383.
Daunfeldt, S. O., Elert, N. and Johansson, D. (2014): «The economic contribution ofhigh-growth firms: do policy implications de-pend on the choice of growth indicator?»,Journal of Industry, Competition and Trade, 14(3): 337-365.
— (2015): «Are high-growth firms overrepresen-ted in high-tech industries?», Industrial and Corporate Change, 1-21.
Davidsson, P. and Henrekson, M. (2002): «Determinants of the prevalence of start-ups and high-growth firms», Small Business Eco-nomics, 19(2): 81–104.
Decker, R.A., Haltiwanger, J., Jarmin, R.S. and Miranda, J. (2016): «Where has all the skewness gone? The decline in high-growth (young) firms in the US», European Economic Review, 86: 4-23.
BIBLIOGRAPHIC REFERENCES
HIGH-GROWTH FIRMS AND INNOVATION IN EUROPEAN COUNTRIES
219
Ekonomiaz N.º 90, 2.º semestre, 2016
Delmar, F., Davidsson, P. and Gartner, W. (2003): «Arriving at the high-growth firm», Journal of Business Venturing, 18(2): 189–216.
Delmar, F., Mckelvie, A. and Wennberg, K. (2013): «Untangling the relationships among growth, profitability and survival in new firms», Technovation. 33: 276–291.
Deutschmann, A. (1991): «America’s fastest ri-sers», Fortune, October, 46-68.
Du, J. and Temouri, Y. (2015): «High-growth firms and productivity: evidence from the United Kingdom», Small Business Economics, 44(1): 123-143.
European Commission (2010): Europe2020: A strategy for smart, sustainable and inclusive growth, Communication from the commis-sion. European-Commission: Research re-port. Growth Firms Report November2010. Accessed 12 Dec 2010.
€(2011): Policies in support of high-growth innova-tive SMEs. An INNO-Grips Policy Brief by em-pirica, Communication and Technology Re-search, Bonn.
Eurostat-Oecd (2007): Eurostat-OECD Manual on Business Demography Statistics, Office for Official Publications of the European Com-munities, Luxembourg.
Haltiwanger, J., Jarmin, R.S. and Miranda, J. (2013): «Who creates jobs? Small versus large versus young», The Review of Economics and Statistics, XCV(2): 347–361.
Henrekson, M. and Johansson, D. (2010): «Gazelles as job creators-A survey and inter-pretation of the evidence», Small Business Eco-nomics, 35: 227–244.
Hölzl, W. (2009): «Is the R&D behaviour of fast-growing SMEs different? Evidence from CISIII data for 16 countries», Small Business Economics, 33(1): 59-75.
— (2014): «Persistence, survival and growth: A closer look at 20 years of high growth firms and firm dynamics in Austria», Industrial and Corporate Change, 23(1): 199–231.
Mason, C. and Brown, R. (2010): High growth firms in Scotland, final report for Scottish en-terprise, Glasgow.
— (2013): «Creating good public policy to sup-port high-growth firms», Small Business Eco-nomics, 40(2): 211–225.
Mason, G., Bishop, K. and Robinson, C. (2009): Business growth and innovation: The wider impact of rapidly growing firms in UK ci-ty-regions, NESTA, London.
Mazzucato, M. and Parris, S. (2015): «High-growth firms in changing competitive envi-ronments: the US pharmaceutical industry (1963 to 2002)», Small Business Economics, 44: 145-170.
Moreno, F. and Coad, A. (2015): «High-Growth Firms: stylized facts and conflicting results», SPRU working paper 2015-05.
Navaretti, G.B., Castellani, D. and Pieri, F. (2014): «Age and firm growth: evidence from three European countries», Small Business Economics, 43(4): 823-837.
Oecd (2002): High-Growth SMEs and Employ-ment, OECD, Paris.
Parker, S.C., Storey, D.J. and Witteloostuijn, A. Van (2010): «What happens to gazelles? Theimportance of dynamic management strategy»,Small Business Economics, 35: 203-226.
Parsley, C. and Halabisky, D. (2008): Profile of growth firms: A summary of industry Canada research, Industry Canada, Ottawa.
Schreyer, P. (2000): «High-growth firms and employment», OECD Science, Technology and Industry Working Papers 2000/03.
Segarra, A. and Teruel, M. (2014): «High-Growth Firms and innovation: an empirical analysis for Spanish firms», Small Business Economics, 43(4): 805-821.
Storey, D.J. (1994): Understanding the Small Bu-siness Sector, Routledge, London.
Sutton, J. (1997): «Gibrat’s legacy», Journal of Economic Literature, 35: 40–59.
Teruel, M. and De Wit, G. (forthcoming): «Determinants of High-Growth Firms: Why Do Some Countries Have More High-Growth Firms than Others?», in Bonnet, Jean, Dejar-din, Marcus and Garcia Perez de Lema, Do-mingo (ed.) Exploring the Entrepreneurial So-ciety: Institutions, Behaviours and Outcomes, Edward Elgar, Chelthenham.
Veugelers, R. and Cincera, M. (2015): «The Impact of Horizon 2020 on Innovation in Eu-rope, Intereconomics, 50:4-30.

AGUSTÍ SEGARRA / MERCEDES TERUEL / ELISENDA JOVÉ
220
Ekonomiaz N.º 90, 2.º semestre, 2016
Table A.1. VARIABLE DEFINITIONS
Dependent variables
HGFDummy variable which takes the value 1 if the firm becomes a HGF measured in sales; 0 if not
Innovative Dummy variable which takes the value 1 if the firm has introduced technological innovations or non-technological innovations; 0 if not
Independent variables
Innovation sources
intRDDummy variable which takes the value 1 if the firm invests in internal R&D; 0 if not
extRDDummy variable which takes the value 1 if the firm invests in external R&D; 0 if not
MachineryDummy variable which takes the value 1 if the firm acquires machinery; 0 if not
Sources of information
Internal sourcesDummy variable which takes the value 1 if information from sources within the enterprise or group has high importance; 0 if not
Market sourcesDummy variable which takes the value 1 if information from suppliers, clients, competitors or private R&D institutions has high importance; 0 if not
Institutional sourcesDummy variable which takes the value 1 if information from universities, public research organizations or technology centres has high importance; 0 if not
Other sourcesDummy variable which takes the value 1 if information from conferences, scientific reviews or professional associations has high importance; 0 if not
Innovation output
TechInnovDummy variable which takes the value 1 if the firm has introduced product or process innovations; 0 if not
Non-TechInnovDummy variable which takes the value 1 if the firm has introduced marketing or organisational innovations t; 0 if not
APPENDIX
…/…

HIGH-GROWTH FIRMS AND INNOVATION IN EUROPEAN COUNTRIES
221
Ekonomiaz N.º 90, 2.º semestre, 2016
Individual characteristics
Size
Set of size dummy variables according to the firm’s number of employees. Categories are: <49 employees, 50–249 employees and 250 or more employees. Note: In CIS 2008 questionnaire Estonian and Latvian firms are only classified between two groups of size less than 50 employees and 50 or more employees.
GroupDummy variable that takes a value equal to 1 if the firm belongs to a group; 0 if not
CooperationDummy variable that takes a value equal to 1 if the firm cooperates with other agents; 0 if not
Regional public fundsDummy variable that takes a value equal to 1 if the firm receives public financial support for innovation activities from local or regional authorities; 0 if not
National public fundsDummy variable that takes a value equal to 1 if the firm receives public financial support for innovation activities from central government; 0 if not
EU public fundsDummy variable that takes a value equal to 1 if the firm receives public financial support for innovation activities from the EU; 0 if not
ExportDummy variable that takes a value equal to 1 if the firm sells goods or services in other European Countries or all other countries; 0 if not
Aggregate determinants
Birth rateNumber of firm births in the reference period (t) divided by the number of firms active in t (%)
Industry Set of industry dummies according to the firm’s main CIS business activities (NACE 2-digit level)
Country
Set of country dummies belonging to country group 1 (Czech Republic, Germany, Italy, Norway, Portugal, Spain and Slovenia) and country group 2 (Bulgaria, Cyprus, Estonia, Hungary, Latvia, Lithuania, Romania and Slovakia).
…/…
AGUSTÍ SEGARRA / MERCEDES TERUEL / ELISENDA JOVÉ
222
Ekonomiaz N.º 90, 2.º semestre, 2016
Tab
le A
.2.
CO
RR
EL
AT
ION
MA
TR
IX
(1)
(2)
(3)
(4)
(5)
(6)
(7)
(8)
(9)
(10)
(11)
(12)
(13)
(14)
(15)
(16)
(17)
(18)
1.H
GF
1.00
0
2.In
nova
tive
-0.0
041.
000
3.in
tRD
-0.0
21*
0.45
5*1.
000
4.ex
tRD
-0.0
000.
293*
0.48
5*1.
000
5.M
achi
nery
0.00
30.
517*
0.35
3*0.
284*
1.00
0
6.In
tern
also
urce
s-0
.001
0.45
1*0.
478*
0.30
5*0.
366*
1.00
0
7.M
arke
tso
urce
s0.
003
0.44
6*0.
390*
0.28
5*0.
414*
0.45
5*1.
000
8.In
stitu
tiona
lso
urce
s0.
006
0.16
0*0.
241*
0.25
2*0.
093*
0.20
2*0.
224*
1.00
0
9.O
ther
so
urce
s0.
014*
0.22
0*0.
251*
0.21
3*0.
177*
0.24
7*0.
302*
0.51
5*1.
000
10.T
echI
nno
v-0
.004
0.80
7*0.
538*
0.35
1*0.
619*
0.53
5*0.
528*
0.18
5*0.
258*
1.00
0
11.N
on-
Tech
Inno
v0.
011*
0.74
3*0.
381*
0.26
3*0.
360*
0.34
7*0.
343*
0.13
0*0.
187*
0.48
5*1.
000
…/…

HIGH-GROWTH FIRMS AND INNOVATION IN EUROPEAN COUNTRIES
223
Ekonomiaz N.º 90, 2.º semestre, 2016
12.S
ize
-0.0
22*
0.19
1*0.
231*
0.21
7*0.
199*
0.18
8*0.
157*
0.07
3*0.
072*
0.19
8*0.
187*
1.00
0
13.G
roup
-0.0
09*
0.18
0*0.
221*
0.21
6*0.
138*
0.18
9*0.
123*
0.05
5*0.
046*
0.18
0*0.
168*
0.42
3*1.
000
14.C
oo
per
atio
n0.
019*
0.36
3*0.
462*
0.43
4*0.
336*
0.35
7*0.
354*
0.29
4*0.
264*
0.43
0*0.
317*
0.21
1*0.
225*
1.00
0
15.R
egio
nal
fund
s-0
.013
*0.
201*
0.27
0*0.
226*
0.11
6*0.
210*
0.18
9*0.
216*
0.17
9*0.
233*
0.14
9*0.
023*
0.02
5*0.
219*
1.00
0
16.N
atio
nal
fund
s0.
002
0.23
2*0.
385*
0.31
1*0.
196*
0.27
9*0.
239*
0.26
7*0.
224*
0.27
8*0.
194*
0.15
2*0.
109*
0.34
0*0.
264*
1.00
0
17.E
U fu
nds
0.01
2*0.
152*
0.20
6*0.
174*
0.17
8*0.
148*
0.14
9*0.
180*
0.16
4*0.
177*
0.14
1*0.
107*
0.05
4*0.
248*
0.16
4*0.
286*
1.00
0
18.E
xpo
rts
-0.0
68*
0.22
5*0.
272*
0.19
0*0.
173*
0.18
6*0.
166*
0.07
7*0.
069*
0.23
7*0.
174*
0.29
3*0.
227*
0.18
7*0.
091*
0.14
1*0.
093*
1.00
0
19.B
irth
rate
0.13
2*-0
.008
*0.
014*
0.00
10.
037*
-0.0
02-0
.006
0.00
60.
030*
-0.0
01-0
.003
-0.0
24*
0.02
9*0.
054*
-0.0
70*
-0.0
050.
027*
-0.0
76*
* Si
gni
fican
ce a
t 5%
…/…