Complete PMP Course presentation
402
1 Project Management. Professional (PMP) Redf [email protected] What's Up: +966558411183 Linked In: ht tps://sa.linkedin.com/in/nasseribrahim
-
Upload
nasser-al-mohimeedpmp -
Category
Education
-
view
3.806 -
download
3
Transcript of Complete PMP Course presentation
1
Project Management.
Professional
(PMP)
What's Up: +966558411183
Linked In: https://sa.linkedin.com/in/nasseribrahim

2
Welcome
Introducing
Lecturer
Attendance

Project Management Institute (PMI)
• Not-for-profit professional association. primary goal is
to advance the practice, science and profession of
project management.
• Recognized since 1969 by working PMs – Nearly
550,000 members.
• Headquartered in Pennsylvania USA.
3
130 * 550,000 = 71,500,000$/Year
Not for Profit

4

PMI Certification Programs
• PMI® Certification Programs include PMP, PgMP, PMI-SP
(Scheduling Professional) PMI-RMP (Risk Mgmt Professional).
• Examination is offered via computer, worldwide.
• Individual Benefits:
Professional/ personal recognition.
Expedites professional advancement.
Create job growth/ opportunities within organizations.
Provides framework for standardized project management
requirements.
5

66
PMI Certification Materials
• To assist PMI candidates for
completing the PMI certification
exam administered by the
Project Management Institute.
• Content is based on “A Guide To
The Project Management Body
Of Knowledge” Fifth Edition
(PMBOK), and others sources.
7
The Exam
• Exam Does test of:
• Your knowledge of PMI’s processes.
• Your understanding of the terms that are used.
• Your ability to apply the processes in a variety of situations.
• Your ability to apply key formulas to scheduling, costing, estimating, and other problems.
• Your understanding of professional responsibility as it applies to project management.
8
Continue The Exam
• It is 200 pass/fail questions.
• To pass, you have to answer 106 graded questions
correctly out off 175. That translates to 61% *.
• The other 25 questions are considered experimental
questions that PMI is evaluating for use on future
exams. However, they do not count toward your grade
and you will not know which questions count and
which don’t.
9
Requirements to Apply
• To be eligible for PMP Certification, you will need to demonstrate
that you meet certain minimum criteria as below:
With a College Diploma
A university Degree,
4,500 hours of project management experience,
35 hours of project management education.
Without a College Diploma
A high school diploma or equivalent,
7,500 hours of project management experience,
35 hours of project management education.

10
Validity
• The credential is valid for 3 Years.‘
• Candidates must recertify every 3 years by earning
60 Professional Development Units (PDUs).

PMP Pay Scale
11
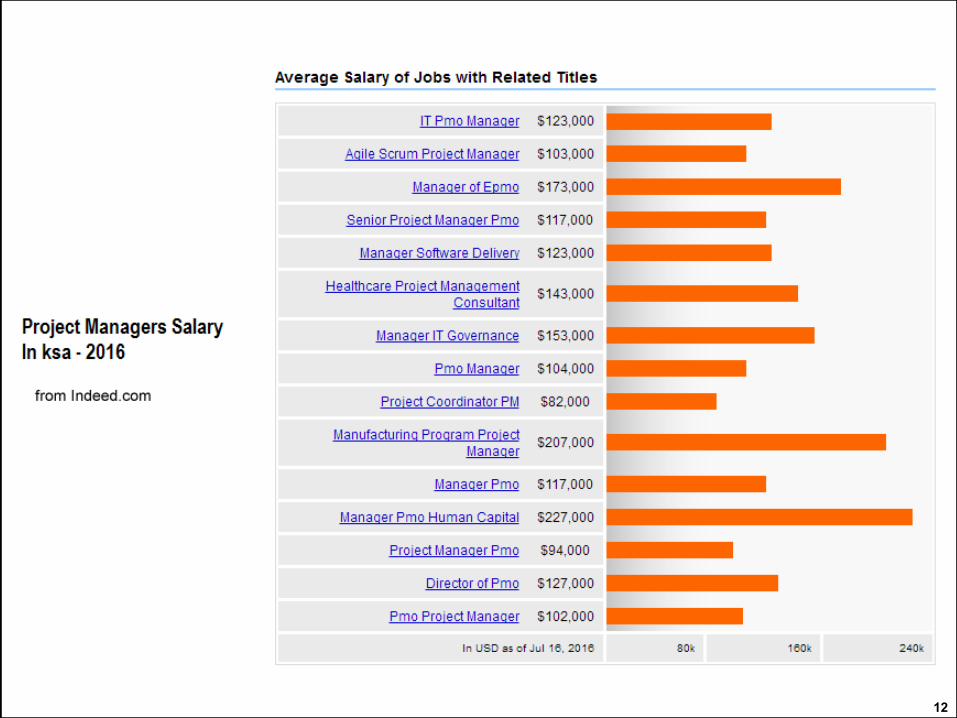
12
13
Ethics in Project Management
• For this reason, PMI offers guides for practitioners like
the PMI Code of Ethics and Professional Conduct, and
an avenue to report and resolve matters involving
unethical behavior through the PMI Ethics Review
Committee.
• In-order to earn the PMP certification, applicants must
agree to the PMP code of professional conduct.

14

15
End

16
Project Management Framework

17
What Is A Project?
• Project
A Project is a temporary endeavour undertaken to
create a unique product, service or result.
End is reached when the objectives have been
achieved, or when the project is terminated
because it’s objectives will not or cannot be met,
or when the need for the project no longer exists.
Projects require project management.

18
Project Management
• What is a Project Management?
Project management is the application of
knowledge, skills, tools, and techniques to project
activities to meet the project requirements.
47 project management processes which logically
categorized into five Process Groups.
It is both a science and an art.

Portfolio, Program, and Projects
• Portfolio refers to a collection of projects, programs,
sub portfolios, and operations managed as a group to
achieve strategic objectives.
• program is a group of related subprogram, projects,
and operations where doing them together to provides
benefit or efficiency.
19
Again
What is Project, Project Management?
20
Project Management Office
A project management office (PMO) is a management
structure that standardizes the project-related
governance processes and facilitates the sharing of
resources, methodologies, tools, and techniques.
A PMO may be delegated the authority to act as an
integral stakeholder and a key decision maker.

Supportive. Supportive PMOs provide a consultative role to projects
by supplying templates, best practices, training, access to
information and lessons learned from other projects.
controlling. Controlling PMOs provide support and require compliance
through various means. Compliance may involve adopting project
management frameworks or methodologies, using specific templates,
forms and tools, or conformance to governance.
Directive. Directive PMOs take control of the projects by directly
managing the projects. The degree of control provided by the PMO is
high.
21
Types of PMO:
Operations
Are organizational function performing the ongoing
execution of activities that produce the same product or
provide a repetitive service.
Are permanent endeavors to produce repetitive outputs,
with resources assigned to do basically the same set of
tasks according to the standards institutionalized in a
product life cycle.
Operations require business process management or
operations management.
22

Projects Vs. Operational Work
• Operations differ of:
Are ongoing.
Produce repetitive products, services, or
results.
Operations work sustain the organization
overtime.
23
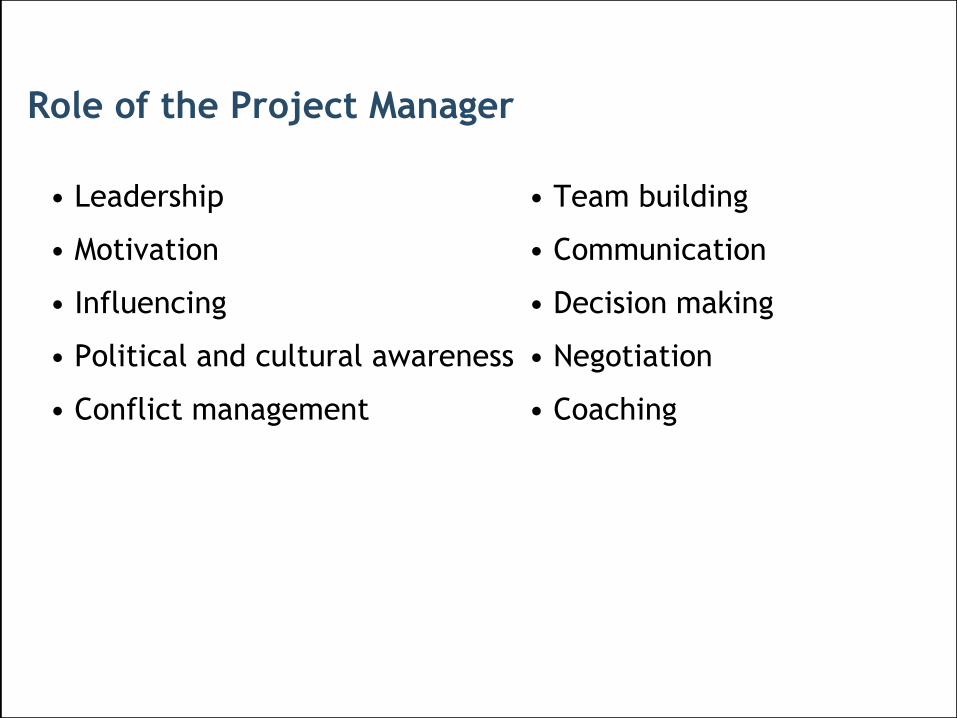
• Leadership • Team building
• Motivation • Communication
• Influencing • Decision making
• Political and cultural awareness • Negotiation
• Conflict management • Coaching
Role of the Project Manager

25
End
26
Foundational Terms & Concepts

Organizational influences on a Project
Organizational cultures and Styles
An organization’s culture and style affect how it conducts
projects. Cultures and styles are known as cultural norms,
which develop over time. Example: Shared visions, mission,
beliefs, and Regulations, Policies, and reward systems;
Organizational communications
Organizational communications capabilities have great
influence on how projects are conducted.
27

Organizational Process Assets
Organizational process assets are the plans,
processes, policies, procedures.
It include the organization’s knowledge bases
such as lessons learned & historical info.
28

Enterprise Environmental Factors
It may have a positive or negative influence on the outcome.
They are considered as inputs to most planning processes.
• Enterprise Environmental Factors include:
Organizational culture, structure, and processes.
Government regulations or industry standards.
29

Organizational Structure
• Organizational structure is EEF which affect
the availability of resources and Influence how
projects are conducted .
• Organizational structures range from
functional to projectized, with a variety of
matrix structures in between.
30
31
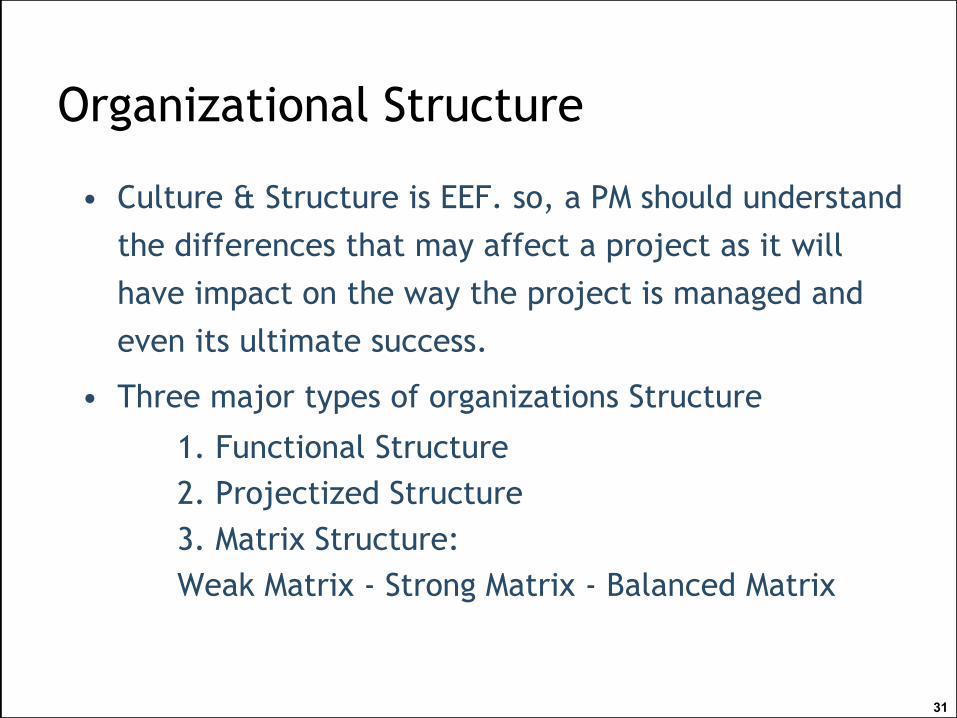
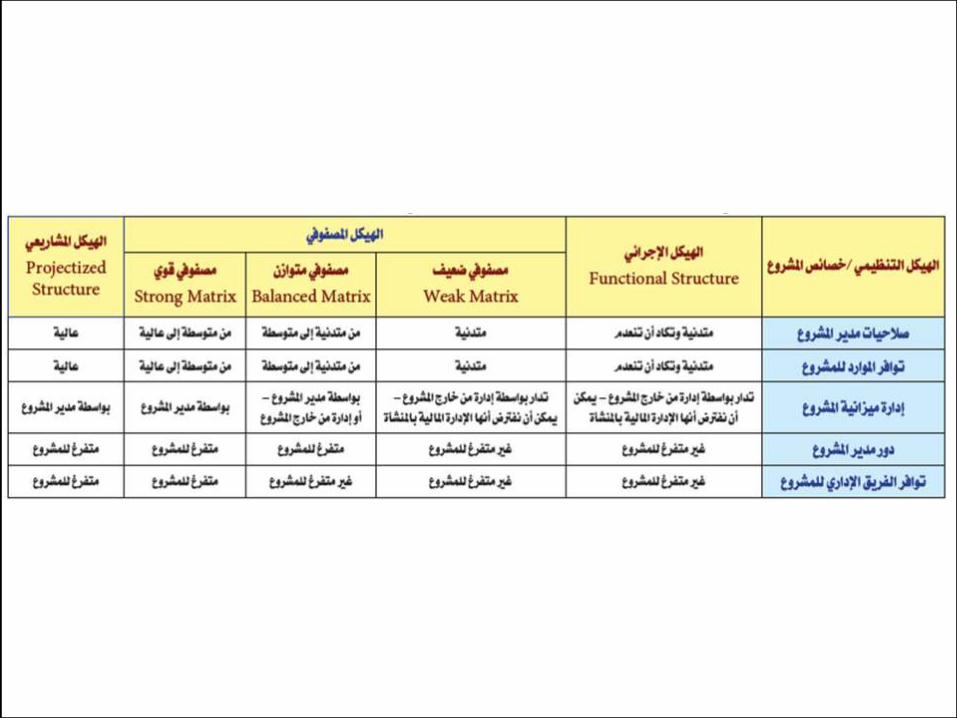
Organizational Structure
• Culture & Structure is EEF. so, a PM should understand
the differences that may affect a project as it will
have impact on the way the project is managed and
even its ultimate success.
• Three major types of organizations Structure
1. Functional Structure
2. Projectized Structure
3. Matrix Structure:
Weak Matrix - Strong Matrix - Balanced Matrix

Functional Organization
32

Projectized Organization
33

Weak Matrix Organization
34

Balanced Matrix Organization
35

Strong Matrix
36

38
Organizational Structure
• Project Manager’s Power

Project Life Cycle
a collection of generally sequential or overlapping project phases.
39

Project Life Cycle
40
Planning
Executing
Monitoring &
Controlling
Closing
Initiating

Continue Project Life Cycle
41

42
What is A Project Management
Process?
A package of inputs, tools and techniques, and outputs used together to do something on the project.
There are 47 unique processes.
The output from process are often used as inputs into other processes.
43
Essential Terms
• Progressive Elaboration
You don’t know all of the characteristics about a product or project when you begin. Instead, they may be revisited often and refined,
The characteristics of the product emerge over time, or “progressively”.
44
Essential Terms
• Baseline
Baseline refers to the accepted and
approved plans & their related documents.
Baselines are prepared on triple constraints:Scope (Quality), Time, Cost.

45
Essential Terms
• Regulation
Official document that provides guidelines that must be followed.
Issued by government or another official organization.
• Standard
A document approved by a recognised body that provide a guidelines. It is not mandatory.

46
Essential Terms
• Policy
Organization policy is an asset.
Gives guidance to your action as per local organization rule.
Save time later in the future by preventing you from doing something your company would frown upon.
PMs should follow company policy.

Essential Terms
Sellers.
Sellers, also called vendors, suppliers, or
contractors, are external companies that
inter into a contractual agreement to
provide components or services necessary
for the project.
Business partners.
Also external companies, but they have a
special relationship with the organization.
47

48
Essential Terms
• Project Coordinator.
Weaker than a PM.
Can't make overall project decisions.
have some authority to reassign assign resources.
Found in weak matrix or functional organization.
• Project Expeditor .
The weakest among all.
Staff assistant with little or no formal authority.
Do not have any authority of resources.
Found in a functional organization.

49
Essential Terms
• The Triple Constraint
Concept that scope, time, &
cost are closely interrelated,
Expanded view of “triple”
constrained could be
represented as a hexagon.
Quality
Scope

Stakeholders
Are persons or organizations who are actively
involved in the project or whose interests may be
positively or negatively affected by the performance
or completion of the project.
The project management team must:
- Identify both internal and external stakeholders.
- Determine stakeholders requirements and
expectations.
50

Continue Stakeholders
51

52
So, we have
5 process groups,
10 knowledge areas,
47 project management processes,

53
End

رالدكتو«نزاهة»الفسادلمكافحةالوطنيةالهيئةلرئيستصريحاهـ4/7/1436الخميسبعدد«عكاظ»نشرت•
من(%44)بنسبةومتأخرامتعثراحكوميامشروعا672رصدعنخاللهمنكشفالمحيسنعبدالمحسنخالد
بهةشوجودإلىالفتا»:يقولبنصخطيرأمرعنمعاليهيكشفكما.الهيئةعليهاوقفتمشروعا1526أصل
عددهاوالتيالمشاريعتعثرأسباببينمناألخطرهماوالمحسوبيةالفسادأنوبالتأكيد.«ومحسوبيةفساد
االعتناءعدموالتصميم،الدراساتمرحلةأثناءالرؤيةوضوحعدم،التخطيطغياب»:وهيالدكتورمعالي
لباتومتطالموقعحيثمنالمشروعطبيعةدراسةفيالقصور،للمنافسةطرحهاقبلالمشروعوثائقإعدادب
لمنلالزمةاالمتطلباتوضوحعدم،للمشروعالالزمةالتربةوتقاريرالتراخيصباستخراجاالهتمامعدم،التنفيذ
التحليلعلىالتركيزالمتنافسين،قبلمنالمشروعقيمةوتسعيرلتقديرالزمنيةالمدةقصر،للمنافسةيتقدم
مراعاةدوناألقلالعطاءصاحبعلىالترسيةذلكعنوينتجالفنيللتحليلالنظردونللعطاءاتالمالي
استخدامة،والفنيالماليةإمكاناتهموتفوقمتعثرةأخرىمشاريعلديهممقاولينعلىالترسيةالفنية،اإلمكانات
اإلشرافجهازكفاءة)ضعف،بينهااالختالفاترغممشروعمنألكثروالمواصفاتالشروطكراسةنفس
اءةكفضعف،واإلشرافالمتابعةفيالحكوميةالجهاتفروعمشاركةعدمالحكومية،للجهةالتابع(الفني
.PMOالمشروعإلدارةمكتبوجودعدمللمشاريع،والنهائياالبتدائياالستالملجانأعضاء
54

55
Project Management Processes

56
PMI Framework
• Framework Organized into:
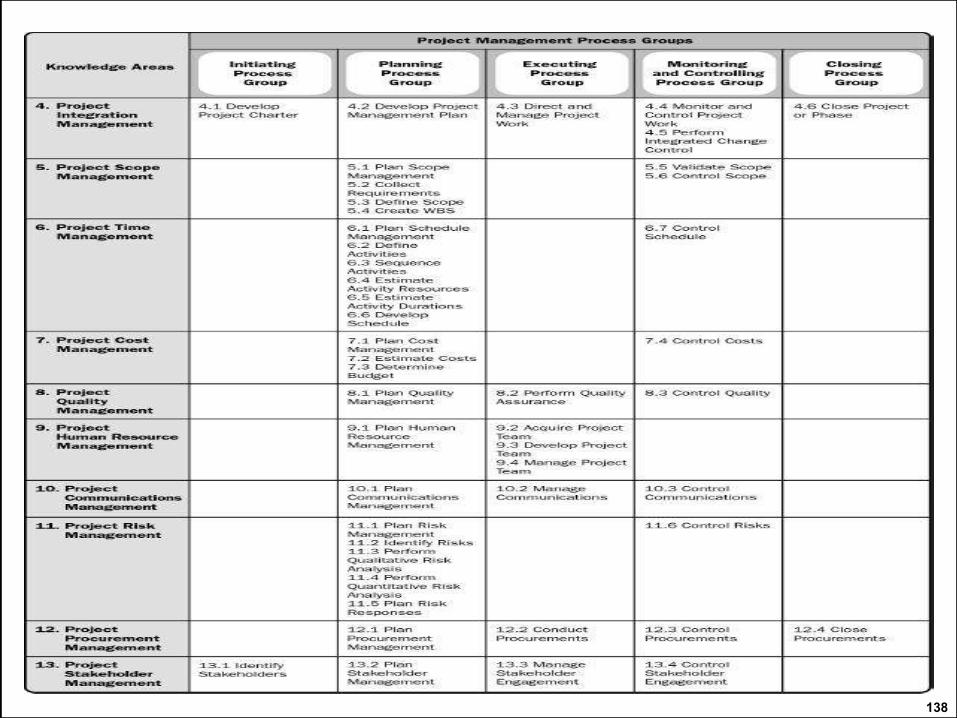
10 knowledge areas: Integration, Scope, Time, Cost,
Quality, HR, Communication, Risk, Procurement and
Stakeholder Management.
5 process groups: Initiating, Planning, Executing ,
Monitoring and Controlling, and Closing. And
47 Project Management Processes

57
Process
A process is a set of interrelated actions and activities performed to achieve a pre-specified product, result, or service.
47 unique processes composed of three elements:
1.Inputs
2.Tools and Techniques
3.Outputs

To Project Success
Select appropriate processes required to meet the
project objectives.
Use a defined approach that can be adopted to meet
requirements.
Comply with requirements to meet stakeholder
needs and expectations.
Balance the competing demands.
58

59
Organization
Process groups are not completely linear.
The scope is “progressively elaborated,” which means that some processes are performed iteratively.
Important Issues:

60

61
End

62
Integration Management

63

64
Integration Management
• Integration process cover all project Phases.
• Takes a high-level view of the project from start to finish.
• Why using the word “Integration”? Changes made in any
one area of the project must be integrated into the rest
of the project.
• The PM must prioritize different objectives that are
competing for time & resources & also keep the team
focused on completing the work.

65
Integration Management
66
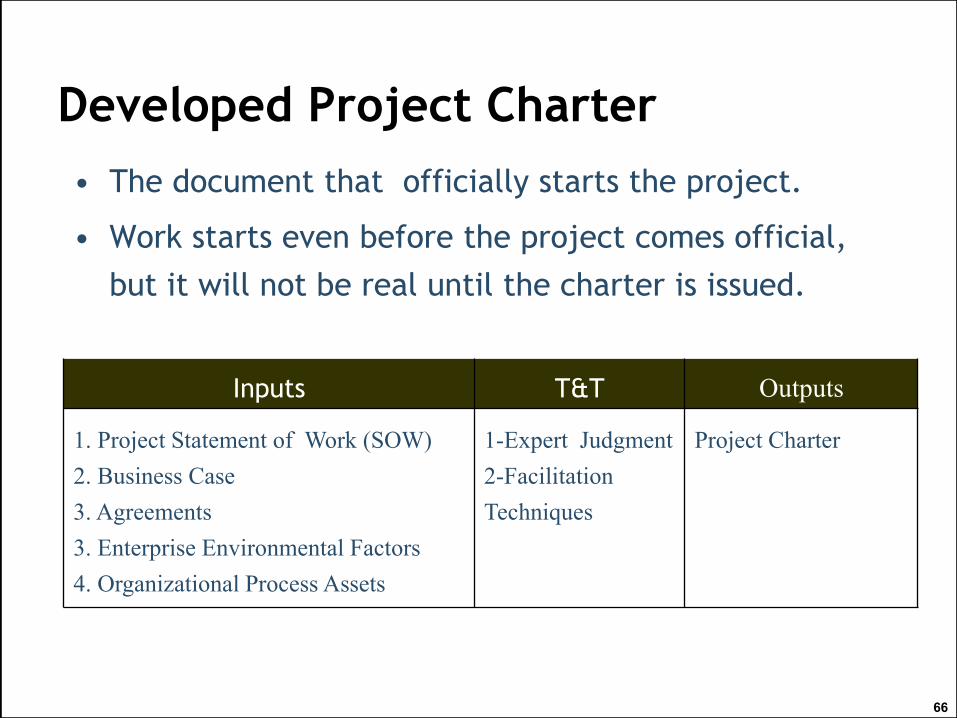
Developed Project Charter
Inputs T&T Outputs
1. Project Statement of Work (SOW)
2. Business Case
3. Agreements
3. Enterprise Environmental Factors
4. Organizational Process Assets
1-Expert Judgment
2-Facilitation
Techniques
Project Charter
• The document that officially starts the project.
• Work starts even before the project comes official,
but it will not be real until the charter is issued.
67
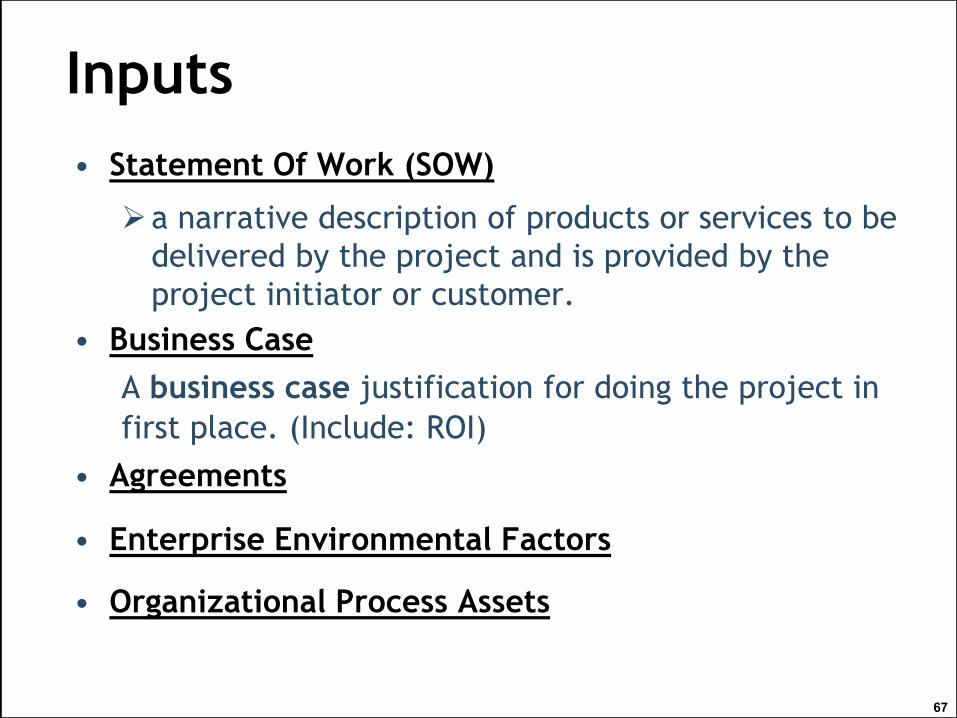
Inputs
• Statement Of Work (SOW)
a narrative description of products or services to be
delivered by the project and is provided by the
project initiator or customer.
• Business Case
A business case justification for doing the project in
first place. (Include: ROI)
• Agreements
• Enterprise Environmental Factors
• Organizational Process Assets

68
Tools and Techniques
• Expert Judgement
Used to assess the inputs to develop a project charter. Such judgement and expertise is applied to any technical and management details during this process.
Ex: Other units within the organization, Consultant, subject matter experts, and
• Facilitation techniques
Facilitation techniques have broad application within
project management processes and guide the
development of the project charter.
Ex: Agenda, Ground Rule, Brainstorming, Nominal Group

69
Outputs
Project Charter
Documents the business needs, current
understanding of the customer's needs, and the
new product, service, or result that it is intended
to satisfy, such as:
Product purpose or justification.
Measurable project objectives and related
success criteria.
High-level requirements.
High-level risks.

Project Charter
Summery milestone schedule.
Summery budget.
Assigned PM, responsibility, and authority level,
and Name and authority of the sponsor or other
person(s) authorizing the project charter.
Project Goal & Scope Statement.
Deliverables & Key Stakeholders.
Assumptions & Constraints.
Initial Risks & Schedule Estimates.
Cost Estimates & Success Criteria
“Signatures”
70

71
Develop Project Mgmt Plan
• The process of documenting the actions necessary to
define, prepare, integrate, and coordinate all subsidiary
plans.
• Specifies the who, what, when, where and how.
• Progressively elaborated, meaning that it is developed,
refined, revisited, and updated.
Inputs T&T Outputs
1. Project Charter
2. Outputs from other Processes
3. Enterprise Environmental Factors
4. Organizational Process Assets
1-Expert Judgment
2-Facilitation
Techniques
Project Mgmt Plan

Inputs
Project Charter.
Outputs from other Planning Processes.
(from other knowledge area)
Enterprise Environmental Factors.
Organizational Process Assets.
72

73
T&T• Expert Judgement.
• Facilitation Techniques.
74
Outputs
• Project Management Plan
It is “A formal, approved document that defines how the project is managed, executed, and controlled”.
It may be Summary or detailed.
It composed of one or more subsidiary management plans and other planning documents.

Project Management Plan and Project
documents
75
Differentiation Between the Project Management Plan and Project documents

76
Direct & Manage Project Execution
Inputs T&T Outputs
1. Project Management Plan
2. Approved Change Requests
3. Enterprise Environmental Factors
4. Organizational Process Assets
1. Expert Judgment
2. Meetings
3. PMIS
1. Deliverables
2. Work Performance data
3. Change Requests
4. Project Mgmt Plan Updates
5. Project Document Updates
• This is where things get done!,
• Most of the project’s time, cost, and resources are
consumed her.

77
Inputs
• Approved Change Requests
It can modify policies, the project management
plan, procedures, costs, or budgets, or revise
schedules.
It may require implementation of preventive or
corrective actions.
• Enterprise Environmental Factors
• Organizational Process Assets

T&T
• Project Management Information System (PMIS)
Provides access to an automated tool, such as
scheduling SW tool, a configuration management
system, and information collection system.
• Meetings
Meetings tend to be one of three types:
Information exchange; option evaluation or Decision
making.
78

79
Outputs
• Deliverables
Any product, service, or result.
• Work Performance data
Information from project activates collected as the project progresses.
• Change Requests (not approved)
When issues are found, it may modify project policies, or procedures, project scope, project cost or budget,
It could be: Corrective Actions, Preventive Actions, Defect Repairs.
Continue Outputs
• Project management plan updates
Elements of project management plan.
• Project Documents updates
Requirements documents.
project logs (issues, assumptions, etc.).
Risk register, and stakeholder register.
80

81
Monitor & Control Project Work
• Looks at all of the work that is being performed &
makes sure that the deliverables themselves & the
way in which they are being produced are inline with
the plan.
• All M&C processes compare the work results to the
plan & make whatever adjustments are necessary to
ensure that they match and that any necessary
changes in the work or the plan are identified and
made.

82
Monitor & Control Project Work
Inputs T&T Outputs
1. Project Management Plan
2. Schedule forecasts
3. Cost forecasts
4. Validated changes
5. Work performance Info
6. Enterprise Environmental Factors
7. Organizational Process Assets
1. Expert Judgment
2. Analytical
Techniques
3. PMIS
4. Meetings
1. Change Requests
2. Work performance reports
3. Project Management plan
updates
4. Project Documents updates

83
Inputs
• Project Management Plan.
• Schedule Forecasts
This is expressed in a form of SV and SPI, variance
between planned date and forecasted finish date.
• Cost Forecasts
Expressed in a form of CV, CPI, BAC and variance against
planned and actual expenditure .
• Validated changes
Approved changes that result from the Perform Integrated
Change Control process require validation to ensure that
the change was appropriately implemented.
• Work Performance Information
Work performance information is circulated through
communication processes.
• Enterprise Environmental Factors
• Organizational Process Assets
84
Continue Inputs

85

86
Tools and Techniques
• Expert Judgment
• Analytical techniques
Analytical techniques are applied in project
management to forecast potential outcomes based on
possible variations of project or environmental
variables and their relationships with other variables.
• Project Management Information System
• Meetings

87
Outputs• Change Requests (not approved)
• Work performance reports
Should be prepared by the project team detailing
activates, accomplishments, milestones, identified issues,
and problems,
It can be used to report the key information including:
Current status,
Forecasts, and
Issues.
• Project Management Plan Update
• Project Document Updates
Forecasts, Performance reports, Issue log.

Perform Integrated Change Control
• When change occurs in one area, it is SHOULD
evaluated for its impact across the entire
project.
88
Inputs T&T Outputs
1. Project Management Plan
2. Work Performance Reports
3. Change Requests
4. EEF
5. OPA
1.Expert Judgment
2.Meetings
3.Change Control
Tools
1. Approved Change requests
2. Change log
3. Project Mgmt Plan Updates
4. Project Document Updates

Inputs
• Project Management Plan.
• Work Performance Reports.
• Change Requests.
• Enterprise Environmental Factors
• Organizational Process Assets
89
T&T
• Expert Judgment.
• Meetings.
• Change Control Tools
Manual or automated tools may be used.
Tools are used to manage the change requests and the
resulting decisions.
90

91
Outputs
• Approved Change Requests
Approved change requests will be implemented through the
Direct and Manage Project Work process.
• Change Log
• Project management Plan Updates
Any subsidiary management plans.
• Project Document Updates

92
Close Project or Phase
• Is the process of finalizing all activates across all of
the project management process group to formally
complete the project or phase.
• Creating the necessary documentation and archives,
capturing the lessons learned, ensuring that the
contract is properly closed, and updating all org
process assets,
• It can’t be completed until the project is finished.

93
Close Project or Phase
Inputs T&T Outputs
1. Project Management Plan
2. Accepted Deliverables
3. OPA
1.Expert Judgment
2.Analytical techniques
3.Meetings
1. Final Product, Service,
or Result Transition
2. Organizational Process
Assets Update

94
Inputs
• Project Management Plan.
• Accepted Deliverables
Those deliverables that have been accepted
through the (Verify Scope process).
• Organizational Process Assets
Project/phase closure guidelines or requirements
(project audits, project evaluations, and transition
criteria), and

T&T
• Expert Judgment
Expert judgment is applied when performing administrative
closure activities. These experts ensure the project or
phase closure is performed to the appropriate standards.
• Analytical Techniques
• Meetings
95
96
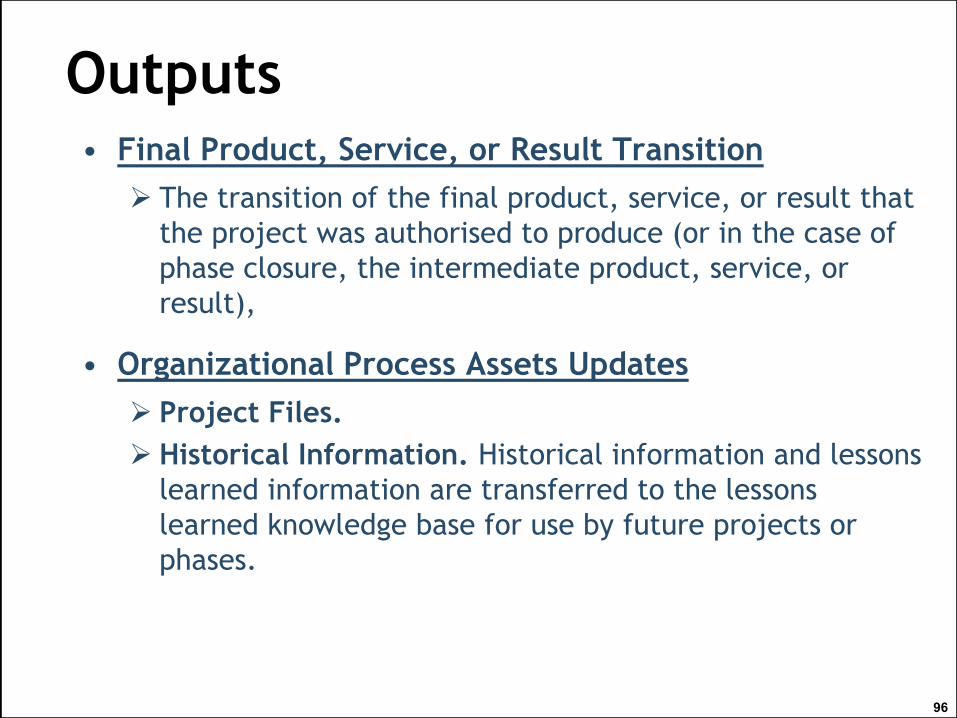
Outputs• Final Product, Service, or Result Transition
The transition of the final product, service, or result that
the project was authorised to produce (or in the case of
phase closure, the intermediate product, service, or
result),
• Organizational Process Assets Updates
Project Files.
Historical Information. Historical information and lessons
learned information are transferred to the lessons
learned knowledge base for use by future projects or
phases.

97
END

98
Scope Management

99

100
Scope Management
• The overall goals of scope mgmt are to:
Define the need, expectations, Manage changes,
and Gain acceptance.
• Include the processes required to insure that the
project includes all the work required to complete
the project successfully.
• Scope changes should be handled in a structured,
procedural, and controlled manner.
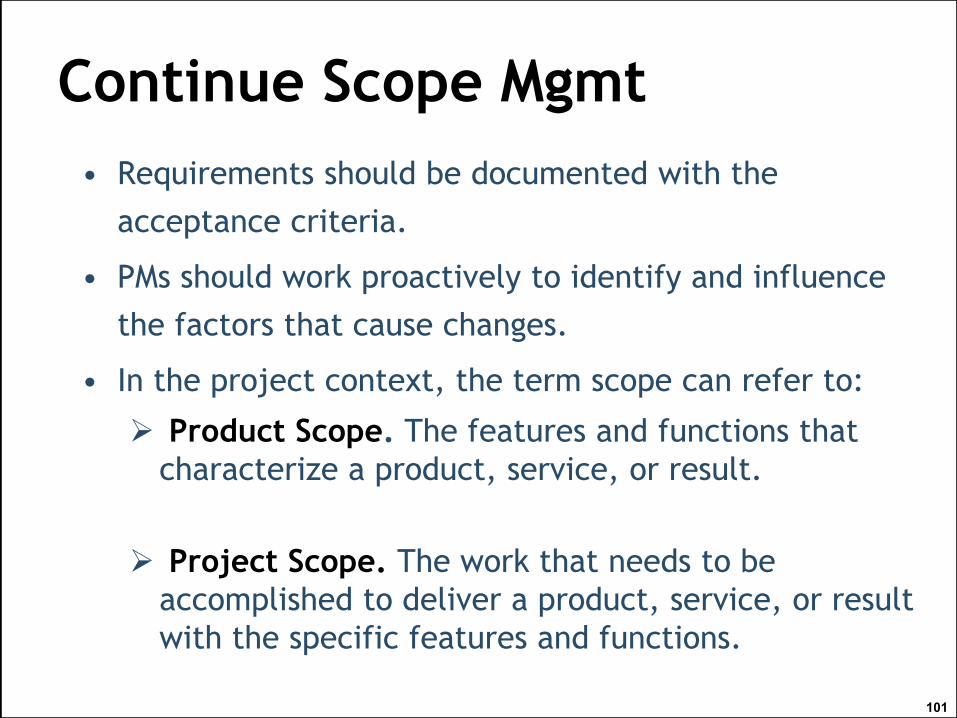
Continue Scope Mgmt
• Requirements should be documented with the
acceptance criteria.
• PMs should work proactively to identify and influence
the factors that cause changes.
• In the project context, the term scope can refer to:
Product Scope. The features and functions that
characterize a product, service, or result.
Project Scope. The work that needs to be
accomplished to deliver a product, service, or result
with the specific features and functions.
101
102
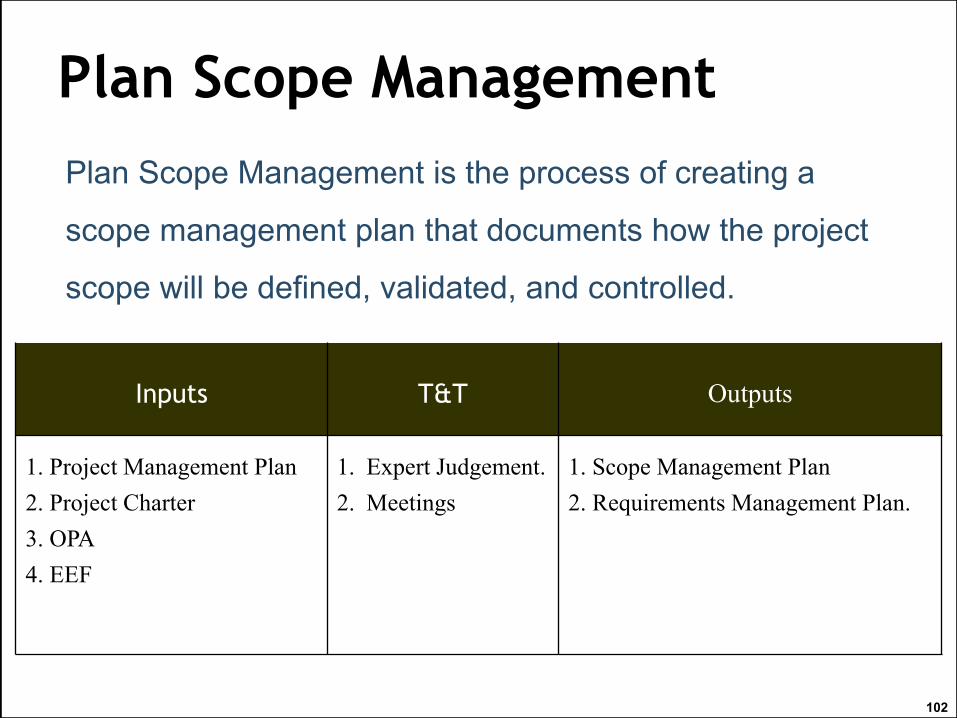
Plan Scope Management
Inputs T&T Outputs
1. Project Management Plan
2. Project Charter
3. OPA
4. EEF
1. Expert Judgement.
2. Meetings
1. Scope Management Plan
2. Requirements Management Plan.
Plan Scope Management is the process of creating a
scope management plan that documents how the project
scope will be defined, validated, and controlled.

OutputsScope Management Plan
The components of a scope management plan include:
Process for preparing a detailed project scope statement;
Process that enables the creation of the WBS from the
detailed project scope statement;
Process that establishes how the WBS will be maintained
and approved;
103

Continue Outputs
Requirements Management Plan
• The requirements management plan is a component of the
project management plan that describes how requirements
will be analyzed, documented, and managed. It include, but
are not limited to:
How requirements activities will be planned, tracked, and
reported.
Requirements prioritization process;
Product metrics that will be used and the rationale for
using them.
104

105
Collect Requirements
• Defining and documenting stakeholder’s needs,
• The project success is directly influenced by the care
taken in capturing and managing project and product
requirements,
• It could categorize into:
Project requirements.
Product requirements.

106
Collect Requirements
Inputs T&T Outputs
1. Scope Management
Plan
2. Requirement
Management Plan
3. Stakeholder
management plan
4. Project Charter
5. Stakeholder
Register
1. Interviews
2. Focus group
3. Facilitated workshops
4. Group creativity techniques
5. Group decision making techniques
6. Questionnaires and surveys
7. Observations
8. Prototypes
9. Benchmarking
10. Context diagrams
11. Document analysis
1. Requirements
documentation
2. Requirements traceability
Matrix

107
Inputs
• Stakeholders Management Plan
• The stakeholder management plan is used to understand
stakeholder communication requirements and the level of
stakeholder engagement.
• Project Charter
• Stakeholder Register
Used to identify stakeholders that can provide
information on detailed project and product
requirements.

T&T• Interviews
Formal or informal approach to discover info from
stakeholders by talking to them directly.
• Focus Groups
Bring together prequalified stakeholders and subject matter experts to learn about their expectations about a proposed project.
• Facilitated Workshop
Primary technique for defining cross-functional requirements and reconciling stakeholder differences, focused sessions that bring key cross-functional stakeholders together to define product requirements.
108

Continue T&T
• Group Creativity Techniques
Brainstorming
Nominal Group Technique
Idea/Mind Mapping
Affinity Diagram
Multi criteria decision analysis
109
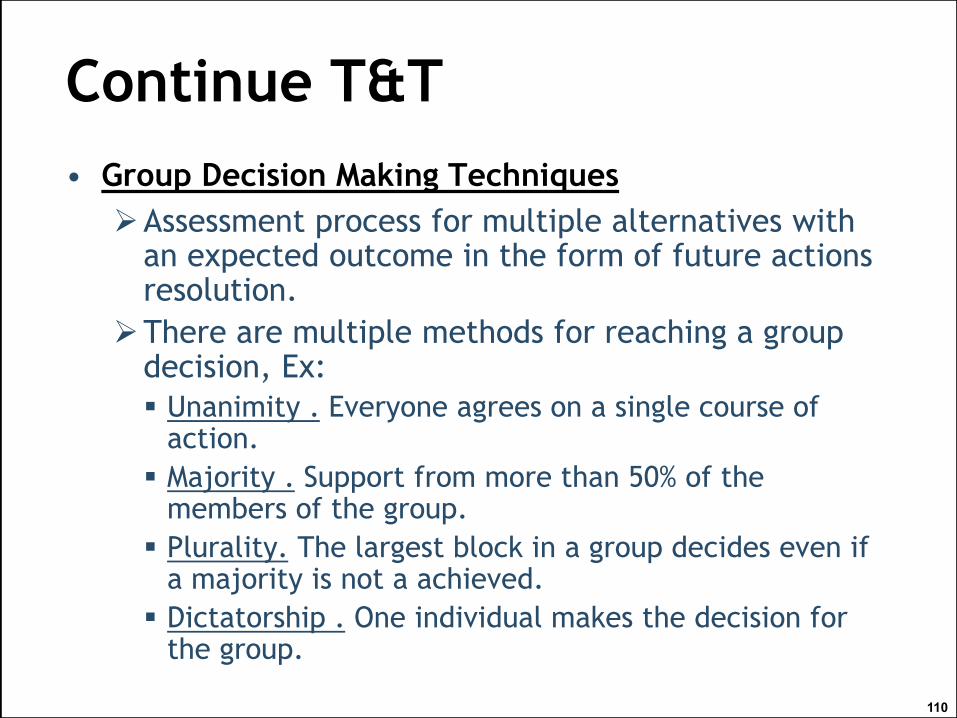
Continue T&T
• Group Decision Making Techniques
Assessment process for multiple alternatives with an expected outcome in the form of future actions resolution.
There are multiple methods for reaching a group decision, Ex:
Unanimity . Everyone agrees on a single course of action.
Majority . Support from more than 50% of the members of the group.
Plurality. The largest block in a group decides even if a majority is not a achieved.
Dictatorship . One individual makes the decision for the group.
110
Continue T&T
• Questioners and Surveys
• Observations
• Prototypes
Obtaining early feedback on requirements by
providing a working model of the expected product
before actually building it.
It supports the concept of progressive elaboration.
111

Benchmarking
Benchmarking involves comparing planned practices to those
of comparable organizations to identify best practices.
Context diagrams
Context diagrams show inputs to the business system, the
actor(s) providing the input, the outputs from the business
system, and the actor(s) receiving the output.
Document Analysis
Document analysis is used to elicit requirements by analyzing
existing documentation and identifying information relevant to
the requirements.112
Continue T&T

113
Outputs
• Requirements Documentation
Requirements may start out at a high level and become
progressively more detailed as more is known.
Acceptance criteria.
Impact to other entities inside & outside the org.
Support & training requirements.
Requirements assumptions & constraints.
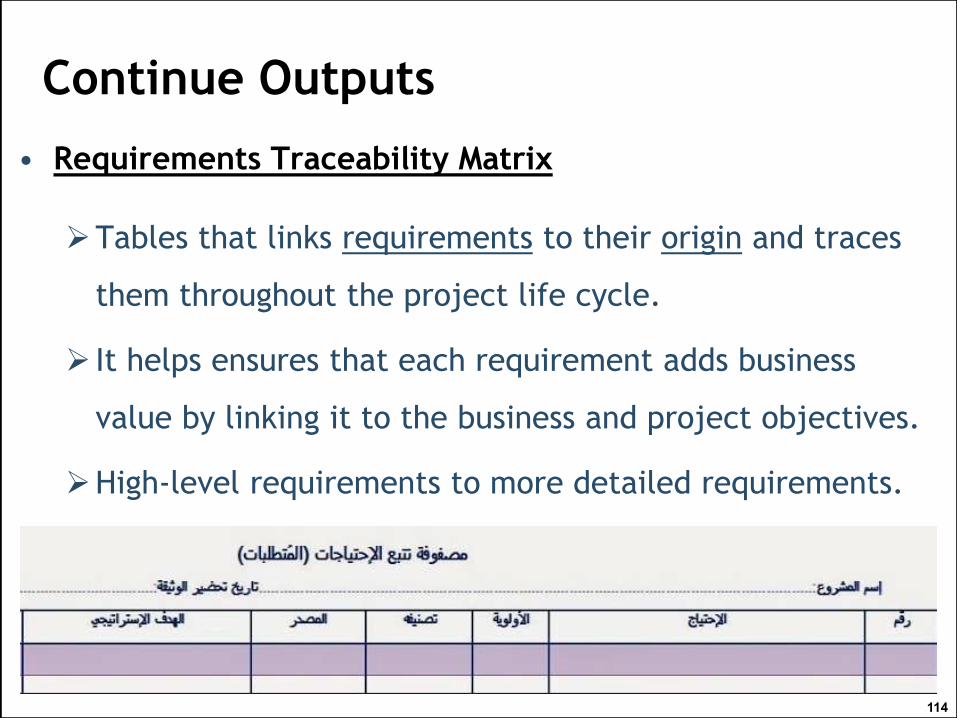
Continue Outputs
• Requirements Traceability Matrix
Tables that links requirements to their origin and traces
them throughout the project life cycle.
It helps ensures that each requirement adds business
value by linking it to the business and project objectives.
High-level requirements to more detailed requirements.
It helps identifying key info about the requirements.
114
115
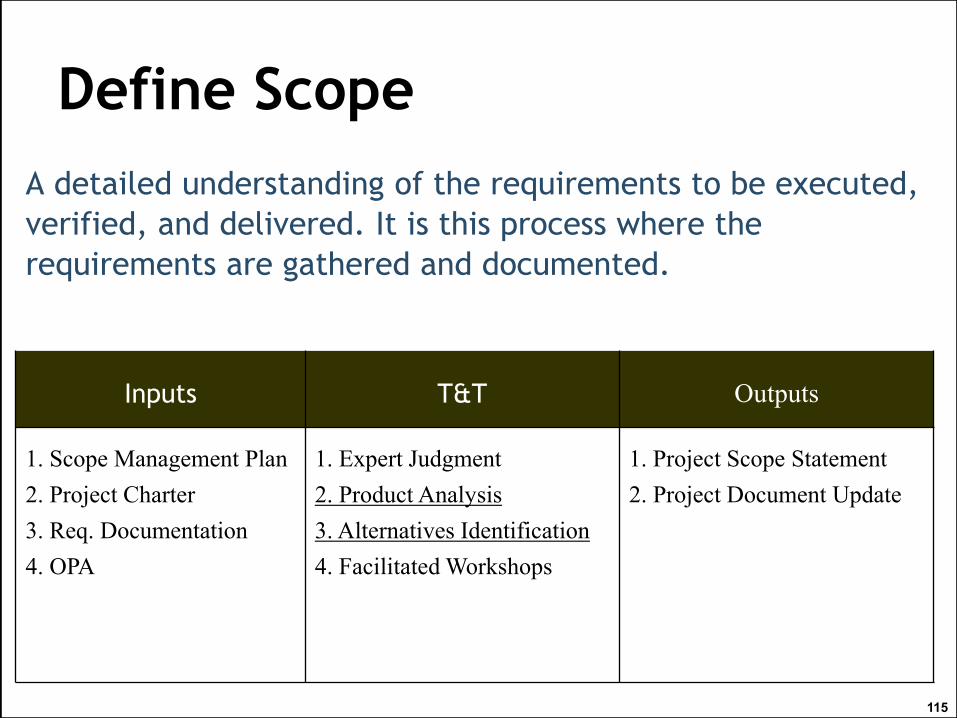
Define Scope
A detailed understanding of the requirements to be executed,
verified, and delivered. It is this process where the
requirements are gathered and documented.
Inputs T&T Outputs
1. Scope Management Plan
2. Project Charter
3. Req. Documentation
4. OPA
1. Expert Judgment
2. Product Analysis
3. Alternatives Identification
4. Facilitated Workshops
1. Project Scope Statement
2. Project Document Update
116
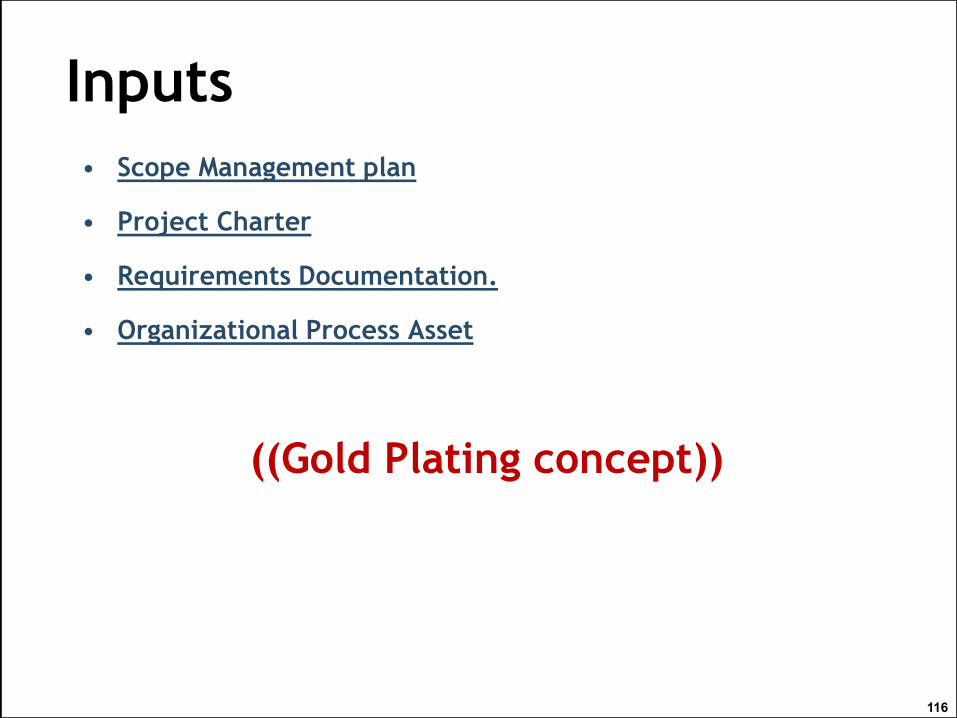
Inputs
• Scope Management plan
• Project Charter
• Requirements Documentation.
• Organizational Process Asset
((Gold Plating concept))
117
Tools and Techniques
• Expert Judgment
• Product Analysis
Detailed Analysis of the project’s product, service, or result, with the intent of improving the project team’s understanding of the product and the requirements.
• Alternatives Identification
To make sure that the team is properly considering all options as they relate to the project’s scope.
Techniques to generate creative thought are used.
• Facilitated Workshops

118
Outputs
• Project Document Updates
• Project Scope Statement
More detailed than the SOW.
It includes:
Goal of the project.
Product descriptions.
Identified risk up to now.
Acceptance criteria.
Cost estimate.
Project exclusions, assumptions, constraints.

119
Create WBS ((Team Work))
The process of sub dividing project deliverables and
project work into smaller more manageable components.
Inputs T&T Outputs
1. Scope Management Plan
2. Project Scope Statement
3. Requirements Documentation
4. Org Process Assets
5.Enterprise Env Factors
1. Decomposition
2. Expert Judgment
1. Scope Baseline
2. Project doc updates

120
T&T
• Decomposition
Breaking down the project deliverables into components (the work package level).
In the WBS, top layer is very general (just name), and each subsequent layer is more and more specific. Every level is the detailed explanation of the level above it.
To what level we decompose?
Are tour work packages small enough to be manage and estimated for time and cost.
• Expert Judgment

121
Outputs
• Scope Baseline
Which include :
Project Scope Statement.
Work Breakdown Structure. (WBS)
WBS Dictionary .
122
Continue WBS
Elements of a Good WBS
It must be detailed down to a low level. The
lowest level called work packages.
Graphically, arranged, where each sub-level rills
up to the level above it.
The project team with the PM creates it. It can
be means of team building.
It helps define responsibilities for the team.
It is a communicational tool.

Continue WBS
123

124
Continue Outputs• WBS Dictionary
A document that detail information to the contents (nodes) of the WBS.
WBS dictionary may include, but is not limited to:
○ Code of account identifier. ○ Description of work.
○ Assumptions and constraints. ○ Responsible organization.
○ Schedule milestones. ○ Associated schedule activities.○
Resources required.
○ Cost estimates.○ Quality requirements. ○ Acceptance
criteria,○ Technical references. and ○ Agreement
information.
• Project Document Updates

Example
• SAAD want to re-qualify his bed room; he
decide to change his bed, paint walls, buy
new sofa and Get rid of old furniture's.
• Since he do not have enough budget; he
also decide to keep some money from his
monthly salary for three months.
125

Example
“SAAD Room Re-qualify Project”
Could you create WBS for this project?
126

127
Validate Scope
Validate Scope is the process of formalizing acceptance of
the completed project deliverables.
• Scope Validation & Quality Control
Both inspect the product against the scope.
SV performed after QC & can be performed at the
same time.
• Difference:
SV focuses on the completeness of the work, while
QC focuses on the correctness of the work.

128
Validate Scope
Inputs T&T Outputs
1. Project Management Plan
2. Requirements Documentation
3. Requirements Traceability Matrix
4. Verified Deliverables
5. Work Performance data
1. Inspection
2. Group decision
making techniques
1. Accepted Deliverables
2. Change Requests
3. Work performance Info
4. Project Document Updates
129
Inputs
• Project Management Plan
• Requirements Documentation
• Requirements Traceability Matrix
• Verified Deliverables
• Work Performance data

130
T&T
• Inspection
Includes activities such as measuring, examining and verifying to determine whether work and deliverables meet requirements and product acceptance criteria.
They are sometimes called reviews, product reviews, audits, and walkthroughs.
• Group decision-Making techniques

131
Outputs
• Accepted Deliverables
Performed by the PM, the sponsor, the customer, and the functional managers.
• Change Requests
• Work Performance information
Work performance information includes information
about project progress, such as which deliverables have
started, their progress, which deliverables have finished,
or which have been accepted.
• Project Document Updates

132
Control Scope
Inputs T&T Outputs
1. Project Mgmt Plan
3. Requirements Doc
4. Requirements Traceability
Matrix
5.Work Performance data
6. Org Process Assets
Variance Analysis 1. Work Performance
information
2. Change Requests
3. Project Mgmt Plan Updates
4. Project document Updates
5. Org Process Assets Updates
An on-going process that begins as soon as the scope
baseline is created where each scope change request
should be controlled and managed.
133
Inputs
• Project Management Plan
• Requirements Documentation.
• Requirements Tractability Matrix.
• Work Performance data
Work performance data can include the number of
change requests received, the number of requests
accepted or the number of deliverables completed, etc.

T&T
• Variance Analysis
Used to measure differences between what was defined in the scope baseline and what was actually created.
A way to investigate and understand the root causes behind the differences.
134

Outputs
• Work Performance Information
• Change requests
• Project Management Plan Updates
• Project Document Updates
Requirements documentation.
Requirements traceability matrix.
135

13
6
End

13
7
Time Management
138
139
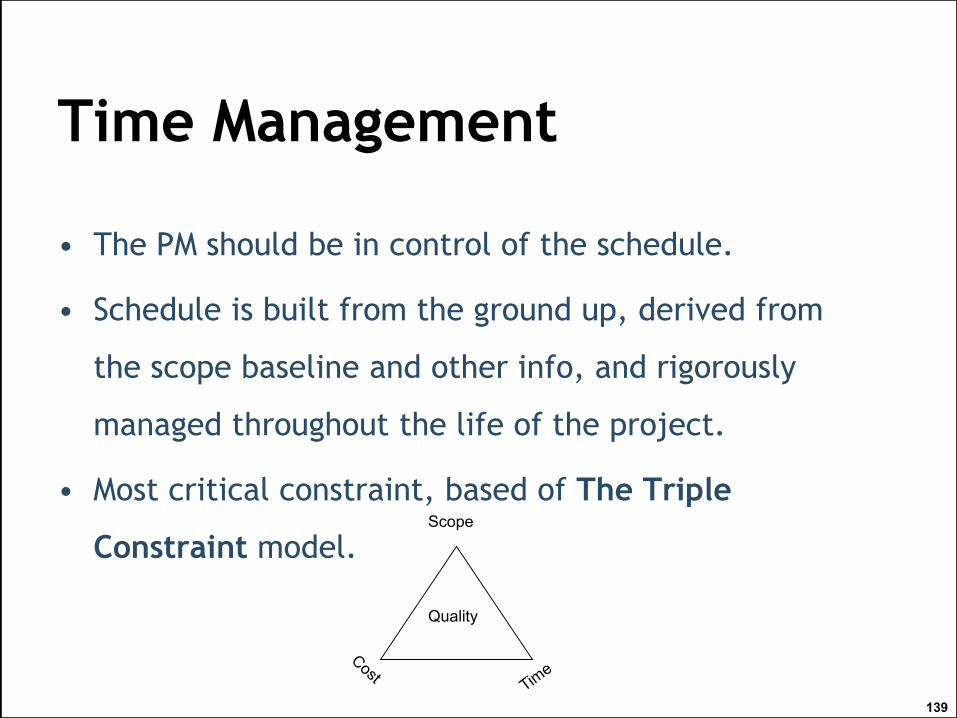
Time Management
• The PM should be in control of the schedule.
• Schedule is built from the ground up, derived from
the scope baseline and other info, and rigorously
managed throughout the life of the project.
• Most critical constraint, based of The Triple
Constraint model.
Quality
Scope

Plan Schedule ManagementPlan Schedule Management is the process of establishing the
policies, procedures, and documentation for planning,
developing, managing, executing, and controlling the project
schedule.
140
OutputsT&TInputs
1-Schedule Management Plan1-Expert Judgement.
2-Analytical Technique.
3-Meeting.
1- project management plan.
2- project charter.
3- EEF.
4- OPA.

Outputs• Schedule Management Plan
A component of the project management plan that
establishes the criteria and the activities for developing,
monitoring, and controlling the schedule. The schedule
management plan may be formal or informal, highly
detailed.
For example, the schedule management plan can
establish the following:
Project schedule model development, Level of accuracy.
Control thresholds, and Process descriptions.
Rules of performance measurement, reporting formats.
141
142
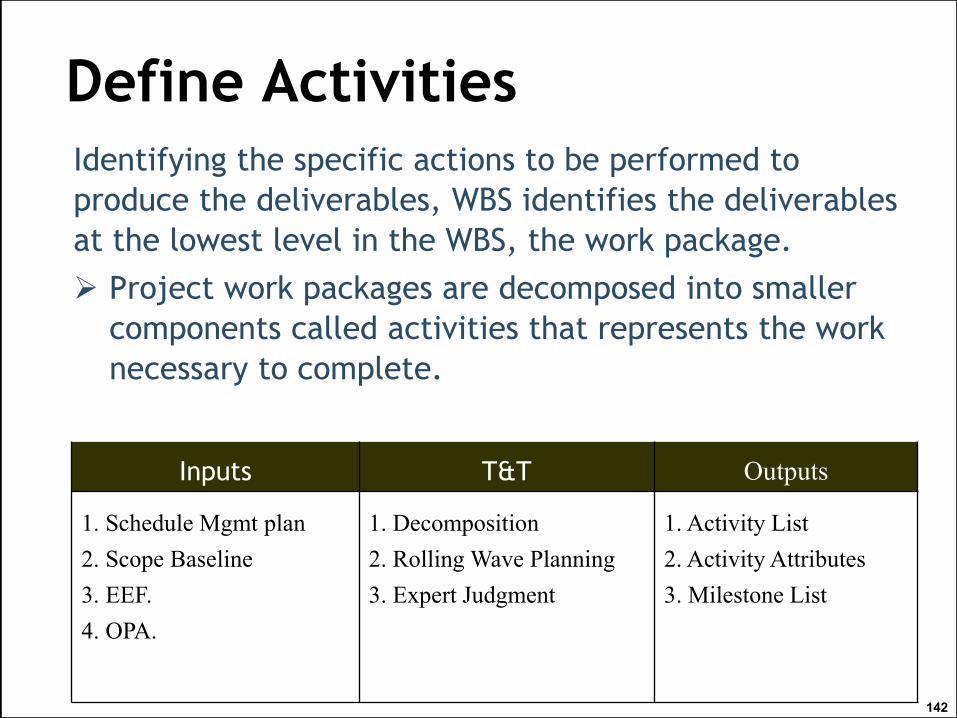
Define Activities
Identifying the specific actions to be performed to
produce the deliverables, WBS identifies the deliverables
at the lowest level in the WBS, the work package.
Project work packages are decomposed into smaller
components called activities that represents the work
necessary to complete.
Inputs T&T Outputs
1. Schedule Mgmt plan
2. Scope Baseline
3. EEF.
4. OPA.
1. Decomposition
2. Rolling Wave Planning
3. Expert Judgment
1. Activity List
2. Activity Attributes
3. Milestone List
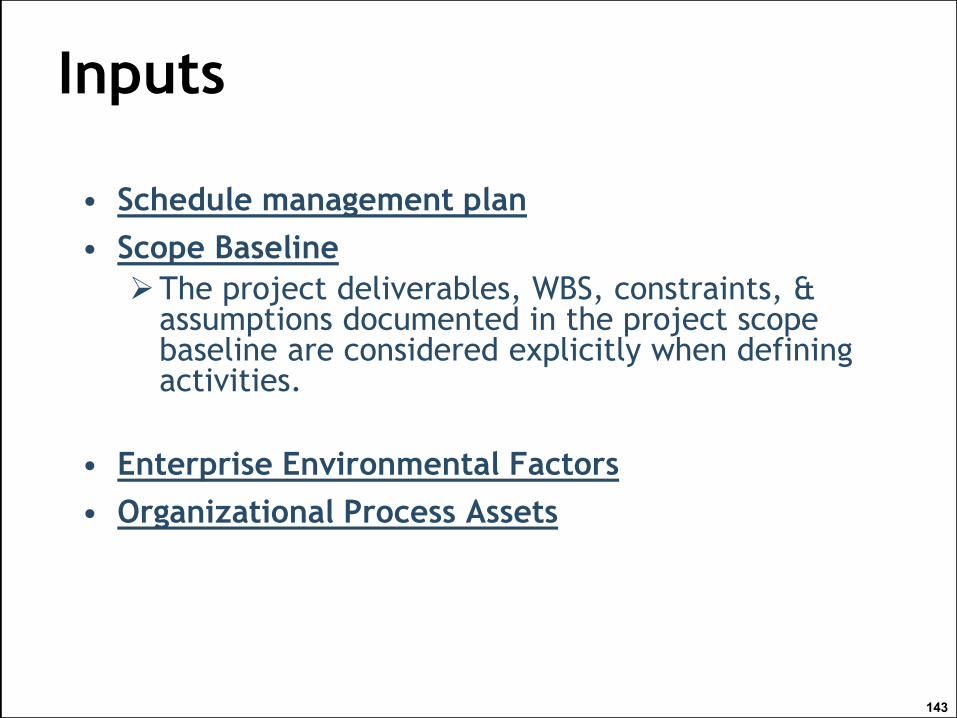
Inputs
• Schedule management plan
• Scope Baseline
The project deliverables, WBS, constraints, & assumptions documented in the project scope baseline are considered explicitly when defining activities.
• Enterprise Environmental Factors
• Organizational Process Assets
143

144
T&T
• Decomposition Subdividing the work packages into smaller, more
manageable components called activities.
Involving team members in the decomposition can lead to better and more accurate results.
• Rolling Wave PlanningA form of progressive elaboration that models
project planning the way we see things in the real world.

145
Outputs• Activity List
All of scheduled activities that need to be performed,
Finally, activities are used to create the project schedule.
• Activity Attributes
For planning, we need to have additional info about activities.
It is an expansion of the activity list and it will be seen with it.
• Milestone List
A significant point or event in the project.
Imposed, dates based on contractual obligation.
Optional, dates based on historical information.

Ex: Activity list
146
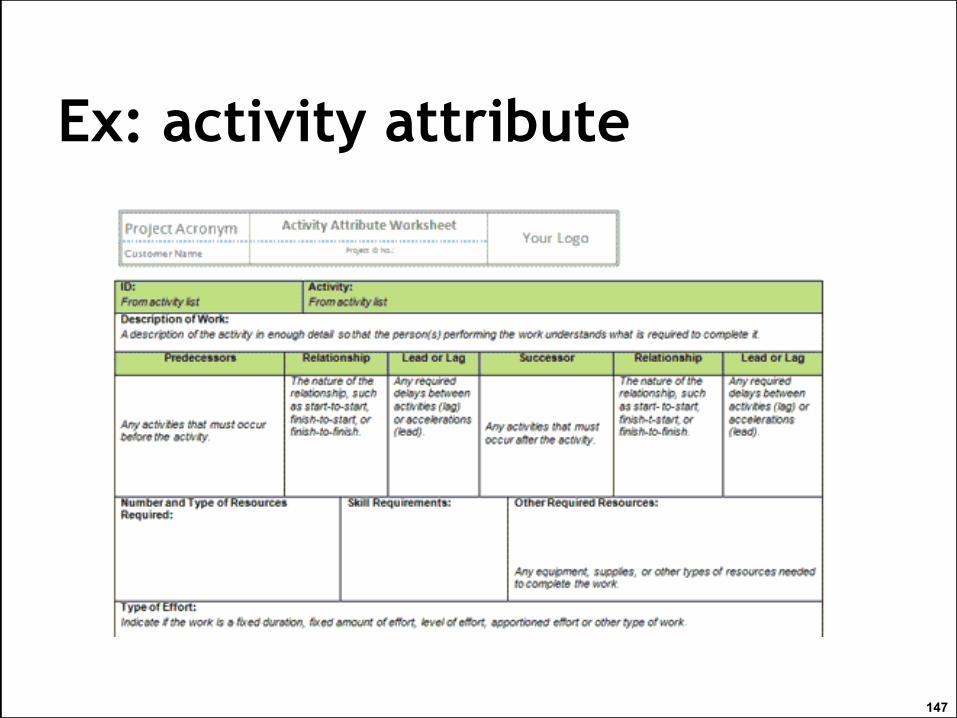
Ex: activity attribute
147

148
Sequence ActivityIdentifying and documenting relationships among the
project activities.
We can use project management software or using
manual or automated techniques.
Ex: MS Projects, primavera.
Inputs T&T Outputs
1. Schedule Mgmt plan
2. Activity List
3. Activity Attributes
4. Milestone List
5. Project Scope Statement
6. EEF
6. OPA
1. Precedence Diagramming
Method (PDM)
2. Dependency Determination
3. Leads and Lags
1. Project Schedule
Network Diagrams
2. Project Document
Updates

149
Inputs
• Schedule Management plan.
• Activity List.
• Activity Attributes.
• Milestone List
• Project Scope Statement
• Organizational Process Assets

150
T&T• Precedence Diagramming Method (PDM) or (AON)
Used in Critical Path Method (CPM) for constructing a project schedule network diagram.
Activities are represented by the node (Rectangles), with arrows representing the dependencies between them.
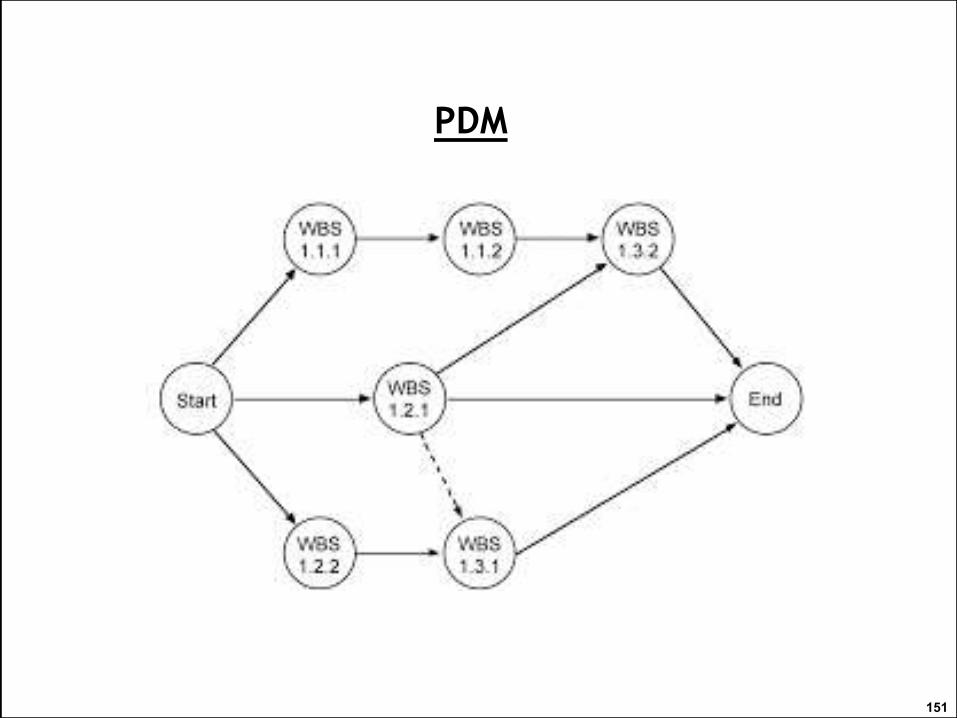
PDM
151

Note:PDM is Activity on NODE (AON); it mean activity present
by node.
While Activity On Arrow(AOA); activity present by Arrow.
152

Continue T&T
153
• PDM includes four types of dependencies or logical relations:
Finish-to-start (FS): The initiation of the successor activity depends upon the completion of the predecessor activity.
Finish-to-finish (FF): The completion of the successor activity depend upon the completion of the predecessor activity.
Start-to-star (SS): The initiation of the successor activity depends upon the initiation of the predecessor activity.
Start-to-finish: The completion of the successor activity depend upon the initiation of the predecessor activity.

154
Continue T&T
• Dependency Determination
Mandatory Dependencies: can’t be broken. Also know
as hard logic.
Discretionary Dependencies: soft logic or preferred
logic. Can be a result of best practices that means it is
based on historical information,
External Dependencies.
Internal Dependencies.

155
Continue T&T• Leads and Lags
A lead: One activity getting a jump start on
another.
It allows the acceleration of the successor activity.
Ex. Finish-to-Start Activity (mandatory)
Continue T&T
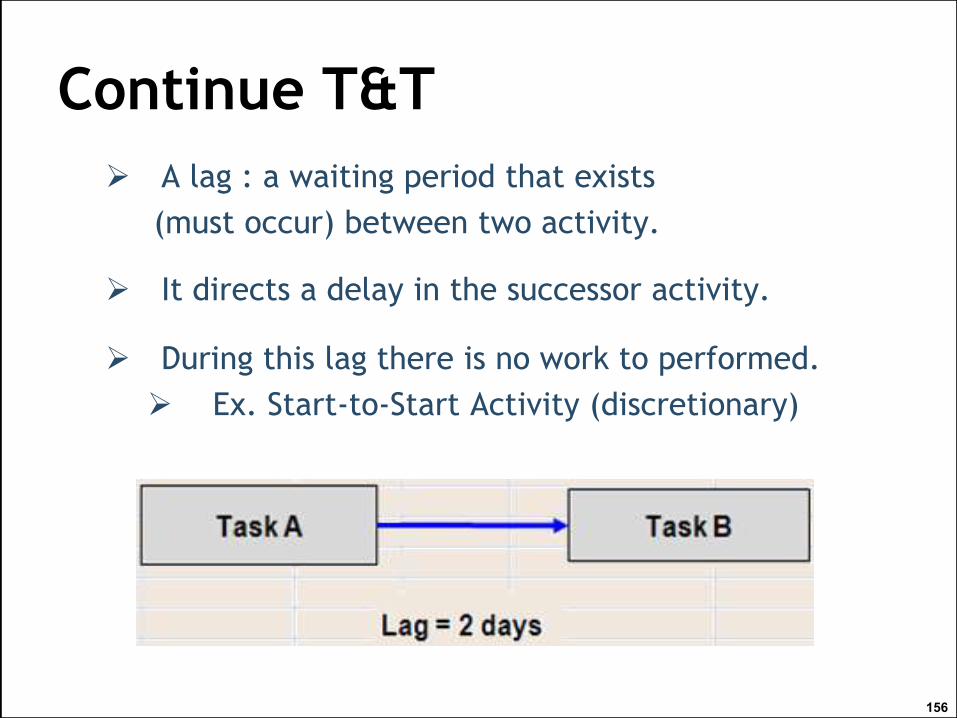
A lag : a waiting period that exists
(must occur) between two activity.
It directs a delay in the successor activity.
During this lag there is no work to performed.
Ex. Start-to-Start Activity (discretionary)
156

157
Outputs
• Project Schedule Network Diagram
No dates are assigned to the activities yet.
Include full representation of every activity with
enough documentation so the flow of activity can be
understood.
• Project Document Updates
Activity list.
Activity attributes.
Risk register.

Part of Activity List for retail Department development Project
158
Activity Description Predecessors Duration-Month
A Review customer complaints - 2
B Review old process flow
documents
- 3
C Specify repeated procedures B 1
D Make short list of complaints A 1
E Make required change to satisfy
customer
D 4
F Approve for changes and delete
repeated procedures
C,E 1
G Update process flow F 1
H Inform interested party G 1
Exercise1
Draw PDM for above activity list

159

160
Estimate Activity Resource
Inputs T&T Outputs
1. Schedule Management Plan
2. Activity List
3. Activity Attributes
4. Resource Calendars
5. Risk Register
6. Activity cost Estimates
7. EEF.
8. OPA.
1. Expert Judgment
2. Alternatives Analysis
3. Published Estimating
Data
4. Bottom-Up Estimating
5. Project Mgmt Software
1. Activity Resource
Requirements
2. Resource Breakdown
Structure
3. Project Document
Updates
Analysing project activity to determine the type and quantities of material, people, logistics, or supplies required to perform each activity.

161
Input• Schedule Management Plan
• Activity List
• Resource Calendars
Information on which resources are potentially available
(when and how) during the activity period,
• Risk Register
Risk events may impact resource selection and availability.
Updates to the risk register are included with project
documents updates.
Risk Register Example
Continue Inputs
• Activity cost Estimates
The cost of resources may impact resource selection.
• Enterprise Environmental Factors
• Organizational Process Assets
162

163
T&T
• Expert Judgement.
• Bottom-Up Estimating
• Alternative Analysis
Outsourcing an activity, purchasing a S.W. component rather than building it, or using a totally different approach to complete the activity.
• Published Estimating Data
Data available through published, recognized sources that can help in estimating,
• Project Management Software

164
Outputs
• Activity Resource Requirements
The type & quantity of resources required for each schedule activity is the primary output.
Ex. Two senior programmers are required for 4 months.
• Resource Breakdown Structure (RBS)
Similar to WBS, is a hierarchical structure of the
identified resources by resource category &
resource type.
It is useful for organizing and reporting project schedule data with resource utilization information.

165
Continue Outputs
• Project Document Updates
Activity list.
Activity attributes.
Resource calendar.
166
Estimate Activity Durations
• Analyze each activity in the activity list to estimate
how long it will take. It focuses on determining the
duration.
• It requires the amount of work effort required to
complete is estimated and the amount of resources
to be applied to complete the activity is estimated,
these are used to approximate the number of work
periods needed to complete the activity.
• project management software can be used.
167
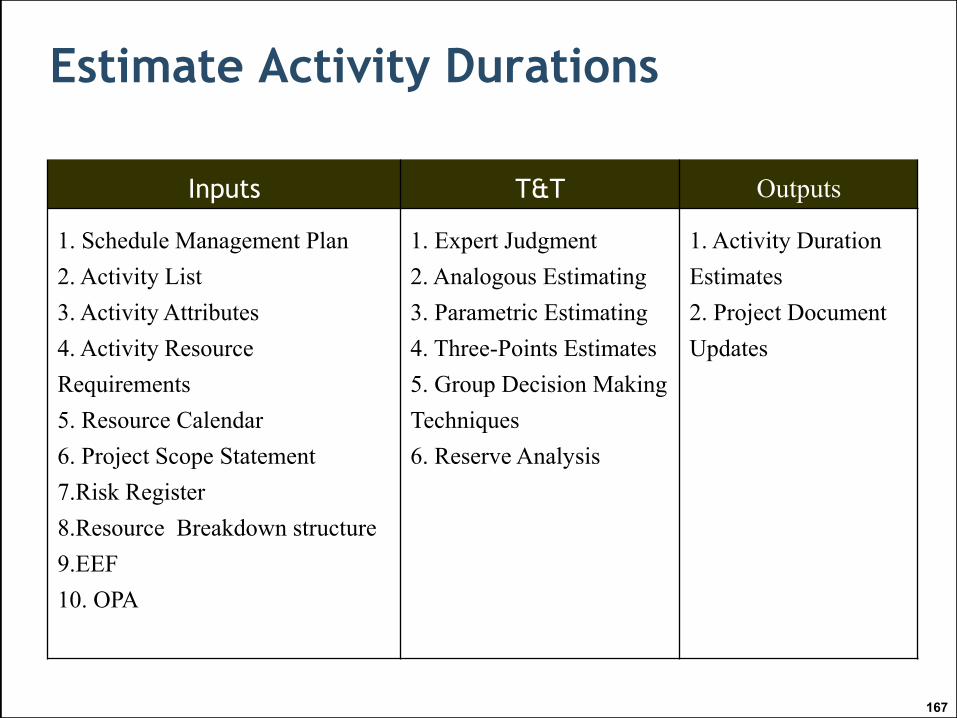
Estimate Activity Durations
Inputs T&T Outputs
1. Schedule Management Plan
2. Activity List
3. Activity Attributes
4. Activity Resource
Requirements
5. Resource Calendar
6. Project Scope Statement
7.Risk Register
8.Resource Breakdown structure
9.EEF
10. OPA
1. Expert Judgment
2. Analogous Estimating
3. Parametric Estimating
4. Three-Points Estimates
5. Group Decision Making
Techniques
6. Reserve Analysis
1. Activity Duration
Estimates
2. Project Document
Updates

168
Inputs
• Schedule Management Plan
• Activity List.
• Activity Attributes.
• Activity Resource Requirements
The resources assigned to the activity, and the
availability of the resources will influence the
duration of most activities.
• Resource Calendars
The type, availability, & capabilities of human
resources.
The type, quantity, availability, & capability when
applicable, of both equipment & material resources.

Continue Inputs
• Project Scope Statement
• Risk Register
The risk register provides the list of risks, along with the
results of risk analysis and risk response planning.
• Resource Breakdown Structure
provides a hierarchical structure of the identified
resources by resource category and resource type.
• Enterprise Environmental Factors
• Organizational Process Assets
Duration estimating databases and other reference data,
productivity metrics, and published commercial 169

170
T&T• Expert Judgement.
• Analogous Estimating
Top-Down Estimating use info from a previously performed project to estimate the current project.
Uses parameters such as duration, budget, size, weight, and complexity as the basis for estimating.
• Parametric Estimating
It can produce a higher levels of accuracy.
Uses statistical relationship between historical data and other variables.

171
Continue T&T• Three-Point Estimating (PERT) : PERT, use three data points for
the duration instead of simply one.
Pessimistic, Most Likely or realistic, and Optimistic estimates,
Formula: Pessimistic + 4XMost Likely + Optimistic
6
Standard Deviation for an Estimate:
Sigma= Pessimistic – Optimistic
6
• Two commonly used formulas are triangular and beta
distributions. The formulas are:
• Triangular distribution. tE = (tO + tM + tP) / 3
• Beta distribution tE = (tO + 4tM + tP) / 6

• Group Decision-Making techniques
• Reserve Analysis
Reserve time or Contingency and some time
referred to as buffer into the overall project
schedule to account for schedule uncertainty,
Revisited throughout the life of the project, being
revised up or down as more info on schedule risk
becomes available.
172
Continue T&T

173
Outputs• Activity Duration Estimates
Quantitative assessments of the likely number of
work periods that will be required to complete an
activity.
Contains an estimated duration for each activity in
the activity list.
• Project Document Updates
Activity attributes, and
Assumptions made in developing the activity duration
estimate such as skill level and availability.

174
Develop Schedule
• Analyzing activity sequences, durations. resource
requirements, and schedule constraints to create the
project schedule.
• Developing an acceptable project schedule, it
determines the planned start and finished dates for the
project activities and milestones.
• Revising and maintaining a realistic schedule continues
throughout the project as work progresses.
175
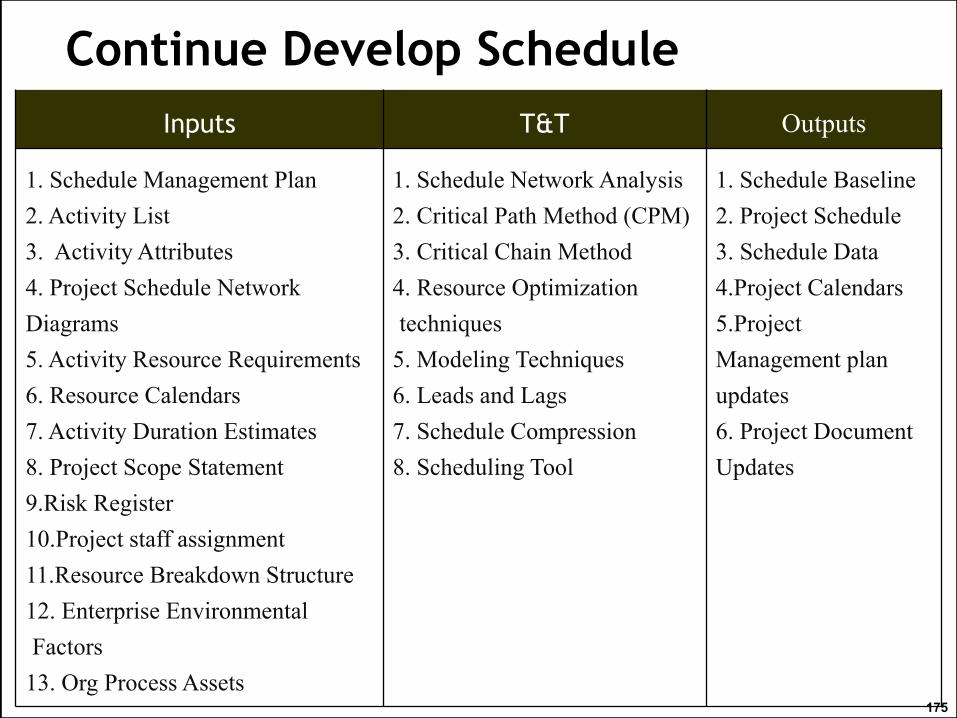
Continue Develop Schedule
Inputs T&T Outputs
1. Schedule Management Plan
2. Activity List
3. Activity Attributes
4. Project Schedule Network
Diagrams
5. Activity Resource Requirements
6. Resource Calendars
7. Activity Duration Estimates
8. Project Scope Statement
9.Risk Register
10.Project staff assignment
11.Resource Breakdown Structure
12. Enterprise Environmental
Factors
13. Org Process Assets
1. Schedule Network Analysis
2. Critical Path Method (CPM)
3. Critical Chain Method
4. Resource Optimization
techniques
5. Modeling Techniques
6. Leads and Lags
7. Schedule Compression
8. Scheduling Tool
1. Schedule Baseline
2. Project Schedule
3. Schedule Data
4.Project Calendars
5.Project
Management plan
updates
6. Project Document
Updates

176
Inputs• Schedule Management Plan
• Activity List.
• Activity Attributes.
• Project Schedule Network Diagram.
• Activity Resource Requirements.
• Resource Calendars.
• Activity Duration Estimates.
• Project Scope Statement.
• Risk Register
• Project Staff Assignment
• Resource Breakdown structure
• Enterprise Environmental Factors.
• Organizational Process Assets.

177
T&T
• Schedule Network Analysis
The technique of identifying early and late start
dates, as well as early and late finish dates, for the
uncompleted portions of project schedule activities.
Slack Time : amount of time the Task can be
delayed without delay project
SL = LS – ES OR SL= LF-EF

Schedule Network Analysis
178

• Critical Path Method
The critical path method, used to estimate the
minimum project duration and determine the
amount of scheduling flexibility on the logical
network paths within the schedule model.
Any delay of any activity locate on Critical Path,
will effect direct of project finish dates.
179
Continue T&T

What Critical Path ?
180
Exercise

Continue T&T
• Critical chain method
It is an upgraded version of the critical path
method, which is a more practical approach to
developing the project schedule.
In critical chain method, the availability of
resources is taken into consideration while drawing
the network diagram.
181
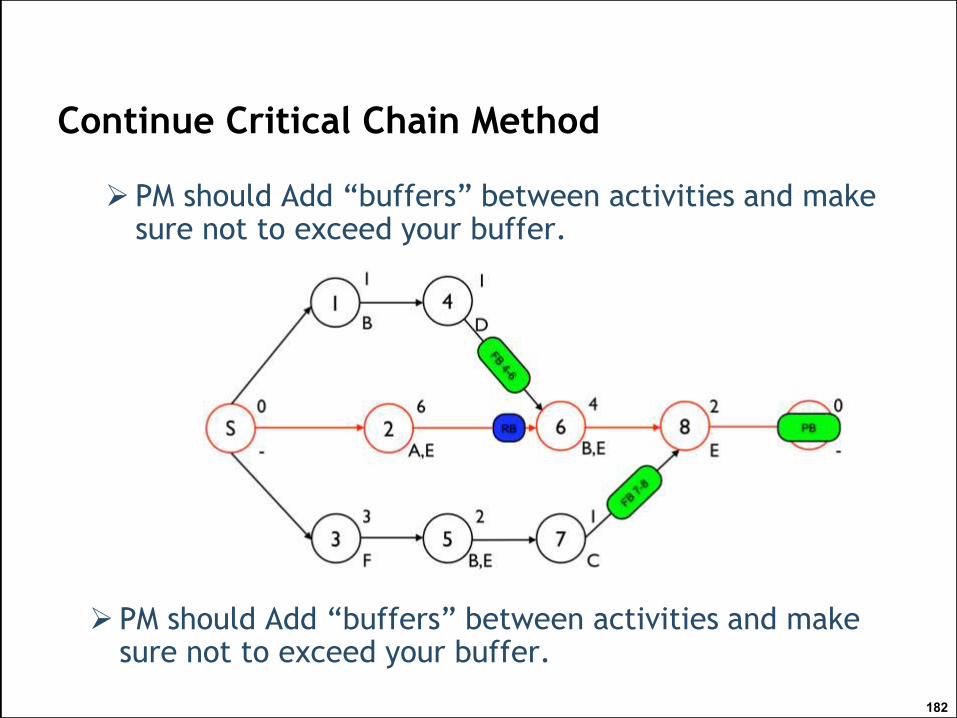
Continue Critical Chain Method
PM should Add “buffers” between activities and make sure not to exceed your buffer.
182
PM should Add “buffers” between activities and make sure not to exceed your buffer.

To achieve this, you first must perform the critical
path analysis and then analyze resource constraints
and probabilities in order to build the schedule and
the buffers.
The size for each buffer should account for the
uncertainty in the duration of the chain, of
dependant tasks leading up to that buffer.
183
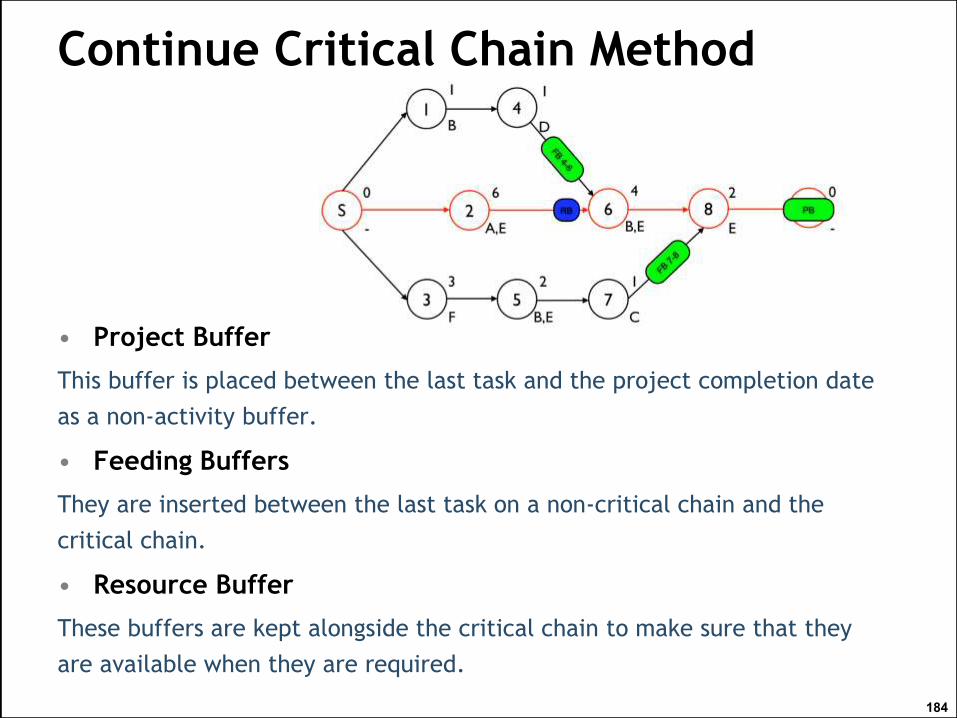
Continue Critical Chain Method
Continue Critical Chain Method
• Project Buffer
This buffer is placed between the last task and the project completion date
as a non-activity buffer.
• Feeding Buffers
They are inserted between the last task on a non-critical chain and the
critical chain.
• Resource Buffer
These buffers are kept alongside the critical chain to make sure that they
are available when they are required.
184

• CRITICAL PATH VS CRITICAL CHAIN
The critical path method (CPM) is a popular approach to
project scheduling that considers the amount of float on
project activities.
Critical chain takes CPM a step further by adding time
buffers to account for limited resources.
185
Continue T&T

Continue T&T
• Resource Optimization Techniques
1.Resource Leveling
A technique in which start and finish dates are
adjusted based on resource constraints with the
goal of balancing demand for resource with the
available supply.
It often cause the original critical path to change.
((extend time to reduce resource load))
In case no more resource's
186
187
Continue T&T
2. Resource Smoothing
A technique that adjusts the activities of a schedule
model such that the requirements for resources on the
project do not exceed certain predefined resource
limits.
((Move work to other resources if the load is over))

• Modeling Techniques
Examples of modeling techniques include, but are not
limited to:
1. What-If Scenario Analysis.
2. Simulation
Simulation involves calculating multiple project durations
with different sets of activity assumptions, usually using
probability distributions constructed from the three-point
estimate.
• Leads and Lags
188
Continue T&T

Continue T&T
• Schedule Compression
Fined ways to complete the project earlier without
cutting the project’s scope:
1. Crashing: adding resources to the project
activity. It almost always increase cost.
2. Fast Tracking: re-ordering the sequence of
activities so that the some of the activities are
performed in parallel, or at the same time. It
does not necessary increase cost, but it
increases risk.
189
Continue T&T
• Scheduling Tool
Automated scheduling tools expedite the
scheduling process by generated start and finish
dates based on the inputs of activities, network
diagrams, resources, resources and activity
durations.
190

191
Outputs• Schedule Baseline
A schedule baseline is the approved version of a schedule
model that can be changed only through formal change
control.
• Project Schedule
Shows when each activity is scheduled to begin and end,
as well as schedule start and finish for overall project.
It may be presented in summery form, sometimes
referred to as the master schedule or milestone schedule,
or presented in detail,

Continue Outputs
Milestone Charts Similar to bar charts, but only
identify the scheduled start or completion of major
deliverables or milestones and key external
interfaces.
Provides general level of information.
Used for brief, high level presentations where a lot
of schedule detail would be undesirable.
192

Continue Outputs
Bar Charts (Gant Chart) representing activities, show
activity starts and end dates, durations.
- Easy, and frequently used. Show percentage complete
- Represents the activity on horizontal bars with calendars.
- The length of the bar corresponds to the length of the time the activity should require.
Project Schedule Net. Diagram. show interdependencies,
the sequences, and the critical path.
- Can be presented in the activity-on-node diagram format, or
presented in a time-scale schedule network diagram format,
sometimes called a logic bar chart.
193

Continue Outputs
• Schedule Data
• Schedule Baseline
It is accepted and approved by the project management team
as the schedule baseline with baseline start dates and
baseline finish dates.
194
195
Continue Outputs
• Project calendars
Identifies working days and shifts that are available for
scheduled activities
• Project Management Plan Updates
• Project Document Updates

196
Control Schedule
• Concept of any controlling process, is to compare the work
results to the plan and ensure that they line up.
• Schedule is controlled to make sure that time-related
performance on the project is inline with the plan.
• Determining the current status of the schedule.
• Influencing the factors that create schedule changes.
• Determining that the project schedule has changed.

197
Control Schedule
Inputs T&T Outputs
1. Project Mgmt Plan
2. Project Schedule
3. Work Performance
data
4.Project Calendars
5.Schedule Data
6. Organizational
Process Assets
1. Performance Reviews
2. Project Mgmt software
3. Resource optimization
techniques
4. Modeling Techniques
5. Leads and Lags
6. Schedule Compression
7. Scheduling Tool
1. Work Performance
Information
2.Schedule Forecasts
3. Change Requests
4. Project Mgmt Plan updates
5. Project Document Updates
6.Organizational process assets
update
198
Inputs
• Project Management Plan
• Project Schedule
• Project Calendars
• Schedule Data
• Organizational Process Assets
• Work performance data

199
T&T
• Performance Reviews
1.Trend Analysis
2.Critical path method.
3.Earned value management (cost management chapter).
4.Critical Chain Method
• Project Management Software

Continue T&T
• Resource Optimization Techniques
• Modeling Techniques
• Leads and Lags
• Schedule Compression
• Scheduling Tools
200

201
Outputs
• Work Performance Information
• Change Requests.
• Project Management Plan Updates
• Project Document Updates
• Organizational Process Assets Updates

20
2
End

20
3
Cost Management

204
205
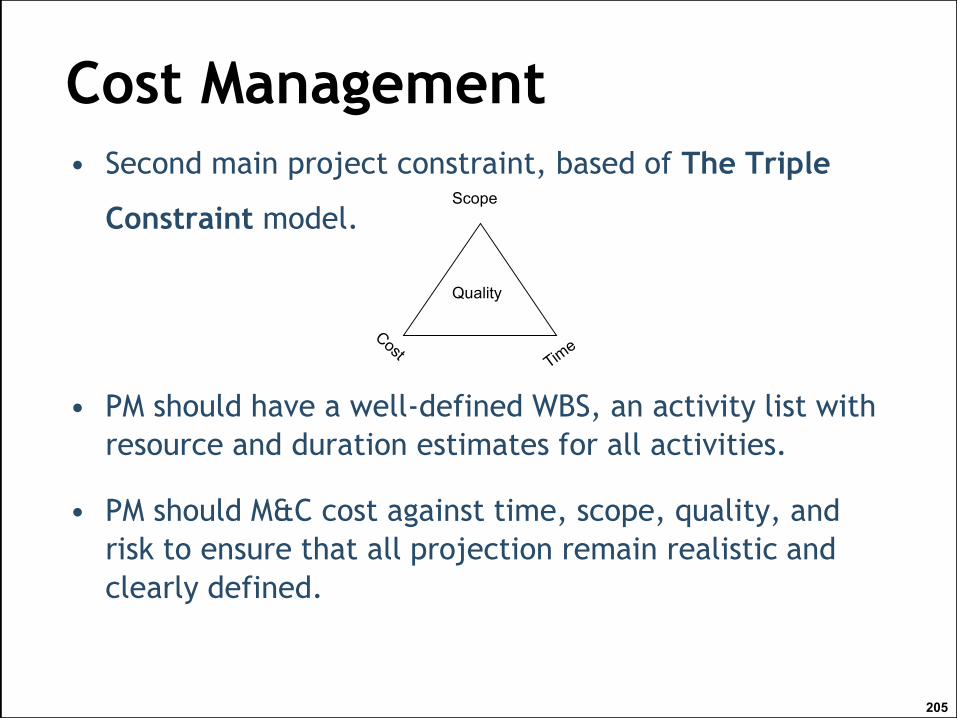
Cost Management
• Second main project constraint, based of The Triple
Constraint model.
• PM should have a well-defined WBS, an activity list with
resource and duration estimates for all activities.
• PM should M&C cost against time, scope, quality, and
risk to ensure that all projection remain realistic and
clearly defined.
Quality
Scope

Plan Cost Management
Plan Cost Management is the process that establishes the
policies, procedures, and documentation for planning,
managing, expending, and controlling project costs.
206
OutputsT&TInputs
1-Cost Management Plan1-Expert Judgement.
2-Analytical Technique.
3-Meeting.
1- project management plan.
2- project charter.
3.EEF.
4.OPA.

Outputs
• Cost Management Plan
The cost management plan is a component of the project
management plan and describes how the project costs will be
planned, structured, and controlled.
For example, the cost management plan can establish the
following:
- Units of measure. - Level of accuracy
- thresholds(upper & lower limit) - Process descriptions
- Rules of performance measurement
- Organizational procedures - reporting formats
207

208
Estimate costs
Estimate Type Range
Rough Order of Magnitude Estimate
at project initiationFrom -50% to +100%
Preliminary Estimate (Used for approvals) From -20% to +30%
Definitive Estimate (Used for project control) From -15% to +20%
Detailed Cost (Used for bid preparation) From -10% to +15%
Estimate Costs is the process of developing an approximation
of the monetary resources needed to complete project
activities.
Estimation become more mature and accurate while project
progressing.

Estimate Costs
209
Inputs T&T Outputs
1.Cost management Plan
2.HR Management plan.
3. Scope Baseline
4. Project Schedule
5. Risk register
6. EEF
7. OPA
1. Expert Judgment
2. Analogues Estimating
3. Parametric Estimating
4. Bottom-up Estimating
5. Three-point estimates
6. Reserve analysis
7. Cost of quality
8. Project Management SW
9. Vendor Bid Analysis
10.Group decision making tech.
1. Activity Cost Estimates
2. Basis of Estimates
3. Project Documents Updates

210
Inputs• Cost Management Plan
• Human Resources Management Plan
Provides project staffing attributes, personnel rates, and
related rewards/recognition, which are necessary
components for developing the project cost estimates.
Human Resource Management Plan input on Estimate Costs?
• Scope baseline :
Scope statement – WBS – and WBS dictionary
• Project Schedule.
• Risk Register.
• EEF & OPA.

T&T
• Expert Judgment:
• Analogous Estimating (Top Down)
• Parametric Estimating
• Bottom-Up (Detailed) Estimating
• Three point estimate:
211

212
T&T
• Reserve Analysis
Reserve amount also called Contingency.
The reserved amount should be analyzed to ensure that the amount of reserve being planned reflects the risk associated with the project.
• Cost of Quality (COQ) (During Product life cycle)
Refers to all of the costs that are incurred to (prevent defects) in products or costs that (result from defects) in the products.
Also used in the quality planning process.

213
T&T
• Project Management Estimating Software:
Computerized applications like spreadsheets,
simulations and statistical tools.
• Vendor Bid Analysis
Bids should be analyzed, to improve the project
team’s understanding of cost.
• Group decision-Making techniques
214
Outputs
• Activity Cost Estimating
How much it would cost to complete each schedule activity.
• Basis of estimates
Document of the basis of estimates.
Document of all assumptions.
Document of any known constrains.
Confidence level of final estimates.
• Project Documents Updates

215
Determine Budget
aggregating the estimated costs of work packages to
establish an authorized cost baseline.
It distribute cost on time phases so that the
performing org. will know how to plan for cash flow
and likely expenses.
It should be performed after activity definition,
activity duration estimate, and activity resource
estimate have been performed.

Determine Budget
216
Inputs T&T Outputs
1.Cost Management Plan
2.Scope Baseline
3. Activity Cost Estimate
4. Basis Of Estimates
5. Project Schedule
6. Resource Calendars
7.Risk Register
8. Agreements
9. OPA
1. Cost aggregation
2. Reserve analysis
3. Expert judgment
4. Historical information
5. Funding limits reconciliation
1. Cost baseline
2. Project Funding
Requirements
3. Project Documents
Updates

217
Inputs
• Cost Management Plan
• Scope Baseline
• Basis of estimates
• Project schedule
• Recourse calendar
• Risk Register
• Agreements
• OPA

218
T&T
• Expert Judgment
• Cost Aggregation
Costs are estimated at an activity level, these estimates should be aggregated to the work package level where they will be measured, managed, and controlled during the project.
• Reserve Analysis
Related to risk.
Almost all projects maintain a financial reserve to protect them against cost overrun.
How much they keep, how they track it vary from project to another. These buffers go by various names such as management reserve, and Contingency reserve.

• Reserve Analysis
219

220
Continue T&T
• Historical Relationship (Parametric Estimation)
A good way to check the validity of your budget is to compare
it with any historic data or industry data that show cost
relationships.
• Funding Limit Reconciliation
The process of identify any variances between the funding
limits and the planned expenditures.

221
Outputs
• Cost Baseline
Provides Budget at completion.
Specifies what costs will be incurred & when.
Larger project may be divided into multiple cost baselines.
• Project Funding Requirements
Cost Baseline is used to determine the project’s funding requirements that are almost always related to the planning expenditures, but not identical to them.
They also should include any planned contingency or reserve funds, since these must be available to the project as soon as they are needed.
• Project documents updates

222

Control Cost
223
Inputs T&T Outputs
1. Project mgmt plan
2. Project funding Req.
3. Work Performance data
4. OPA
1. Earned value mgmt
2. Forecasting
3. To-complete
performance index
4. Performance reviews
5. Project mgmt Software
6. Reserve analysis
1. Work performance Info.
2. Cost forecasts
3.Change requests
4.Project mgmt. plan updates
5.Project document updates
6. OPA update
224
Inputs
• Project management plan
• Project Funding Requirements
• Work performance Data
• Organization process assets

225
T&T
• Earned value management (EVM)
It’s a method of performance measurement, it
integrates project scope, cost and schedule to help
measure project performance.
EVM monitor, three monitory values:
Planned value - Earned value - Actual cost
• By EVM Project manager will know whether the project is:
− ahead of / on / behind schedule
− under / on / over budget

EVMPlanned Value (PV):
How much Work should have been completed at a point in time based on the plan.
The authorized budget assigned to be accomplished.
(Planned % complete X BAC)
Total PV for the project is also known as (BAC)Earned Value (EV) :
The monitory value of work performed.
Delivered by measuring where you actually are in terms of work completed during a given period of time in the schedule.
Actual Cost (AC):
The actual cost incurred.
The money spent during a given period of time.
226

227
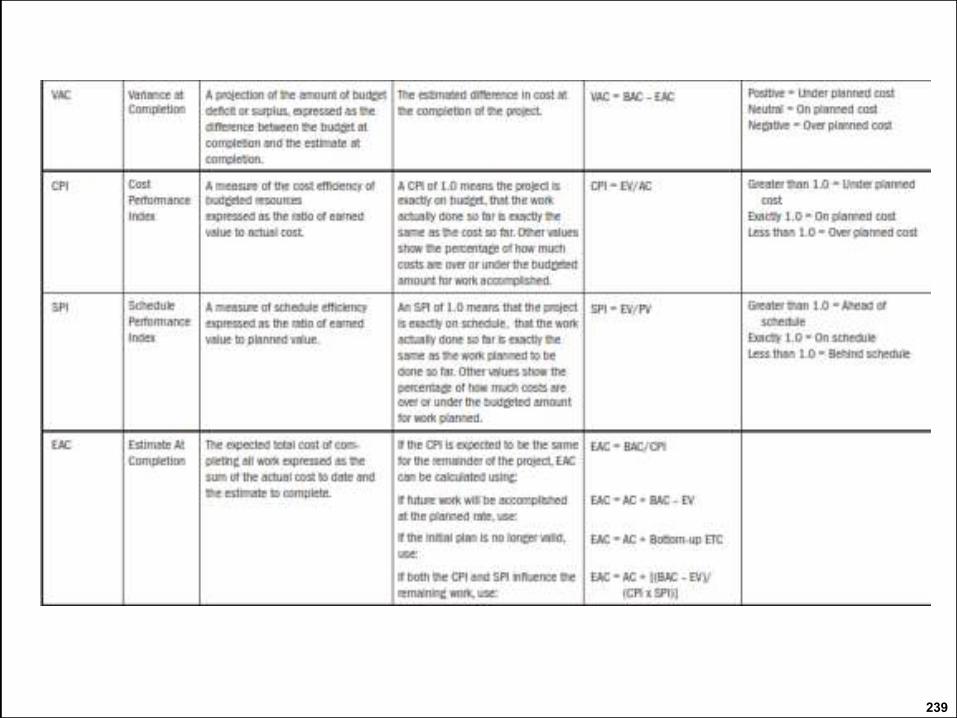
EVM monitor, two variances
Cost Variance:
• The difference between what we expected to spend and what was actually spent.
• CV= EV-AC
Schedule Variance:
• The difference between where we planned to be in the schedule and where we are in the schedule.
• SV=EV-PV.
EVM
EVM
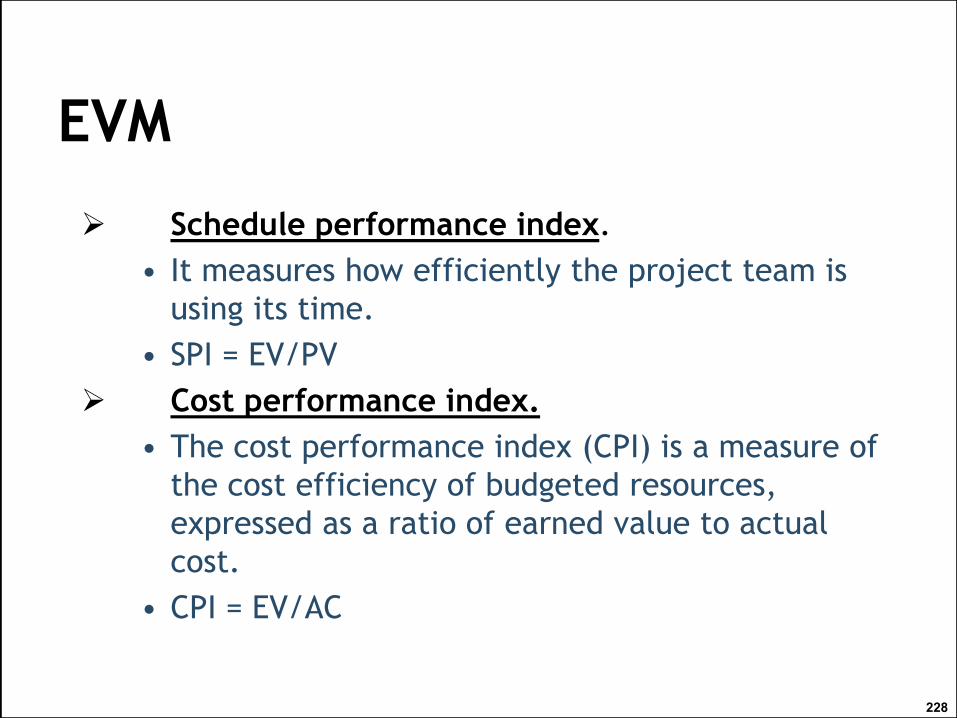
Schedule performance index.
• It measures how efficiently the project team is
using its time.
• SPI = EV/PV
Cost performance index.
• The cost performance index (CPI) is a measure of
the cost efficiency of budgeted resources,
expressed as a ratio of earned value to actual
cost.
• CPI = EV/AC
228
Earned Value Management
229
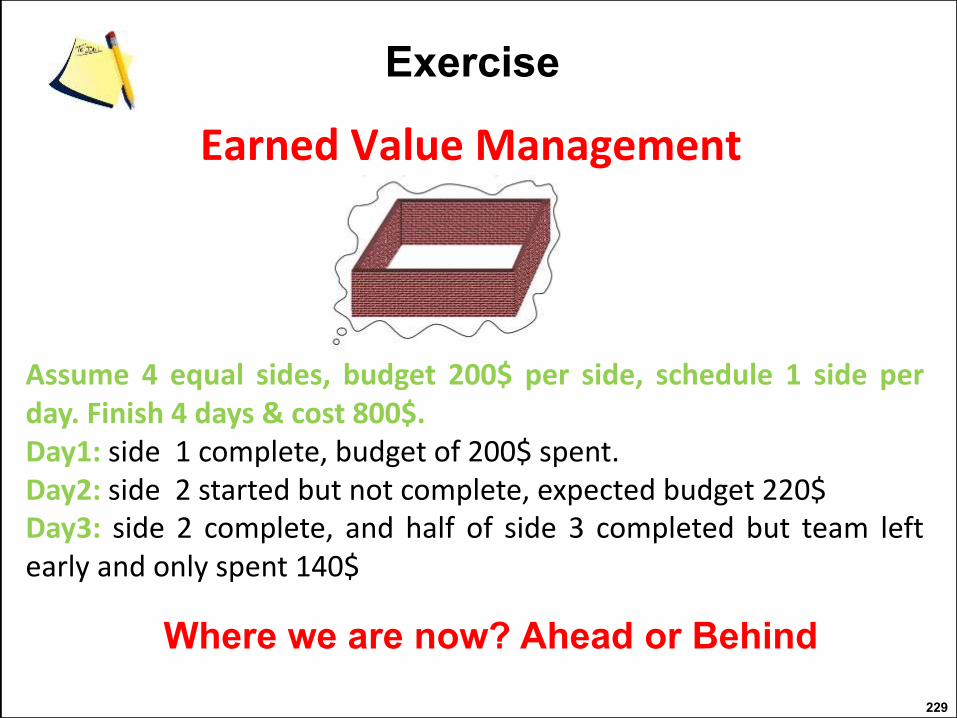
Where we are now? Ahead or Behind
Assume 4 equal sides, budget 200$ per side, schedule 1 side per day. Finish 4 days & cost 800$.Day1: side 1 complete, budget of 200$ spent.Day2: side 2 started but not complete, expected budget 220$Day3: side 2 complete, and half of side 3 completed but team left early and only spent 140$
Exercise

230
4 equal sides, budget 200$ per side, 1 side per day. Finish 4 days & cost 800$.Day1:side 1 complete, budget of 200$ spent.Day2:side 2 started but not complete, expected budget 220$Day3:side 2 complete, and half of side 3 completed but team left early and only spent 140$

EVM Example:
231

Continue T&T
Forecasting.
− EAC forecast for ETC work performed at the budgeted
rate. This EAC method Equation: EAC = AC + (BAC - EV)
− EAC forecast for ETC work performed at the present
CPI Equation: EAC = BAC / CPI
− EAC forecast for ETC work considering both SPI and
CPI factors. Equation:
EAC = AC + [(BAC - EV) / (CPI x SPI)]
232

• Project of Highway Paving 100 Km; for each 10 Km we need
a month with cost 100 k$, total project budget is 1 million
and duration 10 Month.
• MONTH1: 10 km complete, budget of 90k spent.
• MONTH2: 15 km complete, budget of 150k spent.
• MONTH3: 15 km complete, budget of 110k spent.
• MONTH4: 10 km complete, budget of 100k spent.
Where we are now? Ahead or Behind
233
Earned Value Management
Exercise

Answer
234
• PV ; EV ; AC ;
• CV= EV-AC
• SV=EV-PV
• CPI = EV/AC
• SPI = EV/PV
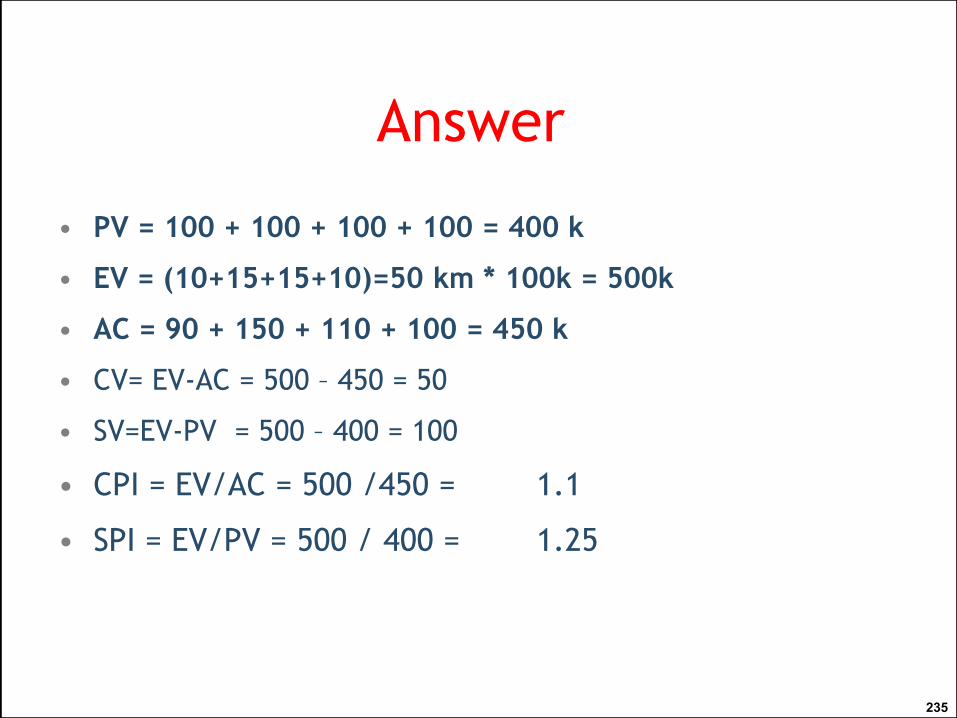
Answer
235
• PV = 100 + 100 + 100 + 100 = 400 k
• EV = (10+15+15+10)=50 km * 100k = 500k
• AC = 90 + 150 + 110 + 100 = 450 k
• CV= EV-AC = 500 – 450 = 50
• SV=EV-PV = 500 – 400 = 100
• CPI = EV/AC = 500 /450 = 1.1
• SPI = EV/PV = 500 / 400 = 1.25
T&T
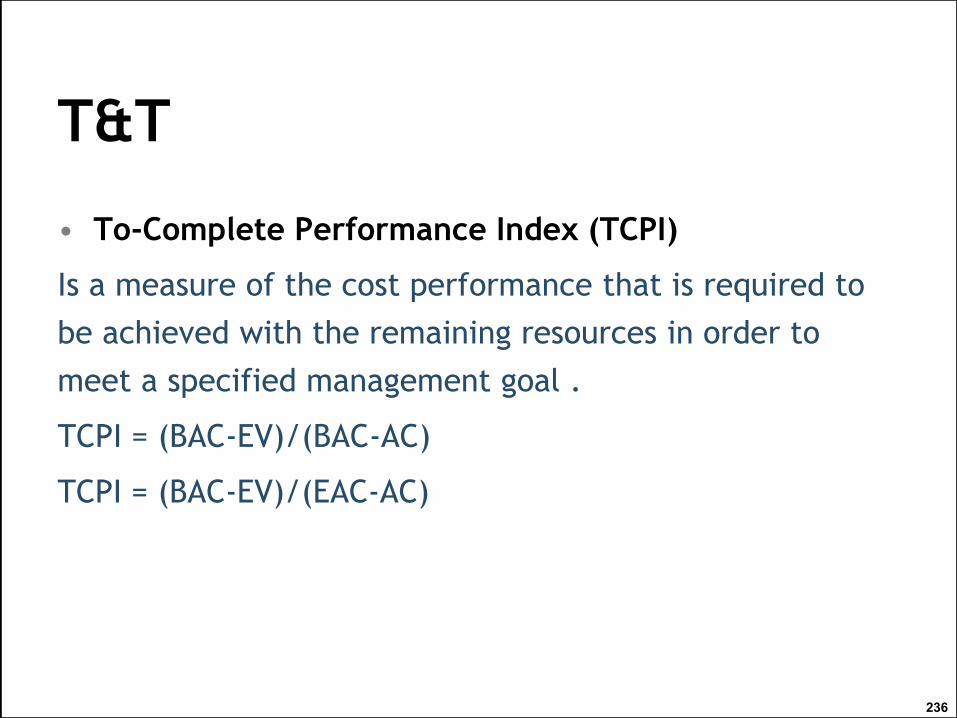
• To-Complete Performance Index (TCPI)
Is a measure of the cost performance that is required to
be achieved with the remaining resources in order to
meet a specified management goal .
TCPI = (BAC-EV)/(BAC-AC)
TCPI = (BAC-EV)/(EAC-AC)
236

237
T&T
EAC=AC+[(BAC-EV)/(cumulative CPIX cumulative SPI], this
estimate introduce SPI as a factor in estimating EAC and
we can add a weighting value (80/20 or 50/50) between
SPI and CPI
• To Complete Performance Index(TCPI)
If the BAC is no longer viable, the project manager develop a
forecast estimate at completion. Once its approved TCPI will
replace BAC.
TCPI based on BAC: (BAC-EV)/(BAC-AC),
If CPI false below the baseline (-ve value)TCPI based on
EAC will be calculated and will be set as new target
TCPI=(BAC-EV)/(EAC-AC).

238
Continue T&T
239

240
Continue T&T
• Performance Reviews
Meetings held to measure actual performance against the plan.
• Project Management Software
The software that will help in automating the generation of EVM variables, indexes and forecasts.
• Reserve Analysis
241

Outputs
• Work Performance Measurements
Show how the project is performing against the plan,
CV, SV, CPI, and CPI.
• Cost Forecasts
Either a calculated EAC value or a bottom-up EAC value is documented and communicated to stakeholders.
• Change requests (By Default)
Corrective actions.
Preventive actions.
242

Continue Outputs
• Project management Plan updates
• Project documents updates
• Organization process assets update
243

24
4
End

24
5
Quality Management

246
Quality Management
• Quality:
The degree to which a set of inherent
characteristics fulfill requirements.
• Differences between grade and quality
Grade: The same technical use, but different
characteristics.
Quality: The degree of characteristics fulfill the
requirements.
247

Terms and Definitions
We must differentiate between quality control and
quality assurance:
Quality assurance: The planned and systematic
activities implemented in a quality system so that
quality requirements for a product or service will
be fulfilled.
Quality control: The observation techniques and
activities used to fulfill requirements for quality.
248

Quality Pioneers and Philosophies
• JURAN: Issue Pareto principle (80% of the problems
are caused by 20% of the causes), He developed
“Juran’s Trilogy”: quality planning, quality control,
and quality improvement.
• CROSBY: Zero Defect, which led to Six Sigma.
• DEMING: Increase quality and reduce costs by
continuous process improvement. (Plan-Do-Check-Act)
249

Continue Terms and Definitions
Just-In-Time (JIT): A manufacturing method that
brings inventory down to zero (or near zero) levels. It
forces a focus on quality, since there is no excess
inventory on hand to waste.
Six Sigma: it focuses very high levels of quality by
controlling the process and reducing defects.
It puts a primary focus on quantifying, measuring,
and controlling the quality of products, services,
and results.
250
251
Continue Terms and Definitions

252
Continue Terms and Definitions
Attribute sampling: Measures whether or not the results conform to specifications. (YES or NO)
Variable sampling: continuous scale that measures the degree of conformity. The result is rated on degree of conformity.
Control limits: identify the boundaries of common variation in a statistically stable process or process performance.
Tolerance: specified range of acceptable results.
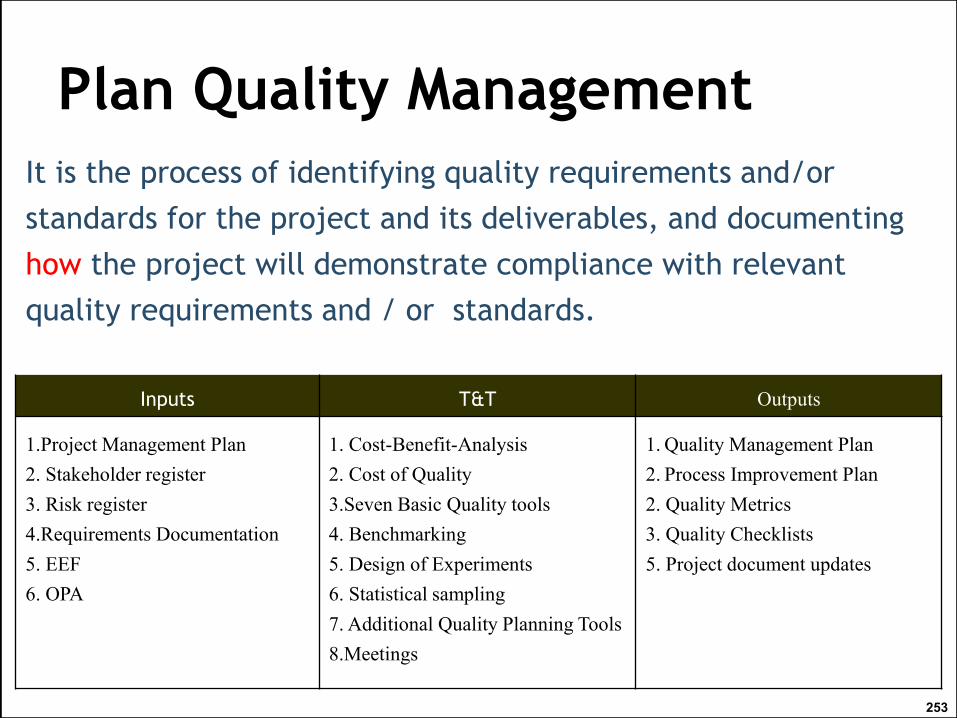
253
Plan Quality Management
It is the process of identifying quality requirements and/or
standards for the project and its deliverables, and documenting
how the project will demonstrate compliance with relevant
quality requirements and / or standards.
Inputs T&T Outputs
1.Project Management Plan
2. Stakeholder register
3. Risk register
4.Requirements Documentation
5. EEF
6. OPA
1. Cost-Benefit-Analysis
2. Cost of Quality
3.Seven Basic Quality tools
4. Benchmarking
5. Design of Experiments
6. Statistical sampling
7. Additional Quality Planning Tools
8.Meetings
1. Quality Management Plan
2. Process Improvement Plan
2. Quality Metrics
3. Quality Checklists
5. Project document updates

Inputs
• Project Management Plan
• Stakeholder register
• Risk register
• Requirements Documentation
• EEF
• OPA
254

255
T&T
• Cost-Benefit Analysis
A cost-benefit analysis for each quality activity compares the cost of the quality step to the expected benefit.
• Cost of Quality (COQ)
Looks at all of the costs that will be realized in order to achieve quality.
• Seven Basic Quality tools
- Cause-and-effect diagrams - Flowcharts
- Check sheets - Pareto diagrams
- Histograms - Control charts
- Scatter diagrams
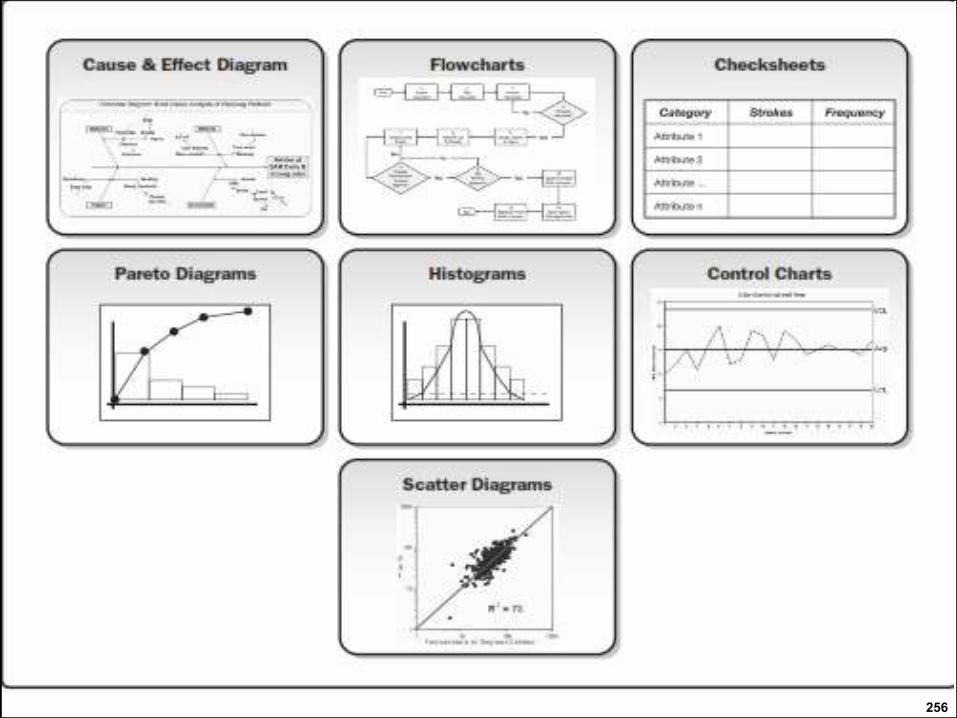
256

T&T
• Benchmarking
Project’s quality standards are compared to those of other projects which will serve as a basis for comparison.
• Design of Experiments (DOE)
We need to know what is the predicted outcome of a systems under experiment (measure phase in 6sigma).
Uses data analysis to determine optimal conditions.
• Additional quality planning tools
Like brain storming, force field analysis, nominal group techniques and Quality Management and control tools .
• Meetings
257

258
Outputs• Quality Management Plan: Describes how the quality policy
will be met.
• Process Improvement Plan: Deals with how quality activities
will be streamlined and improved. Areas to consider:
Process boundaries,
Process configuration,
Process metrics,
Target to improve performance.
• Quality Metrics : Define how quality will be measured.
• Quality Checklists: (list of steps)To ensure that all steps were
performed. and that they were performed in the proper
sequence.
• Project Documents Updates

259
Perform Quality Assurance
The process of auditing the quality requirements and the
results from quality control measurements ensure that
appropriate quality standards are used.
Inputs T&T Outputs
1. Quality Mgmt. Plan
2. Process Improvement Plan
3. Quality Metrics
4. Quality Control
5. Project Documents
1.Qulaity Management
and control tools
2. Quality Audits
3. Process Analysis
1.Changes Requests
2.Project Mgmt. Plan
Updates
3.Project Document
Updates
4. Org Process Assets
updates
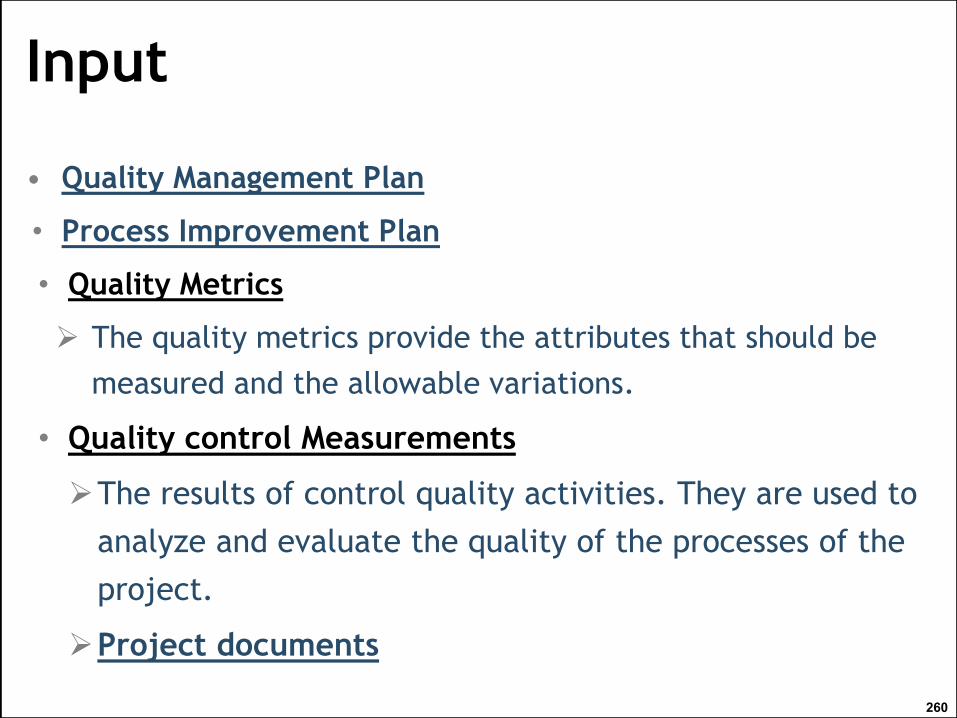
Input
• Quality Management Plan
• Process Improvement Plan
• Quality Metrics
The quality metrics provide the attributes that should be
measured and the allowable variations.
• Quality control Measurements
The results of control quality activities. They are used to
analyze and evaluate the quality of the processes of the
project.
Project documents
260

261
T&T
• Quality Management and Control Tools
Tools and techniques from plan quality process.
- Affinity diagrams
- Process decision program charts (PdPc)
- Interrelationship digraphs.
- Tree diagrams.
- Prioritization matrices
- Activity network diagrams
- Matrix diagrams.

T&T
• Quality Audits
Review the project to evaluate which activities taking
place on the project should be improved and which meet
quality standards,
The goal is to improve acceptance of the product and the
overall cost of quality.
• Process Analysis
Reviews the quality process to ensure that it is working
efficiently & effectively.
262

Outputs
• Change requests
• Project management plan updates
• Project document updates
• Organization process assets updates
263
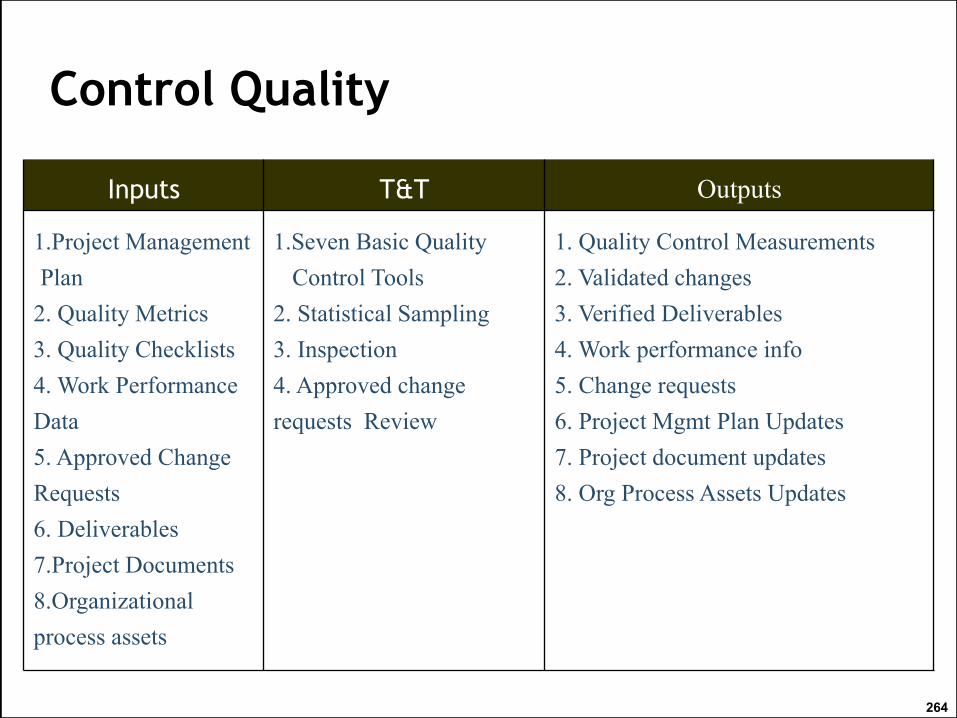
264
Control Quality
Inputs T&T Outputs
1.Project Management
Plan
2. Quality Metrics
3. Quality Checklists
4. Work Performance
Data
5. Approved Change
Requests
6. Deliverables
7.Project Documents
8.Organizational
process assets
1.Seven Basic Quality
Control Tools
2. Statistical Sampling
3. Inspection
4. Approved change
requests Review
1. Quality Control Measurements
2. Validated changes
3. Verified Deliverables
4. Work performance info
5. Change requests
6. Project Mgmt Plan Updates
7. Project document updates
8. Org Process Assets Updates

265
Inputs
• Project management plan
• Work performance measurements
• Approved change requests
• Deliverables.
• Project Documents
• Organization process assets

1- Cause and Effect Diagram (Ishikawa or Fishbone)
Show how different factors relate together & might be tied to potential problems.
Identifies quality problems and trying to uncover the underlying causes.
266
T&TSeven Basic Quality Tools
Example

267
T&T2.Control Charts
3.Flowcharting
Show how various components relate in a system.
Can be used to predict where quality problems may happen.
Cause & effect diagrams are another type of flowcharting.
4.Histogram or Column Char
Shows how often something occurs, or its frequency,
Pareto chart is one example of a type of histogram.
5.Pareto Charts (80/20 rule)
Pareto Law: 80/20 Rule. 80% of problems come from 20% of the
causes.
Shows defects ranked from greatest to least.
268
T&T
Used to focus on the problems most likely to change results.
It helps to determine the few root causes behind the
majority of the problems on a project.

269
Continue T&T6.Run Chart
Taking a snapshot of the way things are at a point in time,
The PM can analyze how quality is trending over time.
7.Scatter Diagram
Powerful tool for spotting trends in data,
Uses two variables dependent and independent variable,

270
Continue T&T• Statistical Sampling
• Inspection
An inspection is the examination of a work product to
determine if it conforms to documented standards.
Inspections may be called reviews, peer reviews, audits, or
walkthroughs. In some application areas, these terms have
narrow and specific meanings.
• Approved change requests review
All approved change requests should be reviewed to verify
that they were implemented as approved.
Outputs
• Quality control measurements
resulting documents out from quality control activates.
• Validated changes
Any changed or repaired items are inspected and either accepted or rejected (return for rework).
• Verified deliverables
Are inputs to verify scope process.
271

Continue Outputs
• Work performance Information
• Change requests
• Project management plan updates
• Project document updates
• Organization process assets updates
272

Perform Quality Assurance & Control Quality
273

27
4
End
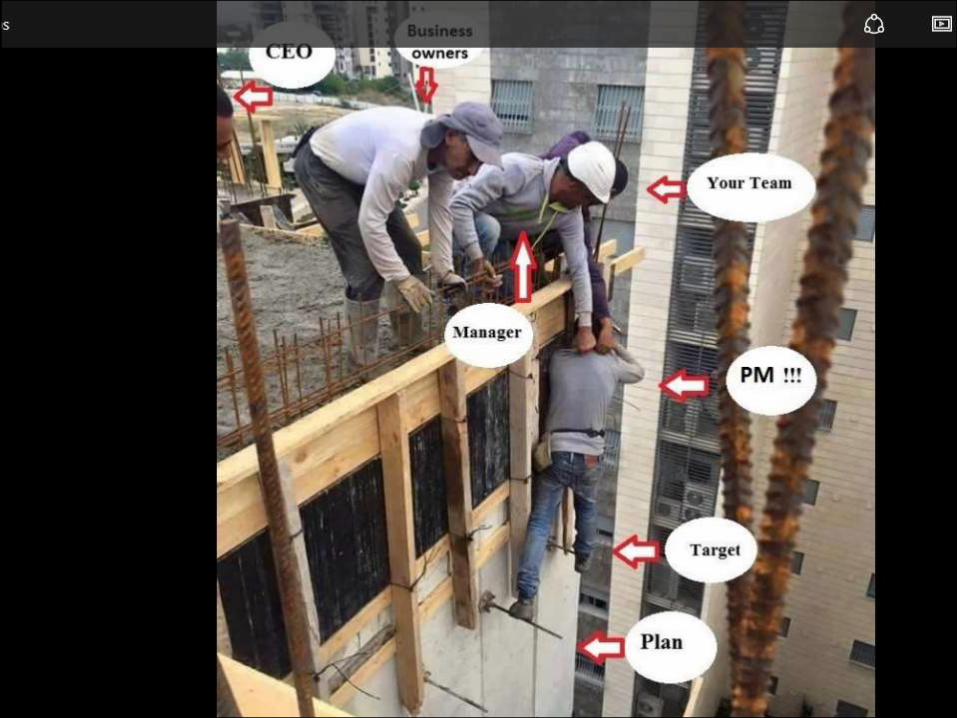
275

27
6
HR Management

277

Human Resource Management
• The process that organize and manage the project team,
• The project management team is a subset of the project team
and called the CORE, EXECUTING, team
• Managing the project team includes:
Influencing the project team,
Professional and ethical behavior.
278

Terms and Definitions
• Maslow's hierarchy need theory
• Mcgregor - theory x y
• Herzberg's motivation-hygiene theory
• McClelland's Human Motivation Theory
279

Maslow's hierarchy need theory
280

Mcgregor - Theory x, y
281

Herzberg's theory
282

McClelland's Human Motivation Theory
283

284
Develop human Resource Plan
• This process defines
Roles, required skills,
Responsibilities, reporting relationships, and
When to acquire and release project team.
Inputs T&T Outputs
1.Project Management Plan
2.Activity resource requirements
3.EEF
4.OPA
1. Org Charts & Position
Descriptions
2. Networking
3. Organization al Theory
4. Expert Judgment
5. Meetings
1. Human resource Plan

Input
• Project Management Plan
• Activity resource requirements
• Enterprise environmental factors
• Organization process assets
285

286
T&T
• Org Charts and Position Description
Present who will be working on the project and what
they will be responsible for doing, including
Responsibility availability matrix hierarchical charts
(WBS,OBS,RBS), text oriented formats.
Hierarchical type charts.

T&T
Matrix based charts (Ex. RAS)
RACI (Responsible, Accountable, Consultant, Inform)
Text oriented formats
287
T&T
• Networking
Communicating with others within your “network” of contacts, like correspondence, meetings and information conversation.
• Organization Theory
Provides info regarding the way in which people, teams, and organizational units behave.
• Expert Judgement
• Meetings
288

Outputs
Human Resources Management Plan:
It includes:
Roles and Responsibilities
Project Organizations Charts
Staffing Management plan
Staffing acquisition.
Resource calendar.
Staff release plan.
Training needs.
Rewards and recognition.
Compliance with governmental, union regulations.
Safety.
289
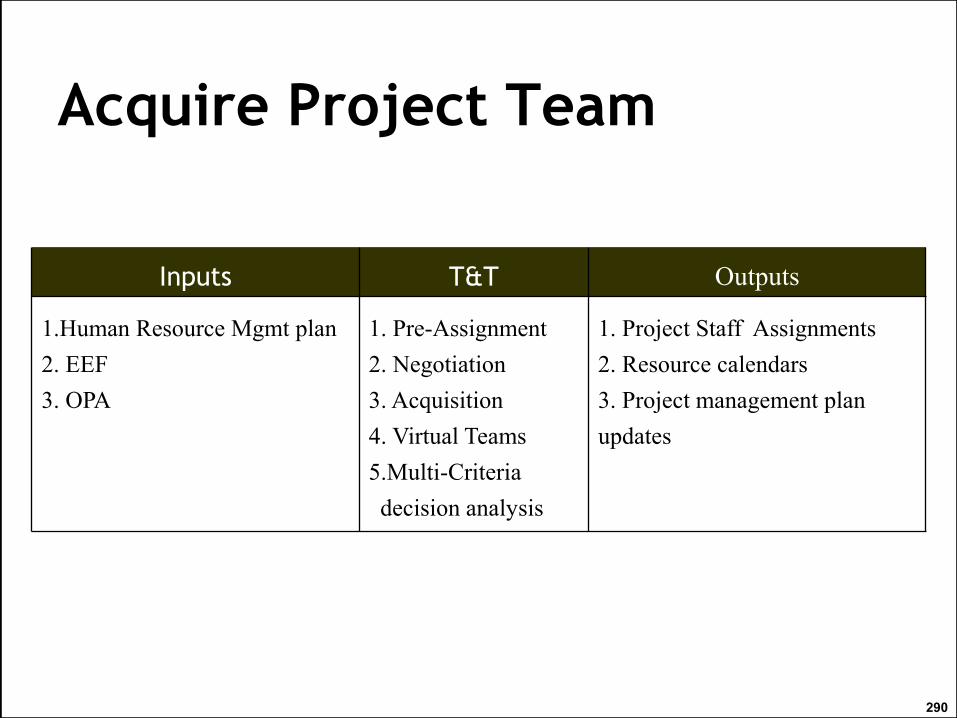
290
Acquire Project Team
Inputs T&T Outputs
1.Human Resource Mgmt plan
2. EEF
3. OPA
1. Pre-Assignment
2. Negotiation
3. Acquisition
4. Virtual Teams
5.Multi-Criteria
decision analysis
1. Project Staff Assignments
2. Resource calendars
3. Project management plan
updates

Inputs
• Human Resource Management Plan
• Enterprise environmental factors
• Organizational process assets
291

T&T• Pre-Assignment
Staffing done before the running of this process for the sake of project requirements or as a result of organization policy or politics.
• Negotiation
It is an important skill for the PM, PM needs to negotiate with functional managers and with project team other project managers and external organizations.
• Acquisition
Looking outside the org for resources when they cannot be provided by your organization.
• Virtual Teams (tools)
Group of individuals who may or may not see each other in person.
292

T&T
• Multi-criteria decision Analysis
Selection criteria are often used as a part of acquiring
the project team. By use of a multi-criteria decision
analysis tool, criteria are developed and used to rate or
score potential team members
293
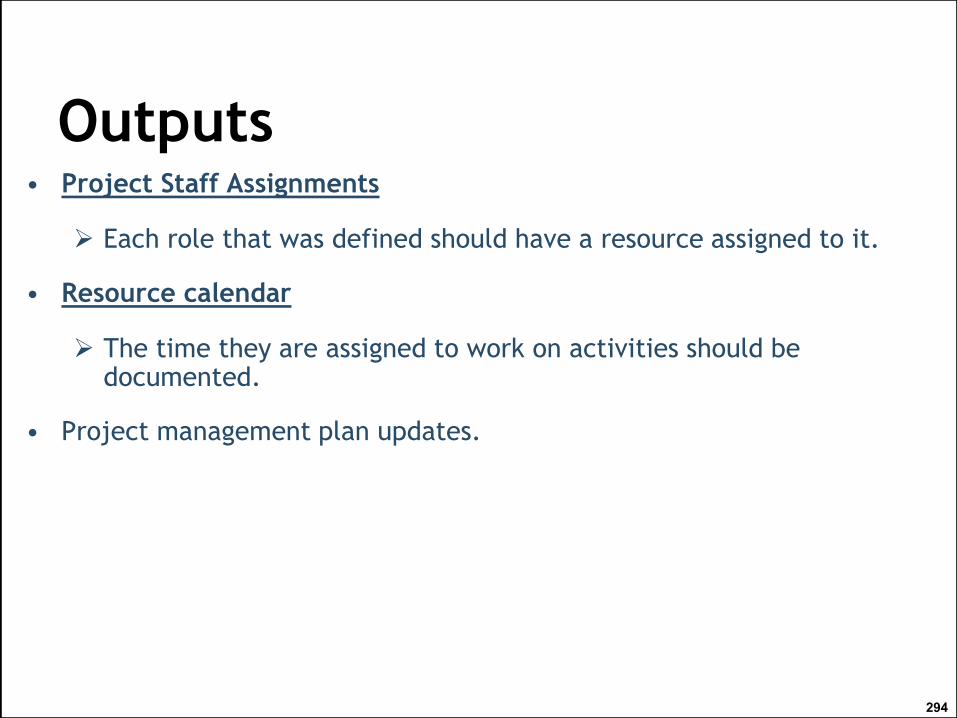
Outputs• Project Staff Assignments
Each role that was defined should have a resource assigned to it.
• Resource calendar
The time they are assigned to work on activities should be documented.
• Project management plan updates.
294
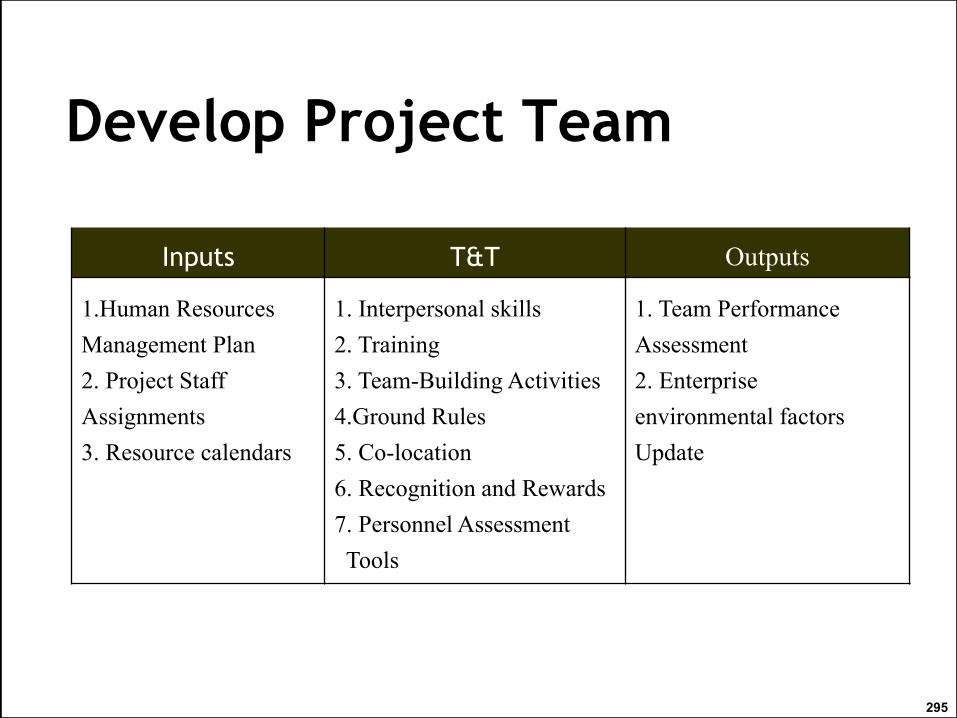
295
Develop Project Team
Inputs T&T Outputs
1.Human Resources
Management Plan
2. Project Staff
Assignments
3. Resource calendars
1. Interpersonal skills
2. Training
3. Team-Building Activities
4.Ground Rules
5. Co-location
6. Recognition and Rewards
7. Personnel Assessment
Tools
1. Team Performance
Assessment
2. Enterprise
environmental factors
Update

Inputs• Human Resource Management
• Project staff assignment
• Resource calendars
296

T&T
• Interpersonal skills
Or what is called “soft skills” like empathy,
creativity, group facilitation, understanding and
sentiments.
• Training
formal or informal training.
• Team building activities
Building relationships among team members by
participating in team problems solving.
In theory there are five stages of development a
team might go through: 297

Team building activities (THE TUCKMAN MODEL)
298

T&T
• Ground Rules
• Co-location (War Room)
• Recognition and Rewards
Desirable behaviors should be rewarded and recognized,
Win-win rewards is the best choices for team building,
Win-lose rewards such a contest where one team member wins and others do not, can be detrimental to the sense of team.
• Personnel Assessment tools
299

Outputs
• Team Performance Assessment
Measuring and evaluating how the team is doing,
E.g., measure the work performance, the experience
the team is acquire.
• EEF updates
300

Manage Project Team
301
• project manager can use five types of power to
influence his team members as follows:
− Formal or Legitimate Power
− Reward Power
− Penalty Power
− Expert Power
− Referent Power
What is the best power of the project manager?
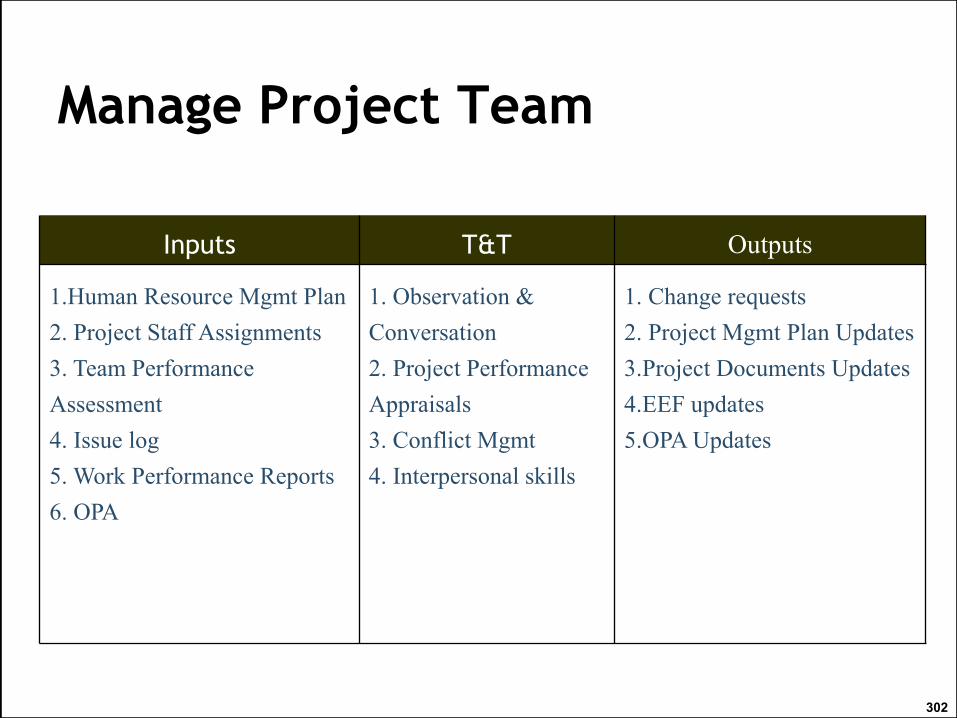
302
Manage Project Team
Inputs T&T Outputs
1.Human Resource Mgmt Plan
2. Project Staff Assignments
3. Team Performance
Assessment
4. Issue log
5. Work Performance Reports
6. OPA
1. Observation &
Conversation
2. Project Performance
Appraisals
3. Conflict Mgmt
4. Interpersonal skills
1. Change requests
2. Project Mgmt Plan Updates
3.Project Documents Updates
4.EEF updates
5.OPA Updates

Inputs
• Human Resource management plans
• Project staff assignments
• Team performance assessment
303

Inputs
• Issue log
An issue log can be used to document and monitor who is
responsible for resolving specific issues by a target date.
• Work Performance reports
• Organizational Process Assets
304
T&T
• Observation and Conversation
• Project Performance Appraisals
PM and other personnel managers on the project
meet the people who report to them on the project
and provide feedback on their performance.
305

T&T• Conflict Management
Conflict occur between individuals or groups on the project, it could occurs between PMs and Functional Managers.
Methods of conflict Management:
306

Continue T&T
• Interpersonal skills
Includes leadership, influencing, and effective decision making.
307
Outputs
• Change requests
• Project management plan update
• Enterprise environmental factors updates
• Organizational Process Assets updates
308

30
9
End

31
0
Communication Management
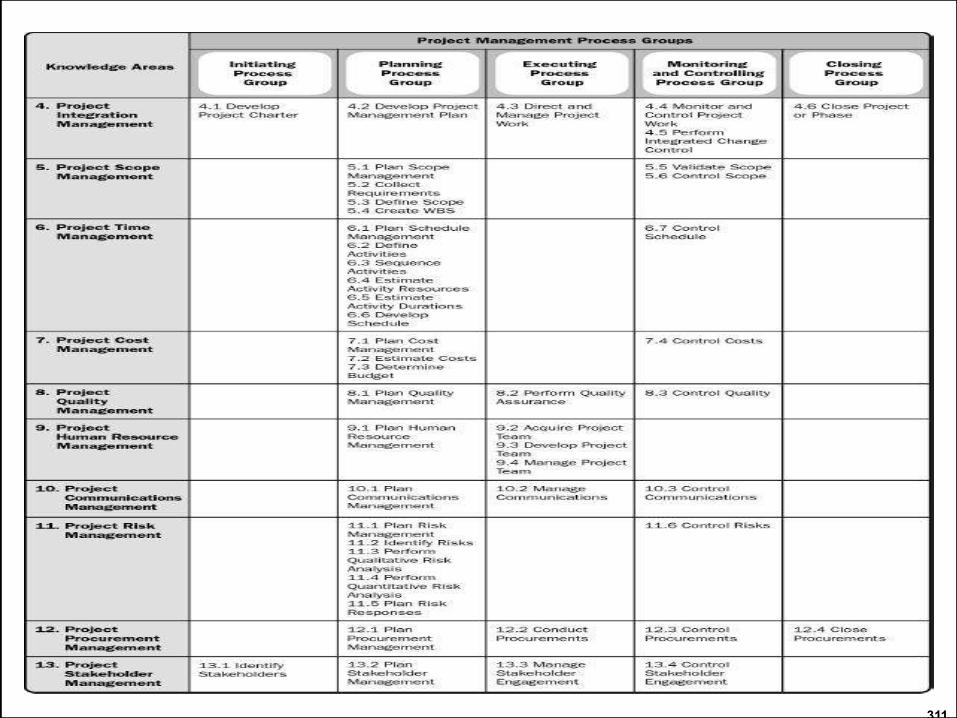
311

312
Communication Management
• All tasks related to producing, compiling, sending,
storing, distributing, and managing project records.
• It is made up of 3 processes to determine what to
communicate, to whom, how often, and when to
reevaluate the plan.
• PMs spend %90-70 of their time communicating with
team members and other project stakeholders.

Communication Type
• Internal and external
• Formal (reports, memos) and informal (emails, ad-hoc
discussions).
• Official (newsletter, annual report) and unofficial (off
the record communications).
• Vertical (up and down the organization) and horizontals
(with peers).
• Verbal and non-verbal (voice inflections, body language).
313

Plan Communication Management
Plan Communications Management is the process of
developing an appropriate approach and plan for project
communications based on stakeholder’s information needs
and requirements, and available organizational assets.
314
Inputs T&T Outputs
1.Project Management Plan.
2.Stackholders register.
3.EEF.
4.OPA.
1.Communication Requirement
analysis.
2. Communication technology
3. Communication Model.
4. Communication Method
5. Meetings
1- Communication
Management Plan
Inputs
• Project Management Plan
• Stakeholder register
• Enterprise Environmental Factors
• Organizational Process Assets
315
T&T
• Communication Requirements Analysis
PM should consider the number of communication
Channels or paths as an indicator of the complexity
of a project’s communication,
Channels = n(n-1)/2 where n=no. of people
316

317
318
T&T
• Communications Technology
The right tool should be selected for a given
communications need.
Factors that can affect the project include:
Urgency of the need for information.
Availability of technology.
Ease of Use.
Project Environment.
Sensitivity and confidentiality of the information.

T&T• Communication Models
319
Communication Models
The sender is responsible for:
Encode the message clearly
Select a communication method
Send the message
Confirm that it was understood from the
receiver
The receiver is responsible for:
Decode the message
Confirm that the message was understood
320

T&T
• Communication Methods
Interactive communication: Phone, Meeting
Push communications : Email
Pull communications : Shared Files
• Meetings
321

Outputs• Communications Management Plan
In addition to what was described, the communication
plan must Identify the project documents that will be
created during the course of the project and define
how these documents will be shared and archived,
322

Outputs
• Communication Management Plan include:
Stakeholder communication requirements.
Information to be communicated, including
language, format, content, and level of detail.
Reasons for the distribution of that information.
Time frame and frequency for the distribution of
the required information.
Person responsible for communicating the
information.
323

• Communication Management Plan include:
Methods or technology used to convey the information.
Escalation process.
Methods for updating and refining the communications
management plan.
Communication constraints.
It can also include guidelines and templates for project
status meetings, project team meetings, e-meetings,
and e-mail.
324

Outputs
• Project Document Updates
Project schedule,
Stakeholder register.
325

Manage communications Manage Communications is the process of creating,
collecting, distributing, storing, retrieving, and the ultimate
disposition of project information in accordance to the
communications management plan.
326
Inputs T&T Outputs
1- Communication
Management Plan
2.Work performance Reports
3.EEF.
4.OPA.
1. Communication technology
2. Communication Model.
3. Communication Method
4. Information Management Sys.
5.Performance Reporting.
1.Project Communications
2. Project Management Plan
updates.
3. Project documents updates
4. OPA Updates

327
Inputs • Communication Management Plan
• Work Performance Reports
• Enterprise Environmental Factors
• Organizational Process Assets

T&T
• communication technology
• communication Models
• communication Methods
• Information Management Systems
• Performance reporting
328
Outputs
• Project communications
The Manage Communications process involves the activities
that are required for information to be created, distributed,
received, acknowledged, and understood.
• Project Management Plan updates
• Project documents updates
• Organizational Process Assets updates
329

Control Communications
Control Communications is the process of monitoring and
controlling communications throughout the entire project
life cycle to ensure the information needs of the project
stakeholders are met.
330
Inputs T&T Outputs
1. Project Management Plan.
2.Comm. Management Plan.
3.Issue Log.
4.Work performance data.
5.OPA.
1. Information Management Sys.
2.Expert Judgement.
3.Meeting.
1. Work Performance
Information.
2. Change requests
3. Project Management Plan
updates.
4. Project documents updates
5. OPA Updates

Inputs
• Project Management Plan
• Project communications
• Issue Log
Or also called action item log can be used to document
and monitor the resolution of issues.
Can be used to facilitate communication and ensure a
common understanding of issues.
• Work Performance data
• Organizational Process Assets
331

T&T
• Information Management Systems
• Expert Judgment
• Meetings
332

Outputs
• Work Performance Information
• Change Requests
• Project Management Plan Updates
• Project Document Updates
• Organizational Process Assets Updates
333

END
334

33
5
Risk Management

336

337
Risk Management
• The PM is in control and proactively managing events, avoiding
as many problems as possible,
• The PM must understand how to anticipate and identify areas
of risks, how to quantify and qualify them, and how to plan
for them,
• Risk has two characteristics:
It is related to an uncertain events.
May affect the project for good or for bad.
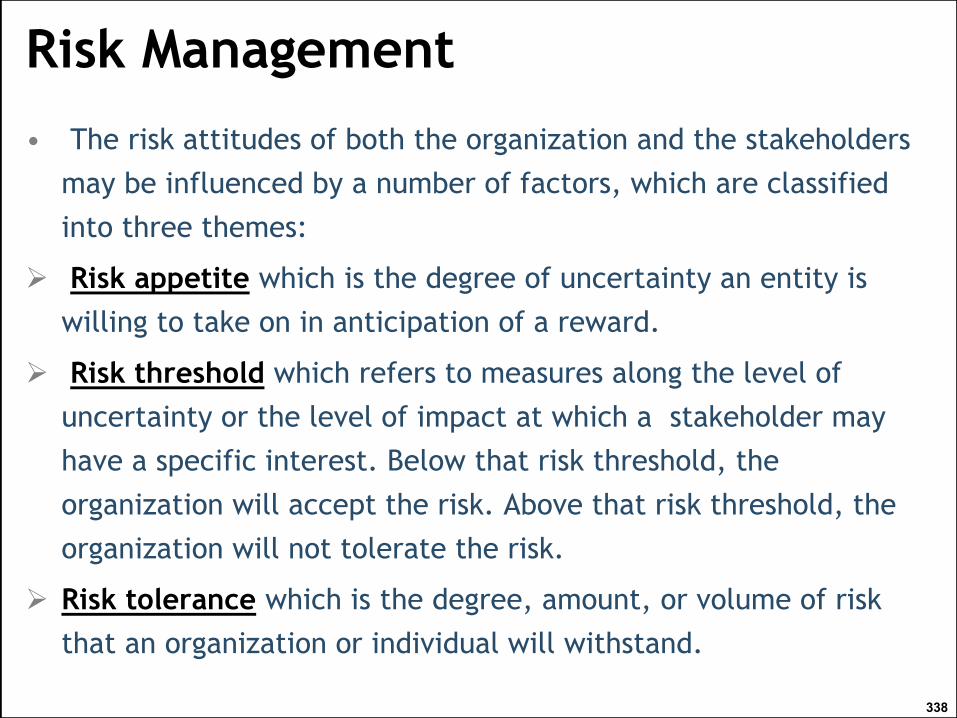
Risk Management
• The risk attitudes of both the organization and the stakeholders
may be influenced by a number of factors, which are classified
into three themes:
Risk appetite which is the degree of uncertainty an entity is
willing to take on in anticipation of a reward.
Risk threshold which refers to measures along the level of
uncertainty or the level of impact at which a stakeholder may
have a specific interest. Below that risk threshold, the
organization will accept the risk. Above that risk threshold, the
organization will not tolerate the risk.
Risk tolerance which is the degree, amount, or volume of risk
that an organization or individual will withstand.
338

339
Plan Risk Management
Inputs T&T Outputs
1.Project Management Plan
2. Project Charter
3. Stakeholder Register
4. Enterprise Environmental Factors
5. Org .Process Assets
1. Analytical techniques
2. Expert judgment
3. Meetings
1. Risk Mgmt Plan
Again Analytical techniquesEnable PM to examine complex relationships between variables

340
Inputs
• Project Management Plan
• Project Charter
• Stakeholder register
• EEF
• OPA
341
T&T
• Analytical Techniques
• Expert Judgment
• Meetings

342
Outputs
• Risk Management Plan
Methodology: define approach, tools and data sources used for risk management.
Roles and responsibilities: How risk will be managed and by whom.
Budgeting.
Timing.
Categorize:
Definition of Risk probability and impact.

Probability and impact matrix.
Revised stakeholders’ tolerances.
Reporting formats.
Tracking
343
Risk Management Plan Include also:
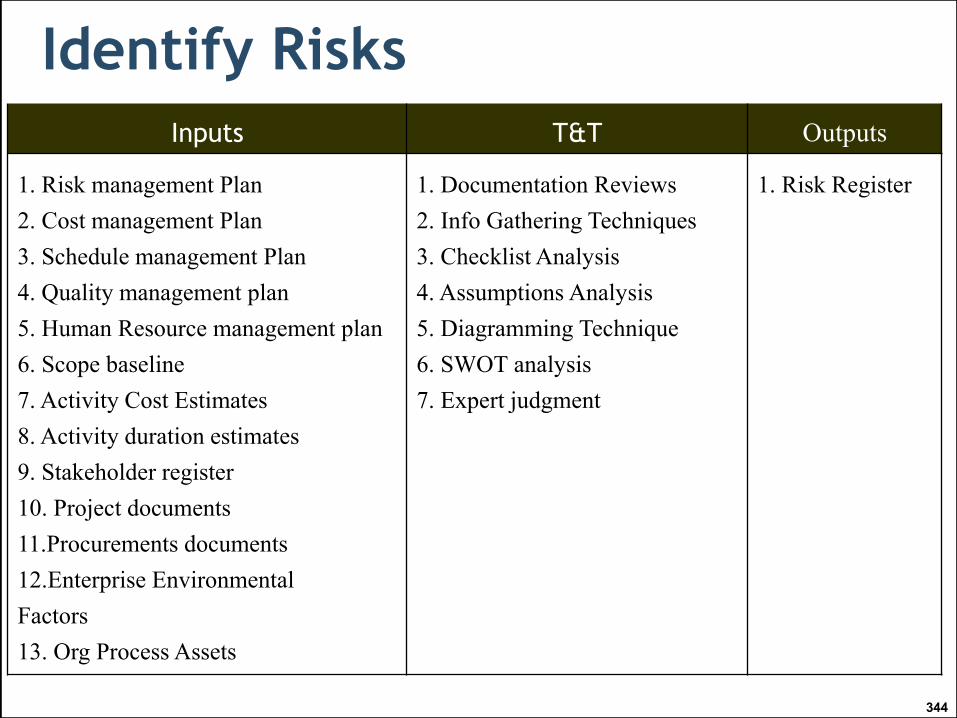
344
Identify Risks
Inputs T&T Outputs
1. Risk management Plan
2. Cost management Plan
3. Schedule management Plan
4. Quality management plan
5. Human Resource management plan
6. Scope baseline
7. Activity Cost Estimates
8. Activity duration estimates
9. Stakeholder register
10. Project documents
11.Procurements documents
12.Enterprise Environmental
Factors
13. Org Process Assets
1. Documentation Reviews
2. Info Gathering Techniques
3. Checklist Analysis
4. Assumptions Analysis
5. Diagramming Technique
6. SWOT analysis
7. Expert judgment
1. Risk Register

345
Inputs
• Risk management plan
• Cost management plan
• Schedule management plan
• Quality management plan
• Human resource management plan
• Scope baseline
• Activity Cost estimates
• Activity duration estimates
• Stakeholder register

346
Continue Inputs
• Project documents
• Procurement documents
If the project requires external procurement of
resources, procurement documents become a key
input to the Identify Risks process.
• EEF
• 0PA

347
T&T• Documents reviews
• Information Gathering Technique
Brainstorming , Delphi technique, Interviewing, Root Cause analysis.
• Checklist Analysis
Risk identification checklists are developed based on
historical information and knowledge that has been
accumulated from previous similar projects and from
other sources of information.
• Assumptions Analysis
Assumptions should be analyzed and documented and
challenged if necessary.

348
Continue T&T• Diagramming technique
Cause-and-effect or Ishikawa
System or process flow charts
• SWOT Analysis (Strength, Weakness, Opportunity, and Threat)
SWOT Analysis, used to measure each risk’s strengths, weaknesses, opportunities, and threats.
It helps specify the most significant project risk factor.
• Expert Judgement
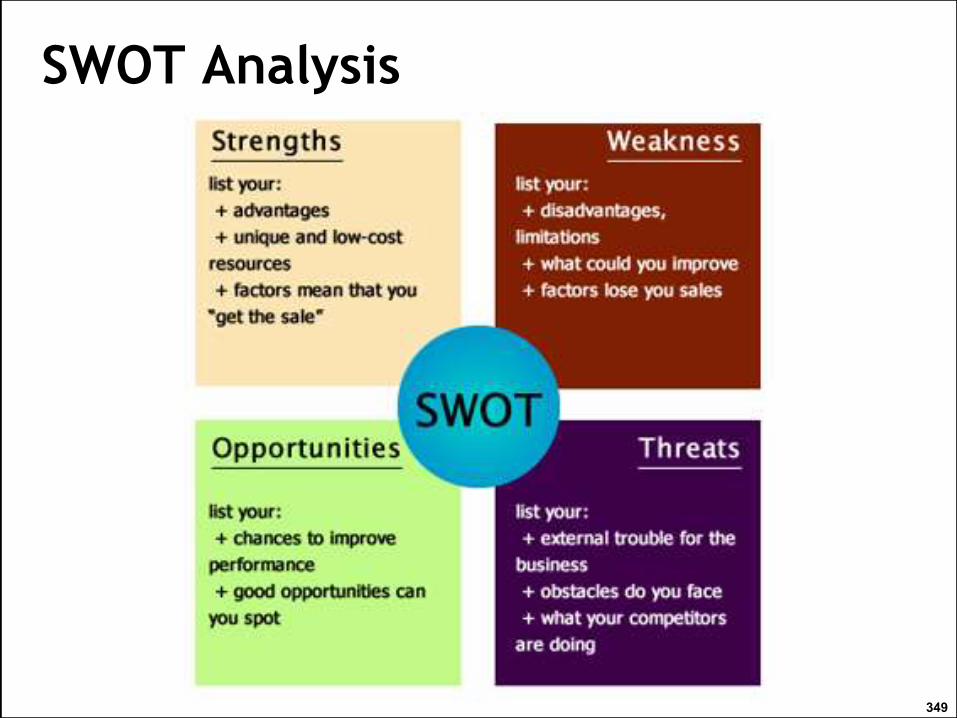
SWOT Analysis
349

350
Outputs
• Risk Register
Provides a list of all identified risks on the
project.
List of Potential response.
What the possible actions to this risk are.
What categories the risks fall into.
To update the RBS.

351
Risk Register

Inputs
• Risk management plan
• Scope Baseline
• Risk Register
• Enterprise Environmental factors
• Organization process assets
352

353
T&T
• Risk Probability and Impact Assessments/
Probability and Impact Matrix
To determine what the highest priorities, can be assesses by meetings or interviews with experts of risk categories.
Each risk in the risk register is evaluated for its likelihood of occurring and its potential impact on the project.

Risk Probability and Impact Assessments
354

355
T&T• Risk Data Quality Assessment
The data used should be evaluated to determine whether or not it is
accurate and of acceptable quality.
• Risk Categorization
Can be categorized in many ways (i.e:RBS or by project phases)
• Risk Urgency Assessment
Risks that cannot wait,
Determine which risks are the most urgent, requiring immediate
attention.
• Expert judgment
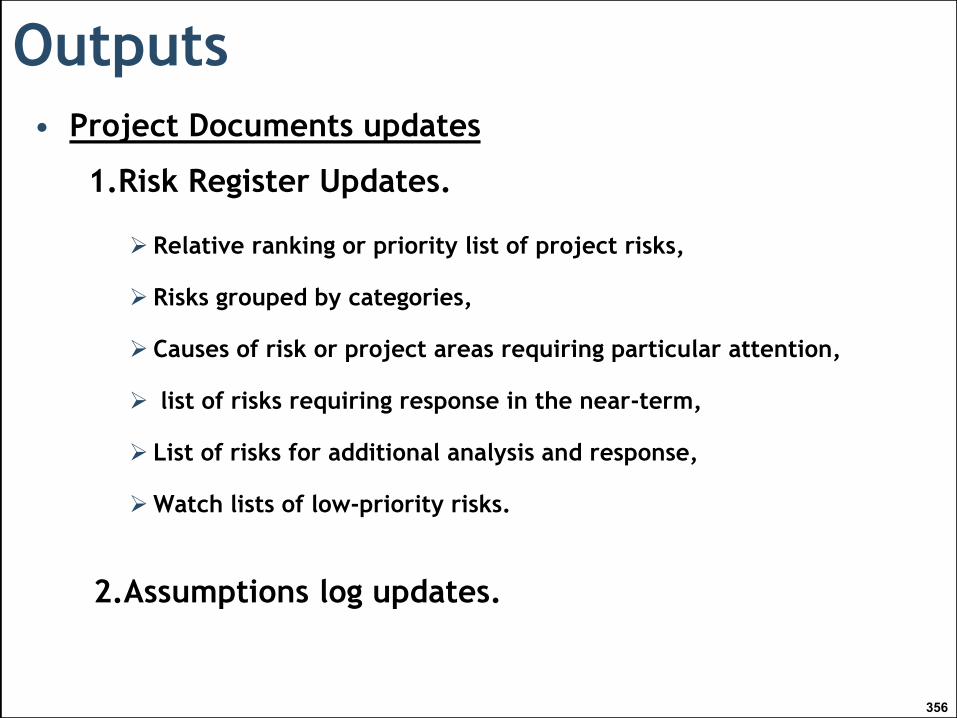
Outputs
• Project Documents updates
1.Risk Register Updates.
Relative ranking or priority list of project risks,
Risks grouped by categories,
Causes of risk or project areas requiring particular attention,
list of risks requiring response in the near-term,
List of risks for additional analysis and response,
Watch lists of low-priority risks.
2.Assumptions log updates.
356

357
Perform Quantitative Risk Analysis
• Assigns a projected value to (quantify) the risks that
have been ranked by qualitative risk analysis.
• This value is specified in terms of cost or time.
Inputs T&T Outputs
1. Risk Mgmt Plan
2. Cost Mgmt plan
3. Schedule Mgmt plan
4. Risk Register
5. EEF
6. OPA
1. Data Gathering and
Representation Techniques
2. Quantitative Risk Analysis
and Modeling Techniques
3. Expert Judgment
1. Project documents
updates
358
Inputs
• Risk management plan.
• Cost management plan.
• Schedule management plan
• Risk register
• Enterprise Environmental Factors
• Organization process assets

359
T&T
• Data Gathering and Representation Techniques
Interviewing - Experts Judgment - Probability distribution.
• Quantitative Risk Analysis & Modeling Techniques
Sensitivity Analysis: analyze the project and determine how sensitive it is to risk.
Tornado Diagrams: analyse project sensitivity to cost or to other factors.

360
Impact Cost Time Quality
Very low Variations manageable by
virement against internal budget
headings
Slight slippage against internal
targets
Slight reduction in quality/scope
with no overall impact on
usability/standards
Low Requires some additional funding
from organisation
Slight slippage against key
milestones or published targets
Failure to include certain ‘nice to
have’ elements or ‘bells and
whistles’ promised to stakeholders
Medium Requires significant additional
funding from organisation
Delay affects key stakeholders
and causes loss of confidence in
the project
Significant elements of scope or
functionality will be unavailable
High Requires significant reallocation of
organisation funds (or borrowing)
to meet project objectives
Failure to meet key deadlines in
relation to the academic year or
strategic plan
Failure to meet the needs of a
large proportion of stakeholders
Very high Increases threaten viability of
project
Delay jeopardises viability of
project
Project outcomes effectively
unusable

Tornado Diagrams
361

Quantitative Risk Analysis & Modeling Tech.
Expected Monetary Value Analysis EMV.
Decision Tree Analysis: used to show probability
and arrive at a dollar amount associated with each
risk.
362

Example
363
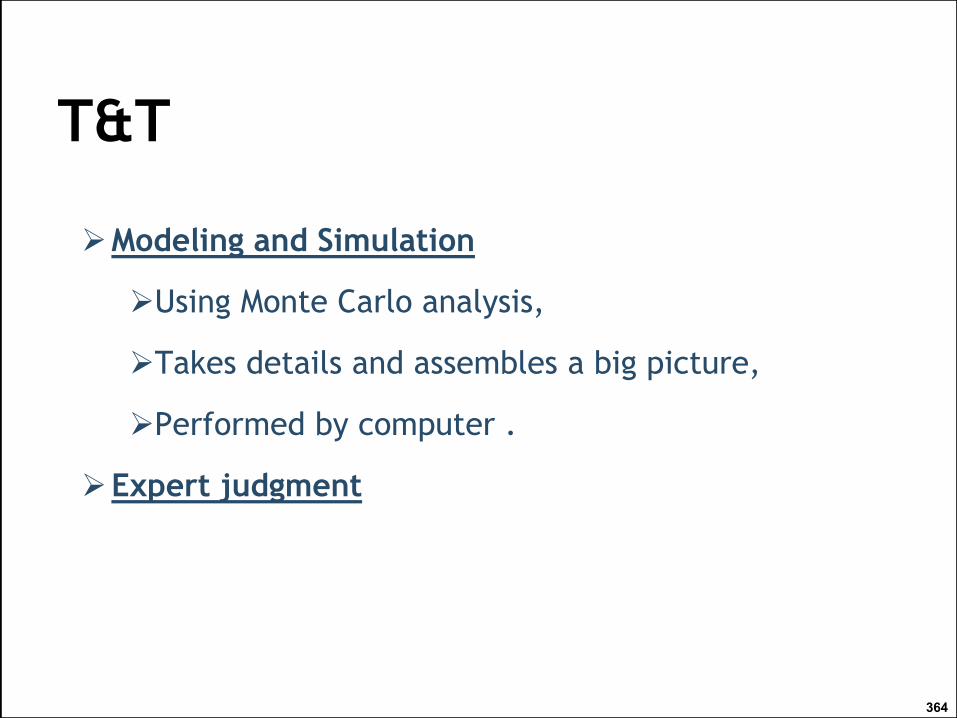
364
T&T
Modeling and Simulation
Using Monte Carlo analysis,
Takes details and assembles a big picture,
Performed by computer .
Expert judgment
Outputs
• Project documents updates
Project documents are updated with information resulting
from quantitative risk analysis.
365

366
Plan Risk Response
Inputs T&T Outputs
1. Risk Mgmt. Plan
2. Risk Register
1.Strategies for Negative Risks or
Threats
2. Strategies for Positive Risks
or Opportunities
3. Contingent Response Strategies
4. Expert Judgment
1. Project Mgmt Plan Updates
2. Project document updates

367
Inputs
• Risk management plan
• Risk register

368
T&T
• Strategies for Negative Risks or Threats
Avoid : appropriate for undesirable risk
Transfer : transfer it to another party (Transferee the loss associated with risks to a third party) and make him responsible (e.g. insurance),
Mitigate : make it less, minimizing the probability and impact of risks to acceptable level (e.g. construct outside rainy season).

T&T
• Strategies for Positive Risks or Opportunities
Exploit: trying to remove any uncertainty. Finishing the project early, adding more people to complete early
Share : working with another party how can better utilize the opportunity.
Enhance: seek to increase the opportunity probability.
369
T&T
• Contingent Response Strategy
The project team may make one decision related to risk, but make that decision contingent upon certain conditions.
E.g. mitigate a technology risk by hiring an outside firm with expertise, but that decision my be contingent upon the outside firm meeting intermediate milestones related to that risk.
• Expert judgment.
370
Outputs
• Risk Management Plan Updates
• Project Document Updates.
371

372
Control Risk
Inputs T&T Outputs
1. Project Mgmt Plan
2. Risk Register
3. Work Performance
data
4. Performance
Reports
1. Risk Reassessment
2. Risk Audits
3. Variance and Trend
Analysis
4. Technical Performance
Measurement
5. Reserve Analysis
6. Meetings
1. Work performance Info
2. Change requests
3. Project Mgmt Plan Updates
4. Project document updates
5. Org Process Assets Updates

373
Inputs
• Project management plan.
• Risk register
• Work performance data
• Work Performance reports
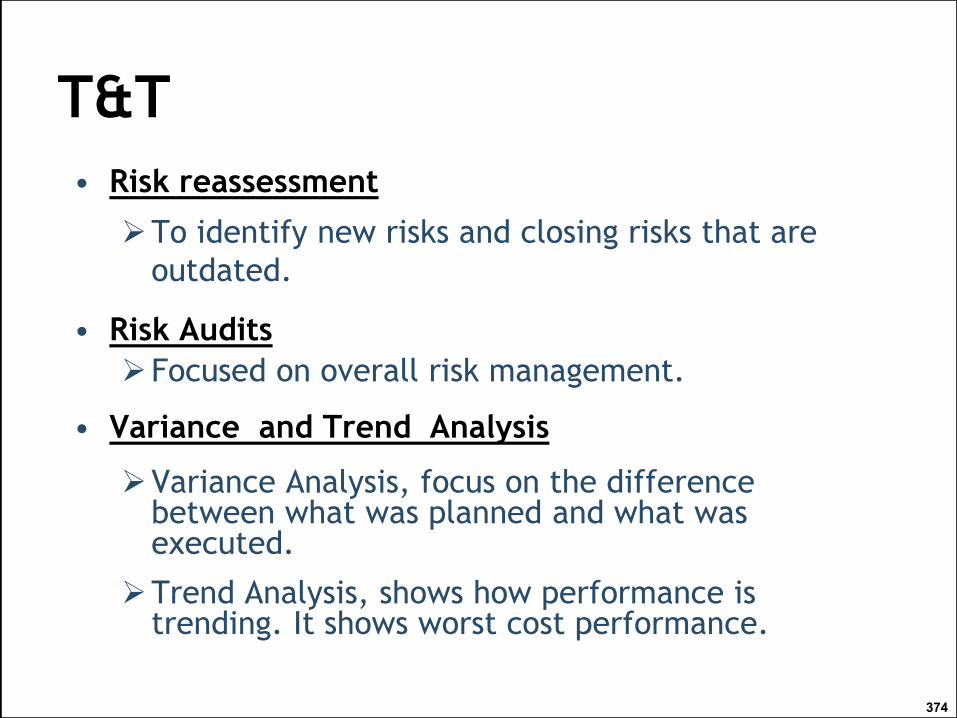
374
T&T
• Risk reassessment
To identify new risks and closing risks that are
outdated.
• Risk Audits
Focused on overall risk management.
• Variance and Trend Analysis
Variance Analysis, focus on the difference between what was planned and what was executed.
Trend Analysis, shows how performance is trending. It shows worst cost performance.
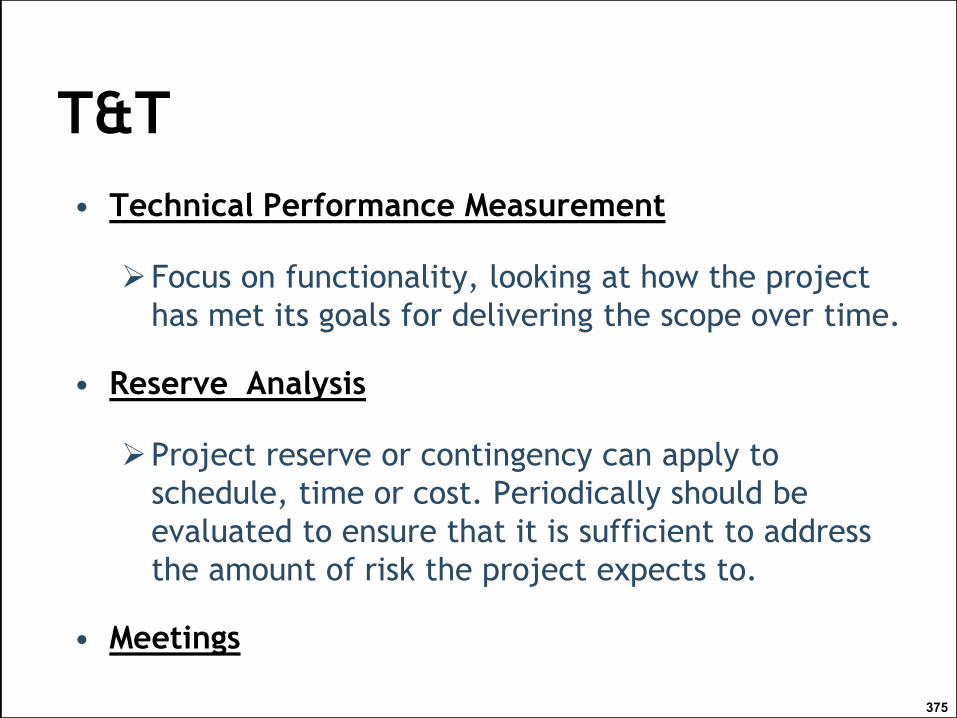
375
T&T
• Technical Performance Measurement
Focus on functionality, looking at how the project
has met its goals for delivering the scope over time.
• Reserve Analysis
Project reserve or contingency can apply to
schedule, time or cost. Periodically should be
evaluated to ensure that it is sufficient to address
the amount of risk the project expects to.
• Meetings

Outputs
376
• Work Performance Information
• Change requests
• Project management plan updates
• Project document updates.
• Organizational process assets updates

37
7
End
37
8
Procurement Management

379

380
Procurement Management
Processes performed to obtain goods, services, or
scope from outside the organization.
• There are two Procurement primary roles:
Buyer: the organization purchasing or procuring the goods or services from the seller.
Seller: the organization providing or delivering the goods or services to the buyer.

Procurement Management
Contracts could take one of Three types:Firm Fixed Price Contracts
Firm Fixed Price (FFP)
Fixed Price Incentive Fee (FPIF)
Fixed Price Economic Price Adjustment (FPEPA)
Cost Reimbursable Contracts (CR)
Cost Plus Fixed Fee (CPFF)
Cost Plus Incentive Fee Contracts (CPIF)
Cost Plus Award Fee Contracts (CAF)
Time and Material Contracts (T&M)
Marge of above two contracts types.
381

Procurement Management
• Who bears the risk of each contract type?
382
WHO PEARS RISKCONTRACT TYPE
SELLERFirm Fixed Price Contracts
BUYERCost Plus Fixed Fee (CPFF)
SELLER AND BUYERCost Plus Incentive Fee Contracts (CPIF)
SELLER AND BUYERCost Plus Award Fee Contracts (CAF)
BUYERTime and Material Contracts (T&M)

383
Plan Procurement
Inputs T&T Outputs
1. Project Management Plan
2. Requirements documentation
3. Risk register
4. Activity resource requirements
5. Project schedule
6. Activity cost estimates
7. Stakeholder Register
8. Enterprise Environmental
Factors
9. Org Process Assets
1. Make-or-Buy
Analysis
2. Expert Judgment
3. Market Research
4. Meetings
1. Procurement Mgmt Plan
2. Procurement statements
of work
3. Procurement documents
4. Source selection criteria
5. Make-or-Buy Decisions
6. Change requests
7.Project documents updates

384
T&T
• Make-or-Buy Analysis
Look at all of the factors that could sway the decision toward making internally or buying externally, including risk factors, costs, releasing proprietary info, and a host of other decision pointing.
• Expert judgment
• Market Research
• Meetings
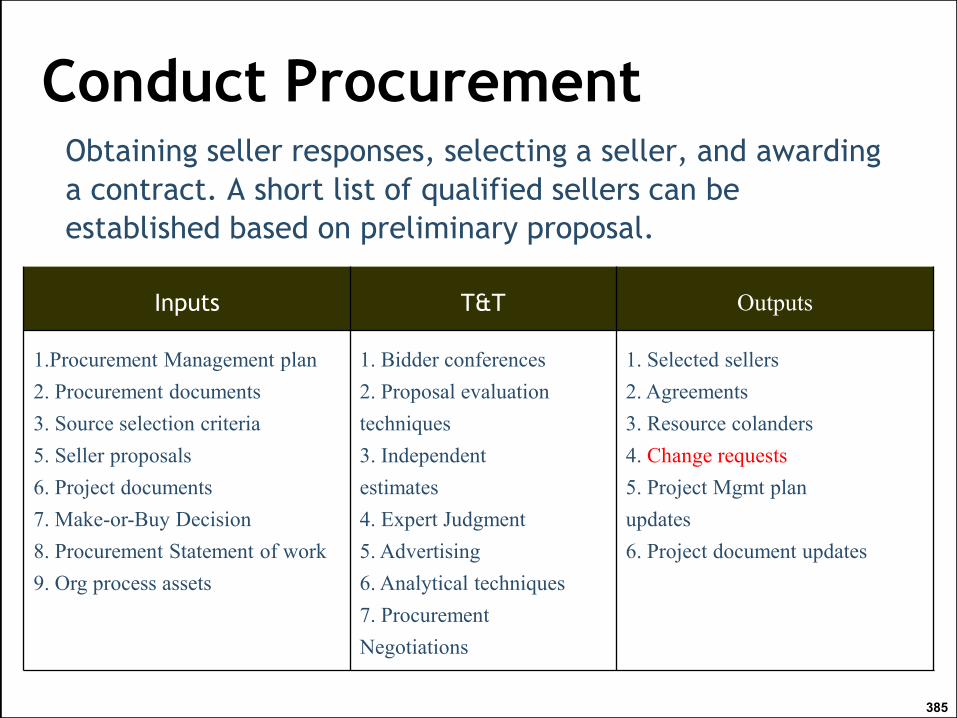
385
Conduct ProcurementObtaining seller responses, selecting a seller, and awarding
a contract. A short list of qualified sellers can be
established based on preliminary proposal.
Inputs T&T Outputs
1.Procurement Management plan
2. Procurement documents
3. Source selection criteria
5. Seller proposals
6. Project documents
7. Make-or-Buy Decision
8. Procurement Statement of work
9. Org process assets
1. Bidder conferences
2. Proposal evaluation
techniques
3. Independent
estimates
4. Expert Judgment
5. Advertising
6. Analytical techniques
7. Procurement
Negotiations
1. Selected sellers
2. Agreements
3. Resource colanders
4. Change requests
5. Project Mgmt plan
updates
6. Project document updates
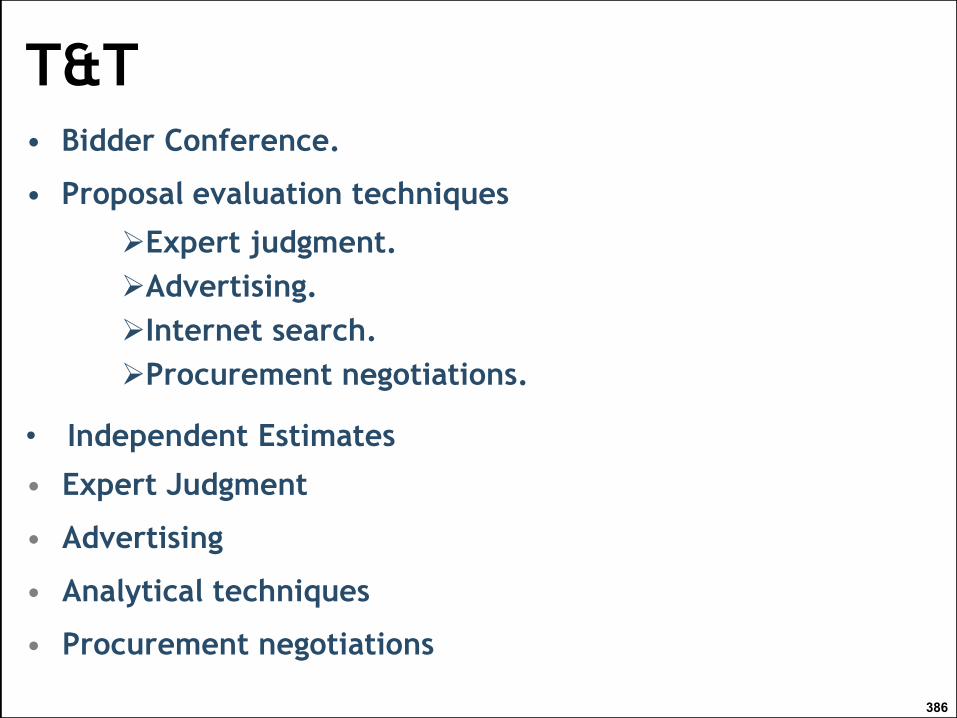
T&T• Bidder Conference.
• Proposal evaluation techniques
Expert judgment.
Advertising.
Internet search.
Procurement negotiations.
• Independent Estimates
• Expert Judgment
• Advertising
• Analytical techniques
• Procurement negotiations
386

387
Control Procurement
Inputs T&T Outputs
1. Procurement Mgmt Plan
2. Procurement Documents
3. Agreements
4. Approved change requests
5. Work Performance reports
6. Work performance Data
1. Contract change control system
2. Procurement performance reviews
3. Inspections and audits
4. Performance reporting
5. Payments systems
6. Claims administration
7. Records mgmt system
1.Work Performance info
2.Change requests
3. Project mgmt plan Updates
4. Project documents updates
5. Org process assets Updates

T&T
• Contract change control system.
• Procurement performance reviews.
• Inspections and audits.
• Performance reporting.
• Payments systems.
• Claims administration.
• Record management system.
388

389
Close Procurement
Inputs T&T Outputs
1. Project Mgmt Plan
2. Procurement
Documentation
1. Procurement Audits
2. Procurements negotiations
3. Records Mgmt System
1. Closed procurements
2. Org Process Assets Updates

390
T&T
• Procurement Audits.
• Procurements negotiations.
• Record Management System.

39
1
End
39
2
Stakeholders Management

393

Identify Stakeholders
394
Inputs T&T Outputs
1. Project Charter
2. Procurement Documents
3. EEF
4. OPA
1. Stakeholder Analysis
2. Expert Judgment
3. Meetings
1. Stakeholder Register

T&T
• Stakeholder Analysis
Influence/impact grid: Grouping the stakeholders based on
their active involvement (“influence”) in the project and their
ability to effect changes to the project’s planning or
execution (“impact”) in the project.
395

Outputs
• Stakeholder Register
Contains all details related to the identify stakeholders
including, but not limited to:
Identification information: name, organizational
position, location, role in the project, contact
information
Assessment information: major requirements, main
expectations, potential influence in the project, phase
in the life cycle with the most interest, and
Stakeholder classification: internal/external,
supporter, natural, resistor, etc.
396
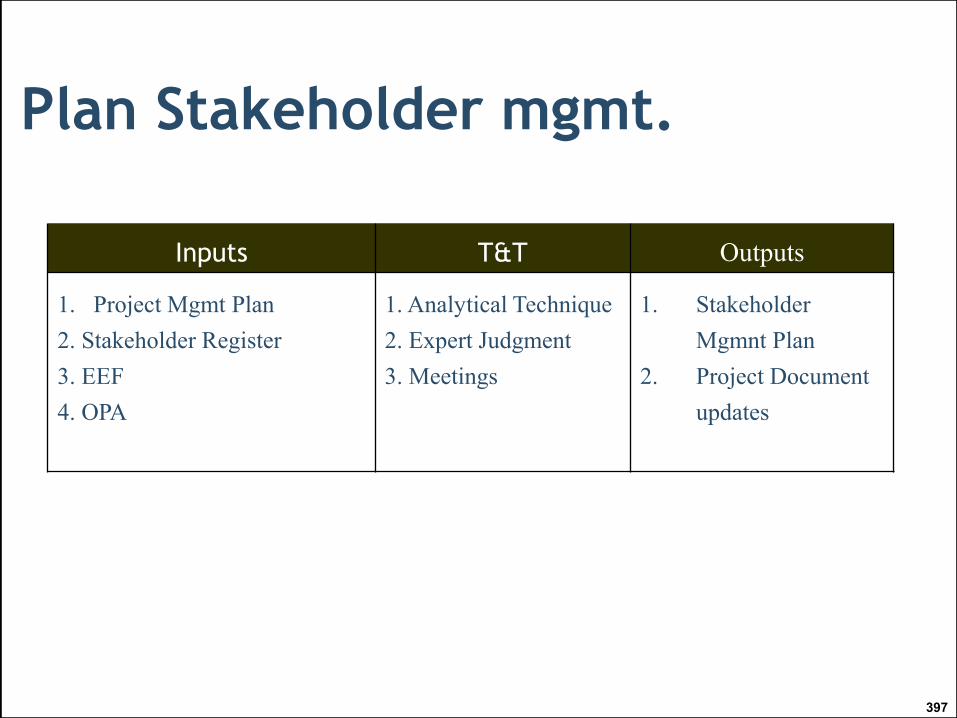
397
Plan Stakeholder mgmt.
Inputs T&T Outputs
1. Project Mgmt Plan
2. Stakeholder Register
3. EEF
4. OPA
1. Analytical Technique
2. Expert Judgment
3. Meetings
1. Stakeholder
Mgmnt Plan
2. Project Document
updates

• Expert Judgment
• Meetings
• Analytical techniques
The engagement level of the stakeholders can be classified as
follows:
Unaware.
Resistant.
Neutral.
Supportive.
Leading.
398
T&T
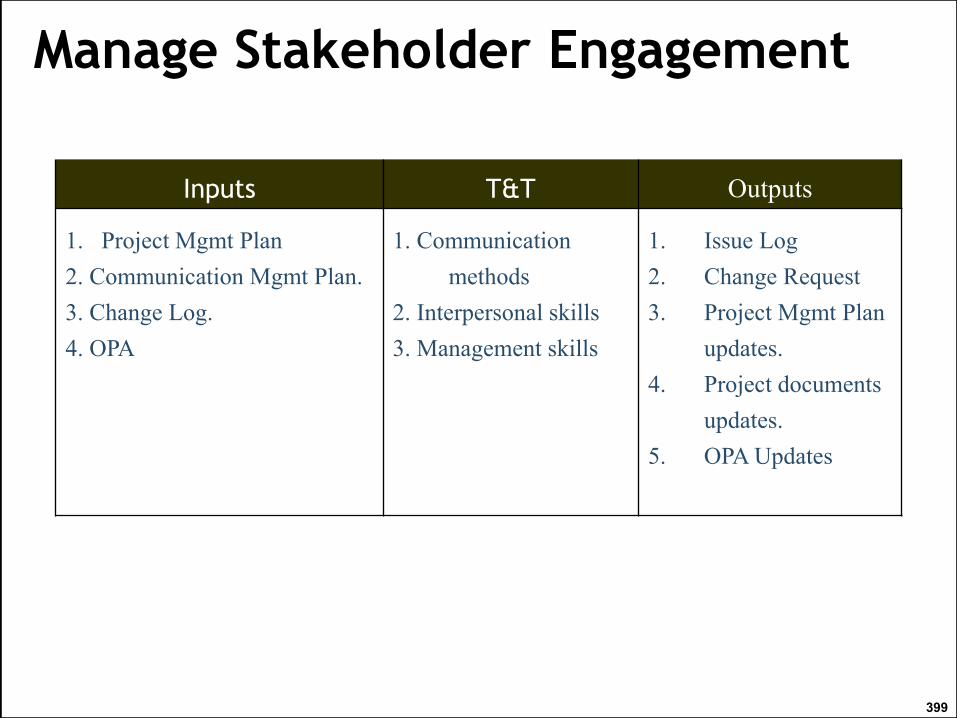
Manage Stakeholder Engagement
399
Inputs T&T Outputs
1. Project Mgmt Plan
2. Communication Mgmt Plan.
3. Change Log.
4. OPA
1. Communication
methods
2. Interpersonal skills
3. Management skills
1. Issue Log
2. Change Request
3. Project Mgmt Plan
updates.
4. Project documents
updates.
5. OPA Updates

T&T
• Communication Methods
• Interpersonal Skills
• Management Skills
400
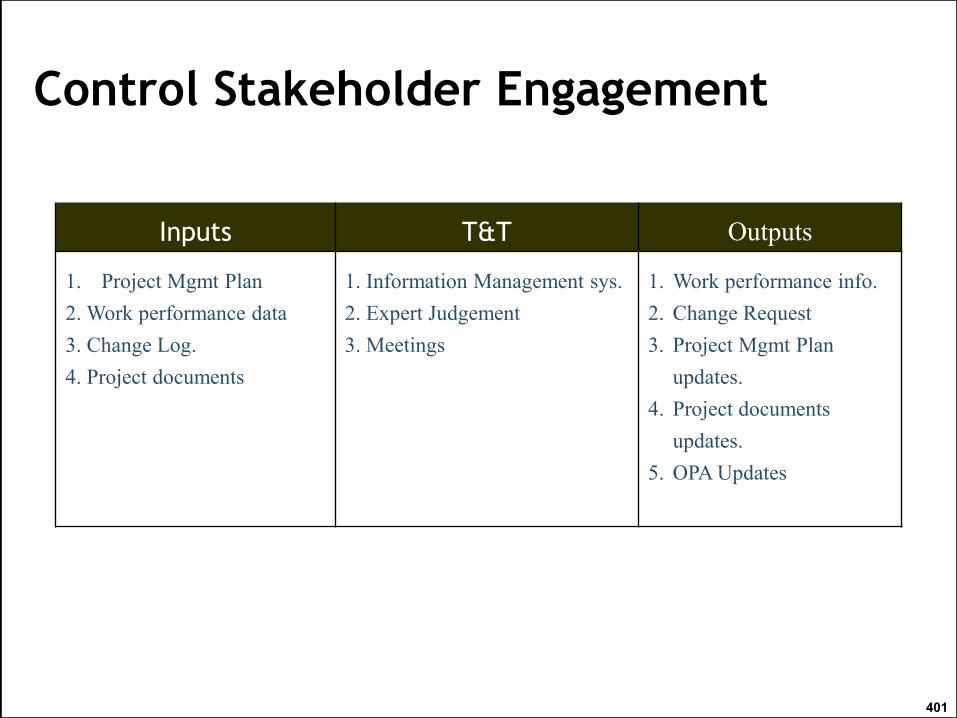
Control Stakeholder Engagement
401
Inputs T&T Outputs
1. Project Mgmt Plan
2. Work performance data
3. Change Log.
4. Project documents
1. Information Management sys.
2. Expert Judgement
3. Meetings
1. Work performance info.
2. Change Request
3. Project Mgmt Plan
updates.
4. Project documents
updates.
5. OPA Updates

40
2
End