RETORNO POTENCIAL DE NUTRIMENTOS POR … · RESUMEN La caída de hojarasca es un mecanismo muy...
18
ARTÍCULO / ARTICLE RETORNO POTENCIAL DE NUTRIMENTOS POR COMPONENTES SECUNDARIOS DE LA HOJARASCA EN COMUNIDADES VEGETALES DE NUEVO LEÓN POTENTIAL NUTRIENT RETURN BY SECONDARY COMPONENTS OF LITTER IN VEGETAL COMMUNITIES OF NUEVO LEÓN STATE Israel Cantú Silva 1 , Laura Rosa Margarita Sánchez Castillo 2 , Humberto González Rodríguez 1 , Tetsuya Kubota 2 , Marco Vinicio Gómez Meza 3 y Tilo Gustavo Domínguez Gómez 1 RESUMEN La caída de hojarasca es un mecanismo muy importante en el ciclo de nutrientes de un ecosistema, por lo cual el objetivo del presente estudio fue determinar el retorno potencial de Ca, K, Mg y P y de micronutrimentos (Cu, Fe, Mn y Zn) a través de las estructuras reproductivas, ramas, corteza e insectos en cuatro comunidades vegetales del noreste de México. La hojarasca se recolectó en tres sitios del Matorral Espinoso Tamaulipeco (Crucitas, Campus y Cascajoso), y uno de bosque de pino-encino (Bosque Escuela), con intervalos de 15 días entre 2006 y 2007. En cada lugar se estableció una parcela (50 m x 50 m) con 10 trampas (1 m 2 ). El calcio (138 kg ha -1 año -1 ) y fierro (372 g ha -1 año -1 ) son los elementos que más reciclan los componentes secundarios. El orden en la deposición de macronutrimentos se presentó de la siguiente manera Ca > Mg > K > P, mientras que para micronutrientes fue Fe > Mn > Zn > Cu. El aporte total de estos últimos a los componentes secundarios (Cu+Fe+Mn+Zn) para el Bosque Escuela, Crucitas, Campus y Cascajoso fue de 362.9, 588.5, 234.9 y 218.3 g ha -1 año -1 , respectivamente. El correspondiente a micronutrimentos para todos los componentes secundarios representó de 93 a 99% del total de la deposición anual, en los que estos fueron la fuente principal de retorno potencial en los cuatro sitios investigados, mientras que las hojas no constituyen un elemento de aporte importante en el retorno de Cu, Fe, Mn y Zn. Palabras claves: Bosque de encino, bosque de pino, componentes secundarios de la hojarasca, deposición de hojarasca, Matorral Espinoso Tamaulipeco, retorno de nutrimentos. ABSTRACT Litter fall is an important process of nutrient cycling in an ecosystem, for the aim of the actual study was to determine the potential return of Ca, K, Mg and P and of micronutrients (Cu, Fe, Mn and Zn) through the reproductive structures, branches, bark and insects, in four vegetal communities of northeastern Mexico. Litter was collected in three sites of the Tamaulipan Thornscrub (Crucitas, Campus and Cascajoso) and one in the pine-oak forest (Bosque Escuela of the Universidad Autónoma de Nuevo León), with intervals of 15 days between the years 2006 and 2007. In each place was placed a plot (50 m x 50 m) with 10 traps (1 m 2 ). Calcium (138 kg ha- 1 year- 1 ) and iron (372 g ha- 1 year- 1 ) are the mostly recycled elements by the secondary components. The order followed in the deposition of macronutrients was Ca > Mg > K > P, while for micronutrients was Fe > Mn > Zn > Cu. The total contribution of the latter to the secondary components (Cu+Fe+Mn+Zn) for the Bosque Escuela, Crucitas, Campus and Cascajoso was 362.9, 588.5, 234.9 y 218.3 g ha- 1 year- 1 , respectively. The corresponding to micronutrients for all the secondary components was 93 to 99% of the total annual deposition, en which they were the major source of potential return in the four researched sites, while leaves do not represent an important provision in the return of Cu, Fe, Mn and Zn. Key words: Oak forest, pine forest, secondary litter components, litter deposition, Tamaulipan Thornscrub, nutrient return. Fecha de recepción: / date of receipt: 4 de febrero de 2013. Fecha de aceptación / date of acceptance: 5 de abril de 2013. 1 Facultad de Ciencias Forestales, Universidad Autónoma de Nuevo León. Correo-e: [email protected] 2 Facultad de Agricultura, Universidad de Kyushu, Japón. 3 Facultad de Economía, Universidad Autónoma de Nuevo León.
-
Upload
nguyenkien -
Category
Documents
-
view
214 -
download
0
Transcript of RETORNO POTENCIAL DE NUTRIMENTOS POR … · RESUMEN La caída de hojarasca es un mecanismo muy...

ARTÍCULO / ARTICLE
RETORNO POTENCIAL DE NUTRIMENTOS POR COMPONENTES SECUNDARIOS DE LA HOJARASCA EN COMUNIDADES VEGETALES DE NUEVO LEÓN
POTENTIAL NUTRIENT RETURN BY SECONDARY COMPONENTS OF LITTER IN VEGETAL COMMUNITIES OF NUEVO LEÓN STATE
Israel Cantú Silva1, Laura Rosa Margarita Sánchez Castillo2, Humberto González Rodríguez1, Tetsuya Kubota2, Marco Vinicio Gómez Meza3 y Tilo Gustavo Domínguez Gómez1
RESUMEN
La caída de hojarasca es un mecanismo muy importante en el ciclo de nutrientes de un ecosistema, por lo cual el objetivo del presente estudio fue determinar el retorno potencial de Ca, K, Mg y P y de micronutrimentos (Cu, Fe, Mn y Zn) a través de las estructuras reproductivas, ramas, corteza e insectos en cuatro comunidades vegetales del noreste de México. La hojarasca se recolectó en tres sitios del Matorral Espinoso Tamaulipeco (Crucitas, Campus y Cascajoso), y uno de bosque de pino-encino (Bosque Escuela), con intervalos de 15 días entre 2006 y 2007. En cada lugar se estableció una parcela (50 m x 50 m) con 10 trampas (1 m2). El calcio (138 kg ha-1 año-1) y fierro (372 g ha-1 año-1) son los elementos que más reciclan los componentes secundarios. El orden en la deposición de macronutrimentos se presentó de la siguiente manera Ca > Mg > K > P, mientras que para micronutrientes fue Fe > Mn > Zn > Cu. El aporte total de estos últimos a los componentes secundarios (Cu+Fe+Mn+Zn) para el Bosque Escuela, Crucitas, Campus y Cascajoso fue de 362.9, 588.5, 234.9 y 218.3 g ha-1 año-1, respectivamente. El correspondiente a micronutrimentos para todos los componentes secundarios representó de 93 a 99% del total de la deposición anual, en los que estos fueron la fuente principal de retorno potencial en los cuatro sitios investigados, mientras que las hojas no constituyen un elemento de aporte importante en el retorno de Cu, Fe, Mn y Zn.
Palabras claves: Bosque de encino, bosque de pino, componentes secundarios de la hojarasca, deposición de hojarasca, Matorral Espinoso Tamaulipeco, retorno de nutrimentos.
ABSTRACT
Litter fall is an important process of nutrient cycling in an ecosystem, for the aim of the actual study was to determine the potential return of Ca, K, Mg and P and of micronutrients (Cu, Fe, Mn and Zn) through the reproductive structures, branches, bark and insects, in four vegetal communities of northeastern Mexico. Litter was collected in three sites of the Tamaulipan Thornscrub (Crucitas, Campus and Cascajoso) and one in the pine-oak forest (Bosque Escuela of the Universidad Autónoma de Nuevo León), with intervals of 15 days between the years 2006 and 2007. In each place was placed a plot (50 m x 50 m) with 10 traps (1 m2). Calcium (138 kg ha-1 year-1) and iron (372 g ha-1 year-1) are the mostly recycled elements by the secondary components. The order followed in the deposition of macronutrients was Ca > Mg > K > P, while for micronutrients was Fe > Mn > Zn > Cu. The total contribution of the latter to the secondary components (Cu+Fe+Mn+Zn) for the Bosque Escuela, Crucitas, Campus and Cascajoso was 362.9, 588.5, 234.9 y 218.3 g ha-1 year-1, respectively. The corresponding to micronutrients for all the secondary components was 93 to 99% of the total annual deposition, en which they were the major source of potential return in the four researched sites, while leaves do not represent an important provision in the return of Cu, Fe, Mn and Zn.
Key words: Oak forest, pine forest, secondary litter components, litter deposition, Tamaulipan Thornscrub, nutrient return.
Fecha de recepción: / date of receipt: 4 de febrero de 2013. Fecha de aceptación / date of acceptance: 5 de abril de 2013.1 Facultad de Ciencias Forestales, Universidad Autónoma de Nuevo León. Correo-e: [email protected] Facultad de Agricultura, Universidad de Kyushu, Japón.3 Facultad de Economía, Universidad Autónoma de Nuevo León.
Cantú et al., Retorno potencial de nutrimentos...
139
INTRODUCCIÓN
La importancia de la hojarasca en el retorno de nutrimentos y la acumulación de materia en el suelo ha sido ampliamente documentada en diferentes ecosistemas (Jorgensen et al., 1975; Lugo et al., 1990; Domínguez, 2009). La hojarasca, además de la precipitación directa y de los flujos corticales (Silva y González, 2001) es la fuente principal de fertilización natural. Más de la mitad de la absorción anual de nutrimentos en los bosques se debe a la reincorporación de hojarasca al suelo, y el subsiguiente reciclaje de estos nutrientes son la principal fuente de minerales disponibles (Del Valle-Arango, 2003).
La caída de la hojarasca al suelo es muy importante, ya que produce un mantillo orgánico sobre la superficie, el cual mediante su descomposición por procesos biológicos, bioquímicos y factores ambientales tiene un efecto sobre las propiedades físicas y químicas del suelo y, consecuentemente, mejora la calidad de su fertilidad y la productividad del ecosistema (Semwal et al., 2003). La cantidad de hojarasca producida por una comunidad vegetal es la sumatoria de los detritos vegetales aéreos finos aportados al suelo durante un periodo de tiempo, expresados en peso seco. Allí se incluyen hojas, flores, frutos, semillas y ramas, entre otros; y su calidad se refiere a la cantidad de nutrientes que contiene. Por lo regular se expresan en kg ha-1 año-1 (Del Valle-Arango, 2003).
El ciclo de nutrientes en un ecosistema forestal consta de su entrada al ecosistema: meteorización de la roca madre, fijación biológica de nitrógeno, aportes atmosféricos, transferencias por biota; del flujo de nutrientes entre las plantas y el suelo: absorción radicular y foliar, retranslocación, pluviolavado, pérdidas por herbivoría, desfronde y descomposición; y de las salidas de nutrientes del ecosistema: lixiviación, escorrentía, emisión de gases y aerosoles, transferencia por biota y explotación de recursos. Cada proceso es un precursor del anterior y el flujo sigue una serie de pasos interconectados. Las entradas y salidas del ecosistema constituyen el ciclo externo de nutrientes y los flujos entre las plantas y el suelo el ciclo interno. También se le conoce al primero como el ciclo geoquímico, a la retranslocación como ciclo bioquímico y al resto de los flujos internos como ciclos biogeoquímicos. Además, para comprender el funcionamiento del ecosistema forestal hay que conocer los compartimientos conectados por estos flujos o procesos: biomasa aérea (fuste, corteza, ramas y hojas), suelo orgánico, raíces, suelo mineral y roca madre (Bosco et al., 2004).
La caída de hojarasca es un mecanismo muy importante en el ciclo de nutrientes, ya que determina la renovación y entrada de materia orgánica al suelo (Campos et al., 1998). Su producción y descomposición son cruciales en el ciclo de nutrientes de los bosques (Jordan, 1982; Melillo y Aber, 1982; Vitousek, 1984; Sundarapandian y Swamy, 1999; Steubing et al., 2001).
Durante dos años consecutivos González et al. (2008) estudiaron la deposición de hojarasca en el Matorral Espinoso
INTRODUCTION
The importance of litter in the return of nutrients and the accumulation of material on soil has been largely documented in different ecosystems (Jorgensen et al., 1975; Lugo et al., 1990; Domínguez, 2009). Litter, in addition to the direct precipitation and of the bark fluxes (Silva and González, 2001) is the main source of natural fertilization. More than half of the annual nutriment absorption in forests is due to the reincorporation of litter to soil, and the resulting recycling of these nutrients are the major source of available minerals (Del Valle-Arango, 2003).
The fall of litter to the soil is very important as it produces an organic cover over the surface, which, by its decomposition through biological and biochemical processes and environmental factors, has an effect upon the physical and chemical properties of soil and, consequently, improves its fertility quality and the productivity of the ecosystem (Semwal et al., 2003). The amount of litter produced by one single vegetal community is the sum of the fine aerial vegetal detritus provided to the soil during some time, expressed in dry weight. There are included leaves, flowers, fruits, seeds and branches, among others; and their quality refers to the amount of nutrients that it has. It is regularly expressed as kg ha-1 yr-1 (Del Valle-Arango, 2003).
The nutrient cycle in a forest ecosystem includes the inputs to the ecosystem: metheorization of the bedrock, biological nitrogen fixing, atmospheric deposition, biotic transferences; nutrient flux between plants and soil: root and foliar absorption, re-translocation, rain-washing, losses from herbivory, crown defoliation and decomposition; and the outputs of nutrients of the ecosystems: lixiviation, run-off, gas emissions and aerosols, biotic transference and resource exploitation. Each process is a precursor of the former and the flow follows a series of intertwined steps. The inputs and outputs of the ecosystem are the external cycle of nutrients and the flows between plants and soils are the internal cycle. The first one is known, too, as the geochemical cycle, and the retranslocation as biochemical cycle and the rest of the internal flows and the biochemical cycles. Also, to understand the operation of the forest ecosystem, the compartments connected by these flows or processes must be known: aerial biomass (stem, bark, branches and leaves), organic soil, roots, mineral soil and bedrock (Bosco et al., 2004).
Litter fall is a very important mechanism in the nutrient cycle, since it determines the renewal and input of organic matter of the soil (Campos et al., 1998). Its production and decomposition are crucial in the nutrient cycle of forests (Jordan, 1982; Melillo and Aber, 1982; Vitousek, 1984; Sundarapandian and Swamy, 1999; Steubing et al., 2001).
During two consecutive years, González et al. (2008) studied litter deposition in the Tamaulipan Thornscrub with records of 4 472 a 6 743 kg ha-1 year-1. In such study, leaves are the main elements that compose litter, with a variation from 62 to 67%,

Rev. Mex. Cien. For. Vol. 4 Núm. 17
140
Tamaulipeco con registros de 4 472 a 6 743 kg ha-1 año-1. En dicho estudio, las hojas representaron el componente principal de la hojarasca con una fluctuación de 62 a 67%, seguido de las ramas con una contribución de 12 a 27%, y las estructuras reproductivas de 6 a 12%. La cantidad de bioelementos contenidos en la hojarasca constituye la principal fuente de nutrimentos incorporados al suelo en los ecosistemas naturales, una vez que se descompone.
En el estado de Nuevo León existen diferentes tipos de vegetación, entre los que destacan los bosques de Pino, Encino y Pino-Encino (Vargas, 1999; Silva y González, 2001), así como los matorrales subtropicales de las planicies semiáridas de la región noreste de México, los cuales están dominados por una diversidad muy densa de arbustos. Este último, denominado Matorral Espinoso Tamaulipeco (MET) está constituido por especies deciduas y siempre verdes o perennes (Reid et al., 1990) y se caracteriza por un amplio intervalo de patrones de crecimiento, diversidad en la longevidad foliar, dinámicas de crecimiento y de contrastes desarrollos fenológicos.
A pesar de la diversidad de estudios florísticos, ecológicos, y biológicos realizados en esos diferentes tipos de vegetación, no se ha documentado en ellos la deposición y el aporte anual de nutrimentos de los componentes secundarios de la hojarasca. En estos ecosistemas existen vegetales con una diversidad de usos: forraje para la ganadería extensiva y fauna silvestre, carbón, madera para la construcción, estantería, alimentos, herbolaria, medicina tradicional y propagación de plantas para llevar a cabo prácticas de reforestación, restauración y conservación de suelos. Por lo tanto, estas comunidades proporcionan una oportunidad para investigar no solo la producción de los diferentes constituyentes de la hojarasca, proveniente de las distintas estructuras de la vegetación tales como hojas, ramas, inflorescencias, frutos, semillas, por ejemplo; sino también, se puede caracterizar el retorno potencial anual de nutrimentos incorporados a través de cada uno de sus componentes. Es importante señalar que los resultados de este proceso en el componente principal de la hojarasca (hojas) para las cuatro comunidades vegetales estudiadas ha sido documentado por Domínguez (2009).
A partir de las consideraciones anteriores, el objetivo del presente estudio fue cuantificar la deposición y retorno potencial de nutrimentos en los componentes secundarios de la hojarasca, en cuatro comunidades vegetales del noreste de México, mediante la determinación del contenido de macronutrimentos (Ca, K, Mg, P y N) y micronutrimentos (Cu, Fe, Mn y Zn) en componentes de la hojarasca: ramas, corteza, estructuras reproductivas, restos de animales e insectos.
MATERIALES Y MÉTODOS
Los cuatro sitios de estudio se ubican en dos municipios de Nuevo León. Tres de ellos se localizan en Linares: “Crucitas” (24°46’35” N, 99°41’44” O a una altitud de 550 m) en el ecotono
followed by branches with a contribution from 12 to 27%, and the reproductive structures from 6 to 12%. The amount of bioelements in litter are the major source of nutrients that are deposited in the soil of natural ecosystems, once it becomes rotten.
There are different types of vegetation in the state of Nuevo León, among which the pine, oak and pine-oak forests are outstanding (Vargas, 1999; Silva and González, 2001), as well as subtropical scrubs of the semiarid plains of the northeastern region of Mexico, which have a dense variety of scrubs as the dominant plants. This latter, which has been named Matorral Espinoso Tamaulipeco (MET, for its acronym in Spanish) which can be stated as Tamaulipan Thornscrub, is made-up by deciduous species, and evergreens or perennial (Reid et al., 1990) and they have a wide range of growth patterns, diversity in their foliar longevity, growth dynamics and contrasting phenological developments.
In spite of the diversity in floristic, ecological and biological studies accomplished in the different types of vegetation, it has not been documented still the deposition and annual contribution of nutrients of the secondary components of litter. In thee ecosystems, there are vegetables with a use diversity: forage for extensive livestock and wildlife, carbon, building timber, shelving, food, herbs, autochthonous medicine and plant propagation to carry out reforestation, restoration and soil conservation practices. Therefore, these communities provide an opportunity to research not only the production of the different elements of litter, coming from the different structures of vegetation such as leaves, branches, inflorescences, fruits and seeds, for example, but also, the annual potential return of assimilated nutrients may be described, through each one of its components. It is important to notice that the results of this process in the major component of litter (leaves) for the four vegetal communities that were studied has been documented by Domínguez (2009).
From the previous considerations, the aim of the present study was to quantify the deposition and potential return of nutrients in the secondary components of litter, in four vegetal communities of northeastern Mexico, by the determination of macronutrient (Ca, K, Mg, P and N) and micronutrient content (Cu, Fe, Mn and Zn) in litter components: branches, bark, reproductive structures and insects.
MATERIALS AND METHODS
The four study sites are located in two municipalities of Nuevo León state. Three of them are in Linares:“Crucitas” (24°46’35” N and 99°41’44” W an altitude of 550 m) in the ecotone of and the submountain forest; the second one in the Facultad de Ciencias Forestales named “Campus” (24°46’43” N and 99°31’39” W, with an altitude of 370 m), vegetation of the Middle Thornless Scrub; and the third one called “Cascajoso” which is located in the Hacienda de Guadalupe ejido (24°54’17’’ N and 99°25’43’’ W, at an altitude of 300 m, with Thornscrub). The fourth place is known as “Bosque
Cantú et al., Retorno potencial de nutrimentos...
141
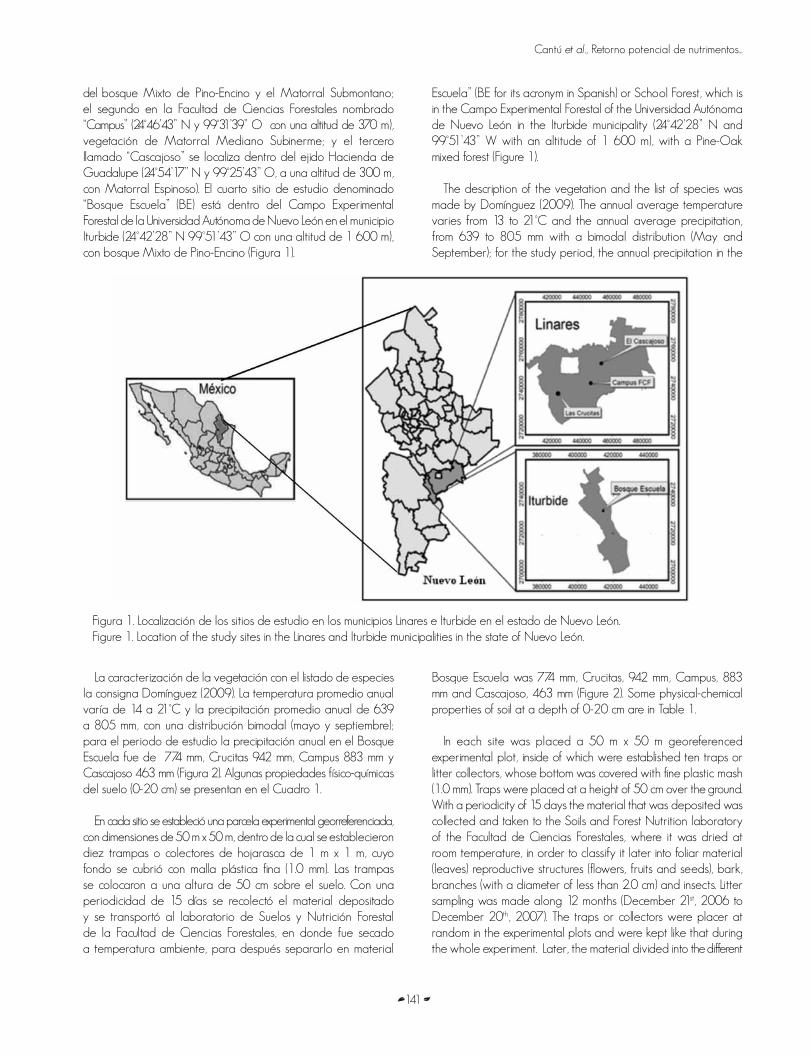
del bosque Mixto de Pino-Encino y el Matorral Submontano; el segundo en la Facultad de Ciencias Forestales nombrado “Campus” (24°46’43” N y 99°31’39” O con una altitud de 370 m), vegetación de Matorral Mediano Subinerme; y el tercero llamado “Cascajoso” se localiza dentro del ejido Hacienda de Guadalupe (24°54’17’’ N y 99°25’43’’ O, a una altitud de 300 m, con Matorral Espinoso). El cuarto sitio de estudio denominado “Bosque Escuela” (BE) está dentro del Campo Experimental Forestal de la Universidad Autónoma de Nuevo León en el municipio Iturbide (24°42’28” N 99°51’43” O con una altitud de 1 600 m), con bosque Mixto de Pino-Encino (Figura 1).
Escuela” (BE for its acronym in Spanish) or School Forest, which is in the Campo Experimental Forestal of the Universidad Autónoma de Nuevo León in the Iturbide municipality (24°42’28” N and 99°51’43” W with an altitude of 1 600 m), with a Pine-Oak mixed forest (Figure 1).
The description of the vegetation and the list of species was made by Domínguez (2009). The annual average temperature varies from 13 to 21°C and the annual average precipitation, from 639 to 805 mm with a bimodal distribution (May and September); for the study period, the annual precipitation in the
Figura 1. Localización de los sitios de estudio en los municipios Linares e Iturbide en el estado de Nuevo León.Figure 1. Location of the study sites in the Linares and Iturbide municipalities in the state of Nuevo León.
La caracterización de la vegetación con el listado de especies la consigna Domínguez (2009). La temperatura promedio anual varía de 14 a 21°C y la precipitación promedio anual de 639 a 805 mm, con una distribución bimodal (mayo y septiembre); para el periodo de estudio la precipitación anual en el Bosque Escuela fue de 774 mm, Crucitas 942 mm, Campus 883 mm y Cascajoso 463 mm (Figura 2). Algunas propiedades físico-químicas del suelo (0-20 cm) se presentan en el Cuadro 1.
En cada sitio se estableció una parcela experimental georreferenciada, con dimensiones de 50 m x 50 m, dentro de la cual se establecieron diez trampas o colectores de hojarasca de 1 m x 1 m, cuyo fondo se cubrió con malla plástica fina (1.0 mm). Las trampas se colocaron a una altura de 50 cm sobre el suelo. Con una periodicidad de 15 días se recolectó el material depositado y se transportó al laboratorio de Suelos y Nutrición Forestal de la Facultad de Ciencias Forestales, en donde fue secado a temperatura ambiente, para después separarlo en material
Bosque Escuela was 774 mm, Crucitas, 942 mm, Campus, 883 mm and Cascajoso, 463 mm (Figure 2). Some physical-chemical properties of soil at a depth of 0-20 cm are in Table 1.
In each site was placed a 50 m x 50 m georeferenced experimental plot, inside of which were established ten traps or litter collectors, whose bottom was covered with fine plastic mash (1.0 mm). Traps were placed at a height of 50 cm over the ground. With a periodicity of 15 days the material that was deposited was collected and taken to the Soils and Forest Nutrition laboratory of the Facultad de Ciencias Forestales, where it was dried at room temperature, in order to classify it later into foliar material (leaves) reproductive structures (flowers, fruits and seeds), bark, branches (with a diameter of less than 2.0 cm) and insects. Litter sampling was made along 12 months (December 21st, 2006 to December 20th, 2007). The traps or collectors were placer at random in the experimental plots and were kept like that during the whole experiment. Later, the material divided into the different

Rev. Mex. Cien. For. Vol. 4 Núm. 17
142
Figura 2. Diagrama climático con la temperatura promedio mensual y la precipitación mensual en los cuatro sitios de estudio, periodo de diciembre 2006 a diciembre 2007.
Figure 2. Climate diagram with the monthly average temperature and the monthly precipitation in the four study sites, from December 2006 to December 2007.
Cuadro 1. Propiedades físico-químicas del suelo determinadas a una profundidad de 0-20 cm en los cuatro sitios investigados.Table 1. Physical-chemical properties of soil (at a 0-20 cm depth) in the four sites that were studied.
Propiedad del suelo Sitio
Bosque Escuela Crucitas Campus Cascajoso
Arena (g kg-1) 170.0 120.0 250.0 130.0
Limo (g kg-1) 430.0 420.0 500.0 610.0
Arcilla (g kg-1) 400.0 460.0 250.0 260.0
D. A. (Mg m-3) 0.9 1.2 0.8 1.2
M.O. (%) 6.0 4.0 7.0 2.0
pH (CaCl2; 0.01 M) 6.6 6.8 6.6 7.1
CE (μS cm-1) 255.0 103.0 216.0 123.0
Ca (mg kg-1) 8 839.1 5 063.5 8 555.6 8 000.2
K (mg kg-1) 297.4 307.7 109.5 134.7
Mg (mg kg-1) 150.3 310.4 216.0 98.5
P (mg kg-1) 5.1 10.2 9.3 5.2
N (mg kg-1) 2 957.3 3 461.2 5 604.6 1 897.3
Cu (mg kg-1) 1.30 1.23 0.44 0.47Zn (mg kg-1) 2.35 3.23 1.87 0.33
Fe (mg kg-1) 15.95 9.24 4.52 3.05
Mn (mg kg-1) 32.07 80.93 12.99 9.85M.O. = materia orgánica; D. A. =densidad aparente; CE = conductividad eléctrica.Propiedad del suelo= Property of soil; sitio = site; arena = sand; limo = lime; arcilla = layM.O. = organic matter; D. A. =apparent density; CE = electric conductivity
Cantú et al., Retorno potencial de nutrimentos...
143
foliar (hojas), estructuras reproductivas (flores, frutos y semillas), corteza, ramas (de menos de 2.0 cm de diámetro) e insectos. El muestreo de la hojarasca se hizo a lo largo de 12 meses (del 21 de diciembre de 2006 al 20 de diciembre de 2007). Los colectores o trampas se dispusieron al azar en las parcelas experimentales y se mantuvieron en el mismo punto durante todo el experimento. Posteriormente, el material separado en los distintos componentes se secó y procesó en un molino Thomas Willey (Thomas Scientific Apparatus, Modelo 3383) con una malla Núm. 60 (1 mm x 1 mm).
El material molido se almacenó en un frasco previamente etiquetado. La preparación de extractos para determinar macronutrimentos (Ca, K, Mg y P) y micronutrimentos (Cu, Fe, Mn y Zn) en los componentes secundarios se realizó de acuerdo a las técnicas analíticas de digestión descritas en AOAC (1997), que consisten en poner material molido y etiquetado en una estufa Presicion, modelo 16EG Economy a 65 °C durante 24 h, en seguida se colocó en un desecador para enfriarlo. Después se pesaron 2.0 g de muestra y se incineraron en crisoles etiquetados y colocados en una mufla Felisa modelo FE-340 a 550 °C, por un lapso de 5 h. Una vez obtenidas las cenizas, se dejaron enfriar por aproximadamente 30 minutos a temperatura ambiente, después se vertieron a un vaso de precipitado de 50 mL, y el crisol se lavó con 20 mL de agua destilada. Se agregaron 5 mL de HCl concentrado y 10 gotas de HNO
3 concentrado; y se procedió
a calentarlas en una parrilla Cornning modelo Stirren Hotplate a 100 °C, hasta reducir el volumen a 10 mL. A continuación se le agregaron 10 mL de agua destilada y nuevamente se calentó por 2 ó 3 minutos, y se dejó reposar la muestra hasta que llegó temperatura ambiente; una vez alcanzada esta, se filtra en papel filtro Whatman Núm. 40 en un matraz volumétrico de 50 mL, el cual se afora con agua destilada. Concluido este procedimiento, las muestras se conservaron en refrigeración a 4 °C hasta que se realizaron los análisis cuantitativos de cada nutrimento.
Para determinar el contenido de cada elemento se utilizó un espectrofotómetro de absorción atómica (Varian, modelo SpectrAA-200). A partir de estándares comerciales, se obtuvo una curva para cuantificar el contenido en los extractos. El caso de los estándares de Ca y Mg se añadió K a una concentración final de 1 000 µg mL-1 de solución, para contrarrestar el efecto ionizante. Con la misma finalidad se añadió Cs a una concentración de 1 000 µg mL-1 a los estándares de K. Ambos supresores de la ionización, a la misma concentración, también se agregaron a las muestras. Los resultados de los contenidos de macronutrimentos se expresaron en mg g-1 peso seco; mientras que para los micro en términos de µg g-1.
La determinación de fósforo (P) se hizo por el método de colorimetría (AOAC, 1997) en un espectrofotómetro de rayos ultravioleta-visible (Cecil, modelo CE 2002). Su contenido en los extractos de las muestras se estimó a partir de una curva estándar preparada con diferentes concentraciones de fósforo.
components was dried and processed in a Thomas Willey (Thomas Scientific Apparatus, 3383 Model) mill with 60 (1 mm x 1 mm) mesh.
The grinded material was stored in a jar previously labeled. The elaboration of extracts to determine macronutrients (Ca, K, Mg and P) and micronutrients (Cu, Fe, Mn and Zn) in the secondary components was carried out according to the analytical techniques of digestion described in the AOAC (1997), which consist in putting mashed or grinded and labeled material into a Precision kiln, Economy16EG model, at 65 °C during 24 h; next, it was put into a dessicator to cool it. Later, 20 g of the sample were weighted and were burned in crucible labeled and placed in a Felisa FE-340 model muffle furnace at 550 °C for 5 h. Once the ashes were obtained, they were left to cool for about 30 minutes at room temperature; afterwards, they were drained into a 50 mL breaker and the crucible was rinsed with 20 mL of distilled water. 5 mL of concentrated HCl plus 10 drops of concentrated HNO
3
were added to them; then, they were heated in a Cornning Stirren Hotplate model grill at 100 °C until the volume was reduced to 10 mL. After this, 10 mL of distilled water were added and once more, it was heated for 2 or 3 minutes and left to cool until it reached room temperature; once it was achieved, it was filtered with number 40 Whatman filter paper into a 50 mL volumetric flask, which is gauged with distilled water. Once this process was concluded, the samples were preserved in refrigeration at 4 °C until the quantitative analysis of each nutriment were made.
To determine the content of each element, a Varian SpectrAA-200 model anatomical absorption spectrophotometer was used. Starting from commercial standards, a curve was obtained to quantify the content of such extracts. In the case of the Ca and Mg standards, K was added up to a final concentration of 1 000 µg mL-1 of solution, to counteract the ionizing effect. With the same ending, a Cs was added at a concentration of 1 000 µg mL-1 to the K standards. Both ionizing suppressors, at the same concentration, were added to the samples. The results of the macronutrient contents were expressed in mg g-1 dry weight, while for the micro in terms of µg g-1.
The calculation of phosphorous (P) was made by the colorimetry method (AOAC, 1997) in an ultraviolet-visible Cecil, CE 2002 model spectrophotometer. Its contents in the extracts of the samples was estimated from a standard curve prepared with different phosphorous concentrations.
The data of litter production as well as those of the nutrient contents of branches, reproductive structures, bark and insects were subjected to an analysis of variance with a completely at random design (Steel and Torrie, 1980). In order to prove the assumptions of normality and homogeneity of variances of each litter component and nutrient concentration, the statistical tests of Kolmogorov-Smirnov, Shapiro Wilk and Levene were applied (Steel and Torrie, 1980). As results proved that most of the data did not have a normal distribution and in almost all the sampling months, the analysis of variance did not make evident the
Rev. Mex. Cien. For. Vol. 4 Núm. 17
144
Los datos de producción de la hojarasca, así como los de contenido de nutrientes de ramas, estructuras reproductivas, corteza e insectos se sometieron a un análisis de varianza con un diseño completamente al azar (Steel y Torrie, 1980). Para probar los supuestos de normalidad y homogeneidad de varianzas de cada componente de la hojarasca y concentración de nutrientes se aplicaron las pruebas estadísticas de Kolmogorov-Smirnov, Shapiro Wilk y Levene (Steel y Torrie, 1980). Los resultados demostraron que la mayoría de los datos no se distribuyeron normalmente, y en casi todos los meses de muestreo el análisis de varianza no evidenció los supuestos de igualdad de varianzas, por lo que se utilizó la prueba no paramétrica de Kruskal-Wallis (Ott, 1993) para detectar diferencias significativas entre los sitios en cada mes de muestreo. Todos los análisis estadísticos se realizaron con el paquete computacional Statistical Package for the Social Sciences (SPSS, 2009).
RESULTADOS Y DISCUSIÓN
Deposición anual de los componentes de la hojarasca
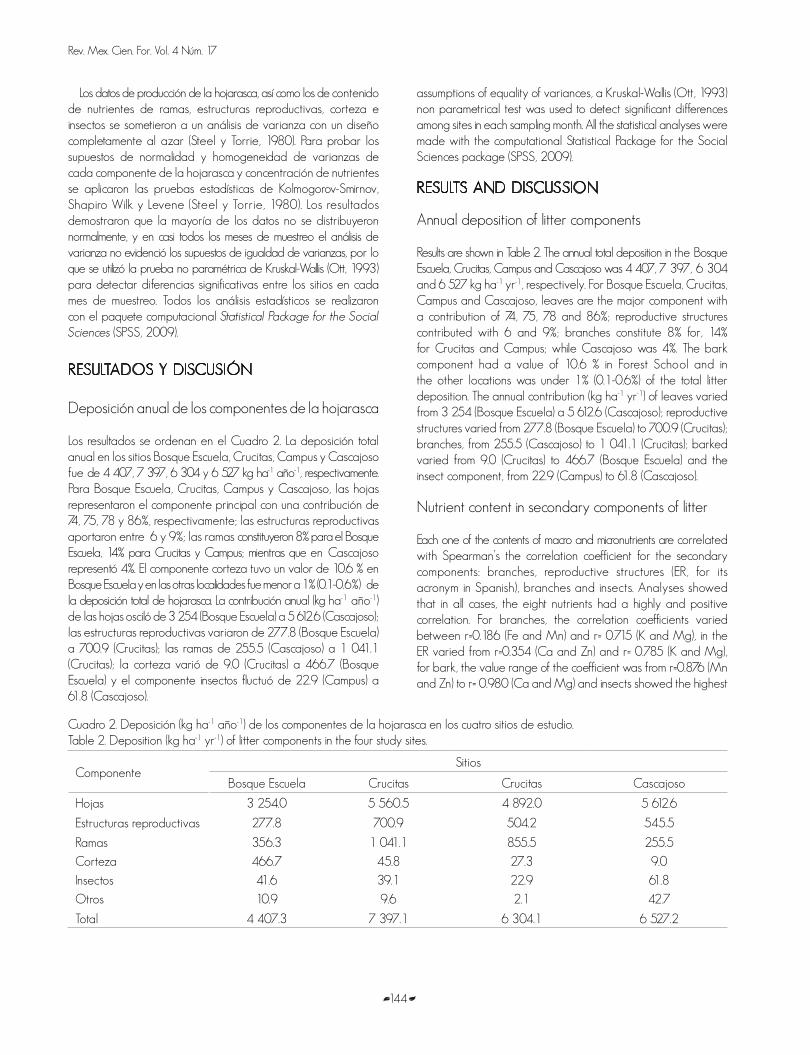
Los resultados se ordenan en el Cuadro 2. La deposición total anual en los sitios Bosque Escuela, Crucitas, Campus y Cascajoso fue de 4 407, 7 397, 6 304 y 6 527 kg ha-1 año-1, respectivamente. Para Bosque Escuela, Crucitas, Campus y Cascajoso, las hojas representaron el componente principal con una contribución de 74, 75, 78 y 86%, respectivamente; las estructuras reproductivas aportaron entre 6 y 9%; las ramas constituyeron 8% para el Bosque Escuela, 14% para Crucitas y Campus; mientras que en Cascajoso representó 4%. El componente corteza tuvo un valor de 10.6 % en Bosque Escuela y en las otras localidades fue menor a 1% (0.1-0.6%) de la deposición total de hojarasca. La contribución anual (kg ha-1 año-1) de las hojas osciló de 3 254 (Bosque Escuela) a 5 612.6 (Cascajoso); las estructuras reproductivas variaron de 277.8 (Bosque Escuela) a 700.9 (Crucitas); las ramas de 255.5 (Cascajoso) a 1 041.1 (Crucitas); la corteza varió de 9.0 (Crucitas) a 466.7 (Bosque Escuela) y el componente insectos fluctuó de 22.9 (Campus) a 61.8 (Cascajoso).
assumptions of equality of variances, a Kruskal-Wallis (Ott, 1993) non parametrical test was used to detect significant differences among sites in each sampling month. All the statistical analyses were made with the computational Statistical Package for the Social Sciences package (SPSS, 2009).
RESULTS AND DISCUSSION
Annual deposition of litter components
Results are shown in Table 2. The annual total deposition in the Bosque Escuela, Crucitas, Campus and Cascajoso was 4 407, 7 397, 6 304 and 6 527 kg ha-1 yr-1, respectively. For Bosque Escuela, Crucitas, Campus and Cascajoso, leaves are the major component with a contribution of 74, 75, 78 and 86%; reproductive structures contributed with 6 and 9%; branches constitute 8% for, 14% for Crucitas and Campus; while Cascajoso was 4%. The bark component had a value of 10.6 % in Forest School and in the other locations was under 1% (0.1-0.6%) of the total litter deposition. The annual contribution (kg ha-1 yr-1) of leaves varied from 3 254 (Bosque Escuela) a 5 612.6 (Cascajoso); reproductive structures varied from 277.8 (Bosque Escuela) to 700.9 (Crucitas); branches, from 255.5 (Cascajoso) to 1 041.1 (Crucitas); barked varied from 9.0 (Crucitas) to 466.7 (Bosque Escuela) and the insect component, from 22.9 (Campus) to 61.8 (Cascajoso).
Nutrient content in secondary components of litter
Each one of the contents of macro and micronutrients are correlated with Spearman’s the correlation coefficient for the secondary components: branches, reproductive structures (ER, for its acronym in Spanish), branches and insects. Analyses showed that in all cases, the eight nutrients had a highly and positive correlation. For branches, the correlation coefficients varied between r=0.186 (Fe and Mn) and r= 0.715 (K and Mg), in the ER varied from r=0.354 (Ca and Zn) and r= 0.785 (K and Mg), for bark, the value range of the coefficient was from r=0.876 (Mn and Zn) to r= 0.980 (Ca and Mg) and insects showed the highest
Cuadro 2. Deposición (kg ha-1 año-1) de los componentes de la hojarasca en los cuatro sitios de estudio.Table 2. Deposition (kg ha-1 yr-1) of litter components in the four study sites.
ComponenteSitios
Bosque Escuela Crucitas Crucitas Cascajoso
Hojas 3 254.0 5 560.5 4 892.0 5 612.6
Estructuras reproductivas 277.8 700.9 504.2 545.5
Ramas 356.3 1 041.1 855.5 255.5
Corteza 466.7 45.8 27.3 9.0
Insectos 41.6 39.1 22.9 61.8
Otros 10.9 9.6 2.1 42.7
Total 4 407.3 7 397.1 6 304.1 6 527.2

Cantú et al., Retorno potencial de nutrimentos...
145
correlation coefficient, between r=0.925 (Cu and Mn) and r= 0.984 (K and Mg).
The summary of the analysis of variance of the Kruskal-Wallis test to observe significant differences in the macro and micro nutrient content in the reproductive structure and branches component for the 12 sampling dates in the four study sites, are shown in tables 3 and 4. The concentrations in the reproductive structures were significantly different among sites for several sampling dates. In regard to macronutrients, Ca was the one that varied more significantly among months, in seven out of the 12 that were considered; P only showed significant differences in four months. About micronutrients, Mn had significant differences in eight dates, which are contrasting to Zn which had differences only in four dates. During winter it can be observed that in two months there were no significant differences among sites for the eight nutrients that were analyzed (February and December).
The macro and micro nutrient concentrations of branches (Table 4) were significantly different among sites for some sampling dates. Of macronutrients, Ca registered greater significant variation among months, in nine out of twelve, while P only in two months had significant differences, a similar tendency as that observed in reproductive structures. In regard to micronutrients, Cu and Mn showed significant differences in eight dates, and Zn varied significantly only in five months. In one date of spring (June 20th) there were no significant differences for any nutrient.
On the other hand, the macro and micronutrient contents of bark were significantly different among them for all the nutriments in April and June. In March, as well, except for Ca and K, which showed non-significant differences. Only Fe and Zn did in six and seven months. Also, the insect component confirmed significant differences only in two dates (May and October) for all nutrients, apparently, these could be coincidental with their activity in the different vegetal communities (data not presented here).
Annual potential return of nutrients by secondary components
The reproductive structures and branches make-up 97% (macronutrients) and 90% (micronutrients) of the annual total potential return of secondary components, not like that in site BE, in which bark made-up 67% of micronutrients. This results from a high deposition (214 g ha-1 yr-1) of Fe, which is recycled by the bark of trees of this type of vegetation (Table 5).
The annual deposition of macronutrients and micronutrients in all the secondary components: branches+bark+ reproductive structures+insects are compared to the main component (leaves) in the four vegetation communities (Table 6).
The highest annual deposition of Ca for the secondary components was in Crucitas followed by Campus, Cascajoso
Contenido de nutrimentos en componentes secundarios de la hojarasca
Cada uno de los contenidos de macro y micronutrimentos se correlacionaron con el coeficiente de correlación de Spearman, para los componentes secundarios: ramas, estructuras reproductivas (ER), corteza e insectos. Los análisis mostraron que en todos los casos los ocho nutrimentos tuvieron una correlación altamente significativamente y positiva. Para ramas los coeficientes de correlación variaron entre r=0.186 (Fe y Mn) y r= 0.715 (K y Mg), en las ER fluctuaron de r=0.354 (Ca y Zn) y r= 0.785 (K y Mg), para corteza el intervalo de valores del coeficiente fue de r=0.876 (Mn y Zn) a r= 0.980 (Ca y Mg) y los insectos presentaron los coeficientes de correlación más altos, entre r=0.925 (Cu y Mn) y r= 0.984 (K y Mg).
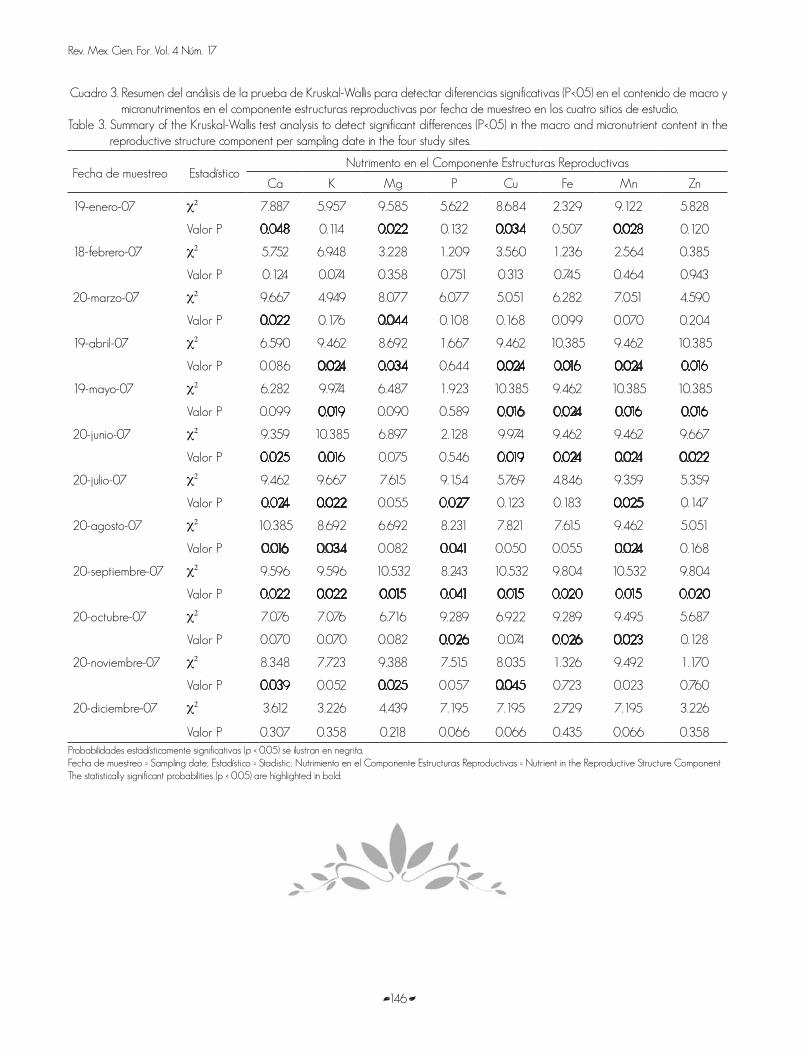
El resumen del análisis de varianza de la prueba Kruskal-Wallis para observar diferencias significativas en el contenido de macro y micronutrimentos en el componente estructuras reproductivas y ramas para las 12 fechas de muestreo en los cuatro sitios de estudio se presentan en los cuadros 3 y 4. Las concentraciones en las estructuras reproductivas (Cuadro 3) fueron significativamente diferentes entre sitios para varias fechas de muestreo. En relación con los macronutrimentos, el Ca fue el que más varió significativamente entre meses, en siete de los 12 considerados; el P solo en cuatro meses presentó diferencias significativas. En cuanto a micronutrimentos, el Mn tuvo diferencias significativas en ocho fechas, que contrastan con el Zn que presentó diferencias solo en cuatro fechas. Durante el invierno se observaron dos meses en los cuales no hubo diferencias estadísticas significativas entre sitios para los ocho nutrimentos analizados (febrero y diciembre).
Las concentraciones de macro y micronutrimentos de las ramas (Cuadro 4) fueron significativamente diferentes entre sitios para algunas fechas de muestreo. De los macronutrimentos, el Ca registró más variación significativa entre meses, en nueve de 12, mientras que el P solo en dos meses tuvo diferencias significativas, tendencia similar a la observada en estructuras reproductivas. En cuanto a micronutrimentos, el Cu y Mn mostraron diferencias significativas en ocho fechas, y el Zn varió significativamente solo en cinco meses. En una fecha de primavera (20 de junio) no hubo diferencias significativas para ningún nutrimento.
Por otra parte, los contenidos de macro y micronutrimentos de la corteza fueron significativamente diferentes entre sitios para todos los nutrimentos en los meses de abril y junio. Igualmente en el mes de marzo, excepto Ca y K, los cuales presentaron diferencias no significativas. Solo el Fe y Zn mostraron diferencias significativas en seis y siete meses. También, el componente insectos presentó diferencias significativas únicamente en dos fechas (mayo y octubre) para todos los nutrimentos, al parecer estas pudiesen coincidir con su actividad en las diferentes comunidades vegetales (datos no presentados).
Rev. Mex. Cien. For. Vol. 4 Núm. 17
146
Cuadro 3. Resumen del análisis de la prueba de Kruskal-Wallis para detectar diferencias significativas (P<.05) en el contenido de macro y micronutrimentos en el componente estructuras reproductivas por fecha de muestreo en los cuatro sitios de estudio.
Table 3. Summary of the Kruskal-Wallis test analysis to detect significant differences (P<.05) in the macro and micronutrient content in the reproductive structure component per sampling date in the four study sites.
Fecha de muestreo EstadísticoNutrimento en el Componente Estructuras Reproductivas
Ca K Mg P Cu Fe Mn Zn
19-enero-07 χ2 7.887 5.957 9.585 5.622 8.684 2.329 9.122 5.828
Valor P 0.048 0.114 0.022 0.132 0.034 0.507 0.028 0.120
18-febrero-07 χ2 5.752 6.948 3.228 1.209 3.560 1.236 2.564 0.385
Valor P 0.124 0.074 0.358 0.751 0.313 0.745 0.464 0.943
20-marzo-07 χ2 9.667 4.949 8.077 6.077 5.051 6.282 7.051 4.590
Valor P 0.022 0.176 0.044 0.108 0.168 0.099 0.070 0.204
19-abril-07 χ2 6.590 9.462 8.692 1.667 9.462 10.385 9.462 10.385
Valor P 0.086 0.024 0.034 0.644 0.024 0.016 0.024 0.016
19-mayo-07 χ2 6.282 9.974 6.487 1.923 10.385 9.462 10.385 10.385
Valor P 0.099 0.019 0.090 0.589 0.016 0.024 0.016 0.016
20-junio-07 χ2 9.359 10.385 6.897 2.128 9.974 9.462 9.462 9.667
Valor P 0.025 0.016 0.075 0.546 0.019 0.024 0.024 0.022
20-julio-07 χ2 9.462 9.667 7.615 9.154 5.769 4.846 9.359 5.359
Valor P 0.024 0.022 0.055 0.027 0.123 0.183 0.025 0.147
20-agosto-07 χ2 10.385 8.692 6.692 8.231 7.821 7.615 9.462 5.051
Valor P 0.016 0.034 0.082 0.041 0.050 0.055 0.024 0.168
20-septiembre-07 χ2 9.596 9.596 10.532 8.243 10.532 9.804 10.532 9.804
Valor P 0.022 0.022 0.015 0.041 0.015 0.020 0.015 0.020
20-octubre-07 χ2 7.076 7.076 6.716 9.289 6.922 9.289 9.495 5.687
Valor P 0.070 0.070 0.082 0.026 0.074 0.026 0.023 0.128
20-noviembre-07 χ2 8.348 7.723 9.388 7.515 8.035 1.326 9.492 1.170
Valor P 0.039 0.052 0.025 0.057 0.045 0.723 0.023 0.760
20-diciembre-07 χ2 3.612 3.226 4.439 7.195 7.195 2.729 7.195 3.226
Valor P 0.307 0.358 0.218 0.066 0.066 0.435 0.066 0.358Probabilidades estadísticamente significativas (p < 0.05) se ilustran en negrita.Fecha de muestreo = Sampling date; Estadístico = Stadistic; Nutrimiento en el Componente Estructuras Reproductivas = Nutrient in the Reproductive Structure ComponentThe statistically significant probabilities (p < 0.05) are highlighted in bold.

Cantú et al., Retorno potencial de nutrimentos...
147
Cuadro 4. Resumen del análisis de la prueba de Kruskal-Wallis para detectar diferencias significativas (P<.05) en el contenido de macro y micronutrimentos en el componente ramas por fecha de muestreo en los cuatro sitios de estudio.
Table 4. Summary of the Kruskal-Wallis test analysis to detect significant differences (P<.05) in the macro and micronutrient content in the branch component per sampling date in the four study sites.
Fecha de muestreo
EstadísticoNutrimento en el Componente Estructuras Reproductivas
Ca K Mg P Cu Fe Mn Zn
19-enero-07 χ2 8.350 8.273 6.574 2.869 8.684 6.188 9.585 5.262
Valor P 0.039 0.041 0.087 0.412 0.034 0.103 0.022 0.154
18-febrero-07 χ2 8.260 9.701 9.495 9.186 3.937 9.392 9.701 8.465
Valor P 0.041 0.021 0.023 0.027 0.268 0.025 0.021 0.037
20-marzo-07 χ2 9.974 9.359 10.385 7.308 9.462 9.667 10.385 7.205
Valor P 0.019 0.025 0.016 0.063 0.024 0.022 0.016 0.066
19-abril-07 χ2 9.359 7.615 6.692 3.205 0.974 8.436 8.744 4.231
Valor P 0.025 0.055 0.082 0.361 0.019 0.038 0.033 0.238
19-mayo-07 χ2 9.667 10.385 9.359 6.692 9.462 8.077 10.385 9.256
Valor P 0.022 0.016 0.025 0.082 0.024 0.044 0.016 0.026
20-junio-07 χ2 4.846 5.974 3.205 0.077 6.385 4.846 5.974 3.359
Valor P 0.183 0.113 0.361 0.994 0.094 0.183 0.113 0.340
20-julio-07 χ2 9.024 7.411 9.596 8.243 9.596 6.787 7.775 9.596
Valor P 0.029 0.060 0.022 0.041 0.022 0.079 0.051 0.022
20-agosto-07 χ2 10.385 4.436 9.974 1.364 9.359 3.821 9.974 9.359
Valor P 0.016 0.218 0.019 0.714 0.025 0.282 0.019 0.025
20-septiembre-07 χ2 6.897 7.615 5.359 7.051 5.051 8.538 7.615 3.923
Valor P 0.075 0.055 0.147 0.070 0.168 0.036 0.055 0.270
20-octubre-07 χ2 8.744 8.744 10.385 0.949 9.667 2.692 9.359 6.436
Valor P 0.033 0.033 0.016 0.814 0.022 0.442 0.025 0.092
20-noviembre-07 χ2 6.846 10.385 7.462 6.077 8.897 9.667 10.385 10.385
Valor P 0.077 0.016 0.059 0.108 0.031 0.022 0.016 0.016
20-diciembre-07 χ2 8.635 8.954 8.635 8.954 4.597 8.529 7.572 6.297
Valor P 0.035 0.030 0.035 0.030 0.204 0.036 0.056 0.098Probabilidades estadísticamente significativas (p < 0.05) se ilustran en negrita.Fecha de muestreo = Sampling date; Estadístico = Stadistic; Nutrimiento en el Componente Ramas = Nutrient in the Branch ComponentThe statistically significant probabilities (p < 0.05) are highlighted in bold.
Retorno potencial anual de nutrimentos por medio de los componentes secundarios
Las estructuras reproductivas y ramas representaron 97% (macronutrimentos) y 90% (micronutrimentos) del retorno total potencial anual de los componentes secundarios, no así en el sitio BE, en el cual la corteza constituyó 67% de los micronutrimentos. Esto se debe a una deposición alta (214 g ha-1 año-1) del nutrimento Fe, el cual es reciclado por la corteza de los árboles de ese tipo de vegetación (Cuadro 5).
and Bosque Escuela; the deposition of K, Mg and P behaved the same. The total deposition of macronutrients (Ca+K+Mg+P) in the secondary components for Bosque Escuela, Crucitas, Campus and Cascajoso was 39.5, 152.1, 100.5 y 84 kg ha-1 yr-1, respectively. Regardless of the study site, their deposition was as follows: Ca> Mg> K> P, in the case of the leaves was given as follows: Ca> K> Mg> P (Table 6).
With regard to micronutrients, the annual estimate for the secondary components Fe was high at Crucitas and Forest School sites, followed

Rev. Mex. Cien. For. Vol. 4 Núm. 17
148
Cuadro 5. Deposición anual de macronutrimentos (kg ha-1 año-1) y micronutrimentos (g ha-1 año-1) por los componentes estructuras reproductivas (ER) y ramas en los cuatro sitios de estudio.
Table 5. Annual deposition of macronutrients (kg ha-1 yr-1) and micronutrients (g ha-1 yr-1) by the components of reproductive structures (ER) and branches in the four study sites.
Nutrimento
SitioBosque Escuela Crucitas Campus Cascajoso
E.R. Ramas E.R. Ramas E.R. Ramas E.R. RamasCa 32.04 2.83 116.49 21.68 87.03 4.74 71.32 5.61K 0.37 0.36 5.34 3.96 5.04 1.39 3.99 0.95
Mg 0.08 0.18 1.00 1.45 0.81 0.27 0.71 0.31P 0.11 0.12 0.66 0.63 0.53 0.12 0.48 0.21
Total 32.60 3.49 123.49 27.72 93.41 6.52 76.51 7.08
Cu 0.94 1.10 7.26 6.73 5.46 2.40 4.23 2.06Fe 32.04 58.9 116.49 230.65 87.03 52.32 71.32 75.1Mn 3.44 5.62 52.15 93.3 26.68 7.44 9.43 7.23Zn 4.09 6.46 16.34 31.30 12.08 14.89 12.04 7.01
Total 40.52 72.08 192.26 361.98 131.25 77.06 97.04 91.40
Cuadro 6. Deposición anual de macronutrimentos (Ca, K, Mg y P; kg ha-1 año-1) y micronutrimentos (Cu, Fe, Mn y Zn; g ha-1 año-1) para el componente principal y los componentes secundarios.
Table 6. Annual deposition of macronutrients (Ca, K, Mg and P; kg ha-1 yr-1) and micronutrients (Cu, Fe, Mn and Zn; g ha-1 yr-1) for the principal component and the secondary components.
Nutrimento
Sitio
Bosque Escuela Crucitas Campus Cascajoso
HojasComponentes
SecundariosHojas
Componentes
SecundariosHojas
Componentes
SecundariosHojas
Componentes
Secundarios
Ca 30.3 37.7 130.5 138.8 182.3 92.2 232.7 77.4
K 7.2 0.4 24.8 2.5 32.5 1.1 37.5 1.1
Mg 4.5 1.0 13.7 9.5 17.7 6.5 22.6 5.1
P 1.4 0.4 4.0 1.3 4.0 0.7 3.4 0.8
Total 43.4 39.5 173.0 152.1 236.5 100.5 296.2 84.4
Cu 0.1 4.2 0.3 14.5 0.3 8.2 0.4 6.7
Fe 2.7 311.2 4.8 372.7 6.3 161.9 11.2 170.9
Mn 1.7 21.2 9.9 152.0 1.5 36.4 4.2 19.4
Zn 0.5 26.3 0.8 49.3 0.8 28.4 1.3 21.3
Total 5.0 362.9 15.8 588.5 8.9 234.9 17.1 218.3
La deposición anual de macronutrimentos y micronutrimentos de todos los componentes secundarios: ramas+corteza+estructuras reproductivas+insectos son comparados con el componente principal (hojas) en las cuatro comunidades de vegetación (Cuadro 6).
by Cascajoso and Campus. Also, the contribution of Mn, Zn and Cu was higher and decreased in Crucitas and decreased in Campus, Forest School and Cascajoso, but for Cu the decreasing order was Campus, Cascajoso and Bosque Escuela. The total deposition for secondary components for the Bosque Escuela,
Cantú et al., Retorno potencial de nutrimentos...
149
La deposición anual de Ca para los componentes secundarios fue más alta en Crucitas, y le siguieron en orden: Campus, Cascajoso y Bosque Escuela; la deposición de K, Mg y P presentó el mismo comportamiento. La deposición total de macronutrimentos (Ca+K+Mg+P) en los componentes secundarios para el Bosque Escuela, Crucitas, Campus y Cascajoso fue de 39.5, 152.1, 100.5 y 84 kg ha-1 año-1, respectivamente.
Con respecto a los micronutrimentos, la estimación anual de Fe para los componentes secundarios resultó alta en los sitios Crucitas y Bosque Escuela, seguida por Cascajoso y Campus. También, el aporte de Mn, Zn y Cu fue superior en Crucitas y decreció en Campus, Bosque Escuela y Cascajoso, solo que para Cu el orden de disminución fue Campus, Cascajoso y Bosque Escuela. La deposición total para los componentes secundarios para el Bosque Escuela, Crucitas, Campus y Cascajoso fue de 362.9, 588.5, 234.9 y 218.3 g ha-1 año-1, respectivamente. Sin importar el sitio, el orden en la deposición correspondió a Fe > Mn > Zn > Cu; un comportamiento similar se observó para las bajas, excepto de Crucitas, donde el orden fue: Mn > Fe > Zn > Cu (Cuadro 6).
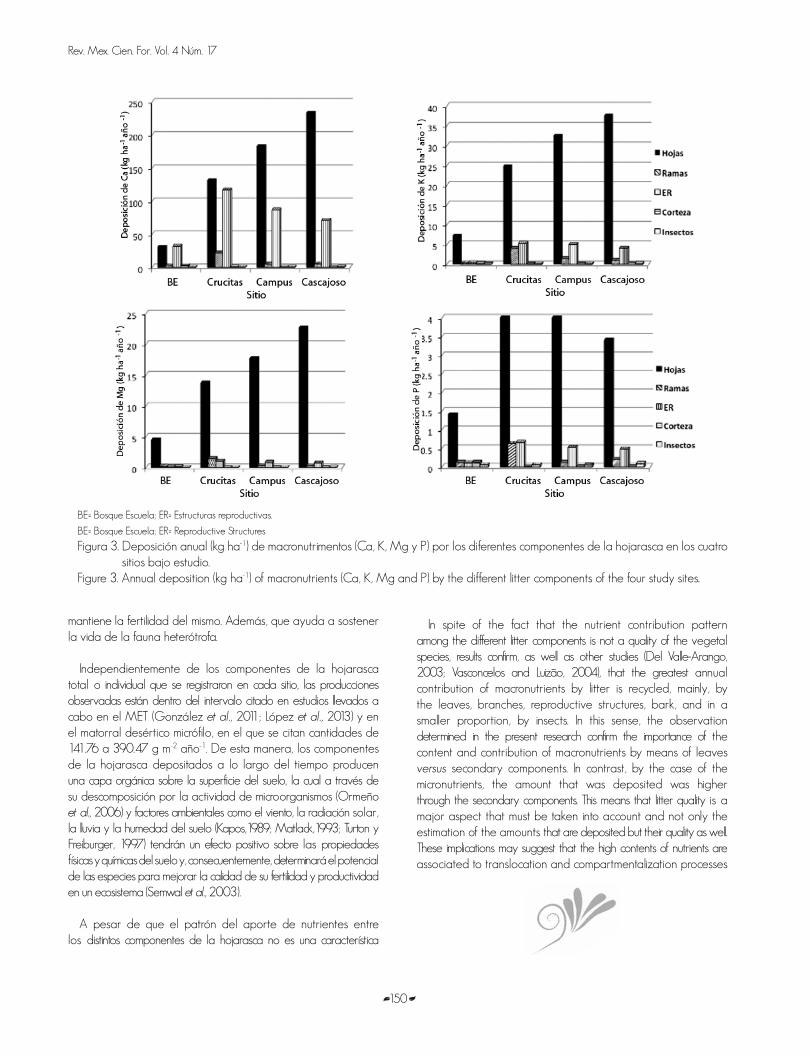
Es importante señalar que los resultados del componente principal (hojas) representaron en promedio 52% en la deposición total de macronutrimentos en Bosque Escuela y Crucitas, mientras que en Cascajoso y Campus constituyó 78 y 70%, respectivamente. En contraste, el considerar los micronutrimentos para los componentes secundarios su contribución varió de 93 a 99% del total de la deposición anual, por lo que estos conformaron la fuente principal de retorno potencial de micronutrimentos en los cuatro sitios investigados; mientras que las hojas no figuraron en la participación del retorno de Cu, Fe, Mn y Zn (Figura 4).
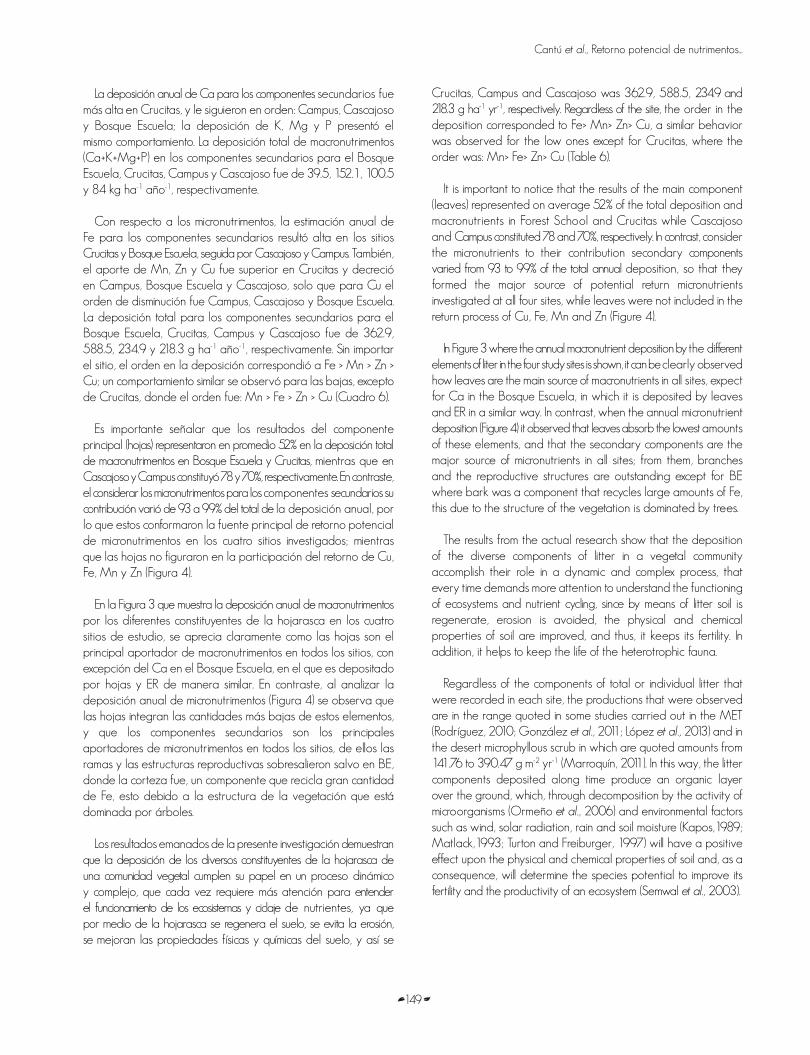
En la Figura 3 que muestra la deposición anual de macronutrimentos por los diferentes constituyentes de la hojarasca en los cuatro sitios de estudio, se aprecia claramente como las hojas son el principal aportador de macronutrimentos en todos los sitios, con excepción del Ca en el Bosque Escuela, en el que es depositado por hojas y ER de manera similar. En contraste, al analizar la deposición anual de micronutrimentos (Figura 4) se observa que las hojas integran las cantidades más bajas de estos elementos, y que los componentes secundarios son los principales aportadores de micronutrimentos en todos los sitios, de ellos las ramas y las estructuras reproductivas sobresalieron salvo en BE, donde la corteza fue, un componente que recicla gran cantidad de Fe, esto debido a la estructura de la vegetación que está dominada por árboles.
Los resultados emanados de la presente investigación demuestran que la deposición de los diversos constituyentes de la hojarasca de una comunidad vegetal cumplen su papel en un proceso dinámico y complejo, que cada vez requiere más atención para entender el funcionamiento de los ecosistemas y ciclaje de nutrientes, ya que por medio de la hojarasca se regenera el suelo, se evita la erosión, se mejoran las propiedades físicas y químicas del suelo, y así se
Crucitas, Campus and Cascajoso was 362.9, 588.5, 234.9 and 218.3 g ha-1 yr-1, respectively. Regardless of the site, the order in the deposition corresponded to Fe> Mn> Zn> Cu, a similar behavior was observed for the low ones except for Crucitas, where the order was: Mn> Fe> Zn> Cu (Table 6).
It is important to notice that the results of the main component (leaves) represented on average 52% of the total deposition and macronutrients in Forest School and Crucitas while Cascajoso and Campus constituted 78 and 70%, respectively. In contrast, consider the micronutrients to their contribution secondary components varied from 93 to 99% of the total annual deposition, so that they formed the major source of potential return micronutrients investigated at all four sites, while leaves were not included in the return process of Cu, Fe, Mn and Zn (Figure 4).
In Figure 3 where the annual macronutrient deposition by the different elements of liter in the four study sites is shown, it can be clearly observed how leaves are the main source of macronutrients in all sites, expect for Ca in the Bosque Escuela, in which it is deposited by leaves and ER in a similar way. In contrast, when the annual micronutrient deposition (Figure 4) it observed that leaves absorb the lowest amounts of these elements, and that the secondary components are the major source of micronutrients in all sites; from them, branches and the reproductive structures are outstanding except for BE where bark was a component that recycles large amounts of Fe, this due to the structure of the vegetation is dominated by trees.
The results from the actual research show that the deposition of the diverse components of litter in a vegetal community accomplish their role in a dynamic and complex process, that every time demands more attention to understand the functioning of ecosystems and nutrient cycling, since by means of litter soil is regenerate, erosion is avoided, the physical and chemical properties of soil are improved, and thus, it keeps its fertility. In addition, it helps to keep the life of the heterotrophic fauna.
Regardless of the components of total or individual litter that were recorded in each site, the productions that were observed are in the range quoted in some studies carried out in the MET (Rodríguez, 2010; González et al., 2011; López et al., 2013) and in the desert microphyllous scrub in which are quoted amounts from 141.76 to 390.47 g m-2 yr-1 (Marroquín, 2011). In this way, the litter components deposited along time produce an organic layer over the ground, which, through decomposition by the activity of microorganisms (Ormeño et al., 2006) and environmental factors such as wind, solar radiation, rain and soil moisture (Kapos,1989; Matlack,1993; Turton and Freiburger, 1997) will have a positive effect upon the physical and chemical properties of soil and, as a consequence, will determine the species potential to improve its fertility and the productivity of an ecosystem (Semwal et al., 2003).
Rev. Mex. Cien. For. Vol. 4 Núm. 17
150
BE= Bosque Escuela; ER= Estructuras reproductivas.
BE= Bosque Escuela; ER= Reproductive Structures
Figura 3. Deposición anual (kg ha-1) de macronutrimentos (Ca, K, Mg y P) por los diferentes componentes de la hojarasca en los cuatro sitios bajo estudio.
Figure 3. Annual deposition (kg ha-1) of macronutrients (Ca, K, Mg and P) by the different litter components of the four study sites.
mantiene la fertilidad del mismo. Además, que ayuda a sostener la vida de la fauna heterótrofa.
Independientemente de los componentes de la hojarasca total o individual que se registraron en cada sitio, las producciones observadas están dentro del intervalo citado en estudios llevados a cabo en el MET (González et al., 2011; López et al., 2013) y en el matorral desértico micrófilo, en el que se citan cantidades de 141.76 a 390.47 g m-2 año-1. De esta manera, los componentes de la hojarasca depositados a lo largo del tiempo producen una capa orgánica sobre la superficie del suelo, la cual a través de su descomposición por la actividad de microorganismos (Ormeño et al., 2006) y factores ambientales como el viento, la radiación solar, la lluvia y la humedad del suelo (Kapos,1989; Matlack,1993; Turton y Freiburger, 1997) tendrán un efecto positivo sobre las propiedades físicas y químicas del suelo y, consecuentemente, determinará el potencial de las especies para mejorar la calidad de su fertilidad y productividad en un ecosistema (Semwal et al., 2003).
A pesar de que el patrón del aporte de nutrientes entre los distintos componentes de la hojarasca no es una característica
In spite of the fact that the nutrient contribution pattern among the different litter components is not a quality of the vegetal species, results confirm, as well as other studies (Del Valle-Arango, 2003; Vasconcelos and Luizão, 2004), that the greatest annual contribution of macronutrients by litter is recycled, mainly, by the leaves, branches, reproductive structures, bark, and in a smaller proportion, by insects. In this sense, the observation determined in the present research confirm the importance of the content and contribution of macronutrients by means of leaves versus secondary components. In contrast, by the case of the micronutrients, the amount that was deposited was higher through the secondary components. This means that litter quality is a major aspect that must be taken into account and not only the estimation of the amounts that are deposited but their quality as well. These implications may suggest that the high contents of nutrients are associated to translocation and compartmentalization processes
Cantú et al., Retorno potencial de nutrimentos...
151
de las especies vegetales, los resultados evidencian, al igual que otros estudios (Del Valle-Arango, 2003; Vasconcelos y Luizâo, 2004), que la mayor contribución anual de macronutrimentos por la hojarasca es reciclada principalmente por las hojas, ramas, las estructuras reproductivas, corteza, y, en menor grado, por insectos. En este sentido, las observaciones determinadas en la presente investigación confirman la importancia del contenido y aporte de macronutrimentos mediante las hojas versus componentes secundarios. En cambio, para el caso de los micronutrimentos, la cantidad depositada fue superior a través de los componentes secundarios. Esto indica que la calidad de hojarasca es un aspecto importante que se debe tomar en cuenta y no solo la estimación de cantidades depositadas, sino que también su calidad. Estas implicaciones pueden plantear que los altos contenidos de nutrimentos estén asociados a procesos de translocación y compartimentación hacia la hoja o componentes secundarios antes de su abscisión, a la promoción de procesos fenológicos y fisiológicos, o bien a condiciones ambientales que permitieron una alta disponibilidad y, consecuentemente, una mayor absorción. No obstante, otras investigaciones han demostrado que la concentración de nutrimentos es más alta en las hojas que en otros componentes (Yang et al., 2006).
to the leaf or secondary components before its abscission, to the promotion of phenological and physiological processes, or even environmental conditions that allowed a higher availability and, consequently, a greater absorption. Nevertheless, other research studies have demonstrated that the concentration of nutrients is higher in leaves than in other components (Yang et al., 2006).
In general terms, the statistical differences of the Kruskal-Wallis test that were observed among the vegetal communities that were studied, are not sistematically associated with specific sampling dates or related to the special behavior of the sites or of the litter components. Also, the production and chemistry of litter in forest ecosystems is determined by the age of the stand and rains (Lawrence, 2005), species composition (Pavón et al., 2005; Sariyildiz and Anderson, 2005), soils and the availability of nutrients (Read and Lawrence, 2003; Vasconcelos and Luizão, 2004; Dent et al., 2006), the structure of the stand (Yang et al., 2006; Zhou et al., 2007) and the successional stage (Yankelevich et al., 2006). In addition, the nutrient return rates to the forest soil are controlled not only but the amount of litter production but also by the concentration of nutrients it has (Yang et al., 2006; Mlambo and Nyathi, 2007). Previous studies at northeastern Mexico revealed that during the wet months (August and September) when rainfall
BE= Bosque Escuela; ER= Estructuras reproductivas.BE= Bosque Escuela; ER= Reproductive Structures
Figura 4. Deposición anual (g ha-1) de micronutrimentos (Cu, Fe, Mn y Zn) por los diferentes componentes de la hojarasca en los cuatro sitios bajo estudio.
Figure 4. Annual deposition (g ha-1) of macronutrients (Cu, Fe, Mn and Zn) by the different litter components of the four study sites.
Rev. Mex. Cien. For. Vol. 4 Núm. 17
152
En general, las diferencias estadísticas de la prueba Kruskal-Wallis que se observaron entre las comunidades vegetales estudiadas, no se asocian sistemáticamente con fechas de muestreo específicas o relacionadas con el comportamiento especial de los sitios, o de los componentes de la hojarasca. Asimismo la producción y química de la hojarasca en ecosistemas forestales es determinada por la edad del rodal y las precipitaciones (Lawrence, 2005), la composición de especies (Pavón et al., 2005; Sariyildiz y Anderson, 2005), los suelos y la disponibilidad de nutrientes (Read y Lawrence, 2003; Vasconcelos y Luizão, 2004; Dent et al., 2006), la estructura del rodal (Yang et al., 2006; Zhou et al., 2007) y la etapa sucesional (Yankelevich et al., 2006). Además, las tasas de retorno de nutrimentos al suelo forestal son controladas no solamente por la cantidad de producción de hojarasca, sino también por la concentración de nutrientes en los componentes de la misma (Yang et al., 2006; Mlambo y Nyathi, 2007). Estudios previos en el noreste de México revelaron que durante los meses húmedos (agosto y septiembre), cuando la lluvia es fuerte, las ramas y los frutos fueron los principales constituyentes de la hojarasca; mientras que, en los meses secos de invierno había una mayor deposición de hojas debido a la sequía y temperaturas bajo cero registradas (González et al., 2007).
La acumulación de la caída de la hojarasca es un proceso vital en la ecología y funcionamiento de las comunidades vegetales y por ello los resultados observados en el presente estudio evidencian la existencia de una variación espacial y temporal, en la deposición de los componentes secundarios de la hojarasca a través del periodo de estudio. También, se aprecia que hay diferencias en la calidad nutrimental de los componentes secundarios, lo cual se comprobó mediante al aporte de micronutrimentos. Dichas observaciones confirman la relevancia de la concentración y deposición de bioelementos, principalmente micronutrimentos, por las estructuras reproductivas, ramas, corteza y en menor grado por insectos.
CONCLUSIONES
El aporte anual de micronutrimentos por los componentes secundarios representó la fuente principal de su reciclaje en los cuatro sitios investigados. De los macro y micronutrimentos considerados, el Ca y el Fe, respectivamente, son los que presentan mayores deposiciones anuales. En el aporte de macronutrimentos en los componentes secundarios se distribuyó de la siguiente manera: Ca > Mg > K > P, mientras que en hojas se dio como sigue: Ca > K > Mg > P. En el caso de la deposición de micronutrimentos tanto en hojas como en componentes secundarios se registra en el orden: Fe > Mn > Zn > Cu. De la deposición de macronutrimentos en los componentes secundarios, el Ca y K se reciclan, principalmente, por estructuras reproductivas en los cuatro sitios de estudio, mientras que el Mg se deposita mayoritariamente por las ramas en Crucitas y Bosque Escuela y por estructuras reproductivas en Campus y Cascajoso. El P lo hace a través de estructuras reproductivas en todos los sitios, salvo en Bosque
is intense, branches and fruits were the major constituent of litter; while in the dry months of winter, there was a greater leaf deposition due to drought and temperatures below zero (González et al., 2007).
The accumulation of litter fall is a vital process in the ecology and functioning of the vegetal communities, and thus, the observed results in the present study confirm the existence of a spatial and temporal variation, in the deposition of secondary components of litter along the study period. Also, it is noted that there are differences in the nutritious quality of the secondary components, which was proved by the contribution of micronutrients. Such observations confirm the relevance of the concentration and deposition of bioelements, mainly micronutrients, by the reproductive structures, branches, bark, and in a lower rate, by insects.
CONCLUSIONS
The annual contribution of micronutrients by the secondary components was the major source of recycling of the four sites that were studied. Of the macro and micronutrients considered here, Ca and Fe, respectively make the most important contributions per year. The contribution in the secondary components was in the following way: Ca > Mg > K > P, while in leaves it was Ca > K > Mg > P. In the case of the deposition of micronutrients both in leaves and in secondary components, the order was Fe > Mn > Zn > Cu. Of the macronutrient deposition, Ca and K are recycled, mainly, by reproductive structures in the four study sites, while Mg is deposited, in major rate, by branches in Crucitas and Bosque Escuela and by reproductive structures in Campus and Cascajoso. P does it by reproductive structures in all the study sites, except for Bosque Escuela where it is returned by all the secondary components.
Micronutrients in Cascajoso and Campus are recycled by means of the reproductive structures, in Crucitas by branches and in Bosque Escuela by bark.
Of the secondary components that were studied, the reproductive structures (flowers, fruits and seeds) are the most important component in the deposition of the macro and micronutrients in the four vegetation communities. In spite of the fact that the three study sites belong to the same vegetation community (MET), they differ in the potential return of nutrients, which is related to the conditions of soil, floral structure and composition, litter quality, seasonal changes and the variations in temperature and precipitation.
ACKNOWLEDGEMENTS
The authors would like to thank the Universidad Autónoma de Nuevo León for having provided the support to accomplish this research. Also, the technical assistance to TQ.L. María Inés Yáñez, TQ.L. Elsa Dolores González and Manuel Hernández in the laboratory and field stages of the project. In addition, to the two anonymous reviewers for improving this paper by being critical with the present study.
End of the English version
Cantú et al., Retorno potencial de nutrimentos...
153
Escuela en donde se reintegra por todos los componentes secundarios.
Los micronutrimentos, en Cascajoso y Campus se reciclan por medio de las estructuras reproductivas, en Crucitas por ramas y en Bosque Escuela por corteza.
De los componentes secundarios estudiados, las estructuras reproductivas (flores, frutos y semillas) son el componente más importante en la deposición de macro y micronutrimentos en las cuatro comunidades de vegetación. A pesar de que tres sitios de estudio pertenecen al mismo tipo de comunidad vegetal (MET), estos difieren en el retorno potencial de nutrimentos, lo que se relaciona con las condiciones edáficas, la estructura y composición florística, la calidad de hojarasca, los cambios estacionales, y las variaciones de temperatura y precipitación.
AGRADECIMIENTOS
Los autores agradecen a la Universidad Autónoma de Nuevo León por el apoyo brindado para la realización de la presente investigación. Asimismo se agradece la asistencia técnica de laboratorio y campo a TQ.L. María Inés Yáñez, TQ.L. Elsa Dolores González y Manuel Hernández,. Adicionalmente, se agradece a dos revisores anónimos por enriquecer y hacer observaciones críticas al presente estudio.
REFERENCIAS
Association of Official Analytical Chemists (AOAC). 1997. Official methods of analysis. 16th Edition, AOAC. Gaithersburg, MD. USA. 1 298 p.
Bosco I., J., J. A. Blanco y F. J. Castillo. 2004. Gestión forestal y ciclos de nutrientes en el marco del cambio global. In:. Valladares, F. (ed.). Ecología del bosque mediterráneo en un mundo cambiante Ministerio de Medio Ambiente, EGRAF, S. A., Madrid, España. pp. 479-506
Campos G., J., J. J. Camarero y E. Gutiérrez. 1998. Crecimiento estacional y caída de acículas en Pinus sylvestris y P. uncinata. Investigaciones Agrícolas: Sistema de Recursos Forestales. 7:156-172.
Del Valle-Arango, J. I. 2003. Cantidad, calidad y nutrientes reciclados por la hojarasca fina de bosques pantanosos del pacífico sur Colombiano. Interciencia 28:443-449.
Dent, D. H., R. Bagchi, D. R. Robinson, L. N. Majalap and D. F. R .P. Burslem. 2006. Nutrient fluxes via litterfall and leaf litter decomposition vary across a gradient of soil nutrient supply in a lowland tropical rain forest. Plant and Soil 288:197-215.
Domínguez G., T. 2009. Deposición de hojarasca y retorno potencial de nutrimentos en diferentes comunidades de vegetación. Tesis de Maestría, Facultad de Ciencias Forestales, Universidad Autónoma de Nuevo León. Linares, N. L. México. 113 p.
González R., H., I. Cantú S., R. G. Ramírez L. and M. V. Gómez M. 2007. Litterfall deposition in subtropical woodlands, Northeastern Mexico. In: Tielkes, E. (ed.) Proceedings of the Deutscher Tropentag 2007, Cuvillier Verlag Göttingen.. October 9 - 11, 2007. Witzenhausen, Germany. pp. 1-10.
González R., H., I. Cantú S., R. G. Ramírez L., M. V. Gómez M., T. G. Domínguez G., J. Bravo G. and R. K. Maiti. 2008. Spatial and seasonal litterfall deposition pattern in the Tamaulipan thorscrub, Northeastern México. International Journal of Agriculture Environment and Biotechnology 1:177-181.
González R., H., T. G. Domínguez G., I. Cantú S., M. V. Gómez M., R. G. Ramírez L., M. Pando M. and C. Fernández J. 2011. Litterfall deposition and leaf litter nutrient return in different locations at Northeastern México. Plant Ecology 212: 1747-1757.
Jordan, C. F. 1982. The nutrient balance of an Amazonian rain forest. Ecology 63: 647-654.
Jorgensen, J. R., C. G. Well and L. J. Metz. 1975. The nutrient cycle: key to continuous forest production. J. of Forest. 73:400-403.
Kapos, V. 1989. Effects of isolation on the water status of forest patches in the Brazilian Amazon. J. Trop. Ecol. 5:173-185.
Lawrence, D. 2005. Regional-scale variation in litter production and seasonality in tropical dry forests of Southern Mexico. Biotropica 37: 561-570.
López J., M. H., H. González R., R. G. Ramírez L., I. Cantú S., M. V. Gómez M., M. Pando M. y E. Estrada C. 2013. Producción de hojarasca y retorno potencial de nutrientes en tres sitios del estado de Nuevo León, México. Polibotanica 35:41-64
Lugo A., E., E. Cuevas and M. J. Sánchez. 1990. Nutrients and mass in litter and top soil of ten tropical tree plantations. Plant and Soil 125:263–280.
Matlack, G. 1993. Microenvironment variation within and among forest edge sites in the eastern United States. Biol. Conser. 66:185-194.
Melillo, J. and J. Aber. 1982. Nitrogen and ligning control of hardwood leaf litter decomposition dynamics. Ecology 63:621-626.
Mlambo, D. and P. Nyathi. 2007. Litterfall and nutrient return in a semi-arid southern African savanna woodland dominated by Colophospermum mopane. Plant Ecol. 196: 101-110.
Ormeño, E., V. Baldy, C. Ballíni, M. Larchevêque, C. Périssol and C. Fernández. 2006. Effects of environmental factors and leaf chemistry on leaf litter colonization by fungi in a Mediterranean shrubland. Pedobiologia. 50:1-10.
Ott, L. 1993. An introduction to statistical methods and data analysis. 2nd Edition. Duxbury Press. Boston, MA USA. 775 p.

Rev. Mex. Cien. For. Vol. 4 Núm. 17
154
Pavón N., P., O. Briones and J. Flores R. 2005. Litterfall production and nitrogen content in an intertropical semi-arid Mexican scrub. J. Arid Environ. 60:1-13.
Read, L. and D. Lawrence. 2003. Litter nutrient dynamics during succession in dry tropical forests of Yucatan: regional and seasonal effects. Ecosystems 6: 747-761.
Reid, N., J. Marroquín and M. P. Beyer. 1990. Utilization of shrubs and trees for browse, fuel-wood and timber in the Tamaulipan thornscrub, northeastern Mexico. Forest Ecol. Manag. 36:61-79.
Sariyildiz, T. and J. M. Anderson. 2005. Variation in the chemical composition of green leaves and leaf litters from three deciduous tree species growing on different soil types. Forest Ecol. Manag. 210: 303-319.
Semwal, R. L., R. K. Maikhuri, K. S. Rao, K. K. Sen and K. G. Saxena. 2003. Leaf litter decomposition and nutrient release patterns of six multipurpose tree species of central Himalaya, India. Biomass Bioenerg. 24:3-11.
Silva I., C. and H. González R. 2001. Interception loss, throughfall and stem flow chemistry in pine and oak forests in northeastern Mexico. Tree Physiology. 21:1009–1013.
Statistical Package for the Social Sciences (SPSS). 2009. Standard released version 17.0 for Windows, SPSS Inc. Chicago, IL USA.
Steubing, L., R. Godoy and M. Alberdi. 2001. Métodos de ecología vegetal. Editorial Universitaria. Santiago, Chile. 345 p.
Steel, R. G. D. and J. H. Torrie. 1980. Principles and procedures of statistics. A biometrical approach, (2nd Ed.). McGraw-Hill Book Co. New York, NY. USA. 633 p.
Sundarapandian, S. M. and P. S. Swamy. 1999. Litter production and leaf-litter decomposition of selected tree species in a tropical forest at Kodayar in the Western Ghats, India. Forest Ecol. Manag. 123:231-244
Turton, S. M. and H. J. Freiburger. 1997. Edge and aspect effects on the microclimate of a small tropical forest remnant on the Atherton Tableland, Northeastern Australia. In: Laurence, W. F. and R. O. Bierregaard Jr. (eds.). Tropical forest remnants: ecology, management and conservation of fragmented communities. University of Chicago Press. Chicago, IL. USA. pp. 45-54.
Vargas L., B. 1999. Caracterización de la productividad y estructura de Pinus hartwegii Lindl en tres gradientes altitudinales en el cerro Potosí, Galeana, Nuevo León. Tesis de Maestría. Facultad de Ciencias Forestales. Universidad Autónoma de Nuevo León. Linares, N.L. México. 93 p.
Vasconcelos H., L. and F. J. Luizão. 2004. Litter production and litter nutrient concentrations in a fragmented Amazonian Landscape. Ecol. App. 14:884-892.
Vitousek, P. M. 1984. Litterfall, nutrient cycling and nutrient limitation in tropical forests. Ecology. 65:285-298
Yang, W. Q., K. Y. Wang, S. Kellomäki and J. Zhang. 2006. Annual and monthly variations in litter macronutrients of three subalpine forests in Western China. Pedosphere. 16:788-798.
Yankelevich, S. N., C. Fragoso, A. C. Newton, G. Russell and O. W. Heal. 2006. Spatial patchiness of litter, nutrients and macroinvertebrates during secondary succession in a tropical montane cloud forest in Mexico. Plant Soil. 286: 123-139.
Zhou, G., L. Guam, X. Wei, D. Zhang, Q. Zhang, J. Yan, D. Wen, J. Liu, S. Liu, Z. Huang, G. Kong, J. Mo and A. Yu. 2007. Litterfall production along successional and altitudinal gradients of subtropical monsoon evergreen broadleaved forest in Guangdong, China. Plant Ecol. 188: 77-89.

Cantú et al., Retorno potencial de nutrimentos...
155
Fernando González Saldívar, 2013.