PROYECTO TIERRA DEL FUEGO - cesni-biblioteca.org · formación. En ese nexo vivo entre educación...
114
Diagnóstico Basal de Salud y Nutrición Base-line Health and Nutrition Survey PROYECTO TIERRA DEL FUEGO FUNDACIÓN JORGE MACRI 1995 CESNI CENTRO DE ESTUDIOS SOBRE NUTRICION INFANTIL ▲▲▲▲▲▲▲▲▲▲▲▲▲▲▲▲▲▲▲▲▲▲▲▲▲▲▲▲▲▲
Transcript of PROYECTO TIERRA DEL FUEGO - cesni-biblioteca.org · formación. En ese nexo vivo entre educación...

Diagnóstico Basal de Salud y NutriciónBase-line Health and Nutrition Survey
PROYECTOTIERRA DEL FUEGO
FUNDACIÓN JORGE MACRI1995
CESNI CENTRO DE ESTUDIOS SOBRE NUTRICION INFANTIL
▲▲
▲▲
▲▲
▲▲
▲▲
▲▲
▲▲
▲▲
▲▲
▲▲
▲▲
▲▲
▲▲
▲▲
▲▲
PROYECTOTIERRA DEL FUEGO
FU
ND A C
I
ON
JO
R
GE M
A
CR
I FUNDACION JORGE MACRI
1994 - 2000REPUBLICA ARGENTINA

DIAGNOSTICOBASAL DE SALUDY NUTRICION
BASE-LINE HEALTHAND NUTRITIONSURVEY
PROYECTOTIERRA DEL FUEGO
FU
ND A C
I
ON
JO
R
GE M
A
CR
I FUNDACION JORGE MACRI
CESNICENTRO DE ESTUDIOS SOBRE NUTRICIÓN INFANTIL

© 1995, CESNI / FUNDACION JORGE MACRI
Hecho en depósito que marca la ley.Queda autorizada la reproducción total o parcial,asumiendo el compromiso de citarel nombre de la fuente.
9 FUNDACIÓN JORGE MACRI71 FUNDACIÓN JORGE MACRI
11 CENTRO DE ESTUDIOS SOBRE NUTRICIÓN INFANTIL - CESNI 73 CENTER FOR STUDIES ON INFANT NUTRITION - CESNI
13 PROYECTO TIERRA DEL FUEGO, UNA SÍNTESIS75 THE TIERRA DEL FUEGO PROJECT, A SUMMARY
21 EL PROYECTO TIERRA DEL FUEGO83 THE TIERRA DEL FUEGO PROJECT
26 ACCIONES EN LA PREVENCIÓN DE LA DESNUTRICIÓN OCULTAY DE LA INADECUADA NUTRICIÓN EN GENERAL
88 ACTIVITIES TO PREVENT HIDDEN MALNUTRITIONAND MALNUTRITION IN GENERAL
28 PROGRAMA DE ESTIMULACIÓN PARA LOS PRIMEROS AÑOS DE VIDA
90 EARLY STIMULATION PROGRAM FOR THE FIRST TWO YEARS OF LIFE
29 CUIDADO PERINATAL Y DEL EMBARAZO
91 PRE- AND POST-NATAL CARE
30 PROGRAMA DE EDUCACIÓN NUTRICIONAL Y SANITARIAPARA LA COMUNIDAD
92 COMMUNITY NUTRITION AND HEALTHEDUCATION PROGRAM
33 DIAGNÓSTICO BASAL DE SALUD Y NUTRICIÓN95 BASE-LINE HEALTH AND NUTRITION SURVEY
34 METODOLOGÍA DE LA ENCUESTA
96 SURVEY METHODOLOGY
39 RESULTADOS
99 RESULTS
63 REFERENCIAS125 REFERENCES
65 TIERRA DEL FUEGO: DE AYER A HOYNATALIE GOODALL
127 TIERRA DEL FUEGO: YESTERDAY AND TODAYBY NATALIE GOODALL
INDICECONTENTS
P R O Y E C T O T I E R R A D E L F U E G O 9
FU
ND A C
I
ON
JO
R
GE M
A
CR
I
La Fundación Jorge Macri orienta su compromiso social en proyectos y programasque aspiran a actuar directamente sobre los factores reales de cambio. Dichocompromiso social tiene, para nosotros, a la educación como eje principal.
La presente publicación es testimonio de nuestro interés por el destinatario de laeducación: el educando mismo, cuyo estado nutricional y estimulación tempranacondicionan el proceso educativo y su futuro profesional.
A tal efecto, estamos convencidos de que nadie puede suplantar a la familia deleducando y a la comunidad. Por este motivo, el Proyecto Tierra del Fuego hatransitado desde su lanzamiento por el camino de la acción mancomunada conpadres, con líderes sociales y con instituciones arraigadas en el medio local de laprovincia de Tierra del Fuego.
Asimismo, en el amplio campo de la educación, desde el cual aspiramos acontribuír al desarrollo económico y social de nuestro país, la Fundación JorgeMacri ha decidido abordar con especial énfasis la temática de la educacióntecnológica a nivel escolar secundario .
La dignidad humana se vincula en forma estrecha con las pobilidades de integrarseactivamente al tejido social. Esta integración se expresa, entre otras muchas formas,a través del trabajo, y trasciende ampliamente los límites de la remuneracióneconómica, ya que el trabajo es, principalmente, un vehículo de la realizaciónpersonal y de la relación comunitaria con el prójimo.
En nuestros días, y en forma creciente, el trabajo es inseparable de la educación.Hoy son cada vez menos los puestos de trabajo que no requieran calificación yformación. En ese nexo vivo entre educación -especialmente la educacióntecnológica, la más apremiada por los cambios-, y el mundo del trabajo, es endonde la Fundación Jorge Macri manifiesta también su preocupación social,mediante el proyecto de un centro educativo que está en proceso de concreción.
Mientras esa tarea avanza, el Proyecto Tierra del Fuego ha cumplido su primeraetapa y esta publicación es demostrativa de todo lo que se ha hecho, así comotambién de las acciones que se están llevando adelante y de las que seinstrumentarán en el futuro.
Aspiramos a que este Proyecto, que se extiende hasta el año 2000, sea aprovechadoy proyectado hacia todo el territorio del país. El sector empresario y lasinstituciones no gubernamentales podrán multiplicar iniciativas que, como lapresente, se proponen brindar respuesta a los requerimientos estructurales denuestra sociedad.
FRANCISCO MACRIPresidente

D I A G N O S T I C O B A S A L D E S A L U D Y N U T R I C I O N1 0
Agradecimientos
La Fundación Jorge Macri y el CESNI agradecenmuy especialmente la colaboración de la Armada Argentina.
También agradecen a las siguientes instituciones científicas:
Hospital de Pediatría Prof. Dr. J. P. Garrahan, Buenos Aires.Organización Panamericana de la Salud, Washington DC, USA.Universidad de California en Berkeley, USA.Universidad de California en Davis, USA.Universidad de Iowa, Departamento de Pediatría, USA.Universidad de Johns Hopkins, Escuela de Salud Pública, USA.Universidad del Salvador, Buenos Aires.
A los Clubes de Leones de Río Grande y Ushuaiay Rotary Club de Río Grande Ushuaia.
Al Gobierno y autoridades de la provinciade Tierra del Fuego y ciudad de Ushuaia.
Y particularmente a toda la comunidad fueguina.
P R O Y E C T O T I E R R A D E L F U E G O 1 1
El Centro de Estudios SobreNutrición Infantil, CESNI, naceen Buenos Aires el 18 de juliode 1976, con la finalidad depromover investigaciones ydesarrollar programasasistenciales y docentes, paradar solución a los problemasnutricionales y de salud delniño y su familia.
Es una entidad sin finesde lucro y de bien públicocon reconocimiento nacionaly municipal. En 1992 fuédesignado Centro Colaborativoen Docencia e Investigación porla Organización Mundial de laSalud (OMS) y OrganizaciónPanamericana de la Salud(OPS).
Participaron delDiagnóstico Basal de Situación:
DIRECCIÓN GENERAL:ESTEBAN CARMUEGAALEJANDRO O’DONNELL
DISEÑO CIENTÍFICO:ALEJANDRO O’DONNELLESTEBAN CARMUEGAELVIRA CALVOERNESTO POLLIT
ADMINISTRACIÓN GRAL. Y RELACIONES INSTITUCIONALES:ANA ARACAMA ZORRAQUÍN
COORDINACIÓN DEL EQUIPO DE TERRENO:PABLO DURÁN
COORDINACIÓN DE LABORATORIO:RAÚL UICICH
COORDINACIÓN ENCUESTA DE DESARROLLO:TERESA TORRALVA
LABORATORIO BUENOS AIRES:ALICIA ROVIROSAVICTORIA CERVERELLAFABIANA ALBERTOJAVIER MORENOKARINA ROSENBLATT
LABORATORIO EN TERRENO:CÉLICA BERNARDINI
RADIOINMUNOENSAYO:MARÍA LUISA DIAZ
ENCUESTA DIETÉTICA Y DE SALUD:VERÓNICA GODINO (NUTR. TERRENO)EDITH ALVAREZ (NUTR. TERRENO)REGINA TRAVERSO (NUTR. TERRENO)CONSTANZA MACHAIN BARZI (NUTR. ANÁLISIS)PATRICIA GIACOMELLI (NUTR. ANÁLISIS)CAROLINA SCAIOLA DE ARIZU (NUTR. ANÁLISIS)MIRIAM ROSENDI (ENF. TERRENO)
ENCUESTA DE DESARROLLO:MICAELA MANSO (PSIC. TERRENO)ISABEL CUGNASCO (PSIC. TERRENO)FLORENCIA SOUTON (PSIC. TERRENO)MARIETA FERRERO (PSIC. TERRENO)CECILIA FURLONG (PSIC. ANÁLISIS)TERESA PINILLA (PSIC. DIS. ENC.)
ENCUESTA DE EDUCACIÓN:MARÍA TERESA OTERO
CENTRO DE CÓMPUTOS DE CESNI:DIEGO ZITZERERNESTO SURIJÓN FRINIS
SECRETARÍA Y LOGÍSTICA GENERAL:AMALIA ROBREDOMARÍA JOSÉ LASCANO
ASESORÍA DISEÑO MUESTRAL: ALICIA MASAUSTIS
ASESORÍA EN PERINATOLOGÍA:MIGUEL LARGUÍA
ASESORÍA EN ADOLESCENCIA: CARLOS BIANCULLI
ASESORÍA EN DESARROLLO: ERNESTO POLLIT
ASESORÍA EN COMUNICACIÓN A LA COMUNIDAD: ALEJANDRO TORCHIO
CESNICentro de Estudios
Sobre Nutrición Infantil
Centro Colaborador de la OMS
en Investigacióny Docencia en
Nutrición Infantil

P R O Y E C T O T I E R R A D E L F U E G O 1 3
Hoy se define a la salud como el estado que permite la plena inserción social y laboral de las personas en la sociedad en que viven y nosimplemente como la ausencia de enfermedad.
El evento más importante para la futura inserción socialde un individuo es la enseñanza escolar formal. Pero para que un niño puedaaprovechar todo lo que el sistema escolar le ofrece, tieneque haber logrado manifestarplenamente el potencial genético con que fuera dotadopor sus progenitores.
Ello depende de la interacciónde múltiples factores socio-ambientales y de saludque actúan desde el momentomismo de la concepción.
El control temprano y periódicodel embarazo, el cuidado de lamujer embarazada, la prevención del bajo peso de nacimiento, una lactancia materna prolongada, un adecuado estado nutricional incluso en lo referido a ciertosmicronutrientes, y pautas deestimulación oportunas en losmomentos más receptivos deldesarrollo infantil son fundamentales para tal fin.
Muchos de estos problemas que comprometen la futura educabilidad de los niños nohan sido resueltos aún en comunidades que presentanbuenos indicadores socioeconómicos y de salud.
Salud, Nutrición y Medio Ambiente:Condicionantes de la Educabilidad de los Niños
D I A G N O S T I C O B A S A L D E S A L U D Y N U T R I C I O N1 4
La Encuesta de Salud yNutrición -realizada en Tierradel Fuego en virtud de susexcelentes indicadores de saludy elevada proporción depoblación infantil- es el másimportante relevamientorealizado hasta la fecha con elpropósito de describir algunasde estos factores condicionantesde la salud y educabilidad delos niños. Sus conclusiones-que pueden proyectarsea las dos terceras partes dela población de nuestro país-seguramente son la mínimaexpresión de lo que ocurreen comunidades menosprivilegiadas.
Durante la Encuesta seentrevistaron a más de 1200familias seleccionadas en unamuestra representativa al azar,quienes prestaron sucolaboración para las distintasetapas del estudio: diagnósticode salud, encuesta alimentaria,valoración antropométrica yanálisis de laboratorio. Laparticipación fue absolutamentevoluntaria, y menos del 2% dela población se rehusóa brindar su colaboración.
En una segunda etapa serealizaron distintos tests paramedir el grado de estimulaciónambiental y el desarrollointelectual de los niños de 6,12, 24 y 60 meses de edad. Loshallazgos y conclusiones de laEncuesta de Desarrollo Infantilserán motivo de una próximapublicación.
Para la realización delDiagnóstico Basal de Situaciónde Salud, Nutrición y DesarrolloInfantil un equipo deinvestigación del CESNI seestableció en Ushuaia. Las 8000determinaciones de laboratorioy los 1200 test psicológicos danpauta de la magnitud deltrabajo realizado.
La información recabadaconfirmó algunos problemassospechados de existir ennuestro país pero nunca hastahoy demostrados.
Los hallazgos de la Encuestaa nivel de la Provincia son labase para las intervencionesque se llevarán a cabo pararesolver los problemasdetectados.
La Situación de Nuestros Niños

P R O Y E C T O T I E R R A D E L F U E G O 1 5
La prevalencia de lactancia esrelativamente buena: 7% de las madres noamamantaron nunca, 82% dió el pechoentre 1 y 3 meses y 60% entre 3 y 6meses, pero la introducción de otrosalimentos es muy temprana, especialmenteleche de vaca sin fortificar.
La lactancia materna en los estratossociales más bajos es 1 mes más corta queen los estratos más altos.
A pesar de que la lactancia fue másprolongada en las madres quereconocieron a los médicos como una delas fuentes más importantes deinformación de salud, solamente 39% delas familias recibieron información sobre lalactancia antes del parto.
La prevalencia de retraso crónico decrecimiento fue 17% en los adolescentes-en su mayoría nacidos fuera de la isla-y 3% en los lactantes nacidos enTierra del Fuego, sugiriendo que lascondiciones de salud y nutrición actualesson capaces de evitar la desnutricióncrónica.
No existe desnutrición aguda; el principalproblema es la obesidad que afecta a 6%de los lactantes, 8% de los preescolares,14% de los escolares y 22% de losadolescentes.
El riesgo de obesidad infantil fué 13 vecesmayor en las familias con un hijo obeso, enlos adolescentes que permanecieron más de4 horas mirando TV y en los escolares conmayor número de actividadesextracurriculares.
De cada cuatro lactantes tres ingeríanmenos hierro del que necesitaban, dostenían deficiencia de hierro y uno anemia.La insuficiente lactancia materna, laintroducción temprana de leche de vaca sinfortificar y el bajo peso de nacimiento sonalgunos de los factores más importantesrelacionados con ella.
11% de los lactantes y 9% de lospreescolares presentaron deficiencia devitamina A y 17% de los niños menores de6 años de vitamina D. 38% de lasembarazadas también presentarondeficiecia de vitamina D.
La dieta es adecuada en calorías y proteínaspero deficiente en calcio, hierro, vitamina Cy vitamina A y con exceso de colesterol,grasas y grasas saturadas.
La forma de alimentación de las personasencuestadas es prácticamente igual a la delos habitantes de las grandes ciudadesargentinas. El mismo patrón basado en unospocos alimentos básicos, lo que los hacenmás proclives a deficiencias o a excesos y apadecer cambios en el costo de la canastafamiliar no bien algunos de estos productossube de precio por razones estacionales.
Algunos hallazgosrelevantes de la encuesta
D I A G N O S T I C O B A S A L D E S A L U D Y N U T R I C I O N1 6
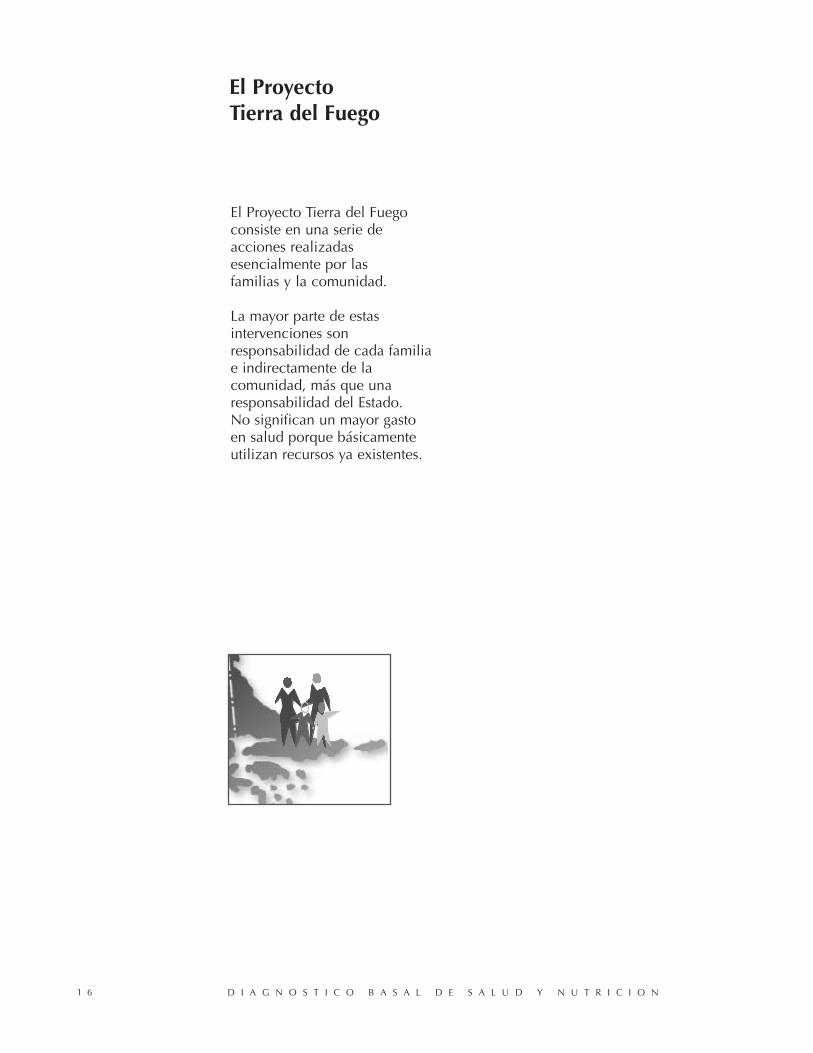
El Proyecto Tierra del Fuegoconsiste en una serie deacciones realizadasesencialmente por las familias y la comunidad.
La mayor parte de estasintervenciones sonresponsabilidad de cada familiae indirectamente de lacomunidad, más que unaresponsabilidad del Estado. No significan un mayor gasto en salud porque básicamenteutilizan recursos ya existentes.
El Proyecto Tierra del Fuego

Cuidado de la Salud.
Alimentación y Nutrición.
Desarrollo Intelectual,Emocional y Social.
P R O Y E C T O T I E R R A D E L F U E G O 1 7
4º Y 5º AÑO
INGRESO
AL
COLEGIO
3º AÑO2º AÑO1º AÑONACIMIENTOEMBARAZOCONCEPCIÓN
CONTROL DEL EMBARAZO
Y CRECIMIENTO FETAL.PREVENCIÓN DE INFECCIONES Y TÓXICOS.
EMBARAZO
Y
SOCIEDAD
PREPARACIÓN
PARA EL
PARTO
PROMOCIÓN
INICIO DE
LACTANCIA
ESTIMULACIÓN
OPORTUNA
FAMILIAR E
INSTITUCIONAL
ESTIMULACIÓN
OPORTUNA
FAMILIAR
CUIDADO DE LA MADRE Y DEL NIÑO.VIGILANCIA DEL CRECIMIENTO.
PROGRAMA DE MEDICINA ANTICIPATORIA.
PREVENCIÓN
DE MALFOR-MACIONES
MEDIANTE
FORTIFICACION
CON FOLATOS.
NUTRICIÓN MATERNA
Y GANANCIA DE PESO.PREVENCION DE
DEFICIENCIAS DE VITAMINA
A, D / FE Y FOLATOS
PREVENCIÓN DE CARENCIASDE MICRONUTRIENTESFE / VIT. D / VIT. A.
PAUTAS DE ALIMENTACIÓN.ALIMENTOS FORTIFICADOS.
SUPLEMENTOS VITAMINICOS.
FORMACIÓN
DE HÁBITOS
SALUDABLES.
PREVENCIÓN
DE OBESIDAD
E HIPERCOLES-TEROLEMIA.
INTER-VENCIONESDURANTE
LA
▲ ▲ ▲ ▲ ▲ ▲ ▲
Programa deintervenciones en:
INTER-VENCIONESDURANTE
EL
INTER-VENCIONESDURANTE
EL
INTER-VENCIONESDURANTE
EL
INTER-VENCIONESDURANTE
EL
INTER-VENCIONESDURANTE
EL
INTER-VENCIONESDURANTE
EL
D I A G N O S T I C O B A S A L D E S A L U D Y N U T R I C I O N1 8
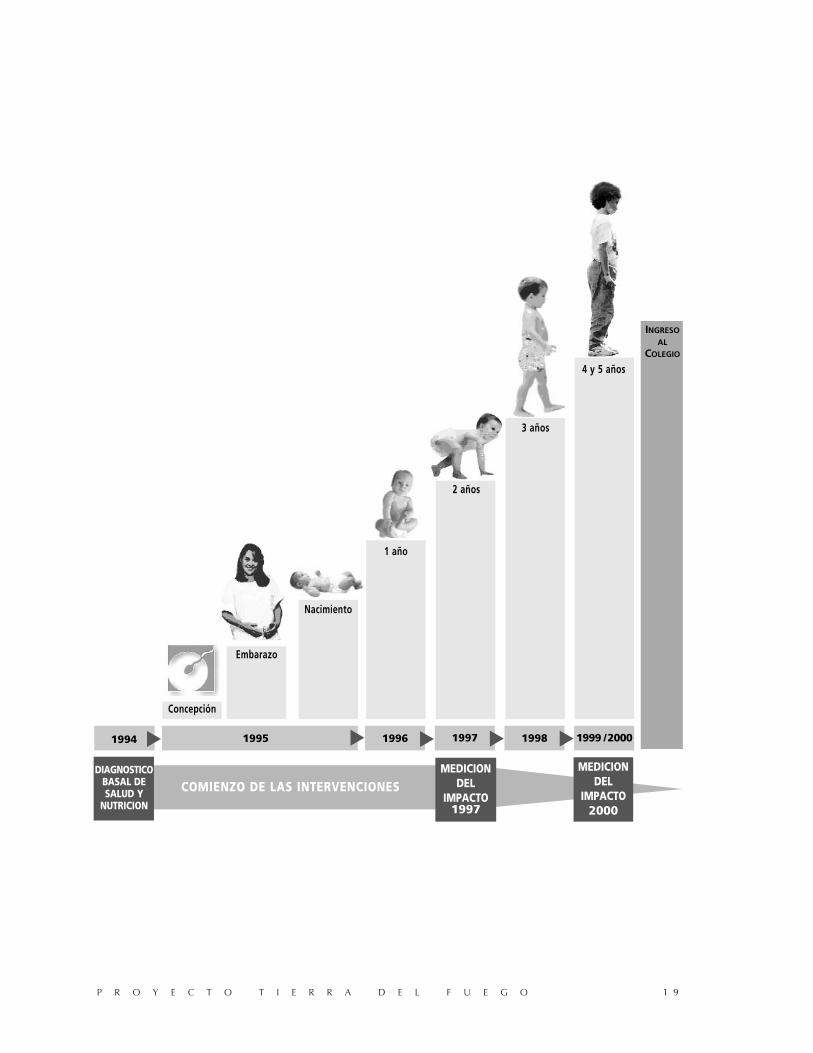
En 1997 se evaluará la situaciónnutricional de hierro, vitaminasA y D, duración de la lactanciay desarrollo de los niños de dosaños de edad, nacidos durantela implementación de lasintervenciones que se inician en1995 basadas en los resultadosde la Encuesta. Se loscomparará con los niños de lamisma edad evaluados enocasión del diagnóstico basalde situación.
En el 2000 se medirá eldesarrollo intelectual, condiciónde educabilidad y salud deestos mismos niños al ingresoescolar y se los comparará consus pares evaluados en 1994.
La medición y difusión delimpacto de las acciones delProyecto Tierra del Fuego sobresus niños, es la mejor garantíapara su perdurabilidad eincorporación definitiva a lavida de la comunidad. Además,la demostración de la mejoríade la educabilidad de los niñoscomo consecuencia deintervenciones sencillas llevadasa cabo básicamente por lasfamilias, será el mejorargumento para extender lasmetodologías e instrumentosempleados en la Provinciapara beneficio de todos losniños del país.
Los Cinco Años del Proyecto:Resultados en el 2000
P R O Y E C T O T I E R R A D E L F U E G O 1 9
4 y 5 años
3 años
2 años
1 año
Nacimiento
Embarazo
Concepción
1999 /20001997 199819961994 1995
DIAGNOSTICOBASAL DESALUD Y
NUTRICION
INGRESO
AL
COLEGIO
MEDICIONDEL
IMPACTO2000
MEDICIONDEL
IMPACTO1997
▲ ▲ ▲ ▲ ▲
COMIENZO DE LAS INTERVENCIONES
EL PROYECTOTIERRA DEL FUEGO
El Proyecto Tierra del Fuego es un proyecto de salud -con especial énfasis en losniños más pequeños- que surge como consecuencia de tres realidades que tienenespecial vigencia para el momento que vive nuestro país.
1) La situación transicional de Argentina desde el punto de vista demográfico,epidemiológico, tecnológico y de su ubicación en el mundo actual.
2) El concepto moderno de salud, fuertemente imbricado con el de calidad de viday por lo tanto con la educación de su población.
3) Por último, el cada vez más relevante rol que les cabe a las personas, a lasfamilias y a las comunidades en el cuidado de su salud y en el mejoramiento de sueducación.
LOS PROBLEMAS DE LA ARGENTINA Y AMÉRICA LATINA
A diferencia de los países centrales, America Latina vive un proceso de transiciónsocial, demográfica, económica y sanitaria. La Argentina no escapa a estefenómeno, anticipando los cambios que se producirán en la mayoría de los paísesdel continente. Nuestro país está culminando su proceso de urbanización -se estimaque para el 2000, 92% de su población será urbana tal como ocurre en los paísesdesarrollados-, mientras que en el resto de Latinoamérica la migración hacia lasciudades aún continúa.
Esto, si bien es un indicador de modernización, ha ocurrido en un tiempo muycorto, comparado con lo acontecido en el Viejo Mundo y en Estados Unidos. Elproceso ha sido desordenado, con mínima regulación gubernamental, con grandessegmentos de la población que han sentido el impacto de tan súbita urbanización,y de la exposición a una tecnología indebidamente aprovechada.
La estructura familiar tradicional se vió así afectada por la migración de los másjóvenes, por la incorporación de la mujer a la actividad laboral fuera de su hogar,por la pérdida de las familias extendidas y consecuentemente de las pautastradicionales de crianza. Si bien se tiene acceso a mayor cantidad de bienes deconsumo, se tiene menos tiempo para dedicarlo al cuidado de los hijos.
Paralelamente, y sobre todo en los sectores medios de la sociedad, se va adoptandoun estilo de vida más sedentario y con mayor carga de estrés/distress.
Ante esta situación no debe extrañar que los indicadores de salud muestren unatendencia clara al aumento de las enfermedades cardiovasculares, de lahipertensión, de la hipercolesterolemia, de la obesidad, del sedentarismo y deltabaquismo. Al mismo tiempo, debido a la mejor infraestructura sanitaria, se muerenmenos niños y ha aumentado la expectativa de vida.
Estos nuevos problemas de salud y de estilo de vida afectan, el cuidado de los hijos,el tiempo libre, la realización personal y vocacional de los adolescentes y elcuidado de los ancianos la calidad de vida.La clase media de la Argentina -que representa el 65% o más del total de nuestrapoblación- es la más expuesta a esta nueva situación, sin que haya tomado
P R O Y E C T O T I E R R A D E L F U E G O 2 1

conciencia cabal de ello. Como consecuencia, no se ha organizado para aprovecharlo positivo de este proceso ni ha desarrollado mecanismos para neutralizar susefectos negativos.
Como en toda sociedad transicional, en nuestro país conviven con los másprivilegiados otros grupos de población que no alcanzan a acceder a condicionesmínimas de alimentación, salud, educación y vivienda. Estos sectores son elobjetivo de programas asistenciales de los gobiernos pues son solidaria y éticamenteuna responsabilidad irrenunciable de la sociedad en su conjunto. En estos sectoresla desnutrición, el retraso de crecimiento y las enfermedades infecciosas como ladiarrea, tuberculosis y Chagas, son problemas que necesitan la implementación deprogramas gubernamentales y no gubernamentales.
Es importante señalar que el hecho de que los niños de clase media -entendiendopor ella al sector de población que tiene resueltas en condiciones más o menossatisfactorias sus necesidades de vivienda, alimentación y educación- no presentenproblemas de salud tan ostensibles como los grupos más marginados no significaque se encuentren sanos y bien nutridos. Algunas carencias específicas -como la dehierro o de ciertas vitaminas-, el peso de nacimiento insuficiente, el mal cuidado delembarazo, las intoxicaciones crónicas por la contaminación ambiental y laobesidad temprana son problemas nutricionales emergentes que comprometen eldesarrollo infantil y que pueden ser prevenidos mediante programas impulsadosdesde la propia comunidad.
La baja tasa de lactancia materna, el poco tiempo que los padres destinan a sushijos, la falta de una apropiada estimulación en los primeros años de vida -que escuando se conforman los mecanismos básicos del pensamiento- son circunstanciasque también comprometen el desarrollo intelectual de los niños y condicionan sufutura inserción en una sociedad con crecientes exigencias educativas y laborales.
Ello es particularmente lamentable pues los niños de esta extracción media tendríanque ser los que, sin problemas, se incorporen en un proceso de cambio como el queexperimenta la Argentina en su afán de modernización.
EL CONCEPTO DE SALUDY SU RELACIÓN CON LA EDUCACIÓN
El concepto de salud se ha modificado en el transcurso del presente siglo.Inicialmente implicaba la ausencia de enfermedades, por lo que el énfasis estabacentrado en aspectos curativos. Más adelante, a medida que avanzaba elconocimiento y se desarrollaban los recursos necesarios, el acento se trasladó a laprevención, haciéndose grandes progresos en inmunizaciones, higiene de losalimentos y saneamiento ambiental. Esta etapa, que está lejos de haber concluídoen la mayoría de los países en vías de desarrollo, muestra como culminación laerradicación universal de la viruela.
En los años recientes,sobre todo a partir de la preocupación de los países másdesarrollados, se introduce el concepto de calidad de vida. Por eso la definiciónactual de salud es el estado que permite la plena inserción social y laboral de laspersonas en la sociedad en que viven. Esto implica, más allá de la ausencia deenfermedades, la posibilidad de felicidad, realización personal y familiar tantocomo una situación laboral satisfactoria y estimulante.
Es obvio que en el logro de esta definición de salud, la educación formal tiene unrol fundamental. Hoy se requieren muchos años de adecuada escolarización paralograr la capacitación necesaria para aprehender todas las posibilidades de latecnología moderna. Los currícula escolares deben ser necesariamente másexigentes y más especializados, como lo son los requisitos del sistema educativo, en
D I A G N O S T I C O B A S A L D E S A L U D Y N U T R I C I O N2 2
términos de edificios escolares bien dotados y en la capacitación de los docentes.Para que un niño aproveche todo lo que el sistema escolar ofrece, deberá haberlogrado desarrollar a pleno todo el potencial genético con que fuera dotado por susprogenitores. Ello dependerá de múltiples factores que se analizan más adelante yque en la mayoría de ellos, al menos en los niños más pequeños, escapan a la órbitade las acciones que pueda desarrollar el Estado, para convertirse en patrimonio dela responsabilidad de cada familia e indirectamente de la comunidad en general.
LOS PROYECTOS DE MOVILIZACIÓN COMUNITARIA
El emprendimiento de estas acciones, que dependen básicamente del compromisode cada persona y del total de ellas en una comunidad, se ha denominado proyectosde movilización comunitaria. El Proyecto Tierra del Fuego es, según esta definición,uno de ellos.
Existen numerosos ejemplos de comunidades que se han organizado para mejorarsus condiciones de vida y salud. Entre los más conocidos, por su magnitud yresultados, puede mencionarse el de North-Karelia, Finlandia, ciudad de 100.000habitantes con elevadísimas tasas de mortalidad cardiovascular, que logró modificarsus hábitos de vida y alimentación para, al cabo de 7 años, mostrar una pronunciadadisminución de las referidas tasas.
En el otro extremo existen numerosísimos ejemplos de lo que pueden lograrcomunidades cuando se organizan en pos de un objetivo. Por citar solamente uncaso, en el Sudeste de la India, Tamil-Nadu, se lograron descensos notables en lastasas de desnutrición y mortalidad infantil mediante la promoción de la lactancia,algunas prácticas higiénicas, adecuada inmunización y racional distribución desuplementos alimentarios.
El éxito de los proyectos de participación comunitaria en pos de un objetivo desalud depende de cuatro factores fundamentales:
a) La participación de todos los sectores de la comunidad que comprenden,participan y comparten los objetivos finales del proyecto.
b) La definición de metas concretas y posibles a las cuales se llega medianteestrategias adecuadas a las posibilidades de la comunidad.
c) La medición de la naturaleza y magnitud del problema y de los resultados de lasestrategias aplicadas a su resolución, y la difusión de los logros para mantener lamotivación comunitaria.
d) La continuidad de las acciones por el tiempo necesario para alcanzar las metaspropuestas y para que los cambios logrados queden definitivamente incorporadosen la vida de la comunidad.
¿QUÉ ES EL PROYECTO TIERRA DEL FUEGO?
El Proyecto Tierra del Fuego consiste en una serie de acciones desarrolladasbásicamente por la comunidad en el área de la salud y la educación, tendientes alograr el pleno desarollo intelectual y social de los niños de dicha provincia, parapermitirles enfrentar exitosamente las exigencias sociales, educativas y laborales delmundo moderno.
El principal objetivo del Proyecto Tierra del Fuego es maximizar la educabilidad delos niños al momento de su ingreso a la escuela, pues se sabe que la calidad de la
P R O Y E C T O T I E R R A D E L F U E G O 2 3

educación escolar primaria y el desempeño del educando son los mejores predictoresde la capacidad intelectual de un individuo y de su inserción productiva futura. La importancia de la educación primaria es reconocida empíricamente por lapoblación en todo el mundo, en tal medida que el aumento de las adjudicacionespresupuestarias en educación es uno de los reclamos que más frecuentemente sehace a las autoridades.
Recientemente el sistema escolar de nuestro país ha sido objeto de debates paramejorar su calidad, y para asignarle mayores recursos, lo cual es un importanteprogreso. Sin embargo, no debe olvidarse que el proceso educativo tiene doscomponentes, el educador y el educando, y que las condiciones en las cuales unniño inicia su escolarización constituyen un condicionante fundamental para su“educabilidad”. Por otro lado, el satisfactorio aprovechamiento escolar justificaráfuturas inversiones en educación y será catalizador de curriculas más exigentes yavanzadas.
Todo individuo nace con un potencial intelectual genéticamente determinado quepuede verse influído por factores externos, que en forma aditiva pueden limitarlo.
Estos son:• el ausente, tardío, o mal control y cuidado del embarazo• las complicaciones que conspiran contra el adecuado peso de nacimiento• la ausencia de lactancia materna• las carencias específicas de nutrientes que caracterizan a la “desnutrición oculta”• los tóxicos ambientales• la falta de una estimulación psicosensorial oportuna en los momentos más
receptivos del desarrollo infantil.
Algunas de estos aspectos son las que este Proyecto pretende afrontar a través de laparticipación de todas las personas y familias que conforman la comunidad deTierra del Fuego.
¿POR QUÉ EN TIERRA DEL FUEGO?
A pesar de estar tan alejada de los centros más poblados de nuestro país, laprovincia de Tierra del Fuego ostenta indicadores demográficos y sanitarios muyadecuados. Tiene la mayor proporción de población infantil de la Argentina y sumortalidad infantil es aún menor que la de la Capital Federal, el distrito con mayorconcentración de recursos de salud en el país.
En Tierra del Fuego prácticamente no existe pobreza extrema y su estructura sociales fundamentalmente de clase media. La población habita en su casi totalidad endos ciudades y hay una mínima población rural estable. Existe amplia cobertura deservicios básicos domiciliarios (energía eléctrica, agua de red, cloacas, etc.) y desalud, tanto a nivel oficial como privado, con altas tasas de control pediátrico y delembarazo, así como de parto institucionalizado.
La población fueguina vive -como en pocos lugares del país- las exigenciaslaborales de las ciudades. Ambos progenitores habitualmente trabajan y el cuidadode los niños queda durante muchas horas a cargo de guarderías fabriles, centrosgubernamentales infantiles o cuidadoras privadas.
La provincia de Tierra del Fuego presenta los mejores indicadores de salud de laArgentina. Su Tasa Anual Media de Crecimiento es la más alta del país comoconsecuencia de presentar la Tasa Bruta de Natalidad más alta y la Tasa deMortalidad Infantil más baja. Por ello la población de la provincia es, en términosdemográficos, la más “joven” de nuestro país. (1)
El hecho de que Tierra del Fuego presente la mayor proporción de población
D I A G N O S T I C O B A S A L D E S A L U D Y N U T R I C I O N2 4
infantil, y de que la mayor parte de la comunidad tenga resueltos sus problemas desustento y vivienda, ha sido un factor determinante en la selección de la provinciapara participar del Proyecto. La estructura socioeconómica de la provinciarepresenta en términos generales lo que sucede en aproximadamente dos terceraspartes de la estructura social de la Argentina. En cuanto a la estructura demográfica,su comunidad -que creció como consecuencia del más rápido proceso de migracióninterna de nuestro país-, está conformada por habitantes de todo el territorio en uncrisol de costumbres y hábitos representativos de la Argentina. Otros factores comoel alto grado de información y participación social, la profusión de medios decomunicación y la eficiente cobertura de salud y de cuidado preescolar han sidocondicionantes importantes para escoger a la provincia de Tierra del Fuego comosede del Proyecto.
Desde el punto de vista de la logística del Proyecto, la provincia tiene un tamañoapropiado para la movilización comunitaria propuesta. La noción de aislamiento einsularidad que despierta la distancia a los lugares de origen de la mayor parte dela población y la inexistencia de abuelos o de familias extendidas, hancondicionado el desarollo de un especial sentimiento de solidaridad en lapoblación. Por otro lado, siendo un lugar de migración relativamente reciente -sucrecimiento poblacional ocurrió en las dos últimas décadas- no existen pautasculturales definidas, sean éstas locales o importadas desde los lugares de origen. Losmedios de comunicación masivos tienen amplia cobertura en todo el territorio y sonmuy escuchados.
Existen numerosas ciudades en el país de tamaño y estructura comparables, por loque se estima que lo logrado en Tierra del Fuego puede ser extrapolado a talescomunidades.
El Proyecto adquiere especial significado pues la problemática abordada no sóloafecta a Tierra del Fuego sino a millones de niños y adultos en la Argentina y enAmérica Latina.
¿EN QUÉ CONSISTEN LAS ACCIONESDEL PROYECTO TIERRA DEL FUEGO?
Pueden agruparse en cuatro programas, aunque esta división es algo artificial ya quese trata de acciones que se superponen y que serán desarrolladas simultáneamente.Las actividades de cada uno de los programas no son originales pues hay abundanteexperiencia en el mundo. La originalidad radica en su aplicación coordinada, en elpapel activo de la comunidad en todas las actividades y en su permanenteevaluación. El diagnóstico de la situación basal y de los distintos programaspermitirá evaluar el impacto de las medidas que se adopten.Los programas que componen el Proyecto Tierra del Fuego son los siguientes:
• Programa de prevención de la inadecuada nutrición incluyendo las carenciasde nutrientes específicos.
• Programa de estimulación psicosensorial oportuna en niños pequeños. • Programa de cuidado perinatal. • Programa de Educación nutricional y sanitaria para la comunidad, que incluye la
prevención de enfermedades crónicas de los adultos.
Estas acciones del Proyecto no implican mayores erogaciones en los presupuestosde salud o educación de la provincia, sino más bien una optimización de losrecursos disponibles, sobre la base del compromiso de la comunidad y de suparticipación en la resolución de los problemas.
P R O Y E C T O T I E R R A D E L F U E G O 2 5
ACCIONES EN LA PREVENCION DE LADESNUTRICION OCULTA Y DE LAINADECUADA NUTRICION EN GENERAL
El objetivo
Disminuír la prevalencia de deficiencias de micronutrientes en la población,mediante la fortificación de alimentos y/o la suplementación medicamentosa y laeducación alimentaria y de salud según resulte más adecuado.
Su fundamento
La desnutrición proteínico-energética -desnutrición social-, es consecuencia de lafalta de alimentos y de la reiteración de enfermedades. Este tipo de desnutrición secaracteriza por retraso del crecimiento en sus formas más leves, o en sus formas másgraves, por un cuadro clínico característico y bastante obvio provocado por lacarencia global de nutrientes (proteínas, energía, vitaminas, minerales).
Esta forma de desnutrición suele concentrarse en los bolsones de pobreza extremay es el objetivo de los programas de asistencia social y alimentaria de entidadesoficiales y organizaciones no gubernamentales.
Por el contrario, la carencia de algunos nutrientes específicos, que no afectan elcrecimiento ni se manifestan con signos de desnutrición, constituye lo que se hadenominado “desnutrición oculta” (OMS-UNICEF) (2) y existe en amplios sectoresde la población, con relativa independencia de la clase o grupo social.
La desnutrición oculta no se produce por falta de alimento sino más bien ocurre comoconsecuencia de una nutrición inadecuada, marginal con relación a algún nutriente,lo cual determina que las reservas corporales resulten insuficientes para afrontar losesfuerzos del crecimiento, del embarazo, de la lactancia o de una infección. Cuandopersiste la deficiencia se perturba la función de órganos o sistemas vinculados conel nutriente; ésto se denomina “adaptación” a una deficiencia e implica unadisminución funcional con repercusión para el presente y el futuro del niño.Un ejemplo clásico de desnutrición oculta es la anemia por deficiencia de hierro, ladeficiencia nutricional más frecuente en la población de nuestro país, puescompromete entre el 30% y 56% de los niños menores de dos años (3), al 10% delos escolares (4), entre el 10% y 15% de los adolescentes (5) y al 25% de las mujeresen edad fértil. Aunque practicamente todas ellas son anemias más bien leves, tienenimportantes consecuencias funcionales.
La carencia de hierro afecta los mecanismos de defensa contra las infecciones, laresistencia al esfuerzo físico y por lo tanto la capacidad de trabajo; en los niñosafecta diversas funciones cerebrales que perturban el aprendizaje y el desarrollo engeneral. Hay evidencias sólidas de que la perturbación en el desarrollo intelectualde los niños más pequeños producida por la anemia -incluso leve y tratada en formaadecuada- es detectable aún varios años después al ingreso escolar (6).
La deficiencia de vitamina A ha sido poco estudiada en la Argentina, pero esprobable que constituya un problema de salud pública. Datos fragmentarios deencuestas alimentarias indicarían que 40% de los niños en Buenos Aires no alcanzaa cubrir las recomendaciones (2). Su deficiencia se asocia con la de hierro y tambiéncon la de zinc.
La recomendación de ingesta alimentaria diaria de calcio no es cubierta por el 30%de los niños y por más del 50% de los adolescentes según estudios realizados en
P R O Y E C T O T I E R R A D E L F U E G O 2 7
Buenos Aires y el conurbano (3)(4)(5). La consecuencia a largo plazo de estacarencia es una mayor propensión a las fracturas de grandes huesos en la terceraedad (osteoporosis). La deficiencia crónica de calcio en la dieta predispone a lahipertensión arterial y a la eclampsia en las embarazadas.
Es muy probable que esta situación marginal de calcio se vea agravada en Tierra delFuego por la deficiencia de vitamina D, que tiene entre otras funciones el rol defacilitar la absorción del calcio de la dieta. Además, el raquitismo por deficiencia devitamina D hace, a los que lo padecen, más proclives a contraer enfermedadesinfecciosas, en particular la tuberculosis; y produce deformaciones óseascaracterísticas, en especial de los miembros inferiores.
Otros nutrientes como el zinc (con efecto sobre el crecimiento, el desarrollo sexualy el apetito en niños); los folatos (su inadecuada ingesta en los primeros tiempos delembarazo se relaciona con malformaciones del sistema nervioso central); o losácidos grasos esenciales (maduración de la visión y del sistema nervioso en loslactantes), conforman con los anteriormente citados el amplio espectro de la des-nutrición oculta. Todos tienen importantes consecuencias sobre el desarrollo infantily la salud de la población en general.
La deficiencia de estos nutrientes es estudiada en Ushuaia por primera vez en elpaís, como parte del diagnóstico basal de situación.
A diferencia de lo que ocurre con la desnutrición global, que suele ser unamanifestación de la extrema pobreza, las carencias de micronutrientes puedensolucionarse mediante la educación alimentaria (modificar los hábitos de alimen-tación de la población), la fortificación (agregar un nutriente específico en alimentosde consumo masivo, como actualmente se realiza con la sal para prevenir ladeficiencia de iodo) o la suplementación medicamentosa (como es de prácticapediátrica con el hierro en los lactantes).
El costo de estas intervenciones es muy bajo y a pesar de existir antecedentes en otrospaíses, no se han implementado en Argentina. Una de las razones para ello es que nilos organismos de decisión política o técnica ni la comunidad perciben la elevadaprevalencia, importancia y repercusión para la salud de esta forma de desnutrición.La demostración de que una comunidad puede disminuir o erradicar estas carenciasy la demostración de su impacto sobre el crecimiento y desarrollo intelectual de losniños, serán una de las contribuciones del Proyecto Tierra del Fuego al resto del país.
D I A G N O S T I C O B A S A L D E S A L U D Y N U T R I C I O N2 8

PROGRAMA DE ESTIMULACIONPARA LOS PRIMEROS AÑOS DE VIDA
El objetivo
Mediante una apropiada estimulación, desarrollar la mejor aptitud intelectual yemocional que la dotación genética de cada niño permita.
Los fundamentos
La potencialidad intelectual de un niño se expresará en mayor o menor medidasegún su interacción con el medio ambiente. Este medio ambiente para los niñosmás pequeños está constituido por el contacto con su familia, y con los cuidadoresdurante el tiempo que los padres trabajan.
El proceso de desarrollo intelectual y aprendizaje en los niños es secuencial, o seaque a un logro deberá seguir otro logro, siendo imposible saltear un paso so penade que el siguiente sea dado en forma inadecuada. El cuidado y estimulación quereciban los niños durante los primeros dos años de vida tienen enormetrascendencia sobre el potencial de desarrollo. Opuestamente, existe abundanteevidencia sobre la menor capacidad intelectual de niños que no han recibidoestimulación afectiva y psicomotora-sensorial adecuada durante las etapas mástempranas y definitorias de su desarrollo intelectual.
El crecimiento y el desarrollo de los niños, aún considerando obvias variacionesindividuales, es un proceso previsible y anticipable. En ello se sustentan consejosindividuales y programas masivos de estimulación, que no son ni más ni menos querecomendaciones a familias y cuidadores sobre actividades e instrumentosadecuados para cada una de las etapas que irá transitando el niño a medida quecrece.
Los programas de estimulación oportuna orientan a los padres para que puedanbrindar en cada edad el tipo de estímulo que los niños requieren; en el caso de lasguarderías entrenan a los cuidadores para que, con actividades sencillas,complementen la tarea que los padres desarrollan en el hogar.
Debido a la creciente incorporación de la mujer a la actividad laboral fuera de sucasa, se hace necesario transformar a las guarderías tradicionales en verdaderoscentros de promoción del desarrollo infantil, donde además de brindar los cuidadosbásicos para su salud y crecimiento, se promueva una mejor y más equilibradamaduración psicológica y social. Esto implica incorporar a padres y cuidadores enun esfuerzo coordinado, brindándoles herramientas específicas, y capacitarlos paraque aprovechen de la manera más útil el tiempo que están con sus pequeños, demanera que si por razones laborales no pueden brindarles el tiempo que quisieran,les brinden calidad de tiempo.
P R O Y E C T O T I E R R A D E L F U E G O 2 9

CUIDADO PERINATAL Y DEL EMBARAZO
El objetivo
Promover desde la comunidad el mejor cuidado de la mujer embarazada,jerarquizando el control prenatal, desarrollando acciones de educación para losfuturos padres, fortaleciendo la autoestima materna, la responsabilidad familiar, yestimulando el vínculo temprano de la madre con su hijo.
Los fundamentos
El nacimiento de un hijo es predecible muchos meses antes de que se produzca,tiempo más que suficiente para desarrollar acciones de promoción de salud desdela comunidad y desde los servicios asistenciales.
Se sabe que el bajo peso de nacimiento (menor de 2500 gramos) aumenta el riesgode infecciones postnatales, puede comprometer el crecimiento físico futuro y afectarel desarrollo intelectual del niño.
El peso de nacimiento es la consecuencia de factores propios del feto, por ejemplosu potencial de crecimiento, y también de factores que inciden sobre la gestación.Tienen mayor riesgo de dar a luz niños con bajo peso las madres muy jóvenes omuy añosas, quienes tienen un embarazo poco cuidado, las madres con malanutrición, con anemia severa, las madres fumadoras o con un consumo elevado dealcohol, las madres hipertensas o con toxemia, y las que han padecido algún tipode infección durante la gestación.
El control prenatal si es precoz, adecuado, integral y programado ha demostrado seruna muy buena inversión, estimándose que por cada peso que se destine al controlprenatal, se ahorran más de tres pesos en cuidados intensivos neonatales.
El parto en Tierra del Fuego tiene tasas de institucionalización (partos hospitalarios)similares a los observados en los países más avanzados del mundo. Por eso resultaimportante identificar a través de una cuidadosa investigación qué factores puedenser mejorados en la infraestructura asistencial y en la capacitación de recursoshumanos en vistas a mejorar las condiciones del parto y de los primeros momentosde la vida.
El puerperio es otra oportunidad única para desarrollar acciones de educación parala salud. Madres e hijos recién nacidos están cautivos en la institución por 2 a 5días. Esos días son ideales para promover la lactancia materna, iniciar programasde estimulación oportuna y enfatizar los conocimientos adquiridos durante losprogramas de apoyo a futuros padres. Es importante señalar que las acciones que sehacen durante el puerperio tienen un fuerte impacto sobre el afianzamiento deconductas maternales adecuadas.
En resumen, se trata de acciones perinatales simples, pero racionales, destinadas aafianzar actitudes individuales y comunitarias para el mejor cuidado de los niñosdesde el momento mismo de su gestación.
D I A G N O S T I C O B A S A L D E S A L U D Y N U T R I C I O N3 0
PROGRAMA DE EDUCACIONNUTRICIONAL Y SANITARIAPARA LA COMUNIDAD
El objetivo
Intervenir con mensajes concretos en la modificación de hábitos vinculados con lapromoción de la salud en los distintos sectores de la comunidad.
Se llevará a cabo mediante los siguientes programas:
• NUTRIMUNDO: La aventura de crecer sanos y vivir mejor.• ECOMUNDO: Promoción del cuidado del medio ambiente en la escuela primaria.• Programa del consumidor responsable.• Programa de prevención de enfermedades crónicas no transmisibles.
NUTRIMUNDO
Es un programa de educación alimentaria para los escolares de las escuelasprimarias de nuestro país, desarrollado por docentes para docentes. Su objetivo esproveer a los maestros actividades y recursos didácticos que les permitan incorporarconceptos nutricionales durante el desarrollo del programa curricular.
Los contenidos de NUTRIMUNDO fueron desarrollados sobre la base de lasconclusiones de una Reunión de Consenso CESNI-UNICEF con especialistas denutrición de todo el país en la cual se definieron las prioridades de educaciónnutricional para nuestros niños. NUTRIMUNDO ya se ha implementado en más de4000 escuelas del país.
El objetivo de NUTRIMUNDO es que los niños, durante su educación escolar,incorporen conocimientos que les permitan tomar decisiones adecuadas respectode su alimentación, y se constituyan en vectores de estos mensajes de salud haciasus hogares.
Se espera que los niños adquieran conocimientos sobre nutrición que contribuyana la modificación de algunos hábitos alimentarios perjudiciales inscriptos en nuestropatrón de alimentación. En este sentido, es favorable que los hábitos alimentarios dela población de Tierra del Fuego resulten de una amalgama de conductas ycostumbres traídas por las corrientes migratorias y que no difieren mayormente delo observado en las grandes ciudades del país.
Uno de los problemas de la alimentación de los argentinos radica en su monotoníay rigidez. Esta monotonía se pone de manifiesto en que más del 75% de las caloríasingeridas en nuestro país provienen de no más de 15 alimentos. Esta inelasticidadde la población para adaptar sus hábitos de compra determina que, ante cualquierfactor estacional que limite la oferta de algúno de esos alimentos, su constantedemanda eleve desmesuradamente el precio. NUTRIMUNDO asigna especialimportancia a este comportamiento, estimulando a los niños a conocer y a aceptarnuevos alimentos, y brinda reglas que les permiten establecer intercambiosrespetando la calidad nutricional. En Tierra del Fuego estas limitaciones estacionalesse ven amplificadas por razones climáticas y es esperable que los conocimientosadquiridos en la escuela y proyectados al hogar puedan traducirse en una mejoríaen el estilo de vida y alimentación.
P R O Y E C T O T I E R R A D E L F U E G O 3 1

PROMOCION DEL CUIDADODEL MEDIO AMBIENTE EN LAEDUCACION PRIMARIA: ECOMUNDO
Desarrollar una conciencia ecológica en la población infantil que se proyecte desdelas escuelas primarias hacia la comunidad en general. Este objetivo adquiereespecial relevancia en la única provincia que contempla el cuidado del medioambiente en su Constitución.
La preservación del medio ambiente es una de las máximas preocupacionescontemporáneas. El Cono Sur de América, y en especial nuestro país, es uno de lospocos nichos ecológicos que aun quedan en el mundo por la existencia deimportantes ecosistemas poco afectados por factores agresivos, por su poblaciónrelativamente educada, por la ausencia de conflictos sociales de gravedad, y por subaja densidad de población. Sin embargo, desde el punto de vista de la preservacióndel medio ambiente, las acciones han sido pobres pues recién se está tomandoconciencia del problema, de su significado para las generaciones futuras y de surepercusión económica. Lo hecho y dicho hasta ahora no se extiende más allá delos estratos altos de la sociedad y aún en éstos se trata más bien de una accióndeclamatoria con escasa repercusión en hechos prácticos. Si bien se reconoce laimportancia de generar una conciencia ecológica desde la escuela como parte de laformación global de los niños, no existe -en nuestro país- una formación ecológicaen los docentes ni recursos didácticos que les ayuden a promocionar conductasadecuadas en los escolares.
Por razones geográficas e históricas, Tierra del Fuego ha generado una concienciaecológica en su comunidad que se destaca en la Argentina. Es importanteaprovechar esta concientización y la motivación que ya existe, para desarrollar yponer en marcha un programa de educación y promoción ecológica desde laescuela. Un programa que rápidamente pueda ser “exportado” a otras provincias,con las adaptaciones indispensables para cada ámbito del país.
P R O Y E C T O T I E R R A D E L F U E G O 3 3
D I A G N O S T I C O B A S A L D E S A L U D Y N U T R I C I O N3 4
DIAGNOSTICO BASALDE SALUD Y NUTRICION
La primera etapa del Proyecto Tierra del Fuego es el diagnóstico basal de lasituación de nutrición y de salud de la Provincia. Este diagnóstico tiene comoobjetivos primordiales: describir los principales problemas, jerarquizando suincidencia en los distintos sectores sociales, y servir como parámetro decomparación para evaluar el impacto de las acciones que se llevarán a cabo durantelos 5 años del proyecto.
El diagnóstico basal de situación comprende dos relevamientos: la encuesta desalud y nutrición, que se presenta a continuación, y la encuesta de desarrollo infantilque será objeto de una siguiente publicación.
El diagnóstico basal se realizó sobre la base de un cuidadoso diseño encuestal, conrepresentación de toda la población, especialmente de los grupos más vulnerablestales como los lactantes y las mujeres embarazadas. Las áreas a encuestar surgierondel detallado análisis de la información nutricional de nuestro país y de lainformación aportada por el sector técnico de la Provincia.
La encuesta de salud y nutrición constituye el más importante relevamientonutricional que haya tenido efecto en nuestro país, tanto por el número deindicadores considerados como por la calidad de la información obtenida, lo cual hapermitido llenar vacíos de información, en algunos casos, inéditos en nuestro país.
Los instrumentos, las metodologías y los programas de computación, desarrolladosespecialmente para el diagnóstico basal de situación, constituyen una de lasprimeras contribuciones concretas del Proyecto Tierra del Fuego, ya que puedeimpulsar el desarrollo de encuestas similares en otras regiones del país.
El diagnóstico basal de situación mostró un alto grado de participación de toda lacomunidad, ya que se contó con la cooperación de los colegios y los clubes deservicio Rotary y Leones para la promoción de la encuesta, y con la cooperación delas escuelas de adultos en el timbrado de las casas. Especialmente, la cordialidad delas 1200 familias que dedicaron su tiempo a las tres entrevistas que conformaron laencuesta fue de gran valor.
Para el desarrollo del diagnóstico basal de situación, un equipo de investigadoresvivió durante 6 meses en la isla, estableció un laboratorio de referencia para el pre-procesamiento de las muestras de sangre, y envió semanalmente al Laboratorio deCESNI el material con el que se desarrollaron las más de 8000 determinacionesbioquímicas que conformaron el diagnóstico. La Armada Argentina brindó uninvalorable apoyo para resolver la compleja logística de este trabajo.
Se brinda a continuación un resumen de la información más relevante de laencuesta de salud y nutrición del Diagnóstico Basal de Situación.
P R O Y E C T O T I E R R A D E L F U E G O 3 5
METODOLOGÍA DE LA ENCUESTA
Diseño encuestal
El diagnóstico basal de situación es un estudio descriptivo, transversal, elaboradosobre una muestra familiar, seleccionada geográficamente con un criterio aleatorio,considerando una fracción global de muestreo de 1:4 que alcanza representatividadpara cada uno de los grupos biológicos de mayor vulnerabilidad.
El objetivo de la encuesta fué brindar información científica para el diseño de losdistintos programas de intervención y además servir como línea de base paraevaluar el impacto de dichas intervenciones a lo largo de los 5 años de duración delproyecto.
La encuesta relevó información de las familias de la ciudad de Ushuaia y en estecontexto se referirá información de los siguientes grupos biológicos:
• Niños de 9 a 23 meses y 29 días.• Preescolares (24 meses a 5 años 11 meses y 29 días).• Escolares (6 años a 11 años 11 meses y 29 días).• Adolescentes (12 años a 18 años 11 meses y 29 días).• Mujeres en edad fértil (madres de alguno de los grupos 1 a 4).• Hombres adultos (padres de alguno de los grupos 1 a 4).• Embarazadas.
Características del diseño muestral
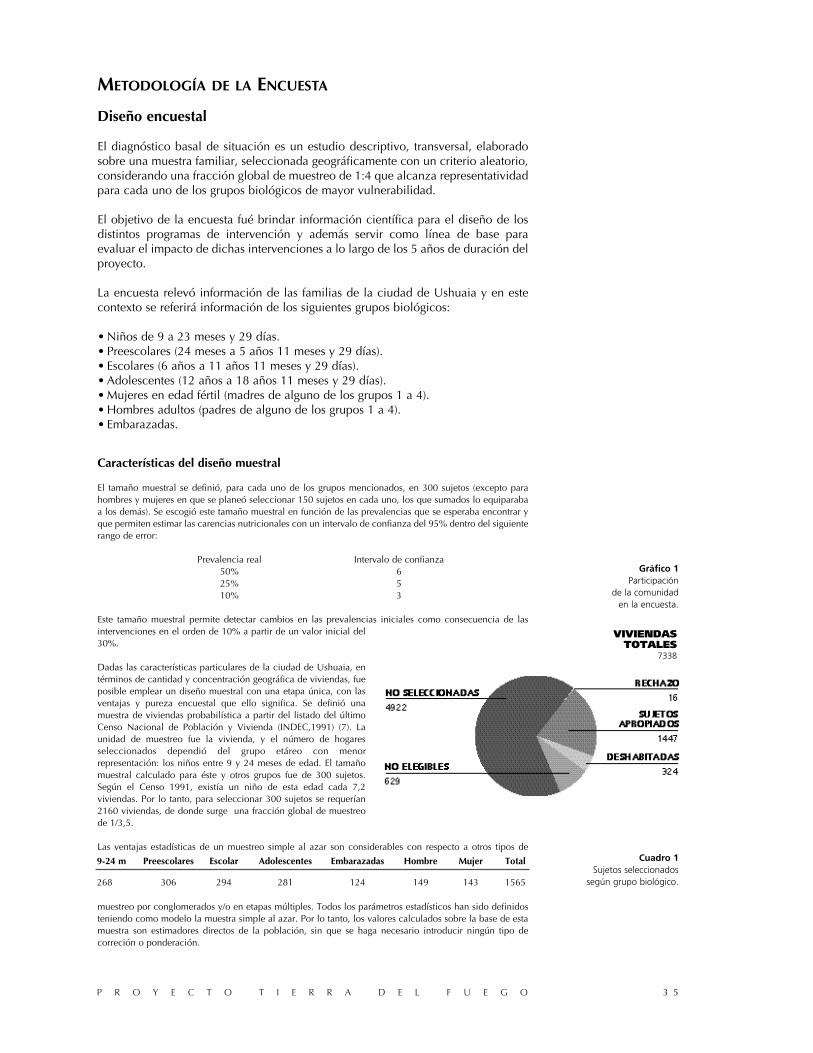
El tamaño muestral se definió, para cada uno de los grupos mencionados, en 300 sujetos (excepto parahombres y mujeres en que se planeó seleccionar 150 sujetos en cada uno, los que sumados lo equiparabaa los demás). Se escogió este tamaño muestral en función de las prevalencias que se esperaba encontrar yque permiten estimar las carencias nutricionales con un intervalo de confianza del 95% dentro del siguienterango de error:
Prevalencia real Intervalo de confianza50% 625% 510% 3
Este tamaño muestral permite detectar cambios en las prevalencias iniciales como consecuencia de lasintervenciones en el orden de 10% a partir de un valor inicial del30%.
Dadas las características particulares de la ciudad de Ushuaia, entérminos de cantidad y concentración geográfica de viviendas, fueposible emplear un diseño muestral con una etapa única, con lasventajas y pureza encuestal que ello significa. Se definió unamuestra de viviendas probabilística a partir del listado del últimoCenso Nacional de Población y Vivienda (INDEC,1991) (7). Launidad de muestreo fue la vivienda, y el número de hogaresseleccionados dependió del grupo etáreo con menorrepresentación: los niños entre 9 y 24 meses de edad. El tamañomuestral calculado para éste y otros grupos fue de 300 sujetos.Según el Censo 1991, existía un niño de esta edad cada 7,2viviendas. Por lo tanto, para seleccionar 300 sujetos se requerían2160 viviendas, de donde surge una fracción global de muestreode 1/3,5.
Las ventajas estadísticas de un muestreo simple al azar son considerables con respecto a otros tipos de
muestreo por conglomerados y/o en etapas múltiples. Todos los parámetros estadísticos han sido definidosteniendo como modelo la muestra simple al azar. Por lo tanto, los valores calculados sobre la base de estamuestra son estimadores directos de la población, sin que se haga necesario introducir ningún tipo decorreción o ponderación.
9-24 m Preescolares Escolar Adolescentes Embarazadas Hombre Mujer Total
268 306 294 281 124 149 143 1565
Gráfico 1Participación
de la comunidaden la encuesta.
Cuadro 1Sujetos seleccionados
según grupo biológico.
VIVIENDASTOTALES
7338

La selección de los niños de 9 a 24 meses respondió a la fracción global de muestreo, lo mismo que la delas embarazadas. La selección de los demás grupos se realizó con una proporción fija estimada según surepresentación relativa en la población, tal como se describe a continuación:
• Grupo 1 Niños 9 a 23 (29d) meses: todas las viviendas.• Grupo 2 Preescolares: una vivienda cada 3 con niños de esa edad.• Grupo 3 Escolares: una vivienda cada 3,5 con niños de esa edad.• Grupo 4 Adolescentes: una vivienda cada 3 con sujetos de esa edad.• Grupos 5-6 Adultos: por definición muestral fueron los padres de alguno de los otros grupos. De lospadres que vivieran en las viviendas seleccionadas por alguno de los grupos de niños, surgió un universode adultos cuyo tamaño era a priori desconocido. La fracción de selección de adulto hombre y adulto mujersurgió en cada radio censal, una vez completada la selección de los grupos 1, 2, 3 y 4. En este momento seconoció el total de la población para ese radio y también el tamaño de la muestra para el grupo 4. Se dividióel total de hombres por el n/2 seleccionado del grupo 4, obteniéndose una fracción de selección que seaplicó a partir de un número aleatorio en cada uno y con intervalo fijo. Para las mujeres adultas se empleóel mismo criterio. Este sistema debía proveer teoricamente 150 sujetos en cada grupo adulto, una vezcompletada la muestra de la ciudad.• Grupo 7 Embarazadas: todas las viviendas.
Por el diseño utilizado en la selección de viviendas, se trata de una muestra autocompensada en la que cadavivienda tuvo la misma probabilidad de ser incluida en la muestra = 1/3.5. Los estimadores de totales decualquier variable se calcularon de acuerdo a la fórmula: x’ = x . 1/P
Muestreo en terreno
La selección de viviendas se realizó en una sola etapa. El universo de muestreo estuvo constituido por 7838viviendas. El universo de niños de 9 a 24 meses fue de 1088. Aplicando la fracción de muestreo de 1/3.5viviendas, resultaron seleccionadas 2209 viviendas, en las que se esperaba encontrar 306 sujetos de 9 a 24meses de edad.La selección de vivendas se aplicó en cada radio censal, comenzando por el radio 1 de la primera fracción(04) con un arranque aleatorio y un intervalo fijo de 3.5 hasta completar el radio 20 de la última fracción.
El muestreo en terreno comenzó en septiembre de 1993 para los primeros 17 radios de la Encuesta, sesuspendió durante el receso del verano y se reanudó en marzo de 1994 para los restantes radios.
En el tiempo transcurrido desde el Censo Nacional de Población y Vivienda de 1991, la ciudad de Ushuaiapresentó no sólo un crecimiento importante en su población y número de viviendas, sino tambiénredistribuciones internas entre los diferentes radios censales. Como consecuencia de este fenómeno sehallaron 517 viviendas más que las descriptas por el Censo 1991 lo que implicó un incremento relativo de6.6%.
De la enumeración “in situ” del total de viviendas surgió un universo de 10.098 viviendas de las que seselccionaron 2917. Una vez que se descartaron las que no tenían uso habitacional o que estabandeshabitadas en forma permanente, quedaron 2416 viviendas familiares ocupadas, que constituyeron eltotal de la selección.
Según los datos del Censo 1991, el porcentaje de viviendas de la ciudad de Ushuaia “con fines nohabitacionales” era de 1.6%, y el de viviendas en construcción de 3.0%. Esta proporción se desestimó a losefectos de facilitar el muestreo, numerándose las construcciones independientemente de su uso (comercialo habitacional) y de la comprobación de si estaban efectivamente deshabitadas en forma permanente. En elanálisis de los datos finales del muestreo en terreno, se comprobó que el porcentaje de viviendas de uso no-habitacional y de viviendas deshabitadas en forma permanente resultó muy superior al previsto: en conjuntorepresentaron el 17% del total. De la combinación de ambos factores -incremento del total de viviendas ymenor proporción de viviendas particulares ocupadas- surgió una diferencia neta de 12.4% en el númerode niños de 9 a 24 meses efectivamente hallados (268) con respecto a los 306 niños previstos.
El efecto global sobre la validez del muestreo es mínimo y resulta equivalente a haber aplicado una fracciónglobal de muestreo de 1/4.1 viviendas.
Del total de 2416 viviendas familiares ocupadas seleccionadas, en 1447 (59.9%) existía un sujetoperteneciente a los grupos etáreos requeridos para la encuesta, esto es niños de 9 meses a 18 años 11 mesesy 29 días o embarazadas. Los resultados de las restantes viviendas se distribuyeron de la siguiente forma: en324 (13.4%) no se encontraron los ocupantes en 3 visitas en diferentes días y horarios; en 629 (26.0%) nohabía sujetos de las edades requeridas, y en 16 (0.7%) la familia no quiso participar de la encuesta.
El número de sujetos seleccionados en los distintos grupos etáreos se resume en el siguiente Cuadro:
D I A G N O S T I C O B A S A L D E S A L U D Y N U T R I C I O N3 6
P R O Y E C T O T I E R R A D E L F U E G O 3 7
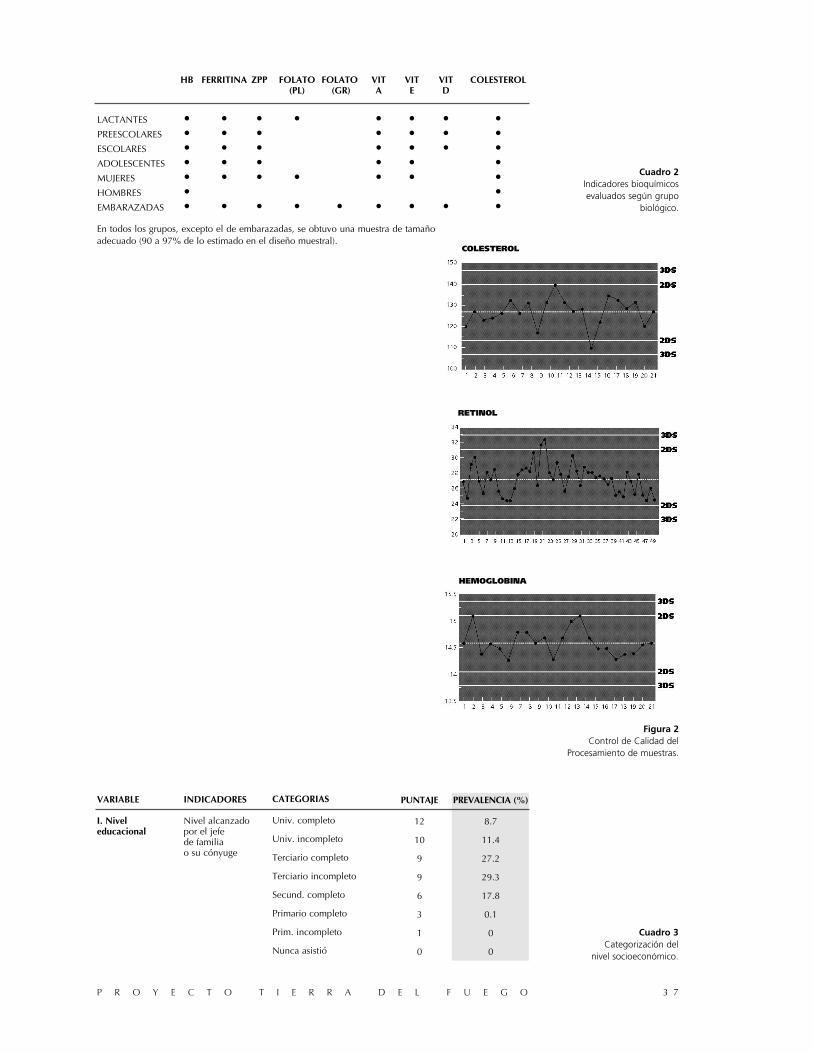
En todos los grupos, excepto el de embarazadas, se obtuvo una muestra de tamañoadecuado (90 a 97% de lo estimado en el diseño muestral).
HB FERRITINA ZPP FOLATO FOLATO VIT VIT VIT COLESTEROL(PL) (GR) A E D
LACTANTES • • • • • • • •PREESCOLARES • • • • • • •ESCOLARES • • • • • • •ADOLESCENTES • • • • • •MUJERES • • • • • • •HOMBRES • •EMBARAZADAS • • • • • • • • •
VARIABLE
I. Niveleducacional
INDICADORES
Nivel alcanzadopor el jefede familiao su cónyuge
CATEGORIAS
Univ. completo
Univ. incompleto
Terciario completo
Terciario incompleto
Secund. completo
Primario completo
Prim. incompleto
Nunca asistió
Figura 2Control de Calidad del
Procesamiento de muestras.
Cuadro 2Indicadores bioquímicosevaluados según grupo
biológico.
Cuadro 3Categorización del
nivel socioeconómico.
PREVALENCIA (%)
8.7
11.4
27.2
29.3
17.8
0.1
0
0
PUNTAJE
12
10
9
9
6
3
1
0
COLESTEROL
HEMOGLOBINA
RETINOL

D I A G N O S T I C O B A S A L D E S A L U D Y N U T R I C I O N3 8
VARIABLE
II. Condición (*)socio-ocupacional
INDICADORES
Ocupaciónactual del jefede hogar
CATEGORIAS
Directores de empresas
Profesionales en funciónespecífica
Propietarios pequeñasempresas
Cuadros técnicos y asimilados
Empleados administrativosy vendedores
Pequeños productoresautónomos/ trabajadoresespecializados autónomos
Obreros calificados
Obreros no calificados
Empleados domésticosy trabajadores inestables
No PEA (población noeconómicamente activa)
PUNTAJE
12
11
10
8
7
6
4
2
1
0
Casa / departamentoPieza inq. / hotelPrecaria / móvil
Mosaico, madera, plásticoCemento, ladrilloTierra
MamposteríaMaderaFibrocemento, metalCartón, plástico
Losa, teja, asf.MaderaChapaCartón, etc.
Con descarga aguaSin descarga aguaLetrinaPozoNo baño propio
a) Red públicab) Bombac) Otras víasd) Cañer.dentro viv.e) Fuera viv., dentro terrenof) Fuera del terreno
Prop. vivienda y terrenoProp. vivienda solaInquilino
Fiscal o AlquiladoIntrusado
III. Calidadde la vivienda
Tipo de vivienda
Material piso
Pared exterior
Techo
Baño (inodoro)
Provisión de agua
a) Propiedadde la vivienda
b) Propidad delTerreno
IV. Hacinamiento a) Númeromiembros delhogar.
b) Númerode habitaciones(excluyendo bañoy cocina).
Descripción: La variable intervalarconstruida resultante permite segmentarcuatro categorías:
Nº DE PERSONAS POR CUARTO PUNTAJE
1 - 2 6 76.52.01 - 4 3 17.64.01 - y más 0 5.9
(*) Variable construida a partir del nomenclador CSO (programa estructura social argentina). convenio CFI - CEPAL (15).
PREVALENCIA (%)
2.0
6.2
3.8
16.3
19.5
4.9
39.2
3.7
2.1
2.2
200
310
3210
3210
32100
210100
411
10
86.4
13.6
79.217.73.1
21.751.825.61.0
10.21.7
87.50.6
72.93.27.2
17.10
92.20.87.0
91.28.8
63.936.1
25.474.6
El índice resultante de la sumatoria Suma Puntajede los indicadores es el siguiente: 19 - 21 12
15 - 18 910 - 14 65 - 9 3

P R O Y E C T O T I E R R A D E L F U E G O 3 9
Materiales y métodos utilizados en la encuesta
La encuesta se realizó en tres rondas con un intervalo menor a una semana entre las mismas. En la primerase seleccionó la vivienda y se invitó a la familia participar de la encuesta. En la segunda una nutricionistarealizó el recordatorio de alimentos y la encuesta socioeconómica, y en la tercera una enfermera y unasistente dental tomaron las mediciones antropométricas, de tensión arterial, el examen bucal y laextracción de sangre. Todos los resultados bioquímicos fueron codificados para preservar laconfidencialidad de la información y devueltos a las familias en un lapso de dos meses desde el momentode la encuesta.
Indicadores bioquímicos
Las muestras de sangre fueron obtenidas mediante Vacutainers® a través de una extracción venosa,rotuladas y mezcladas por inversión por lo menos 5 veces evitando la formación de espuma.Inmediatamente después, se protegió el tubo de la luz con papel de aluminio y se lo refrigeró para suconservación.
La hemoglobina y el hematocrito se procesaron localmente, las muestras para ácido fólico intraeritrocitariofueron almacenadas con ácido ascórbico y protegidas de la luz. El análisis de zinc-protoporfirinaeritrocitaria se realizó en muestras anticoaguladas con EDTA. El resto de las determinaciones se realizaronsobre plasma conservado a -20 C hasta su determinación. Las muestras fueron transportadas refrigeradas unavez por semana por la Armada Argentina y procesadas en el Laboratorio de Nutricion del Hospital dePediatria J.P. Garrahan. Durante el procesamiento de la muestra se trabajó con muy baja iluminación paraevitar la degradación de la vitamina A.
Para la determinación de hemoglobina se utilizó el método de cianometahemoglobina según Drabkin(Wiener, Argentina). La calibración del espectrofotómetro se realizó diariamente con cada lote de muestrascon estandard Sigma (Sigma Chemical Co, SL, USA) 18 g/dl. La linealidad de la determinación se estableciómediante diluciones conocidas de un standard Wiener en el rango 7.5-15 g/dl de la determinación. Elcontrol de calidad se realizó mediante la lectura simultánea de un standard (Wiener) como una muestramás. El hematocrito se determinó por microhematocrito, centrifugando a 12.000 rpm (centrífuga Gelec)durante 7 minutos. Los parámetros de referencia para el diagnóstico de anemia fueron los valores delpercentilo s de Dallman y Siimes para los distintos grupos de edad y sexo.
La determinación de zinc-protoporfirina (ZPP) en eritrocitos se realizó con un hematofluorómetro (Aviv,modelo 206, Aviv Biomedical Incorporated, Lakewood, NJ USA). Con cada lote de sangre se calibró elequipo con 3 concentraciones distintas de standards del mismo fabricante. Se tomaron como puntos decorte más de 100ug/dl en menores de 4 años y 80 ug/dl en mayores de 4 años.
El colesterol plasmático se determinó por método enzimático (G.Lab Rosario, Argentina). Previo al inicio delestudio se realizó una prueba de linealidad utilizando un estandard y diluciones en el rango de 100 a 400mg/dl constatándose adecuada linealidad. Como control de calidad se procesó simultáneamente con cadalote un Precinorm U (Boehringer, Argentina).
GRUPO SELECCION ENCUESTA ANTROPOMETR. BIOQUIMIC.
Lactantes 268 231 (86.2%) 144 (53.7%) 128 (47.8%)
Preescolares 306 258 (84.3%) 145 (47.4%) 161 (52.6%)
Escolares 294 227 (77.2%) 161 (54.8%) 169 (57.5%)
Adolescentes 281 225 (80.1%) 150 (53.4%) 174 (61.9%)
Embarazadas 124 115 (92.7%) 63 (50.8%) 75 (60.5%)
Mujeres 143 105 (73.4%) 71 (49.6%) 82 (57.3%)
Hombres 149 96 (64.4%) 55 (36.9%) 60 (40.3%)
TOTAL 1565 1257 (80.3%) 789 (50.4%) 849 (54.2%)
Cuadro 4Población seleccionada yencuestada según grupo
biológico.
PUNTAJES CATEGORIAS % HOGARES
5 - 11 Nivel I 1.7
12 - 18 Nivel II 9.7
19 - 24 Nivel III 22.9
25 - 30 Nivel IV 35.7
31 - 36 Nivel V 23.3
37 - 42 Nivel VI 6.6
Cuadro 5Categorización del
nivel socioeconómico.

Para el diagnóstico de hipercolesterolemia se tomaron como referencia los criterios mayores de 20 años y180 a 200 mg/dl en lactantes, prescolares y adolescentes.
La vitamina A (retinol) y vitamina E (tocoferol) se dosaron por cromatografía líquida de alta resolución(HPLC) en un cromatógrafo Varian 5020 (Varian, Palo Alto CA, USA), con una columna Adsorbosphere C18HS, 3, 150x4.6 mm (Alltech Deerfield, IL, USA) utilizando como estandard interno acetato de retinol yacetato de tocoferol (Sigma Chemical Co, SL, USA), fase móvil metanol/agua y detección UV a 325 nm y295 nm. Como control externo de la calibración de la metodología cromatográfica se procesaron sueros delNational Institute of Standards and Technology Gaithersburg MD,USA. Como control de calidad de retinolse utilizó un pool de sueros previamente fraccionado y conservado a -20 C con cada lote de la muestra. Seconsideraron deficientes a los individuos con retinol sérico menor de 20ug/dl y 500ug de tocoferol (11).
La vitamina D (25 OH-vitamina D) se dosó por el métodode Hollis con 125I (Incstar Co,Stillwater,MN, USA). Estemétodo cuantifica 25-OH-vitamina D2 y D3. Con cadalote de muestras se procesaron los estandards decalibración y un suero provisto para control de calidad. Seconsideraron deficientes a los individuos con valoresinferiores a 10ng/ml (12).
La ferritina se determinó por método inmunorradiométrico(IRMA) Coat-A-Count (DPC, Los Angeles, CA, USA). Concada lote de muestras se realizó una curva de calibracióny como control de calidad se utilizó un pool de sueros. Elpunto de corte fue 12ug/l (13).
La vitamina B12 (Valor límite: 175ng/ml), el ácido fólico enplasma (valor límite menor de 3ug/ml), en eritrocitos y ensangre total se dosaron por radioinmunoensayo (DPC, LosAngeles, CA, USA), realizándose una curva de calibración
con cada lote de muestras.
Controles de calidad
Se procesó simultáneamente con cada lote una muestra de valor conocido estableciéndose como criterio deconfiabilidad un límite de confidencia de 95% Ninguno de los lotes debió ser procesado dos veces. Sepresentan los gráficos de control de calidad correspondientes a hemoglobina, colesterol y retinol.
Encuesta alimentaria
Licenciados en nutrición se entrenaron en la técnica encuestal. Se unificaron criterios mediante encuestassupervisadas, hasta que existió concordancia en la identificación de alimentos y en la estimación del tamaño
de la porciones.
La encuesta alimentaria consistió en un recordatorio de 24 horas asistidopor modelos estandardizados para la estimación de tamaños y cantidades.Cuando fué necesario se realizó la inspección del menú de la fábrica o delcolegio para completar la composición de las preparaciones. Las encuestasfueron codificadas localmente y el equipo de terreno brindó consistencia ala información unificando criterios durante el desarrollo de la encuesta.Los alimentos fueron traducidos a nutrientes mediante un programa decomputación desarrollado ad hoc (Programa de Encuestas alimentariasCESNI versión 3.0) contemplando una base de composición química conalimentos locales recopilada por CESNI (14).
Encuesta de nivel socioeconómico
Se relevó información de diferentes indicadores sociales, educativos y devivienda con el propósito de categorizar de acuerdo a un índice confiable
el nivel socioeconómico (NSE)
Se utilizaron diversos indicadores seleccionados por los siguientes criterios:1) Indicadores básicos utilizados por el INDEC en la cédula ampliada del Censo Nacional de Población yVivienda 1991 y en las Encuestas Permanentes de Hogares, los cuales permitirán eventualmente lacomparación con otras zonas del país mediante un índice similar. 2) Indicadores utilizados por CESNI enotros estudios poblacionales debidamente validados. 3) Indicadores sugeridos por el Ministerio de Salud de
D I A G N O S T I C O B A S A L D E S A L U D Y N U T R I C I O N4 0
Figura 4Motivo de consultaal sistema de salud.
Figura 3Distribución geográficasegún radios censalesdel promedio del indicadorde nivel socioeconómico.
NIVEL SOCIOECONOMICOSEGUN RADIOS CENSALES
CONSULTA MEDICA

P R O Y E C T O T I E R R A D E L F U E G O 4 1
Tierra del Fuego, por su especificidad de discriminación local.
Con estos indicadores se construyeron cuatro variables:1) Nivel educacional. 2) Condición socio-ocupacional. 3) Calidad de vivienda. 4) Hacinamiento por cuarto.
La ponderación de cada uno de los indicadores y la prevalencia de aparición en la población de Ushuaiase resume en el cuadro siguiente:
RESULTADOS
Habitan en la isla 69.227 individuos distribuídos preponderantemente en dosciudades: Río Grande y Ushuaia. En la ciudad de Ushuaia el censo declara almomento de la encuesta 29.411 habitantes. Fueron seleccionados sobre una basegeográfica 1565 individuos; de ellos completaron la encuesta 1257, se obtuvoantropometría y examen clínico en 789 y una muestra de sangre para lasdeterminaciónes bioquímicas en 849. La población se mostró muy receptiva a laencuesta y la tasa de aceptación de estudios bioquímicos puede considerarseexcelente de acuerdo a experiencias locales e internacionales.
En el Cuadro siguiente se describen los tamaños muestrales para cada etapa ocomponente de la Encuesta, discriminados por grupos etáreos.
Indicadores de vivienda, educación y condición laboral
Se exponen resumidamente en el cuadro 3. Es importante mencionar que lacategorización de la vivienda en la provincia de Tierra del Fuego probablemente notenga el mismo significado que en el resto del país. Contribuye a que una elevadaproporción de los hogares tengan condiciones estructurales precarias a la dificultadpor acceder a la propiedad de la tierra. Algunas de estas viviendas más precariasestán construídas sobre una plataforma y son trasladadas íntegramente cuando lafamilia consigue otro espacio donde afincarla. Por otro lado, existe ciertadiscordancia entre la precariedad de los materiales constructivos y la habitabilidadde las mismas. En razón de lo riguroso del clima todas ellas son confortables, conadecuada calefacción y con los servicios indispensables cubiertos. El criterio depropiedad de la tierra es un indicador que incide fuertemente en la categorizaciónsocial en Ushuaia.
Los puntajes obtenidos en cada una de las variables (nivel educacional, condiciónsocio-ocupacional, calidad de la vivienda y hacinamiento descriptos) fueronsumados, obteniéndose un rango entre 5 y 42 puntos. Se definieron seis intervaloscorrespondientes a seis niveles económico sociales (NSE) crecientes.
Figura 5Fuentes de información
de puericultura reconocidaspor los padres.
FUENTES DEINFORMACION
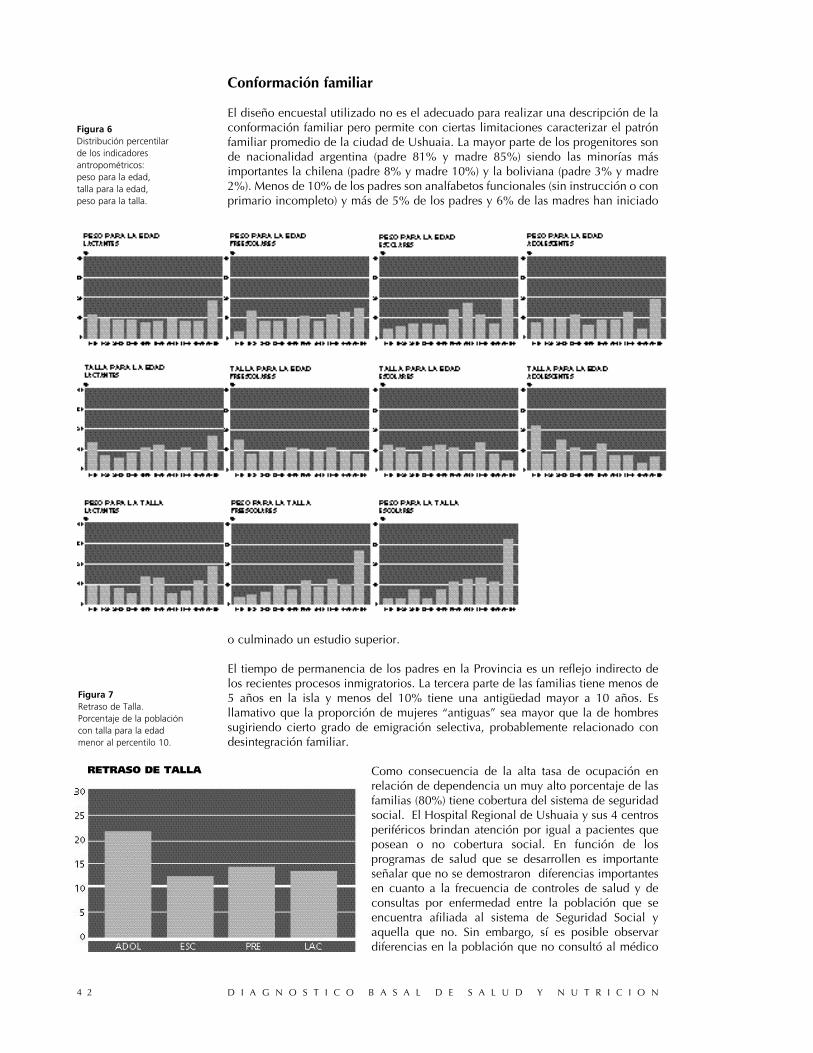
Conformación familiar
El diseño encuestal utilizado no es el adecuado para realizar una descripción de laconformación familiar pero permite con ciertas limitaciones caracterizar el patrónfamiliar promedio de la ciudad de Ushuaia. La mayor parte de los progenitores sonde nacionalidad argentina (padre 81% y madre 85%) siendo las minorías másimportantes la chilena (padre 8% y madre 10%) y la boliviana (padre 3% y madre2%). Menos de 10% de los padres son analfabetos funcionales (sin instrucción o conprimario incompleto) y más de 5% de los padres y 6% de las madres han iniciado
o culminado un estudio superior.
El tiempo de permanencia de los padres en la Provincia es un reflejo indirecto delos recientes procesos inmigratorios. La tercera parte de las familias tiene menos de5 años en la isla y menos del 10% tiene una antigüedad mayor a 10 años. Esllamativo que la proporción de mujeres “antiguas” sea mayor que la de hombressugiriendo cierto grado de emigración selectiva, probablemente relacionado condesintegración familiar.
Como consecuencia de la alta tasa de ocupación enrelación de dependencia un muy alto porcentaje de lasfamilias (80%) tiene cobertura del sistema de seguridadsocial. El Hospital Regional de Ushuaia y sus 4 centrosperiféricos brindan atención por igual a pacientes queposean o no cobertura social. En función de losprogramas de salud que se desarrollen es importanteseñalar que no se demostraron diferencias importantesen cuanto a la frecuencia de controles de salud y deconsultas por enfermedad entre la población que seencuentra afiliada al sistema de Seguridad Social yaquella que no. Sin embargo, sí es posible observardiferencias en la población que no consultó al médico
D I A G N O S T I C O B A S A L D E S A L U D Y N U T R I C I O N4 2
Figura 7Retraso de Talla.Porcentaje de la poblacióncon talla para la edadmenor al percentilo 10.
Figura 6Distribución percentilarde los indicadoresantropométricos:peso para la edad,talla para la edad,peso para la talla.
RETRASO DE TALLA
en el último año. Los individuos sin afiliación consultaron menos en el pasado añoque los que tenían cobertura social (figura 4).
La consulta médica para control en salud es una valiosísima oportunidad para losprogramas preventivos. En este sentido es importante destacar que más del 80% delos lactantes y del 57% de los preescolares concurrieron al médicoespontáneamente para su control en salud. A estas cifras es necesario agregar loscontroles periódicos dependientes de los programas de salud escolar vigentes.
La prevalencia de bajo peso de nacimiento fué menor que la descripta por algunaspublicaciones estadísticas (16). El 7.4% de los lactantes presentaron bajo peso denacimiento (menor de 2500 gramos) y el 15.7 % peso insuficiente (entre 2500 y3000 gramos); el 20.8% de los partos fué realizado por cesárea, el 13.4% de losrecién nacidos requirieron incubadora y el 9.5% luminoterapia.
En relación a la lactancia materna las cifras son mejores que las referidas por otrosestudios poblacionales en nuestro país (3) (17). Solamente 6.6% de las madres no
amamantaron nunca o lo hicieron por menos de 1 mes, 20% amamantó entre 1 y 3meses, 22% entre 3 y 6 meses, 13% entre 6 y 9 meses, 14% entre 9 meses y 1 añoy 24% por más de un año. Se entiende por lactancia exclusiva la utilización de laleche humana como único alimento sin la suplementación de sucedáneos. La
P R O Y E C T O T I E R R A D E L F U E G O 4 3
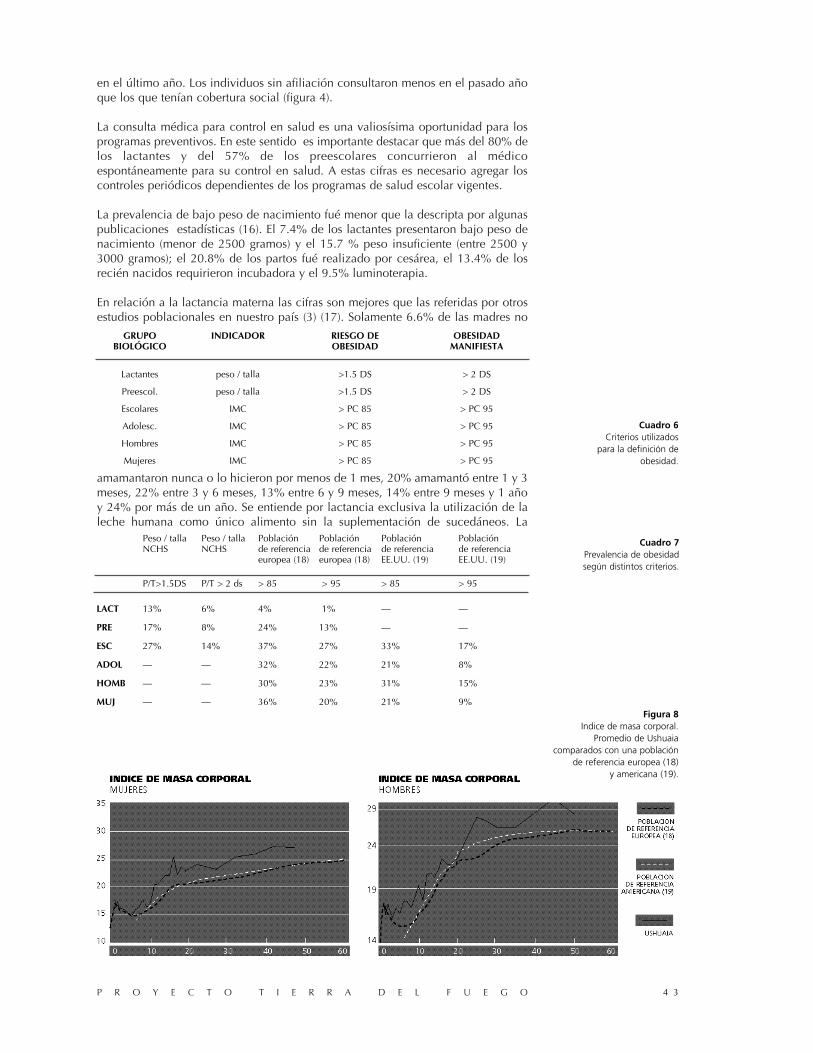
GRUPO INDICADOR RIESGO DE OBESIDADBIOLÓGICO OBESIDAD MANIFIESTA
Lactantes peso / talla >1.5 DS > 2 DS
Preescol. peso / talla >1.5 DS > 2 DS
Escolares IMC > PC 85 > PC 95
Adolesc. IMC > PC 85 > PC 95
Hombres IMC > PC 85 > PC 95
Mujeres IMC > PC 85 > PC 95
Peso / talla Peso / talla Población Población Población PoblaciónNCHS NCHS de referencia de referencia de referencia de referencia
europea (18) europea (18) EE.UU. (19) EE.UU. (19)
P/T>1.5DS P/T > 2 ds > 85 > 95 > 85 > 95
LACT 13% 6% 4% 1% — —
PRE 17% 8% 24% 13% — —
ESC 27% 14% 37% 27% 33% 17%
ADOL — — 32% 22% 21% 8%
HOMB — — 30% 23% 31% 15%
MUJ — — 36% 20% 21% 9%
Cuadro 7Prevalencia de obesidadsegún distintos criterios.
Cuadro 6Criterios utilizados
para la definición deobesidad.
Figura 8Indice de masa corporal.
Promedio de Ushuaiacomparados con una población
de referencia europea (18)y americana (19).
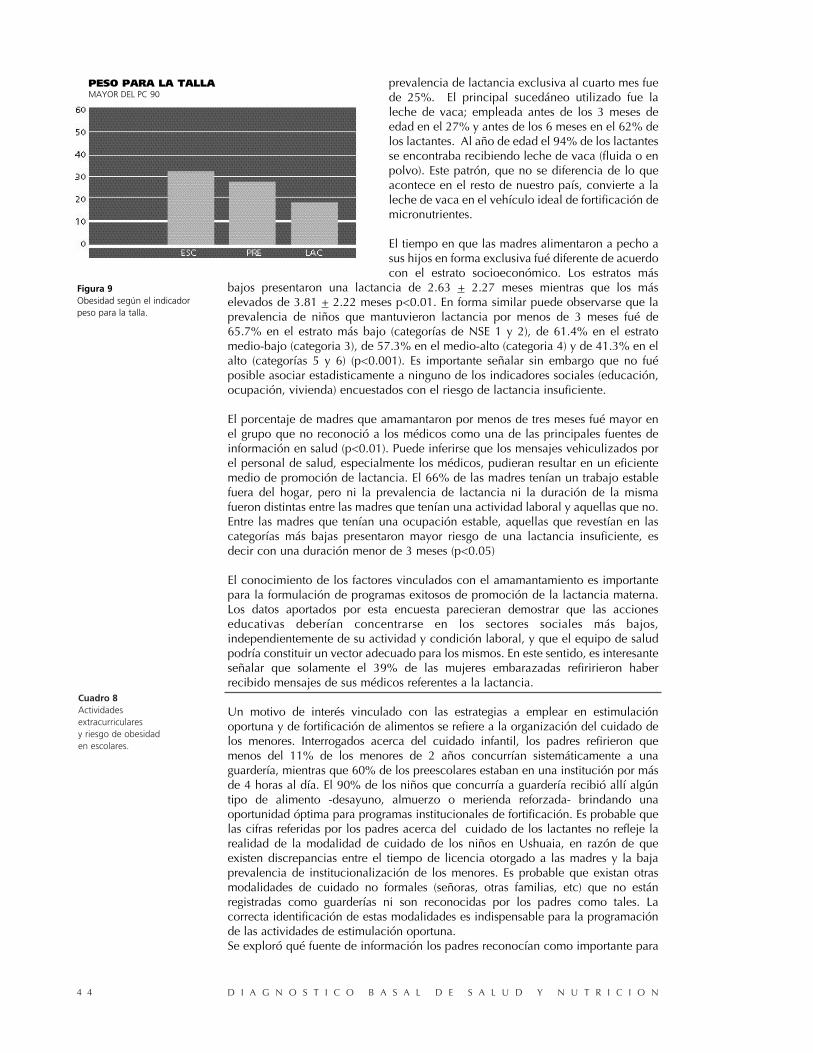
D I A G N O S T I C O B A S A L D E S A L U D Y N U T R I C I O N4 4
Cuadro 8Actividadesextracurricularesy riesgo de obesidaden escolares.
prevalencia de lactancia exclusiva al cuarto mes fuede 25%. El principal sucedáneo utilizado fue laleche de vaca; empleada antes de los 3 meses deedad en el 27% y antes de los 6 meses en el 62% delos lactantes. Al año de edad el 94% de los lactantesse encontraba recibiendo leche de vaca (fluida o enpolvo). Este patrón, que no se diferencia de lo queacontece en el resto de nuestro país, convierte a laleche de vaca en el vehículo ideal de fortificación demicronutrientes.
El tiempo en que las madres alimentaron a pecho asus hijos en forma exclusiva fué diferente de acuerdocon el estrato socioeconómico. Los estratos más
bajos presentaron una lactancia de 2.63 + 2.27 meses mientras que los máselevados de 3.81 + 2.22 meses p<0.01. En forma similar puede observarse que laprevalencia de niños que mantuvieron lactancia por menos de 3 meses fué de65.7% en el estrato más bajo (categorías de NSE 1 y 2), de 61.4% en el estratomedio-bajo (categoria 3), de 57.3% en el medio-alto (categoria 4) y de 41.3% en elalto (categorías 5 y 6) (p<0.001). Es importante señalar sin embargo que no fuéposible asociar estadisticamente a ninguno de los indicadores sociales (educación,ocupación, vivienda) encuestados con el riesgo de lactancia insuficiente.
El porcentaje de madres que amamantaron por menos de tres meses fué mayor enel grupo que no reconoció a los médicos como una de las principales fuentes deinformación en salud (p<0.01). Puede inferirse que los mensajes vehiculizados porel personal de salud, especialmente los médicos, pudieran resultar en un eficientemedio de promoción de lactancia. El 66% de las madres tenían un trabajo establefuera del hogar, pero ni la prevalencia de lactancia ni la duración de la mismafueron distintas entre las madres que tenían una actividad laboral y aquellas que no.Entre las madres que tenían una ocupación estable, aquellas que revestían en lascategorías más bajas presentaron mayor riesgo de una lactancia insuficiente, esdecir con una duración menor de 3 meses (p<0.05)
El conocimiento de los factores vinculados con el amamantamiento es importantepara la formulación de programas exitosos de promoción de la lactancia materna.Los datos aportados por esta encuesta parecieran demostrar que las accioneseducativas deberían concentrarse en los sectores sociales más bajos,independientemente de su actividad y condición laboral, y que el equipo de saludpodría constituir un vector adecuado para los mismos. En este sentido, es interesanteseñalar que solamente el 39% de las mujeres embarazadas refiririeron haberrecibido mensajes de sus médicos referentes a la lactancia.
Un motivo de interés vinculado con las estrategias a emplear en estimulaciónoportuna y de fortificación de alimentos se refiere a la organización del cuidado delos menores. Interrogados acerca del cuidado infantil, los padres refirieron quemenos del 11% de los menores de 2 años concurrían sistemáticamente a unaguardería, mientras que 60% de los preescolares estaban en una institución por másde 4 horas al día. El 90% de los niños que concurría a guardería recibió allí algúntipo de alimento -desayuno, almuerzo o merienda reforzada- brindando unaoportunidad óptima para programas institucionales de fortificación. Es probable quelas cifras referidas por los padres acerca del cuidado de los lactantes no refleje larealidad de la modalidad de cuidado de los niños en Ushuaia, en razón de queexisten discrepancias entre el tiempo de licencia otorgado a las madres y la bajaprevalencia de institucionalización de los menores. Es probable que existan otrasmodalidades de cuidado no formales (señoras, otras familias, etc) que no estánregistradas como guarderías ni son reconocidas por los padres como tales. Lacorrecta identificación de estas modalidades es indispensable para la programaciónde las actividades de estimulación oportuna.Se exploró qué fuente de información los padres reconocían como importante para
Figura 9Obesidad según el indicadorpeso para la talla.
PESO PARA LA TALLAMAYOR DEL PC 90

P R O Y E C T O T I E R R A D E L F U E G O 4 5
la transmisión de mensajes de saludrelacionados con el cuidado de los menores de6 años (Figura 5). Los médicos, pero no así otrosintegrantes del equipo de salud, fueron laprincipal fuente de información, especialmenteen los lactantes. Pero los familiares aportaron enpracticamente la misma proporción mensajes depuericultura. Libros, revistas y televisión fueronuna fuente percibida como importante entre el10 y 20% de los padres, mientras que la radio -el principal y más utilizado medio de difusiónen la isla- no es reconocido por los padres comouna fuente de información en salud.
Indicadores antropométricos
La distribución percentilar de los indicadores peso/edad, talla/edad y peso/talla se
presentan en las siguientes figuras:En relación con el indicador talla/edad, puede observarse que en términos generalesse corresponde aceptablemente con la población de referencia. (bondad de ajustex2=p<0.42). El 13.2 % de los lactantes, el 14.4% de los los preescolares, 12,3% delos escolares y el 21.7% de los adolescentes crecían por debajo del primer decil. Conlas limitaciones metodológicas propias de todo análisis transversal, puede decirseque es posible diferenciar el patrón de crecimiento de los adolescentes del observadoen lactantes y niños (Figura 7). Los adolescentes presentaron mayor prevalencia deretraso crónico de crecimiento que los niños más pequeños. En razón del pocotiempo de residencia en la Provincia de la mayoría de las familias de Ushuaia, puedeespecularse que estas diferencias en la talla de los adolescentes reflejen condicionesambientales adversas ocurridas antes de su emigración. En favor de esta especulaciónlos adolescentes con menor talla corres-pondieron a familias con menor nivelsocioeconómico (p< 0.02); menor nivel educativo -madres con primario completo oincompleto- (p< 0.01); o con un peso de nacimiento menor a 2500 gramos (p< 0.05).Como corolario, podría inferirse que las condiciones sanitarias y de nutrición desde suarribo a la isla se han modificado favorablemente y han sido suficientes para evitar laaparición de retraso crónico de crecimiento en los niños nacidos o criadostempranamente en Tierra del Fuego.Sobrepeso y obesidad
Se considera sobrepeso al aumento del peso corporal por sobre un determinadovalor límite sea este expresado en forma absoluta para la edad, como porcentaje deun peso teórico relativo a la edad o como índice de masa corporal (IMC) (peso/tallaal cuadrado). Mientras que se considera obesidad al aumento de la cantidad degrasa corporal. En razón de los instrumentos antropométricos utilizados, seobtuvieron indicadores exclusivamente de sobrepeso aunque en el contexto deltrabajo se refiera a ellos indistintamente como sobrepeso u obesidad. Se consideraque un individuo presenta riesgo de obesidad (o llamada también obesidad loslimites) cuando por su peso y talla muy probablemente tenga un aumento de sugrasa corporal, mientras que se considera obesidad manifiesta cuando su aumento
% RDA (*) LACT PREES ESC ADOL HOMB MUJ EMBA
< 50 % 32.8 19.5 15.9 35.2 20.0 51.1 89.3
50-75 % 15.0 19.9 18.2 20.0 25.0 22.0 7.1
75-100 % 15.6 19.9 17.8 15.3 25.0 14.4 1.6
100-120 % 8.2 12.7 13.5 10.5 22.5 6.7 1.1
> 120 % 28.4 28.0 34.6 19.0 22.5 5.8 0.9
Cuadro 9Ingesta de Hierro expresada
como porcentaje de lasrecomendaciones nutricionales.
Figura 10Porcentaje de la población que
no cubre su recomendaciónde hierro.
Cuadro 10Prevalencia de Anemia
en Ushuaia.
(*) Porcentaje de la población por debajo de la recomendación nutricional.(Recomended Dietary Allowances) (20).
Figura 11Prevalencia de anemia y deficiencia
de hierro (concentración de ferritina)en la población.
DEPOSITOSDE HIERRO Y ANEMIA
INGESTA DE HIERRO
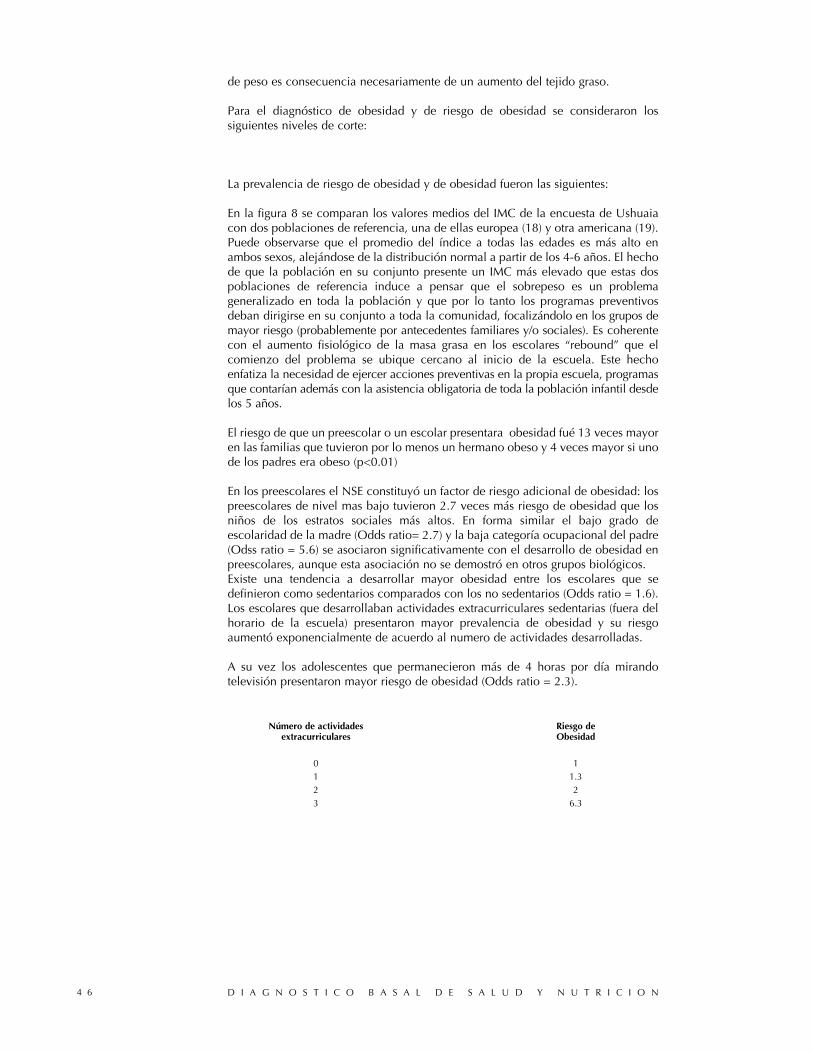
de peso es consecuencia necesariamente de un aumento del tejido graso.
Para el diagnóstico de obesidad y de riesgo de obesidad se consideraron lossiguientes niveles de corte:
La prevalencia de riesgo de obesidad y de obesidad fueron las siguientes:
En la figura 8 se comparan los valores medios del IMC de la encuesta de Ushuaiacon dos poblaciones de referencia, una de ellas europea (18) y otra americana (19).Puede observarse que el promedio del índice a todas las edades es más alto enambos sexos, alejándose de la distribución normal a partir de los 4-6 años. El hechode que la población en su conjunto presente un IMC más elevado que estas dospoblaciones de referencia induce a pensar que el sobrepeso es un problemageneralizado en toda la población y que por lo tanto los programas preventivosdeban dirigirse en su conjunto a toda la comunidad, focalizándolo en los grupos demayor riesgo (probablemente por antecedentes familiares y/o sociales). Es coherentecon el aumento fisiológico de la masa grasa en los escolares “rebound” que elcomienzo del problema se ubique cercano al inicio de la escuela. Este hechoenfatiza la necesidad de ejercer acciones preventivas en la propia escuela, programasque contarían además con la asistencia obligatoria de toda la población infantil desdelos 5 años.
El riesgo de que un preescolar o un escolar presentara obesidad fué 13 veces mayoren las familias que tuvieron por lo menos un hermano obeso y 4 veces mayor si unode los padres era obeso (p<0.01)
En los preescolares el NSE constituyó un factor de riesgo adicional de obesidad: lospreescolares de nivel mas bajo tuvieron 2.7 veces más riesgo de obesidad que losniños de los estratos sociales más altos. En forma similar el bajo grado deescolaridad de la madre (Odds ratio= 2.7) y la baja categoría ocupacional del padre(Odss ratio = 5.6) se asociaron significativamente con el desarrollo de obesidad enpreescolares, aunque esta asociación no se demostró en otros grupos biológicos.Existe una tendencia a desarrollar mayor obesidad entre los escolares que sedefinieron como sedentarios comparados con los no sedentarios (Odds ratio = 1.6).Los escolares que desarrollaban actividades extracurriculares sedentarias (fuera delhorario de la escuela) presentaron mayor prevalencia de obesidad y su riesgoaumentó exponencialmente de acuerdo al numero de actividades desarrolladas.
A su vez los adolescentes que permanecieron más de 4 horas por día mirandotelevisión presentaron mayor riesgo de obesidad (Odds ratio = 2.3).
Número de actividades Riesgo de extracurriculares Obesidad
0 11 1.32 23 6.3
D I A G N O S T I C O B A S A L D E S A L U D Y N U T R I C I O N4 6

P R O Y E C T O T I E R R A D E L F U E G O 4 7
Situación nutricional de hierro
La situación nutricional de hierro fue uno de los pilares de la investigaciónbioquímica tanto en razón de su elevada prevalencia en la población infantil denuestro país como de su importancia en las alteraciones funcionales del procesocognitivo.
La encuesta alimentaria demostró que la ingesta de hierro es deficiente enprácticamente todos los grupos biológicos. Puede observarse en el Cuadro 9 queentre el 55% (adolescentes) al 98% de la población (adultos) presentaron unaingesta de hierro menor que la recomendación nutricional.
En la figura 10 puede observarse en barras horizontales el porcentaje de individuosde cada grupo biológico que satisface un intervalo específico de su recomendaciónnutricional. En relación con la ingesta de hierro se observa que una proporciónimportante de los lactantes, de las mujeres embarazadas y de los adolescentespresentaron una ingesta de hierro muy baja.
La prevalencia de anemia encontrada en los diferentes grupos etáreos y/ofisiológicos se resume en el siguiente cuadro:
LACTANTES PREESCOLARES ESCOLARES ADOLESC. EMBARAZ. MUJER HOMBRE
20.6 % 10.8 % 10.2 % 11.7 % 38.6 % 10.3 % 15.8 %
Se analizan a continuación los resultados según grupo biológico, considerando enparticular a los lactantes y las mujeres en virtud de su mayor vulnerabilidad (Figura 11).
Cuadro 11 ADeficiencia de hierro,
folatos y anemiaen lactantes.
Cuadro 11 BDeficiencia de hierro,vitamina A y anemia
en lactantes.
LACTANTES ANEMICOS NO ANEMICOS
(n = 102) 20.6% 79.4%
DEF. HIERRO SI NO SI NO
(63.8%) 90.5% 9.5% 56.8% 43.2%
DEF. FOLATOS SI NO SI NO SI NO SI NO
(5.9%) 5.3% 94.7% 0% 100% 6.5% 93.5% 5.7% 94.3%
LACTANTES ANEMICOS NO ANEMICOS
20.6% 79.4%
DEF. HIERRO SI NO SI NO
(63.8%) 90.5% 9.5% 56.8% 43.2%
DEF. VIT A SI NO SI NO SI NO SI NO
(9.1%) 17% 83% 0% 100% 11% 89% 3% 97%

Lactantes:
• Concentración de hemoglobina (gl/dl) 11.63 + 1.13• Hematocrito (%) 34.74 + 3.44 • Zinc-protoporfirina (mol/mol Heme) 77.38 + 50.95• Ferritina sérica (mg/l) 19.91 + 37.56• Folatos plasmáticos (g/ml) 6.71 + 3.12• Vitamina B12 (ng/ml) 580.83 + 220.01
La prevalencia de anemia en el grupo de lactantes -definida según concentración dehemoglobina inferior a 11 g/dL- fué de 20.6%. Los depósitos de hierro, medidos porferritina sérica, se encontraron deplecionados en el 51.9% de los niños y el 42.5%de los casos presentaron un indicador de eritropoyesis deficiente (Zinc-protoporfirina elevada).
El 90.9% de los lactantes anémicos presentaron uno o dos indicadores de deficienciade hierro en el rango anormal (zinc-protoporfirina o ferritina sérica). En este grupo delactantes anémicos con deficiencia de hierro, el 16.7% presentó además un valor deretinol sérico inferior a 20 ug/dL y el 5.3% de los niños presentó folatos plasmáticospor debajo de 3 ug/mL. La prevalencia de deficiencia de folatos en los lactantesanémicos fué similar a la de la población general de lactantes (5.9%). La deficienciade vitamina A tuvo una prevalencia mayor en el grupo de lactantes anémicos (15%)que en los no-anémicos (7.6%). Los niveles de retinol sérico se asociaron con losniveles de hemoglobina (coeficiente de correlación r de Pearson = 0.30, p =<0.002).
Los sujetos que no presentaron indicadores de deficiencia de hierro, tampocopresentaron deficiencia de vitamina A ni de folatos plasmáticos.
En resumen, de los casos de anemia en lactantes:• 71.4% presentó deficiencia aislada de hierro• 14.3% presentó deficiencia combinada de hierro y vitamina A• 4.8% presentó deficiencia combinada de hierro y folatos plasmáticos;• 9.5% no tuvo indicadores bioquímicos de deficiencia de ninguno de los nutrientes.
El análisis de los factores de riesgo de anemia en los lactantes se realizó en dosetapas: evaluación de asociaciones bivariadas y regresión múltiple.
En otras investigaciones (3) el peso al nacer, el tiempo de duración de la lactanciaexclusiva y la edad de introducción de la leche de vaca han resultado ser fuertespredictores del desarrollo de anemia. En este estudio, el análisis de las tendenciaslineales de las asociaciones bivariadas entre estos factores y la presencia de anemiano alcanzó significación estadística. Sin embargo, al analizar modelos de regresiónlineal múltiple, la duración total del amamantamiento y la edad de introducción dela leche de vaca en la dieta se asociaron significativamente con el nivel dehemoglobina. Las variables ingresadas en el modelo fueron: peso al nacer,antecedente de cesárea, lugar de consulta, duración total de la lactancia, duracióndel consumo de fórmulas fortificadas, edad de introducción de leche de vaca, edadde introducción de carne en la dieta, nivel de folatos plasmáticos y de retinol sérico.Estos factores combinados explicaron el 24.6% de las variaciones en el nivel dehemoglobina. R2 ajustado = 0.246, F = 3.03, p = 0.006.Al introducir en el modelo de regresión indicadores de estado nutricional de hierro(ZPP y ferritina sérica), la fuerte asociación directa de estas variables anuló el pesode otros factores causales, presentando coeficientes significativos sólo laprotoporfirina eritrocitaria y la edad de comienzo de la leche de vaca. R2 ajustado= 0.359, F = 4.079, p = 0.0005.
D I A G N O S T I C O B A S A L D E S A L U D Y N U T R I C I O N4 8
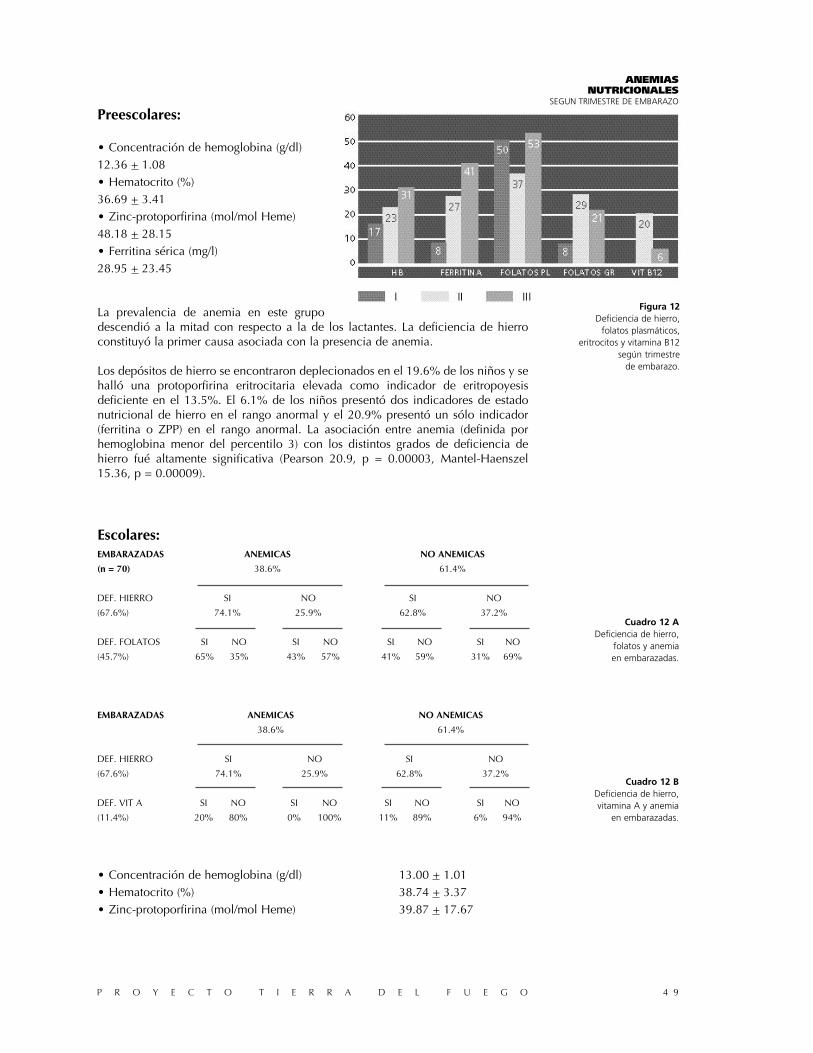
P R O Y E C T O T I E R R A D E L F U E G O 4 9
Preescolares:
• Concentración de hemoglobina (g/dl)12.36 + 1.08• Hematocrito (%)36.69 + 3.41• Zinc-protoporfirina (mol/mol Heme)48.18 + 28.15• Ferritina sérica (mg/l)28.95 + 23.45
La prevalencia de anemia en este grupodescendió a la mitad con respecto a la de los lactantes. La deficiencia de hierroconstituyó la primer causa asociada con la presencia de anemia.
Los depósitos de hierro se encontraron deplecionados en el 19.6% de los niños y sehalló una protoporfirina eritrocitaria elevada como indicador de eritropoyesisdeficiente en el 13.5%. El 6.1% de los niños presentó dos indicadores de estadonutricional de hierro en el rango anormal y el 20.9% presentó un sólo indicador(ferritina o ZPP) en el rango anormal. La asociación entre anemia (definida porhemoglobina menor del percentilo 3) con los distintos grados de deficiencia dehierro fué altamente significativa (Pearson 20.9, p = 0.00003, Mantel-Haenszel15.36, p = 0.00009).
Escolares:
• Concentración de hemoglobina (g/dl) 13.00 + 1.01• Hematocrito (%) 38.74 + 3.37• Zinc-protoporfirina (mol/mol Heme) 39.87 + 17.67
Cuadro 12 ADeficiencia de hierro,
folatos y anemiaen embarazadas.
Cuadro 12 BDeficiencia de hierro,vitamina A y anemia
en embarazadas.
EMBARAZADAS ANEMICAS NO ANEMICAS
(n = 70) 38.6% 61.4%
DEF. HIERRO SI NO SI NO
(67.6%) 74.1% 25.9% 62.8% 37.2%
DEF. FOLATOS SI NO SI NO SI NO SI NO
(45.7%) 65% 35% 43% 57% 41% 59% 31% 69%
EMBARAZADAS ANEMICAS NO ANEMICAS
38.6% 61.4%
DEF. HIERRO SI NO SI NO
(67.6%) 74.1% 25.9% 62.8% 37.2%
DEF. VIT A SI NO SI NO SI NO SI NO
(11.4%) 20% 80% 0% 100% 11% 89% 6% 94%
Figura 12Deficiencia de hierro,
folatos plasmáticos, eritrocitos y vitamina B12
según trimestrede embarazo.
ANEMIASNUTRICIONALES
SEGUN TRIMESTRE DE EMBARAZO
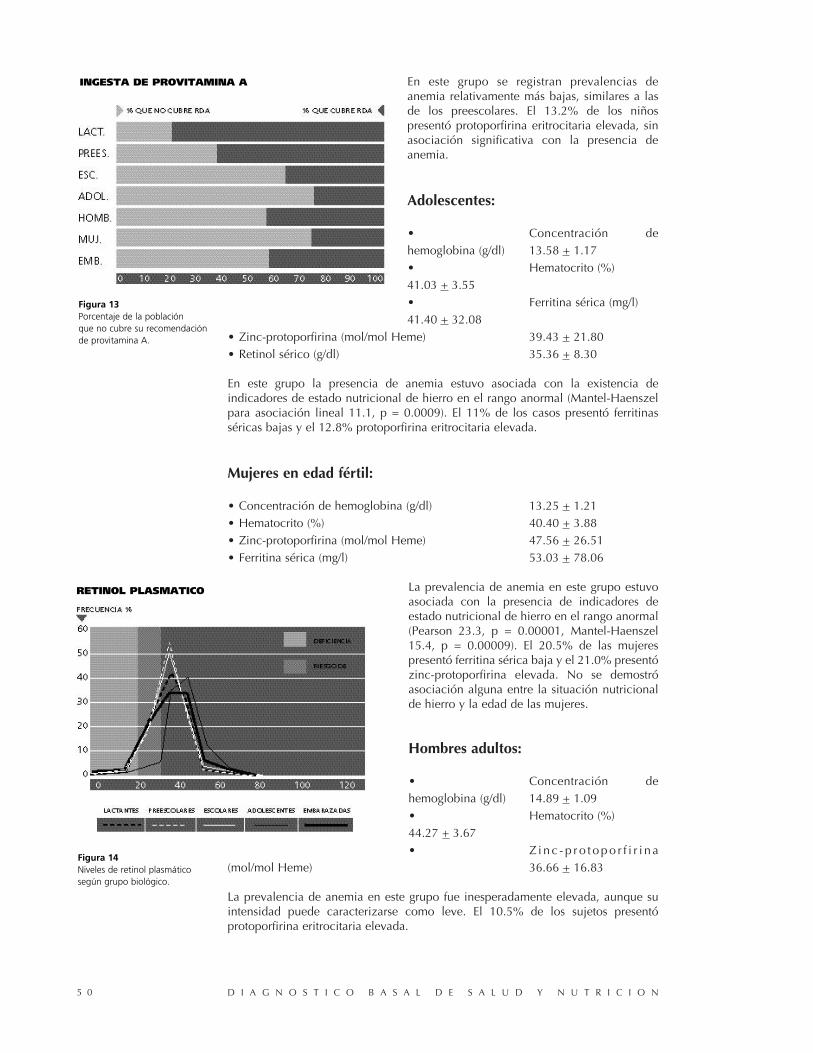
En este grupo se registran prevalencias deanemia relativamente más bajas, similares a lasde los preescolares. El 13.2% de los niñospresentó protoporfirina eritrocitaria elevada, sinasociación significativa con la presencia deanemia.
Adolescentes:
• Concentración dehemoglobina (g/dl) 13.58 + 1.17• Hematocrito (%)41.03 + 3.55• Ferritina sérica (mg/l)41.40 + 32.08
• Zinc-protoporfirina (mol/mol Heme) 39.43 + 21.80• Retinol sérico (g/dl) 35.36 + 8.30
En este grupo la presencia de anemia estuvo asociada con la existencia deindicadores de estado nutricional de hierro en el rango anormal (Mantel-Haenszelpara asociación lineal 11.1, p = 0.0009). El 11% de los casos presentó ferritinasséricas bajas y el 12.8% protoporfirina eritrocitaria elevada.
Mujeres en edad fértil:
• Concentración de hemoglobina (g/dl) 13.25 + 1.21• Hematocrito (%) 40.40 + 3.88• Zinc-protoporfirina (mol/mol Heme) 47.56 + 26.51• Ferritina sérica (mg/l) 53.03 + 78.06
La prevalencia de anemia en este grupo estuvoasociada con la presencia de indicadores deestado nutricional de hierro en el rango anormal(Pearson 23.3, p = 0.00001, Mantel-Haenszel15.4, p = 0.00009). El 20.5% de las mujerespresentó ferritina sérica baja y el 21.0% presentózinc-protoporfirina elevada. No se demostróasociación alguna entre la situación nutricionalde hierro y la edad de las mujeres.
Hombres adultos:
• Concentración dehemoglobina (g/dl) 14.89 + 1.09• Hematocrito (%)44.27 + 3.67• Z i n c - p r o t o p o r f i r i n a
(mol/mol Heme) 36.66 + 16.83
La prevalencia de anemia en este grupo fue inesperadamente elevada, aunque suintensidad puede caracterizarse como leve. El 10.5% de los sujetos presentóprotoporfirina eritrocitaria elevada.
D I A G N O S T I C O B A S A L D E S A L U D Y N U T R I C I O N5 0
Figura 14Niveles de retinol plasmáticosegún grupo biológico.
RETINOL PLASMATICO
Figura 13Porcentaje de la poblaciónque no cubre su recomendaciónde provitamina A.
INGESTA DE PROVITAMINA A
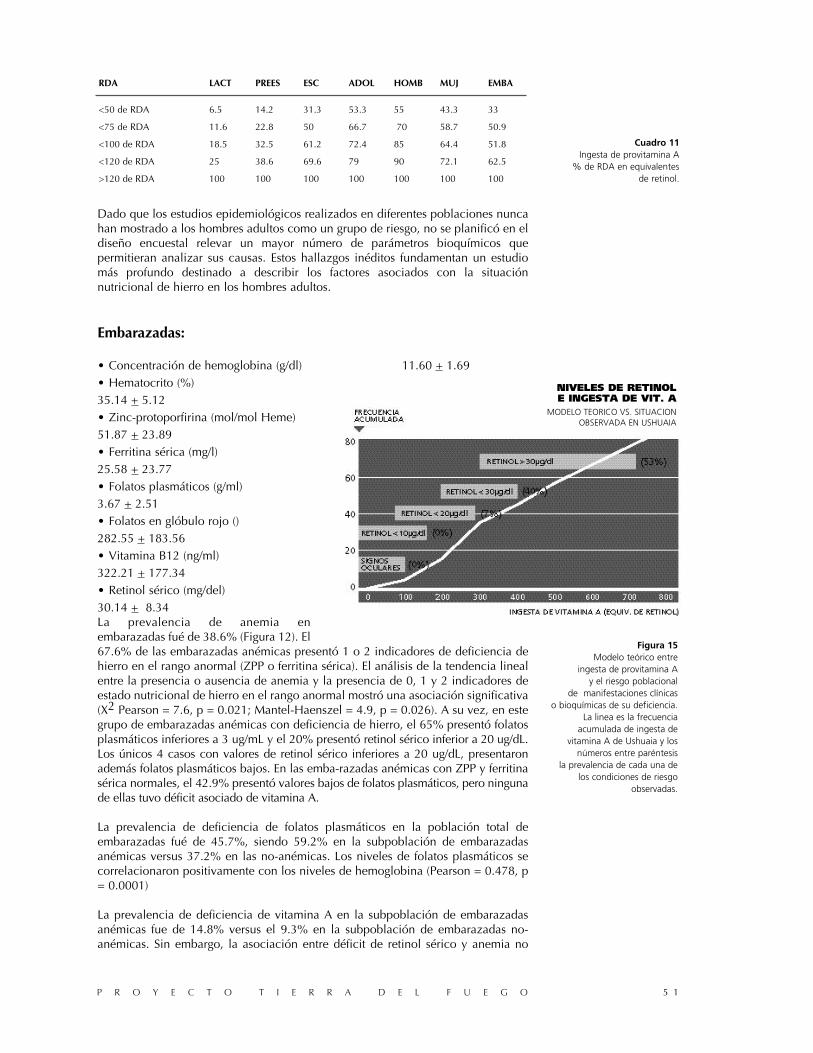
P R O Y E C T O T I E R R A D E L F U E G O 5 1
Dado que los estudios epidemiológicos realizados en diferentes poblaciones nuncahan mostrado a los hombres adultos como un grupo de riesgo, no se planificó en eldiseño encuestal relevar un mayor número de parámetros bioquímicos quepermitieran analizar sus causas. Estos hallazgos inéditos fundamentan un estudiomás profundo destinado a describir los factores asociados con la situaciónnutricional de hierro en los hombres adultos.
Embarazadas:
• Concentración de hemoglobina (g/dl) 11.60 + 1.69• Hematocrito (%)35.14 + 5.12• Zinc-protoporfirina (mol/mol Heme)51.87 + 23.89• Ferritina sérica (mg/l)25.58 + 23.77• Folatos plasmáticos (g/ml)3.67 + 2.51• Folatos en glóbulo rojo ()282.55 + 183.56• Vitamina B12 (ng/ml)322.21 + 177.34• Retinol sérico (mg/del)30.14 + 8.34La prevalencia de anemia enembarazadas fué de 38.6% (Figura 12). El67.6% de las embarazadas anémicas presentó 1 o 2 indicadores de deficiencia dehierro en el rango anormal (ZPP o ferritina sérica). El análisis de la tendencia linealentre la presencia o ausencia de anemia y la presencia de 0, 1 y 2 indicadores deestado nutricional de hierro en el rango anormal mostró una asociación significativa(X2 Pearson = 7.6, p = 0.021; Mantel-Haenszel = 4.9, p = 0.026). A su vez, en estegrupo de embarazadas anémicas con deficiencia de hierro, el 65% presentó folatosplasmáticos inferiores a 3 ug/mL y el 20% presentó retinol sérico inferior a 20 ug/dL.Los únicos 4 casos con valores de retinol sérico inferiores a 20 ug/dL, presentaronademás folatos plasmáticos bajos. En las emba-razadas anémicas con ZPP y ferritinasérica normales, el 42.9% presentó valores bajos de folatos plasmáticos, pero ningunade ellas tuvo déficit asociado de vitamina A.
La prevalencia de deficiencia de folatos plasmáticos en la población total deembarazadas fué de 45.7%, siendo 59.2% en la subpoblación de embarazadasanémicas versus 37.2% en las no-anémicas. Los niveles de folatos plasmáticos secorrelacionaron positivamente con los niveles de hemoglobina (Pearson = 0.478, p= 0.0001)
La prevalencia de deficiencia de vitamina A en la subpoblación de embarazadasanémicas fue de 14.8% versus el 9.3% en la subpoblación de embarazadas no-anémicas. Sin embargo, la asociación entre déficit de retinol sérico y anemia no
RDA LACT PREES ESC ADOL HOMB MUJ EMBA
<50 de RDA 6.5 14.2 31.3 53.3 55 43.3 33
<75 de RDA 11.6 22.8 50 66.7 70 58.7 50.9
<100 de RDA 18.5 32.5 61.2 72.4 85 64.4 51.8
<120 de RDA 25 38.6 69.6 79 90 72.1 62.5
>120 de RDA 100 100 100 100 100 100 100
Cuadro 11Ingesta de provitamina A
% de RDA en equivalentesde retinol.
Figura 15Modelo teórico entre
ingesta de provitamina Ay el riesgo poblacional
de manifestaciones clínicaso bioquímicas de su deficiencia.
La linea es la frecuenciaacumulada de ingesta de
vitamina A de Ushuaia y losnúmeros entre paréntesis
la prevalencia de cada una delos condiciones de riesgo
observadas.
NIVELES DE RETINOLE INGESTA DE VIT. A
MODELO TEORICO VS. SITUACIONOBSERVADA EN USHUAIA

D I A G N O S T I C O B A S A L D E S A L U D Y N U T R I C I O N5 2
alcanzó significación estadística.
En resumen, de los casos de anemia en embarazadas:• 11.1% presentó deficiencia aislada de folatos plasmáticos,
• 25.9% presentó deficiencia aislada de hierro,• 33.3% presentó deficiencia combinada dehierro y folatos,• 14.8% presentó deficiencia combinada dehierro, folatos y vitamina A,• 14.8% no presentó indicadores bioquímicosde deficiencia de ninguno de estos nutrientes.La deficiencia de vitamina B12 tuvo unaprevalencia global de 7.1% y no estuvo asociadacon la deficiencia de folatos plasmáticos. Los 5casos con vitamina B12 inferior a 175 ng/mLcorrespondieron a embarazadas no-anémicas.
Los factores de riesgo de anemia en las mujeresembarazadas fueron analizados a través de
regresiones múltiples. El modelo que presentó una mejor asociación, explicando el36% de las variaciones en el nivel de hemoglobina, incluyó las siguientes variablesindependientes: edad, trimestre de embarazo, número de embarazo, consumo desuplementos de hierro durante el embarazo, folatos plasmáticos, folatos en glóbulorojo, zinc-protoporfirina y retinol sérico. R2 ajustado = 0.36, F = 4.75, p = 0.0001.
Deficiencia de vitamina A
Existen muy pocos datos acerca de ladeficiencia de vitamina A en nuestro país apesar de que numerosas encuestas demuestranque la ingesta de provitamina A de losalimentos es marginal en amplios sectores dela población (21). En la encuesta alimentariade Ushuaia se observó que los individuos demenor edad presentaron una ingesta devitamina A relativa a sus recomendacionesmás alta que la de los de mayor edad a pesarde que las recomendaciones nutricionales novarían sustancialmente a lo largo de la vida.Esta mejor ingesta se explica por la mayor
ingesta de lácteos -una de las más importantes fuentes de esta vitamina- en los máspequeños que fue relativamente alta. A pesar de ello, 21% de los lactantes y 37%de los preescolares no cubrieron las recomendaciones de vitamina A. Estos gruposetáreos son especialmente importantes en función de la suceptibilidad a ladeficiencia de retinol y su potencial impacto sobre la inmunidad yconsecuentemente sobre la morbimortalidad.
En forma similar puede observarse que a medida que aumenta la edad, la ingesta dealimentos ricos en vitamina A disminuye.
media Deficiencia Deficiencia riesgo de + ds severa moderada deficiencia
lactantes 22.9 + 14 13% 16.5% 21.7%
preescolares 20.6 + 12.3 13.2% 16.4% 23%
embarazadas 11.8 + 8.1 38.4% 53.4% 69.9%
Cuadro 12Niveles medios de25 OH- vitamina Dy prevalencia de deficiencia.
Figura 17Ingesta de calcio.
Figura 16Frecuencia acumuladade niveles plásmaticos devitamina D y porcentaje depoblación con deficienciay valores marginales.
VITAMINA D
INGESTA DE CALCIO
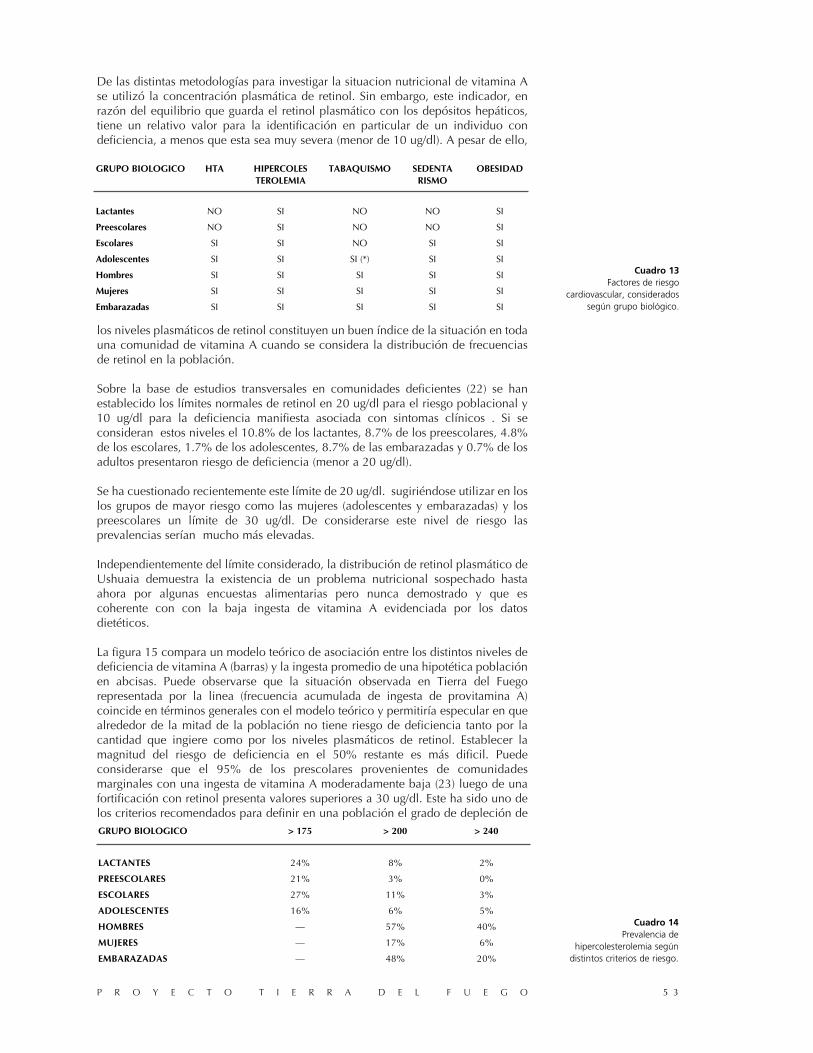
De las distintas metodologías para investigar la situacion nutricional de vitamina Ase utilizó la concentración plasmática de retinol. Sin embargo, este indicador, enrazón del equilibrio que guarda el retinol plasmático con los depósitos hepáticos,tiene un relativo valor para la identificación en particular de un individuo condeficiencia, a menos que esta sea muy severa (menor de 10 ug/dl). A pesar de ello,
los niveles plasmáticos de retinol constituyen un buen índice de la situación en todauna comunidad de vitamina A cuando se considera la distribución de frecuenciasde retinol en la población.
Sobre la base de estudios transversales en comunidades deficientes (22) se hanestablecido los límites normales de retinol en 20 ug/dl para el riesgo poblacional y10 ug/dl para la deficiencia manifiesta asociada con sintomas clínicos . Si seconsideran estos niveles el 10.8% de los lactantes, 8.7% de los preescolares, 4.8%de los escolares, 1.7% de los adolescentes, 8.7% de las embarazadas y 0.7% de losadultos presentaron riesgo de deficiencia (menor a 20 ug/dl).
Se ha cuestionado recientemente este límite de 20 ug/dl. sugiriéndose utilizar en loslos grupos de mayor riesgo como las mujeres (adolescentes y embarazadas) y lospreescolares un límite de 30 ug/dl. De considerarse este nivel de riesgo lasprevalencias serían mucho más elevadas.
Independientemente del límite considerado, la distribución de retinol plasmático deUshuaia demuestra la existencia de un problema nutricional sospechado hastaahora por algunas encuestas alimentarias pero nunca demostrado y que escoherente con con la baja ingesta de vitamina A evidenciada por los datosdietéticos.
La figura 15 compara un modelo teórico de asociación entre los distintos niveles dedeficiencia de vitamina A (barras) y la ingesta promedio de una hipotética poblaciónen abcisas. Puede observarse que la situación observada en Tierra del Fuegorepresentada por la linea (frecuencia acumulada de ingesta de provitamina A)coincide en términos generales con el modelo teórico y permitiría especular en quealrededor de la mitad de la población no tiene riesgo de deficiencia tanto por lacantidad que ingiere como por los niveles plasmáticos de retinol. Establecer lamagnitud del riesgo de deficiencia en el 50% restante es más dificil. Puedeconsiderarse que el 95% de los prescolares provenientes de comunidadesmarginales con una ingesta de vitamina A moderadamente baja (23) luego de unafortificación con retinol presenta valores superiores a 30 ug/dl. Este ha sido uno delos criterios recomendados para definir en una población el grado de depleción de
P R O Y E C T O T I E R R A D E L F U E G O 5 3
GRUPO BIOLOGICO HTA HIPERCOLES TABAQUISMO SEDENTA OBESIDADTEROLEMIA RISMO
Lactantes NO SI NO NO SI
Preescolares NO SI NO NO SI
Escolares SI SI NO SI SI
Adolescentes SI SI SI (*) SI SI
Hombres SI SI SI SI SI
Mujeres SI SI SI SI SI
Embarazadas SI SI SI SI SI
Cuadro 13Factores de riesgo
cardiovascular, consideradossegún grupo biológico.
GRUPO BIOLOGICO > 175 > 200 > 240
LACTANTES 24% 8% 2%
PREESCOLARES 21% 3% 0%
ESCOLARES 27% 11% 3%
ADOLESCENTES 16% 6% 5%
HOMBRES — 57% 40%
MUJERES — 17% 6%
EMBARAZADAS — 48% 20%
Cuadro 14Prevalencia de
hipercolesterolemia segúndistintos criterios de riesgo.
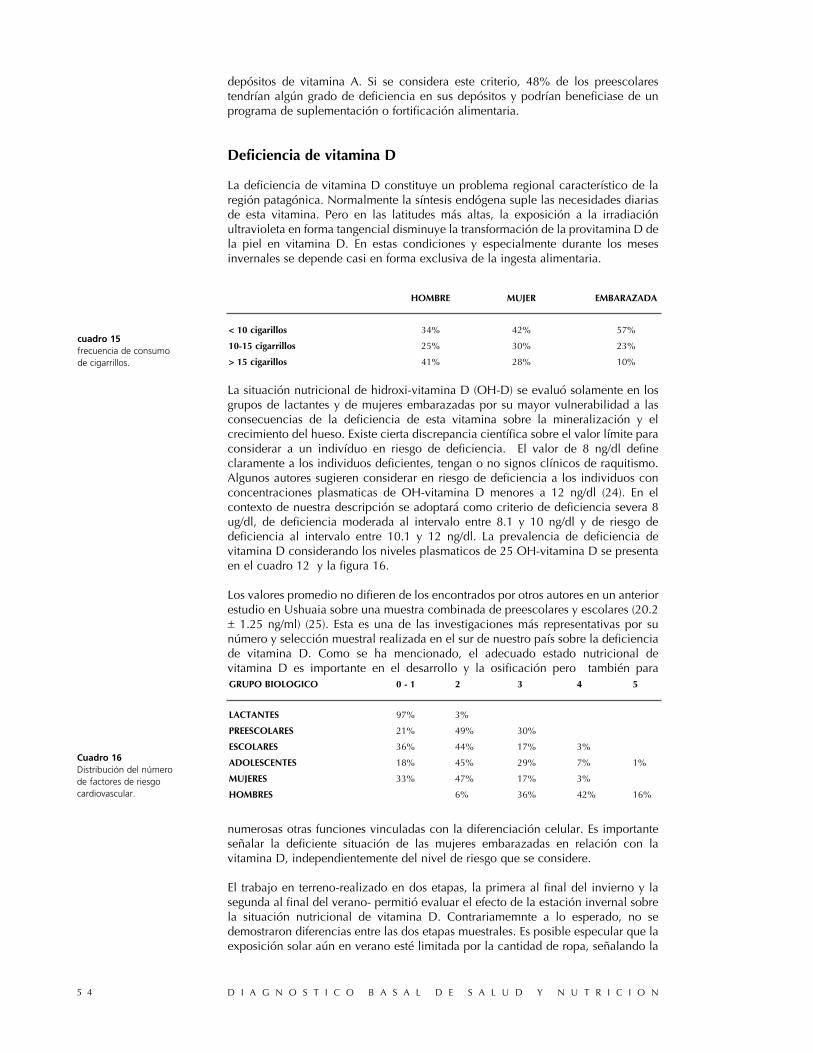
depósitos de vitamina A. Si se considera este criterio, 48% de los preescolarestendrían algún grado de deficiencia en sus depósitos y podrían beneficiase de unprograma de suplementación o fortificación alimentaria.
Deficiencia de vitamina D
La deficiencia de vitamina D constituye un problema regional característico de laregión patagónica. Normalmente la síntesis endógena suple las necesidades diariasde esta vitamina. Pero en las latitudes más altas, la exposición a la irradiaciónultravioleta en forma tangencial disminuye la transformación de la provitamina D dela piel en vitamina D. En estas condiciones y especialmente durante los mesesinvernales se depende casi en forma exclusiva de la ingesta alimentaria.
La situación nutricional de hidroxi-vitamina D (OH-D) se evaluó solamente en losgrupos de lactantes y de mujeres embarazadas por su mayor vulnerabilidad a lasconsecuencias de la deficiencia de esta vitamina sobre la mineralización y elcrecimiento del hueso. Existe cierta discrepancia científica sobre el valor límite paraconsiderar a un indivíduo en riesgo de deficiencia. El valor de 8 ng/dl defineclaramente a los individuos deficientes, tengan o no signos clínicos de raquitismo.Algunos autores sugieren considerar en riesgo de deficiencia a los individuos conconcentraciones plasmaticas de OH-vitamina D menores a 12 ng/dl (24). En elcontexto de nuestra descripción se adoptará como criterio de deficiencia severa 8ug/dl, de deficiencia moderada al intervalo entre 8.1 y 10 ng/dl y de riesgo dedeficiencia al intervalo entre 10.1 y 12 ng/dl. La prevalencia de deficiencia devitamina D considerando los niveles plasmaticos de 25 OH-vitamina D se presentaen el cuadro 12 y la figura 16.
Los valores promedio no difieren de los encontrados por otros autores en un anteriorestudio en Ushuaia sobre una muestra combinada de preescolares y escolares (20.2+ 1.25 ng/ml) (25). Esta es una de las investigaciones más representativas por sunúmero y selección muestral realizada en el sur de nuestro país sobre la deficienciade vitamina D. Como se ha mencionado, el adecuado estado nutricional devitamina D es importante en el desarrollo y la osificación pero también para
numerosas otras funciones vinculadas con la diferenciación celular. Es importanteseñalar la deficiente situación de las mujeres embarazadas en relación con lavitamina D, independientemente del nivel de riesgo que se considere.
El trabajo en terreno-realizado en dos etapas, la primera al final del invierno y lasegunda al final del verano- permitió evaluar el efecto de la estación invernal sobrela situación nutricional de vitamina D. Contrariamemnte a lo esperado, no sedemostraron diferencias entre las dos etapas muestrales. Es posible especular que laexposición solar aún en verano esté limitada por la cantidad de ropa, señalando la
D I A G N O S T I C O B A S A L D E S A L U D Y N U T R I C I O N5 4
HOMBRE MUJER EMBARAZADA
< 10 cigarillos 34% 42% 57%
10-15 cigarrillos 25% 30% 23%
> 15 cigarillos 41% 28% 10%
cuadro 15frecuencia de consumode cigarrillos.
GRUPO BIOLOGICO 0 - 1 2 3 4 5
LACTANTES 97% 3%
PREESCOLARES 21% 49% 30%
ESCOLARES 36% 44% 17% 3%
ADOLESCENTES 18% 45% 29% 7% 1%
MUJERES 33% 47% 17% 3%
HOMBRES 6% 36% 42% 16%
Cuadro 16Distribución del númerode factores de riesgocardiovascular.
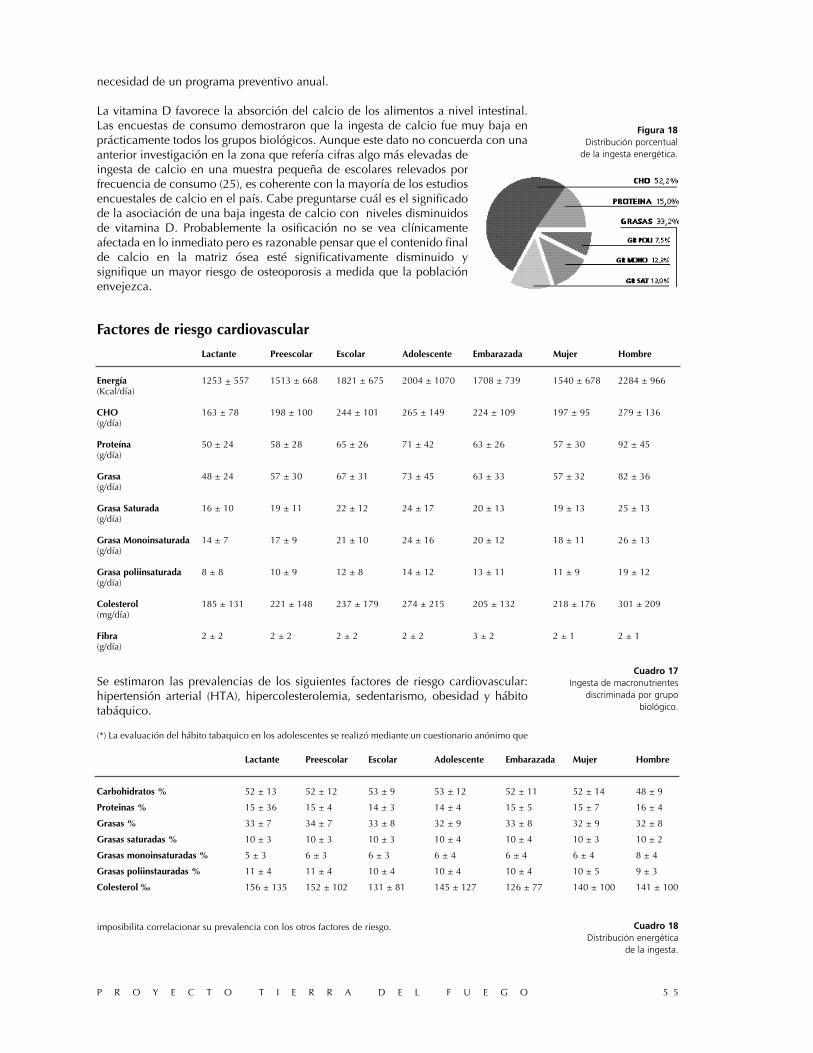
necesidad de un programa preventivo anual.
La vitamina D favorece la absorción del calcio de los alimentos a nivel intestinal.Las encuestas de consumo demostraron que la ingesta de calcio fue muy baja enprácticamente todos los grupos biológicos. Aunque este dato no concuerda con unaanterior investigación en la zona que refería cifras algo más elevadas deingesta de calcio en una muestra pequeña de escolares relevados porfrecuencia de consumo (25), es coherente con la mayoría de los estudiosencuestales de calcio en el país. Cabe preguntarse cuál es el significadode la asociación de una baja ingesta de calcio con niveles disminuidosde vitamina D. Probablemente la osificación no se vea clínicamenteafectada en lo inmediato pero es razonable pensar que el contenido finalde calcio en la matriz ósea esté significativamente disminuido ysignifique un mayor riesgo de osteoporosis a medida que la poblaciónenvejezca.
Factores de riesgo cardiovascular
Se estimaron las prevalencias de los siguientes factores de riesgo cardiovascular:hipertensión arterial (HTA), hipercolesterolemia, sedentarismo, obesidad y hábitotabáquico.
(*) La evaluación del hábito tabaquico en los adolescentes se realizó mediante un cuestionario anónimo que
imposibilita correlacionar su prevalencia con los otros factores de riesgo.
P R O Y E C T O T I E R R A D E L F U E G O 5 5
Lactante Preescolar Escolar Adolescente Embarazada Mujer Hombre
Energía 1253 + 557 1513 ± 668 1821 ± 675 2004 ± 1070 1708 ± 739 1540 ± 678 2284 ± 966(Kcal/día)
CHO 163 ± 78 198 ± 100 244 ± 101 265 ± 149 224 ± 109 197 ± 95 279 ± 136(g/día)
Proteína 50 ± 24 58 ± 28 65 ± 26 71 ± 42 63 ± 26 57 ± 30 92 ± 45(g/día)
Grasa 48 ± 24 57 ± 30 67 ± 31 73 ± 45 63 ± 33 57 ± 32 82 ± 36(g/día)
Grasa Saturada 16 ± 10 19 ± 11 22 ± 12 24 ± 17 20 ± 13 19 ± 13 25 ± 13(g/día)
Grasa Monoinsaturada 14 ± 7 17 ± 9 21 ± 10 24 ± 16 20 ± 12 18 ± 11 26 ± 13(g/día)
Grasa poliinsaturada 8 ± 8 10 ± 9 12 ± 8 14 ± 12 13 ± 11 11 ± 9 19 ± 12(g/día)
Colesterol 185 ± 131 221 ± 148 237 ± 179 274 ± 215 205 ± 132 218 ± 176 301 ± 209(mg/día)
Fibra 2 ± 2 2 ± 2 2 ± 2 2 ± 2 3 ± 2 2 ± 1 2 ± 1(g/día)
Cuadro 17Ingesta de macronutrientes
discriminada por grupobiológico.
Lactante Preescolar Escolar Adolescente Embarazada Mujer Hombre
Carbohidratos % 52 ± 13 52 ± 12 53 ± 9 53 ± 12 52 ± 11 52 ± 14 48 ± 9
Proteinas % 15 ± 36 15 ± 4 14 ± 3 14 ± 4 15 ± 5 15 ± 7 16 ± 4
Grasas % 33 ± 7 34 ± 7 33 ± 8 32 ± 9 33 ± 8 32 ± 9 32 ± 8
Grasas saturadas % 10 ± 3 10 ± 3 10 ± 3 10 ± 4 10 ± 4 10 ± 3 10 ± 2
Grasas monoinsaturadas % 5 ± 3 6 ± 3 6 ± 3 6 ± 4 6 ± 4 6 ± 4 8 ± 4
Grasas poliinstauradas % 11 ± 4 11 ± 4 10 ± 4 10 ± 4 10 ± 4 10 ± 5 9 ± 3
Colesterol ‰ 156 ± 135 152 ± 102 131 ± 81 145 ± 127 126 ± 77 140 ± 100 141 ± 100
Cuadro 18Distribución energética
de la ingesta.
Figura 18Distribución porcentual
de la ingesta energética.
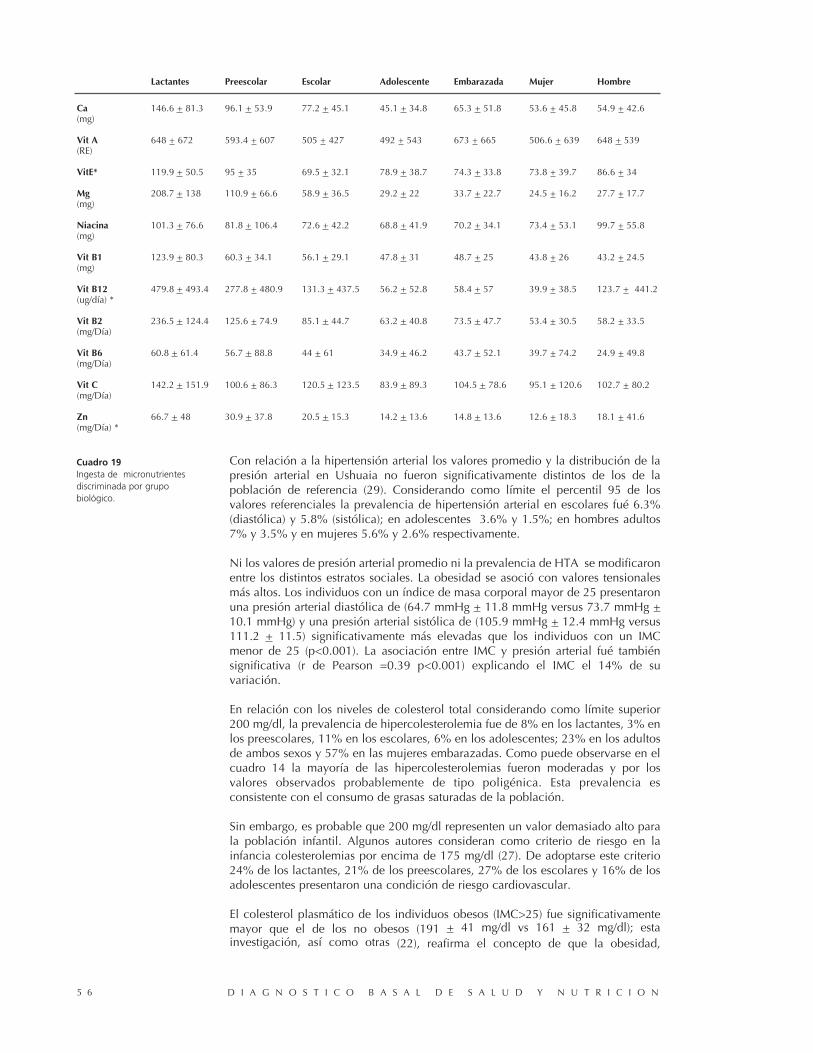
D I A G N O S T I C O B A S A L D E S A L U D Y N U T R I C I O N5 6
Con relación a la hipertensión arterial los valores promedio y la distribución de lapresión arterial en Ushuaia no fueron significativamente distintos de los de lapoblación de referencia (29). Considerando como límite el percentil 95 de losvalores referenciales la prevalencia de hipertensión arterial en escolares fué 6.3%(diastólica) y 5.8% (sistólica); en adolescentes 3.6% y 1.5%; en hombres adultos7% y 3.5% y en mujeres 5.6% y 2.6% respectivamente.
Ni los valores de presión arterial promedio ni la prevalencia de HTA se modificaronentre los distintos estratos sociales. La obesidad se asoció con valores tensionalesmás altos. Los individuos con un índice de masa corporal mayor de 25 presentaronuna presión arterial diastólica de (64.7 mmHg + 11.8 mmHg versus 73.7 mmHg +10.1 mmHg) y una presión arterial sistólica de (105.9 mmHg + 12.4 mmHg versus111.2 + 11.5) significativamente más elevadas que los individuos con un IMCmenor de 25 (p<0.001). La asociación entre IMC y presión arterial fué tambiénsignificativa (r de Pearson =0.39 p<0.001) explicando el IMC el 14% de suvariación.
En relación con los niveles de colesterol total considerando como límite superior200 mg/dl, la prevalencia de hipercolesterolemia fue de 8% en los lactantes, 3% enlos preescolares, 11% en los escolares, 6% en los adolescentes; 23% en los adultosde ambos sexos y 57% en las mujeres embarazadas. Como puede observarse en elcuadro 14 la mayoría de las hipercolesterolemias fueron moderadas y por losvalores observados probablemente de tipo poligénica. Esta prevalencia esconsistente con el consumo de grasas saturadas de la población.
Sin embargo, es probable que 200 mg/dl representen un valor demasiado alto parala población infantil. Algunos autores consideran como criterio de riesgo en lainfancia colesterolemias por encima de 175 mg/dl (27). De adoptarse este criterio24% de los lactantes, 21% de los preescolares, 27% de los escolares y 16% de losadolescentes presentaron una condición de riesgo cardiovascular.
El colesterol plasmático de los individuos obesos (IMC>25) fue significativamentemayor que el de los no obesos (191 + 41 mg/dl vs 161 + 32 mg/dl); estainvestigación, así como otras (22), reafirma el concepto de que la obesidad,
Lactantes Preescolar Escolar Adolescente Embarazada Mujer Hombre
Ca 146.6 + 81.3 96.1 + 53.9 77.2 + 45.1 45.1 + 34.8 65.3 + 51.8 53.6 + 45.8 54.9 + 42.6(mg)
Vit A 648 + 672 593.4 + 607 505 + 427 492 + 543 673 + 665 506.6 + 639 648 + 539(RE)
VitE* 119.9 + 50.5 95 + 35 69.5 + 32.1 78.9 + 38.7 74.3 + 33.8 73.8 + 39.7 86.6 + 34
Mg 208.7 + 138 110.9 + 66.6 58.9 + 36.5 29.2 + 22 33.7 + 22.7 24.5 + 16.2 27.7 + 17.7(mg)
Niacina 101.3 + 76.6 81.8 + 106.4 72.6 + 42.2 68.8 + 41.9 70.2 + 34.1 73.4 + 53.1 99.7 + 55.8(mg)
Vit B1 123.9 + 80.3 60.3 + 34.1 56.1 + 29.1 47.8 + 31 48.7 + 25 43.8 + 26 43.2 + 24.5(mg)
Vit B12 479.8 + 493.4 277.8 + 480.9 131.3 + 437.5 56.2 + 52.8 58.4 + 57 39.9 + 38.5 123.7 + 441.2(ug/día) *
Vit B2 236.5 + 124.4 125.6 + 74.9 85.1 + 44.7 63.2 + 40.8 73.5 + 47.7 53.4 + 30.5 58.2 + 33.5(mg/Día)
Vit B6 60.8 + 61.4 56.7 + 88.8 44 + 61 34.9 + 46.2 43.7 + 52.1 39.7 + 74.2 24.9 + 49.8(mg/Día)
Vit C 142.2 + 151.9 100.6 + 86.3 120.5 + 123.5 83.9 + 89.3 104.5 + 78.6 95.1 + 120.6 102.7 + 80.2(mg/Día)
Zn 66.7 + 48 30.9 + 37.8 20.5 + 15.3 14.2 + 13.6 14.8 + 13.6 12.6 + 18.3 18.1 + 41.6(mg/Día) *
Cuadro 19Ingesta de micronutrientesdiscriminada por grupobiológico.
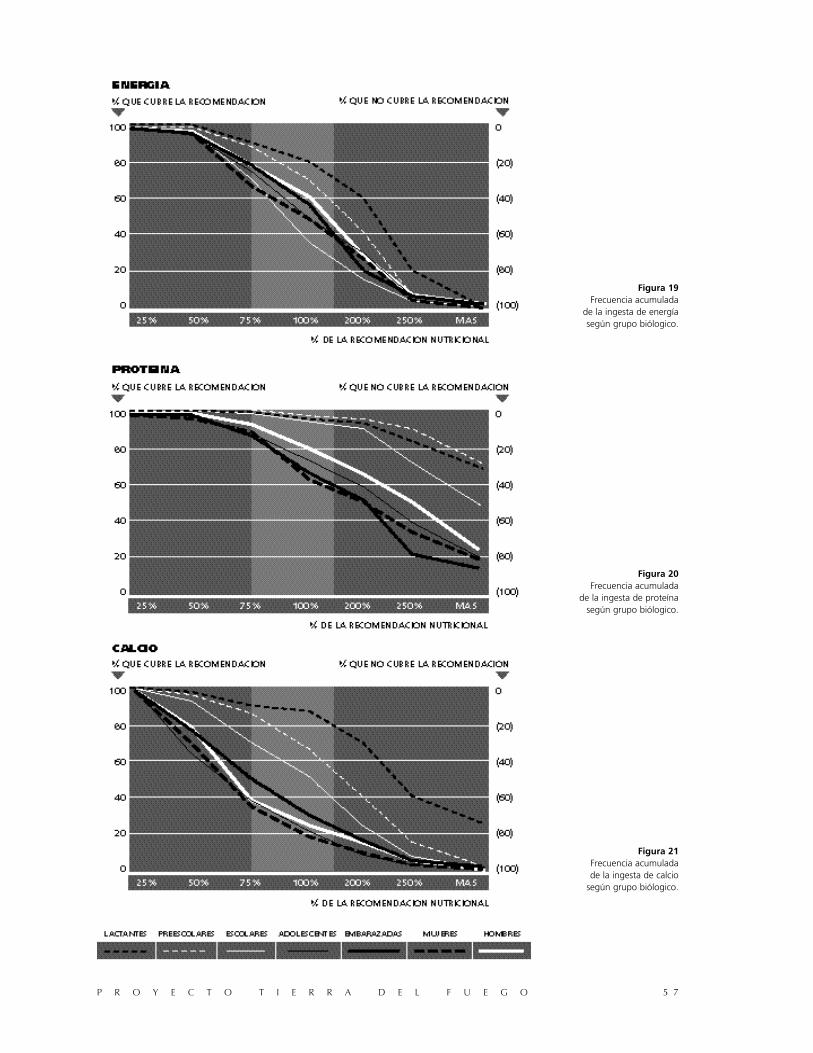
P R O Y E C T O T I E R R A D E L F U E G O 5 7
Figura 19Frecuencia acumulada
de la ingesta de energíasegún grupo biólogico.
Figura 20Frecuencia acumulada
de la ingesta de proteínasegún grupo biólogico.
Figura 21Frecuencia acumuladade la ingesta de calcio
según grupo biólogico.
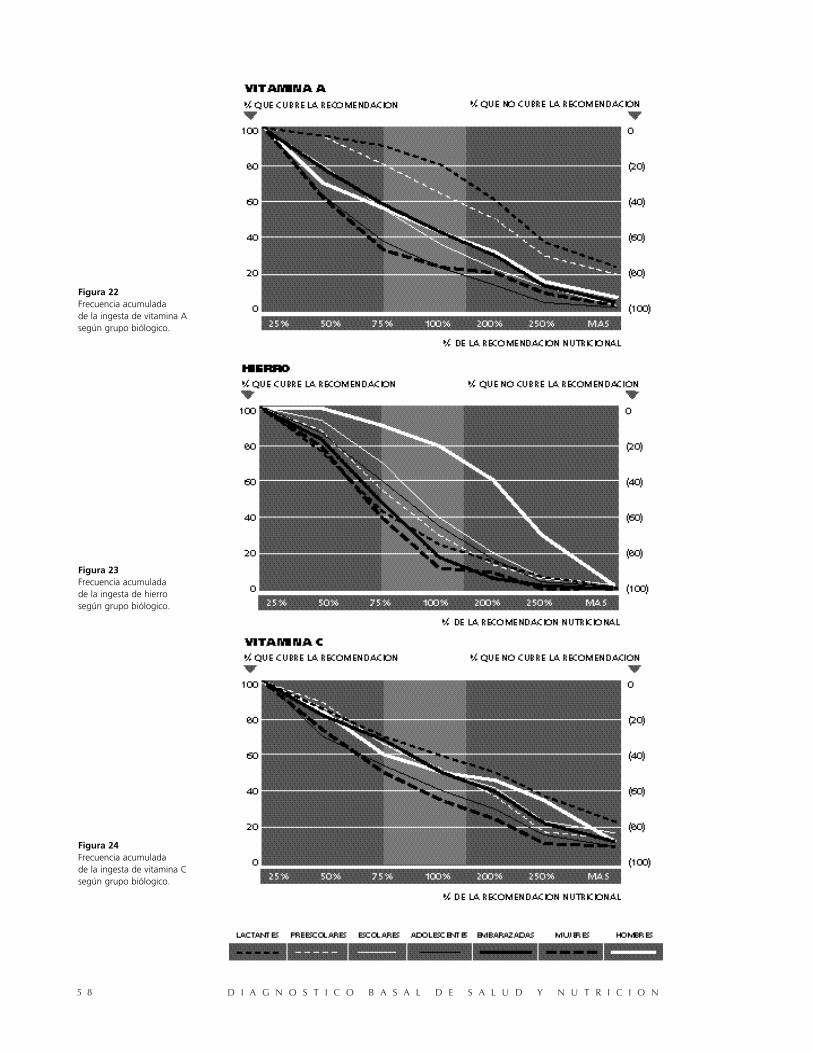
D I A G N O S T I C O B A S A L D E S A L U D Y N U T R I C I O N5 8
Figura 22Frecuencia acumuladade la ingesta de vitamina Asegún grupo biólogico.
Figura 23Frecuencia acumuladade la ingesta de hierrosegún grupo biólogico.
Figura 24Frecuencia acumuladade la ingesta de vitamina Csegún grupo biólogico.
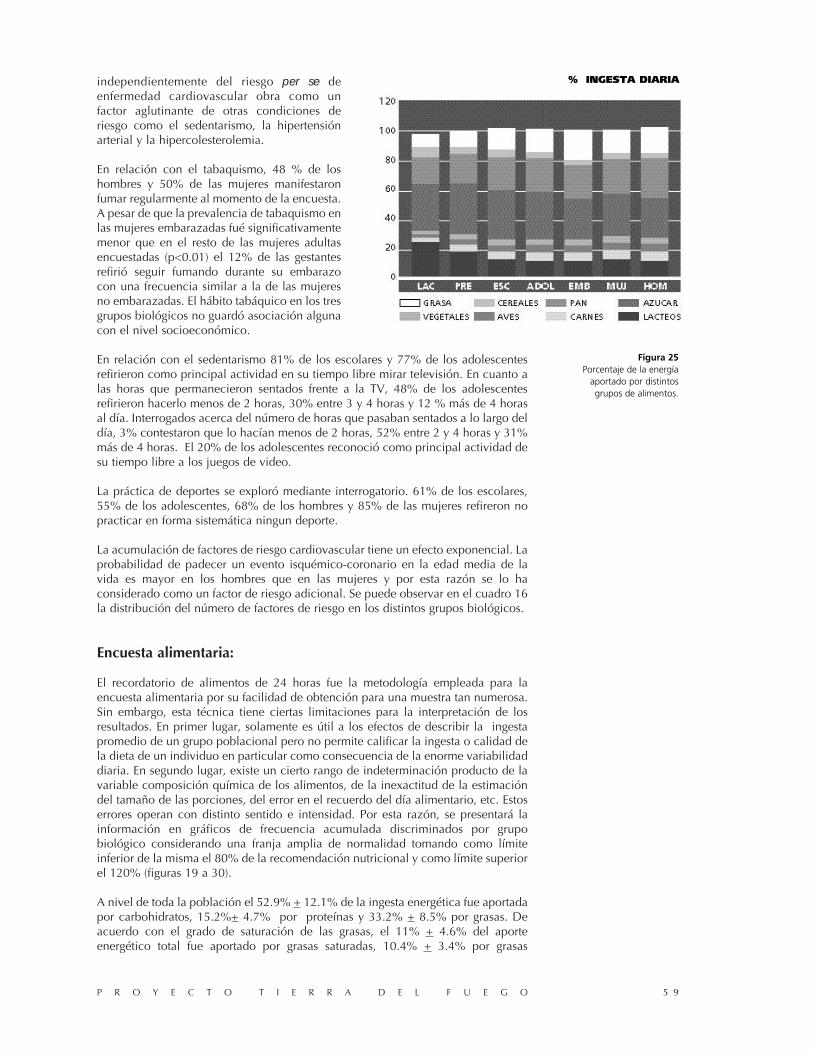
independientemente del riesgo per se deenfermedad cardiovascular obra como unfactor aglutinante de otras condiciones deriesgo como el sedentarismo, la hipertensiónarterial y la hipercolesterolemia.
En relación con el tabaquismo, 48 % de loshombres y 50% de las mujeres manifestaronfumar regularmente al momento de la encuesta.A pesar de que la prevalencia de tabaquismo enlas mujeres embarazadas fué significativamentemenor que en el resto de las mujeres adultasencuestadas (p<0.01) el 12% de las gestantesrefirió seguir fumando durante su embarazocon una frecuencia similar a la de las mujeresno embarazadas. El hábito tabáquico en los tresgrupos biológicos no guardó asociación algunacon el nivel socioeconómico.
En relación con el sedentarismo 81% de los escolares y 77% de los adolescentesrefirieron como principal actividad en su tiempo libre mirar televisión. En cuanto alas horas que permanecieron sentados frente a la TV, 48% de los adolescentesrefirieron hacerlo menos de 2 horas, 30% entre 3 y 4 horas y 12 % más de 4 horasal día. Interrogados acerca del número de horas que pasaban sentados a lo largo deldía, 3% contestaron que lo hacían menos de 2 horas, 52% entre 2 y 4 horas y 31%más de 4 horas. El 20% de los adolescentes reconoció como principal actividad desu tiempo libre a los juegos de video.
La práctica de deportes se exploró mediante interrogatorio. 61% de los escolares,55% de los adolescentes, 68% de los hombres y 85% de las mujeres refireron nopracticar en forma sistemática ningun deporte.
La acumulación de factores de riesgo cardiovascular tiene un efecto exponencial. Laprobabilidad de padecer un evento isquémico-coronario en la edad media de lavida es mayor en los hombres que en las mujeres y por esta razón se lo haconsiderado como un factor de riesgo adicional. Se puede observar en el cuadro 16la distribución del número de factores de riesgo en los distintos grupos biológicos.
Encuesta alimentaria:
El recordatorio de alimentos de 24 horas fue la metodología empleada para laencuesta alimentaria por su facilidad de obtención para una muestra tan numerosa.Sin embargo, esta técnica tiene ciertas limitaciones para la interpretación de losresultados. En primer lugar, solamente es útil a los efectos de describir la ingestapromedio de un grupo poblacional pero no permite calificar la ingesta o calidad dela dieta de un individuo en particular como consecuencia de la enorme variabilidaddiaria. En segundo lugar, existe un cierto rango de indeterminación producto de lavariable composición química de los alimentos, de la inexactitud de la estimacióndel tamaño de las porciones, del error en el recuerdo del día alimentario, etc. Estoserrores operan con distinto sentido e intensidad. Por esta razón, se presentará lainformación en gráficos de frecuencia acumulada discriminados por grupobiológico considerando una franja amplia de normalidad tomando como límiteinferior de la misma el 80% de la recomendación nutricional y como límite superiorel 120% (figuras 19 a 30).
A nivel de toda la población el 52.9% + 12.1% de la ingesta energética fue aportadapor carbohidratos, 15.2%+ 4.7% por proteínas y 33.2% + 8.5% por grasas. Deacuerdo con el grado de saturación de las grasas, el 11% + 4.6% del aporteenergético total fue aportado por grasas saturadas, 10.4% + 3.4% por grasas
P R O Y E C T O T I E R R A D E L F U E G O 5 9
Figura 25Porcentaje de la energía
aportado por distintosgrupos de alimentos.
% INGESTA DIARIA
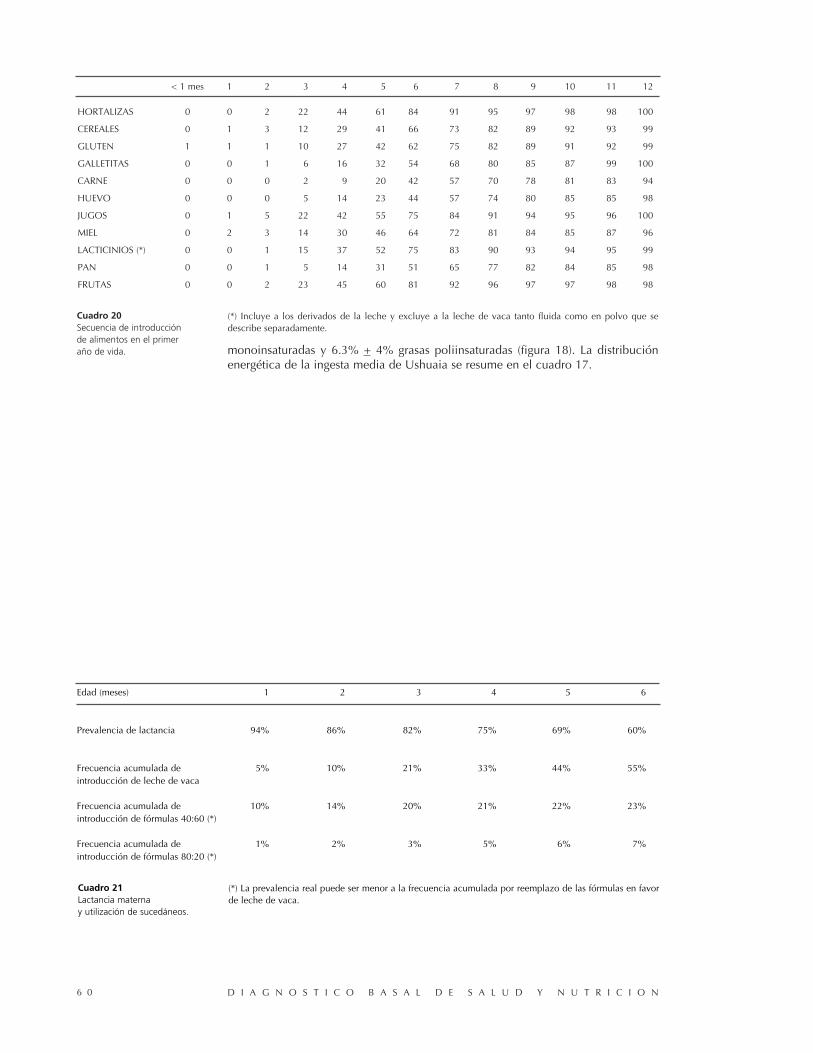
monoinsaturadas y 6.3% + 4% grasas poliinsaturadas (figura 18). La distribuciónenergética de la ingesta media de Ushuaia se resume en el cuadro 17.
D I A G N O S T I C O B A S A L D E S A L U D Y N U T R I C I O N6 0
< 1 mes 1 2 3 4 5 6 7 8 9 10 11 12
HORTALIZAS 0 0 2 22 44 61 84 91 95 97 98 98 100
CEREALES 0 1 3 12 29 41 66 73 82 89 92 93 99
GLUTEN 1 1 1 10 27 42 62 75 82 89 91 92 99
GALLETITAS 0 0 1 6 16 32 54 68 80 85 87 99 100
CARNE 0 0 0 2 9 20 42 57 70 78 81 83 94
HUEVO 0 0 0 5 14 23 44 57 74 80 85 85 98
JUGOS 0 1 5 22 42 55 75 84 91 94 95 96 100
MIEL 0 2 3 14 30 46 64 72 81 84 85 87 96
LACTICINIOS (*) 0 0 1 15 37 52 75 83 90 93 94 95 99
PAN 0 0 1 5 14 31 51 65 77 82 84 85 98
FRUTAS 0 0 2 23 45 60 81 92 96 97 97 98 98
Cuadro 20Secuencia de introducciónde alimentos en el primeraño de vida.
(*) Incluye a los derivados de la leche y excluye a la leche de vaca tanto fluida como en polvo que sedescribe separadamente.
Edad (meses) 1 2 3 4 5 6
Prevalencia de lactancia 94% 86% 82% 75% 69% 60%
Frecuencia acumulada de 5% 10% 21% 33% 44% 55%introducción de leche de vaca
Frecuencia acumulada de 10% 14% 20% 21% 22% 23%introducción de fórmulas 40:60 (*)
Frecuencia acumulada de 1% 2% 3% 5% 6% 7%introducción de fórmulas 80:20 (*)
Cuadro 21Lactancia maternay utilización de sucedáneos.
(*) La prevalencia real puede ser menor a la frecuencia acumulada por reemplazo de las fórmulas en favorde leche de vaca.
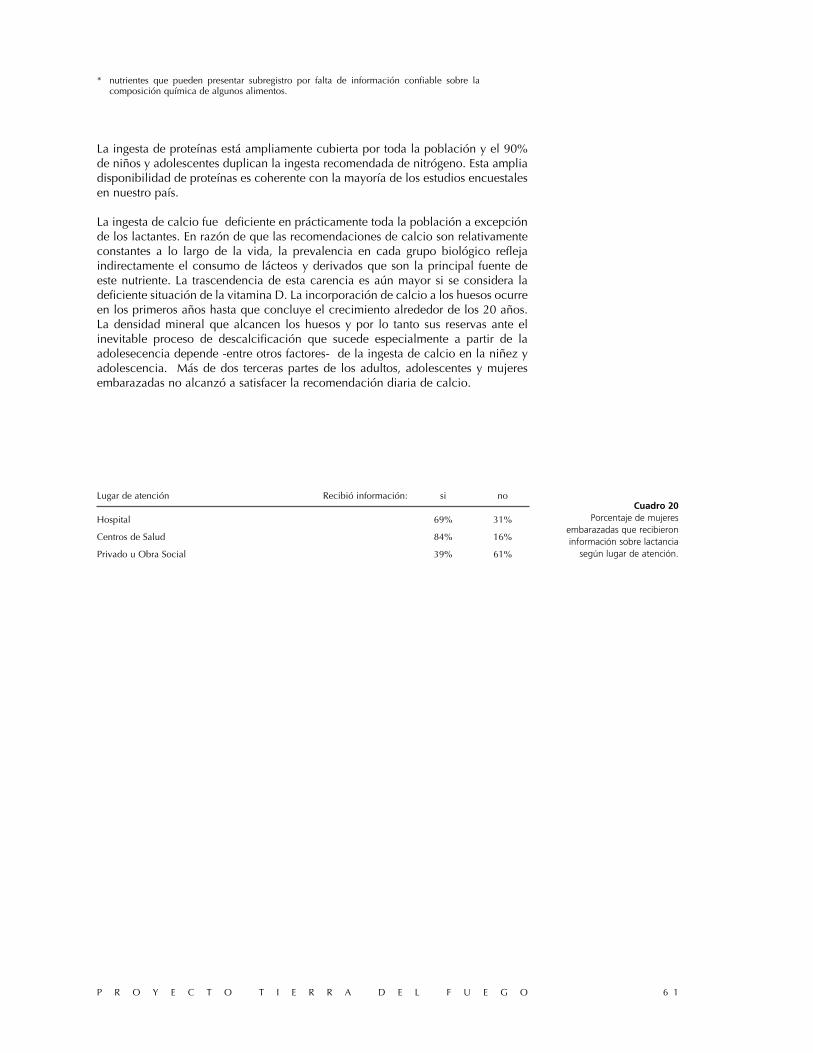
* nutrientes que pueden presentar subregistro por falta de información confiable sobre lacomposición química de algunos alimentos.
La ingesta de proteínas está ampliamente cubierta por toda la población y el 90%de niños y adolescentes duplican la ingesta recomendada de nitrógeno. Esta ampliadisponibilidad de proteínas es coherente con la mayoría de los estudios encuestalesen nuestro país.
La ingesta de calcio fue deficiente en prácticamente toda la población a excepciónde los lactantes. En razón de que las recomendaciones de calcio son relativamenteconstantes a lo largo de la vida, la prevalencia en cada grupo biológico reflejaindirectamente el consumo de lácteos y derivados que son la principal fuente deeste nutriente. La trascendencia de esta carencia es aún mayor si se considera ladeficiente situación de la vitamina D. La incorporación de calcio a los huesos ocurreen los primeros años hasta que concluye el crecimiento alrededor de los 20 años.La densidad mineral que alcancen los huesos y por lo tanto sus reservas ante elinevitable proceso de descalcificación que sucede especialmente a partir de laadolesecencia depende -entre otros factores- de la ingesta de calcio en la niñez yadolescencia. Más de dos terceras partes de los adultos, adolescentes y mujeresembarazadas no alcanzó a satisfacer la recomendación diaria de calcio.
P R O Y E C T O T I E R R A D E L F U E G O 6 1
Lugar de atención Recibió información: si no
Hospital 69% 31%
Centros de Salud 84% 16%
Privado u Obra Social 39% 61%
Cuadro 20Porcentaje de mujeres
embarazadas que recibieroninformación sobre lactancia
según lugar de atención.
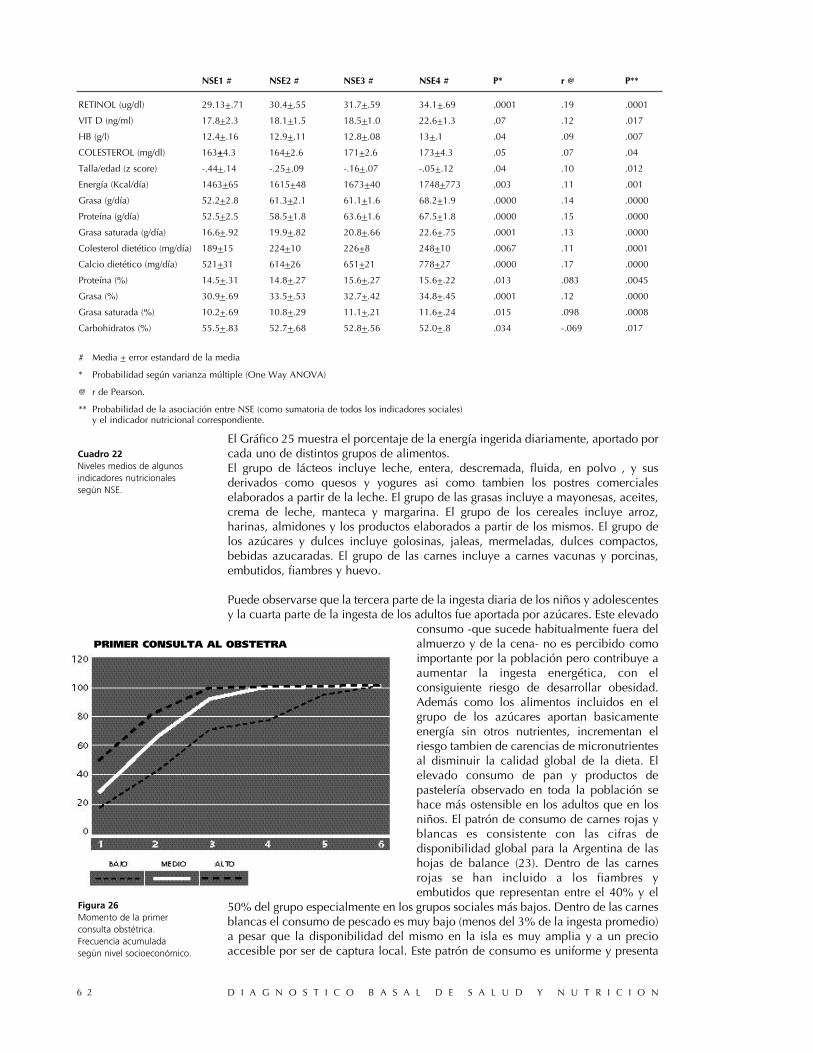
El Gráfico 25 muestra el porcentaje de la energía ingerida diariamente, aportado porcada uno de distintos grupos de alimentos. El grupo de lácteos incluye leche, entera, descremada, fluida, en polvo , y susderivados como quesos y yogures asi como tambien los postres comercialeselaborados a partir de la leche. El grupo de las grasas incluye a mayonesas, aceites,crema de leche, manteca y margarina. El grupo de los cereales incluye arroz,harinas, almidones y los productos elaborados a partir de los mismos. El grupo delos azúcares y dulces incluye golosinas, jaleas, mermeladas, dulces compactos,bebidas azucaradas. El grupo de las carnes incluye a carnes vacunas y porcinas,embutidos, fiambres y huevo.
Puede observarse que la tercera parte de la ingesta diaria de los niños y adolescentesy la cuarta parte de la ingesta de los adultos fue aportada por azúcares. Este elevado
consumo -que sucede habitualmente fuera delalmuerzo y de la cena- no es percibido comoimportante por la población pero contribuye aaumentar la ingesta energética, con elconsiguiente riesgo de desarrollar obesidad.Además como los alimentos incluidos en elgrupo de los azúcares aportan basicamenteenergía sin otros nutrientes, incrementan elriesgo tambien de carencias de micronutrientesal disminuir la calidad global de la dieta. Elelevado consumo de pan y productos depastelería observado en toda la población sehace más ostensible en los adultos que en losniños. El patrón de consumo de carnes rojas yblancas es consistente con las cifras dedisponibilidad global para la Argentina de lashojas de balance (23). Dentro de las carnesrojas se han incluido a los fiambres yembutidos que representan entre el 40% y el
50% del grupo especialmente en los grupos sociales más bajos. Dentro de las carnesblancas el consumo de pescado es muy bajo (menos del 3% de la ingesta promedio)a pesar que la disponibilidad del mismo en la isla es muy amplia y a un precioaccesible por ser de captura local. Este patrón de consumo es uniforme y presenta
D I A G N O S T I C O B A S A L D E S A L U D Y N U T R I C I O N6 2
NSE1 # NSE2 # NSE3 # NSE4 # P* r @ P**
RETINOL (ug/dl) 29.13+.71 30.4+.55 31.7+.59 34.1+.69 .0001 .19 .0001
VIT D (ng/ml) 17.8+2.3 18.1+1.5 18.5+1.0 22.6+1.3 .07 .12 .017
HB (g/l) 12.4+.16 12.9+.11 12.8+.08 13+.1 .04 .09 .007
COLESTEROL (mg/dl) 163+4.3 164+2.6 171+2.6 173+4.3 .05 .07 .04
Talla/edad (z score) -.44+.14 -.25+.09 -.16+.07 -.05+.12 .04 .10 .012
Energía (Kcal/día) 1463+65 1615+48 1673+40 1748+773 .003 .11 .001
Grasa (g/día) 52.2+2.8 61.3+2.1 61.1+1.6 68.2+1.9 .0000 .14 .0000
Proteína (g/día) 52.5+2.5 58.5+1.8 63.6+1.6 67.5+1.8 .0000 .15 .0000
Grasa saturada (g/día) 16.6+.92 19.9+.82 20.8+.66 22.6+.75 .0001 .13 .0000
Colesterol dietético (mg/día) 189+15 224+10 226+8 248+10 .0067 .11 .0001
Calcio dietético (mg/día) 521+31 614+26 651+21 778+27 .0000 .17 .0000
Proteína (%) 14.5+.31 14.8+.27 15.6+.27 15.6+.22 .013 .083 .0045
Grasa (%) 30.9+.69 33.5+.53 32.7+.42 34.8+.45 .0001 .12 .0000
Grasa saturada (%) 10.2+.69 10.8+.29 11.1+.21 11.6+.24 .015 .098 .0008
Carbohidratos (%) 55.5+.83 52.7+.68 52.8+.56 52.0+.8 .034 -.069 .017
# Media + error estandard de la media
* Probabilidad según varianza múltiple (One Way ANOVA)
@ r de Pearson.
** Probabilidad de la asociación entre NSE (como sumatoria de todos los indicadores sociales)y el indicador nutricional correspondiente.
Cuadro 22Niveles medios de algunosindicadores nutricionalessegún NSE.
Figura 26Momento de la primerconsulta obstétrica.Frecuencia acumuladasegún nivel socioeconómico.
PRIMER CONSULTA AL OBSTETRA

P R O Y E C T O T I E R R A D E L F U E G O 6 3
1) INDEC: Censo Nacional de Población yVivienda, Resultados definitivos de la Provincia deTierra del Fuego. INDEC; 1991.
2) WHO-UNICEF-IDRC: Combating Hiddenmalnutrition, Quebec Canada; 1993.
3) Calvo EB, Gnazzo N. Prevalence of irondeficiency in children aged 9-24 mo from a largeurban area of Argentina. Am J Clin Nutr52:534; 1990.
4) Carmuega E, Calvo E, Britos S, Uicich R,O’Donnell AM: Racionalización del Programa deComedores escolares del partido de Gral.Rodriguez. X Congreso Argentino de Nutrición.Premio J. Landa; 1987.
5) Carmuega E, Bianculli C, Durán P. y col.:Estudio de ciertos factores de riesgo de la salud yde la situación nutricional de adolescentesurbanos. Medicina Infantil 2:71; 1995.
6) Lozoff B, Brittenham G, Viteri F, Wolf A,Urrutia J.: The effects of short term oral irontherapy on developmental deficits in iron-deficientanemic infants. J Pediatr 100:351; 1982.
7) INDEC: Censo Nacional de Población yVivienda INDEC; 1990.
8) Dallman PR, Siimes MA. Percentile curves forhemoglobin and red cell volume in infancy andchildhood. J Pediatr 94:26; 1979.
9) Hastka J, Lasserre J, Schwarzbeck A, HehlmannR.: Central role of zinc protoporphyrin in stagingiron deficiency. Clin Chem 40:768; 1994.
10) OMS/OPS: Hipovitaminosis A en las Américas.Informe de la Reunión de un grupo técnico de laOPS. Organización Panamericana de la Salud,Washington; 1970.
11) Klasing S, Pilch S Suggested measures ofnutritional status and health conditions for thethird national Health and Nutrition ExaminationSurvey. Life Sciences Research Office, Federationof American Societies for experimental Biology.Bethesda, Maryland; 1985.
12) Jacobs A, Miller F, Worwood M, Beamish M,Wardrop C.: Ferritin in the serum of normalsubjects and patients with iron deficiency and ironoverload. Br Med J 4:206; 1972.
13) INACG: Measurements of iron status. A reportof the international nutritional anemia consultativegroup. Tue Nutrition Fundation. New York; 1985.
14) CESNI, Base de datos sobre composiciónquímica de alimentos argentinos. Boletín CESNIaños 1986-1994.
15) Ariño M, Rosas M, Torrado S. Metodologíapara el análisis de la estructura socioupacionalargentina (1960-80) Consejo Federal deInversiones. Documentos de la SecretaríaGeneral; 1987.
16) Programa Nacional de Estadísticas de Salud.Estadísticas Vitales. Información Básica 1993.Serie 5 Nº37. Ministerio de Salud y Acción Social;1993.
17) Abeyá, E; Galindo, A; Gnazzo, N; O’Donnell,A. Encuesta Alimentaria de niños de 6 a 24 mesesen Buenos Aires y área suburbana.I- Características Generales. Libro de Resúmenes.VI Congreso Latinoamericano de Nutrición; 1982.
18) Rolland-Cachera, MF; Cole, T.; Sempre, M;Tichet, J.; Rossignol, C.; Charraud, A. Body MassIndex variations: centiles from birth to 87 years.Eur J Clin Nut 45: 13; 1991.
19) Must, A; Dallal, G.; Dietz, W. Reference datafor obesity: 85th and 95th percentiles of bodymass index (wt/ht2) - a correction. Am J Clin Nutr54:773; 1991.
20) Food and Nutrition Board. National Academyof Sciences/National Research Council:Recomended Dietary Allowances. 10th Ed.Washington DC. National Academy Press;1989.
21) Comité Multisectorial: ConferenciaInternacional sobre nutrición. república Argentina.México; 1992.
22) INACG. A brief guide to current methods ofassesing vitamin A status. A report of theInternational Vitamin A Consultative Group(IVACG) Nutrition Foundations Inc. WashingtonDC; 1993.
23) Flores H, Azevedo M, Campos F et al: Curvade distribución de vitamina A sérica para niños de2 a 6 años con estado adecuado de vitamina A:una población de referencia. Arch Lat Nutr42:2; 1992.
24) Pettifor JM, Isdale JM, Sahakian J, Hansen JDL.Diagnosis of subclinical rickets. Arch Dis Child55:155; 1980.
25) Olivieri M, Ladiezesky M, Somoza J, et al.Niveles séricos invernales de 25-OH vitamina Den Ushuaia y Buenos Aires. Medicina50:310; 1990.
26) Report of the second Task Force on BloodPresure control in children Pediatrics 79:1; 1987.
27) National Cholesterol Education Program:Report of the expert panel on blood cholesterollevels in children and adolescents. Pediatrics(suppl) 89:534; 1992.
28) Britos S. Hojas de Balance de alimentos en laRepública Argentina. Publicación Científica CESNINº 6, 1989.
29) Rosso P, Mardones P.: Gráfica de incrementode peso para embarazadas. Ministerio de Saludde Chile; 1986.
Referencias

P R O Y E C T O T I E R R A D E L F U E G O 6 5
TIERRA DEL FUEGO: DE AYER A HOY
Natalie Goodall
Rae Natalie Prosser de Goodall, casada con un descendiente directo del primer poblador blancode la isla, es parte de la historia de Tierra del Fuego. Investigadora, bióloga, historiadora,exploradora de mares y tierras fueguinas, recopiladora de flora y fauna, ha publicado entremuchos trabajos científicos, un exquisito libro sobre la gente, la geografía, la flora y fauna de laisla que es de lectura obligatoria para quienes visitan este tan recóndito como hermoso lugarde la Tierra.
El Proyecto Tierra del Fuego agradece el testimonio de Natalie Goodall, que refleja los cambiosexperimentados en la isla en menos de un siglo hasta convertirse en la que es hoy unacomunidad moderna y pujante, cuya población comparte el estilo de vida de las grandesciudades del país. Pero con la ventaja de hacerlo en un entorno de notable belleza.
Este libro ha presentado un estudiode la nutrición de los residentes deUshuaia, Tierra del Fuego, y formaparte de un plan de seis años paraenseñarnos una mejor nutrición.Me enorgullece que Tierra del Fuegohaya sido elegida para este importanteproyecto, que podría inspirar, desdeestos confines, experiencias similaresen el resto del país. Encuentro losresultados del estudio realmentefascinantes.
Es probable que en Tierra del Fuego,la nutrición siempre haya sido unproblema de adaptación al entorno.Esta Isla ofrece sólo mínimoscarbohidratos “naturales” para losrequerimientos metabólicos que marcael clima. Una persona no puede vivirsólo de la vegetación de la isla; en losprimeros tiempos no hubo otra opción:quien se alimentara de los productosde la tierra debía ser carnívoro.
Los primeros habitantes llegaron a piehace unos 11.800 años, siguiendo alguanaco a través de un puente de tierraque más tarde sería el Estrecho deMagallanes. Estos indígenaspredominaron en las estepas del nortey las montañas, haciendo incursionesocasionales hacia el sur.Se alimentaban principalmente decarne -guanacos, tuco-tucos, aves,lobos marinos, ballenas varadas-consumían pocos productos vegetales(carbohidratos), si bien comían algunoshongos, apio silvestre y semillas. Pocoes lo que sabemos de su nutrición, perolos inviernos y las primaveras, cuandola carne era magra y muchas aveshabían migrado, deben haber sidodifíciles. En esos períodos los habitantes
migraban hacia las costas. La cantidadde habitantes estaba limitada por el“techo demográfico” de la parte nortede la isla, ya que allí existían escasosaportes de nueva vida animal desdefuera de la misma. Cuando habíasuperpoblación, el alimento se tornabaescaso y sobrevenían los feudos y lasguerras.Los habitantes del Canal Beaglellegaron por la costa oeste del sur deSud América en canoas e ingresaron ala región sur fueguina una vez que losglaciares se retiraron, hace no menosde 6.500 años. Ya estaban adaptados ala dieta del litoral marino, que tambiénconsistía principalmente en carne -lobos marinos, nutrias, delfines, aves,pescado, mariscos. El lobo de dospelos o lobo fino era su alimentoprimordial y sus cuerpos se habíanadaptado a esta dieta rica en grasasmarinas. Cuando el hombre blancollegó por primera vez al continente, loslobos marinos eran abundantes, y loscanales fueguinos tenían una densidadde población 20-40 veces la de laPampa y la Patagonia. Esto se debió aque en los canales existía un gran flujode alimento desde afuera delarchipiélago. Si los canoeros llegabana consumir la mayoría de los lobos,más de éstos podían venir desde otrasáreas; los peces se alimentaban en elmar durante el invierno e ingresaban alos canales en verano, las ballenasllegaban en el otoño. No habíanecesidad de ser belicoso cuandohabía suficiente alimento para todos.Los restos óseos humanos de estaépoca no muestran deficiencias deVitamina D (uno de los problemas enTierra del Fuego hoy); la ausencia devestimenta (una mayor exposición a la
radiación solar) y el alto consumode grasas marinas solucionabaneste problema.
Con el advenimiento del europeo,el hombre blanco, todo cambió. Los balleneros y loberos comenzarona cazar en las costas del sur de SudAmérica en la década de 1790,incluso antes de que se descubrierael Canal Beagle.
En un corto lapso, el lobo de dos peloso lobo fino había sido prácticamenteexterminado, no sólo en las islas ycanales sino también en las zonas másamplias a mar abierto; ya no había másaportes desde fuera de Tierra delFuego. Debilitados, sin alimentaciónadecuada (especialmente en lo querespecta a las grasas), obligados a vivirprincipalmente de mariscos, aves,pescado (en verano) y hongos, loscanoeros sucumbieron con mayorrapidez a las enfermedades del hombreblanco. Los loberos sellaron el destinode los pueblos del sur.
Los misioneros anglicanos quearribaron a comienzos de 1860,trataron de enseñar a los canoeros acultivar verduras, en especial papas ynabos suecos, y trajeron ganado paralos nativos asentados en la misión.También introdujeron la harina, el pan,el azúcar, lo que les produjo nuevosproblemas ya que sus cuerpos noestaban acostumbrados a consumirlos.Los loberos y otros navegantes queincursionaban a través de los canales,introdujeron el tabaco y el alcohol,signando la decadencia de muchosindígenas.
Los pioneros europeos,desde los primeros residentesmisioneros en 1869 hasta nuestrosdías, vivieron de sus cultivos,invirtiendo en ello mucho tiempo yesfuerzo. La tierra no era fácil decultivar, pero ellos producían papas,zanahorias, repollo, nabos suecos ycriaban ovejas, gallinas para producirhuevos, y algunos vacunos. Tambiénusaban alimentos autóctonos, como elpescado y los mariscos. Dependían engran medida de las galletas marineras,harina, granos, porotos, azúcar, té,café, frutas desecadas y otros alimentosque podían almacenarse mucho
tiempo, traídos en barco desde Europao Buenos Aires vía Punta Arenaso las Malvinas.
A nosotros esta dieta nos habríaparecido espantosa. Casi nuncacomían fruta o verdura fresca, las frutasde Tierra del Fuego eran el calafate, elmichay, otras bayas pequeñas deestación, y las cultivadas, como laframbuesa.
El primer ruibarbo a fines de laprimavera era recibido con granplacer. Durante gran parte del inviernoy de la primavera no había nada frescopara comer; la lechuga no estaba listapara consumir sino hasta fines dediciembre o principios de enero.
Los barcos que traían provisiones,los de la misión anglicana primeroy a partir de 1884 los de la ArmadaArgentina, no siempre llegaban conregularidad. A veces las visitas deaprovisionamiento eran varias en elaño, otras veces una sola. En 1874-75el barco de la Misión se retrasó un añoy medio. En esos tiempos depreocupación, escasez de provisionesy falta de contacto con el resto delmundo, nacieron dos bebés en dos delas tres familias blancas que vivían enUshuaia. Mucho más tarde, en 1925-26, por más de un año no vino ningúnbarco y la gente de Ushuaia y delpresidio pasó hambre y se dirigió a laspocas granjas de la costa del canal enbusca de comida. Allí había poco paracompartir. Guillermo Bridges, abuelode mi esposo, hizo construir unalancha pequeña y la trajo a Tierra delFuego para que “nunca más nos paseque no podamos llegar por lo menos aPunta Arenas”.
Con el tiempo, la frecuencia de losbarcos mejoró y llegaba más alimentoa Tierra del Fuego. Mi esposo recuerdaque cuando era niño en Río Grande,a fines de los 30 y comienzos de los40, llegaban barriles de pequeñasmanzanas amarillas (la única frutaque tenían en todo el año) y barriles demiel tan dura que podía cortarse porla mitad con serrucho. Cuando losaviones de la Aeroposta comenzaron allegar a Río Grande los pilotos a vecesle traían, a él y a su hermano, unanaranja. ¡Qué felicidad!.
D I A G N O S T I C O B A S A L D E S A L U D Y N U T R I C I O N6 6
P R O Y E C T O T I E R R A D E L F U E G O 6 7
Cuando el abastecimiento por barcose hizo regular , se construyeron lasrutas y empezaron a llegar loscamiones, pudo conseguirse frutas yverduras frescas. Pero aun así, en losaños 60, cada vez que íbamos delcampo a la ciudad, cada dos o tresmeses, parecía que el barco no llegaríasino en una semana o dos, y todo loque quedaba en los mercados eranfrutas ya secas o podridas. Pormuchos años no comí fruta; lo pocoque conseguíamos era destinado anuestras pequeñas hijas.
Ahora todo ésto ha cambiado. Sedispone de todo tipo de alimentos; lasfrutas y las verduras frescas llegan casia diario y están en los mercados.También llegan alimentos especialesde todas partes del mundo.Habiendo tanto qué elegir, nuestrosniños deberían gozar de una nutriciónóptima. Las muy variadas actividadesde nuestra época requieren unanutrición adecuada. La única razónpara que ésta sea deficiente es laelección de las comidas que sepreparan. Este estudio ha mostrado queaún existen muchas deficiencias tantoen niños como en adultos de Tierra delFuego, y que es necesario unentrenamiento en la planificaciónde las comidas.
Tierra del Fuego es hoy un lugar muyespecial, con muchos jóvenes yprofesionales. Ya no es el lugar al que
la gente venía a hacer una ciertafortuna para luego irse, como se decíaantes. Creo que ahora la mayoría dela gente, en especial los padresjóvenes, viven aquí porque quierenestar aquí, porque aman Tierra delFuego y quieren ayudar en suprogreso. Existen aún muchosproblemas sociales y económicos.Este estudio señala muchos de los quecompeten en especial a esta isla :la falta de una vivienda permanentedada la dificultad de obtener unterreno propio, el alto porcentaje demadres que trabajan, la granproporción de niños en la población,la ausencia de abuelos porque lamayoría viven lejos, en el norte.
Un estudio de diagnóstico como éstees de suma importancia para evaluarnuestra capacidad para enfrentar elcamino que tenemos por delante, alcomenzar un nuevo siglo, un nuevomundo, con nuevos problemas comoel de la disminución de la capa deozono, el efecto invernadero,los cambios en la tierra y lasuperpoblación.
Este nuevo siglo también trae nuevaspromesas de grandes avances ensalud, comunicaciones, educacióny especialmente un nuevo espíritude cooperación entre grupos denaciones. Una nutrición apropiada esmuy importante para preparar anuestros hijos para este nuevo mundo.
R. Natalie P. GoodallUshuaia, agosto de 1995.
Agradezco las ideas aportadas por Ernesto Piana, Abigail Goodall y Estela Caipillán.

BASE-LINE HEALTHAND NUTRITIONSURVEY
TIERRA DEL FUEGOPROJECT
FU
ND A C
I
ON
JO
R
GE M
A
CR
I FUNDACION JORGE MACRI
CESNICENTER FOR STUDIES ON INFANT NUTRITION
T I E R R A D E L F U E G O P R O J E C T 7 1
The Fundación Jorge Macri expresses its social commitment through projects andprograms which seek to act directly upon real factors of change. For us, educationis the main axis of our social commitment.
The publication here presented stands testimony to our concern for the recipient oflearning: the student whose education and professional future is conditioned byproper nutrition and initial stimulus at childhood.
In this task, we are convinced that nobody can replace the student’s family and thesocial community. For this reason, the Tierra del Fuego Project has since itsinauguration travelled the path of joint action with parents, with social leaders andwith the institutions rooted in the area of the province of Tierra del Fuego.
At the same time, within the broad field of education, from which we hope tocontribute to the economic and social development of our country, the FundaciónJorge Macri has decided to take on with special emphasis the issue of technologicaleducation at the high school level.
Human dignity is closely linked to the opportunity to actively integrate with society.This integration expresses itself, among many other ways, through work, and broadlytranscends the limits of economic remuneration, as work is, mainly, a vehicle forpersonal fulfillment and for the formation of common bonds between individuals.
In our time, and every day more, work is inseparable from education. There are eachday less posts that do no require qualifications and training. This vital link betweeneducation -especially technological education, which is the most affected bychange- and the workplace, is where the Fundación Jorge Macri manifests its socialconcern, through the undertaking of an educational center which is in the processof coming into being.
While this task advances, the Tierra del Fuego Project has completed its first stageand this publication stands witness to all that has been done, together with all theactivity which continues today and which will carry on in the future.
We hope that this Project, which will continue to the year 2000, will be madeextensive to and of use throughout the national territory. The business sector andnon-governmental institutions are thus able to build up enterprises which, like thisone, seek to address the structural requirements of our society.
FU
ND A C
I
ON
JO
R
GE M
A
CR
I
FRANCISCO MACRIPresident

B A S E - L I N E H E A L T H A N D N U T R I T I O N S U R V E Y7 2
Acknowledgments
The Fundación Jorge Macri and CESNI thanksthe Argentine Navy for its cooperation.
They also thank the following scientific institutions:
Hospital de Pediatría Prof. Dr. J. P. Garrahan, Buenos Aires.Panamerican Health Organization, Washington DC, USA.University of California at Berkeley, USA.University of California at Davis, USA.University of Iowa, Departament of Pediatrics, USA.Johns Hopkins University, School of Public Health, USA.Universidad del Salvador, Buenos Aires.
And also to Lions Club of Río Grande and Ushuaiaand Rotary Club of Río Grande and Ushuaia.
And to the Government and authoritiesof Tierra del Fuego and Ushuaia City.
And especially to the people of Tierra del Fuego.

T I E R R A D E L F U E G O P R O J E C T 7 3
CESNI (Center for Studieson Infant Nutrition) is anon-governmental, non profit,government approvedfoundation, created in 1976with the initial support ofUNICEF.
CESNI's main purposes are1) to promote research on thehealth and nutrition problemsaffecting argentinean childrenand their families2) to develop the manpowerneeded to face such problems 3)to educate the community insuch issues4) to advice in interventionprograms carried bygovernmental or privateagencies.
In 1992 CESNI was designeda WHO-PAHO CollaboratingCenter in Research andTeaching in Pediatric Nutrition.
CESNI's BaselineSurvey TeamDIRECTIONESTEBAN CARMUEGA MDALEJANDRO O'DONNELL MD
SCIENTIFIC ISSUES AND EXPERIMENTAL DESIGNALEJANDRO O'DONNELL MDESTEBAN CARMUEGA MDELVIRA CALVO MDERNESTO POLLITT MD
GENERAL MANAGEMENTANA ARACAMA ZORRAQUÍN
COORDINATION OF FIELD TEAMS IN USHUAIAPABLO DURÁN MD
LABORATORY COORDINATIONRAÚL UICICH, PHD
HEALTH AND NUTRITION SURVEY TEAMVERÓNICA GODINO RD (FIELD)EDITH ALVAREZ RD (FIELD)REGINA TRAVERSO RD (FIELD)CONSTANZA MACHAIN BARZI RD (ANALYSIS)PATRICIA GIACOMELLI RD (ANALYSIS)CAROLINA SCAIOLA DE ARIZU RD (ANALYSIS)MIRIAM ROSENDY RN (FIELD)
CHILD DEVELOPMENT SURVEYCOORDINATOR:TERESA TORRALVA PHDTEAM:MICAELA MANSO PHD (FIELD)ISABEL CUGNASCO PHD (FIELD)FLORENCIA SOUTON PHD (FIELD)MARIETA FERRERO PHD (FIELD)CECILIA FURLONG PHD (ANALYSIS)TERESA PINILLA PHD (SURVEY DESIGN)
MAIN LABORATORY TEAMALICIA ROVIROSA PHDVICTORIA CERVERELLAFABIANA ALBERTO PHDJAVIER MORENOKARINA ROSENBLATT
FIELD LABORATORYCÉLICA BERNARDINI PHD
RADIOINMUNOASSSAYMARÍA LUISA DÍAZ PHD
NUTRITION EDUCATION PROGRAMMARÍA TERESA OTERO PHD
COMPUTER CENTER AT CESNIERNESTO SURIJÓN FRINIS PHDDIEGO ZITZER PHD
SECRETARIAT AND LOGISTICSAMALIA ROBREDOMARÍA JOSÉ LASCANO
EXTERNAL CONSULTANTS:DEMOGRAPHY AND POPULATION SAMPLINGALICIA MASAUTIS PHD
PERINATOLOGYMIGUEL LARGUÍA MD
ADOLESCENCECARLOS BIANCULLI MD
CHILD DEVELOPMENTERNESTO POLLIT PHD
SOCIAL COMMUNICATIONALEJANDRO TORCHIO PHD
CESNICenter for Studieson Infant Nutrition
WHO Collaborating Centre for Researchand Education onInfant Nutrition
T I E R R A D E L F U E G O P R O J E C T 7 5
Health is nowadays defined, notsimply as the absence ofdisease, but as the conditionwhich allows the full social andlabor integration of individualswithin the society in which theylive.
The most important event forthe future social and laborinsertion of an individual isformal school education. But inorder for a child to profit fromall that the school system has tooffer, he or she must have beenable in his or her early years tofully express the geneticpotential with which he or shewas endowed by his parents.
This depends on the interplay ofmultiple socio-environmentaland health factors which areactive from the moment ofconception itself.
The early and periodic controlof pregnancy, nutritional care ofpregnant and breast-feedingwomen, prevention of low birthweights, prolonged breastfeeding, a satisfactory healthand nutritional status and timelystimulation guidelines duringthe most receptive moments ofthe child’s development arefundamental for achieving suchend.
Many of these preventiveactivities have not beenaccomplished even incommunities which have fairlygood socioeconomic and healthstandards.
Health, Nutrition & Environment:Constraint for Children’s Educability
B A S E - L I N E H E A L T H A N D N U T R I T I O N S U R V E Y7 6
The Health, Nutrition and ChildDevelopment Survey of theTierra del Fuego Project is themost comprehensive studyperformed in our country todate with the purpose ofdescribing conditions which caninterfere with our child’s futureeducability. Its findings-which can be extrapolated to75% of the infantile populationof our country- are however theminimal expression of what issurely happening in lessprivileged communities.
Over 1200 families wererandomly selected for theSurvey. These familiesgenerously collaborated withthe health, anthropometry,dietary and biochemical studies.Participation was strictly on avoluntary basis and only lessthan 2% of the families selectedrefused to participate.
In a second stage of theBaseline Survey, thedevelopment of children aged6, 12, 24 and 60 months, wasevaluated as well as the abilityof those children’s environmentto provide enriching stimulus.
Findings and conclusions of theChild Development Survey willbe published soon.
A group of researchers fromCESNI set themselves up on theisland of Tierra del Fuego,assembling a laboratory for theinitial processing of bloodsamples, which were later senton a weekly schedule to theCentral Laboratory in BuenosAires, where more than 8000biochemical tests were carriedout. Related to the ChildDevelopment Survey, 1200psychological tests were takento children of different ages.
The information obtainedconfirmed several problemswhich were suspected ofexisting in our country but thathad never been studied before.
The findings of the Survey arethe basis for the interventions tobe conducted along the years ofthe Tierra del Fuego Project.
The Health Conditionof Our Children
T I E R R A D E L F U E G O P R O J E C T 7 7
The prevalence of breast feeding relative tonational figures can be considered as good.82% of the mothers breast fed for 1-3months, 60% between 3 and 6 months.Only 7% never breast fed.
The introduction of foods other than breastmilk is inadequately early, particularly non-fortified cow's milk. Mothers of lower SELbreast fed for one month less than moreprivileged mothers.
Mothers who acknowledged the healthteam as the most reliable source ofinformation about infant care, breast fed fora longer period. However, only 39% of themothers had received information about theadvantages and practice of breast feedingduring their pregnancy and hospital stay fordelivery.
The prevalence of linear growth retardationwas 17% in adolescents -most of them bornoutside the island- and 3% in infants bornin Tierra del Fuego suggesting better localhealth, nutrition and environmentalconditions than in the provinces whereparents came from.
The main nutritional problem is overweightand obesity, affecting 6% of infants, 8% ofpreschool children, 14% of school agechildren and 22% of adolescents.
Acute protein-energy malnutrition was notdetected in any child; as mentioned before,low height for age as an indicator ofchronic malnutrition was more commonin adolescents than in younger children.
Three out of four infants had iron intakesbelow the recommendations; two hadbiochemical evidences of iron deficiencyand one anemia.Low birth weight, breast feeding for shorttime and the early introduction of non-fortified cow's milk were the most importantfactors associated with iron deficiencyanemia.
11% of infants, 9% of preschoolers showedbiochemical evidences of vitamin Adeficiency.
17% of children below 6 years of agehad vitamin D deficiency. 38% of pregnantwomen also had vitamin D deficiency.
In the population interviewed, diet wasinadequate in calcium, iron, vitamin C,vitamin A. Intakes of energy and proteinwas adequate.
Food consumption and food purchasingpatterns in Tierra del Fuego do not differfrom what happens in other urbancommunities in our country.
Some Relevant Findingsof the Survey

B A S E - L I N E H E A L T H A N D N U T R I T I O N S U R V E Y7 8
The Tierra del Fuego Projectconsists in a series of activitiesto be performed essentially bythe families and by thecommunity with the objective ofreaching the full intellectual andsocial development of theirchildren.
Most of these actions are mostlya responsibility of each family inparticular and of the communityin general -rather than being aresponsibility of the state. Theactions do not mean an increasein health expenditures; they justmake better use of alreadyexisting resources.
The Tierra del FuegoProject
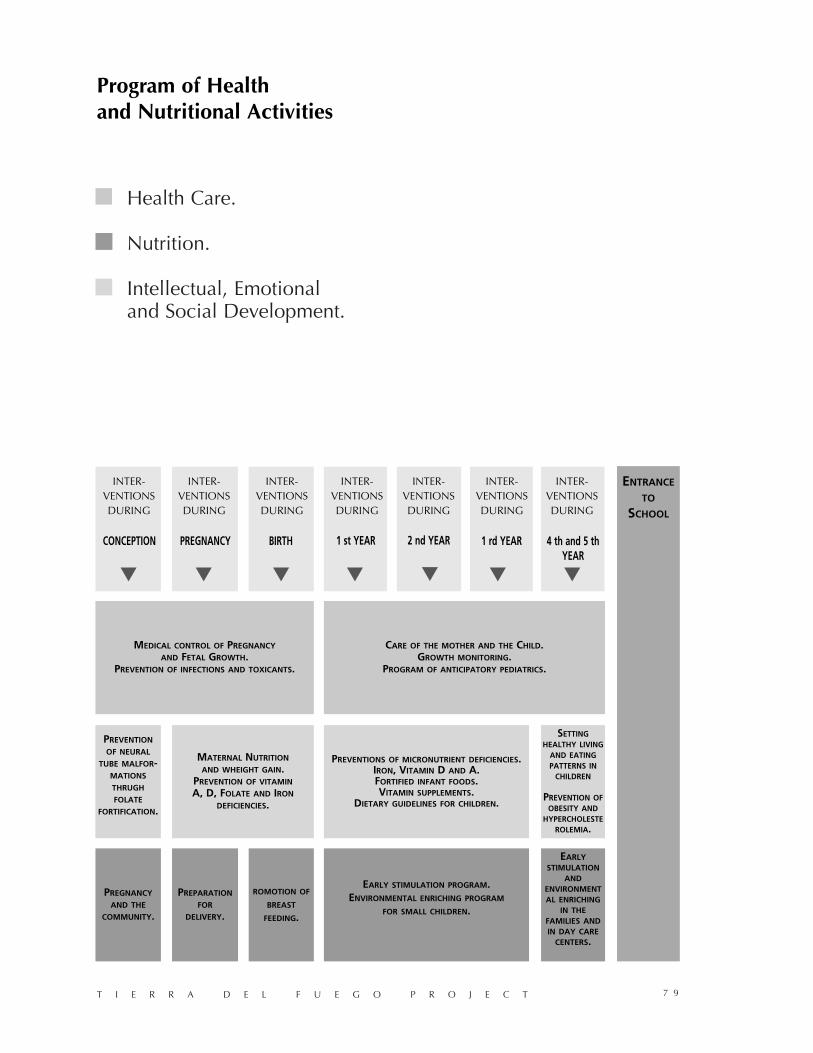
Health Care.
Nutrition.
Intellectual, Emotionaland Social Development.
T I E R R A D E L F U E G O P R O J E C T 7 9
4 th and 5 thYEAR
ENTRANCE
TO
SCHOOL
1 rd YEAR2 nd YEAR1 st YEARBIRTHPREGNANCYCONCEPTION
MEDICAL CONTROL OF PREGNANCY
AND FETAL GROWTH.PREVENTION OF INFECTIONS AND TOXICANTS.
PREGNANCY
AND THE
COMMUNITY.
PREPARATION
FOR
DELIVERY.
ROMOTION OF
BREAST
FEEDING.
EARLYSTIMULATION
ANDENVIRONMENTAL ENRICHING
IN THEFAMILIES ANDIN DAY CARE
CENTERS.
EARLY STIMULATION PROGRAM.ENVIRONMENTAL ENRICHING PROGRAM
FOR SMALL CHILDREN.
CARE OF THE MOTHER AND THE CHILD.GROWTH MONITORING.
PROGRAM OF ANTICIPATORY PEDIATRICS.
PREVENTION
OF NEURAL
TUBE MALFOR-MATIONS
THRUGH
FOLATE
FORTIFICATION.
MATERNAL NUTRITION
AND WHEIGHT GAIN.PREVENTION OF VITAMIN
A, D, FOLATE AND IRON
DEFICIENCIES.
PREVENTIONS OF MICRONUTRIENT DEFICIENCIES.IRON, VITAMIN D AND A.FORTIFIED INFANT FOODS.VITAMIN SUPPLEMENTS.
DIETARY GUIDELINES FOR CHILDREN.
SETTINGHEALTHY LIVING
AND EATINGPATTERNS IN
CHILDREN
PREVENTION OFOBESITY AND
HYPERCHOLESTEROLEMIA.
INTER-VENTIONSDURING
▲INTER-
VENTIONSDURING
INTER-VENTIONSDURING
INTER-VENTIONSDURING
INTER-VENTIONSDURING
INTER-VENTIONSDURING
INTER-VENTIONSDURING
▲ ▲ ▲ ▲ ▲ ▲
Program of Healthand Nutritional Activities

B A S E - L I N E H E A L T H A N D N U T R I T I O N S U R V E Y8 0
In 1997, there will be anevaluation of the nutritionalsituation in iron, vitamins A andD, the duration of breast-feedingand the development of thetwo-year-old children bornduring the implementation ofthe actions initiated in 1995 asa result of the findings of thebase-line survey. The situationwill be compared with thechildren of the same ageevaluated during the base-linesurvey.
In the year 2000, the intellectualdevelopment and learningabilities of these same childrenwhen they enterschool will be comparedwith the evaluation of similarchildren in 1994.
The effects of the Tierra delFuego Project and its assessmentwill be the best guarantee for itscontinuation and its permanentincorporation into the life of thecommunity. The evidence of theimprovement in the learningabilities of these children as aconsequence of simpleinterventions applied basicallyby the families themselves, willbe the best argument to extendthese methods outside theprovince. This will benefit allthe Argentine children.
The Five Years of the Project:Results in the year 2000

T I E R R A D E L F U E G O P R O J E C T 8 1
4 - 5 years
3 years
2 years
1 year
Birth
Pregnancy
Conception
1999 / 20001997 199819961994 1995
BASE-LINEHEALTH ANDNUTRITION
SURVEY
ENTRANCE
TO
SCHOOL
EVALUATIONOF IMPACT
2000
EVALUATIONOF IMPACT
1997
▲ ▲ ▲ ▲ ▲
BEGINNING OF INTERVENTIONS

THE TIERRA DEL FUEGOPROJECT
The Tierra del Fuego Project is a health and child development project -with aspecial emphasis on young children- which has risen from three aspects of thecurrent reality in our country:
1) The transitional situation in which Argentina finds itself, from the point of view ofdemographics, epidemiology, technology and the country’s place in the modernworld.
2) The modern concept of health, which is strongly tied to quality of life andtherefore education.
3) The increasing importance of the role of individuals, families and the communityin the areas of health care and education - areas which cannot totally be delegatedto the government.
PROBLEMS IN ARGENTINA AND LATIN AMERICA
The Latin American countries are currently living through a transitional processaffecting social, demographic, economic and health issues. Argentina is taking partin this transitional process, although it can be said that the country is in thevanguard, well ahead of the changes occurring in the rest of the continent. Ourcountry is culminating its urbanization process. It is estimated that by the year 2000,92 percent of Argentina’s population will be urban, a figure which matches that ofthe developed countries. The rest of Latin America, on the other hand, continues tosee migration toward cities in all of its magnitude.
In Argentina this urban migration, while being an indicator of modernization, hastaken place in a very short time in comparison with similar transitions in Europe orthe United States. The process has been disorganized, with minimal governmentalregulation, and with those migrating to the cities suffering from the impact of suddenurbanization and exposure to technology which has not been fully taken advantage of.
The family structure is affected - women are progressivly joining the work force andfinding employment outside the home, resulting in the loss of the extended familyand therefore, of the traditional pattern for raising children. While this allows foraccess to more consumer goods, it means less time dedicated to taking care ofchildren.
At the same time, especially among the middle classes, these new patterns imply amore sedentary lifestyle with greater levels of stress.
Given this situation, it is not surprising that health indicators are showing a clearincrease in cardiovascular diseases, hypertension, hypercholesterolemia, obesity,increased sedentary time and tobacco addiction. At the same time, because ofimprovements in health care infrastructure, fewer children are dying and lifeexpectancy is rising.
These new health and lifestyle problems are affecting the quality of life, the care ofchildren, free time, the possibility for adolescents to reach their full potential, andthe care of the elderly.
T I E R R A D E L F U E G O P R O J E C T 8 3
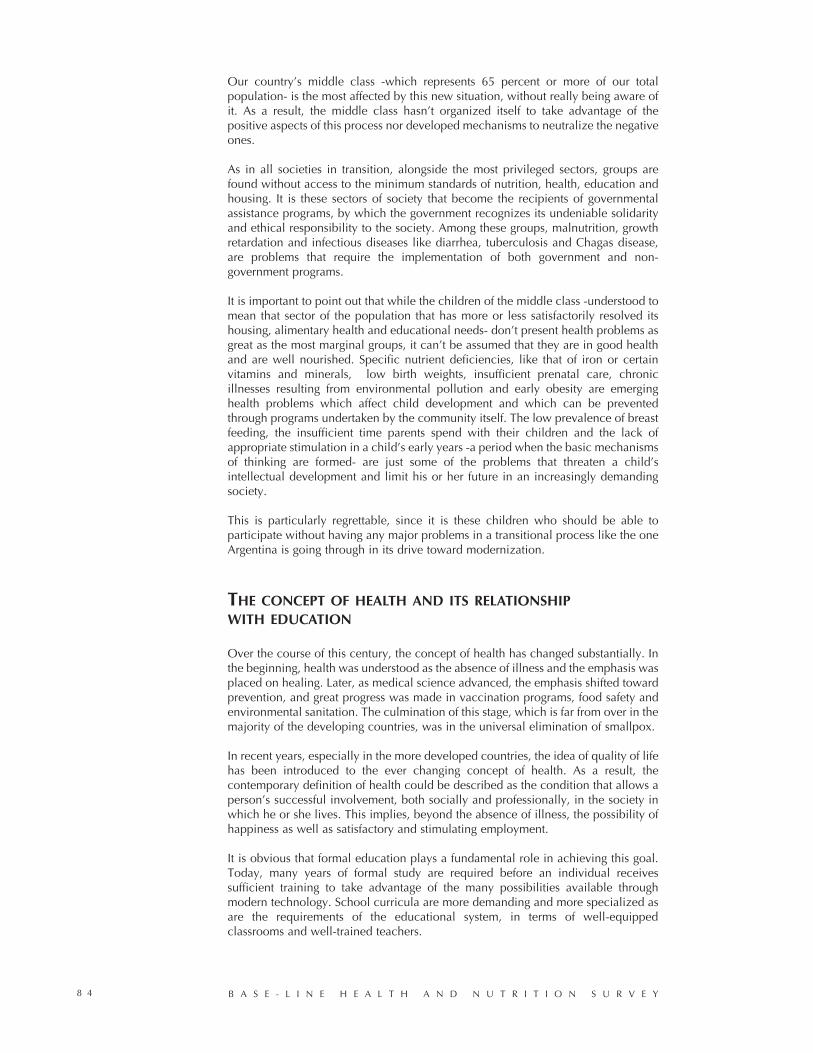
Our country’s middle class -which represents 65 percent or more of our totalpopulation- is the most affected by this new situation, without really being aware ofit. As a result, the middle class hasn’t organized itself to take advantage of thepositive aspects of this process nor developed mechanisms to neutralize the negativeones.
As in all societies in transition, alongside the most privileged sectors, groups arefound without access to the minimum standards of nutrition, health, education andhousing. It is these sectors of society that become the recipients of governmentalassistance programs, by which the government recognizes its undeniable solidarityand ethical responsibility to the society. Among these groups, malnutrition, growthretardation and infectious diseases like diarrhea, tuberculosis and Chagas disease,are problems that require the implementation of both government and non-government programs.
It is important to point out that while the children of the middle class -understood tomean that sector of the population that has more or less satisfactorily resolved itshousing, alimentary health and educational needs- don’t present health problems asgreat as the most marginal groups, it can’t be assumed that they are in good healthand are well nourished. Specific nutrient deficiencies, like that of iron or certainvitamins and minerals, low birth weights, insufficient prenatal care, chronicillnesses resulting from environmental pollution and early obesity are emerginghealth problems which affect child development and which can be preventedthrough programs undertaken by the community itself. The low prevalence of breastfeeding, the insufficient time parents spend with their children and the lack ofappropriate stimulation in a child’s early years -a period when the basic mechanismsof thinking are formed- are just some of the problems that threaten a child’sintellectual development and limit his or her future in an increasingly demandingsociety.
This is particularly regrettable, since it is these children who should be able toparticipate without having any major problems in a transitional process like the oneArgentina is going through in its drive toward modernization.
THE CONCEPT OF HEALTH AND ITS RELATIONSHIPWITH EDUCATION
Over the course of this century, the concept of health has changed substantially. Inthe beginning, health was understood as the absence of illness and the emphasis wasplaced on healing. Later, as medical science advanced, the emphasis shifted towardprevention, and great progress was made in vaccination programs, food safety andenvironmental sanitation. The culmination of this stage, which is far from over in themajority of the developing countries, was in the universal elimination of smallpox.
In recent years, especially in the more developed countries, the idea of quality of lifehas been introduced to the ever changing concept of health. As a result, thecontemporary definition of health could be described as the condition that allows aperson’s successful involvement, both socially and professionally, in the society inwhich he or she lives. This implies, beyond the absence of illness, the possibility ofhappiness as well as satisfactory and stimulating employment.
It is obvious that formal education plays a fundamental role in achieving this goal.Today, many years of formal study are required before an individual receivessufficient training to take advantage of the many possibilities available throughmodern technology. School curricula are more demanding and more specialized asare the requirements of the educational system, in terms of well-equippedclassrooms and well-trained teachers.
B A S E - L I N E H E A L T H A N D N U T R I T I O N S U R V E Y8 4

In order for children to take full advantage of all that the formal education systemcan offer, they must first achieve their full genetic potential, inherited from theirprogenitors. Many factors, which will be examined later in this report, must concurrfor this to happen; in large part they depend on actions not linked to governmentalprograms, but on activities which each family and, indirectly, the community ingeneral, must take responsibility for.
COMMUNITY MOBILIZATION PROJECTS
These activities, which basically depend on the commitment of each person,individually and as part of the community, are what has been called communitymobilization projects. The Tierra del Fuego Project, according to this definition, isone of such projects.
There are many examples of communities which have organized themselves toimprove their health and living conditions. Among the best known, for themagnitude of the program and its results, is the North-Karelia Project in Finland: thiscity of 100,000 had an extraordinarily high cardiovascular mortality rate and,through the education and mobilization of the community, modified its lifestyle anddiet such that, at the end of seven years, a dramatic drop was seen in thecardiovascular mortality rate.
At the other extreme, there are many examples of what a community can achievewhen it organizes itself around a specific objective. Tamil Nadu, in southwesternIndia, is just such an example. Notable reductions in malnutrition and infantmortality rates were achieved through education on nursing, hygienic practices,immunization and distribution of dietary supplements.
The success of community mobilization projects are attributed to four fundamentalfactors:
a) The participation of all sectors of the community that understand and share thegoals of the project and as a result become active participants in its development.
b) The definition of concrete and possible goals which can be reached throughstrategies within the capabilities of the community.
c) The evaluation of the nature and magnitude of the problem and of the resultsachieved, and the diffusion of such achievements to maintain the motivation of thecommunity.
d) The continuity of all these actions for the time needed to reach the proposed goalsand so that the changes achieved remain incorporated in the life of the community.
WHAT IS THE TIERRA DEL FUEGO PROJECT?
The Tierra del Fuego Project consists of a series of health and nutritional activities-to be carried out basically by the community- to assist the province’s children toachieve their full intellectual and social potential, so that they may successfully meetthe social, educational and employment demands of the modern world.The main objective of the Tierra del Fuego Project is to optimize the conditions inwhich children in the province enter the formal education system, since it is knownthat the quality of education in primary school and the student’s accomplishmentsare the most reliable indicators of a person’s future.
The importance of education is felt by people all over the world, and as such, one of themost frequent demands put on governments is an increase in the budget for education.
T I E R R A D E L F U E G O P R O J E C T 8 5

Recently, much debate has centered on the school system in our country in an effortto improve its quality and increase its buget, which is an important step. However,it shouldn’t be forgotten that the educational system involves two parties: theeducator and the student. The conditions in which children begin their education isa factor in determining their educatability. The students’ ability to take advantage ofwhat the formal education can offer justifies investments in education and will be acatalyst for more advanced and modern curricula.
Every person is born with a genetically determined intellectual potential, which canbe affected by several factors that together can limit its full expression. Theseinclude:
• lack of, late or poor prenatal care• conditions causing low birth weights• breast feeding nil or too short• specific nutritional deficiencies that characterize “hidden malnutrition”• environmental pollutants• the lack of appropriate stimulation during the critical stages of child development
The Project attempts to address some of these factors, with the participation of allthe individuals and families that form the community of Tierra del Fuego.
WHY IN TIERRA DEL FUEGO?
In spite of its location so far from the more populated areas of our country, the Tierradel Fuego province registers some of the best demographic and health statistics. Theprovince has the largest child population, proportionally, in all of Argentina andinfant mortality rates are even lower than those in the Federal Capital - the districtwith the greatest concentration of health facilities in the country.
Extreme poverty doesn’t exist in Tierra del Fuego, where the social structure isfundamentally of the middle class. Almost all the inhabitants of the province live inone of two cities, with a very small permanent rural population (2%). Basic services(like domiciliary access to electricity, water, and sewage) and both state and privatehealth care, with high standards of pediatric and perinatal care are universallyavailable.
The people live -as in few parts of the country- under the intense labour demands ofthe cities. Both parents usually work away from the household and the children areleft for many hours in daycare, be it factory sponsored, government run or private.
The province’s population annual rate of growth is the highest in the country, whichis due to the highest gross birth rate and the lowest infant mortality rate. As a result,the population of the province, is the “youngest” in the nation (1).
The fact that Tierra del Fuego has the highest percentage of child population in thecountry and that the majority of the community is able to meet its food health andhousing needs, was a determining factor in selecting this province to participate inthe Project. The socio-economic structure of the province is representative, ingeneral terms, of the social structure of about two-thirds of Argentina. From ademographic point of view, the community - which grew rapidly as a consequenceof domestic migration within our country- is made up of inhabitants from all overArgentina, creating a melting pot of customs and habits representative of the entirenation. Other factors like the high level of social participation, the mediapenetration, efficient health care and preschool care have been other importantdeterminants in the choice of Tierra del Fuego as the location of the project.
From a logistical point of view, the province has the appropriate size for a
B A S E - L I N E H E A L T H A N D N U T R I T I O N S U R V E Y8 6

community mobilization program. The feeling of isolation and insularity, inspired bythe distance separating most of the province’s inhabitants from their original homesand from their grandparents and extended families, has encouraged thedevelopment of a special feeling of solidarity. On the other hand, since it is an areaof relatively recent immigration - its population boom having occurred in the lasttwo decades - there are no strongly defined cultural patterns, neither local norimported from the inhabitants’ original areas of residence. The mass media - mainlyradio - covers the entire provincial territory and is regularly listened to.
There are many cities in Argentina that are of comparable size and structure toUshuaia, fostering the hope that activities in Tierra del Fuego may be a model forother communities. The project also acquires special significance since theproblems at hand do not affect just Tierra del Fuego, but rather millions of childrenand adults throughout Argentina and Latin America.
WHAT ACTIVITIES DOESTHE TIERRA DEL FUEGO PROJECT INVOLVE?
The Project can be divided into four programs, although it is a somewhat artificialdivision, since the activities could be developed simultaneously and overlapconsiderably . The activities in each of the programs are not original since there havealready been many comparable experiences in the world. However, the orginalityof the project is based on their coordinated implementation, on the community’srole and on the permanent evaluation of them. The evaluation of the baselinesituation and of the different programs will allow measurement of the impact of theactivities implemented.
The four proposed programs are:
• Malnutrition prevention program, including deficiencies of specific nutrients.• Psycho-social enrichment program in infants and preschool children.• Pre- and post-natal care program.• Community nutrition and health education program, including the prevention of
chronic non-transmissible diseases in adults.
The activities don’t imply an additional burden to the health or education budgetsof the province, but rather the optimal use of available rescources, supported by thecommitment of the community in solving the problems.
T I E R R A D E L F U E G O P R O J E C T 8 7

ACTIVITIES TO PREVENTHIDDEN MALNUTRITIONAND MALNUTRITION IN GENERAL
Objective
To reduce the prevalence of micro-nutrient deficiencies in the population throughthe fortifying of foods and/or provision of medicinal supplements, and nutrition andhealth education.
Background
Protein-energy malnutrition (PEM) - known as social malnutrition - is theconsequence of a lack of food and repeated illnesses. This form of malnutrition ischaracterized in mild cases by stunted growth, and, in more severe cases, by aclinical picture showing an obvious, overall deficiency of nutrients (proteins, energy,vitamins, minerals).This form of malnutrition is usually concentrated in pockets ofextreme poverty and is the target of many government and private social welfare,health and food assistance programs.
On the other hand, deficiencies of one or more specific nutrients - without affectingnormal growth nor showing signs of malnutrition, “Hidden Malnutrition” (WHO-UNICEF) (2) - affects large sectors of the population without distinction among socialgroups.
Hidden malnutrition is not due to a lack of food, but begins with the reduced intakeof a specific nutrient, which causes the body’s reserves to drop to a level insufficientto sustain normal growth, pregnancy or nursing or to fight off infection or can affectthe functioning of organs or bodily systems linked to the nutrient, whethernoticeable or not. This is called “adaptation” to the deficiency and implies areduction in some functions and usually has a repercussion on the child’s future.
A typical example is the anemia caused by iron deficiency, which is the mostcommon nutritional deficiency in our country, affecting between 30 and 56 percentof children under two years (3), 10 percent of school-aged children (4), 10-15percent of adolescents (5) and 25 percent of women of childbearing age. Althoughmost cases are mild, it has important functional consequences.
Iron deficiency affects the body’s defenses against infection, as well as physicalendurance and therefore the ability to work; in young children it affects manycerebral functions including the ability to learn and general development. There issolid evidence supporting the conclusion that disruptions to the intellectualdevelopment of infants caused by anemia - even when mild and properly treated -can be detected even years later when children start school (6).
Although it has yet to be studied in Argentina, vitamin A deficiency certainlyconstitutes another health problem. Data from dietary surveys shows that 40 percentof children in Buenos Aires don’t fulfill the recommended intakes (2). Vitamin Adeficiency is associated with deficiencies of iron and zinc.
Some 30 percent of children and more than 50 percent of adolescents have calciumintakes below the recommended levels , according to studies undertaken in BuenosAires (3)(4)(5). The long term consequence of this deficiency is an increasedlikelihood of bone fractures and osteoporosis. Chronic calcium deficiencypredisposes to arterial hypertension and eclampsia in pregnant women.
B A S E - L I N E H E A L T H A N D N U T R I T I O N S U R V E Y8 8
It is likely that Argentina’s marginal calcium situation is aggravated in Tierra delFuego by the deficiency of vitamin D, which, among its other functions, facilitatesthe absorption of dietary calcium. Rickets, caused by vitamin D deficiency,increases the susceptibility to infectious diseases - tuberculosis, in particular - andcan produce bone deformities.
Other nutrients, like zinc (which affects growth, sexual development and children’sappetites), folates (inadequate intake during the first months of pregnancy has beenlinked to malformations of the central nervous system), the essential fatty acids(which affect the development of vision and of the nervous system of small infantsand newborns), along with those nutrients mentioned above, make up the broadspectrum of hidden malnutrition. They all involve important consequences for childdevelopment and the health of the population at large.
The deficiency of these nutrients will be, for the first time in Argentina, studied inUshuaia, as part of the baseline survey of health and nutrition conditions.
Micronutrient deficiencies, such as those mentioned, can be solved through dietaryeducation (changing the population’s eating habits), fortification (adding specificnutrients to widely consumed foodstuffs, in the same way that iodine deficiency iscurbed by adding iodine to salt) or medicinal supplements (as is practiced with ironsupplements for pregnant and nursing women).
The cost of these interventions is minimal but, in spite of the results achieved inother countries with such policies, it hasn’t been implemented in Argentina. Onereason for this failure to address micro-nutrient deficiencies is that neither thecommunities nor the agencies that make political and technical decisions have atangible perception of this form of malnutrition.
Showing that an apparently healthy population has a high prevalence of thesedeficiencies and that it can reduce or eliminate these deficiencies and thedemonstration of the impact of such accomplishments on the growth anddevelopment of the children, will be one of the contributions that the Tierra delFuego Project can make to the rest of the country.
T I E R R A D E L F U E G O P R O J E C T 8 9
EARLY STIMULATION PROGRAMFOR THE FIRST TWO YEARS OF LIFE
Objective
To fully develop the intellectual and motor skill aptitude possible given each child’sinherited genetic endowment, through appropriate psychological stimulation.
Background
The full intellectual potential of a child is reached depending on the child’sinteraction with his or her environment. For the youngest children, this environmentconsists of contact with their family and their care givers during the time parents areworking.
The learning process is sequential. In other words, the achievement of onedevelopmental milestone must be followed by another, making it impossible to skipa step without being inadequately prepared for the next. The care and stimulationthat children receive in the first two years of life has an enormous impact on theirfuture development. There is overwhelming evidence suggesting that children whohaven’t received adequate affection and motor and sensory stimulation during theearliest stages of their development show a lower intellectual capacity.
Child growth and development, taking into account obvious differences betweenindividuals, is a foreseeable process and as such provides the basis for individualadvice and community programs, which are nothing more than anticipatoryrecommendations for families and care providers about useful activities and tools foreach stage of a child’s development.
Early stimulation and environmental enrichment programs help parents to providethe stimulation needed in each stage of a child’s life. The program also attempts totrain care givers so that the simplest activities they may perform can contribute tothe efforts of the parents in the home.
Given women’s growing role in the workplace outside of the home, it has becomenecessary to transform traditional day care centers into true centers for childdevelopment where, in addition to providing the basic care necessary for goodhealth and growth, a better and more balanced psychological and socialdevelopment is encouraged. This implies including parents and care givers in acoordinated effort toward this end, giving them the specific tools (stimulationmaterial for every age, educational toys, etc.) and training and motivating parents tomake the best use of time spent with their children. So that when, for employmentreasons, they can’t spend all the time they might want with their children, parentscould offer their children the best quality time for their psychological and emotionaldevelopment.
B A S E - L I N E H E A L T H A N D N U T R I T I O N S U R V E Y9 0

PRE- AND POST-NATAL CARE
Objective
To promote from within the community better care of pregnant women,emphasizing prenatal care, developing educational activities for future parents,strengthening maternal self-esteem, family responsibility and stimulating earlybonding between mother and child.
Background
The birth of a child is known many months beforehand, providing more than enoughtime to develop healthy practices encouraged by the community and health careservices.
Birth weight is the consequence of various factors including the fetus’s potential forgrowth and other occurrences during the term of the pregnancy. Those at greatestrisk for delivering infants with low birth weight are the very young and very old,those who don’t seek and take adequate care during pregnancy, undernourishedwomen, smokers, alcoholics, women with hypertension or toxemia, and those whohad some kind of infection during pregnancy. It is known that low birth weight (lessthan 2,500 grams) increases the risk of postnatal infections and can limit the child’sphysical growth and intellectual development.
Prenatal care has proven itself to be a good investment, with some estimatesshowing that for every peso spent on prenatal care, three are saved in intensiveneonatal care.
The rate of hospital deliveries in Tierra del Fuego is as high as in the most advancedcountries in the world. It is, therefore, important to identify, through a very thoroughoperational study, which areas of hospital care can be improved in terms ofinfrastructure or human resources training.
Post-partum days offer a unique opportunity for health education activities. Mothersand their newborns are, for this purpose, held “captive” in the hospital for two tofive days. This offers an ideal opportunity to promote the benefits of breastfeeding,begin early stimulation programs, and to emphasize knowledge acquired duringattendance at programs for future parents. It’s important to point out that theseunique experiences, in such emotional moments, can have an enormous impact onmaternal behavior, which in turn can make a big difference in the interactionbetween parents and children.
In summary, these are some simple but rational prenatal activities, that can changethe attitudes towards pregnancy and breastfeeding of both individuals and thecommunity as a whole, and allow for better care of children from the moment oftheir conception.
T I E R R A D E L F U E G O P R O J E C T 9 1
COMMUNITY NUTRITIONAND HEALTH EDUCATIONPROGRAM
Objective
To encourage, by way of concrete messages, better health habits in different sectorsof the community.
this will be carried out through the following programs:
• NUTRIMUNDO (Nutriworld): The adventure of growing healthy and living better.• ECOMUNDO: Program for the protection of the environment in the elementary
school.• Conscientious consumer programs.• Program to prevent non-transmittable chronic illnesses in adults.
NUTRIMUNDO
Is a nutrition education program for elementary school children, developed by andfor teachers. The objective is to provide teachers with ideas and materials tointroduce nutrition education into the curricula.
The program’s content is based on concepts developed in a CESNI-UNICEFConsensus Meeting with nutrition experts from all around the country, during whichpriorities were set for the nutrition education of the nation’s children.NUTRIMUNDO has already been implemented in more than 4,000 public schoolsin Argentina.
The objective of NUTRIMUNDO is to provide children with the knowledge that willallow them to make appropriate decisions about how to eat healthily and helpeducate their families about such health issues.
It is hoped that through NUTRIMUNDO children will acquire knowledge aboutnutrition that will contribute to changes in some undesirable eating habits in ournational diet. These changes will be a valuable aspect of this study, especially sincethe dietary patterns and habits of Tierra del Fuego represent an amalgam of thosefound in different regions of our country and don’t differ greatly from those of ourmajor cities.
One of the principal problems in Argentina’s eating habits is the monotony andrigidity of the diet. Dietary dependence on but a few foods is show by the fact that75 percent of the average calorie intake in our country comes from only 15 foods.The population’s inflexibility when it comes to changing shopping habits means thatwhen seasonal factors limit the availability of a particular food, continuing demandcauses increases in food prices. NUTRIMUNDO places special importance on thisbehavior and encourages children to learn about and accept new foods, whileproviding guidelines to aid them in changing their habits to achieve better nutrition.In Tierra del Fuego food availability is greatly affected by seasonal factors and theregion’s climate and it is hoped that the information provided in school throughNUTRIMUNDO when projected toward the home will translate into animprovement in quality of life and diet.
B A S E - L I N E H E A L T H A N D N U T R I T I O N S U R V E Y9 2
PROMOTINGENVIRONMENTALPROTECTION: ECOMUNDO
To develop environmental awareness in the juvenile population that will projectfrom the elementary schools toward the community in general. This objective isparticularly relevant in the only Argentine province which specifically addressesenvironmental protection in its state Constitution.
Preservation of the environment is one of humanity’s biggest concerns, and one onwhich its future depends. The Southern Cone of South America, and our nation inparticular, is one of the few ecological niches that remain in the world, because ofits physical beauty, its rather well-educated population, its absence of serious socialconflicts, and its relatively scarce population. However, when environmentalprotection is considered, one sees that insufficient actions are taken. Only recentlyhas there been some awareness of this problem and its significance for futuregenerations and, in the short term, for the economy. Although the importance ofgenerating environmental awareness in school children has been recognized,teachers in our country have no training in environmental issues nor resources toassist them in educating pupils on the subject.
For geographical and historical reasons, Tierra del Fuego has produced anenvironmental awareness in its community unlike that found anywhere else inArgentina. It is important to take advantage of this awareness and the motivation thatalready exists to develop and implement an educational program promoting criticalenvironmental objectives. This school-based project could then be quickly exportedto other provinces, with whatever adaptations are necessary for the different regionsof the country.
T I E R R A D E L F U E G O P R O J E C T 9 3
BASE-LINE HEALTHAND NUTRITIONSURVEY
The first stage of the Tierra del Fuego Project is the baseline survey of health,nutrition, and child development conditions in the province. This diagnosis has twomain objectives: a) to describe the problems, ranking their importance b) to serveas a baseline information for the evaluation of the impact of the activities that willbe carried out during the 5 years the project is scheduled to last.
The survey has two main components: a) the health and nutrition survey and b) thedevelopmental survey which will be published soon.
The baseline diagnosis was based on a careful sampling design, with the entirepopulation represented, especially the most vulnerable groups like infants andpregnant women. The items surveyed were selected from a detailed analysis ofnutritional information about Argentina and from information contributed by thetechnical sector of the Province’s government.
This survey constitutes the most important nutritional study undertaken to date inour country, in terms of both the number of indicators considered and the quality ofinformation obtained.
The instruments, methodologies and computer software developed and tested for thehealth and nutrition survey are the first contributions of the Tierra del Fuego Project.It is expected that these will be used for surveys in other regions of the country.
The survey demonstrated the high level of community participation as shown by thecooperation of schools, promotion of the study by the Rotary and the Lions clubs,participation of schools for adults which voluntarily took on the door-to-door censusand especially the cordiality of the 1,200 families which generously gave their timeto the three interviews required by the survey.
In order to conduct the basal survey, a CESNI field team lived for 6 months in Tierradel Fuego,where a field laboratory was established to pre-process blood sampleswhich were then sent each week to CESNI’s main laboratory at the GarrahanHospital in Buenos Aires. More than 8,000 lab analysies were done during thesurvey. The Argentine Navy provided invaluable support by providing transportationof samples and housing for the personnel.
A summary of the most significant information produced by the health and nutritionsurvey of the basic diagnosis follows.
T I E R R A D E L F U E G O P R O J E C T 9 5
SURVEY METHODOLOGY
Ushuaia Survey Design
The baseline diagnosis is a descriptive, transversal study undertaken with a sampleof families, randomly selected based on geographic location, considering a globalsampling fraction of 1:4 which reaches representativity for each one of thebiological groups of greater vulnerability.
The purpose of the survey is to generate scientific information for the design ofeffective intervention programs and to serve as a baseline for evaluating the effect ofthese programs throughout the 5 years the project is designed to last.
The survey data in the context of this report will be referred to for the followingbiological groups:
• Children from 9 to 23 months and 29 days.• Preschool children (24 months to 5 years, 11 months and 29 days).• School children (6 years to 11 years, 11 months and 29 days).• Adolescents (12 years to 18 years, 11 months and 29 days).• Women of child-bearing age (mothers of some of the groups 1 to 4).• Adult men (fathers of some of the groups 1 to 4).• Pregnant women.
Characteristics of the sampling design
The sampling size was defined, for each of the groups noted, in 300 subjects (except for groups 5 and 6, forwhich there were 150 subjects each, which when combined were equivalent to the other groups). The sizeof the sample permits an estimation of the following prevalences with a confidence interval of 95%:
Real prevalence Confidence interval50% 625% 510% 3
The size of the sample allows the detection of changes in the initial prevalence rates in the order of 10%from an initial value of 30%.
Given the particular characteristics of the city of Ushuaia, in terms of the quantity and geographicconcentration of homes, it was possible to use a one-stage sample design, with the advantages and reliabilitythis signifies. A probabilistic sample of homes was defined using information from the most recent NationalPopulation and Household Census (INDEC, 1991) (7). The sampling unit was the home and the number ofhouseholds selected depended on the age group with the lowest representation, which was that of childrenbetween 9 and 24 months old. The size of the sample calculated for this and other groups was 300 subjects.According to the 1991 Census, there was one child of this age for every 7.2 homes. Therefore, in order toselect 300 subjects, 2,160 homes were needed, which gave the sampling a global fraction of 1/3.5 homes.
The statistical advantages of a simple random sampling are considerable with respect to other types ofsamples by conglomerates or/ and in multiple stages. All the statistical parameters have been defined withthe simple random sample as a model. Therefore, the values calculated using this sample are direct estimatesof the population and consequently it isn’t necessary to introduce correction factors.
The selection of 9 to 24-month-old children corresponded to the global sampling fraction as did thesampling of pregnant women. The selection of the other groups was made using a fixed estimated proportionaccording to their relative representation in the population, as described below:
• Group 1 Children 9 months to 23 months: all households.• Group 2 Pre-school children: 1 out of every 3 housholds with children of this age.• Group 3 School children: 1 out of every 3.5 households with children of this age.• Group 4 Adolescents: 1 out of every 3 households with subjects this age.• Groups 5-6 Adults: by sampling definition these subjects were individuals of the other groups. Of theparents who live in homes selected as part of one of the children’s groups, a universe of adults would arisewhose size was unknown. The sampling fraction for adult man and adult woman arose from each censusunits once the sampling was completed for groups 1, 2, 3, and 4. At this time the total population was knownfor that unit and also the size of the sampling for group 4. The total number of men was divided by the n/2selected from group 4, to obtain a sampling fraction that was applied using a random number for each andwith fixed interval. For the adult women the same criteria was used. This system should have produced 150
B A S E - L I N E H E A L T H A N D N U T R I T I O N S U R V E Y9 6
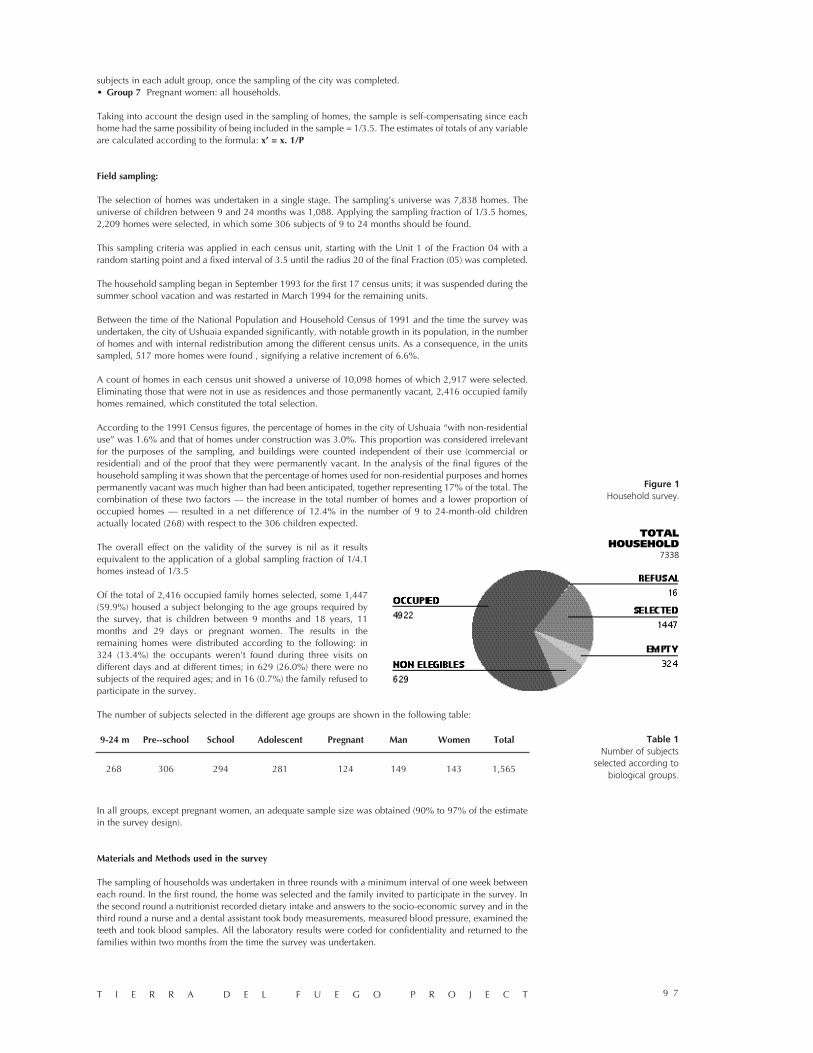
subjects in each adult group, once the sampling of the city was completed.• Group 7 Pregnant women: all households.
Taking into account the design used in the sampling of homes, the sample is self-compensating since eachhome had the same possibility of being included in the sample = 1/3.5. The estimates of totals of any variableare calculated according to the formula: x’ = x. 1/P
Field sampling:
The selection of homes was undertaken in a single stage. The sampling’s universe was 7,838 homes. Theuniverse of children between 9 and 24 months was 1,088. Applying the sampling fraction of 1/3.5 homes,2,209 homes were selected, in which some 306 subjects of 9 to 24 months should be found.
This sampling criteria was applied in each census unit, starting with the Unit 1 of the Fraction 04 with arandom starting point and a fixed interval of 3.5 until the radius 20 of the final Fraction (05) was completed.
The household sampling began in September 1993 for the first 17 census units; it was suspended during thesummer school vacation and was restarted in March 1994 for the remaining units.
Between the time of the National Population and Household Census of 1991 and the time the survey wasundertaken, the city of Ushuaia expanded significantly, with notable growth in its population, in the numberof homes and with internal redistribution among the different census units. As a consequence, in the unitssampled, 517 more homes were found , signifying a relative increment of 6.6%.
A count of homes in each census unit showed a universe of 10,098 homes of which 2,917 were selected.Eliminating those that were not in use as residences and those permanently vacant, 2,416 occupied familyhomes remained, which constituted the total selection.
According to the 1991 Census figures, the percentage of homes in the city of Ushuaia “with non-residentialuse” was 1.6% and that of homes under construction was 3.0%. This proportion was considered irrelevantfor the purposes of the sampling, and buildings were counted independent of their use (commercial orresidential) and of the proof that they were permanently vacant. In the analysis of the final figures of thehousehold sampling it was shown that the percentage of homes used for non-residential purposes and homespermanently vacant was much higher than had been anticipated, together representing 17% of the total. Thecombination of these two factors — the increase in the total number of homes and a lower proportion ofoccupied homes — resulted in a net difference of 12.4% in the number of 9 to 24-month-old childrenactually located (268) with respect to the 306 children expected.
The overall effect on the validity of the survey is nil as it resultsequivalent to the application of a global sampling fraction of 1/4.1homes instead of 1/3.5
Of the total of 2,416 occupied family homes selected, some 1,447(59.9%) housed a subject belonging to the age groups required bythe survey, that is children between 9 months and 18 years, 11months and 29 days or pregnant women. The results in theremaining homes were distributed according to the following: in324 (13.4%) the occupants weren’t found during three visits ondifferent days and at different times; in 629 (26.0%) there were nosubjects of the required ages; and in 16 (0.7%) the family refused toparticipate in the survey.
The number of subjects selected in the different age groups are shown in the following table:
In all groups, except pregnant women, an adequate sample size was obtained (90% to 97% of the estimatein the survey design).
Materials and Methods used in the survey
The sampling of households was undertaken in three rounds with a minimum interval of one week betweeneach round. In the first round, the home was selected and the family invited to participate in the survey. Inthe second round a nutritionist recorded dietary intake and answers to the socio-economic survey and in thethird round a nurse and a dental assistant took body measurements, measured blood pressure, examined theteeth and took blood samples. All the laboratory results were coded for confidentiality and returned to thefamilies within two months from the time the survey was undertaken.
T I E R R A D E L F U E G O P R O J E C T 9 7
Figure 1Household survey.
Table 1Number of subjects
selected according tobiological groups.
9-24 m Pre--school School Adolescent Pregnant Man Women Total
268 306 294 281 124 149 143 1,565
TOTALHOUSEHOLD
7338
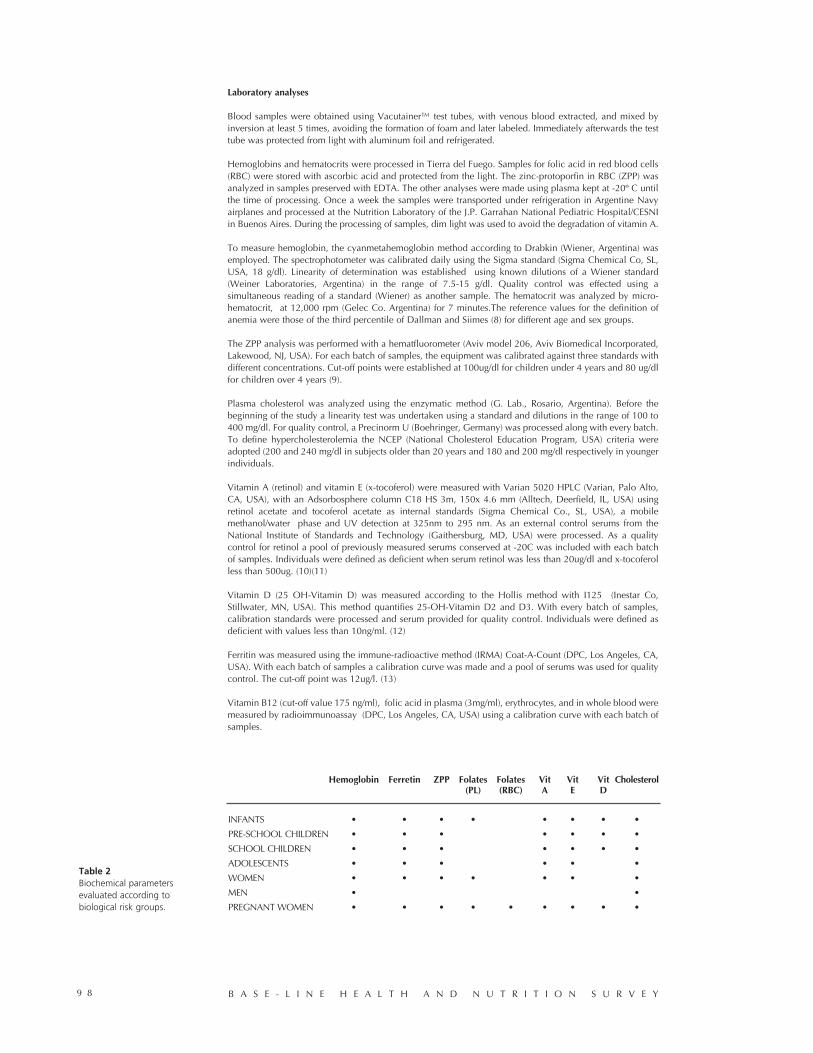
Laboratory analyses
Blood samples were obtained using Vacutainer™ test tubes, with venous blood extracted, and mixed byinversion at least 5 times, avoiding the formation of foam and later labeled. Immediately afterwards the testtube was protected from light with aluminum foil and refrigerated.
Hemoglobins and hematocrits were processed in Tierra del Fuego. Samples for folic acid in red blood cells(RBC) were stored with ascorbic acid and protected from the light. The zinc-protoporfin in RBC (ZPP) wasanalyzed in samples preserved with EDTA. The other analyses were made using plasma kept at -20º C untilthe time of processing. Once a week the samples were transported under refrigeration in Argentine Navyairplanes and processed at the Nutrition Laboratory of the J.P. Garrahan National Pediatric Hospital/CESNIin Buenos Aires. During the processing of samples, dim light was used to avoid the degradation of vitamin A.
To measure hemoglobin, the cyanmetahemoglobin method according to Drabkin (Wiener, Argentina) wasemployed. The spectrophotometer was calibrated daily using the Sigma standard (Sigma Chemical Co, SL,USA, 18 g/dl). Linearity of determination was established using known dilutions of a Wiener standard(Weiner Laboratories, Argentina) in the range of 7.5-15 g/dl. Quality control was effected using asimultaneous reading of a standard (Wiener) as another sample. The hematocrit was analyzed by micro-hematocrit, at 12,000 rpm (Gelec Co. Argentina) for 7 minutes.The reference values for the definition ofanemia were those of the third percentile of Dallman and Siimes (8) for different age and sex groups.
The ZPP analysis was performed with a hematfluorometer (Aviv model 206, Aviv Biomedical Incorporated,Lakewood, NJ, USA). For each batch of samples, the equipment was calibrated against three standards withdifferent concentrations. Cut-off points were established at 100ug/dl for children under 4 years and 80 ug/dlfor children over 4 years (9).
Plasma cholesterol was analyzed using the enzymatic method (G. Lab., Rosario, Argentina). Before thebeginning of the study a linearity test was undertaken using a standard and dilutions in the range of 100 to400 mg/dl. For quality control, a Precinorm U (Boehringer, Germany) was processed along with every batch.To define hypercholesterolemia the NCEP (National Cholesterol Education Program, USA) criteria wereadopted (200 and 240 mg/dl in subjects older than 20 years and 180 and 200 mg/dl respectively in youngerindividuals.
Vitamin A (retinol) and vitamin E (x-tocoferol) were measured with Varian 5020 HPLC (Varian, Palo Alto,CA, USA), with an Adsorbosphere column C18 HS 3m, 150x 4.6 mm (Alltech, Deerfield, IL, USA) usingretinol acetate and tocoferol acetate as internal standards (Sigma Chemical Co., SL, USA), a mobilemethanol/water phase and UV detection at 325nm to 295 nm. As an external control serums from theNational Institute of Standards and Technology (Gaithersburg, MD, USA) were processed. As a qualitycontrol for retinol a pool of previously measured serums conserved at -20C was included with each batchof samples. Individuals were defined as deficient when serum retinol was less than 20ug/dl and x-tocoferolless than 500ug. (10)(11)
Vitamin D (25 OH-Vitamin D) was measured according to the Hollis method with I125 (Inestar Co,Stillwater, MN, USA). This method quantifies 25-OH-Vitamin D2 and D3. With every batch of samples,calibration standards were processed and serum provided for quality control. Individuals were defined asdeficient with values less than 10ng/ml. (12)
Ferritin was measured using the immune-radioactive method (IRMA) Coat-A-Count (DPC, Los Angeles, CA,USA). With each batch of samples a calibration curve was made and a pool of serums was used for qualitycontrol. The cut-off point was 12ug/l. (13)
Vitamin B12 (cut-off value 175 ng/ml), folic acid in plasma (3mg/ml), erythrocytes, and in whole blood weremeasured by radioimmunoassay (DPC, Los Angeles, CA, USA) using a calibration curve with each batch ofsamples.
B A S E - L I N E H E A L T H A N D N U T R I T I O N S U R V E Y9 8
Table 2Biochemical parametersevaluated according tobiological risk groups.
Hemoglobin Ferretin ZPP Folates Folates Vit Vit Vit Cholesterol(PL) (RBC) A E D
INFANTS • • • • • • • •
PRE-SCHOOL CHILDREN • • • • • • •
SCHOOL CHILDREN • • • • • • •
ADOLESCENTS • • • • • •
WOMEN • • • • • • •
MEN • •
PREGNANT WOMEN • • • • • • • • •

Quality control of biochemical procedures
With every batch a sample of known values was simultaneously processed,establishing as a confidence criteria a confidence limit of 95%. None of the batcheshad to be processed twice. Graphs of quality control corresponding to hemoglobin,cholesterol, and retinol are shown.
Dietary survey
Four dietitians were trained in dietary survey methods. Criteria were unified throughsupervised interviews until concordance was reached in the identification of foodsand estimation of portion sizes.
The dietary survey consisted of a 24-hour recall helped by food models to estimateportion sizes and quantities. When needed, factory and school menus wereexamined so that the ingredients of meals could be determined. The samples werecodified locally and the field team gave consistency to the information, unifyingcriteria as the survey was carried out. The foods reported were translated intonutrients using an ad-hoc computer program (Programa de Encuestas AlimentariasCESNI, version 3.0), based on the chemical composition of local foods as compiledthrough many years by CESNI.(14)
Socio-economic Level Survey
Information was collected concerning different social, educational and housingcharacteristics, in order to classify members of the population under study, accordingto a trustworthy definition of social and economic level (SEL).
Different indicators were selected by the following criteria: 1)Basic indicators used bythe INDEC (National Institute of Statistics and Census, Argentina) in the 1991National Population and Housing Census and in the Encuesta Permanente de Hogares(Continued Household Information Systems. INDEC), which will eventually allow acomparison to be made with other regions of the country using similar instruments.2) Duly validated indicators used by CESNI in other population studies(3). 3) Indicatorssuggested by the Tierra del Fuego Ministry of Health, taking into account their localdiscriminating value.
With these indicators, four variables were built:1) Level of education attained2) Socio-occupational condition3) Quality of housing4) People per room (crowding index)
The weight of each of these indicators and their prevalence in the sample of families in the population ofUshuaia is summarized in the following table:
T I E R R A D E L F U E G O P R O J E C T 9 9
Figure 2Quality control
of laboratory analysis.
Table 3Classification by
socio-economic level.
VARIABLE
I. Education
INDICATORS
Level ofinstructioncompleted by thehead of family orpartner.
CATEGORIES
Completed University
Attended University
Completed Tertiary Studies
Attended Tertiary
Completed High School
Attended High School
Completed Elementary School
Attended Elementary School
Never Attended
PREVALENCE (%)
8.7
11.4
27.2
29.3
17.8
0.1
0
0
SCORE
12
10
9
9
6
3
1
0
CHOLESTEROL
HEMOGLOBIN
RETINOL
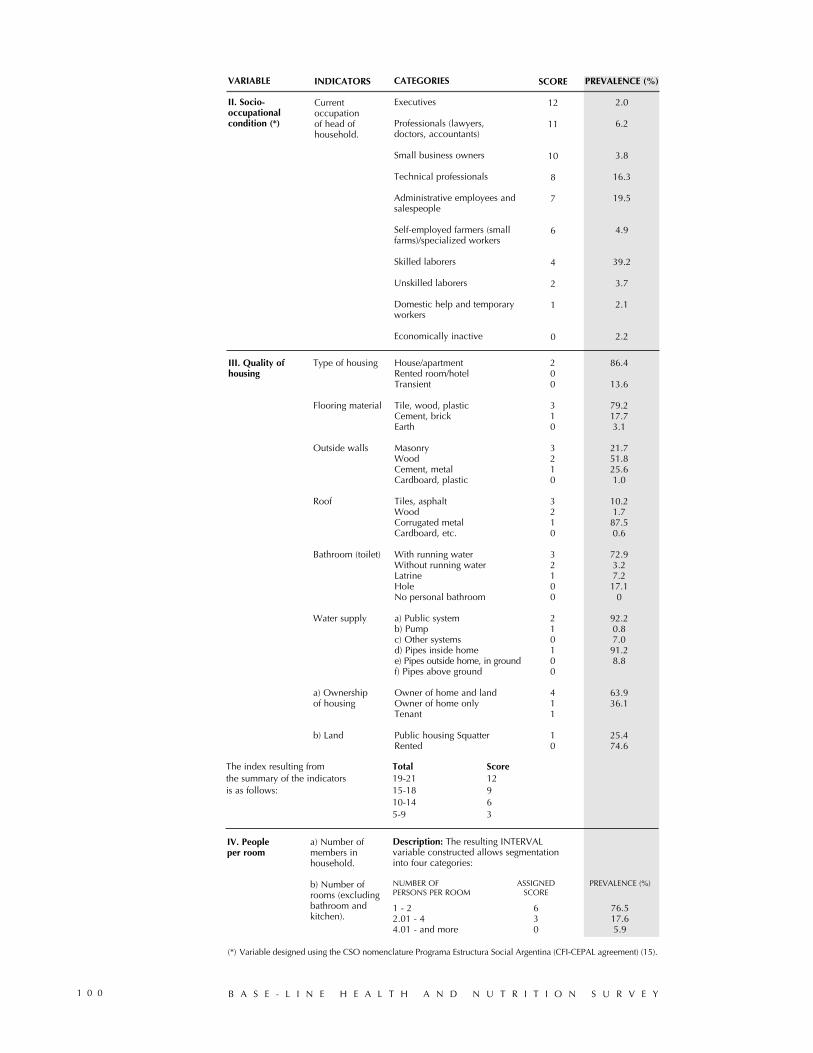
B A S E - L I N E H E A L T H A N D N U T R I T I O N S U R V E Y1 0 0
VARIABLE
II. Socio-occupationalcondition (*)
INDICATORS
Currentoccupationof head ofhousehold.
CATEGORIES
Executives
Professionals (lawyers,doctors, accountants)
Small business owners
Technical professionals
Administrative employees andsalespeople
Self-employed farmers (smallfarms)/specialized workers
Skilled laborers
Unskilled laborers
Domestic help and temporaryworkers
Economically inactive
PREVALENCE (%)
2.0
6.2
3.8
16.3
19.5
4.9
39.2
3.7
2.1
2.2
SCORE
12
11
10
8
7
6
4
2
1
0
House/apartmentRented room/hotelTransient
Tile, wood, plasticCement, brickEarth
MasonryWoodCement, metalCardboard, plastic
Tiles, asphaltWoodCorrugated metalCardboard, etc.
With running waterWithout running waterLatrineHoleNo personal bathroom
a) Public systemb) Pumpc) Other systemsd) Pipes inside homee) Pipes outside home, in groundf) Pipes above ground
Owner of home and landOwner of home onlyTenant
Public housing SquatterRented
200
310
3210
3210
32100
210100
411
10
III. Quality ofhousing
Type of housing
Flooring material
Outside walls
Roof
Bathroom (toilet)
Water supply
a) Ownershipof housing
b) Land
86.4
13.6
79.217.73.1
21.751.825.61.0
10.21.787.50.6
72.93.27.217.1
0
92.20.87.091.28.8
63.936.1
25.474.6
The index resulting fromthe summary of the indicatorsis as follows:
Total Score19-21 1215-18 910-14 65-9 3
IV. Peopleper room
a) Number ofmembers inhousehold.
b) Number ofrooms (excludingbathroom andkitchen).
Description: The resulting INTERVALvariable constructed allows segmentationinto four categories:
NUMBER OF ASSIGNED PREVALENCE (%)PERSONS PER ROOM SCORE
1 - 2 6 76.52.01 - 4 3 17.64.01 - and more 0 5.9
(*) Variable designed using the CSO nomenclature Programa Estructura Social Argentina (CFI-CEPAL agreement) (15).
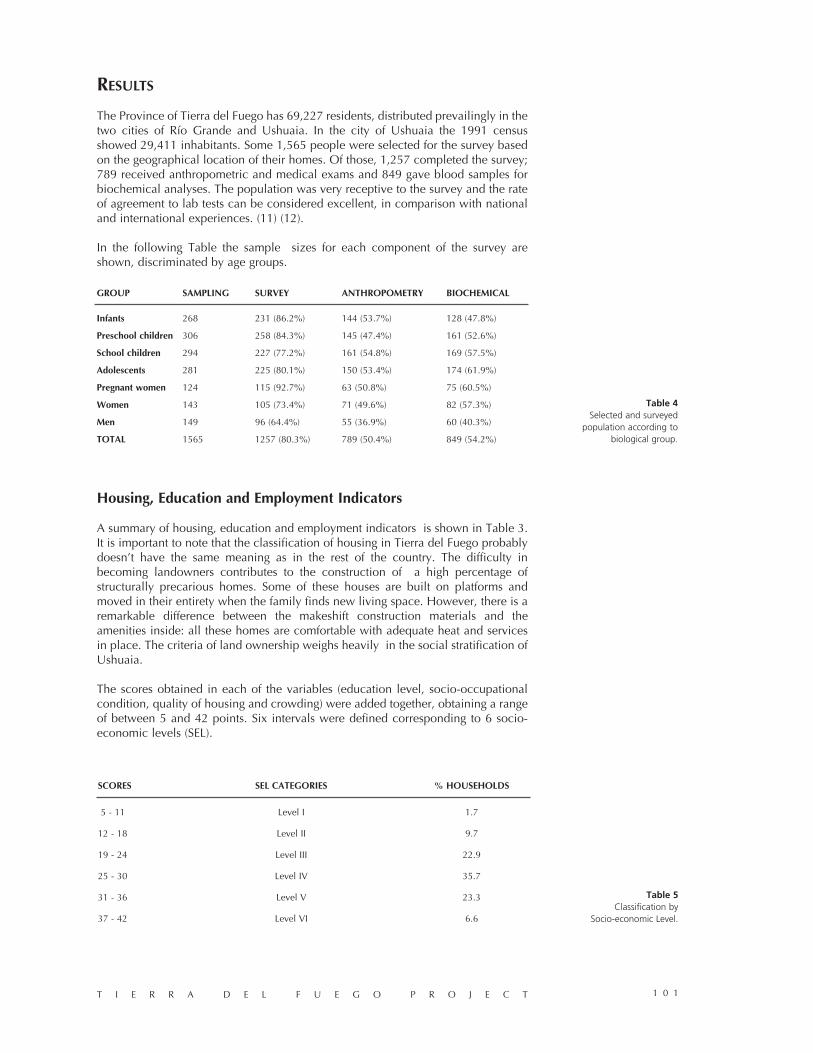
RESULTS
The Province of Tierra del Fuego has 69,227 residents, distributed prevailingly in thetwo cities of Río Grande and Ushuaia. In the city of Ushuaia the 1991 censusshowed 29,411 inhabitants. Some 1,565 people were selected for the survey basedon the geographical location of their homes. Of those, 1,257 completed the survey;789 received anthropometric and medical exams and 849 gave blood samples forbiochemical analyses. The population was very receptive to the survey and the rateof agreement to lab tests can be considered excellent, in comparison with nationaland international experiences. (11) (12).
In the following Table the sample sizes for each component of the survey areshown, discriminated by age groups.
Housing, Education and Employment Indicators
A summary of housing, education and employment indicators is shown in Table 3.It is important to note that the classification of housing in Tierra del Fuego probablydoesn’t have the same meaning as in the rest of the country. The difficulty inbecoming landowners contributes to the construction of a high percentage ofstructurally precarious homes. Some of these houses are built on platforms andmoved in their entirety when the family finds new living space. However, there is aremarkable difference between the makeshift construction materials and theamenities inside: all these homes are comfortable with adequate heat and servicesin place. The criteria of land ownership weighs heavily in the social stratification ofUshuaia.
The scores obtained in each of the variables (education level, socio-occupationalcondition, quality of housing and crowding) were added together, obtaining a rangeof between 5 and 42 points. Six intervals were defined corresponding to 6 socio-economic levels (SEL).
T I E R R A D E L F U E G O P R O J E C T 1 0 1
SCORES SEL CATEGORIES % HOUSEHOLDS
5 - 11 Level I 1.7
12 - 18 Level II 9.7
19 - 24 Level III 22.9
25 - 30 Level IV 35.7
31 - 36 Level V 23.3
37 - 42 Level VI 6.6
Table 5Classification by
Socio-economic Level.
GROUP SAMPLING SURVEY ANTHROPOMETRY BIOCHEMICAL
Infants 268 231 (86.2%) 144 (53.7%) 128 (47.8%)
Preschool children 306 258 (84.3%) 145 (47.4%) 161 (52.6%)
School children 294 227 (77.2%) 161 (54.8%) 169 (57.5%)
Adolescents 281 225 (80.1%) 150 (53.4%) 174 (61.9%)
Pregnant women 124 115 (92.7%) 63 (50.8%) 75 (60.5%)
Women 143 105 (73.4%) 71 (49.6%) 82 (57.3%)
Men 149 96 (64.4%) 55 (36.9%) 60 (40.3%)
TOTAL 1565 1257 (80.3%) 789 (50.4%) 849 (54.2%)
Table 4Selected and surveyed
population according tobiological group.
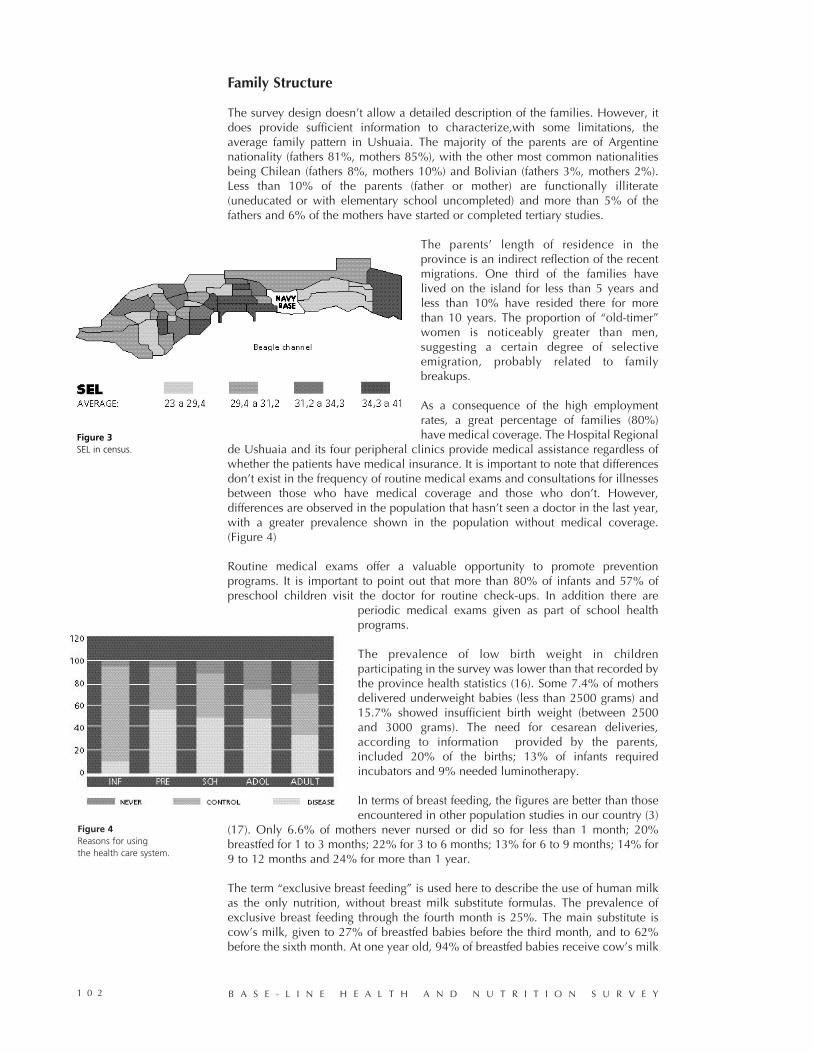
Family Structure
The survey design doesn’t allow a detailed description of the families. However, itdoes provide sufficient information to characterize,with some limitations, theaverage family pattern in Ushuaia. The majority of the parents are of Argentinenationality (fathers 81%, mothers 85%), with the other most common nationalitiesbeing Chilean (fathers 8%, mothers 10%) and Bolivian (fathers 3%, mothers 2%).Less than 10% of the parents (father or mother) are functionally illiterate(uneducated or with elementary school uncompleted) and more than 5% of thefathers and 6% of the mothers have started or completed tertiary studies.
The parents’ length of residence in theprovince is an indirect reflection of the recentmigrations. One third of the families havelived on the island for less than 5 years andless than 10% have resided there for morethan 10 years. The proportion of “old-timer”women is noticeably greater than men,suggesting a certain degree of selectiveemigration, probably related to familybreakups.
As a consequence of the high employmentrates, a great percentage of families (80%)have medical coverage. The Hospital Regional
de Ushuaia and its four peripheral clinics provide medical assistance regardless ofwhether the patients have medical insurance. It is important to note that differencesdon’t exist in the frequency of routine medical exams and consultations for illnessesbetween those who have medical coverage and those who don’t. However,differences are observed in the population that hasn’t seen a doctor in the last year,with a greater prevalence shown in the population without medical coverage.(Figure 4)
Routine medical exams offer a valuable opportunity to promote preventionprograms. It is important to point out that more than 80% of infants and 57% ofpreschool children visit the doctor for routine check-ups. In addition there are
periodic medical exams given as part of school healthprograms.
The prevalence of low birth weight in childrenparticipating in the survey was lower than that recorded bythe province health statistics (16). Some 7.4% of mothersdelivered underweight babies (less than 2500 grams) and15.7% showed insufficient birth weight (between 2500and 3000 grams). The need for cesarean deliveries,according to information provided by the parents,included 20% of the births; 13% of infants requiredincubators and 9% needed luminotherapy.
In terms of breast feeding, the figures are better than thoseencountered in other population studies in our country (3)
(17). Only 6.6% of mothers never nursed or did so for less than 1 month; 20%breastfed for 1 to 3 months; 22% for 3 to 6 months; 13% for 6 to 9 months; 14% for9 to 12 months and 24% for more than 1 year.
The term “exclusive breast feeding” is used here to describe the use of human milkas the only nutrition, without breast milk substitute formulas. The prevalence ofexclusive breast feeding through the fourth month is 25%. The main substitute iscow’s milk, given to 27% of breastfed babies before the third month, and to 62%before the sixth month. At one year old, 94% of breastfed babies receive cow’s milk
B A S E - L I N E H E A L T H A N D N U T R I T I O N S U R V E Y1 0 2
Figure 4Reasons for usingthe health care system.
Figure 3SEL in census.

(liquid or in powder form). This feeding pattern, similar to that found in the rest ofthe country, makes cow’s milk an ideal vehicle for micro nutrient fortification.
The length of time mothers breastfeed exclusively differed according to the socio-economic level. In the lower SEL nursing took place for 2.63+ 2.27 months while inthe higher SEL mothers nursed for 3.81+ 2.22 months (p<0.01). The prevalence ofmothers who breastfed for less than 3 months was 65.7% in the lowest level (SELcategories 1 and 2) and 61.4% in the middle-low (level 3) and 57.3% in the middle-high level ( 4) and 41.3% in the highest levels (5 and 6) (p<0.001). It is important topoint out that it wasn’t possible to statistically relate any of the indicators of socio-economic level with the risk of insufficient nursing.
The percentage of breast feeding for less than 3 months was greater in mothers whodon’t recognize doctors as one of the principal sources of information about health(p<0.01). It can so be inferred that health care personnel, especially doctors, wouldmake an efficient vehicle to promote breast feeding. Some 66% of mothers havestable jobs outside the home, but neither the prevalence of breast feeding nor thelength of time mothers breastfeed were different for those who work outside thehome and those who don’t. Among mothers who have stable employment there isgreater risk of insufficient breast feeding, e.g. less than 3 months.(p<0.05)
Knowledge of the factors related to nursing patterns is important for the design ofsuccessful programs to promote breast feeding. The data provided by the surveysuggests that educational campaigns should be concentrated in the lower socio-economic levels, regardless of the mothers’ employment conditions, and that thehealth team could be an appropriate channel to convey this information. It isinteresting to note that only 39% of pregnant women surveyed had receivedinformation about breast feeding.
The pattern of child care is, of course, an important issue for the strategies to beemployed in infant stimulation and nutritional fortification. According to the parentssurveyed, less than 11% of children less than 2 years old are regularly sent todaycare, while 60% of preschool children spend more than 4 hours per day indaycare centers. Some 90% of the children who attend daycare receive some kindof meal -breakfast, lunch or substantial snack- providing an optimal opportunity forfortification programs. It is likely that these figures provided by the parents don’trepresent the real situation of child care in Ushuaia, since discrepancies existbetween the amount of leave new mothers are given from work and the low rate ofchildren sent to child care. It is likely that other informal forms of child care are inuse (maids, other families, etc.) which aren’t registered like daycare centers norrecognized as such by parents. The correct identification of such forms of child careis indispensable for planning the stimulation activities.
The sources which parents considered most reliablefor health-related information affecting the care ofchildren under 6 years was also studied. Doctors, butnot other members of the health team, were named asthe principal source of information, especially forinfants. Relatives provide an equal proportion of childrearing information. Books, magazines and televisionwere perceived as an important scource of informationby 10-20% of parents, while the radio -which is theprincipal media on the island- isn’t considered by theparents as a source of health information.
Anthropometric Indicators
The percentile distribution of the weight/age, height/age, weight/height indicatorsare shown in figure 6.
T I E R R A D E L F U E G O P R O J E C T 1 0 3
SOURCES OFINFORMATION
Figure 5Sources of child care
information as recognizedby parents.

The height/age indicator, in general terms, corresponds with the referencepopulation (Goodness of fit x2=p<0.42.). Some 13.2% of infants, 14.4% of thepreschool children, 12.3% of school children, and 21.7% of adolescents grewbelow the tenth percentile.Acknowledging the limitations of a transversal analysis, it is possible to differentiatethe growth pattern of adolescents from the growth patterns of infants and children
(Figure 7). Adolescents show a greater prevalence ofchronic growth retardation than the smallest children.Given the short length of residence in the province forthe majority of families in Ushuaia, it can be speculatedthat height differences in adolescents reflect the differentenvironments from which they came. Supporting thisassumption, shorter adolescents tend to belong tofamilies of lower socio-economic levels (p<0.02), lowereducational levels (p<0.01) or birth weight of less than2500 grams (p<0.05). As a corollary to this inference, itcould be said that the health and nutritional conditionsof these families has changed favorably since theirarrival in Tierra del Fuego, thereby avoiding growthretardation in those children born on the island.
Overweight and Obesity
Overweight is defined as an increase in total body weight above a cut-off value,whether this be expressed as an absolute value for the age, or as a percentage of thetheoretic weight relative to the age, or as body mass index (BMI) (weight divided bythe square of height). Obesity is considered as an increase in the proportion of bodyfat. In the context of the work both obesity and overweight are referred to withoutdistinction as body composition was not measured A person is considered to be inrisk of obesity when, because of their weight and height, it is probable that he or she
B A S E - L I N E H E A L T H A N D N U T R I T I O N S U R V E Y1 0 4
Figure 7Growth retardation.
Figure 6Percentile distribution ofthe weight / age, height / age,weight / height indicators.
GROWTH RETARDATION
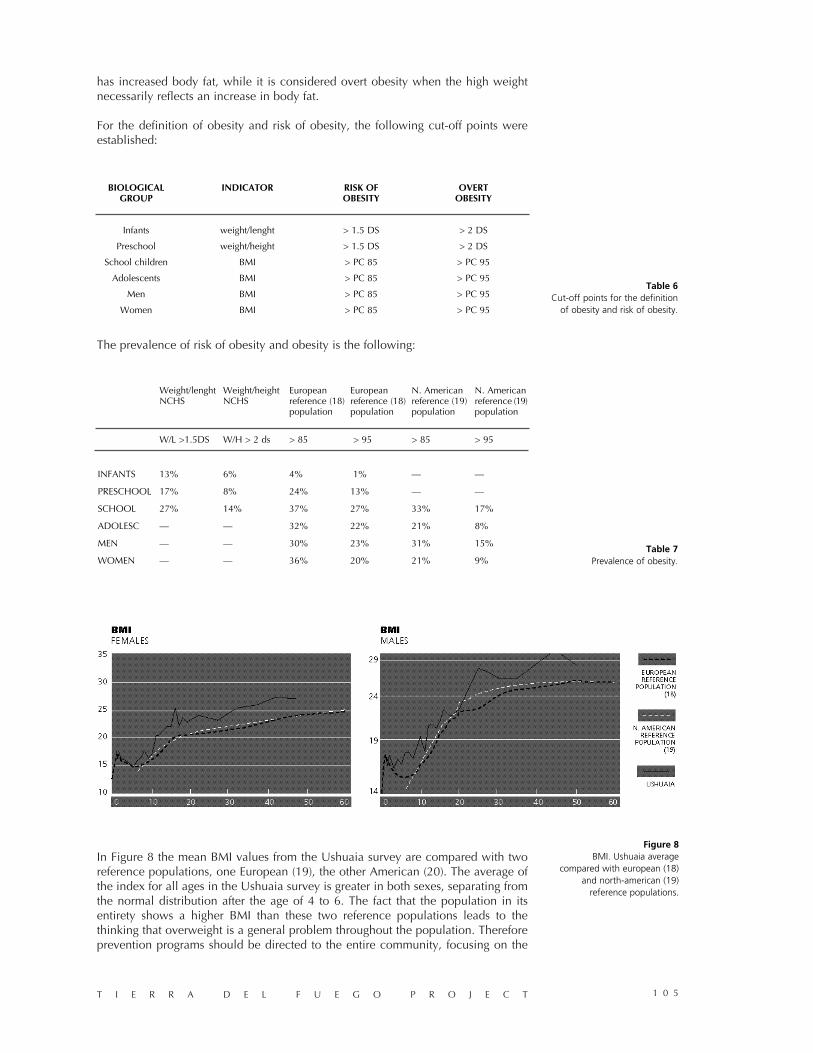
has increased body fat, while it is considered overt obesity when the high weightnecessarily reflects an increase in body fat.
For the definition of obesity and risk of obesity, the following cut-off points wereestablished:
The prevalence of risk of obesity and obesity is the following:
In Figure 8 the mean BMI values from the Ushuaia survey are compared with tworeference populations, one European (19), the other American (20). The average ofthe index for all ages in the Ushuaia survey is greater in both sexes, separating fromthe normal distribution after the age of 4 to 6. The fact that the population in itsentirety shows a higher BMI than these two reference populations leads to thethinking that overweight is a general problem throughout the population. Thereforeprevention programs should be directed to the entire community, focusing on the
T I E R R A D E L F U E G O P R O J E C T 1 0 5
Figure 8BMI. Ushuaia average
compared with european (18)and north-american (19)
reference populations.
BIOLOGICAL INDICATOR RISK OF OVERTGROUP OBESITY OBESITY
Infants weight/lenght > 1.5 DS > 2 DS
Preschool weight/height > 1.5 DS > 2 DS
School children BMI > PC 85 > PC 95
Adolescents BMI > PC 85 > PC 95
Men BMI > PC 85 > PC 95
Women BMI > PC 85 > PC 95
Weight/lenght Weight/height European European N. American N. AmericanNCHS NCHS reference (18) reference (18) reference (19) reference (19)
population population population population
W/L >1.5DS W/H > 2 ds > 85 > 95 > 85 > 95
INFANTS 13% 6% 4% 1% — —
PRESCHOOL 17% 8% 24% 13% — —
SCHOOL 27% 14% 37% 27% 33% 17%
ADOLESC — — 32% 22% 21% 8%
MEN — — 30% 23% 31% 15%
WOMEN — — 36% 20% 21% 9%
Table 6Cut-off points for the definition
of obesity and risk of obesity.
Table 7Prevalence of obesity.
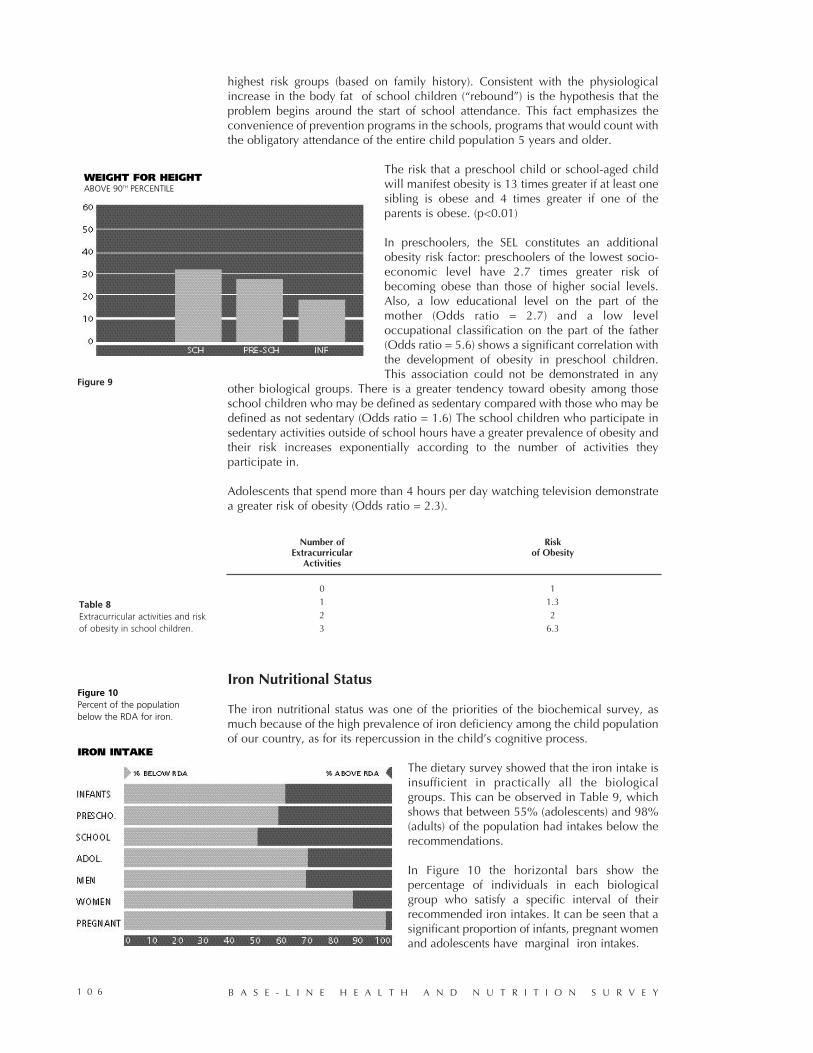
highest risk groups (based on family history). Consistent with the physiologicalincrease in the body fat of school children (“rebound”) is the hypothesis that theproblem begins around the start of school attendance. This fact emphasizes theconvenience of prevention programs in the schools, programs that would count withthe obligatory attendance of the entire child population 5 years and older.
The risk that a preschool child or school-aged childwill manifest obesity is 13 times greater if at least onesibling is obese and 4 times greater if one of theparents is obese. (p<0.01)
In preschoolers, the SEL constitutes an additionalobesity risk factor: preschoolers of the lowest socio-economic level have 2.7 times greater risk ofbecoming obese than those of higher social levels.Also, a low educational level on the part of themother (Odds ratio = 2.7) and a low leveloccupational classification on the part of the father(Odds ratio = 5.6) shows a significant correlation withthe development of obesity in preschool children.This association could not be demonstrated in any
other biological groups. There is a greater tendency toward obesity among thoseschool children who may be defined as sedentary compared with those who may bedefined as not sedentary (Odds ratio = 1.6) The school children who participate insedentary activities outside of school hours have a greater prevalence of obesity andtheir risk increases exponentially according to the number of activities theyparticipate in.
Adolescents that spend more than 4 hours per day watching television demonstratea greater risk of obesity (Odds ratio = 2.3).
Iron Nutritional Status
The iron nutritional status was one of the priorities of the biochemical survey, asmuch because of the high prevalence of iron deficiency among the child populationof our country, as for its repercussion in the child’s cognitive process.
The dietary survey showed that the iron intake isinsufficient in practically all the biologicalgroups. This can be observed in Table 9, whichshows that between 55% (adolescents) and 98%(adults) of the population had intakes below therecommendations.
In Figure 10 the horizontal bars show thepercentage of individuals in each biologicalgroup who satisfy a specific interval of theirrecommended iron intakes. It can be seen that asignificant proportion of infants, pregnant womenand adolescents have marginal iron intakes.
B A S E - L I N E H E A L T H A N D N U T R I T I O N S U R V E Y1 0 6
Figure 9
Table 8Extracurricular activities and riskof obesity in school children.
Number of RiskExtracurricular of Obesity
Activities
0 11 1.32 23 6.3
Figure 10Percent of the populationbelow the RDA for iron.
WEIGHT FOR HEIGHTABOVE 90TH PERCENTILE
IRON INTAKE
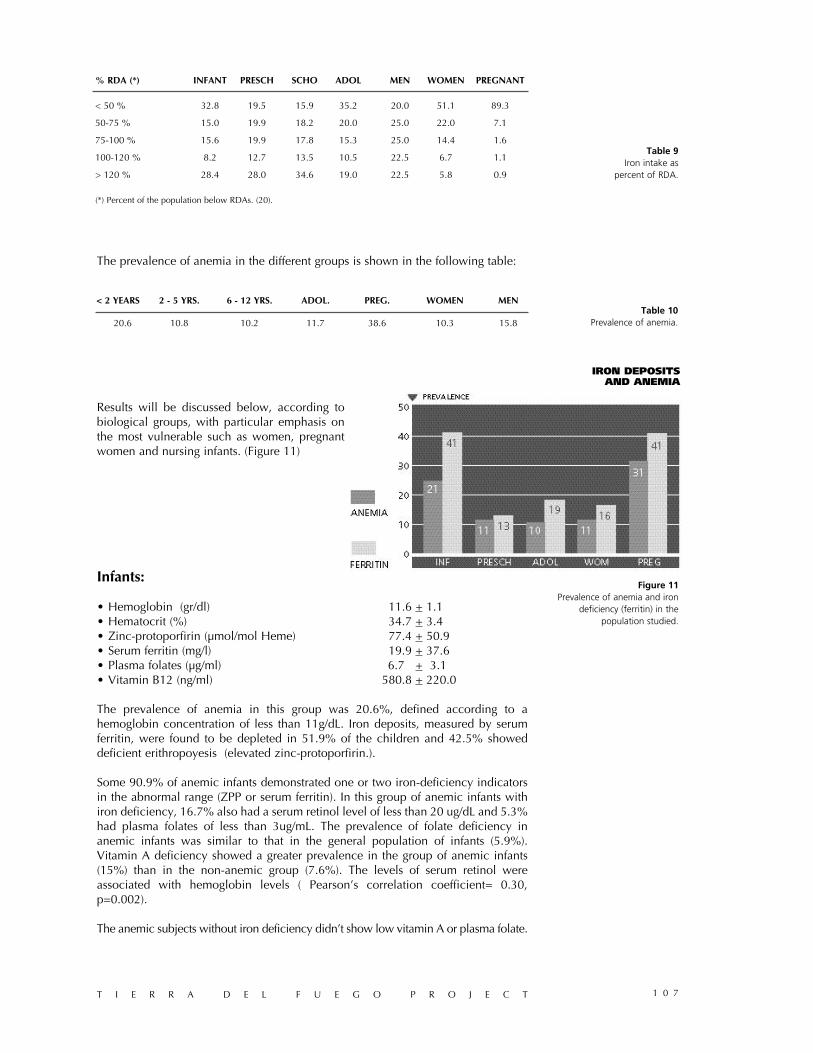
The prevalence of anemia in the different groups is shown in the following table:
Results will be discussed below, according tobiological groups, with particular emphasis onthe most vulnerable such as women, pregnantwomen and nursing infants. (Figure 11)
Infants:
• Hemoglobin (gr/dl) 11.6 + 1.1• Hematocrit (%) 34.7 + 3.4• Zinc-protoporfirin (µmol/mol Heme) 77.4 + 50.9• Serum ferritin (mg/l) 19.9 + 37.6• Plasma folates (µg/ml) 6.7 + 3.1• Vitamin B12 (ng/ml) 580.8 + 220.0
The prevalence of anemia in this group was 20.6%, defined according to ahemoglobin concentration of less than 11g/dL. Iron deposits, measured by serumferritin, were found to be depleted in 51.9% of the children and 42.5% showeddeficient erithropoyesis (elevated zinc-protoporfirin.).
Some 90.9% of anemic infants demonstrated one or two iron-deficiency indicatorsin the abnormal range (ZPP or serum ferritin). In this group of anemic infants withiron deficiency, 16.7% also had a serum retinol level of less than 20 ug/dL and 5.3%had plasma folates of less than 3ug/mL. The prevalence of folate deficiency inanemic infants was similar to that in the general population of infants (5.9%).Vitamin A deficiency showed a greater prevalence in the group of anemic infants(15%) than in the non-anemic group (7.6%). The levels of serum retinol wereassociated with hemoglobin levels ( Pearson’s correlation coefficient= 0.30,p=0.002).
The anemic subjects without iron deficiency didn’t show low vitamin A or plasma folate.
T I E R R A D E L F U E G O P R O J E C T 1 0 7
Table 9Iron intake as
percent of RDA.
Table 10Prevalence of anemia.
< 2 YEARS 2 - 5 YRS. 6 - 12 YRS. ADOL. PREG. WOMEN MEN
20.6 10.8 10.2 11.7 38.6 10.3 15.8
% RDA (*) INFANT PRESCH SCHO ADOL MEN WOMEN PREGNANT
< 50 % 32.8 19.5 15.9 35.2 20.0 51.1 89.3
50-75 % 15.0 19.9 18.2 20.0 25.0 22.0 7.1
75-100 % 15.6 19.9 17.8 15.3 25.0 14.4 1.6
100-120 % 8.2 12.7 13.5 10.5 22.5 6.7 1.1
> 120 % 28.4 28.0 34.6 19.0 22.5 5.8 0.9
(*) Percent of the population below RDAs. (20).
IRON DEPOSITSAND ANEMIA
Figure 11Prevalence of anemia and iron
deficiency (ferritin) in thepopulation studied.
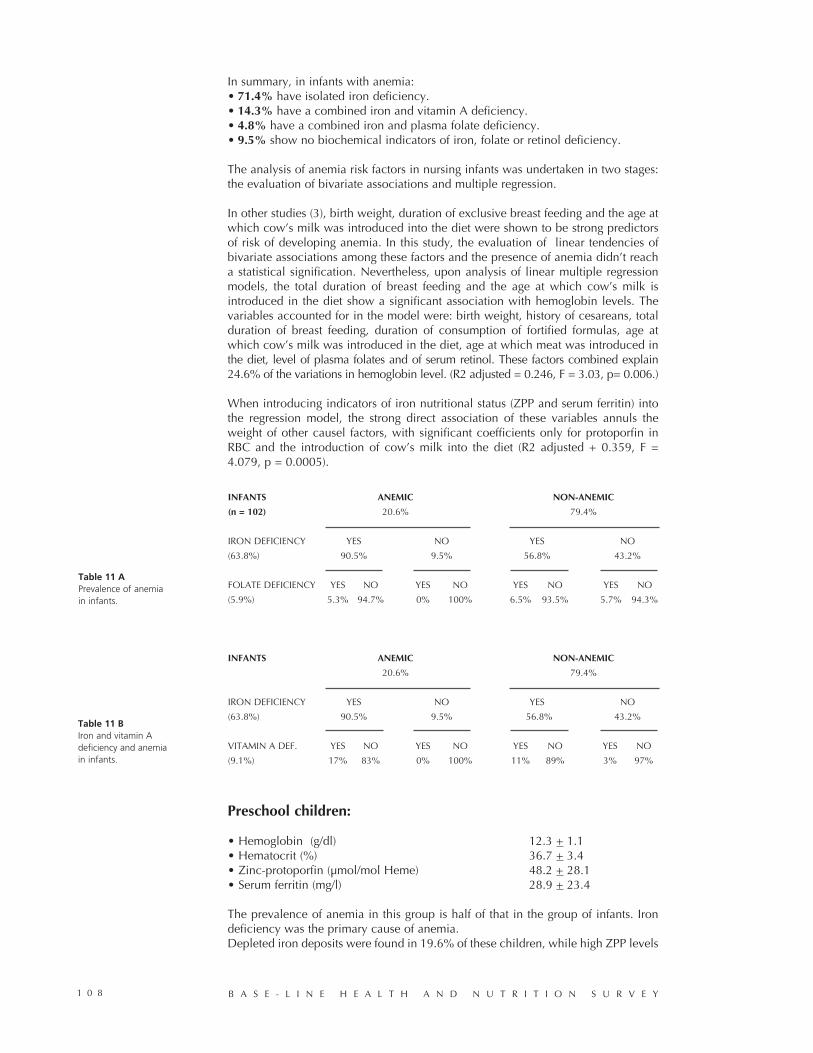
In summary, in infants with anemia:• 71.4% have isolated iron deficiency.• 14.3% have a combined iron and vitamin A deficiency.• 4.8% have a combined iron and plasma folate deficiency.• 9.5% show no biochemical indicators of iron, folate or retinol deficiency.
The analysis of anemia risk factors in nursing infants was undertaken in two stages:the evaluation of bivariate associations and multiple regression.
In other studies (3), birth weight, duration of exclusive breast feeding and the age atwhich cow’s milk was introduced into the diet were shown to be strong predictorsof risk of developing anemia. In this study, the evaluation of linear tendencies ofbivariate associations among these factors and the presence of anemia didn’t reacha statistical signification. Nevertheless, upon analysis of linear multiple regressionmodels, the total duration of breast feeding and the age at which cow’s milk isintroduced in the diet show a significant association with hemoglobin levels. Thevariables accounted for in the model were: birth weight, history of cesareans, totalduration of breast feeding, duration of consumption of fortified formulas, age atwhich cow’s milk was introduced in the diet, age at which meat was introduced inthe diet, level of plasma folates and of serum retinol. These factors combined explain24.6% of the variations in hemoglobin level. (R2 adjusted = 0.246, F = 3.03, p= 0.006.)
When introducing indicators of iron nutritional status (ZPP and serum ferritin) intothe regression model, the strong direct association of these variables annuls theweight of other causel factors, with significant coefficients only for protoporfin inRBC and the introduction of cow’s milk into the diet (R2 adjusted + 0.359, F =4.079, p = 0.0005).
Preschool children:
• Hemoglobin (g/dl) 12.3 + 1.1• Hematocrit (%) 36.7 + 3.4• Zinc-protoporfin (µmol/mol Heme) 48.2 + 28.1• Serum ferritin (mg/l) 28.9 + 23.4
The prevalence of anemia in this group is half of that in the group of infants. Irondeficiency was the primary cause of anemia.Depleted iron deposits were found in 19.6% of these children, while high ZPP levels
B A S E - L I N E H E A L T H A N D N U T R I T I O N S U R V E Y1 0 8
Table 11 APrevalence of anemiain infants.
Table 11 BIron and vitamin Adeficiency and anemiain infants.
INFANTS ANEMIC NON-ANEMIC
(n = 102) 20.6% 79.4%
IRON DEFICIENCY YES NO YES NO
(63.8%) 90.5% 9.5% 56.8% 43.2%
FOLATE DEFICIENCY YES NO YES NO YES NO YES NO
(5.9%) 5.3% 94.7% 0% 100% 6.5% 93.5% 5.7% 94.3%
INFANTS ANEMIC NON-ANEMIC
20.6% 79.4%
IRON DEFICIENCY YES NO YES NO
(63.8%) 90.5% 9.5% 56.8% 43.2%
VITAMIN A DEF. YES NO YES NO YES NO YES NO
(9.1%) 17% 83% 0% 100% 11% 89% 3% 97%
-an indicator of inadequate erithropoyesis- were found in 13.5%. 6.1% of thechildren showed two abnormal indicators of iron nutriture, while 20.9% showedone abnormal indicator. The association of anemia (defined by hemoglobin < Pc3)with different degrees of iron deficiency was highly significant (Pearson 20,9, p =0.00003, Mantel-Haenszel 15,36, p = 0.0009).
School children:
• Hemoglobin (g/dl) 13.00 + 1.01• Hematocrit (%) 38.74 + 3.37• Zinc-protoporfirin (µmol/mol Heme) 39.87 + 17.67
A low prevalence of anemia, similar to that among preschool children, was found inthis group. Some 13.2% of the children showed high levels of protoporfirin in RBC,without an association with the presence of anemia.
Adolescents:
• Hemoglobin (g/dl) 13.58 + 1.17• Hematocrit (%) 41.03 + 3.55• Serum ferritin (mg/l) 41.40 + 32.08• Zinc-protoporfin (µmol/mol Heme) 39.43 + 21.80• Serum retinol 35.36 + 8.30
In this group the presence of anemia was associated with indicators of abnormal ironnutrition (Mantel-Hanszel for linear association 11.06, p = 0.0009). Low serumferritin levels were registered in 11% of the children and high ZPP in RBC was foundin 12.8%.
Women in childbearing age:
• Hemoglobin (g/dl) 13.25 + 1.21• Hematocrit (%) 40.40 + 3.88• Zinc-protoporfin (µmol/mol Heme) 47.56 + 26.51• Serum ferritin (mg/l) 53.03 + 78.06
The prevalence of anemia in this group was associated with indicators of abnormaliron nutritional status(Pearson 23.33, p = 0.00001, Mantel-Haenszel 15.41, p =0.00009). Low serum ferritin was registered in 20.5% of the women and high ZPPin 21.0%. No significant association between iron nutritional status and the age ofthe women was found.
Adult men:
• Hemoglobin (g/dl) 14.89 + 1.09• Hematocrit (%) 44.27 + 3.67• Zinc-protoporfin (mmol/mol Heme) 36.66 + 16.83
The prevalence of anemia in this group was unexpectedly high, although theanemia was mild. Some 10.5% of these subjects showed high ZPP levels.
Given that epidemiological studies undertaken in different populations have nevershown adult men to constitute a risk group, the survey design didn’t intend to seekout in this age group a greater number of biochemical parameters that would allowto explain the causes of this high prevalence of anemia. These findings justify a morein-depth study of the factors associated with the iron nutritional status of adult men
T I E R R A D E L F U E G O P R O J E C T 1 0 9

in this population.
Pregnant Women:
• Hemoglobin concentration: 11.60 + 1.69• Hematocrit (%) 35.14 + 5.12• Zinc-protoporfirin (µmol/mol Heme) 51.87 + 23.89• Serum ferritin (mg/l) 25.58 + 23.77• Plasma folates (µg/ml) 3.67 + 2.51• Folates in RBC 282.55 + 183.66• Vitamin B-12 (ng/ml) 322.21 + 177.34• Serum retinol (mg/del) 30.14 + 8.34
The prevalence of anemia among pregnantwomen was 38.6%; 67.6% of anemicpregnant women showed one or twoindicators of iron deficiency in the abnormalrange (ZPP or serum ferritin). The analysis ofthe linear tendency between the presence orabsence of anemia and the presence of 0, 1and 2 indicators of abnormal nutritional ironstatus showed a significant association (X2Pearson = 7.64, p = 0.021; Mantel-Haenszel= 4.97, p = 0.026). At the same time, 65% ofthis group of anemic pregnant women hadplasma folates of less than 3 ug/mL and 20%showed serum retinol levels less than 20ug/dL. The only four subjects whose serumretinol levels were less than 20 ug/dL alsoshowed low plasma folate levels. Among the
anemic pregnant women with normal ZPP and serum ferritin, 42.9% showed lowlevels of plasma folates, but none showed vitamin A deficiency.
The prevalence of low plasma folate in the entire pregnant woman population was45.7%, with 59.2% among the anemic pregnant women versus 37.2% among thenon-anemic. The plasma folate levels showed a positive correlation with thehemoglobin levels (Pearson = 0.478, p = 0.000).The prevalence of vitamin A deficiency in the sub-group of anemic pregnant womenwas 14.8% versus 9.3% in the subgroup of non-anemic pregnant women. However,
B A S E - L I N E H E A L T H A N D N U T R I T I O N S U R V E Y1 1 0
Table 12 AIron and folatedeficiency and anemiain pregnant women.
Table 12 BIron and vitamin Adeficiency and anemiain pregnant women.
PREGNANT WOMEN ANEMIC NON-ANEMIC
(n = 70) 38.6% 61.4%
IRON DEFICIENCY YES NO YES NO
(67.6%) 74.1% 25.9% 62.8% 37.2%
FOLATE DEFICIENCY YES NO YES NO YES NO YES NO
(45.7%) 65% 35% 43% 57% 41% 59% 31% 69%
PREGNANT WOMEN ANEMIC NON-ANEMIC
38.6% 61.4%
IRON DEFICIENCY YES NO YES NO
(67.6%) 74.1% 25.9% 62.8% 37.2%
VITAMIN A DEF. YES NO YES NO YES NO YES NO
(11.4%) 20% 80% 0% 100% 11% 89% 6% 94%
Figure 12Iron, Vitamin B12, plasmaand red cell folates accordingto trimester of pregnancy.
NUTRITIONALANEMIAACCORDING TO TRIMESTEROF PREGNANCY

the association between serum retinol deficiencies and anemia was not statisticallysignificant.
In summary, of the cases of anemia among the group of pregnant women:• 11.1% have an isolated deficiency of plasma folates• 25.9% have an isolated iron deficiency• 33.3% have a combined iron and folates deficiency• 14.8% have a combined iron, folates and vitamin A deficiency.The remaining 14.8% showed no biochemical indicators of deficiencies of any ofthese nutrients.
Vitamin B-12 deficiency had a universalprevalence of 7.1% and was not associated withplasma folate deficiency. The five cases ofVitamin B-12 levels less than 175 ng/mL werefound among non-anemic pregnant women.
The risk factors for anemia in pregnant womenwere analyzed using multiple regressions. Themodel which demonstrated the greatestassociation, explaining 36% of the variation inhemoglobin level, included the followingindependent variables: age, trimester ofpregnancy, number of pregnancies, consumptionof iron supplements during pregnancy, plasmafolates, folates in RBC, ZPP and serum retinol.(R2adjusted = 0.36, F = 4.75, p = 0.0001)
Vitamin A
Very little data exists concerning vitamin A deficiency in Argentina despite the factthat several surveys show that the intake of provitamin A is marginal in large sectorsof the population (21). The survey in Ushuaia shows that younger people comecloser to ingesting the recommended amounts ofvitamin A than older people,despite the fact that the recommended amounts remain quite similar throughout life.This is probably due to the fact that in the early years the consumption of dairyproducts -the principal source of vitamin A for the youngest children- was relativelyhigh. In spite of that,in 18% of infants and 36% of preschool children intake wasless than 75% of the recommended allowances of vitamin A. These age groups areespecially critical given its susceptibility to retinol deficiency and in its relation tothe immune system and morbidity.
Similarly, it can be seen that as age increases, theintake of foods rich in vitamin A decreases.
Of the various methodologies available to study thevitamin A nutritional situation, the concentrationof retinol in plasma was used as indicator.However, because of the equilibrium plasmaretinol maintains with the liver deposits of thevitamin, this indicator is of little value in theindividual identification of deficient individuals,unless the deficiency is severe (less than 10ug/dl).Nevertheless, the study of distribution of retinolfrequencies of the plasma retinol levels remain agood index of the vitamin A situation in acommunity. The limits for plasma retinol have been set at 20ug/dl for population risk and 10 ug/dl for severe
T I E R R A D E L F U E G O P R O J E C T 1 1 1
PROVITAMIN A INTAKE
PLASMA RETINOL
Figure 14Plasma retinol
in biological groups.
Figure 13Percent of the population
not fullfilling the RDAfor provitamin A.
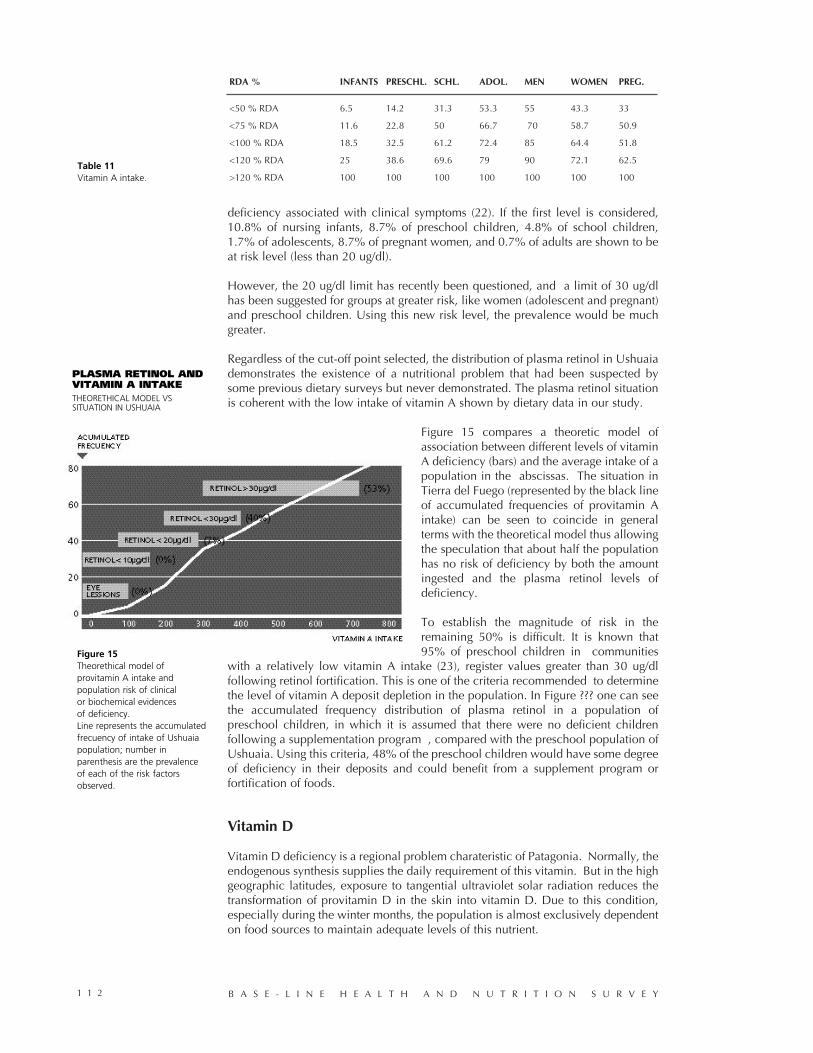
deficiency associated with clinical symptoms (22). If the first level is considered,10.8% of nursing infants, 8.7% of preschool children, 4.8% of school children,1.7% of adolescents, 8.7% of pregnant women, and 0.7% of adults are shown to beat risk level (less than 20 ug/dl).
However, the 20 ug/dl limit has recently been questioned, and a limit of 30 ug/dlhas been suggested for groups at greater risk, like women (adolescent and pregnant)and preschool children. Using this new risk level, the prevalence would be muchgreater.
Regardless of the cut-off point selected, the distribution of plasma retinol in Ushuaiademonstrates the existence of a nutritional problem that had been suspected bysome previous dietary surveys but never demonstrated. The plasma retinol situationis coherent with the low intake of vitamin A shown by dietary data in our study.
Figure 15 compares a theoretic model ofassociation between different levels of vitaminA deficiency (bars) and the average intake of apopulation in the abscissas. The situation inTierra del Fuego (represented by the black lineof accumulated frequencies of provitamin Aintake) can be seen to coincide in generalterms with the theoretical model thus allowingthe speculation that about half the populationhas no risk of deficiency by both the amountingested and the plasma retinol levels ofdeficiency.
To establish the magnitude of risk in theremaining 50% is difficult. It is known that95% of preschool children in communities
with a relatively low vitamin A intake (23), register values greater than 30 ug/dlfollowing retinol fortification. This is one of the criteria recommended to determinethe level of vitamin A deposit depletion in the population. In Figure ??? one can seethe accumulated frequency distribution of plasma retinol in a population ofpreschool children, in which it is assumed that there were no deficient childrenfollowing a supplementation program , compared with the preschool population ofUshuaia. Using this criteria, 48% of the preschool children would have some degreeof deficiency in their deposits and could benefit from a supplement program orfortification of foods.
Vitamin D
Vitamin D deficiency is a regional problem charateristic of Patagonia. Normally, theendogenous synthesis supplies the daily requirement of this vitamin. But in the highgeographic latitudes, exposure to tangential ultraviolet solar radiation reduces thetransformation of provitamin D in the skin into vitamin D. Due to this condition,especially during the winter months, the population is almost exclusively dependenton food sources to maintain adequate levels of this nutrient.
B A S E - L I N E H E A L T H A N D N U T R I T I O N S U R V E Y1 1 2
RDA % INFANTS PRESCHL. SCHL. ADOL. MEN WOMEN PREG.
<50 % RDA 6.5 14.2 31.3 53.3 55 43.3 33
<75 % RDA 11.6 22.8 50 66.7 70 58.7 50.9
<100 % RDA 18.5 32.5 61.2 72.4 85 64.4 51.8
<120 % RDA 25 38.6 69.6 79 90 72.1 62.5
>120 % RDA 100 100 100 100 100 100 100Table 11Vitamin A intake.
PLASMA RETINOL ANDVITAMIN A INTAKETHEORETHICAL MODEL VSSITUATION IN USHUAIA
Figure 15Theorethical model ofprovitamin A intake andpopulation risk of clinicalor biochemical evidencesof deficiency. Line represents the accumulatedfrecuency of intake of Ushuaiapopulation; number inparenthesis are the prevalenceof each of the risk factorsobserved.

The nutritional situation of hydroxy-vitamin D (OH-D) was studied only in thegroups of infants and pregnant mothers, because of their greater vulnerability to theconsequences of this deficiency in terms of mineralization and bone growth. Thereis some scientific discrepancy concerning the cut-off point for an individual at riskof being deficient. The value of 8 ng/dl clearly defines deficient individuals, whetheror not they show clinical signs of rickets. Some authors suggest that risk ofdeficiency should be considered for individuals with plasma concentrations of OH-vitamin D less than 12ng/dl (24). In the context of our description, we adopted thefollowing criteria: severe deficiency 8ng/dl, moderate deficiency between 8.1 and10 ng/dl and risk of deficiency between 10.1 and 12 ng/dl. The prevalence ofvitamin D deficiency, considering the plasma levels of 25 OH-vitamin D, is shownin Table 12 and Figure 18.
The average values don’t differ from thoserecorded by other authors in an earlier study inUshuaia in a combined sample of preschool andschool children (20.2 + 1.25 ng/ml) (25). Thepresent one is one of the most representativestudies on vitamin D deficiency, in terms of thenumber and representativeness of the samplesurveyed, that has been done in southernArgentina. As mentioned, a good nutritional statusin vitamin D is important for bone developmentand ossification as well as for numerous functionsrelated to cell differentiation. It is important topoint out the situation of vitamin D deficiency inpregnant women, regardless of the risk leveladopted.
The field work in this study was carried out in two stages, one at the end of winterand the other at the end of summer, allowing the evaluation of the effect of thewinter season on vitamin D levels. Contrary to what was expected, there was nodemonstrable difference between the two survey stages. It is possible to speculatethat exposure to the sun is limited even in the summer by the amount of clothesworn, demonstrating the need for a year-round prevention program.
Vitamin D enhances the absorption of dietary calcium in the gut. The dietary surveydemonstrated that calcium intake is low in practically all biological groups. Eventhough this information doesn’t concur with thatdemonstrated in an earlier study in the region -which notes somewhat higher levels of calciumintake in a small sample of school children basedon food consumption frequency- (25) it isconsistent with the majority of surveys studyingcalcium intake in Argentina. The question mustbe asked: what is the correlation between lowcalcium intake and the very low levels of vitaminD? Although ossification is unlikely to beclinically affected in the short run, it isreasonable to think that the final calcium contentof the bone matrix will be significantly reduced,
T I E R R A D E L F U E G O P R O J E C T 1 1 3
mean Severe Moderate Risk of + ds Deficiency Deficiency Deficiency
Infants 22.9 + 14 13% 16.5% 21.7%
Presch. 20.6 + 12.3 13.2% 16.4% 23%
Pregnant 11.8 + 8.1 38.4% 53.4% 69.9%Table 12
Vitamin D deficiency.
Figure 17Calcium intake.
VITAMIN D
CALCIUM INTAKE
Figure 16Accumulated frequencies of
plasma levels of vitamin Dand percent of the
population with deficiencyor marginal concentrations.
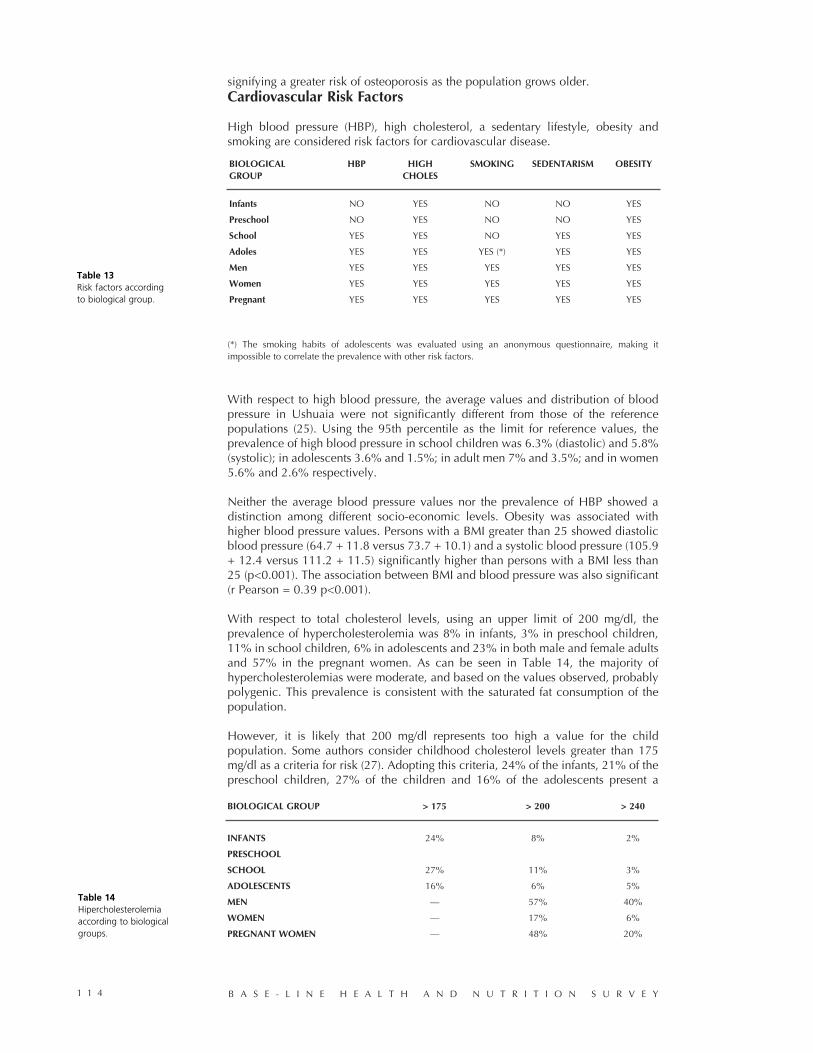
signifying a greater risk of osteoporosis as the population grows older.Cardiovascular Risk Factors
High blood pressure (HBP), high cholesterol, a sedentary lifestyle, obesity andsmoking are considered risk factors for cardiovascular disease.
(*) The smoking habits of adolescents was evaluated using an anonymous questionnaire, making itimpossible to correlate the prevalence with other risk factors.
With respect to high blood pressure, the average values and distribution of bloodpressure in Ushuaia were not significantly different from those of the referencepopulations (25). Using the 95th percentile as the limit for reference values, theprevalence of high blood pressure in school children was 6.3% (diastolic) and 5.8%(systolic); in adolescents 3.6% and 1.5%; in adult men 7% and 3.5%; and in women5.6% and 2.6% respectively.
Neither the average blood pressure values nor the prevalence of HBP showed adistinction among different socio-economic levels. Obesity was associated withhigher blood pressure values. Persons with a BMI greater than 25 showed diastolicblood pressure (64.7 + 11.8 versus 73.7 + 10.1) and a systolic blood pressure (105.9+ 12.4 versus 111.2 + 11.5) significantly higher than persons with a BMI less than25 (p<0.001). The association between BMI and blood pressure was also significant(r Pearson = 0.39 p<0.001).
With respect to total cholesterol levels, using an upper limit of 200 mg/dl, theprevalence of hypercholesterolemia was 8% in infants, 3% in preschool children,11% in school children, 6% in adolescents and 23% in both male and female adultsand 57% in the pregnant women. As can be seen in Table 14, the majority ofhypercholesterolemias were moderate, and based on the values observed, probablypolygenic. This prevalence is consistent with the saturated fat consumption of thepopulation.
However, it is likely that 200 mg/dl represents too high a value for the childpopulation. Some authors consider childhood cholesterol levels greater than 175mg/dl as a criteria for risk (27). Adopting this criteria, 24% of the infants, 21% of thepreschool children, 27% of the children and 16% of the adolescents present a
B A S E - L I N E H E A L T H A N D N U T R I T I O N S U R V E Y1 1 4
BIOLOGICAL HBP HIGH SMOKING SEDENTARISM OBESITYGROUP CHOLES
Infants NO YES NO NO YES
Preschool NO YES NO NO YES
School YES YES NO YES YES
Adoles YES YES YES (*) YES YES
Men YES YES YES YES YES
Women YES YES YES YES YES
Pregnant YES YES YES YES YES
BIOLOGICAL GROUP > 175 > 200 > 240
INFANTS 24% 8% 2%
PRESCHOOL
SCHOOL 27% 11% 3%
ADOLESCENTS 16% 6% 5%
MEN — 57% 40%
WOMEN — 17% 6%
PREGNANT WOMEN — 48% 20%
Table 13Risk factors accordingto biological group.
Table 14Hipercholesterolemiaaccording to biologicalgroups.
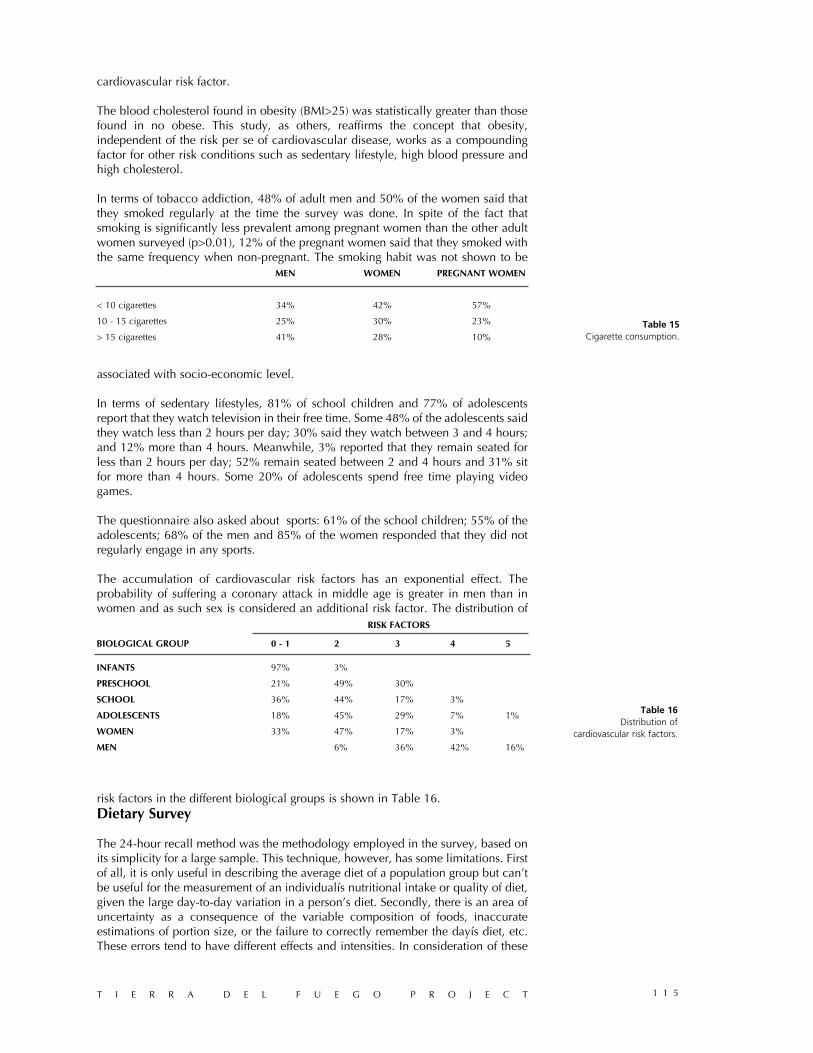
cardiovascular risk factor.
The blood cholesterol found in obesity (BMI>25) was statistically greater than thosefound in no obese. This study, as others, reaffirms the concept that obesity,independent of the risk per se of cardiovascular disease, works as a compoundingfactor for other risk conditions such as sedentary lifestyle, high blood pressure andhigh cholesterol.
In terms of tobacco addiction, 48% of adult men and 50% of the women said thatthey smoked regularly at the time the survey was done. In spite of the fact thatsmoking is significantly less prevalent among pregnant women than the other adultwomen surveyed (p>0.01), 12% of the pregnant women said that they smoked withthe same frequency when non-pregnant. The smoking habit was not shown to be
associated with socio-economic level.
In terms of sedentary lifestyles, 81% of school children and 77% of adolescentsreport that they watch television in their free time. Some 48% of the adolescents saidthey watch less than 2 hours per day; 30% said they watch between 3 and 4 hours;and 12% more than 4 hours. Meanwhile, 3% reported that they remain seated forless than 2 hours per day; 52% remain seated between 2 and 4 hours and 31% sitfor more than 4 hours. Some 20% of adolescents spend free time playing videogames.
The questionnaire also asked about sports: 61% of the school children; 55% of theadolescents; 68% of the men and 85% of the women responded that they did notregularly engage in any sports.
The accumulation of cardiovascular risk factors has an exponential effect. Theprobability of suffering a coronary attack in middle age is greater in men than inwomen and as such sex is considered an additional risk factor. The distribution of
risk factors in the different biological groups is shown in Table 16. Dietary Survey
The 24-hour recall method was the methodology employed in the survey, based onits simplicity for a large sample. This technique, however, has some limitations. Firstof all, it is only useful in describing the average diet of a population group but can’tbe useful for the measurement of an individualís nutritional intake or quality of diet,given the large day-to-day variation in a person’s diet. Secondly, there is an area ofuncertainty as a consequence of the variable composition of foods, inaccurateestimations of portion size, or the failure to correctly remember the dayís diet, etc.These errors tend to have different effects and intensities. In consideration of these
T I E R R A D E L F U E G O P R O J E C T 1 1 5
RISK FACTORS
BIOLOGICAL GROUP 0 - 1 2 3 4 5
INFANTS 97% 3%
PRESCHOOL 21% 49% 30%
SCHOOL 36% 44% 17% 3%
ADOLESCENTS 18% 45% 29% 7% 1%
WOMEN 33% 47% 17% 3%
MEN 6% 36% 42% 16%
MEN WOMEN PREGNANT WOMEN
< 10 cigarettes 34% 42% 57%
10 - 15 cigarettes 25% 30% 23%
> 15 cigarettes 41% 28% 10%Table 15
Cigarette consumption.
Table 16Distribution of
cardiovascular risk factors.

factors, the information will be presented graphically as accumulated frequencies bybiological groups, using a wide range of normality, establishing 80% of therecommended nutritional allowances as the lower limit and 120% as the upper limit
(figures 19 to 30).
For the whole population, 52.9% + 12.1% of energy intake wasderived from carbohydrates, 15.2% + 4.7% from proteins and33.2% + 8.5% from fats. Segmented by the degree of fat saturation,11% + 4.6% of total energy intake was derived from saturated fats,10.4% + 3.4% from mono-saturated fats and 6.3% + 4% from poly-saturated fates (figure 18). The energy distribution of the averageintake in Ushuaia is itemized in table 17.
B A S E - L I N E H E A L T H A N D N U T R I T I O N S U R V E Y1 1 6
Figure 18Distribution of energy intake.
Infant Preschool School Adoles. Pregnant Woman Man
Energy 1253 + 557 1513 ± 668 1821 ± 675 2004 ± 1070 1708 ± 739 1540 ± 678 2284 ± 966(Kcal/day)
CHO 163 ± 78 198 ± 100 244 ± 101 265 ± 149 224 ± 109 197 ± 95 279 ± 136(g/day)
Protein 50 ± 24 58 ± 28 65 ± 26 71 ± 42 63 ± 26 57 ± 30 92 ± 45(g/day)
Fats 48 ± 24 57 ± 30 67 ± 31 73 ± 45 63 ± 33 57 ± 32 82 ± 36(g/day)
Saturated Fats 16 ± 10 19 ± 11 22 ± 12 24 ± 17 20 ± 13 19 ± 13 25 ± 13(g/day)
Monounsatured Fats 14 ± 7 17 ± 9 21 ± 10 24 ± 16 20 ± 12 18 ± 11 26 ± 13(g/day)
Polyunsaturated Fats 8 ± 8 10 ± 9 12 ± 8 14 ± 12 13 ± 11 11 ± 9 19 ± 12(g/day)
Cholesterol 185 ± 131 221 ± 148 237 ± 179 274 ± 215 205 ± 132 218 ± 176 301 ± 209(mg/day)
Fiber 2 ± 2 2 ± 2 2 ± 2 2 ± 2 3 ± 2 2 ± 1 2 ± 1(g/day)
Infant Preschool School Adoles. Pregnant Woman Man
Carbohydrates 52 ± 13 52 ± 12 53 ± 9 53 ± 12 52 ± 11 52 ± 14 48 ± 9
Protein 15 ± 36 15 ± 4 14 ± 3 14 ± 4 15 ± 5 15 ± 7 16 ± 4
Fats 33 ± 7 34 ± 7 33 ± 8 32 ± 9 33 ± 8 32 ± 9 32 ± 8
Saturated Fats 10 ± 3 10 ± 3 10 ± 3 10 ± 4 10 ± 4 10 ± 3 10 ± 2
Monounsaturated 5 ± 3 6 ± 3 6 ± 3 6 ± 4 6 ± 4 6 ± 4 8 ± 4
Polyunsaturated 11 ± 4 11 ± 4 10 ± 4 10 ± 4 10 ± 4 10 ± 5 9 ± 3
Cholesterol 156 ± 135 152 ± 102 131 ± 81 145 ± 127 126 ± 77 140 ± 100 141 ± 100
Table 17Daily macro nutrientintake according tobiological groups.
Table 18Energy distributionof dietary intake.
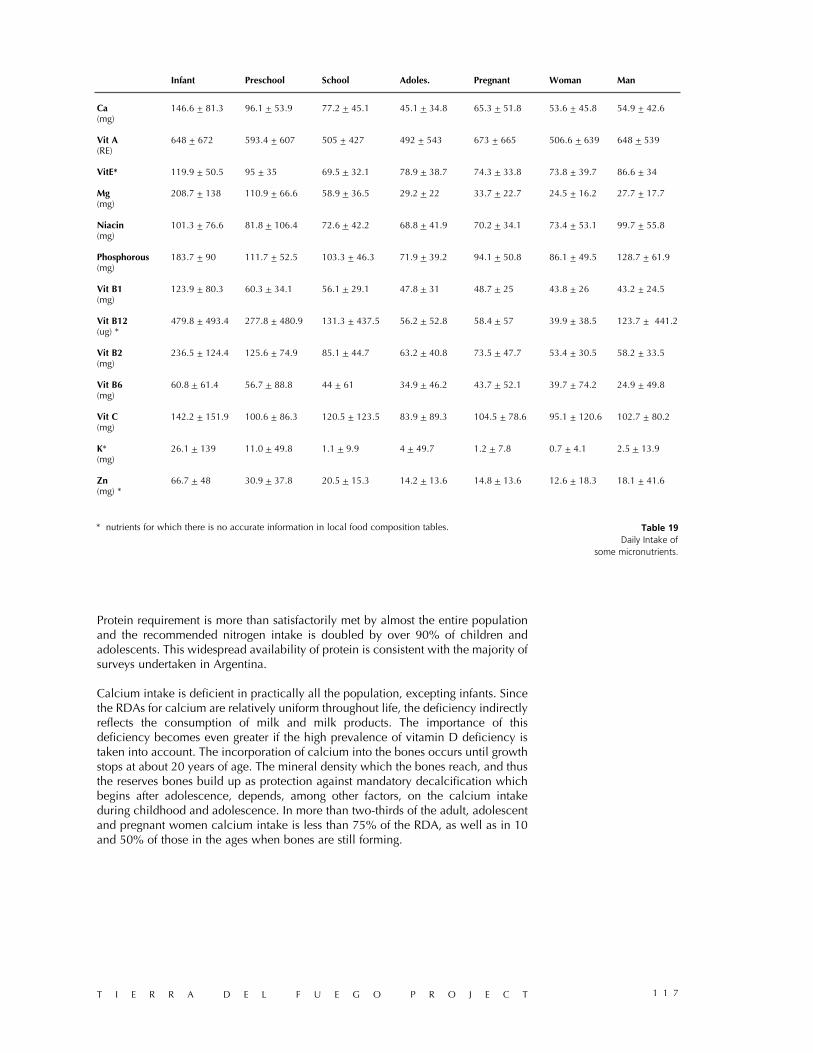
Protein requirement is more than satisfactorily met by almost the entire populationand the recommended nitrogen intake is doubled by over 90% of children andadolescents. This widespread availability of protein is consistent with the majority ofsurveys undertaken in Argentina.
Calcium intake is deficient in practically all the population, excepting infants. Sincethe RDAs for calcium are relatively uniform throughout life, the deficiency indirectlyreflects the consumption of milk and milk products. The importance of thisdeficiency becomes even greater if the high prevalence of vitamin D deficiency istaken into account. The incorporation of calcium into the bones occurs until growthstops at about 20 years of age. The mineral density which the bones reach, and thusthe reserves bones build up as protection against mandatory decalcification whichbegins after adolescence, depends, among other factors, on the calcium intakeduring childhood and adolescence. In more than two-thirds of the adult, adolescentand pregnant women calcium intake is less than 75% of the RDA, as well as in 10and 50% of those in the ages when bones are still forming.
T I E R R A D E L F U E G O P R O J E C T 1 1 7
Infant Preschool School Adoles. Pregnant Woman Man
Ca 146.6 + 81.3 96.1 + 53.9 77.2 + 45.1 45.1 + 34.8 65.3 + 51.8 53.6 + 45.8 54.9 + 42.6(mg)
Vit A 648 + 672 593.4 + 607 505 + 427 492 + 543 673 + 665 506.6 + 639 648 + 539(RE)
VitE* 119.9 + 50.5 95 + 35 69.5 + 32.1 78.9 + 38.7 74.3 + 33.8 73.8 + 39.7 86.6 + 34
Mg 208.7 + 138 110.9 + 66.6 58.9 + 36.5 29.2 + 22 33.7 + 22.7 24.5 + 16.2 27.7 + 17.7(mg)
Niacin 101.3 + 76.6 81.8 + 106.4 72.6 + 42.2 68.8 + 41.9 70.2 + 34.1 73.4 + 53.1 99.7 + 55.8(mg)
Phosphorous 183.7 + 90 111.7 + 52.5 103.3 + 46.3 71.9 + 39.2 94.1 + 50.8 86.1 + 49.5 128.7 + 61.9(mg)
Vit B1 123.9 + 80.3 60.3 + 34.1 56.1 + 29.1 47.8 + 31 48.7 + 25 43.8 + 26 43.2 + 24.5(mg)
Vit B12 479.8 + 493.4 277.8 + 480.9 131.3 + 437.5 56.2 + 52.8 58.4 + 57 39.9 + 38.5 123.7 + 441.2(ug) *
Vit B2 236.5 + 124.4 125.6 + 74.9 85.1 + 44.7 63.2 + 40.8 73.5 + 47.7 53.4 + 30.5 58.2 + 33.5(mg)
Vit B6 60.8 + 61.4 56.7 + 88.8 44 + 61 34.9 + 46.2 43.7 + 52.1 39.7 + 74.2 24.9 + 49.8(mg)
Vit C 142.2 + 151.9 100.6 + 86.3 120.5 + 123.5 83.9 + 89.3 104.5 + 78.6 95.1 + 120.6 102.7 + 80.2(mg)
K* 26.1 + 139 11.0 + 49.8 1.1 + 9.9 4 + 49.7 1.2 + 7.8 0.7 + 4.1 2.5 + 13.9(mg)
Zn 66.7 + 48 30.9 + 37.8 20.5 + 15.3 14.2 + 13.6 14.8 + 13.6 12.6 + 18.3 18.1 + 41.6(mg) *
* nutrients for which there is no accurate information in local food composition tables. Table 19Daily Intake of
some micronutrients.
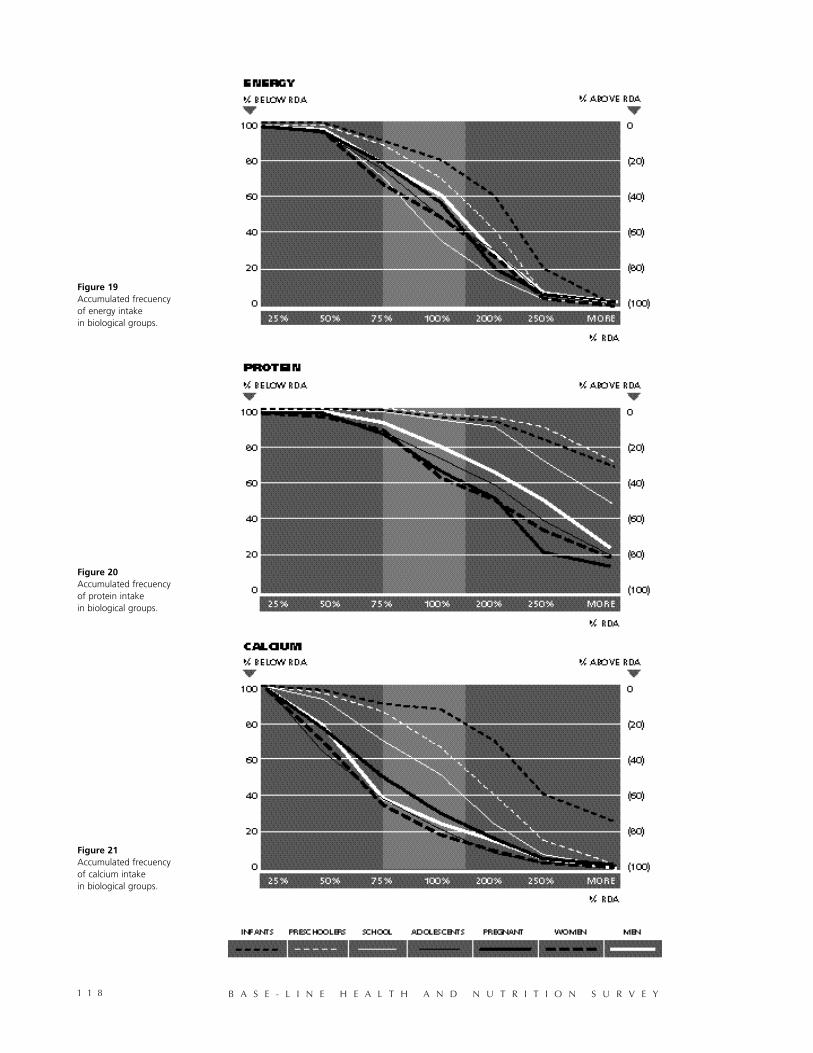
B A S E - L I N E H E A L T H A N D N U T R I T I O N S U R V E Y1 1 8
Figure 19Accumulated frecuencyof energy intakein biological groups.
Figure 20Accumulated frecuencyof protein intakein biological groups.
Figure 21Accumulated frecuencyof calcium intakein biological groups.

T I E R R A D E L F U E G O P R O J E C T 1 1 9
Figure 22Accumulated frecuency
of vitamin A intakein biological groups.
Figure 23Accumulated frecuency
of iron intakein biological groups.
Figure 24Accumulated frecuency
of vitamin C intakein biological groups.

Figure 25 shows the percentage of daily energyintake derived from each of the different foodgroups. The dairy products group includeswhole, skimmed, fluid and powdered milk andsubproducts such as cheese and yoghurt aswell as milk-based processed deserts. The fatsgroup includes mayonnaise, oils, cream, butterand margarine. The cereals group includes rice,flours, starches and the products processedfrom the same. The group of sugars and sweetsincludes candies, jams, marmalades, fruitpreserves, and soft drinks. The meats groupincludes meat and pork, sausages, cold cutsand eggs.
It can be noticed that the third part of the dailyintake for children and adolescents and thefourth part of the intake for adults was providedby sugars. This high consumption -which
usually occurs outside lunch and dinner- is not perceived as important by thepopulation but it contributes to increase energy intake, with the consequent risk ofobesity. As the foods which make up the sugars group basically provide energywithout other nutrients, they also increase the risk of the lack of micro-nutrients asthe global quality of the diet drops. The high consumption of bread and pastryproducts observed throughout the population becomes more pronounced amongadults than in children. The consumption of red and white meats is consistent withthe global availability figures for Argentina as displayed in the balance charts (23).Cold cuts and sausages have been included among red meats, representing as theydo between 40% and 50% of the group, especially among the lower social groups.Among white meats, fish consumption is very low (less than 3% of the averageintake) despite the fact that its availability is widespread on the island and at a veryaccessible price as it is fished locally. This consumption pattern is uniform anddisplays very few differences among the various social levels, showing that thisconstitutes a highly consolidated consumption habit.
Introduction of Foods During the First Year of Life
Dietary patterns were surveyed among infants over one year of age and in pre-school children with a questionnaire given to the mothers about the months of agein which specific foods were introduced. The questionnaire was assembled basedon certain dietary habits frequent in our country as well as on the potentially harmfulhabits which could be modified through correct pre- and post-natal care patterns.
Table 20 shows how the introduction of flours and cereals with gluten, bread andcrackers occurred before the sixth month in between 30% and 40% of infants.Honey -which carries the risk of botulism among younger children due to thelikelihood of colonizing the intestine with clostridium Botulinum- is a habit whichappears as installed among half the children six months old and in practically allchildren at one year of age. Some foods, such as meat, are introduced late: at thetenth month of life 20% of infants had not yet incorporated meats, a factor whichhas also been associated with the risk of iron deficiencies.
Although the prevalence of breast-feeding is comparatively high in Tierra del Fuegoin relation with surveys undertaken elsewhere in the country, the early introductionof other foods, especially red meats and other alternatives, limits the bio-availabilityof some of the nutrients found in mother’s milk and accelerates early weaning. It isimportant to fully know the dietary habits of this period -which usually coincideswith the return to the work place of mothers- in order to elaborate appropriatedietary norms and promote successful and more prolonged breast-feeding.
B A S E - L I N E H E A L T H A N D N U T R I T I O N S U R V E Y1 2 0
Figure 25Percent of dailyenergy intake fromdifferent foodstuffs.
% OF DAILY INTAKE

Of infants under six months old, 55% received dairy milk, 23% humanized formulas(with lower protein content a 40:60 casein:serum ratio) and 6.5% modified formulas(greater protein content and an 80:20 casein:serum ration)
The introduction of cow‘s milk occurred very early on: 5% of infants received itduring the first month of life, 21% before the fourth month and over 90% during thefirst year. As it was mentioned above, the early introduction of unfortified cow‘s milkwas one of the factors significantly associated with the risk of the development of
iron deficiencies.
Situation of Pregnant Women
Pregnancy constitutes a period of life with a high nutritional risk resulting from thelarge requirements of nutrients needed to satisfy the demands of fetal growth and ofthe reproductive organs. Some deficiencies have impact on the foetus, as forexample the already described deficiency of folic acid. Others, such as irondeficiencies, especially if they are slight, do not affect the newborn but they depletethe mother’s iron, constituting one more factor endangering the quality of life andthe success of prolonged breast-feeding. An inadequate weight gain duringpregnancy, resulting in either an underweight or overweight mother, affectsadequate intra-uterine growth. In a community with a high index of hospital births,
T I E R R A D E L F U E G O P R O J E C T 1 2 1
<1 month 1 2 3 4 5 6 7 8 9 10 11 12
LEGUMES 0 0 2 22 44 61 84 91 95 97 98 98 100
CEREALS 0 1 3 12 29 41 66 73 82 89 92 93 99
GLUTEN 1 1 1 10 27 42 62 75 82 89 91 92 99
COOKIES 0 0 1 6 16 32 54 68 80 85 87 99 100
MEAT 0 0 0 2 9 20 42 57 70 78 81 83 94
EGG 0 0 0 5 14 23 44 57 74 80 85 85 98
FRUIT JUICES 0 1 5 22 42 55 75 84 91 94 95 96 100
HONEY 0 2 3 14 30 46 64 72 81 84 85 87 96
DAIRY PRODUCTS (*) 0 0 1 15 37 52 75 83 90 93 94 95 99
BREAD 0 0 1 5 14 31 51 65 77 82 84 85 98
FRUITS 0 0 2 23 45 60 81 92 96 97 97 98 98
Table 20Age of introduction foodstuffs
along the first year of life.
(*) Includes the derivatives of milk and excludes cow“s milk, liquid and in powder, that are describedseparately.
Age (months) 1 2 3 4 5 6
Prevalence of Breast Feeding 94% 86% 82% 75% 69% 60%
Accumulated frequency of introduction 5% 10% 21% 33% 44% 55%of cow‘s milk
Accumulated frequency of introduction 10% 14% 20% 21% 22% 23%of formulas 40:60 whey:casein (*)
Accumulated frequency of introduction 1% 2% 3% 5% 6% 7%of formulas 80:20 whey:casein (*)
Table 21Breast feeding
and substitutes.
(*) The true prevalence can be less than the accumulated frequency by the replacement of infants formulasfor cow‘s milk.
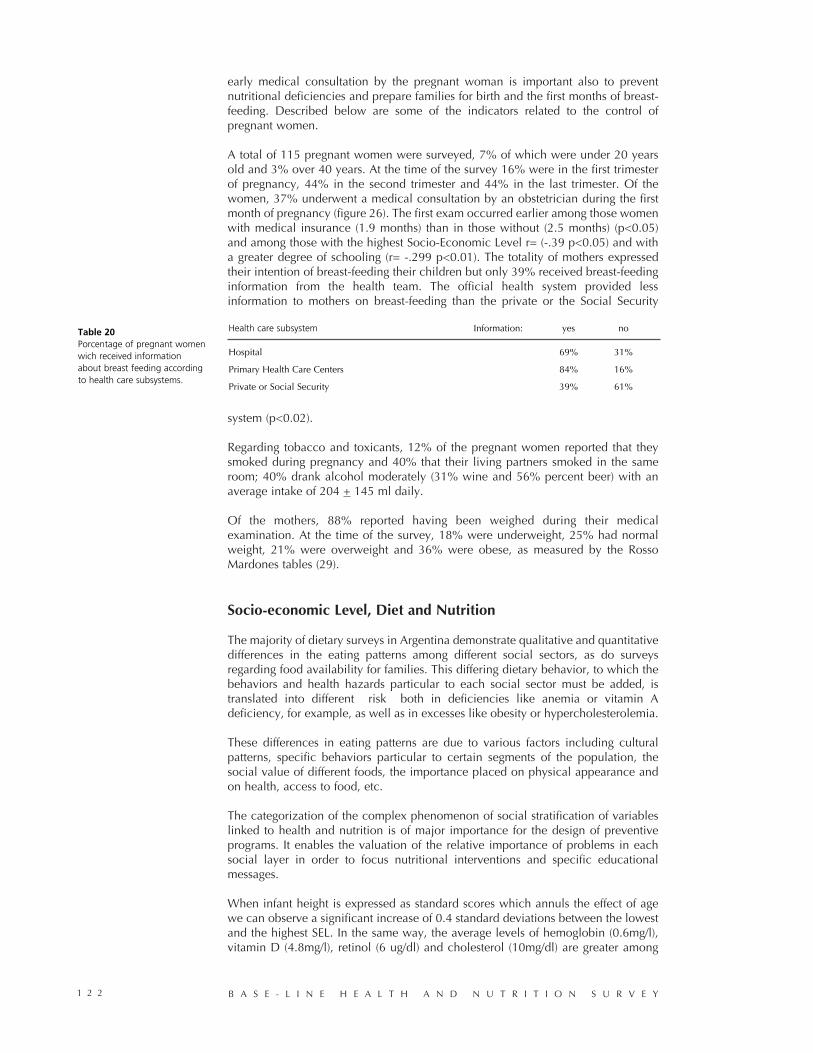
early medical consultation by the pregnant woman is important also to preventnutritional deficiencies and prepare families for birth and the first months of breast-feeding. Described below are some of the indicators related to the control ofpregnant women.
A total of 115 pregnant women were surveyed, 7% of which were under 20 yearsold and 3% over 40 years. At the time of the survey 16% were in the first trimesterof pregnancy, 44% in the second trimester and 44% in the last trimester. Of thewomen, 37% underwent a medical consultation by an obstetrician during the firstmonth of pregnancy (figure 26). The first exam occurred earlier among those womenwith medical insurance (1.9 months) than in those without (2.5 months) (p<0.05)and among those with the highest Socio-Economic Level r= (-.39 p<0.05) and witha greater degree of schooling (r= -.299 p<0.01). The totality of mothers expressedtheir intention of breast-feeding their children but only 39% received breast-feedinginformation from the health team. The official health system provided lessinformation to mothers on breast-feeding than the private or the Social Security
system (p<0.02).
Regarding tobacco and toxicants, 12% of the pregnant women reported that theysmoked during pregnancy and 40% that their living partners smoked in the sameroom; 40% drank alcohol moderately (31% wine and 56% percent beer) with anaverage intake of 204 + 145 ml daily.
Of the mothers, 88% reported having been weighed during their medicalexamination. At the time of the survey, 18% were underweight, 25% had normalweight, 21% were overweight and 36% were obese, as measured by the RossoMardones tables (29).
Socio-economic Level, Diet and Nutrition
The majority of dietary surveys in Argentina demonstrate qualitative and quantitativedifferences in the eating patterns among different social sectors, as do surveysregarding food availability for families. This differing dietary behavior, to which thebehaviors and health hazards particular to each social sector must be added, istranslated into different risk both in deficiencies like anemia or vitamin Adeficiency, for example, as well as in excesses like obesity or hypercholesterolemia.
These differences in eating patterns are due to various factors including culturalpatterns, specific behaviors particular to certain segments of the population, thesocial value of different foods, the importance placed on physical appearance andon health, access to food, etc.
The categorization of the complex phenomenon of social stratification of variableslinked to health and nutrition is of major importance for the design of preventiveprograms. It enables the valuation of the relative importance of problems in eachsocial layer in order to focus nutritional interventions and specific educationalmessages.
When infant height is expressed as standard scores which annuls the effect of agewe can observe a significant increase of 0.4 standard deviations between the lowestand the highest SEL. In the same way, the average levels of hemoglobin (0.6mg/l),vitamin D (4.8mg/l), retinol (6 ug/dl) and cholesterol (10mg/dl) are greater among
B A S E - L I N E H E A L T H A N D N U T R I T I O N S U R V E Y1 2 2
Health care subsystem Information: yes no
Hospital 69% 31%
Primary Health Care Centers 84% 16%
Private or Social Security 39% 61%
Table 20Porcentage of pregnant womenwich received informationabout breast feeding accordingto health care subsystems.
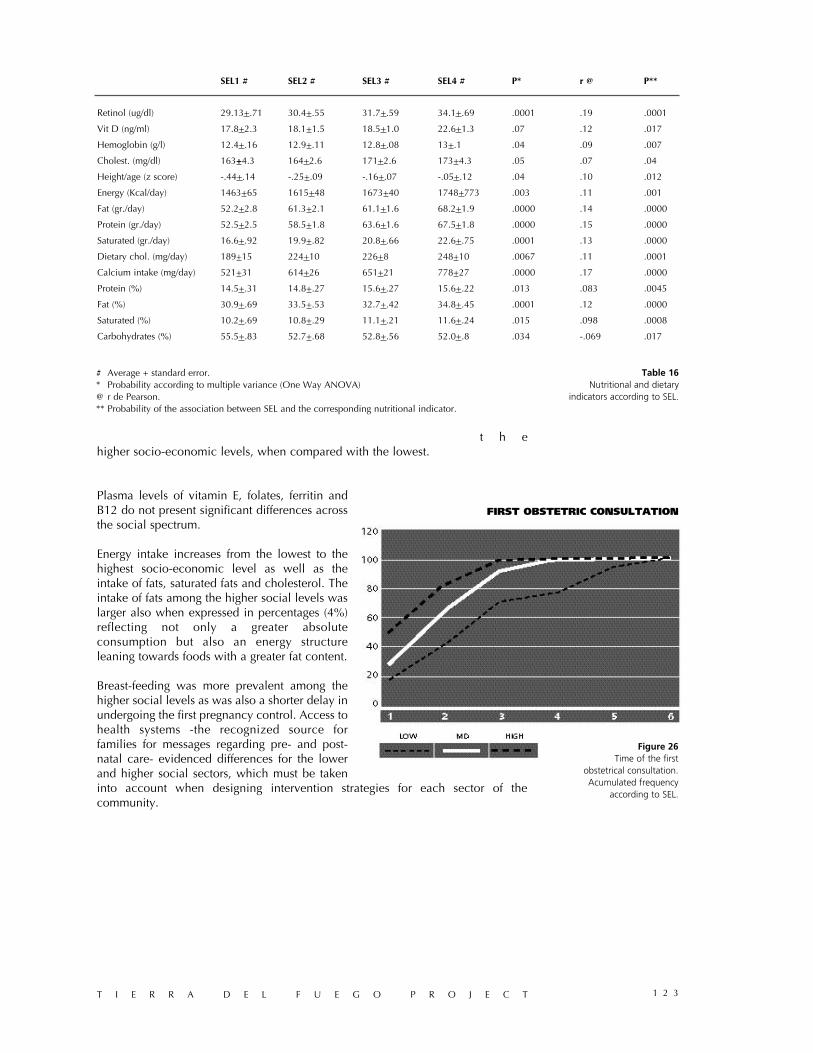
t h ehigher socio-economic levels, when compared with the lowest.
Plasma levels of vitamin E, folates, ferritin andB12 do not present significant differences acrossthe social spectrum.
Energy intake increases from the lowest to thehighest socio-economic level as well as theintake of fats, saturated fats and cholesterol. Theintake of fats among the higher social levels waslarger also when expressed in percentages (4%)reflecting not only a greater absoluteconsumption but also an energy structureleaning towards foods with a greater fat content.
Breast-feeding was more prevalent among thehigher social levels as was also a shorter delay inundergoing the first pregnancy control. Access tohealth systems -the recognized source forfamilies for messages regarding pre- and post-natal care- evidenced differences for the lowerand higher social sectors, which must be takeninto account when designing intervention strategies for each sector of thecommunity.
T I E R R A D E L F U E G O P R O J E C T 1 2 3
SEL1 # SEL2 # SEL3 # SEL4 # P* r @ P**
Retinol (ug/dl) 29.13+.71 30.4+.55 31.7+.59 34.1+.69 .0001 .19 .0001
Vit D (ng/ml) 17.8+2.3 18.1+1.5 18.5+1.0 22.6+1.3 .07 .12 .017
Hemoglobin (g/l) 12.4+.16 12.9+.11 12.8+.08 13+.1 .04 .09 .007
Cholest. (mg/dl) 163+4.3 164+2.6 171+2.6 173+4.3 .05 .07 .04
Height/age (z score) -.44+.14 -.25+.09 -.16+.07 -.05+.12 .04 .10 .012
Energy (Kcal/day) 1463+65 1615+48 1673+40 1748+773 .003 .11 .001
Fat (gr./day) 52.2+2.8 61.3+2.1 61.1+1.6 68.2+1.9 .0000 .14 .0000
Protein (gr./day) 52.5+2.5 58.5+1.8 63.6+1.6 67.5+1.8 .0000 .15 .0000
Saturated (gr./day) 16.6+.92 19.9+.82 20.8+.66 22.6+.75 .0001 .13 .0000
Dietary chol. (mg/day) 189+15 224+10 226+8 248+10 .0067 .11 .0001
Calcium intake (mg/day) 521+31 614+26 651+21 778+27 .0000 .17 .0000
Protein (%) 14.5+.31 14.8+.27 15.6+.27 15.6+.22 .013 .083 .0045
Fat (%) 30.9+.69 33.5+.53 32.7+.42 34.8+.45 .0001 .12 .0000
Saturated (%) 10.2+.69 10.8+.29 11.1+.21 11.6+.24 .015 .098 .0008
Carbohydrates (%) 55.5+.83 52.7+.68 52.8+.56 52.0+.8 .034 -.069 .017
# Average + standard error.* Probability according to multiple variance (One Way ANOVA)@ r de Pearson.** Probability of the association between SEL and the corresponding nutritional indicator.
Figure 26Time of the first
obstetrical consultation.Acumulated frequency
according to SEL.
Table 16Nutritional and dietary
indicators according to SEL.
FIRST OBSTETRIC CONSULTATION

T I E R R A D E L F U E G O P R O J E C T 1 2 5
References
1) INDEC: Censo Nacional de Población yVivienda, Resultados definitivos de la Provincia deTierra del Fuego. INDEC; 1991.
2) WHO-UNICEF-IDRC: Combating Hiddenmalnutrition, Quebec Canada; 1993.
3) Calvo EB, Gnazzo N. Prevalence of irondeficiency in children aged 9-24 mo from a largeurban area of Argentina. Am J Clin Nutr52:534; 1990.
4) Carmuega E, Calvo E, Britos S, Uicich R,O’Donnell AM: Racionalización del Programa deComedores escolares del partido de Gral.Rodriguez. X Congreso Argentino de Nutrición.Premio J. Landa; 1987.
5) Carmuega E, Bianculli C, Durán P. y col.:Estudio de ciertos factores de riesgo de la salud yde la situación nutricional de adolescentesurbanos. Medicina Infantil 2:71; 1995.
6) Lozoff B, Brittenham G, Viteri F, Wolf A,Urrutia J.: The effects of short term oral irontherapy on developmental deficits in iron-deficientanemic infants. J Pediatr 100:351; 1982.
7) INDEC: Censo Nacional de Población yVivienda INDEC; 1990.
8) Dallman PR, Siimes MA. Percentile curves forhemoglobin and red cell volume in infancy andchildhood. J Pediatr 94:26; 1979.
9) Hastka J, Lasserre J, Schwarzbeck A, HehlmannR.: Central role of zinc protoporphyrin in stagingiron deficiency. Clin Chem 40:768; 1994.
10) OMS/OPS: Hipovitaminosis A en las Américas.Informe de la Reunión de un grupo técnico de laOPS. Organización Panamericana de la Salud,Washington; 1970.
11) Klasing S, Pilch S Suggested measures ofnutritional status and health conditions for thethird national Health and Nutrition ExaminationSurvey. Life Sciences Research Office, Federationof American Societies for experimental Biology.Bethesda, Maryland; 1985.
12) Jacobs A, Miller F, Worwood M, Beamish M,Wardrop C.: Ferritin in the serum of normalsubjects and patients with iron deficiency and ironoverload. Br Med J 4:206; 1972.
13) INACG: Measurements of iron status. A reportof the international nutritional anemia consultativegroup. Tue Nutrition Fundation. New York; 1985.
14) CESNI, Base de datos sobre composiciónquímica de alimentos argentinos. Boletín CESNIaños 1986-1994.
15) Ariño M, Rosas M, Torrado S. Metodologíapara el análisis de la estructura socioupacionalargentina (1960-80) Consejo Federal deInversiones. Documentos de la SecretaríaGeneral; 1987.
16) Programa Nacional de Estadísticas de Salud.Estadísticas Vitales. Información Básica 1993.Serie 5 Nº37. Ministerio de Salud y Acción Social;1993.
17) Abeyá, E; Galindo, A; Gnazzo, N; O’Donnell,A. Encuesta Alimentaria de niños de 6 a 24 mesesen Buenos Aires y área suburbana.I- Características Generales. Libro de Resúmenes.VI Congreso Latinoamericano de Nutrición; 1982.
18) Rolland-Cachera, MF; Cole, T.; Sempre, M;Tichet, J.; Rossignol, C.; Charraud, A. Body MassIndex variations: centiles from birth to 87 years.Eur J Clin Nut 45: 13; 1991.
19) Must, A; Dallal, G.; Dietz, W. Reference datafor obesity: 85th and 95th percentiles of bodymass index (wt/ht2) - a correction. Am J Clin Nutr54:773; 1991.
20) Food and Nutrition Board. National Academyof Sciences/National Research Council:Recomended Dietary Allowances. 10th Ed.Washington DC. National Academy Press;1989.
21) Comité Multisectorial: ConferenciaInternacional sobre nutrición. república Argentina.México; 1992.
22) INACG. A brief guide to current methods ofassesing vitamin A status. A report of theInternational Vitamin A Consultative Group(IVACG) Nutrition Foundations Inc. WashingtonDC; 1993.
23) Flores H, Azevedo M, Campos F et al: Curvade distribución de vitamina A sérica para niños de2 a 6 años con estado adecuado de vitamina A:una población de referencia. Arch Lat Nutr42:2; 1992.
24) Pettifor JM, Isdale JM, Sahakian J, Hansen JDL.Diagnosis of subclinical rickets. Arch Dis Child55:155; 1980.
25) Olivieri M, Ladiezesky M, Somoza J, et al.Niveles séricos invernales de 25-OH vitamina Den Ushuaia y Buenos Aires. Medicina50:310; 1990.
26) Report of the second Task Force on BloodPresure control in children Pediatrics 79:1; 1987.
27) National Cholesterol Education Program:Report of the expert panel on blood cholesterollevels in children and adolescents. Pediatrics(suppl) 89:534; 1992.
28) Britos S. Hojas de Balance de alimentos en laRepública Argentina. Publicación Científica CESNINº 6, 1989.
29) Rosso P, Mardones P.: Gráfica de incrementode peso para embarazadas. Ministerio de Saludde Chile; 1986.

T I E R R A D E L F U E G O P R O J E C T 1 2 7
Rae Natalie Prosser de Goodall, married to a direct descendant of the first white settler of theisland, is part of the history of Tierra del Fuego. Researcher, biologist, historian and explorer ofthe Fuegian land and waters, a compiler of its flora and fauna, she has published, as well as otherscientific works, an exquisite book about the people, the geography and the plants and animals ofthe island which is obligatory reading for those who visit this both recondite and beautiful part ofthe world.
The Tierra del Fuego Project wishes to give thanks to the testimony of Natalie Goodall, whichreflects the changes experimented on the island in less than a century, until becoming what it istoday, a modern and vigorous community, with a population that shares the style of life of thecountry’s main cities. But with the advantadge of doing so in a setting of outstanding deauty.
TIERRA DEL FUEGO: YESTERDAY AND TODAY
By Natalie Goodall
This book is the result of a study of thenutrition of the residents of Ushuaia,Tierra del Fuego, and is part of a six-year plan to teach us better nutrition. Iam proud that Tierra del Fuego hasbeen selected for this importantproject, which could inspire, from thissouthernmost tip, similar studiesthroughout the continent. I find theresults of the study fascinating.
In Tierra del Fuego, nutrition hasprobably always been a problem ofadaptation to the environment. Thisisland offers only minimal “natural”carbohydrates for the metabolicrequirements needed for the climate.There is no way a person can live onits native plants alone. In the earlydays, there was no option, anyoneliving on the products of the land hadto be carniverous.
The earliest settlers came here on footsome 11,800 years ago, following theguanaco and crossing a land bridgethat would later become the Strait ofMagellan. These people lived mainlyon the northern plains and mountains,with occasional excursions to thesouth. They were principally meateaters-guanacos, tuco-tucos, birds,seals, stranded whales-with fewvegetable carbohydrates in their diet,although they did eat some fungi, wildcelery and seeds. We know little oftheir nutrition, but winter and springmust have been difficult, when meatwas lean and many birds hadmigrated. At that time, they movednearer the coasts. Their population sizewas limited by the carrying capacity ofthe land, as there was little input ofnew animal life from outside the
island. When overpopulation occurred,food became scarce and the peopledeveloped feuds and wars.
The Beagle Channel people camedown the west coast of southern SouthAmerica in canoes and entered thesouthern Fuegian region as the glaciersreceeded, not earlier than 6,500 yearsago. They had already becomeadapted to a marine-littoral diet, alsomostly meat-seals, otters, dolphins,birds, fish, shell-fish. The southern furseal was their principal food and theirbodies had adapted to this diet high inmarine fats. On the first arrival of thewhite man, there were plenty of sealsand the Fuegian channels had adensity of population 20-40 times thatof the Pampas and Patagonia. This wasbecause there was a high influx of foodfrom outside the archipielago. If thecanoe people finished off most of theseals, more came in from other areas;the fish fed at sea in winter andentered the channels in summer; thewhales arrived in the fall. There wasno need to be war-like when there wassufficient for all. Bones of the people ofthis time do not show deficiencies ofVitamin D (one of the problems inTierra del Fuego today); this was takencare of by the lack of clothing (moreexposure to radiation) and the highconsumption of marine fats.
With the arrival of the European, thewhite man, everything changed.The whalers and sealers began theircaptures off southern South America inthe 1790s, even before the BeagleChannel was discovered. Within afairly short time, the southern fur sealwas decimated, not only from the

islands and channels, but from thelarger areas offshore. There was nomore recruitment, no more influx ofanimals from outside Tierra del Fuego.Weakened, without proper food(especially fats), reduced to livingmainly on mussels, birds, fish (insummer) and fungi, the canoe peoplessuccumbed even more rapidly to thewhite man’s diseases. The sealers hadliterally sealed the fate of the southernpeople.
The Anglican missionaries who camein the early 1860s tried to teach thecanoe people to grow vegetables,especially potatoes and swedes, andbrought cattle for the “settled” natives.They also introduced flour, bread andsugar, which caused new problems inbodies not used to them. The sealersand others wandering through thechannels introduced tobacco anddrink, leading to the downfall ofmany a native.
The European pioneers, from the firstmissionary residents in 1869 up intoour own times, lived from what theycould grow, at great cost in time andlabor. The land was not easly tocultivate, but the settlers grewpotatoes, carrots, cabbage, swedes andraised sheep, chickens for eggs, and afew cattle. They also used some nativefoods, such as fish and mussels. Theydepended greatly on ship’s biscuits,flour, grains, beans, sugar, tea, coffee,dried fruits and other foods whichcould be kept for long periods andwhich were brought from Europe orBuenos Aires via Punta Arenas or theMalvinas. We would have consideredtheir diet horrible. Practically never didthey see fresh fruit or vegetables otherthan those they grew themselves; thefruits of Tierra del Fuego were thebarberries, other small berries inseason and those cultivated, such asraspberries. The appearance of the firstrhubarb in late spring was hailed withgreat pleasure. There was nothing at allthat was fresh to eat in late winter andspring; even lettuce was not ready untilthe end of December or early January.
The ships that brought supplies, firstthose of the Anglican mission, andafter 1884 the Argentine navy, werenot always dependable. Sometimes
there were several supply visits a year,sometimes only one. In 1874-75 theMission ship was delayed for a yearand a half; in that time of worry, shortsupplies, and no news at all from theoutside world, a new baby was born intwo of the three white families living inUshuaia. Much later, in 1925-26, noship came for over a year and peoplein Ushuaia and its prison were sohungry they went to the few farmsalong the channel for food, but theyalso had little to give. GuillermoBridges, my husband’s grandfather,had a small launch built and broughtto Tierra del Fuego so that “neveragain would we not be able to get atleast to Punta Arenas.”
Gradually, shipping improved andmore food came to Tierra del Fuego.My husband, as a child in Río Grandein the late 1930s and early 1940s,remembers barrels of small yellowapples -the only fruit they had duringthe year- and barrels of honey, so hardthey could be sawed in half. When theAeroposta planes began to arrive at RíoGrande, the pilots sometimes broughthim and his brother an orange.What joy!
With regular shipping, and then theconstruction of roads and the arrival oftrucks, fresh fruit and vegetablessuddenly became available. Even so,in the 1960s, every time we went totown from the farm, once every two orthree months, it seemed that the shipwould not be due for a week or two,and all that was left in the stores wasdried up or rotten fruit. For severalyears I did not eat any fruit at all, sothat what we could get could be givento our small daughters.
Now all this has changed. Foods ofevery kind are available to everyone;fresh fruits and vegetables arrivealmost daily and are in all the stores.Special foods come from all over theworld. With so much to choose from,our children should have optimalnutrition. Proper nutrition is necessaryfor the highly varied activities of ourtimes. The only reason for poornutrition lies in the choices of foods tobe served. This study shows that thereare still many deficiencies in both thechildren and adults of Tierra del Fuego
B A S E - L I N E H E A L T H A N D N U T R I T I O N S U R V E Y1 2 8
T I E R R A D E L F U E G O P R O J E C T 1 2 9
and that training in meal planning isneeded.
Tierra del Fuego today is a very specialplace, filled with many young,professional people. It is no longer aplace where people, as it was said, justcome to make money and leave.I feel that now most people, especiallyyoung parents, live here because theywant to be here, because they loveTierra del Fuego and want to make itbetter. There are still many social andeconomic problems. This study pointsout many of those particular to Tierradel Fuego -the lack of permanenthousing because of the difficulty ofobtaining land, the high percentage ofmothers that work, the great proportion
of children in the population, the lackof grandparents -most of them live faraway in the north.
A base-line study, such as the one inthis book, is of utmost importance inevaluating our competence for the pathahead as we move into a new century,a new world, with new problems, suchas ozone depletion, global warming,changes on the land, overpopulation.The new century also brings newpromises of great advances in health,communications, education andespecially, a new spirit of cooperationamong groups of nations. Propernutrition is very important inpreparing our children forthis new world.
Natalie GoodallUshuaia, August, 1995.
I greatly appreciate the ideas offered by Ernesto Piana, Abigail Goodall and Estela Caipillán.