portador lo cual fue desmodulado a un s
18
Transcript of portador lo cual fue desmodulado a un s


Figura 1 Calibración de un transductor de presión.
1 Actividades realizadas
1.1 Equipo experimental
1.1.1 Adecuación de las instalaciones experimentales.
Los principales adquisiciones de equipo experimental fueron relacionados conmantener y adecuar la instalación experimental: sistema de termografía,calentadores eléctricos con envolvente de silicio, medidores de flujo de calor y unoxímetro.
Se realizó la calibración de un transductor de presión diferencial (Figura 1). Elarreglo consistió en una perilla de goma conectada a una base con manómetroDEWIT con rango de 0-60 onzas por pulgada cuadrada con resolución de 2 onzaspor pulgada cuadrada| (0.00879 kg/cm2) y éste conectado a un extremo deltransductor de presión diferencial. El transductor fue energizado con un señal

Figura 2 Resultados de la calibración de un transductor de presión.
portador lo cual fue desmodulado a un señal de voltaje conectado a un adquisitor
de datos. Obteniéndose la tabla y gráfica de la figura 2.
Se montó un calentador Electrothermal tipo cerámico con un diámetro de 14mm
y una longitud de 240mm que a un voltaje de 220V daba una potencia de
calentamiento de aproximada de 400W según datos de fabricante; en posición
concéntrica con respecto a la columna de acrílico (Figura 3).

Figura 3 Calentador de tubo concéntrico instalado.
Se instalaron bafles modificados para permitir el uso del calentador concéntrico
con los bafles para estudios de transferencia de calor con y sin lecho fluidizado
en el régimen de flujo helicoidal (Figura ).

Figura 4 Bafles para uso con el calentador de tubo concéntrico.
Instrumentó el equipo con 2 sensores de temperatura Omega Engineering
(termopares tipo T cobre-constantan) uno a la entrada de agua antes de entrar
en contacto con el calentador e inmediatamente después de este, se cuentó con
un sensor de flujo de calor-termopar tipo T , de RDF Corporation el cual se ubicó
en la superficie del calentador y un transductor de presión diferencial Validyne
Engineering conectado en la parte inferior de calentador y a la salida de este
aproximadamente en la misma zona de los termopares. Todos los anteriores
dispositivos fueron conectados al sistema de adquisición de datos Omega
Engineering.
Se realizaron modificaciones, adecuaciones y calibraciones detalladas del
impresora 3D tipo delta para logra impresiones de precisión ocupando todo del
área de la placa base de impresión. La figura 5 muestra una impresión de prueba
que ocupa los extremos del área de impresión.

Figura 5 Impresión de prueba usando los extremos del área de impresión.
1.1.2 Desarrollos
Se realizaron estudios de transferencia de calor y caídas de presión con el
calentador de tubo concéntrico, con y sin lecho fluidizado y con y sin bafles
helicoidales. Se reporta dichos desarrollos en los informes de avance en el
proyecto doctoral del M. I. Oscar García Aranda anexos y el manuscrito de
artículo para publicación anexo.
2 Resumen de resultados
2.1 Experimentales
Se han integrado los sistemas experimentales e instrumentación.
El programa experimental ha resultado en estudios de la transferencia de calor

con una geometría de calentador de tubo concéntrico con fluidizaciónlíquido/sólido tanto en flujo vertical como en flujo helicoidal.
2.2 Modelado
El modelado se ha realizado de forma individual para:
Determinación de coeficientes de transferencia de calor considerando diferentesdeflectores, en este tema se han obtenido resultados en un proyecto terminal quese ha concluido
Determinación de las condiciones hidrodinámicas para la fluidización departículas con diferentes geometrías y ángulos de inclinación, el tema es partede un proyecto de maestría y se han presentado los resultados en un congresointernacional, el proyecto está en proceso.
3 Publicaciones
3.1 Publicaciones:
En proceso de elaboración: manuscrito anexo.An experimental study on the effect of liquid-solid fluidized vertical bed andhelical baffles in a concentric heat exchanger. García Oscar, Heard Christopher,Valencia Jose, Solorio Francisco.
3.2 Presentaciones en congresos:
Fernando A. López Mata, J. Javier Valencia López, Christopher Heard; Simulaciónen 2D de la Hidrodinámica de una Columna de Lechos Fluidizados con Variacióndel Ángulo de Inclinación; Congreso Iberoamericano de Computación Aplicadaa la Industria de Procesos CAIP; México, septiembre del 2017. (Se anexaconstancia de participación y extenso del trabajo publicado en las memorias delevento).
4 Formación de Recursos humanos
Doctorado; Óscar García Aranda; “Desarrollo de intercambiadores de calorcompactos con lecho fluidizado solido-líquido por el lado de la coraza”; (enproceso).
Maestría; Fernando Alberto López Mata; “Simulación de la hidrodinámica de

lechos fluidizados considerando variación en el ángulo de inclinación de la
columna”; (en proceso).
Licenciatura, Proyecto terminal; Daniel Camacho Ibarra; “Determinación
Numérica y Comparación de Coeficientes de Transferencia de Calor bajo lainfluencia de Factores geométricos en Intercambiadores de Calor de TubosConcéntricos”; septiembre 2016 (concluido, se anexa proyecto terminal).
5 Conclusiones
El proyecto obtuvo resultados experimentales significativas integrando lasdisciplinas de diseño y de ingeniería y ha originado publicaciones ypresentaciones que amparan dichos resultados.

An experimental study on the effect of liquid-solid fluidized vertical bed and helical
baffles in a concentric heat exchanger.
García Oscar a, Heard Christopher
b, Valencia Jose
c, Solorio Francisco
d
a Posgrado en Ciencias Naturales e Ingeniería, Universidad Autónoma Metropolitana
Unidad Cuajimalpa, Ciudad de México, México.
b Departamento de Teoría y Procesos de Diseño, DCNI, Universidad Autónoma
Metropolitana Unidad Cuajimalpa, Ciudad de México, México.
c
Departamento de Procesos y Tecnología, DCNI, Universidad Autónoma Metropolitana
Unidad Cuajimalpa, Ciudad de México, México.
d División de Ingeniería Eléctrica y Mecánica, Universidad Nacional Autónoma de México,
Ciudad de México, México.
Abstract
Seven different metal particles are fluidized, choosing only one of them according to the
characteristics they present. Nine different helical baffles were tested with 3, 4 and 5
propellers at 45, 60 and 75 degrees of inclination, three of them being the best to be tested
with the selected particle in the heat exchange. Only one of them better in conjunction to
maximize energy exchange.
1. Introduction
Fluidized bed was perhaps first used in the old practice of washing gold so as to suspend
the particles of sand and separate them from the denser ones that sediment. Fluidization
with liquid is the operation by which small solid particles are transformed through contact
into a state similar to that the fluid. This effect is sought for a better exchange of energy
(heat transfer) from one fluid to another or from a solid wall to a liquid. [1]
Turbulence affects the thermal boundary layer and reduces resistance to heat transfer. The
heat transfer coefficient increases as the liquid velocity increases. The violent movement of
the particles also has a positive effect on the fouling factor of the heat transfer surface. [2]
There are vertically oriented equipment in which the external fluid on the side of the tubes
is added particles of various forms and materials, in order to create turbulence, which
improves heat transfer by stirring the particles within the fluid in which they are immersed
and suspended. [3]
2. Experiment setup model and measurement system
One of the first steps in the mechanical design of the fluidized bed is the selection of the
geometry of the distributor plate where the bed rests and through which the fluid is
introduced to the bottom of the bed. A simple perforated plate may be employed
considering that the holes should be smaller than the diameter of the particle to be
employed and that the structure or material be capable of supporting the weight thereof and

the hydrostatic charge. By doing these considerations we used distributors in 5 different
points for the stabilization of the flow and the 3 different models can be seen in Figure 1.
Figure 1. Flow distributors employed in the test bench.
The assembly of the concentric vertical heat exchanger has a ceramic type heater with a
diameter of 14 [mm] and a length of 240 [mm] which at a voltage of 220 [V] offers a
heating power of approximately 400 [W ] according to the manufacturer's data, Figure 2
(a).
It has two temperature sensors (thermocouples type T copper-constantan) one at the
entrance of water before coming into contact with the heater and immediately after this,
there is a thermocouple flow sensor-type "T" the which is located on the surface of the
heater and a differential pressure transducer connected at the bottom of the heater and the
outlet of this in the same area as that of the thermocouples. All of the above devices are
connected to a data acquisition system. In addition, the peripheral equipment has a water
recirculation tank, 3 HP centrifugal pump, rotameter and speed variator as shown in figure
2 (b).
a) b)

Figure 2. a) Concentric tube heat exchanger. b) Measurement system.
3. Methods
3.1 Fluidization
Figure 3. Pressure drop as a function of surface velocity [4]
The minimum velocity at which a fluidized bed of particles is a crucial parameter necessary
for the design of any fluidization operation. The details of the minimum velocity depend on
a number of factors, including the shape, size, density, and polydispersity of the particles.
Density, for example, directly alters the net gravitational force acting on the particle, hence
the minimum resistance force, or velocity, necessary to lift a particle. The shape not only
alters the relationship between the drag force and the speed, but also the packing properties
of the fixed bed and associated voids and the velocity of the fluid therethrough.
Measurements of pressure drop across the particle bed can be used to identify the minimum
fluidization velocity. As shown in Figure 3, the pressure drop increases with flow rate until
the bed expands and the voidage increases (point A). It is taken into account that the
velocity and pressure drop relationship is not necessarily linear as shown, depending on the
range of Re (Reynolds) covered.
By further increasing the speed, the pressure drop reaches a maximum value. Between
points A and B, drag friction causes the particles to reorganize, which can alter porosity.
After reordering, the pressure decreases and point B is above point C as a result. As U
(velocity) increases beyond the point C, the pressure drop is maintained approximately
constant to a certain point D where the velocity is not significantly greater than at point C.
If the process is reversed in a constant manner by the reduction of velocity U, the point E
will be found instead of point B due to the different porosity resulting from the
rearrangement of the particles, and the EF line is the process of reforming the fixed bed of
particles. This conceptual diagram serves as the basis for the experimental determination of
Umf. to identify the point E, the velocity of the fluid increases until the pressure passes
through a maximum and then stops changing; this method defines the CD line. The amount

of the flow is then reduced to obtain the EF line. The minimum fluidization velocity is the
speed at which these two lines intersect. Increases in velocity must be small to solve for
point E.
During the fluidization for the following particles the amount of 70 cm 3 was kept constant
and obtaining the following table and graph.
P#1
Sphere
P#2
Sphere
P#3
Saturn
P#4
Diagonal
cylinder
P#5
Straight
cylinder
P#6
Needle
P#7
Sphere
Density
(gr/cm3)
10.031 9.570 8.25 8.24 7.325 8.26 6.90
Mass (gr) 443 450 329 352 350 334 315
Bed voidage 0.284 0.242 0.236 0.184 0.222 0.358 0.264
Sphericity 1.0 1.0 0.808 0.923 0.873 0.891 1.0
Min. Vel. of F.
Umf (m/s)
0.353 0.602 0.463 0.381 0.332 0.384 0.528
Height of the bed (mm)
930 1170 670 690 1180 705 1115
Table 1. Characteristic values of the particles used
Graph1. Development of voidage during fluidization for different particles.
!"!!!!#
!"$!!!#
!"%!!!#
!"&!!!#
!"'!!!#
("!!!!#
("$!!!#
)*!!"!!!# )*!!!"!!!#
!!
"#$%&'()!*"#+!+,(# +,$# +,)# +,%# +,*# +,&# +,-#
./0 123045/#
3.2 Helical baffles
Such flows, where a particle represents a helical path due to an axial flow component and a
rotating component, are referred to as the helical flows. Therefore, for a pressure driven
flow, the increase in axial flow velocity is attributed exclusively to the rheological effects
combined with the orthogonal stresses (the flow in the azimuthal direction lies in a plane
which is orthogonal to the axial direction). [5]
Literature consulted indicates that, despite their practical importance, very few studies have
been reported on the fluidized bed in inclined tubes (behavior similar to helical baffles).
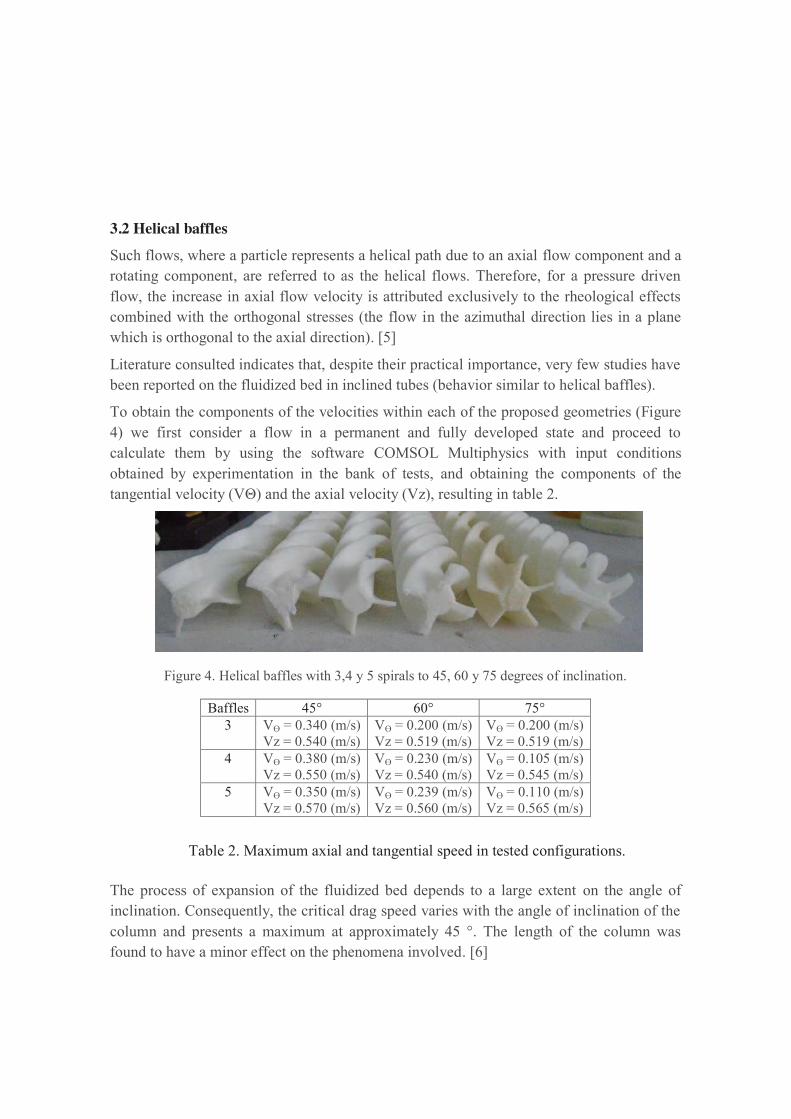
To obtain the components of the velocities within each of the proposed geometries (Figure
4) we first consider a flow in a permanent and fully developed state and proceed to
calculate them by using the software COMSOL Multiphysics with input conditions
obtained by experimentation in the bank of tests, and obtaining the components of the
tangential velocity (V ) and the axial velocity (Vz), resulting in table 2.
Figure 4. Helical baffles with 3,4 y 5 spirals to 45, 60 y 75 degrees of inclination.
Baffles 45° 60° 75°
3 V = 0.340 (m/s)
Vz = 0.540 (m/s)
V = 0.200 (m/s)
Vz = 0.519 (m/s)
V = 0.200 (m/s)
Vz = 0.519 (m/s)
4 V = 0.380 (m/s)
Vz = 0.550 (m/s)
V = 0.230 (m/s)
Vz = 0.540 (m/s)
V = 0.105 (m/s)
Vz = 0.545 (m/s)
5 V = 0.350 (m/s)
Vz = 0.570 (m/s)
V = 0.239 (m/s)
Vz = 0.560 (m/s)
V = 0.110 (m/s)
Vz = 0.565 (m/s)
Table 2. Maximum axial and tangential speed in tested configurations.
The process of expansion of the fluidized bed depends to a large extent on the angle of
inclination. Consequently, the critical drag speed varies with the angle of inclination of the
column and presents a maximum at approximately 45 °. The length of the column was
found to have a minor effect on the phenomena involved. [6]

According to the values reported in Table 1, particle number 5 was chosen to be the best for
fluidization in the vertical column without baffles. So we proceeded to realize the
visualizations of those but now with the baffles having a different number of starts, as well
as degrees of inclination in their propellers, obtaining thus the images that are presented
next.
# # #
Figure 5. Baffle with 3 starts (from left to right) at 45 °, 60 ° and 75 °.
## ## #
Figure 6. Baffle with 4 starts (from left to right) at 45 °, 60 ° and 75 °.

### ## #
Figure 7. Baffle with 4 starts (from left to right) at 45 °, 60 ° and 75 °.
4. Heating
In the first of the experiment, water without particles is passed to a volumetric flow equal to
that of fluidization in order to make the comparison between both experiments and thus to
obtain the data under the same operating conditions. Volumetric flow, concentric tube
velocity, Reynolds number, temperature at the heater surface, water temperature, pressure
drop between the inlet and outlet, heat flow and convection coefficient are recorded by the
law of Newton cooling. With this arrangement for both processes a 20-minute period was
considered to reach steady state condition to take the readings, Figure 8.
Figure 8. Fluidization with heating.
W/O
Baffle
W/O Baffle
&
Baffle 3-45°
Baffle 4-45° Baffle 5-60°

& Particles With
Particles
W/O
Particles
With
Particles
W/O
Particles
With
Particles
W/O
Particles
With
Particles
v[m/s] 0.369 0.369 0.340 0.340 0.380 0.380 0.239 0.239
[kg/s] 0.499 0.499 0.499 0.499 0.499 0.499 0.499 0.499
Re 10952.30 10952.30 5553.74 5553.74 5872.3 5872.3 3556.28 3556.28
T1 [°C] 87.96 73.68 73.85 62.60 70.71 64.8 64.50 56.80
T2 [°C] 17.30 17.70 20.57 22.01 21.66 22.01 18.30 19.0
T3 [°C] 18.55 18.93 21.36 22.96 23.08 23.94 19.42 20.23 2] 0.022 0.043 0.028 0.046 0.039 0.060 0.044 0.061
Q [W/m2] 35986.8 35986.8 35986.8 35986.8 35986.8 35986.8 35986.8 35986.8
h[W/m2°C] 509.29 638.36 675.50 886.68 733.75 841.10 779.02 952.13
A[m2],HTA 0.0106 0.0106 0.0106 0.0106 0.0106 0.0106 0.0106 0.0106
Table 3. Values obtained during fluidization with heating.
5. Discussion
There are numerous experimental studies of fluidization that support both their resistance to
fouling on the heat exchange surfaces and the considerable increase in heat transfer
coefficient. [7]
However, recent literature indicates that higher heat transfer coefficients can be achieved in
the wall of vertical tubes immersed in the bed than with fluidized beds inside tubes in the
case of liquid-solid fluidization. [8]
The suspension of the bed can be achieved in a better way with the interaction between
inclined plates; the system allows thus a wide range of suspension. On the other hand, it
aids in the retention of particles within the vessel and it also attenuates fluctuations during
fluidization. [9]
Dense suspensions are possible during fluidization at speeds greater than the terminal
velocity of the particles. With the installation of the inclined plates, however, they alter the
dynamic characteristics of the fluidized bed, in particular, impacting on the expansion
behavior of the suspension. [10]
It is possible to retain the bed by reducing the vertical velocity of the fluidizing fluid at the
outlet of the bed chamber thereby using the baffle or baffles. [11]
Such flows, where a particle represents a helical path due to an axial flow component and a
rotating member, are referred to as the helical flows. Therefore, for a pressure driven flow,
the increase in axial flow velocity is attributed exclusively to the rheological effects
combined with the orthogonal stresses (the flow in the azimuthal direction lies in a plane
which is orthogonal to the axial direction). [12]
6. Conclusions

By fluidizing the seven different particles in the vertical column without baffles and
without heating the seven different particles, it was found that the particle # 5 was
suspended in a more homogeneous way in relation to the others and also counted on the
smallest minimum velocity value fluidization, so then it is chosen to be fluidized in the
same vertical column with helical baffles of 3, 4, and 5 propellers at 45 °, 60 ° and 75 ° of
inclination, thus determining which is the best configuration in hydrodynamic tests.
According to the values of velocities obtained within the different geometries by means of
CFD (Comsol), it was possible to verify by means of visualization that the best
configurations of the 9 different ones that were tested, are those of 3-45 °, 4-45 ° and 5-60 °
with the most homogeneous fluidization compared to the others. The best velocities are
presented in the 5-45 ° configuration, but at the moment of the visualizations, it is observed
that, by restricting the cross section area through which the fluidization originates, this is
not homogeneous and the particles started to be stagnant as observed.
During heating for the three geometries mentioned above and with the selected particle, it
was obtained that the configuration that offers the best behavior was the baffle 3-45º,
although its convection coefficient (with particles) is smaller in relation to 5-60º, this does
not present stagnation of the particles through the helix, effect that if present the geometries
4-45º and 5-60º.
The fluidization by itself is observed to increase the convection coefficient by 25.3% with
respect to traditional concentric tubes and the only helical effect 32.6%, 44.1% and 52.9%
(respectively 3-45 °, 4-45 ° and 5 -60°). In conjunction, these two techniques of enhanced
in heat transfer give us convection coefficients (following the same order) 74.1%, 65.15
and 86.9% higher than conventional ones.
References
1) Jamialahmadi M, Müller-Steinhagen, Hydrodynamics and heat transfer of liquid
fluidized bed systems, Chem. Eng. Comm. Vol. 179, pp. 35-79, 2000.
2) Haid, M., Correlations for the prediction of heat transfer to liquid-solid fluidized beds,
Chemical Engineering and Processing Vol. 36, (2), 143-147, 1997.
3) Jamialahmadi M, Malayeri M. R., Müller-Steinhagen H., Prediction of heat transfer to
liquid-solid fluidized beds, Canadian Journal of Chemical Engineering, Vol. 73, pp. 444-
455, 1995.
4) Experimental and Theorical Determination of Minimum Velocity of Fluidization, Unit
Operations Laboratory Department of Chemical Engineering, University of Florida. March
13 2015.
5) Bandopadhyay A, Goswami P., Chakraborty S. Effect of streaming current on helical
flows of powerlaw fluids. Physics of Fluids 26, 122003, 2014.
6) Yakubov B., Tanny J, Maron D.M., Brauner N. The dynamics and structure of a liquid
solid fluidizedbed in inclined pipes. Chemical Engineering Journal 128 105-114 (2007).
7) Rautenbach R, Kollbach J., New developments in fluidized bed heat transfer for
preventing fouling, Swiss Chem., Vol. 8, (5), 47-55, 1986.
8) Kenichi Hashizume, Akira Shirai, Koichi Fukai y Akihiro Fukagawa, Heat Transfer on
Tube Bundles Embedded Vertically in Liquid-Fluidized Beds, Heat Transfer Asian
Research, 38 (8), 520-535, 2009.
9) K. P. Galvin, G. Nguyentranlam, Influence of parallel inclined plates in a liquid
fluidized bed system, Chemical Engineering Science, 57, 1231 1234, 2002.
10) E. Doroodchi, K.P. Galvin, D.F. Fletcher, The influence of inclined plates on expansion
behaviour of solid suspensions in a liquid fluidised bed a computational fluid dynamics
study, Powder Technology, 156, 1-7, 2005.
11) Giang Nguyentranlam, Kevin P. Galvin, Applications of the Reflux Classifier in solid
liquid operations, Int. J. Miner. Process., 73, 83 89, 2004.
12) Bandopadhyay A, Goswami P., Chakraborty S. Effect of streaming current on helical
flows of powerlaw fluids. Physics of Fluids 26, 122003, 2014.