Muonography of large natural and industrial objects...Motor control card 20 Tomographic Images taken...
29
Muonography of large natural and industrial objects ISCRA 2019, 25 June 2019, MEPhI, Moscow, Russia
Transcript of Muonography of large natural and industrial objects...Motor control card 20 Tomographic Images taken...

Muonography of large natural and industrial
objects
ISCRA 2019, 25 June 2019, MEPhI, Moscow, Russia

T.V. Shchedrina, A.K. Abiev, A.V. Bagulya, M.M. Chernyavsky,
A.B. Dashkina, A.A. Dimitrienko, A.A. Gadjiev, M.S. Gadjiev,
V.I. Galkin, A.A. Gippius, L.A. Goncharova, V.M. Grachev,
N.S. Konovalova , A.K. Managadze, N.M. Okateva
N.G. Polukhina , T.M. Roganova, N.I. Starkov ,
A.A. Teymurov, V. Tioukov, S.G. Vasina and P.I. Zarubin.
ISCRA 2019, 25 June 2019, MEPhI, Moscow, Russia
Lebedev Physical Institute, Russian Academy of Sciences, Moscow, Russia Institute of History, Archeology and Ethnography, Dagestan Scientific Centre, Russian Academy of Sciences, Makhachkala, Republic of Dagestan, Russia Dagestan State University, Makhachkala, Republic of Dagestan, Russia National University of Science and Technology MISiS, Moscow, Russia Faculty of Physics, Lomonosov Moscow State University, Moscow, Russia National Research Nuclear University MEPhI, Moscow, Russia Skobeltsyn Institute of Nuclear Physics, Moscow State University, Moscow, Russia INFN Sezione di Napoli, Naples, Italy Joint Institute for Nuclear Research, Dubna, Moscow Region, Russia

Outlook The principle of muonography and application areas
Nuclear emulsions as a tracking detector
advantages of emulsion tracking detector
PAVICOM scanning station
Exposure in citadel of Naryn-Kala, Derbent
Simulation and data analysis
Conclusions and perspectives
ISCRA 2019, 25 June 2019, MEPhI, Moscow, Russia 3
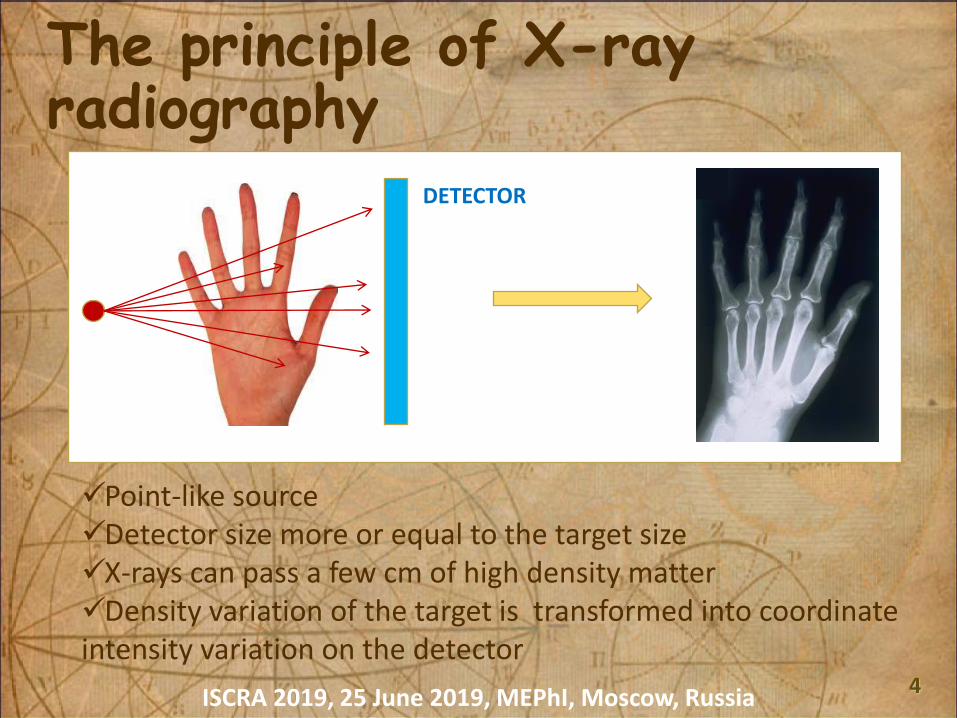
The principle of X-ray radiography
ISCRA 2019, 25 June 2019, MEPhI, Moscow, Russia 4
DETECTOR
Point-like source Detector size more or equal to the target size X-rays can pass a few cm of high density matter Density variation of the target is transformed into coordinate intensity variation on the detector
DETECTOR

The principle of muonography
ISCRA 2019, 25 June 2019, MEPhI, Moscow, Russia 5
Distributed radiation source Detector is point-like in respect to the target Muons can pass about a km of investigated objects Density variation of the target is transformed into angular intensity variation on the detector
DETECTOR
Angle to coordinate transformation is required to see this picture
DETECTOR

Atmospheric muons
6 ISCRA 2019, 25 June 2019, MEPhI, Moscow, Russia
Protons coming from space
muon flux is the penetrating component of cosmic rays; intensity at the see level: 10,000 µ / m2 / min; muons are capable of crossing hundreds of meters of rock with absorption
corresponding to the thickness of the substance they pass through; the maximum depth where the highest energy muons were recorded is about 8,600 m
in terms of water equivalent, which roughly corresponds to 2 km of rocky soil.

Application areas of MUONOGRAPHY
7 ISCRA 2019, 25 June 2019, MEPhI, Moscow, Russia

Application areas of MUONOGRAPHY Active volcano STROMBOLI, Italy
8
Rock thickness and mountain profiles as seen by the detector
Difference between the observed muon flux and the one expected from Monte Carlo simulation Color scale represents muons counts.
the crater region seen from the detector location
Detector location and crater in a map from the Digital Elevation Model The color scale indicates the elevation in meters.
Rock density changes, dense lava channels and low density magma supply channels at Stromboli
suggest a strong control of the crater area structure!

Application areas of MUONOGRAPHY Great East Japan Earthquake
9 ISCRA 2019, 25 June 2019, MEPhI, Moscow, Russia

10
Application areas of MUONOGRAPHY Ice-bedrock interface of alpine glaciers
Detector frames installed at the rock wall in the railway tunnel
Muonography first time applied to the field of glaciology. The technique provides important information when other geological procedures such as radar and seismic inspections can not be used
Jungfrau Railway
The project is financially supported by the Swiss national Science Foundation

Advantages of emulsion tracking detector
11
High sensitivity and excellent tracking
capability with angular resolution few mrad
and spatial resolution less than 1µm
High information capacity
Simple design and relatively small < 1m2
Easy transportable to the object
Able to work in harsh environments
Do not require power supply

NUCLEAR EMULSION as a tracking detector
12
June25_Presentation_14_ShchedrinaT_Anim.gif
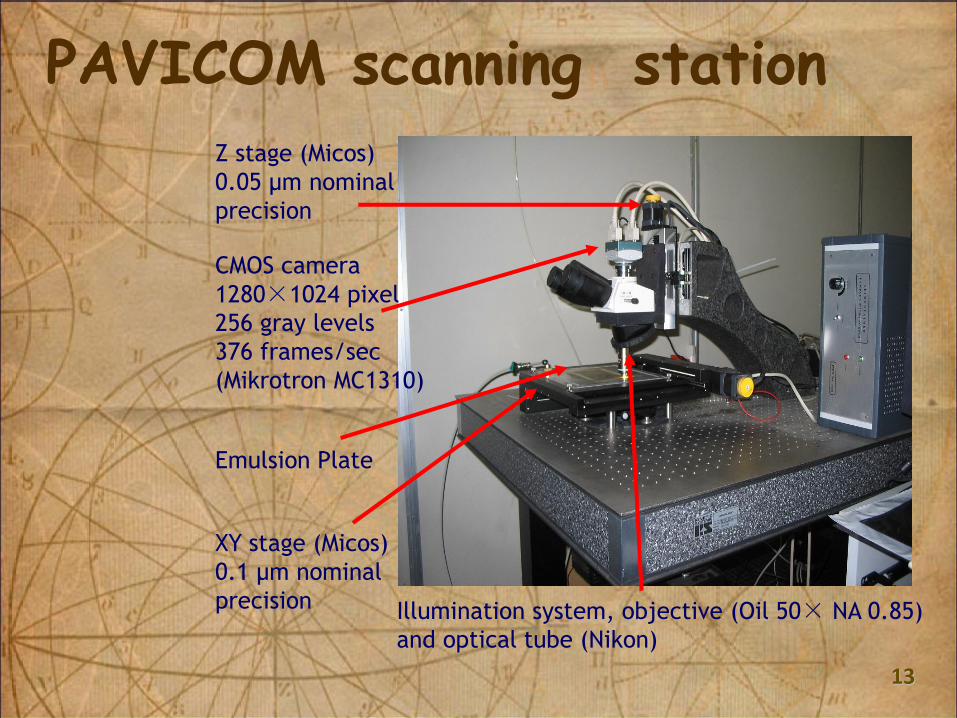
PAVICOM scanning station
13
CMOS camera
1280×1024 pixel
256 gray levels
376 frames/sec
(Mikrotron MC1310)
XY stage (Micos)
0.1 μm nominal
precision
Emulsion Plate
Z stage (Micos)
0.05 μm nominal
precision
Illumination system, objective (Oil 50× NA 0.85)
and optical tube (Nikon)

14
14
Principle of the automatic emulsion scanning
Movable stage
Image Processing board Motor control card
20 Tomographic Images taken through 40-micron Emulsion Layer

15
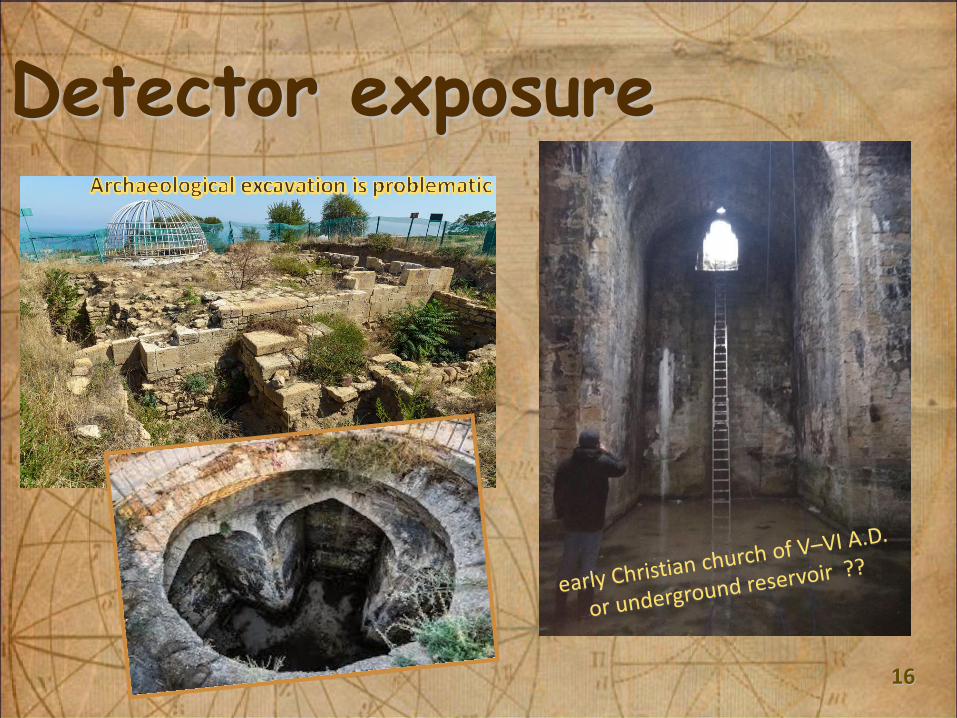
Naryn-Kala citadel in Derbent
16
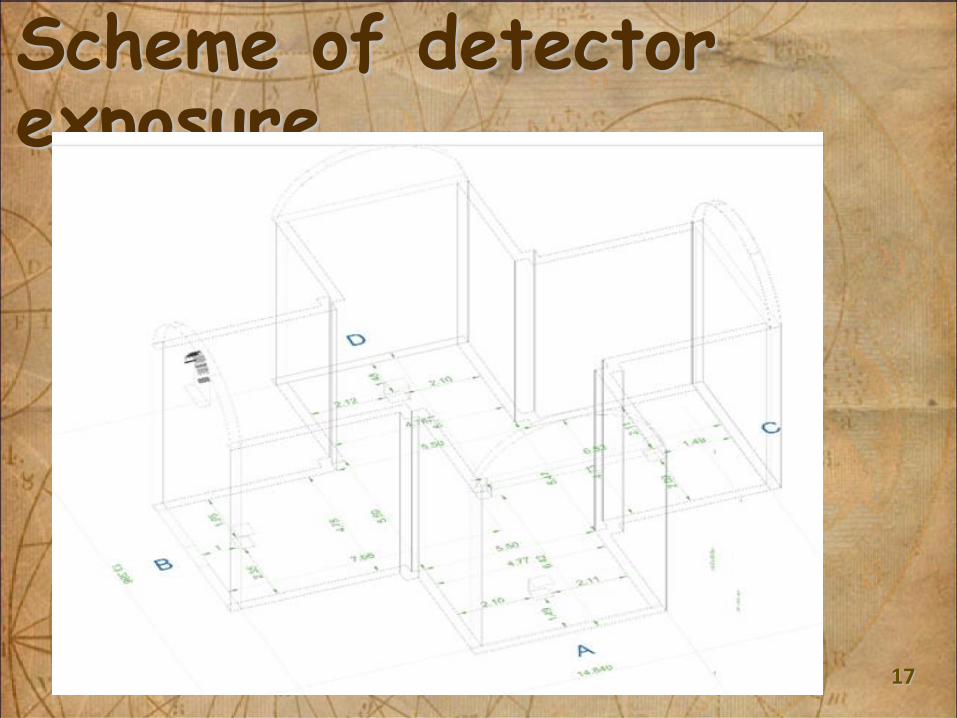
Detector exposure
17
Scheme of detector exposure

Detector construction
11
Inox steel frame
Elastic (rubber) layers
Enveloped emulsion films
2 months of exposure
19
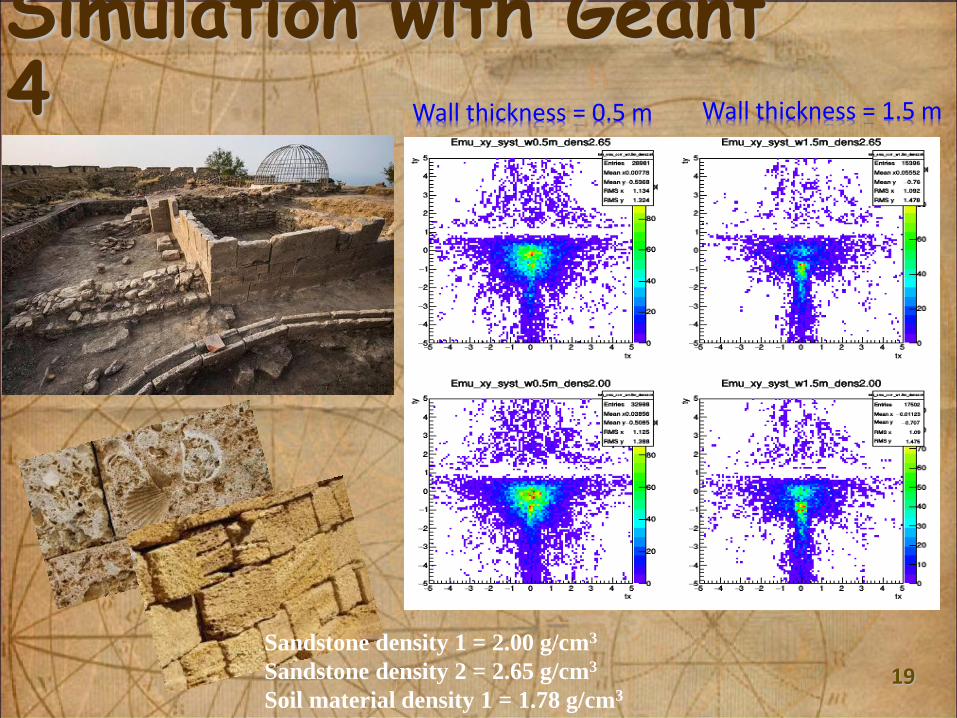
Simulation with Geant 4 Wall thickness = 0.5 m
Wall thickness = 1.5 m
Sandstone density 1 = 2.00 g/cm3
Sandstone density 2 = 2.65 g/cm3
Soil material density 1 = 1.78 g/cm3

20
Experimental data costgdz
dxtx
sintgdz
dyty

Conclusions The first results of test experiment with using the muonography method are reported
The technique makes it possible to obtain reliable experimental data interpretation for the structure of investigated objects
21
Detectors installation on the western slope of the fortress outside the walls of the building to obtain 3D tomogram of the underground cross-shaped dome structure under discussion, simulation in progress
Optimization automated scanning system PAVICOM for increasing scanning speed in progress
and perspectives

Backup slides

Data processing for muonography
Microtracks
30 GB / film (120 cm2)
Filtered microtracks
1.5 GB / film (120 cm2)
Volume tracks
500 MB / 5 emulsion films
Full detector (1 m2)
40 GB

Detectors made with nuclear emulsions

Track reconstruction algorithm
Image processing • substitution of the light field
background • image filtration • applying threshold and binarization
Grains reconstruction • finding clusters on each depth • reconstructing grains in each
field of view
Microtracks reconstruction for each emulsion layer
• finding all "links" - pairs of clusters • selecting links that have grain
density along it over the threshold (prepare microtrack candidates)
• histogramming of these links and finding microtracks
• fitting of the found microtracks
~15M links -> ~150k selected links -> ~1500 microtracks
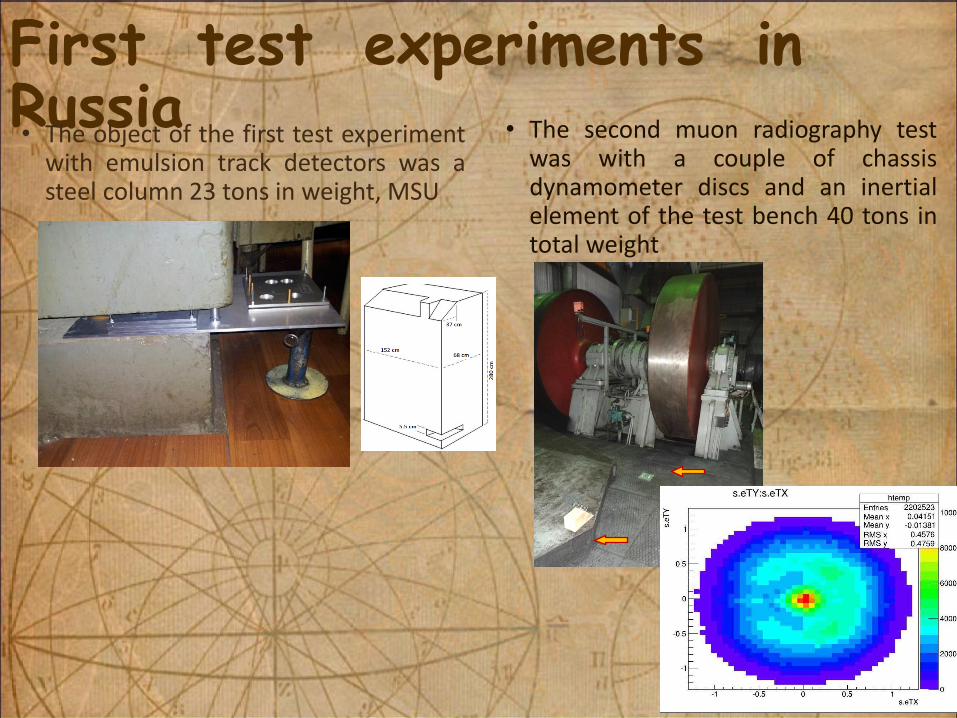
First test experiments in Russia • The object of the first test experiment
with emulsion track detectors was a steel column 23 tons in weight, MSU
9
• The second muon radiography test was with a couple of chassis dynamometer discs and an inertial element of the test bench 40 tons in total weight

The third experiment, Obninsk RAS
The experiment goal was to assess the possibility of
“finding” a cavity (elevator mine shaft at a depth of 30
m) in the bulk of ground and to register the difference in
fluxes of atmospheric muons at the earth surface and at
a depth after passing the layer of ground
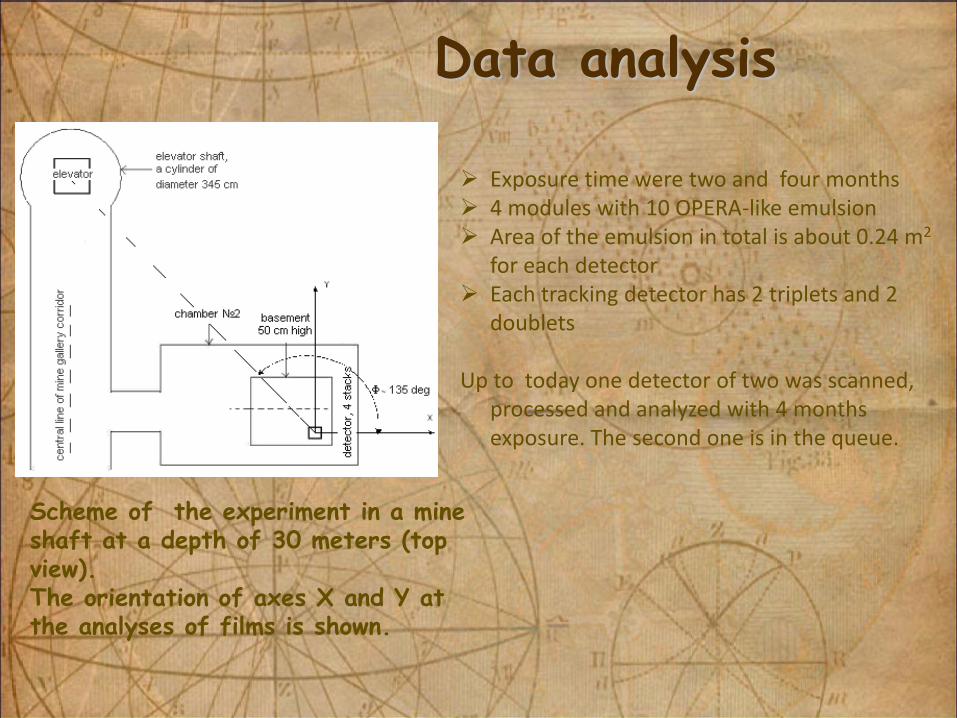
Data analysis
Scheme of the experiment in a mine shaft at a depth of 30 meters (top view). The orientation of axes X and Y at the analyses of films is shown.
Exposure time were two and four months 4 modules with 10 OPERA-like emulsion Area of the emulsion in total is about 0.24 m2
for each detector Each tracking detector has 2 triplets and 2
doublets
Up to today one detector of two was scanned, processed and analyzed with 4 months exposure. The second one is in the queue.

The track density as a function of the 2 components TX and TY of the track slope. .
To select original tracks from other background tracks, the original two-dimensional distribution (TX, TY) subtracted averaged over the azimuthal angle Φ background.
Data analysis


![Introduccion matem atica a la tomograf a...Verano de las Matem aticas, del 28 de junio al 24 de julio. CIMAT. Tomograf a [5/116] Radiolog a (rayos X) 254 Chapter 10. Tomographic Evaluation](https://static.fdocuments.ec/doc/165x107/60e1951521526514260c6b0a/introduccion-matem-atica-a-la-tomograf-a-verano-de-las-matem-aticas-del-28.jpg)