
Medicina - Mi Medicina Interna Miniharrison-T09 Hematología Oncología
Luis Paz-Ares
Hospital Universitario Doce de Octubre,
Madrid, Spain
Medicina Personalizada en
Oncología:
el Ejemplo del Cáncer de Pulmón
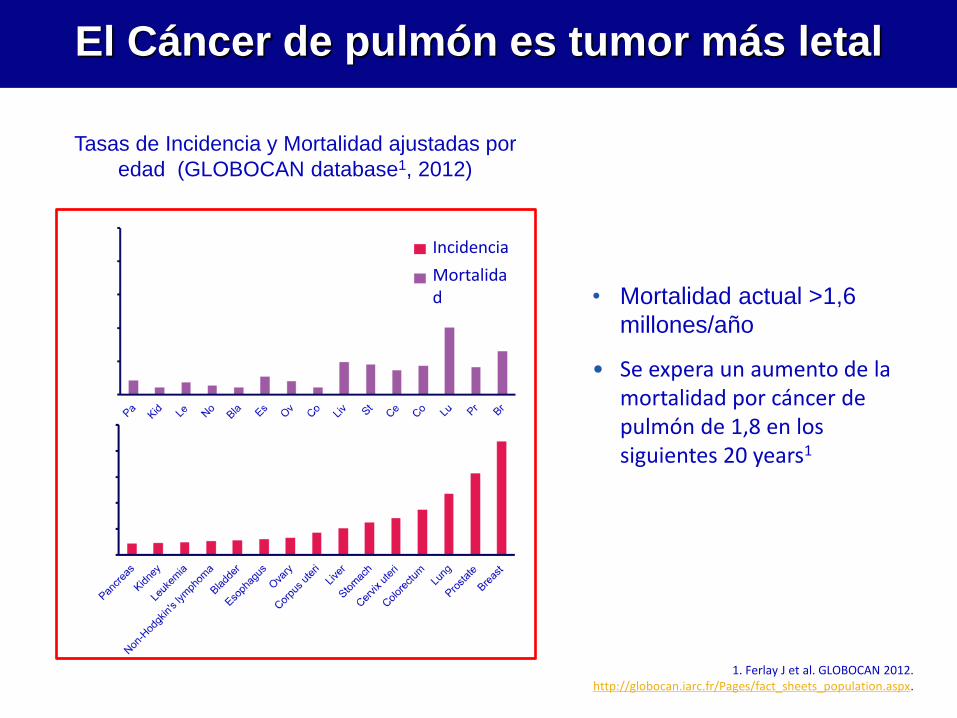
El Cáncer de pulmón es tumor más letal
1. Ferlay J et al. GLOBOCAN 2012. http://globocan.iarc.fr/Pages/fact_sheets_population.aspx.
• Mortalidad actual >1,6
millones/año
• Se expera un aumento de la mortalidad por cáncer de pulmón de 1,8 en los siguientes 20 years1
Tasas de Incidencia y Mortalidad ajustadas por
edad (GLOBOCAN database1, 2012)
Age
-sta
nd
ard
ized
rat
e (w
orl
d)
per
10
0,0
00
Incidencia
Mortalidad
Age
-sta
nd
ard
ized
rat
e (w
orl
d)
per
10
0,0
00
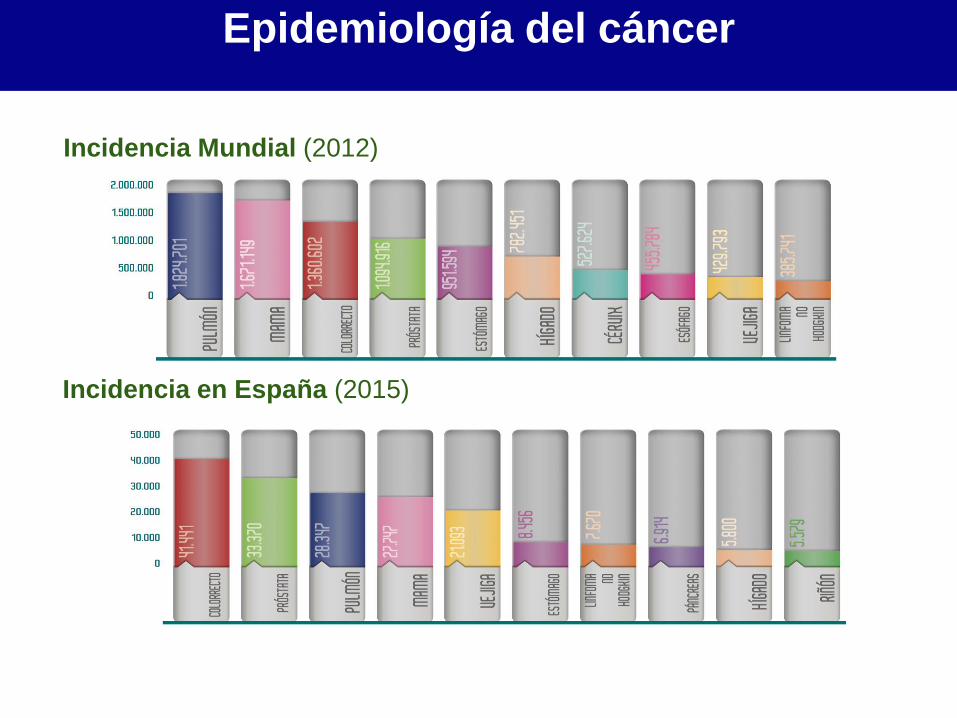
Incidencia Mundial (2012)
Incidencia en España (2015)
REDECAN. Cancer Incidence in Spain 2015. Clin Transl Oncol. DOI 10.1007/s12094-016-1607-9
Epidemiología del cáncer
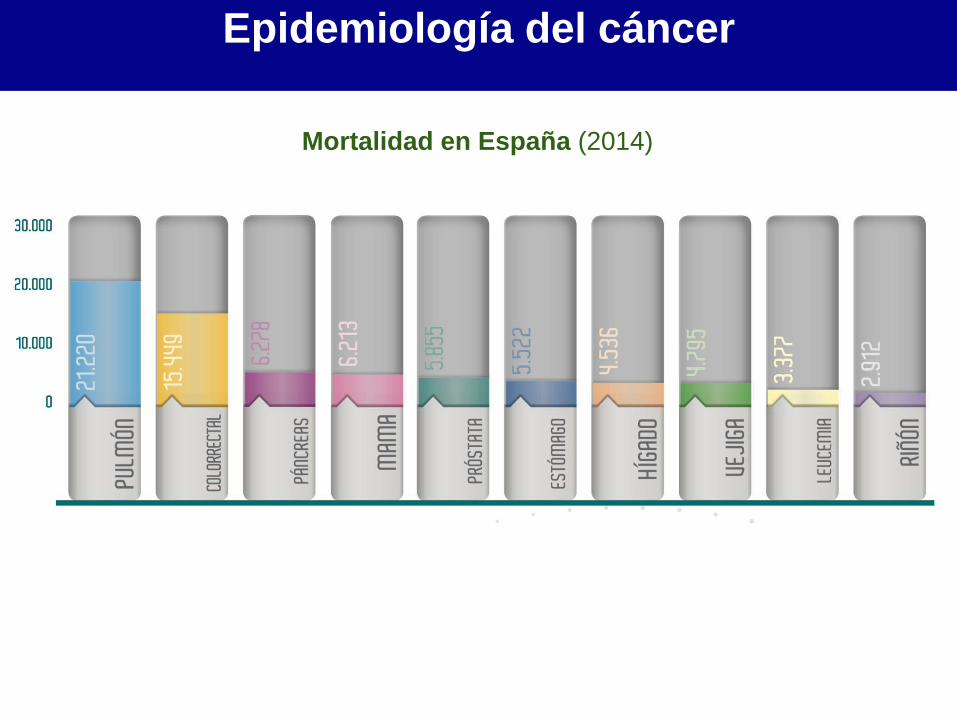
Epidemiología del cáncer
Mortalidad en España (2014)
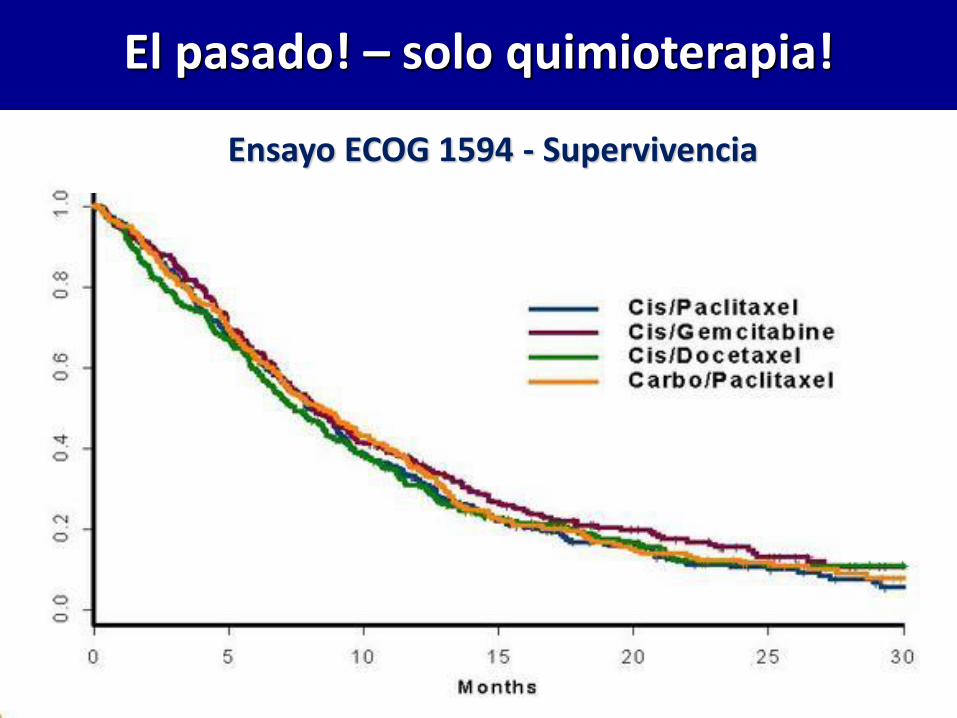
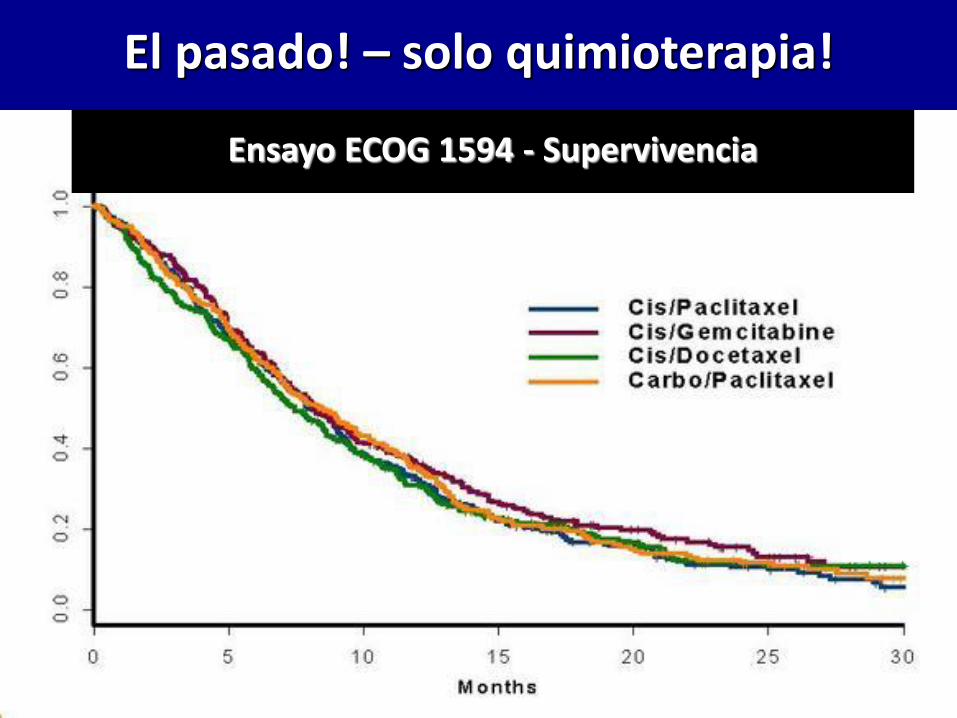
El pasado! – solo quimioterapia!
Ensayo ECOG 1594 - Supervivencia
• Conocimiento y tecnología
• Adicción oncogénica
• Subgrupos difíciles
• Estrategias prometedoras
• Perspectivas
Agenda

• Conocimiento y Tecnología
• Adicción oncogénica
• Subgrupos difíciles
• Estrategias prometedoras
• Perspectivas
Agenda
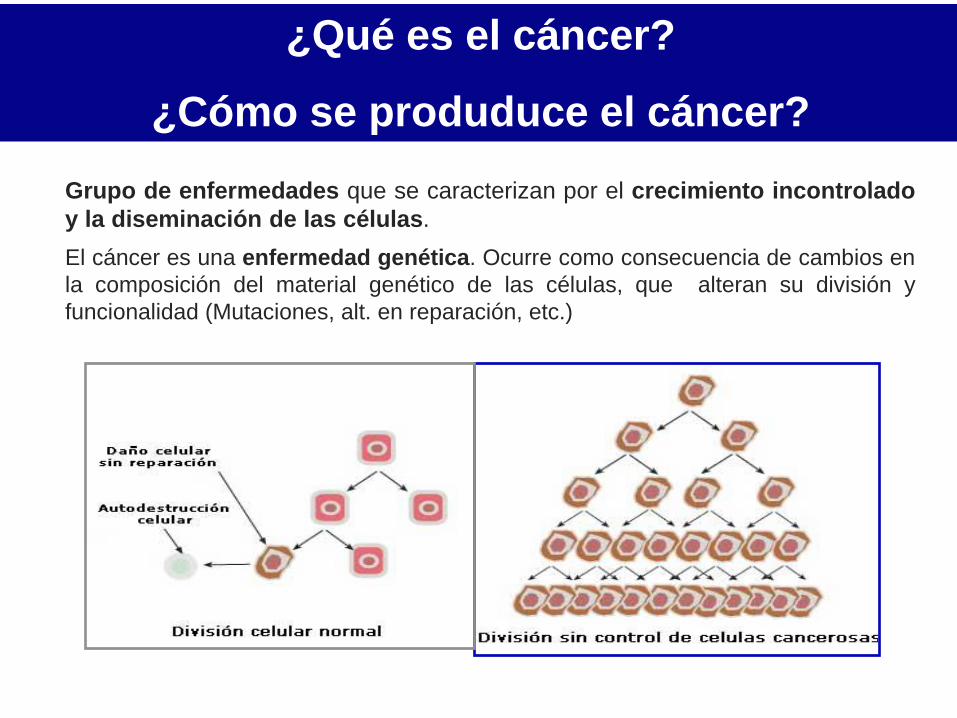
¿Qué es el cáncer?
¿Cómo se produduce el cáncer?
Grupo de enfermedades que se caracterizan por el crecimiento incontrolado
y la diseminación de las células.
El cáncer es una enfermedad genética. Ocurre como consecuencia de cambios en
la composición del material genético de las células, que alteran su división y
funcionalidad (Mutaciones, alt. en reparación, etc.)
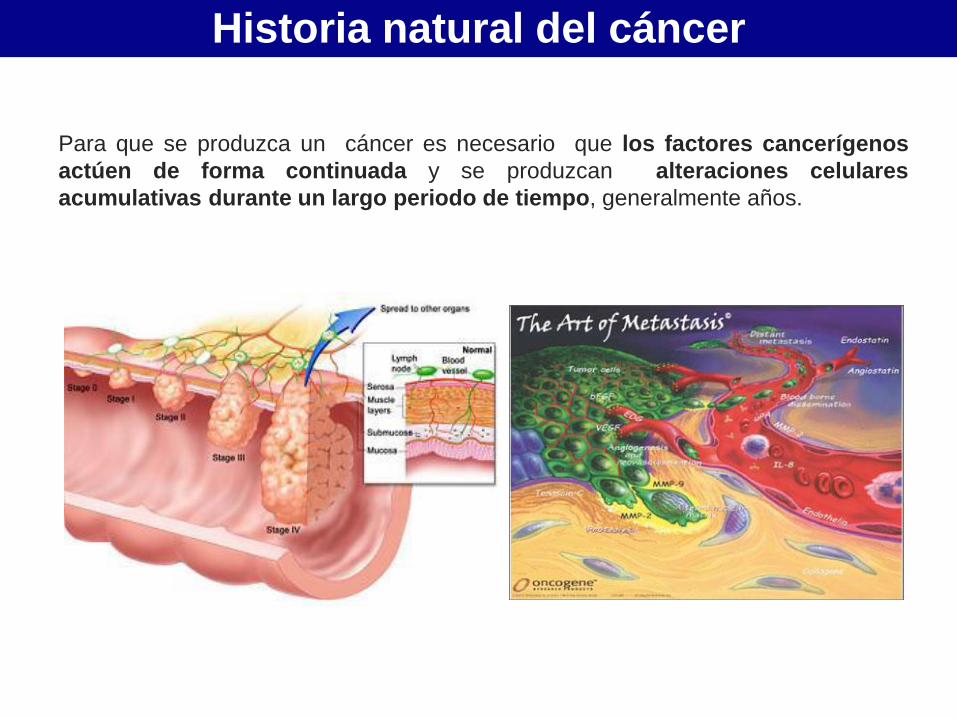
Historia natural del cáncer
Para que se produzca un cáncer es necesario que los factores cancerígenos
actúen de forma continuada y se produzcan alteraciones celulares
acumulativas durante un largo periodo de tiempo, generalmente años.
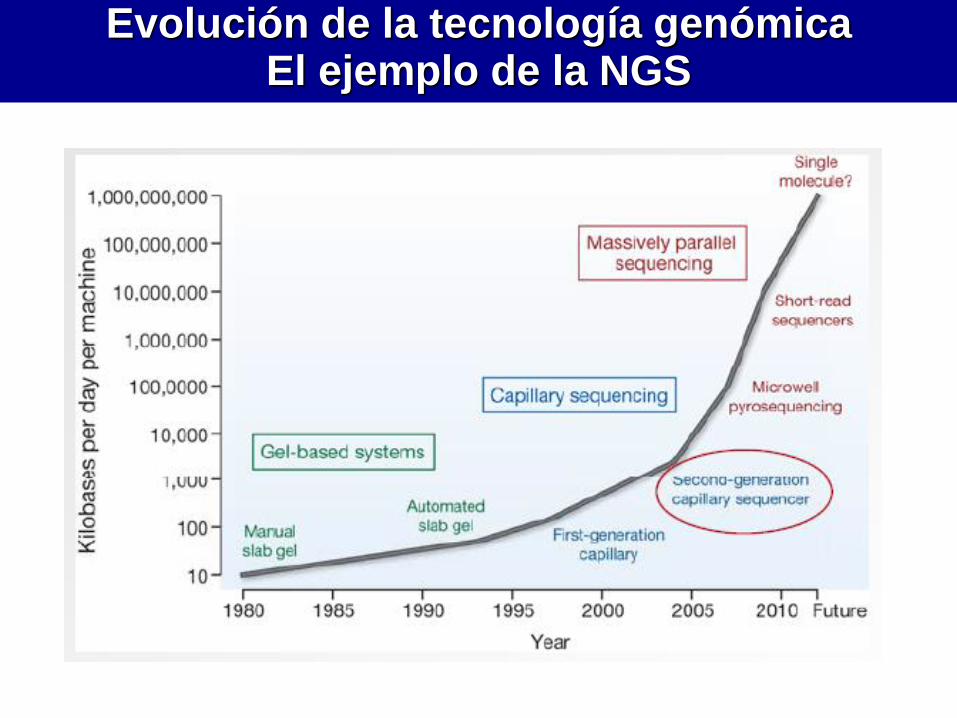
Evolución de la tecnología genómica El ejemplo de la NGS
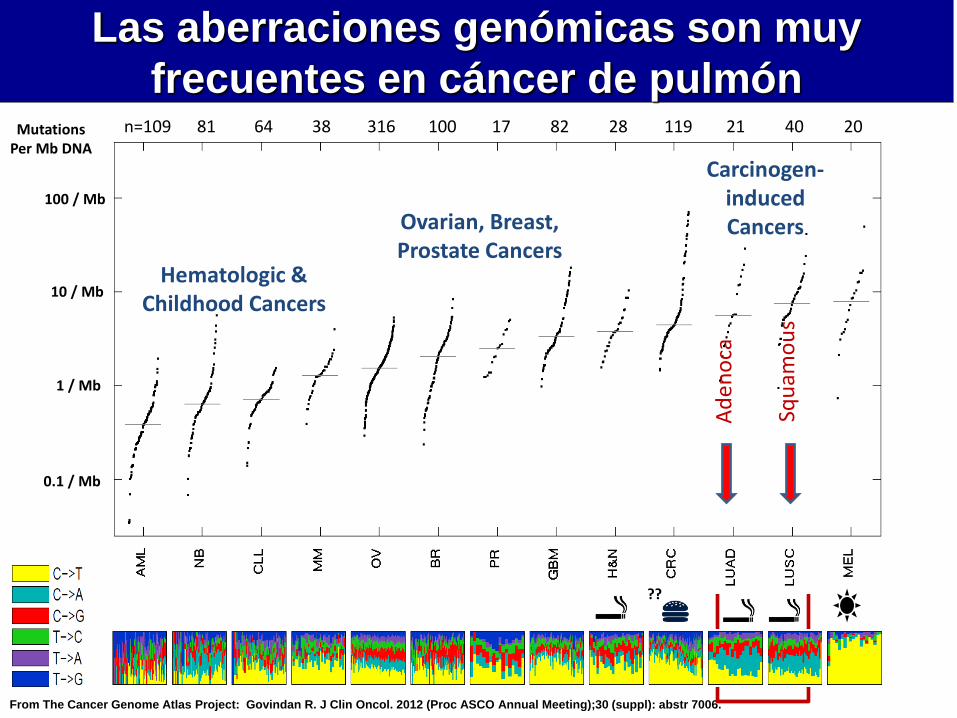
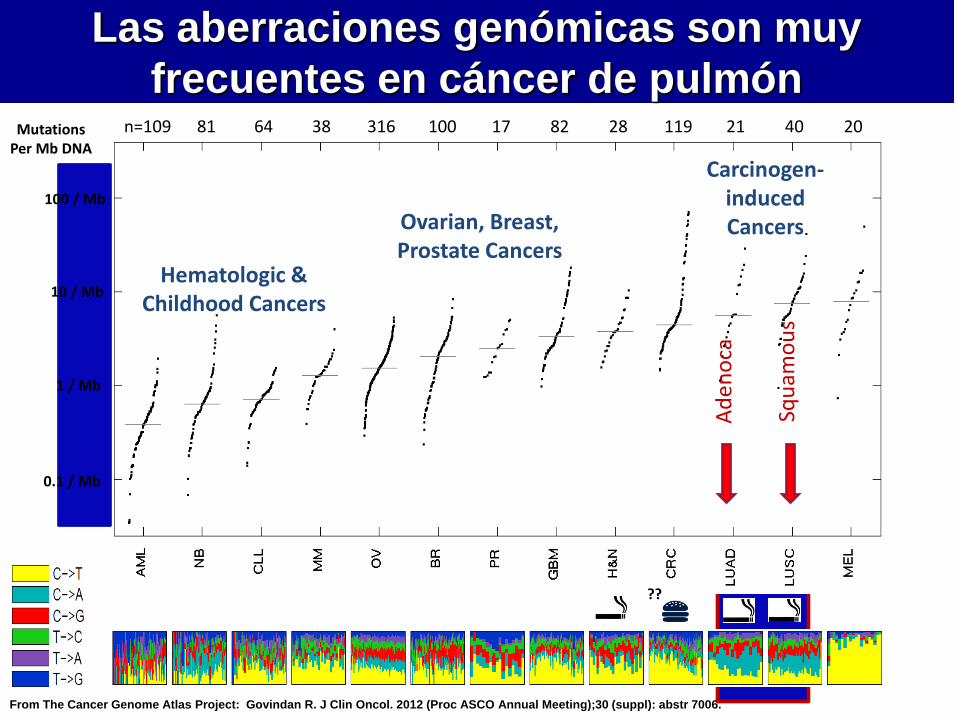
From The Cancer Genome Atlas Project: Govindan R. J Clin Oncol. 2012 (Proc ASCO Annual Meeting);30 (suppl): abstr 7006.
1 / Mb
10 / Mb
100 / Mb
0.1 / Mb
81 64 38 316 100 17 82 28 n=109 119 21 40 20
Hematologic & Childhood Cancers
Carcinogen-induced Cancers
??
Ad
en
oca
Squ
amo
us
Ovarian, Breast, Prostate Cancers
Mutations Per Mb DNA
Las aberraciones genómicas son muy
frecuentes en cáncer de pulmón
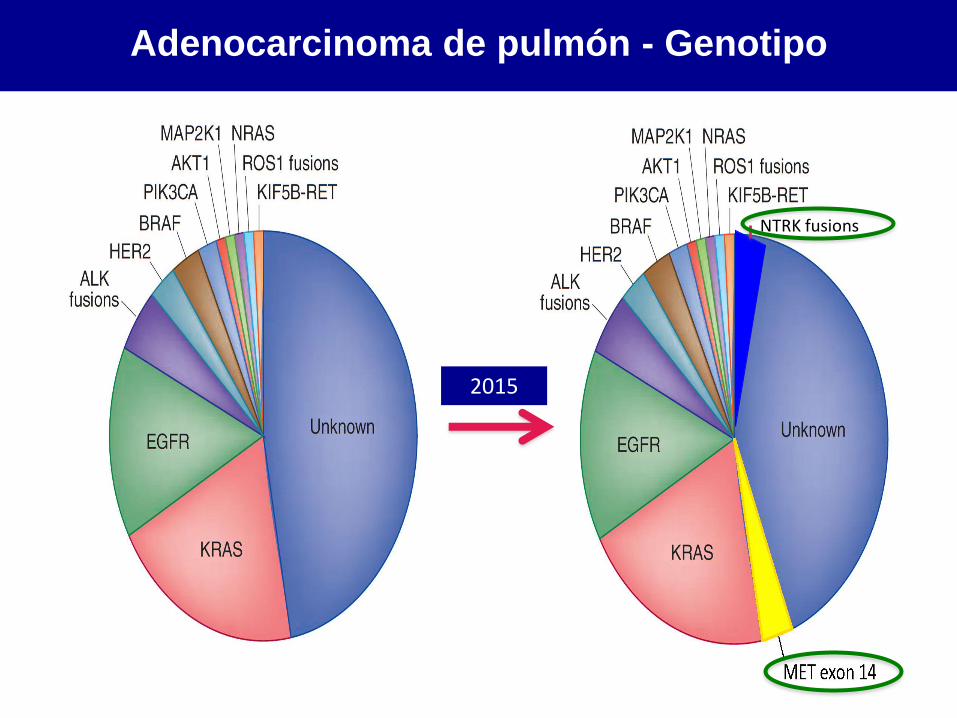
Adenocarcinoma de pulmón - Genotipo
NTRK fusions
2015
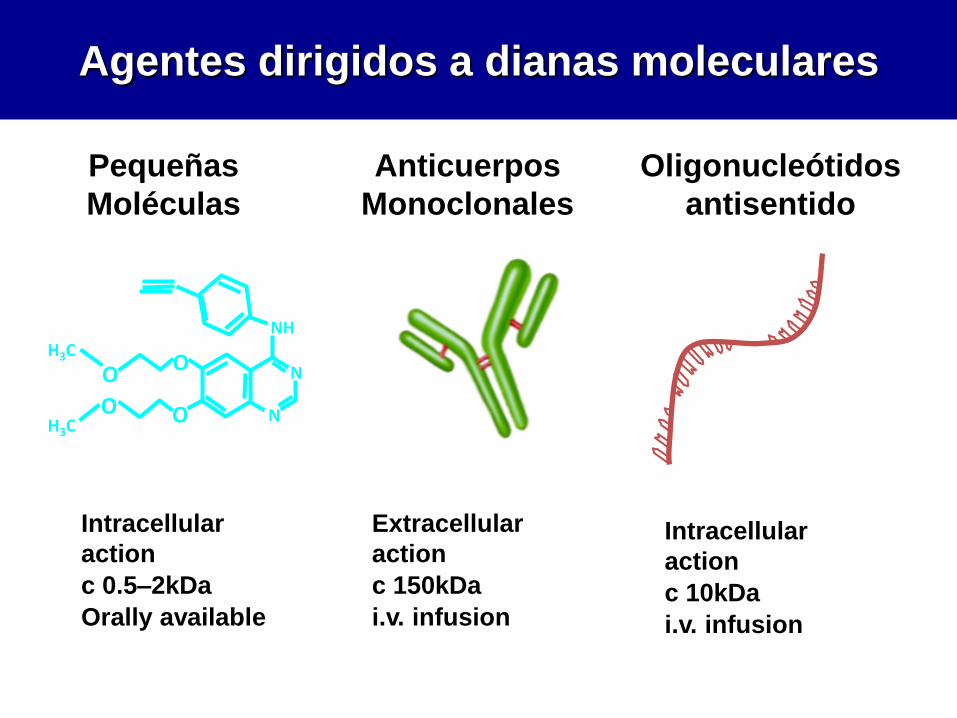
Agentes dirigidos a dianas moleculares
Intracellular
action
c 0.5–2kDa
Orally available
Pequeñas
Moléculas
Anticuerpos
Monoclonales
Extracellular
action
c 150kDa
i.v. infusion
O
O
H3C
H3C O
O
NH
N
N
Oligonucleótidos
antisentido
Intracellular
action
c 10kDa
i.v. infusion
• Conocimiento y tecnología
• Adicción oncogénica
• Subgrupos difíciles
• Estrategias prometedoras
• Perspectivas
Agenda
El pasado! – solo quimioterapia!
Ensayo ECOG 1594 - Supervivencia
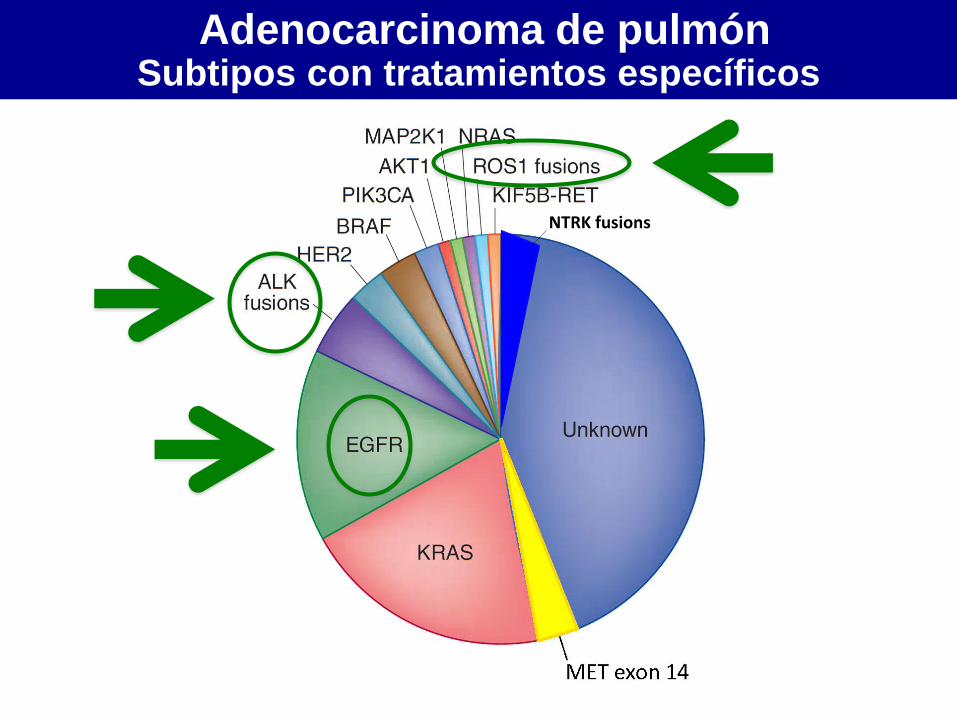
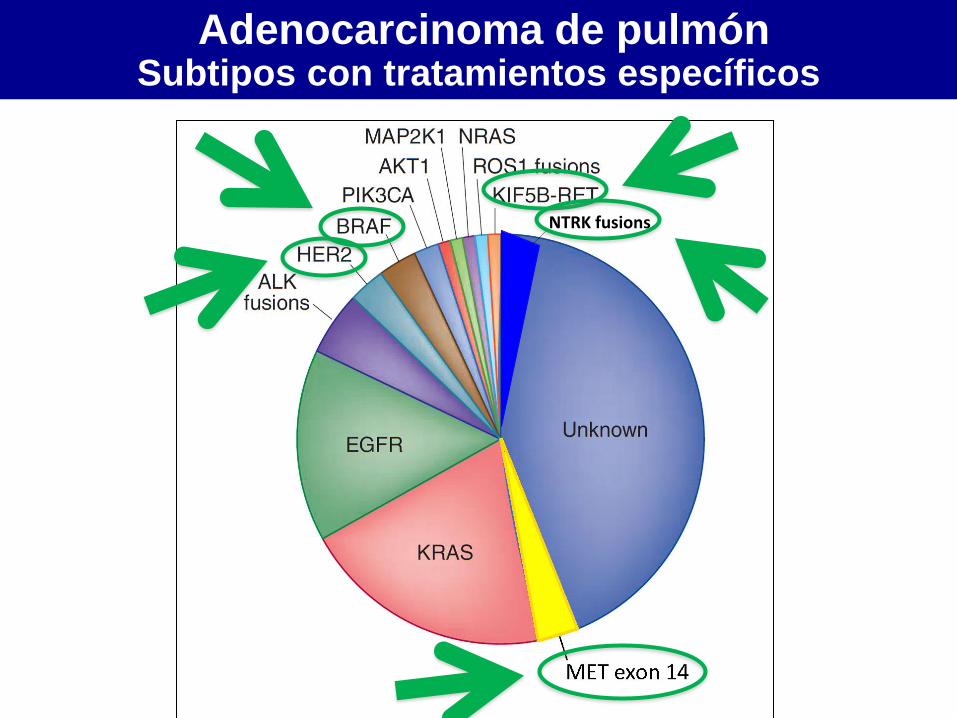
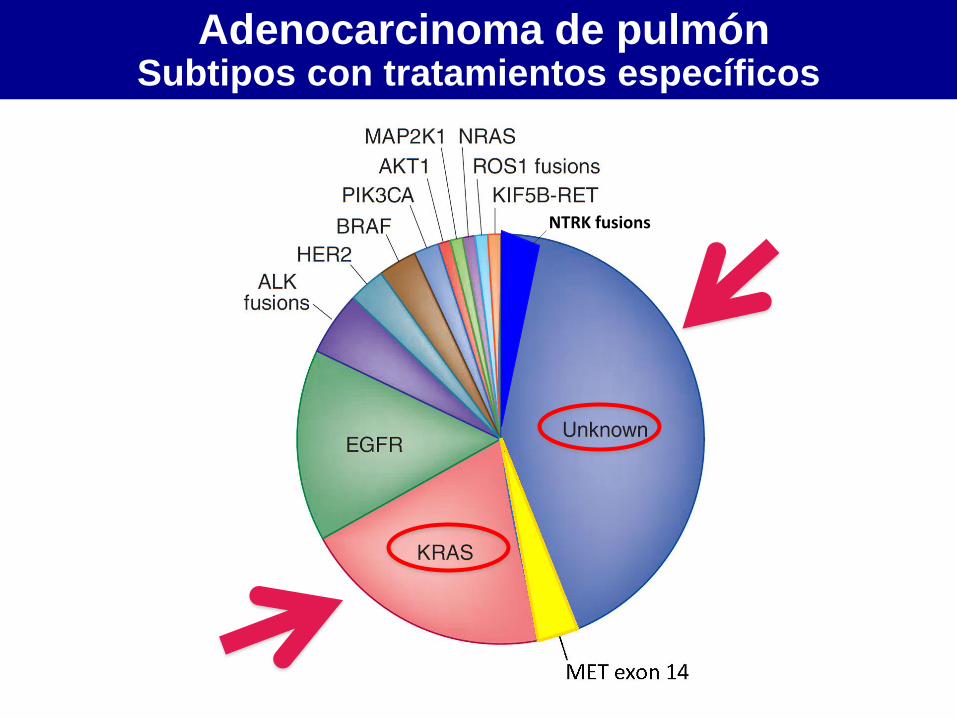
Adenocarcinoma de pulmón Subtipos con tratamientos específicos
NTRK fusions
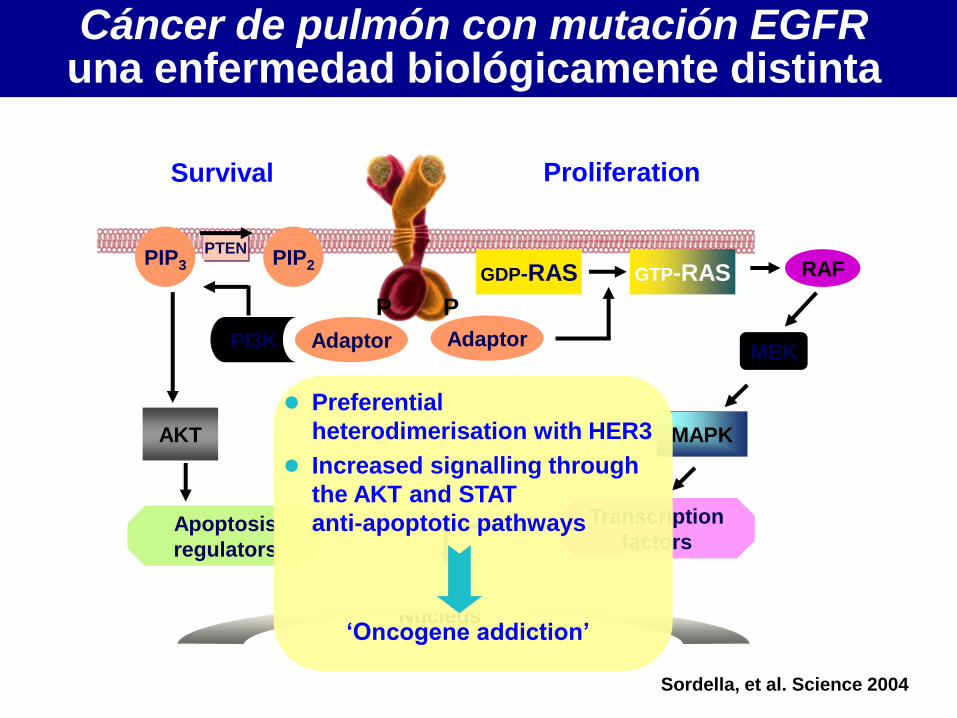
Cáncer de pulmón con mutación EGFR una enfermedad biológicamente distinta
P P
Nucleus
Adaptor
Survival
PIP2
PI3K
PIP3 PTEN
AKT
Apoptosis
regulators
Proliferation
Adaptor
Transcription
factors
MAPK
MEK
RAF GTP-RAS GDP-RAS
Sordella, et al. Science 2004
Preferential
heterodimerisation with HER3
Increased signalling through
the AKT and STAT
anti-apoptotic pathways
‘Oncogene addiction’
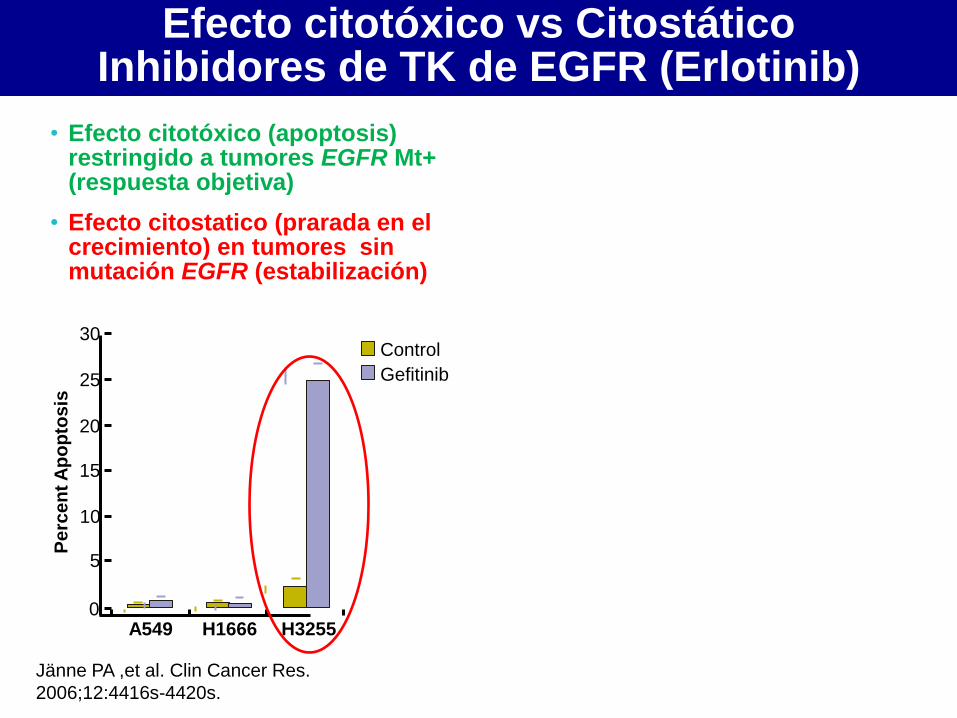
Efecto citotóxico vs Citostático Inhibidores de TK de EGFR (Erlotinib)
• Efecto citotóxico (apoptosis) restringido a tumores EGFR Mt+ (respuesta objetiva)
• Efecto citostatico (prarada en el crecimiento) en tumores sin mutación EGFR (estabilización)
Jänne PA ,et al. Clin Cancer Res.
2006;12:4416s-4420s.
A549 H1666 H3255 0
5
10
20
25
30
Pe
rce
nt
Ap
op
tos
is
15
Control
Gefitinib
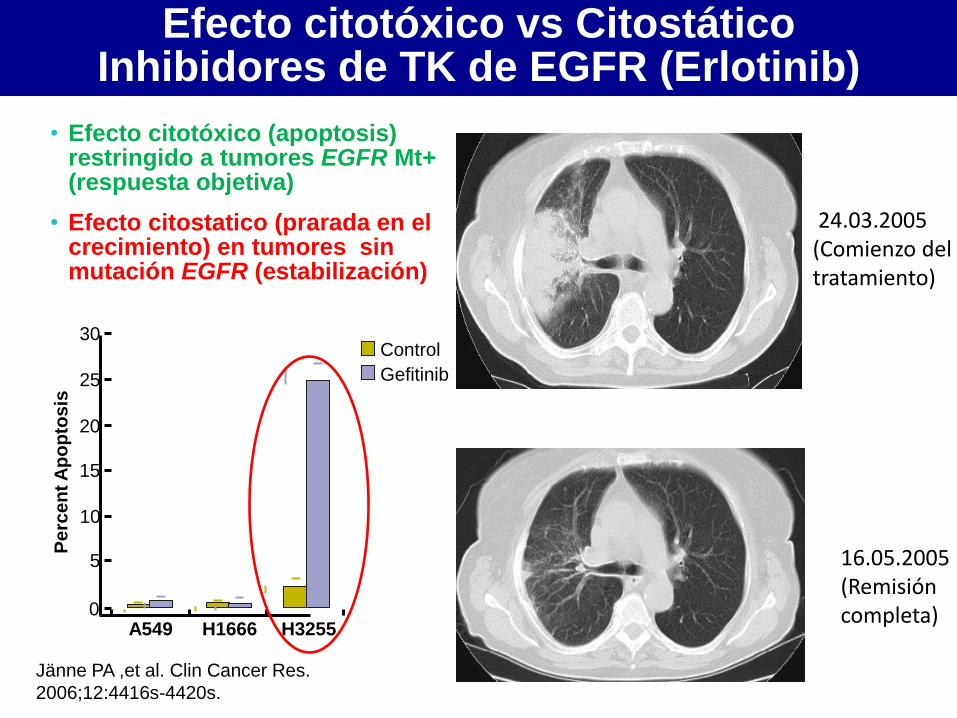
16.05.2005 (Remisión completa)
24.03.2005 (Comienzo del tratamiento)
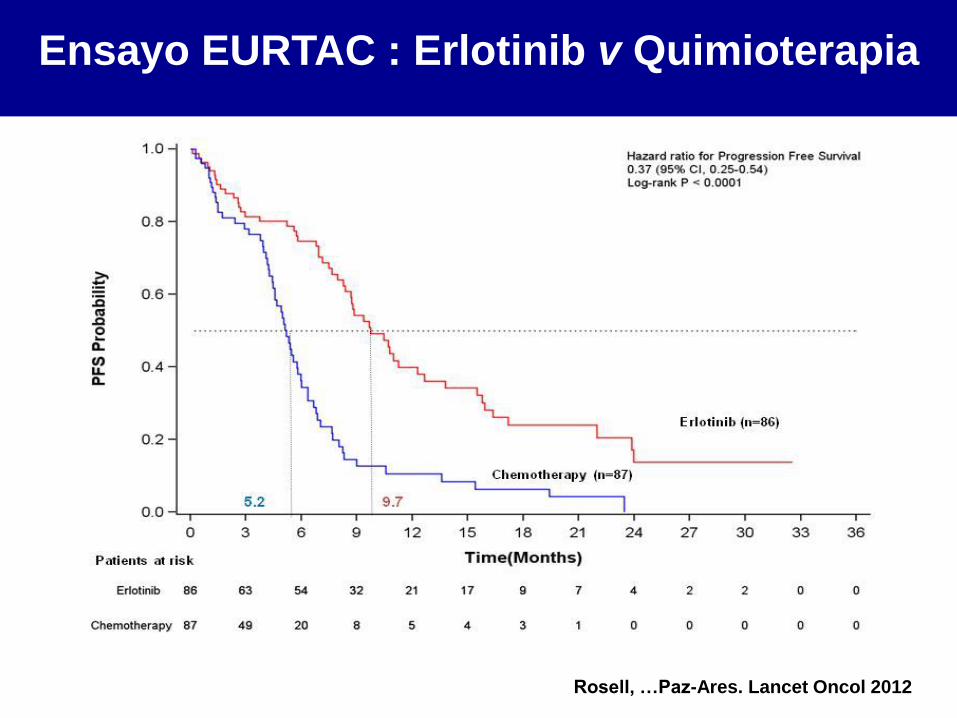
Ensayo EURTAC : Erlotinib v Quimioterapia
Rosell, …Paz-Ares. Lancet Oncol 2012
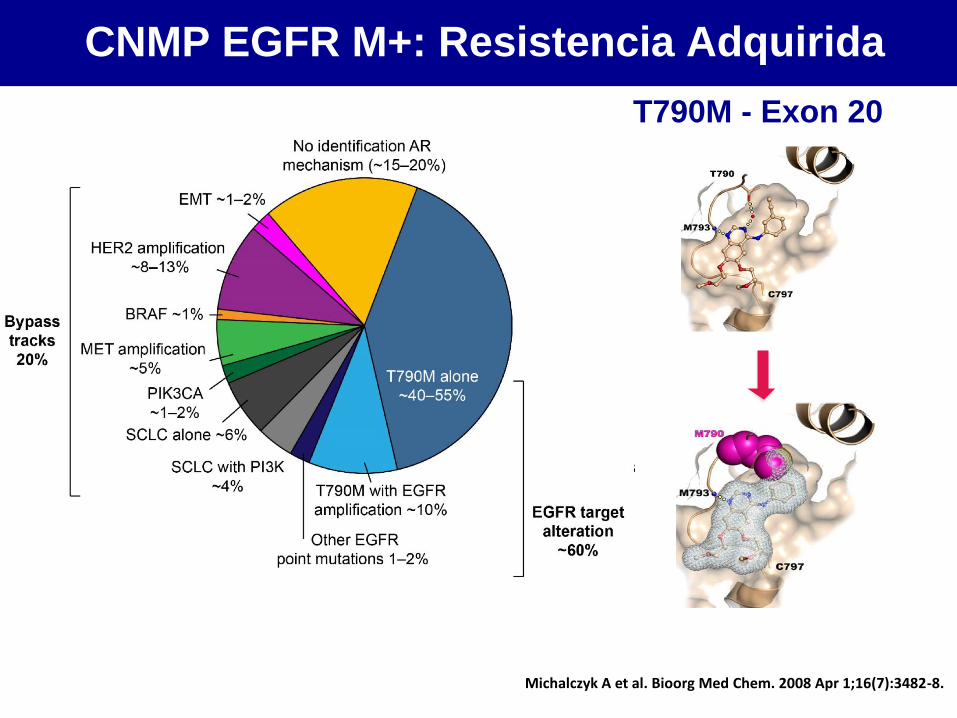
CNMP EGFR M+: Resistencia Adquirida
Yu HA et al. Clin Cancer Res. 2013;19:2240–7; Shaw AT, Engelman JA. J Clin Oncol. 2013;31:1105–11
EGFR mutant
Michalczyk A et al. Bioorg Med Chem. 2008 Apr 1;16(7):3482-8.
T790M - Exon 20
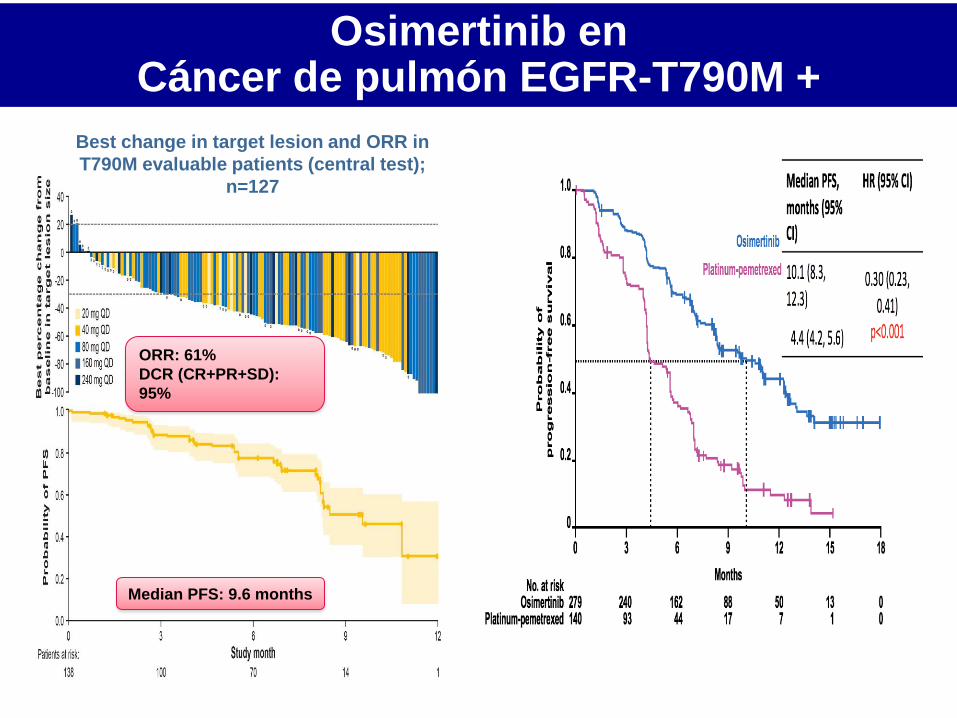
Osimertinib en Cáncer de pulmón EGFR-T790M +
P Janne et al., New Engl J Med 2015
ORR: 61%
DCR (CR+PR+SD):
95%
Median PFS: 9.6 months
Best change in target lesion and ORR in
T790M evaluable patients (central test);
n=127
Slide 31
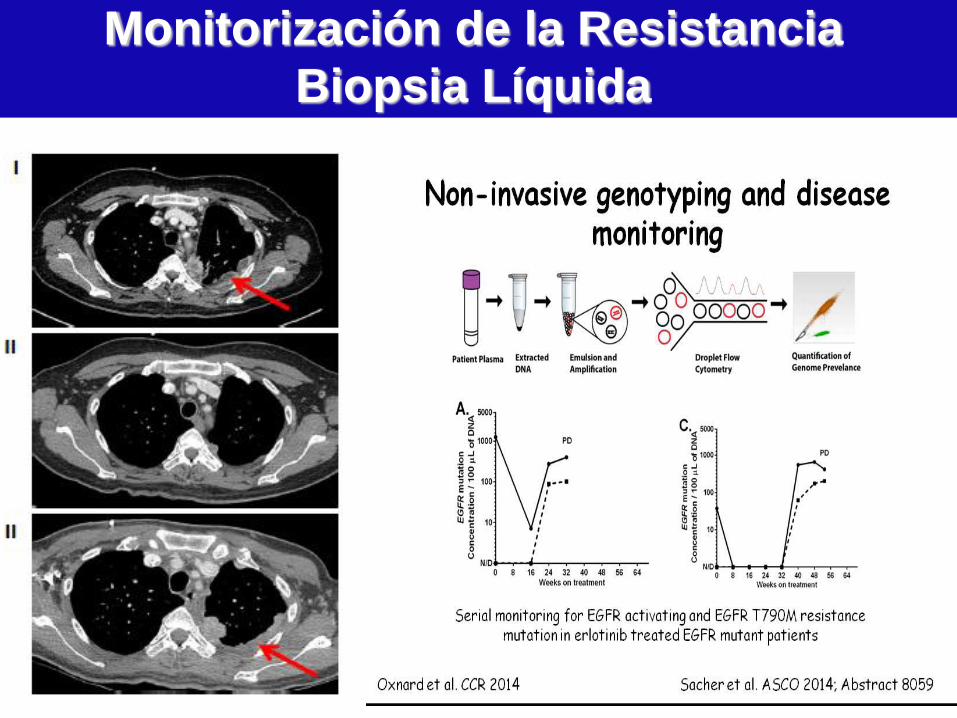
Monitorización de la Resistancia
Biopsia Líquida
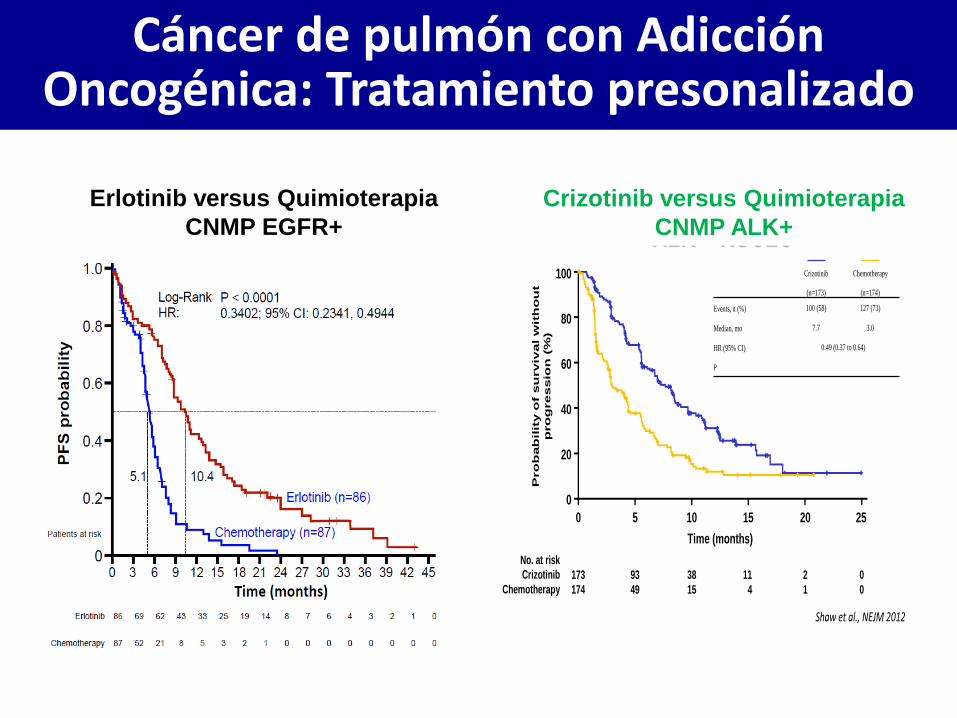
Cáncer de pulmón con Adicción Oncogénica: Tratamiento presonalizado
Crizotinib
(n=173)
Chemotherapy
(n=174)
Events, n (%) 100 (58) 127 (73)
Median, mo 7.7 3.0
HR (95% CI) 0.49 (0.37 to 0.64)
P <0.0001
CrizotinibCrizotinib vv Chemotherapy in Chemotherapy in ALK + NSCLCALK + NSCLC
Pro
bab
ilit
y o
f s
urviv
al w
ith
ou
t
pro
gressio
n (
%)
100
80
60
40
20
0
0 5 10 15 20 25
Time (months)
173 93 38 11 2 0
174 49 15 4 1 0
No. at risk
Crizotinib
Chemotherapy
Shaw et al., NEJM 2012
Erlotinib versus Quimioterapia
CNMP EGFR+
Crizotinib versus Quimioterapia
CNMP ALK+
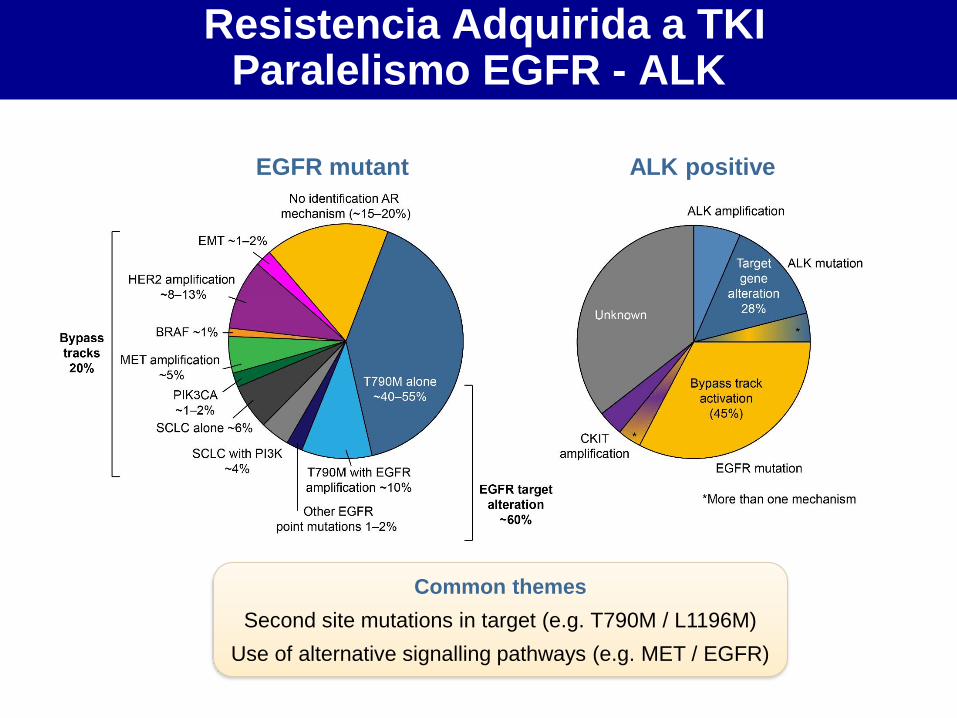
Resistencia Adquirida a TKI Paralelismo EGFR - ALK
Yu HA et al. Clin Cancer Res. 2013;19:2240–7; Shaw AT, Engelman JA. J Clin Oncol. 2013;31:1105–11
EGFR mutant ALK positive
Common themes
Second site mutations in target (e.g. T790M / L1196M)
Use of alternative signalling pathways (e.g. MET / EGFR)
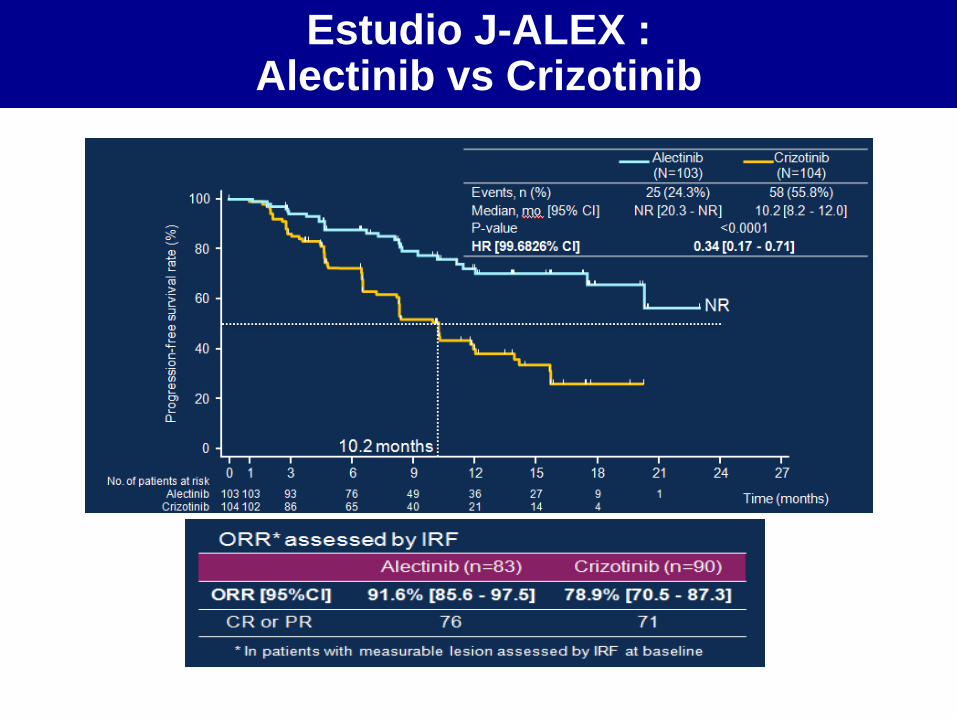
Estudio J-ALEX : Alectinib vs Crizotinib
Nokihara, et al. ASCO 2016. Abs 9008
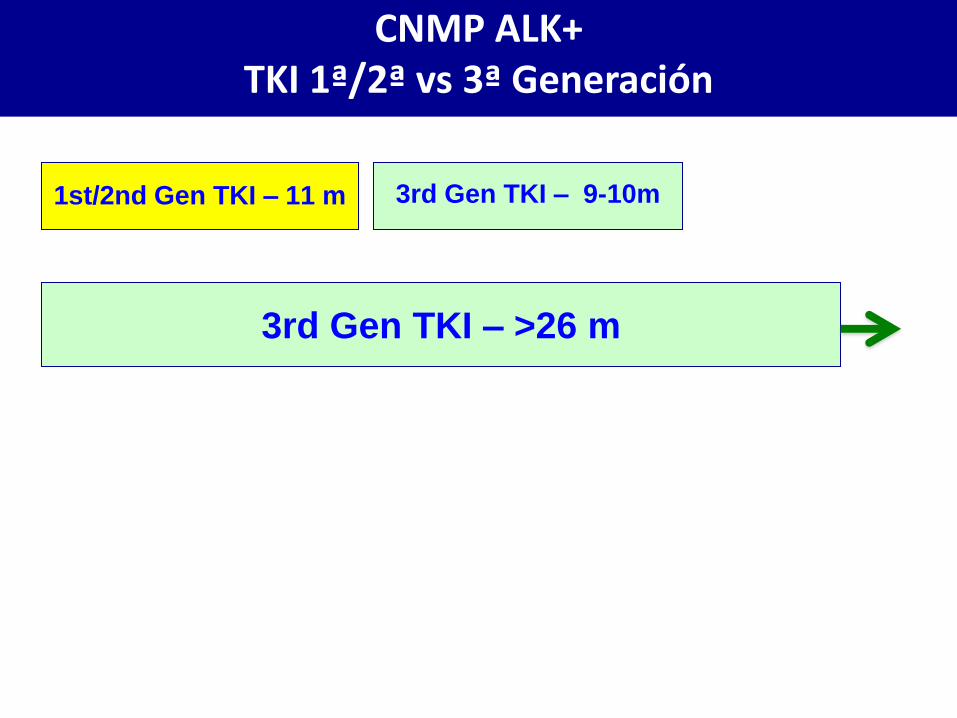
1st/2nd Gen TKI – 11 m 3rd Gen TKI – 9-10m
3rd Gen TKI – >26 m
CNMP ALK+ TKI 1ª/2ª vs 3ª Generación
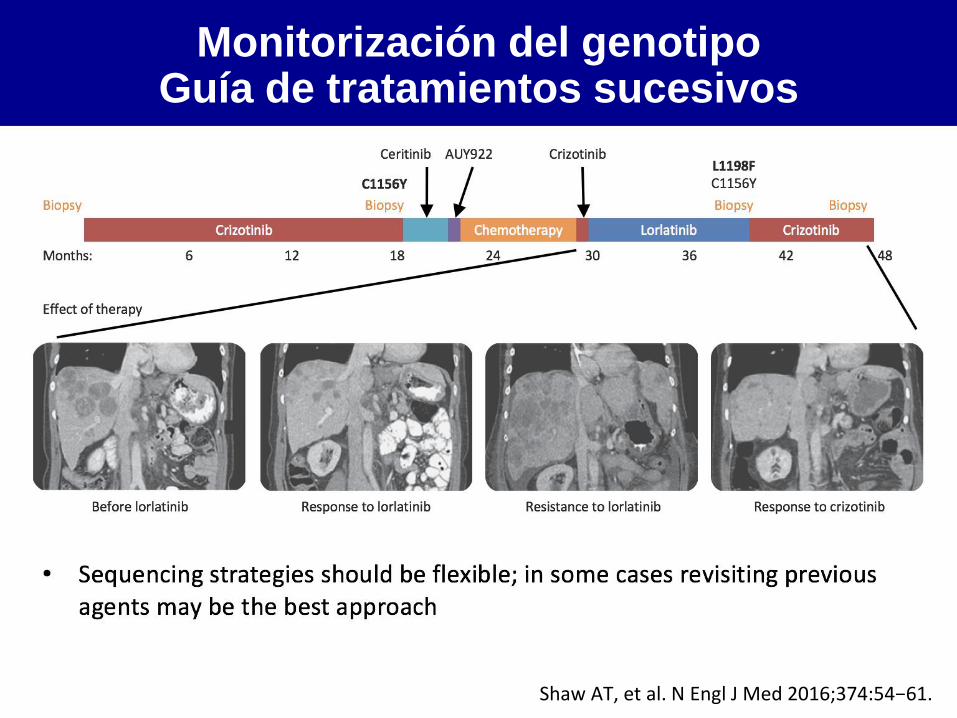
Monitorización del genotipo Guía de tratamientos sucesivos
• Sequencing strategies should be flexible; in some cases revisiting previous agents may be the best approach
Shaw AT, et al. N Engl J Med 2016;374:54−61.
Crizotinib Chemotherapy Lorlatinib Crizotinib
Ceritinib AUY922 Crizotinib
Biopsy Biopsy Biopsy Biopsy
Months: 6 12 18 24 30 36 42 48
Effect of therapy
Before lorlatinib Response to lorlatinib Resistance to lorlatinib Response to crizotinib
C1156Y L1198F C1156Y
NTRK fusions
Adenocarcinoma de pulmón Subtipos con tratamientos específicos
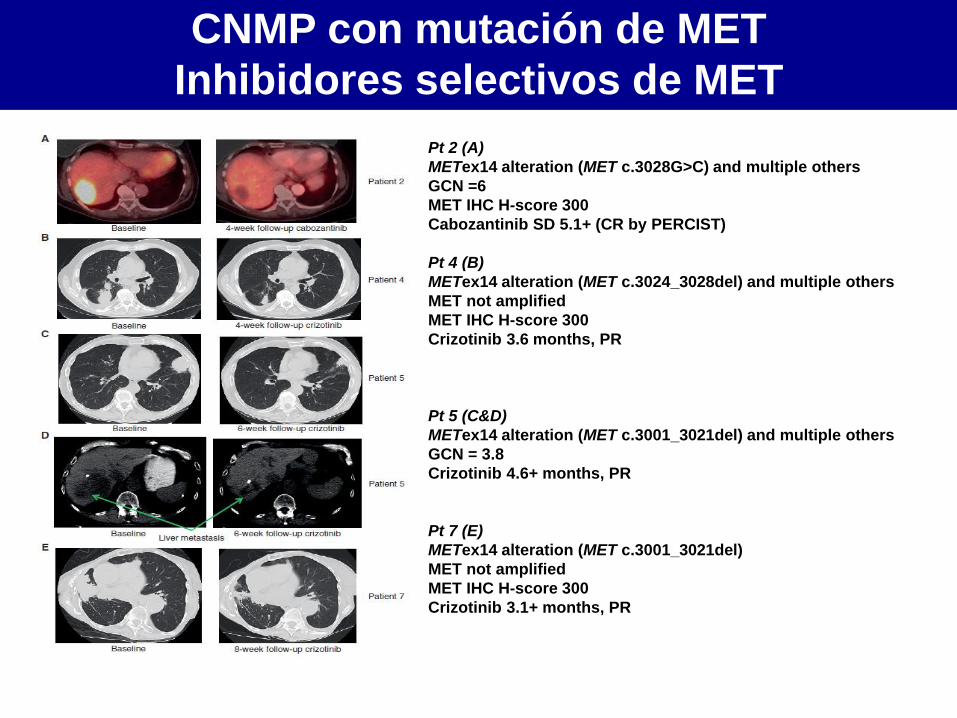
Pt 2 (A)
METex14 alteration (MET c.3028G>C) and multiple others
GCN =6
MET IHC H-score 300
Cabozantinib SD 5.1+ (CR by PERCIST)
Pt 4 (B)
METex14 alteration (MET c.3024_3028del) and multiple others
MET not amplified
MET IHC H-score 300
Crizotinib 3.6 months, PR
Pt 5 (C&D)
METex14 alteration (MET c.3001_3021del) and multiple others
GCN = 3.8
Crizotinib 4.6+ months, PR
Pt 7 (E)
METex14 alteration (MET c.3001_3021del)
MET not amplified
MET IHC H-score 300
Crizotinib 3.1+ months, PR
Paik PK, et al. Cancer Discov 2015
CNMP con mutación de MET
Inhibidores selectivos de MET
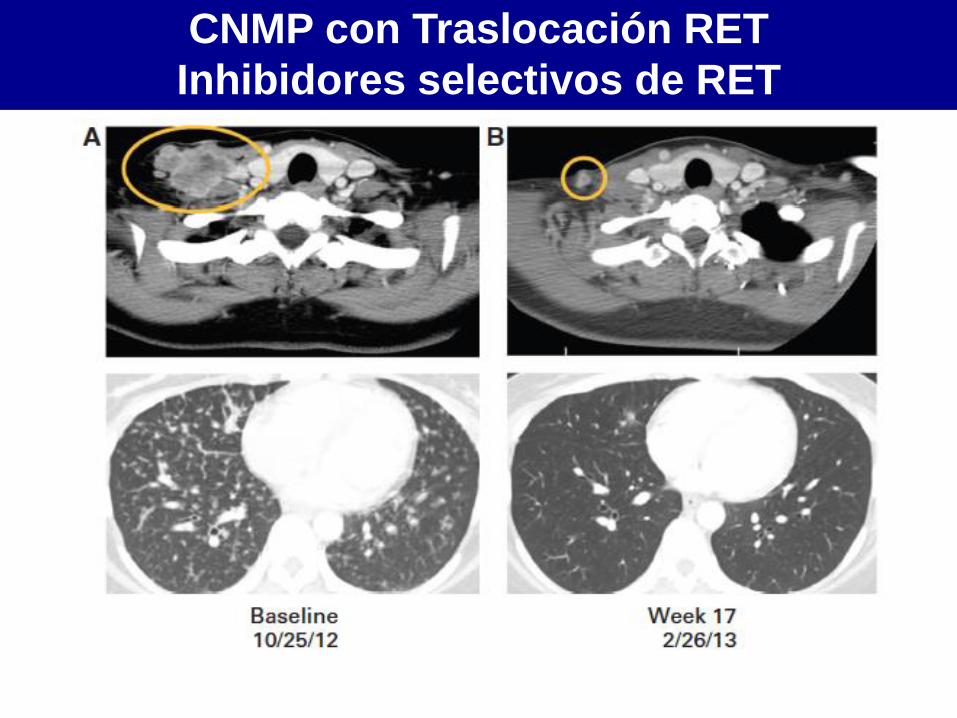
Falchook et al., J Clin Oncol 2014
CNMP con Traslocación RET
Inhibidores selectivos de RET
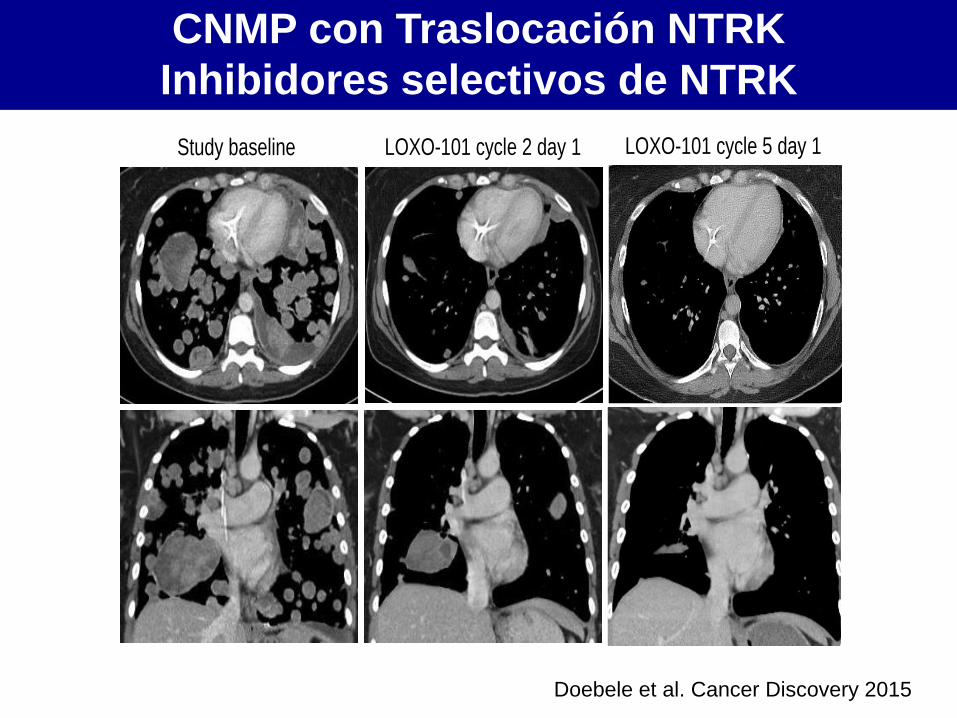
Study baseline LOXO-101 cycle 5 day 1 LOXO-101 cycle 2 day 1
Doebele et al. Cancer Discovery 2015
CNMP con Traslocación NTRK
Inhibidores selectivos de NTRK
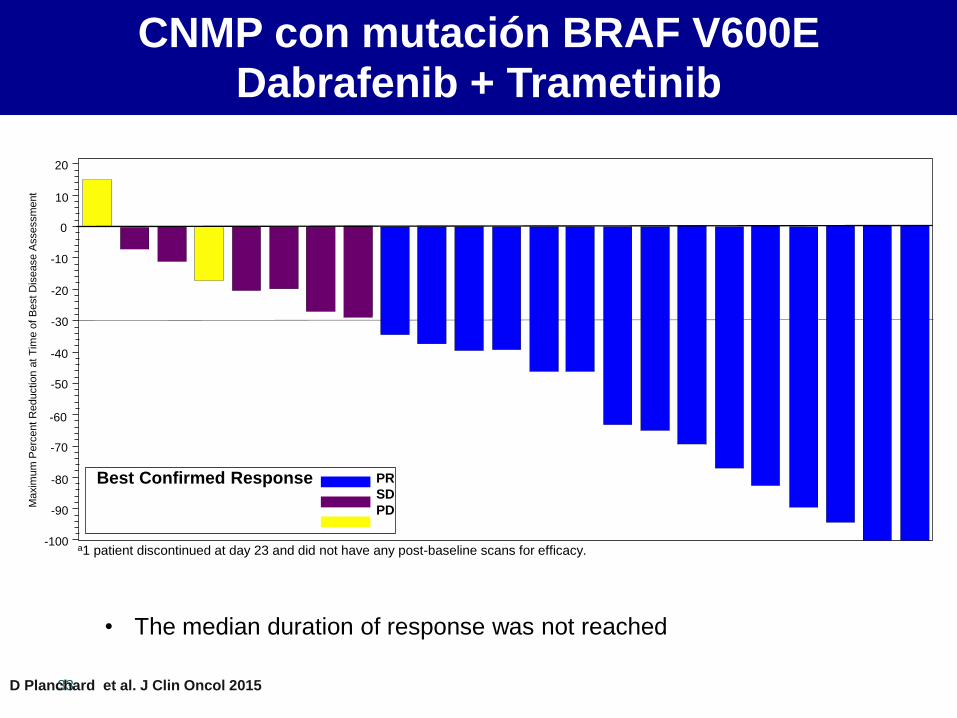
CNMP con mutación BRAF V600E
Dabrafenib + Trametinib
33
• The median duration of response was not reached
Maxim
um
Perc
ent
Reductio
n a
t T
ime o
f B
est D
isease A
ssessm
ent
20
10
0
-10
-20
-30
-40
-50
-60
-70
-80
-90
-100
Best Confirmed Response PR
SD
PD
a1 patient discontinued at day 23 and did not have any post-baseline scans for efficacy.
D Planchard et al. J Clin Oncol 2015

• Conocimiento y tecnología
• Adicción oncogénica
• Subgrupos difíciles
• Estrategias prometedoras
• Perspectivas
Agenda
NTRK fusions
Adenocarcinoma de pulmón Subtipos con tratamientos específicos
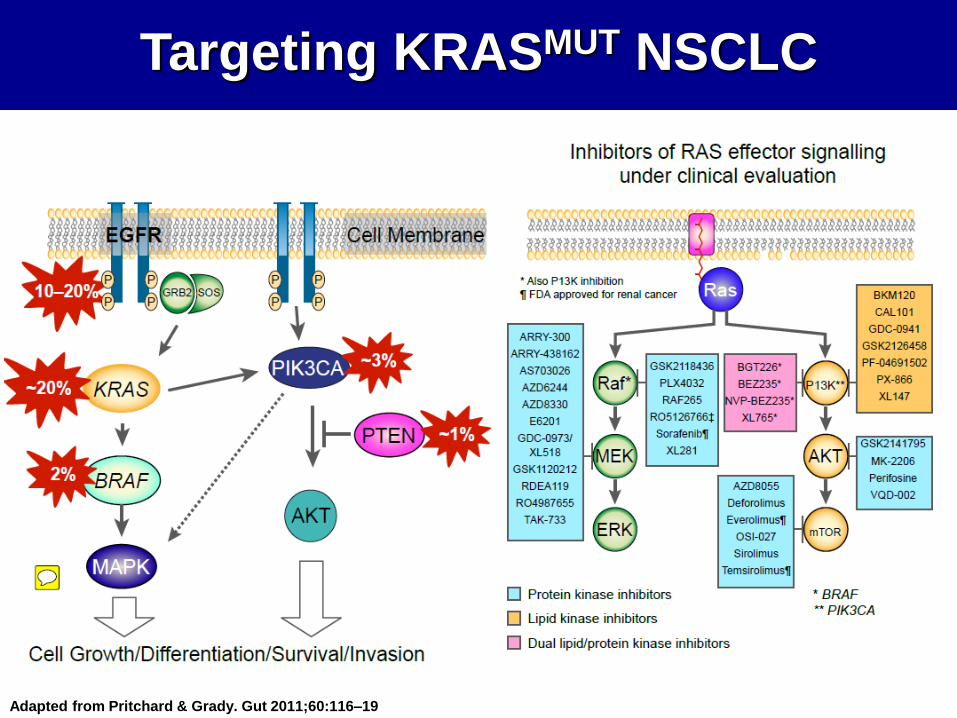
Targeting KRASMUT NSCLC
Adapted from Pritchard & Grady. Gut 2011;60:116–19
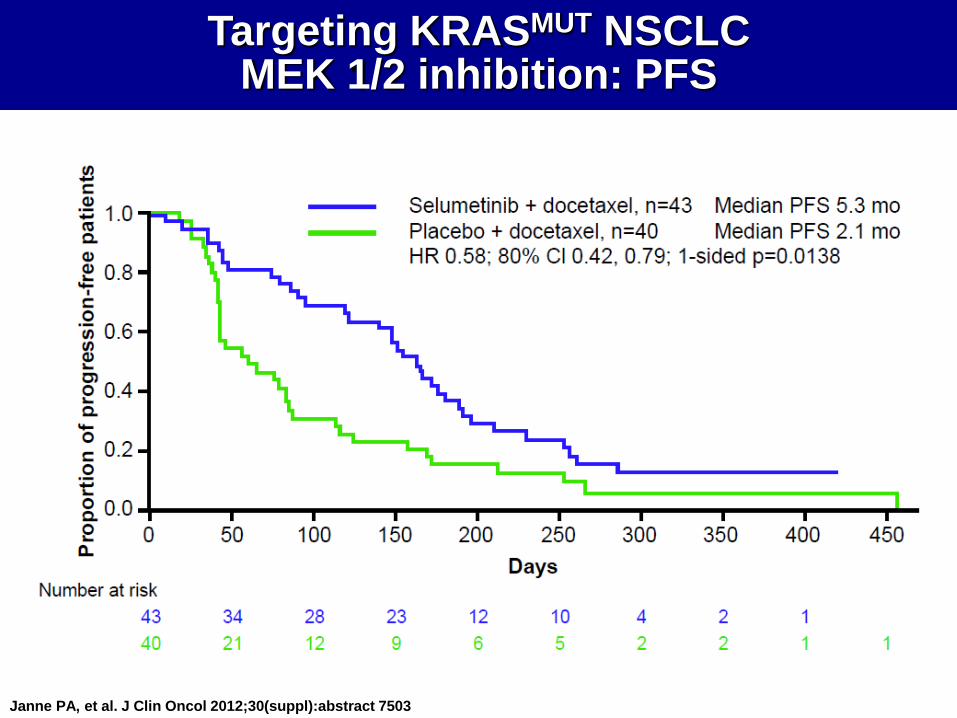
Janne PA, et al. J Clin Oncol 2012;30(suppl):abstract 7503
Targeting KRASMUT NSCLC
MEK 1/2 inhibition: PFS
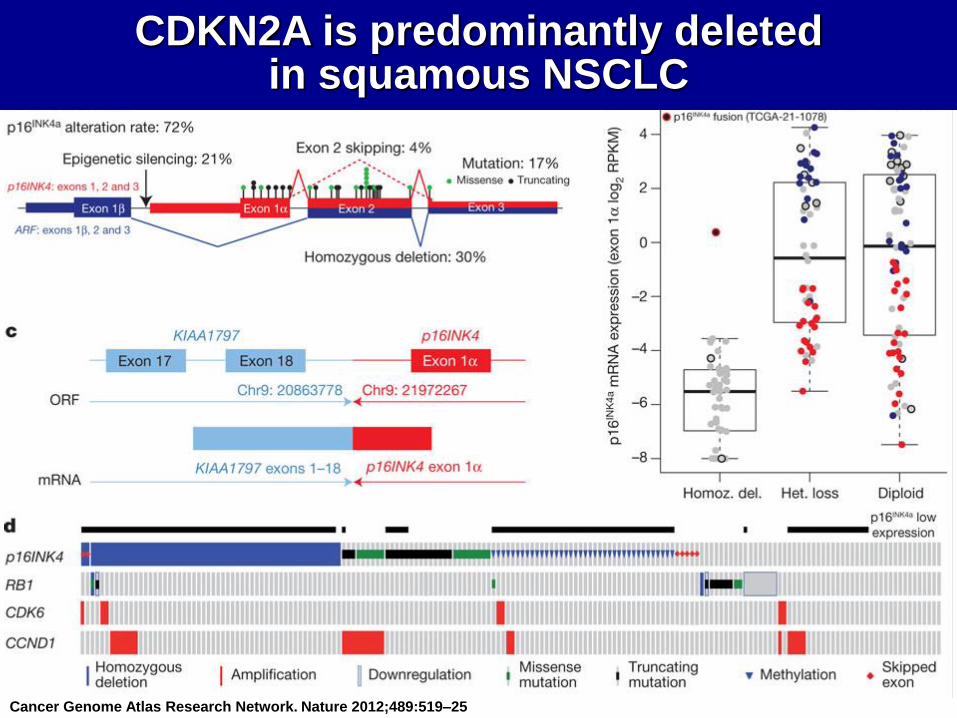
Cancer Genome Atlas Research Network. Nature 2012;489:519–25
CDKN2A is predominantly deleted
in squamous NSCLC
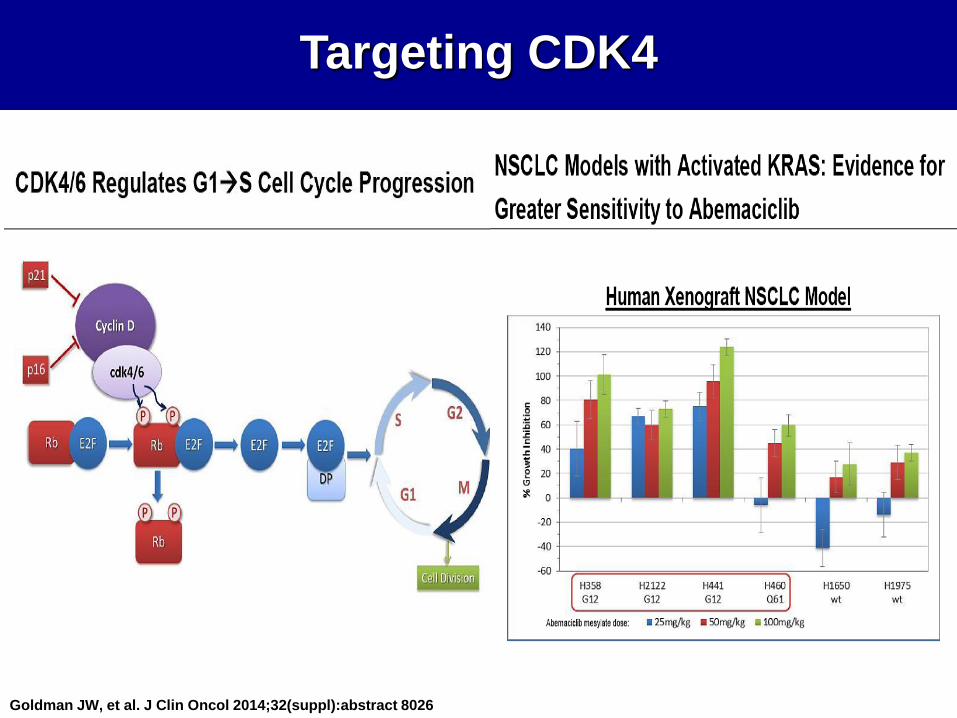
Targeting CDK4
Goldman JW, et al. J Clin Oncol 2014;32(suppl):abstract 8026
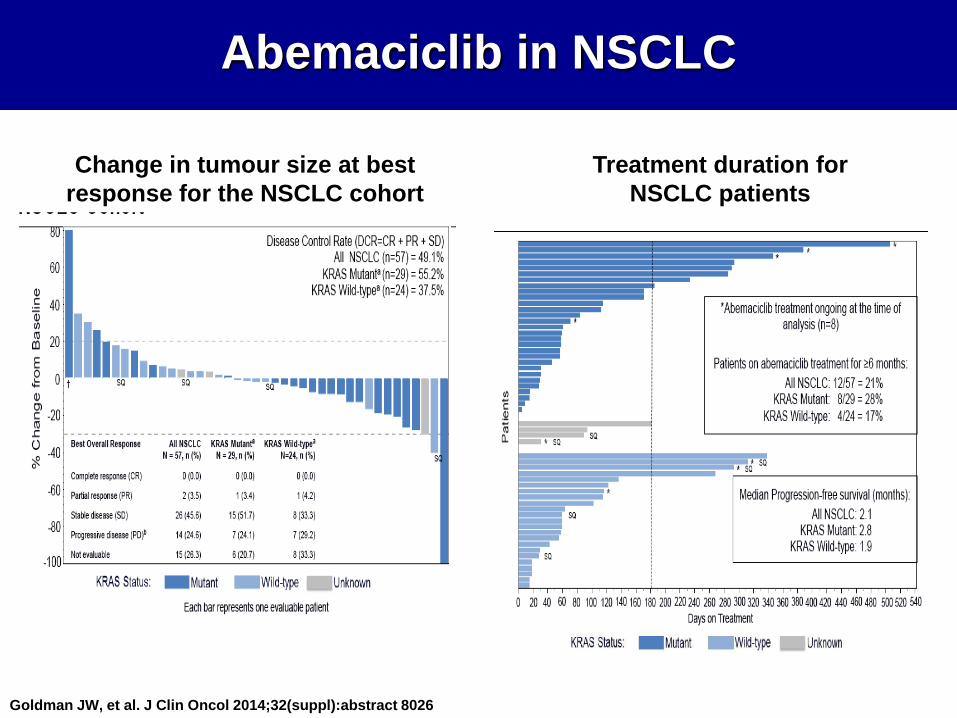
Goldman JW, et al. J Clin Oncol 2014;32(suppl):abstract 8026
Abemaciclib in NSCLC
Change in tumour size at best
response for the NSCLC cohort
Treatment duration for
NSCLC patients
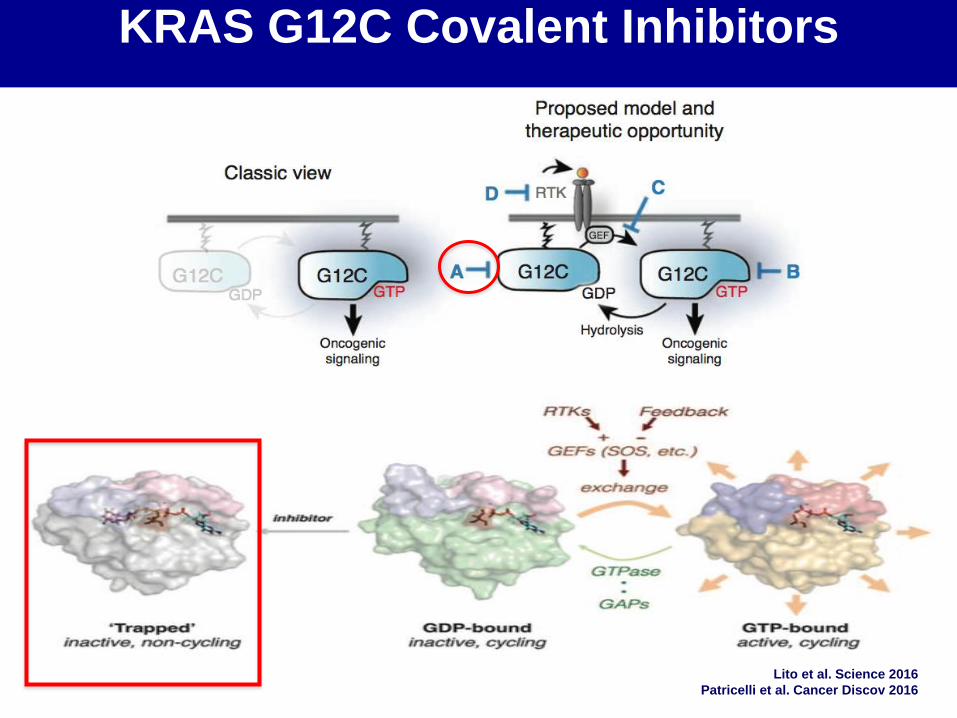
Lito et al. Science 2016
Patricelli et al. Cancer Discov 2016
KRAS G12C Covalent Inhibitors
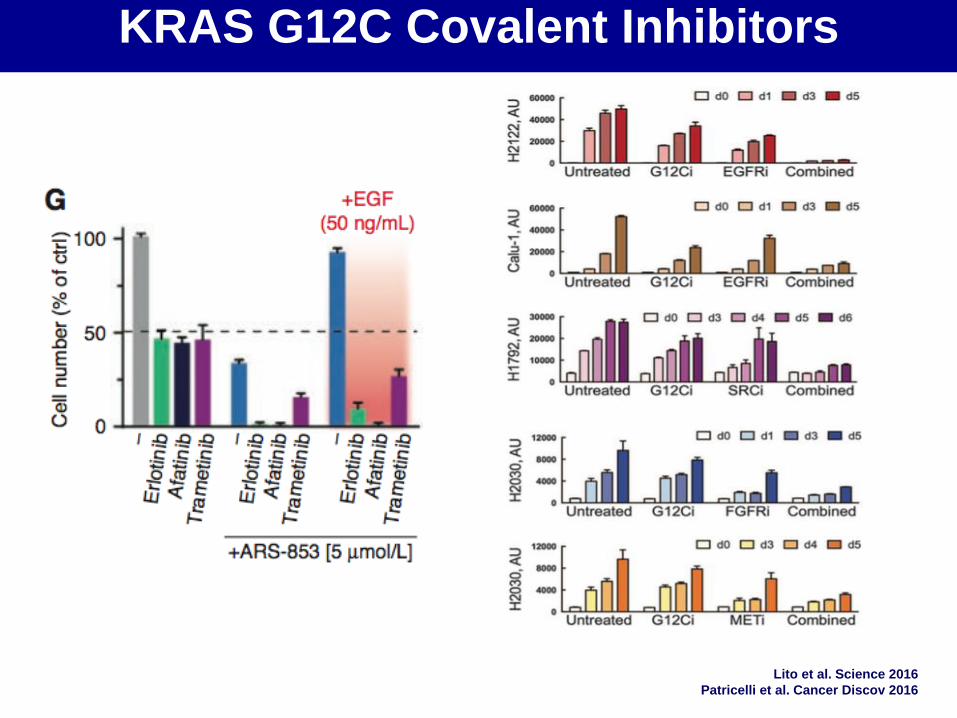
Lito et al. Science 2016
Patricelli et al. Cancer Discov 2016
KRAS G12C Covalent Inhibitors
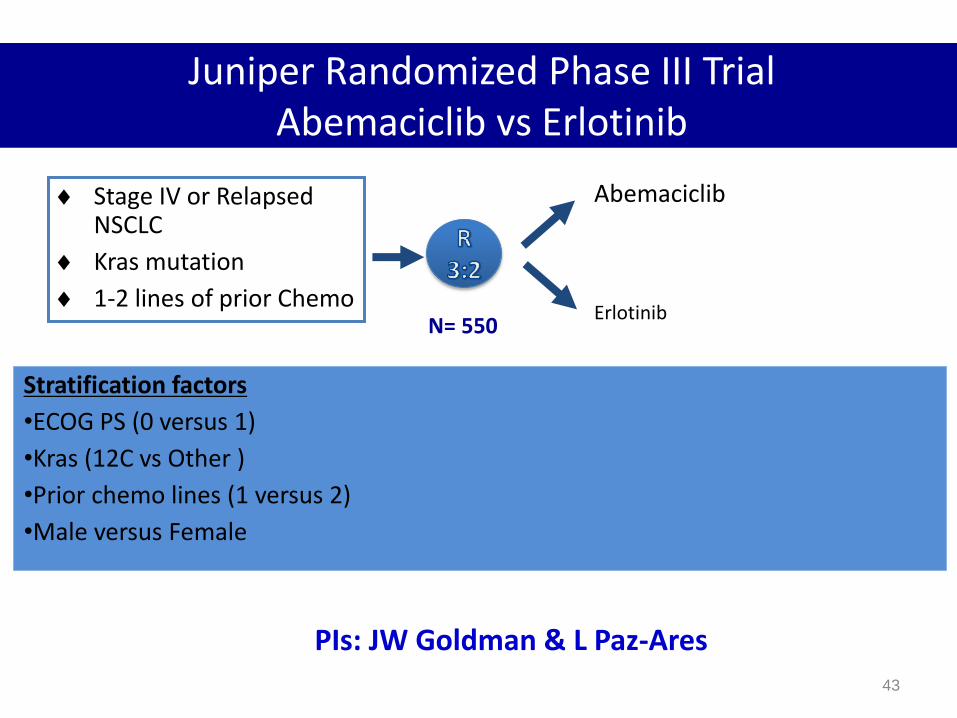
Juniper Randomized Phase III Trial Abemaciclib vs Erlotinib
Stage IV or Relapsed NSCLC
Kras mutation
1-2 lines of prior Chemo
Abemaciclib
Erlotinib
Stratification factors
•ECOG PS (0 versus 1)
•Kras (12C vs Other )
•Prior chemo lines (1 versus 2)
•Male versus Female
43
PIs: JW Goldman & L Paz-Ares
N= 550
From The Cancer Genome Atlas Project: Govindan R. J Clin Oncol. 2012 (Proc ASCO Annual Meeting);30 (suppl): abstr 7006.
1 / Mb
10 / Mb
100 / Mb
0.1 / Mb
81 64 38 316 100 17 82 28 n=109 119 21 40 20
Hematologic & Childhood Cancers
Carcinogen-induced Cancers
??
Ad
en
oca
Squ
amo
us
Ovarian, Breast, Prostate Cancers
Mutations Per Mb DNA
Las aberraciones genómicas son muy
frecuentes en cáncer de pulmón
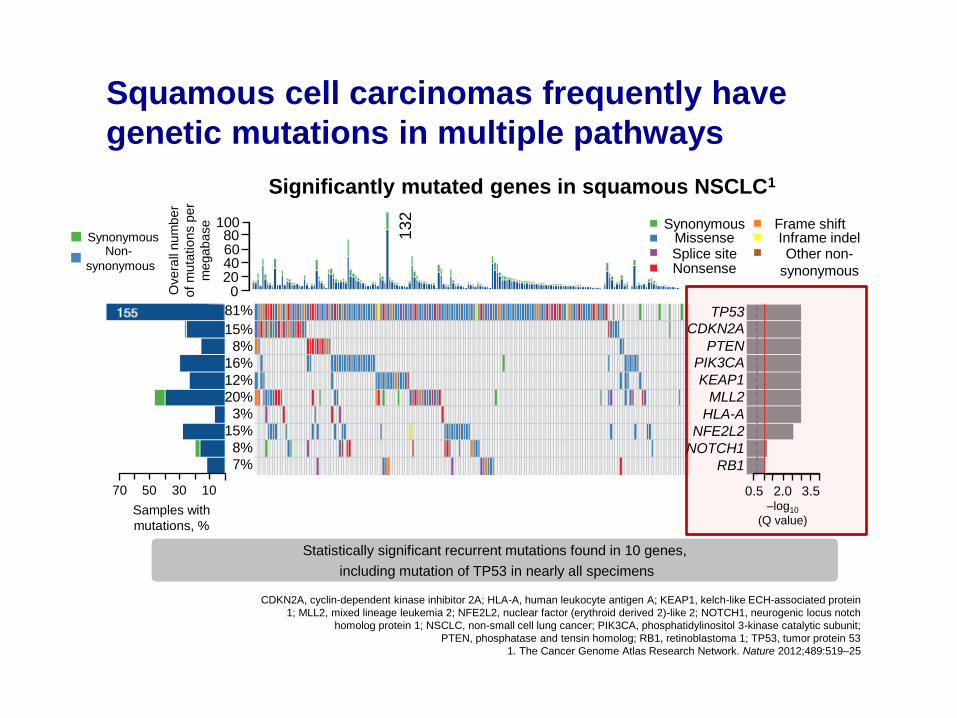
Squamous cell carcinomas frequently have
genetic mutations in multiple pathways
CDKN2A, cyclin-dependent kinase inhibitor 2A; HLA-A, human leukocyte antigen A; KEAP1, kelch-like ECH-associated protein
1; MLL2, mixed lineage leukemia 2; NFE2L2, nuclear factor (erythroid derived 2)-like 2; NOTCH1, neurogenic locus notch
homolog protein 1; NSCLC, non-small cell lung cancer; PIK3CA, phosphatidylinositol 3-kinase catalytic subunit;
PTEN, phosphatase and tensin homolog; RB1, retinoblastoma 1; TP53, tumor protein 53
1. The Cancer Genome Atlas Research Network. Nature 2012;489:519–25
Samples with
mutations, %
Significantly mutated genes in squamous NSCLC1
Statistically significant recurrent mutations found in 10 genes,
including mutation of TP53 in nearly all specimens
Synonymous
Splice site Missense
Nonsense
Frame shift Inframe indel Other non-
synonymous
13
2
100 80 60 40 20 0 O
ve
rall
nu
mb
er
of
mu
tatio
ns p
er
me
ga
ba
se
Synonymous Non-
synonymous
70 50 30 10
81%
15%
8%
16%
12%
20%
3%
15%
8%
7%
TP53
CDKN2A
PTEN
PIK3CA
KEAP1
MLL2
HLA-A
NFE2L2
NOTCH1
RB1
0.5 2.0 3.5 –log10
(Q value)
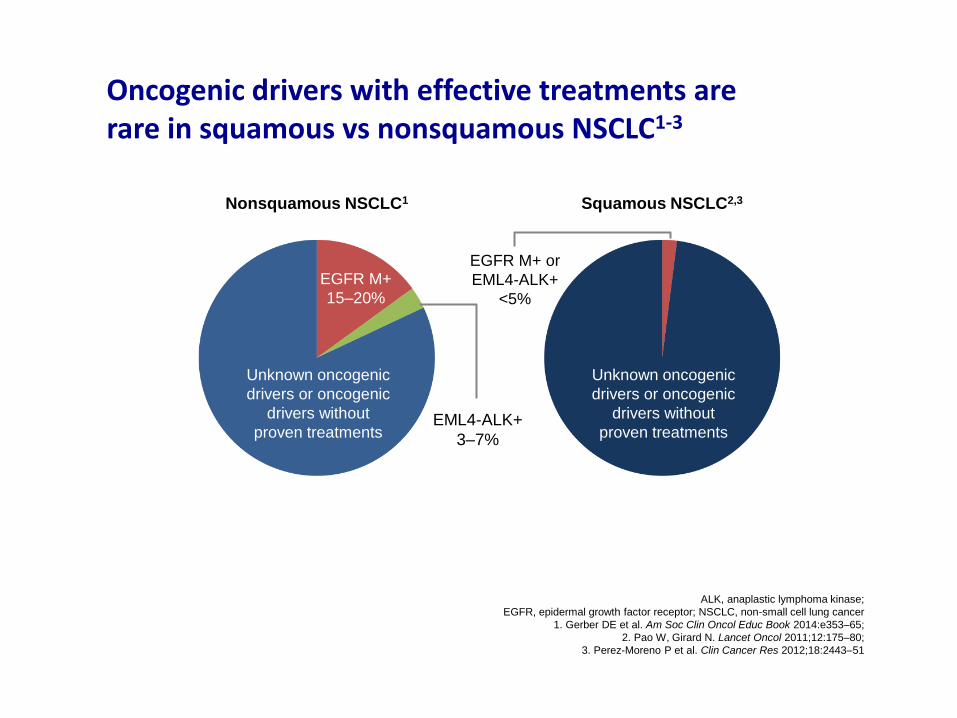
Oncogenic drivers with effective treatments are rare in squamous vs nonsquamous NSCLC1-3
ALK, anaplastic lymphoma kinase;
EGFR, epidermal growth factor receptor; NSCLC, non-small cell lung cancer
1. Gerber DE et al. Am Soc Clin Oncol Educ Book 2014:e353–65;
2. Pao W, Girard N. Lancet Oncol 2011;12:175–80;
3. Perez-Moreno P et al. Clin Cancer Res 2012;18:2443–51
Unknown oncogenic
drivers or oncogenic
drivers without
proven treatments
Unknown oncogenic
drivers or oncogenic
drivers without
proven treatments
EGFR M+
15–20%
Squamous NSCLC2,3 Nonsquamous NSCLC1
EML4-ALK+
3–7%
EGFR M+ or
EML4-ALK+
<5%
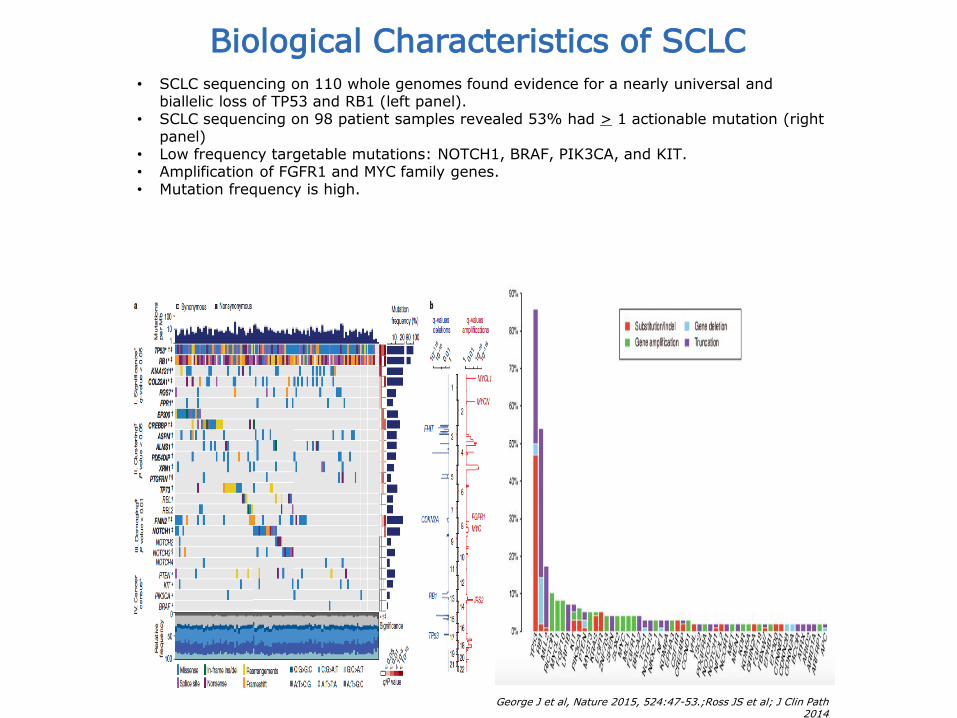
George J et al, Nature 2015, 524:47-53.;Ross JS et al; J Clin Path 2014
Biological Characteristics of SCLC • SCLC sequencing on 110 whole genomes found evidence for a nearly universal and
biallelic loss of TP53 and RB1 (left panel). • SCLC sequencing on 98 patient samples revealed 53% had > 1 actionable mutation (right
panel) • Low frequency targetable mutations: NOTCH1, BRAF, PIK3CA, and KIT. • Amplification of FGFR1 and MYC family genes. • Mutation frequency is high.
48 J. Gorge et al..Nature.2015 524(7563): 47–53
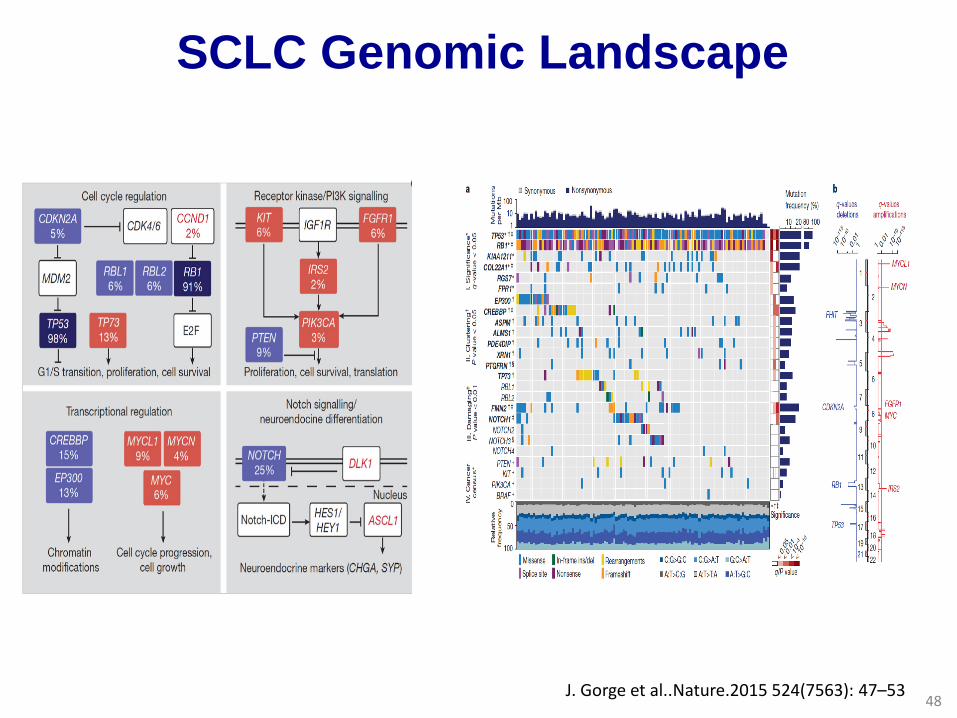
SCLC Genomic Landscape
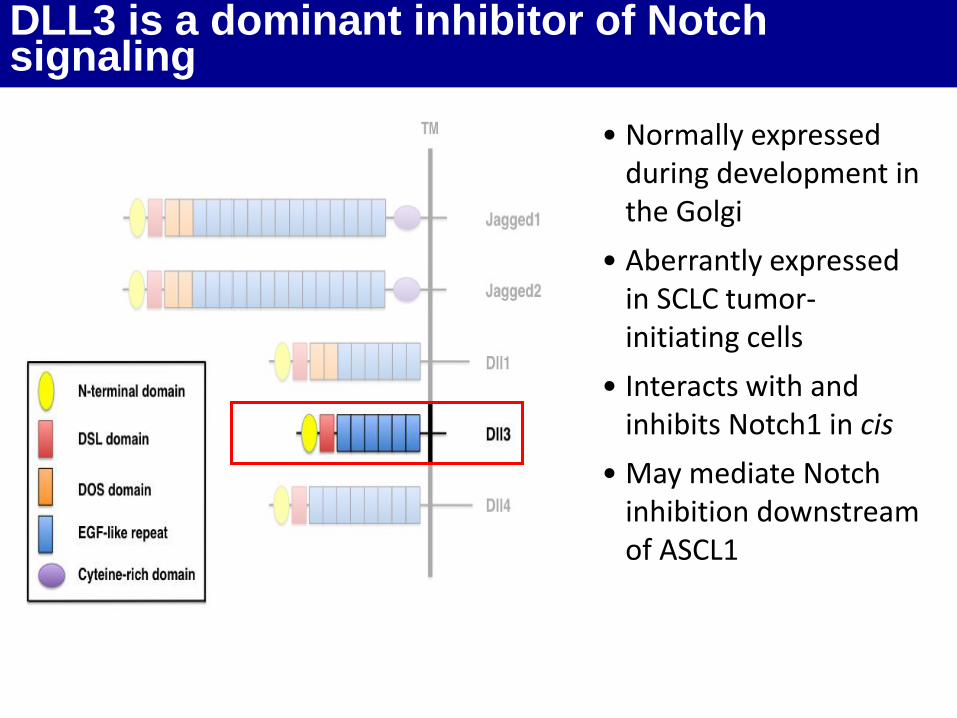
DLL3 is a dominant inhibitor of Notch signaling
• Normally expressed during development in the Golgi
• Aberrantly expressed in SCLC tumor-initiating cells
• Interacts with and inhibits Notch1 in cis
• May mediate Notch inhibition downstream of ASCL1
Kume et al., J Angiogen Res 2009
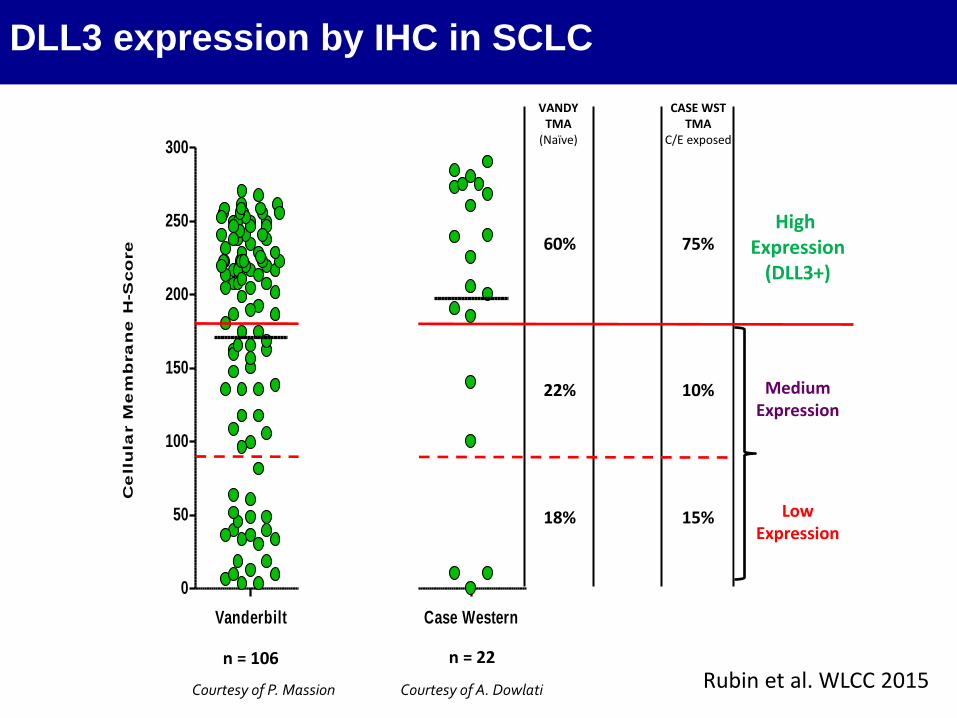
DLL3 expression by IHC in SCLC
Vanderbilt SC16LD6.5 Trial Case Western
0
50
100
150
200
250
300C
ell
ula
r M
em
bra
ne
H-S
co
re
n = 50
Courtesy of A. Dowlati
n = 106 n = 22
VANDY TMA
(Naïve)
SC16LD6.5 TRIAL
(Naïve)
CASE WST TMA
C/E exposed
60% 70% 75%
22% 12% 10%
18% 18% 15%
High Expression
(DLL3+)
Medium Expression
Low Expression
Courtesy of P. Massion Rubin et al. WLCC 2015
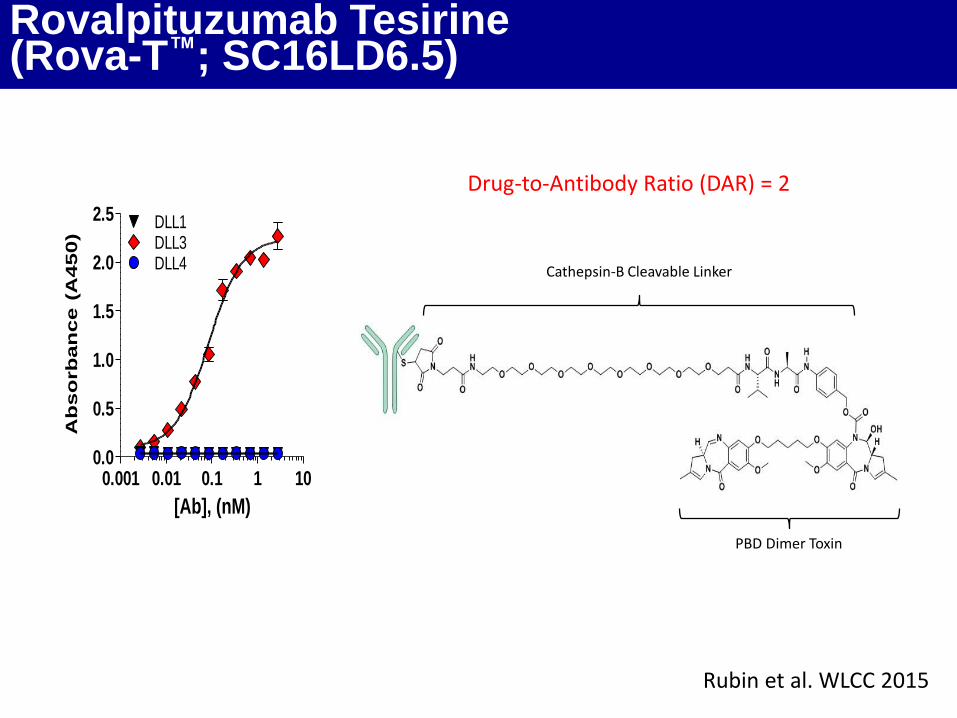
Rovalpituzumab Tesirine (Rova-T™; SC16LD6.5)
0.001 0.01 0.1 1 100.0
0.5
1.0
1.5
2.0
2.5
DLL3DLL1
DLL4
[Ab], (nM)
Ab
so
rb
an
ce
(A
45
0)
Drug-to-Antibody Ratio (DAR) = 2
Cathepsin-B Cleavable Linker
PBD Dimer Toxin
Rubin et al. WLCC 2015
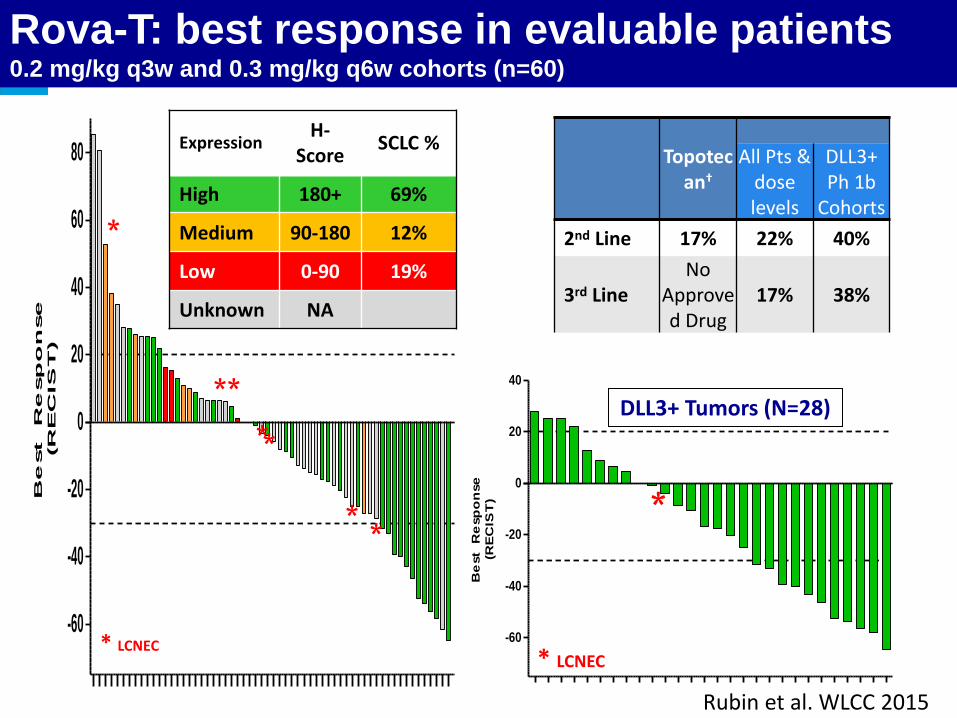
Rova-T: best response in evaluable patients 0.2 mg/kg q3w and 0.3 mg/kg q6w cohorts (n=60)
-60
-40
-20
0
20
40
60
80
Be
st R
esp
on
se
(R
EC
IS
T)
* LCNEC
* *
*
*
*
* *
Expression H-
Score SCLC %
High 180+ 69%
Medium 90-180 12%
Low 0-90 19%
Unknown NA
-60
-40
-20
0
20
40
Be
st
Re
sp
on
se
(RE
CIS
T) *
* LCNEC
Topotec
an†
All Pts & dose levels
DLL3+ Ph 1b
Cohorts
2nd Line 17% 22% 40%
3rd Line No
Approved Drug
17% 38%
Rubin et al. WLCC 2015
DLL3+ Tumors (N=28)

• Conocimiento y tecnología
• Adicción oncogénica
• Subgrupos difíciles
• Estrategias prometedoras
• Perspectivas
Agenda

NTRK fusions
Adenocarcinoma de pulmón Subtipos con tratamientos específicos
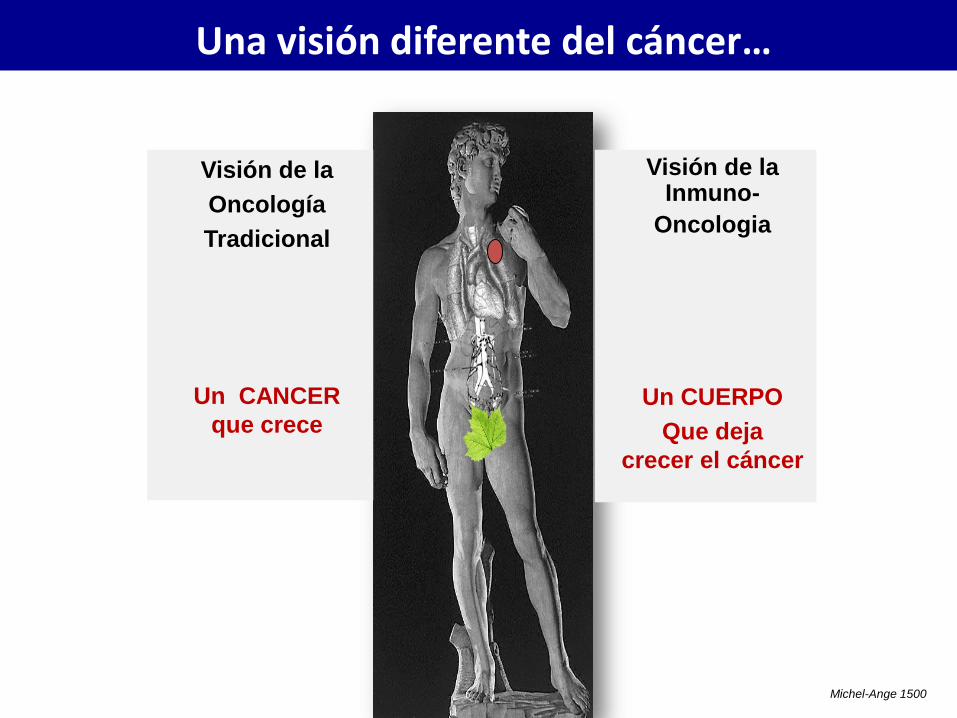
Michel-Ange 1500
Visión de la
Oncología
Tradicional
Un CANCER
que crece
Visión de la Inmuno-
Oncologia
Un CUERPO
Que deja
crecer el cáncer
Una visión diferente del cáncer…
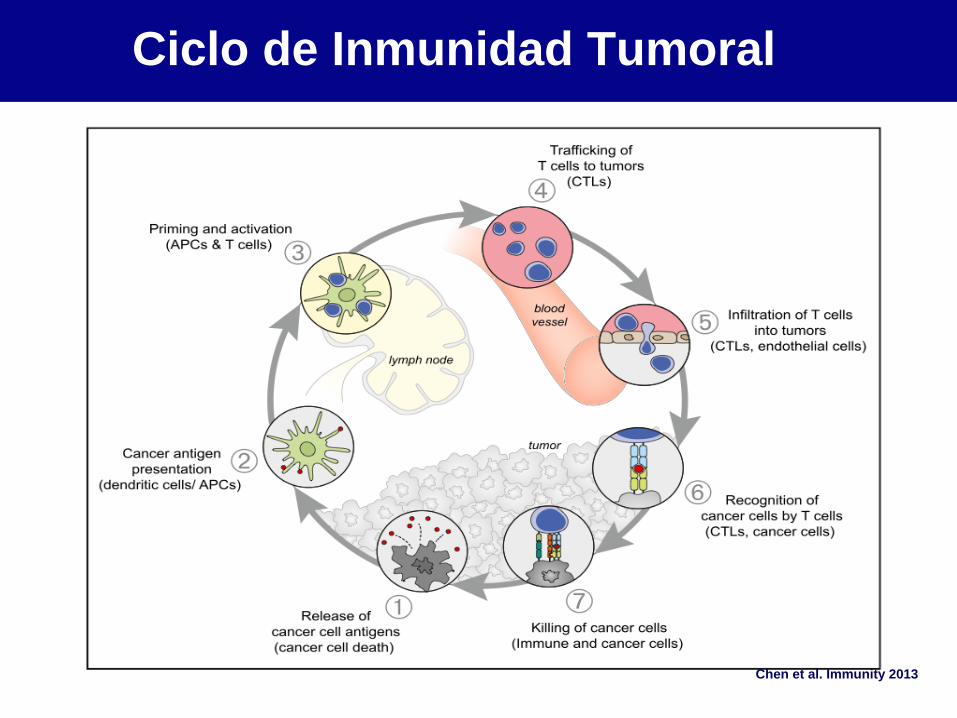
Chen et al. Immunity 2013
Ciclo de Inmunidad Tumoral

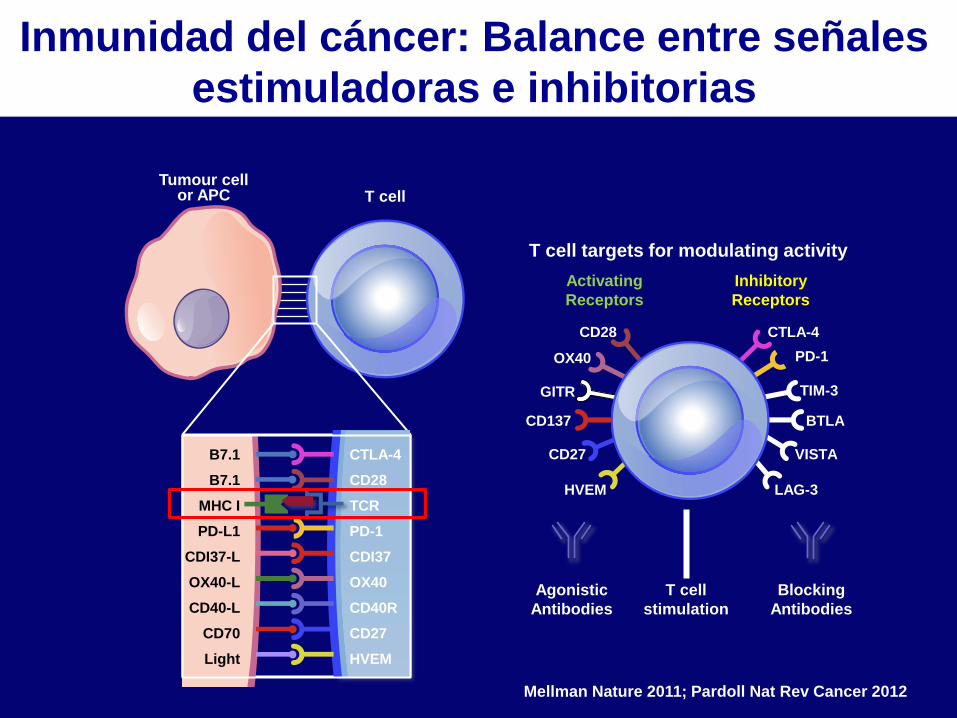
B7.1
B7.1
MHC I
PD-L1
CDI37-L
OX40-L
CD40-L
CD70
Light
CTLA-4
CD28
TCR
PD-1
CDI37
OX40
CD40R
CD27
HVEM
Tumour cell or APC T cell
CD28
OX40
GITR
CD137
CD27
HVEM
CTLA-4
PD-1
TIM-3
BTLA
VISTA
LAG-3
T cell targets for modulating activity
Activating
Receptors
Inhibitory
Receptors
T cell
stimulation
Agonistic
Antibodies
Blocking
Antibodies
Mellman Nature 2011; Pardoll Nat Rev Cancer 2012
Inmunidad del cáncer: Balance entre señales estimuladoras e inhibitorias
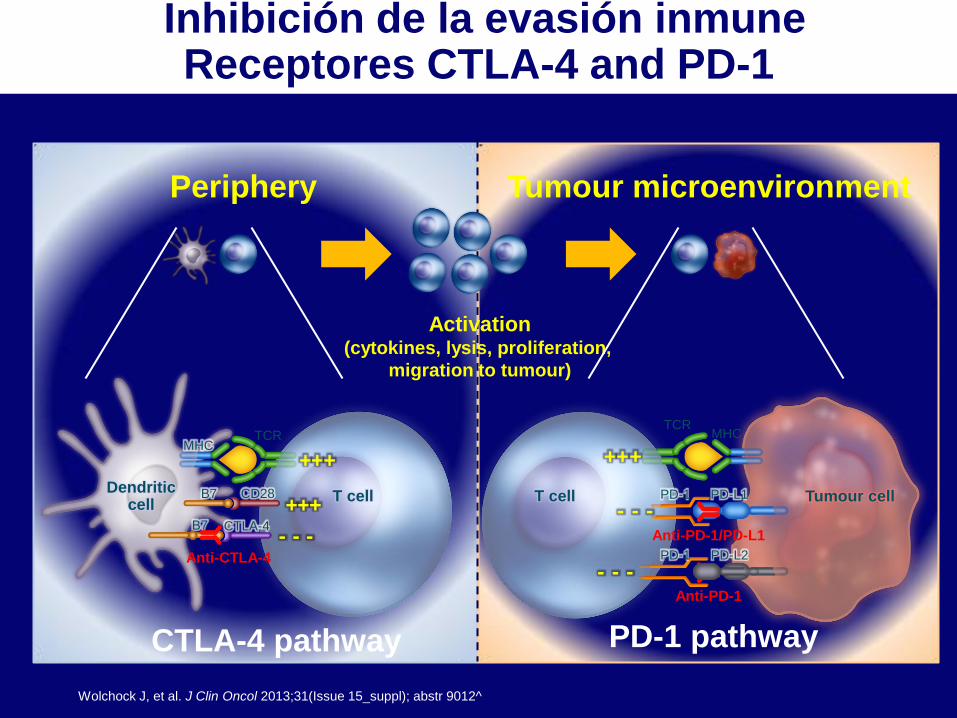
Wolchock J, et al. J Clin Oncol 2013;31(Issue 15_suppl); abstr 9012^
T cell Tumour cell
MHC TCR
PD-L1 PD-1 T cell Dendritic
cell
MHC TCR
CD28
B7 CTLA-4 - - -
Activation (cytokines, lysis, proliferation,
migration to tumour)
B7 + + +
+ + +
CTLA-4 pathway PD-1 pathway
Anti-CTLA-4
Anti-PD-1/PD-L1
Periphery Tumour microenvironment
+ + +
PD-L2 PD-1
Anti-PD-1
- - -
- - -
Inhibición de la evasión inmune Receptores CTLA-4 and PD-1
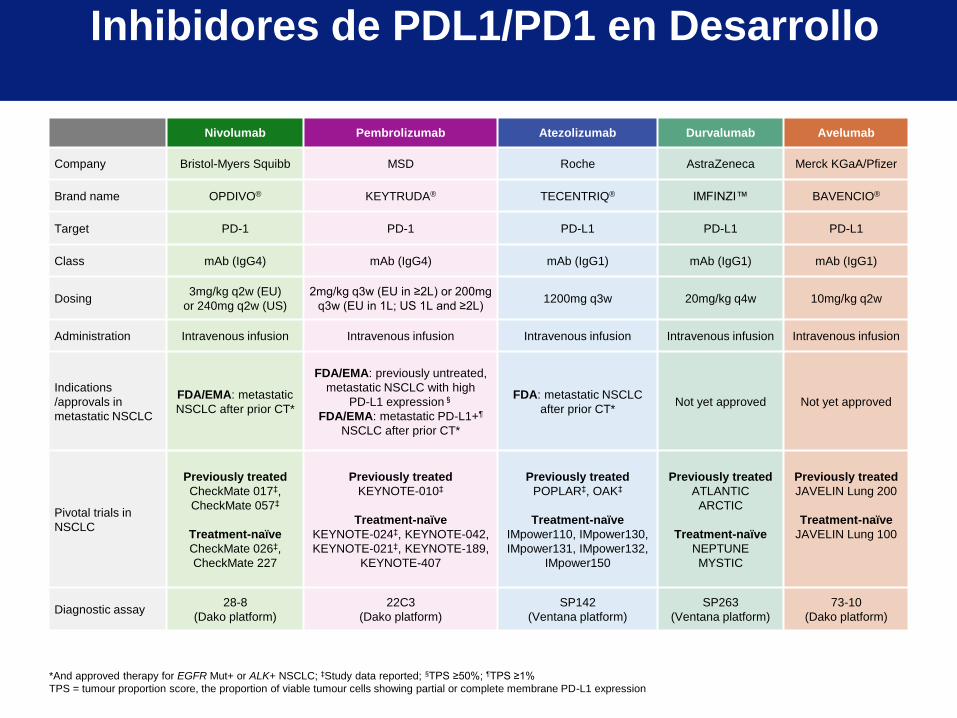
Nivolumab Pembrolizumab Atezolizumab Durvalumab Avelumab
Company Bristol-Myers Squibb MSD Roche AstraZeneca Merck KGaA/Pfizer
Brand name OPDIVO® KEYTRUDA® TECENTRIQ® IMFINZI™ BAVENCIO®
Target PD-1 PD-1 PD-L1 PD-L1 PD-L1
Class mAb (IgG4) mAb (IgG4) mAb (IgG1) mAb (IgG1) mAb (IgG1)
Dosing 3mg/kg q2w (EU)
or 240mg q2w (US)
2mg/kg q3w (EU in ≥2L) or 200mg
q3w (EU in 1L; US 1L and ≥2L) 1200mg q3w 20mg/kg q4w 10mg/kg q2w
Administration Intravenous infusion Intravenous infusion Intravenous infusion Intravenous infusion Intravenous infusion
Indications
/approvals in
metastatic NSCLC
FDA/EMA: metastatic
NSCLC after prior CT*
FDA/EMA: previously untreated,
metastatic NSCLC with high
PD-L1 expression§
FDA/EMA: metastatic PD-L1+¶
NSCLC after prior CT*
FDA: metastatic NSCLC
after prior CT* Not yet approved Not yet approved
Pivotal trials in
NSCLC
Previously treated
CheckMate 017‡,
CheckMate 057‡
Treatment-naïve
CheckMate 026‡,
CheckMate 227
Previously treated
KEYNOTE-010‡
Treatment-naïve
KEYNOTE-024‡, KEYNOTE-042,
KEYNOTE-021‡, KEYNOTE-189,
KEYNOTE-407
Previously treated
POPLAR‡, OAK‡
Treatment-naïve
IMpower110, IMpower130,
IMpower131, IMpower132,
IMpower150
Previously treated
ATLANTIC
ARCTIC
Treatment-naïve
NEPTUNE
MYSTIC
Previously treated
JAVELIN Lung 200
Treatment-naïve
JAVELIN Lung 100
Diagnostic assay 28-8
(Dako platform)
22C3
(Dako platform)
SP142
(Ventana platform)
SP263
(Ventana platform)
73-10
(Dako platform)
Inhibidores de PDL1/PD1 en Desarrollo
*And approved therapy for EGFR Mut+ or ALK+ NSCLC; ‡Study data reported; §TPS ≥50%; ¶TPS ≥1%
TPS = tumour proportion score, the proportion of viable tumour cells showing partial or complete membrane PD-L1 expression
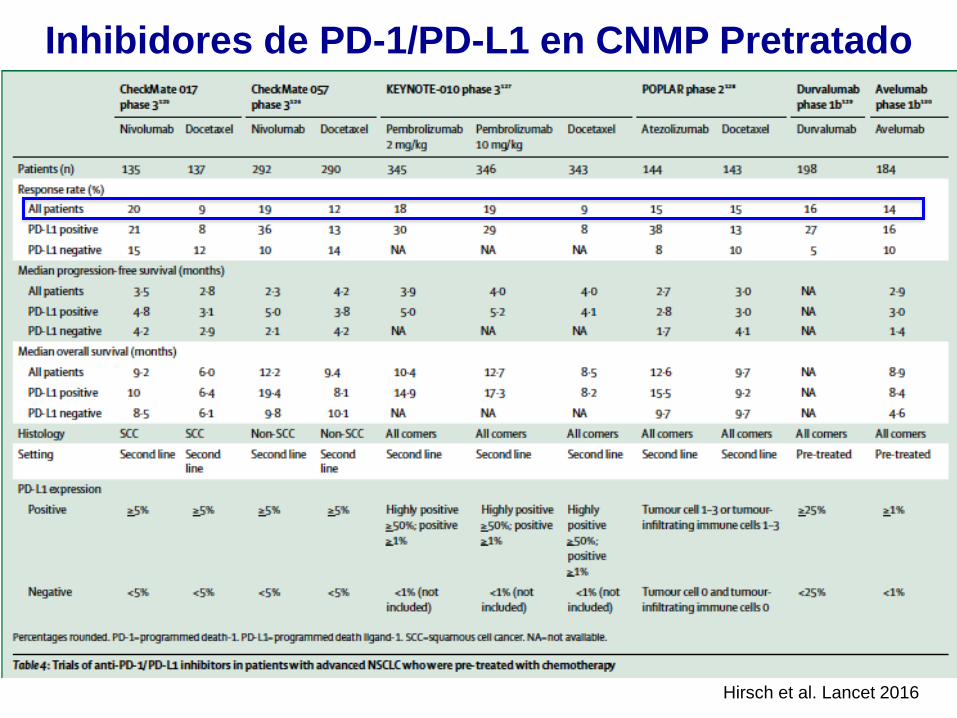
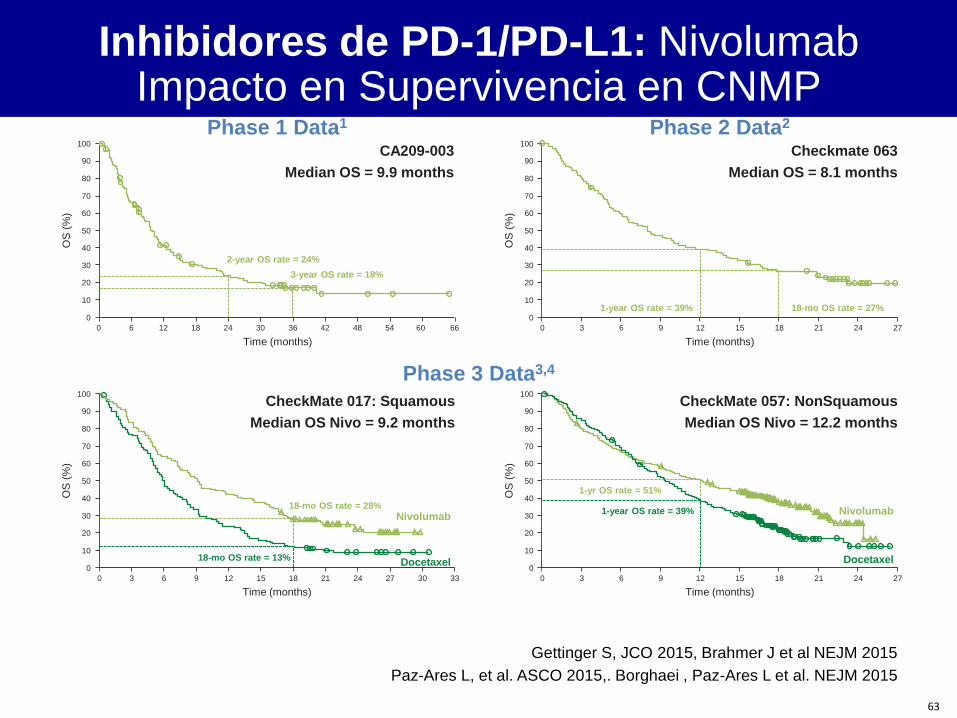
Inhibidores de PD-1/PD-L1 en CNMP Pretratado
Hirsch et al. Lancet 2016
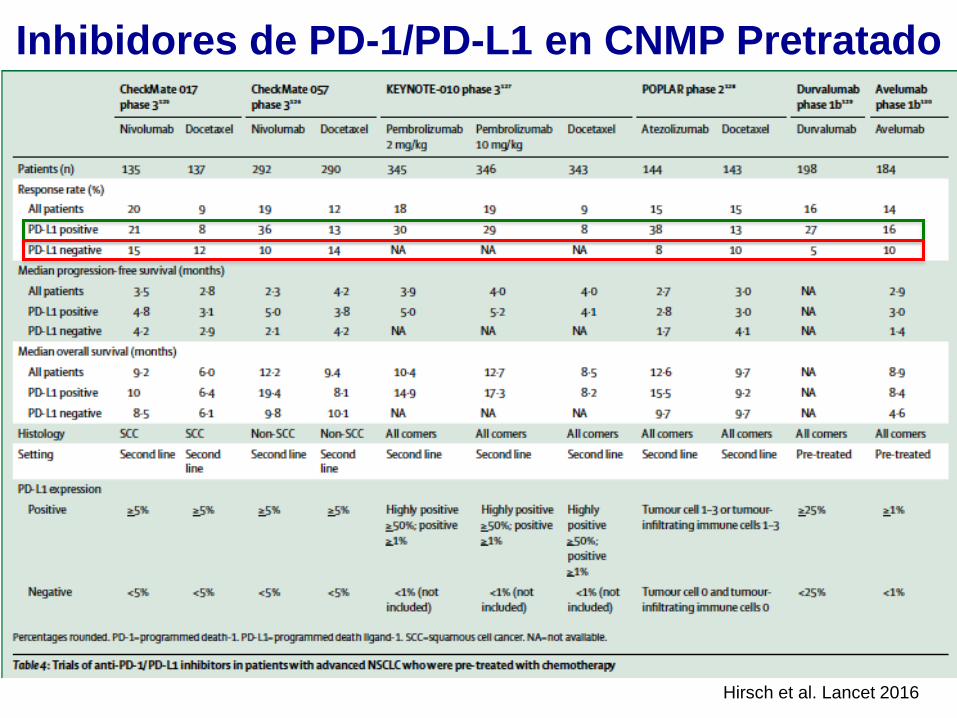
Hirsch et al. Lancet 2016
Inhibidores de PD-1/PD-L1 en CNMP Pretratado
63
Phase 1 Data1
Time (months)
Phase 3 Data3,4
Nivolumab
Docetaxel
CA209-003
Median OS = 9.9 months
100
90
80
70
60
50
40
30
20
10
0
0 6 12 18 24 30 36 42 48 54 60 66
OS
(%
)
3-year OS rate = 18%
2-year OS rate = 24%
Checkmate 063
Median OS = 8.1 months
Phase 2 Data2
100
90
80
70
60
50
40
30
20
10
0
0 3 6 9 12 15 18 21 24 27
OS
(%
)
18-mo OS rate = 27% 1-year OS rate = 39%
Time (months)
CheckMate 057: NonSquamous
Median OS Nivo = 12.2 months
100
90
80
70
60
50
40
30
20
10
0
0 3 6 9 12 15 18 21 24 27
OS
(%
) 1-year OS rate = 39%
Time (months)
1-yr OS rate = 51%
Nivolumab
Docetaxel
CheckMate 017: Squamous
Median OS Nivo = 9.2 months
100
90
80
70
60
50
40
30
20
10
0
0 3 6 9 12 15 18 24 30 33 27 21
OS
(%
)
18-mo OS rate = 13%
Time (months)
18-mo OS rate = 28%
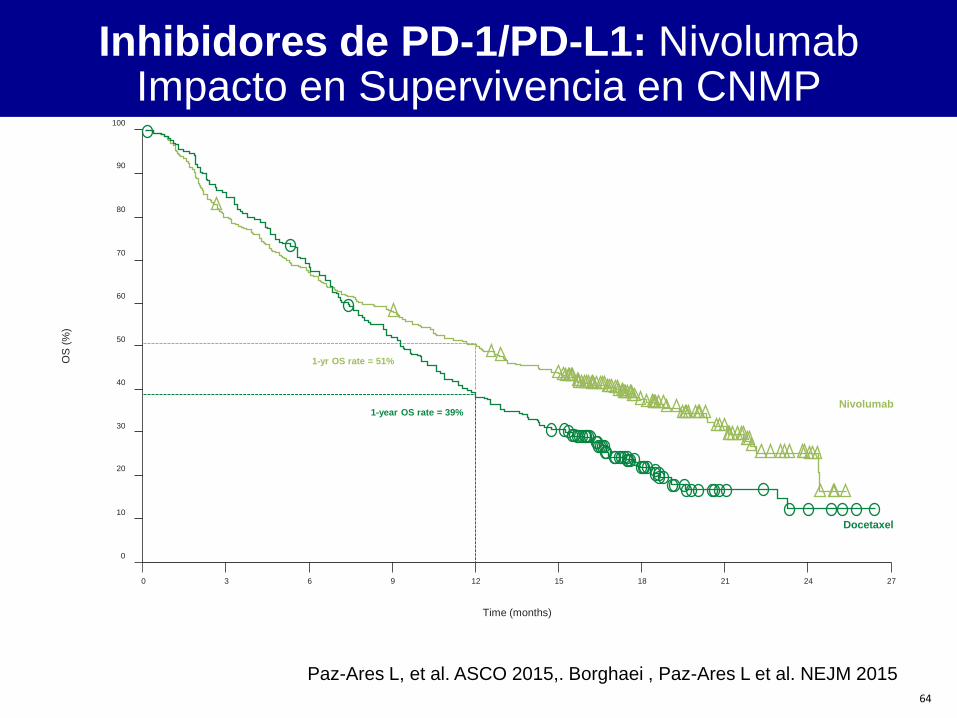
Inhibidores de PD-1/PD-L1: Nivolumab Impacto en Supervivencia en CNMP
Gettinger S, JCO 2015, Brahmer J et al NEJM 2015
Paz-Ares L, et al. ASCO 2015,. Borghaei , Paz-Ares L et al. NEJM 2015
64
Paz-Ares L, et al. ASCO 2015,. Borghaei , Paz-Ares L et al. NEJM 2015
Nivolumab
Docetaxel
100
90
80
70
60
50
40
30
20
10
0
0 3 6 9 12 15 18 21 24 27
OS
(%
)
1-year OS rate = 39%
Time (months)
1-yr OS rate = 51%
Inhibidores de PD-1/PD-L1: Nivolumab Impacto en Supervivencia en CNMP
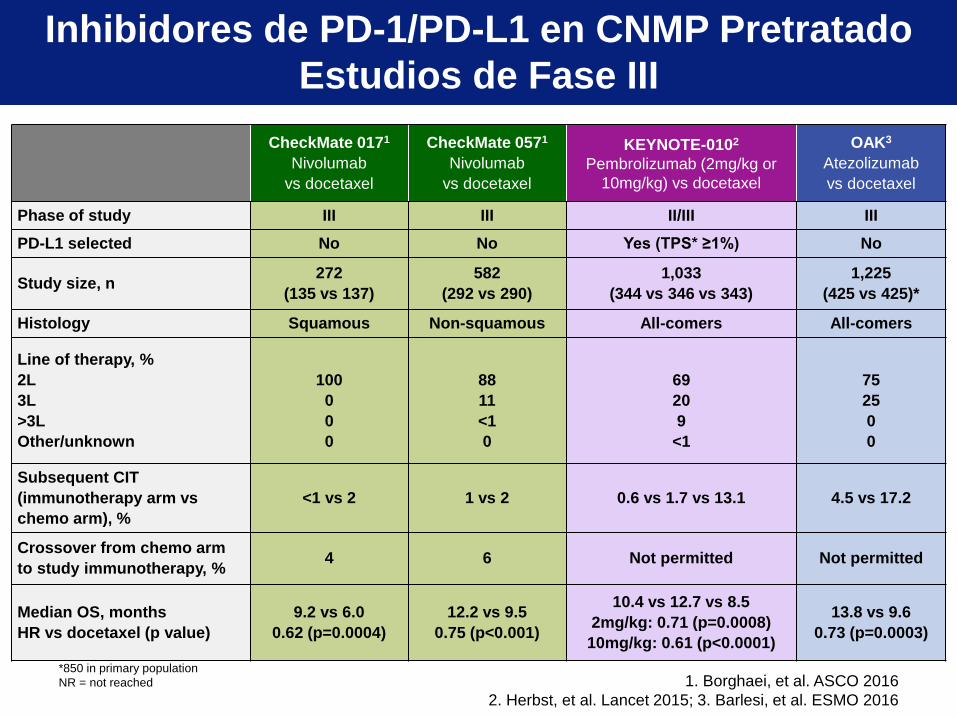
*850 in primary population
NR = not reached 1. Borghaei, et al. ASCO 2016
2. Herbst, et al. Lancet 2015; 3. Barlesi, et al. ESMO 2016
CheckMate 0171
Nivolumab
vs docetaxel
CheckMate 0571
Nivolumab
vs docetaxel
KEYNOTE-0102
Pembrolizumab (2mg/kg or
10mg/kg) vs docetaxel
OAK3
Atezolizumab
vs docetaxel
Phase of study III III II/III III
PD-L1 selected No No Yes (TPS* ≥1%) No
Study size, n 272
(135 vs 137)
582
(292 vs 290)
1,033
(344 vs 346 vs 343)
1,225
(425 vs 425)*
Histology Squamous Non-squamous All-comers All-comers
Line of therapy, %
2L
3L
>3L
Other/unknown
100
0
0
0
88
11
<1
0
69
20
9
<1
75
25
0
0
Subsequent CIT
(immunotherapy arm vs
chemo arm), %
<1 vs 2 1 vs 2 0.6 vs 1.7 vs 13.1 4.5 vs 17.2
Crossover from chemo arm
to study immunotherapy, % 4 6 Not permitted Not permitted
Median OS, months
HR vs docetaxel (p value)
9.2 vs 6.0
0.62 (p=0.0004)
12.2 vs 9.5
0.75 (p<0.001)
10.4 vs 12.7 vs 8.5
2mg/kg: 0.71 (p=0.0008)
10mg/kg: 0.61 (p<0.0001)
13.8 vs 9.6
0.73 (p=0.0003)
Inhibidores de PD-1/PD-L1 en CNMP Pretratado
Estudios de Fase III
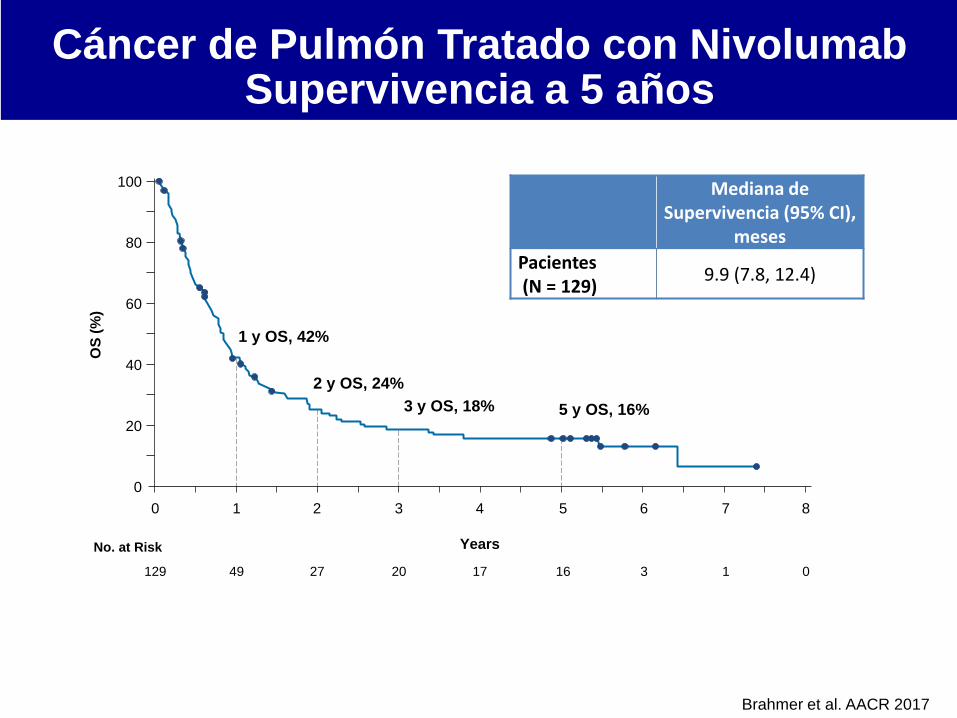
Mediana de Supervivencia (95% CI),
meses
Pacientes (N = 129)
9.9 (7.8, 12.4)
100
80
60
40
20
0
0 1 2 3 4 5 6 7 8
129 49 27 20 17 16 3 1 0
Years No. at Risk
OS
(%
)
1 y OS, 42%
2 y OS, 24%
3 y OS, 18% 5 y OS, 16%
Brahmer et al. AACR 2017
Cáncer de Pulmón Tratado con Nivolumab Supervivencia a 5 años
67
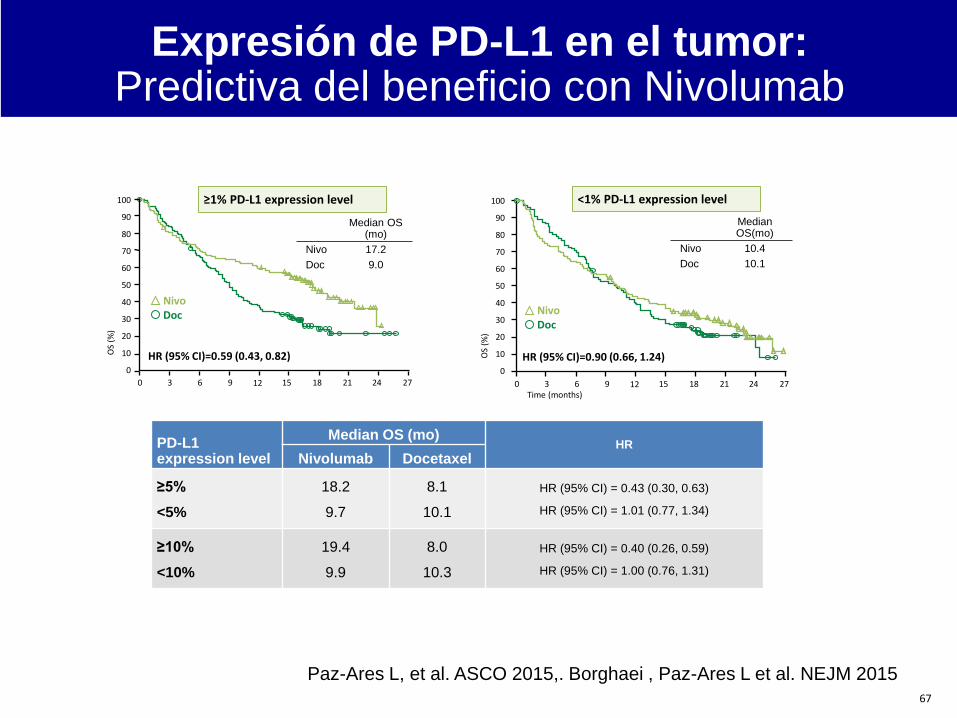
Nivo Doc
100
90
80
70
60
50
40
30
10
0
20
Time (months) 24 21 18 15 12 9 6 3 0 27
Median OS(mo)
Nivo 10.4
Doc 10.1
Median OS (mo)
Nivo 17.2
Doc 9.0
≥1% PD-L1 expression level
HR (95% CI)=0.59 (0.43, 0.82)
<1% PD-L1 expression level
OS
(%)
HR (95% CI)=0.90 (0.66, 1.24) OS
(%)
24 21 18 15 12 9 6 3 0 27
100
90
80
70
60
50
40
30
10
0
20
Nivo Doc
PD-L1 expression level
Median OS (mo) HR
Nivolumab Docetaxel
≥5%
<5%
18.2
9.7
8.1
10.1
HR (95% CI) = 0.43 (0.30, 0.63)
HR (95% CI) = 1.01 (0.77, 1.34)
≥10%
<10%
19.4
9.9
8.0
10.3
HR (95% CI) = 0.40 (0.26, 0.59)
HR (95% CI) = 1.00 (0.76, 1.31)
Paz-Ares L, et al. ASCO 2015,. Borghaei , Paz-Ares L et al. NEJM 2015
Expresión de PD-L1 en el tumor: Predictiva del beneficio con Nivolumab
Inmunidad del cáncer: Balance entre señales
estimuladoras e inhibitorias
B7.1
B7.1
MHC I
PD-L1
CDI37-L
OX40-L
CD40-L
CD70
Light
CTLA-4
CD28
TCR
PD-1
CDI37
OX40
CD40R
CD27
HVEM
Tumour cell or APC T cell
CD28
OX40
GITR
CD137
CD27
HVEM
CTLA-4
PD-1
TIM-3
BTLA
VISTA
LAG-3
T cell targets for modulating activity
Activating
Receptors
Inhibitory
Receptors
T cell
stimulation
Agonistic
Antibodies
Blocking
Antibodies
Mellman Nature 2011; Pardoll Nat Rev Cancer 2012

• Conocimiento y tecnología
• Adicción oncogénica
• Subgrupos difíciles
• Estrategias prometedoras
• Perspectivas
Agenda
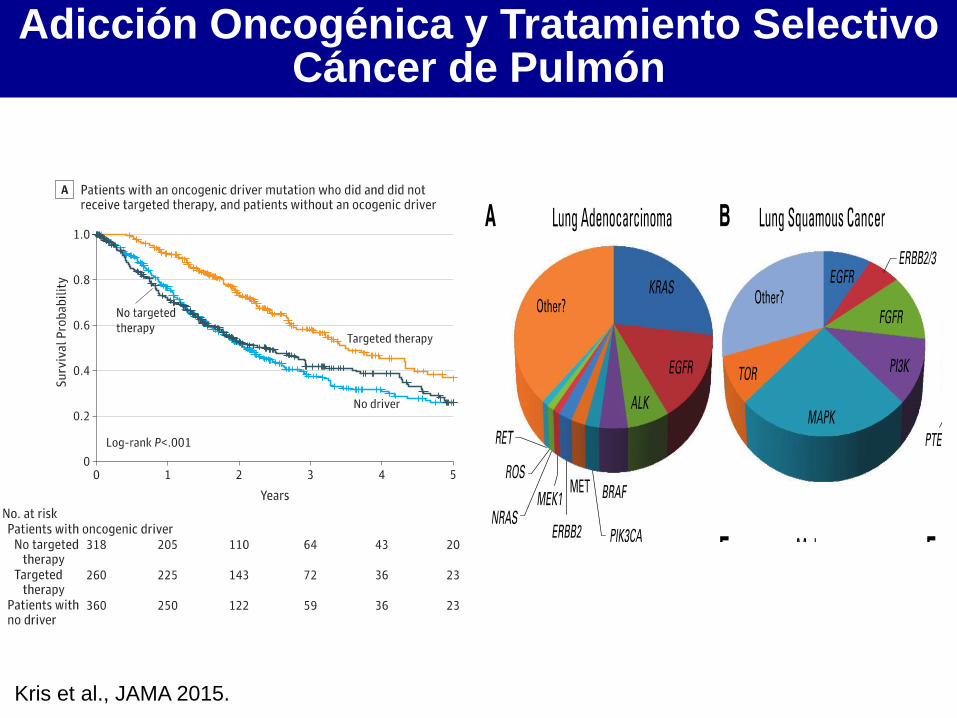
Adicción Oncogénica y Tratamiento Selectivo Cáncer de Pulmón
Kris et al., JAMA 2015.
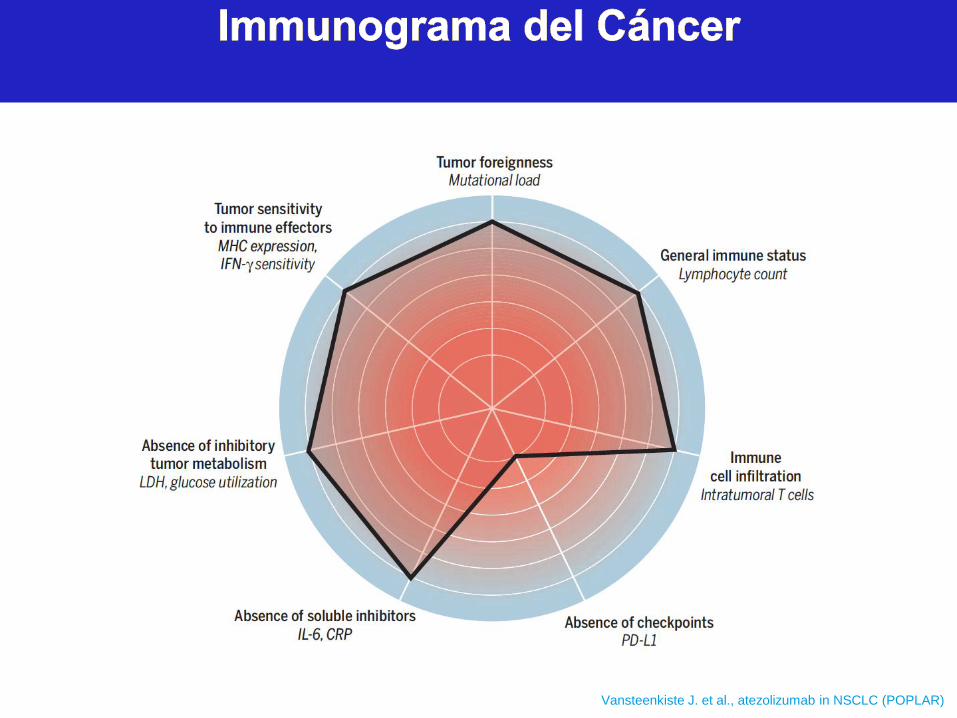
Vansteenkiste J. et al., atezolizumab in NSCLC (POPLAR) Blank CU et al. Science 2016; 352:658