ECONOMIC ANALYSIS OF OPTIONS FOR MANAGING … · Economic Analysis of Options for Managing...
202
Economic Analysis of Options for Managing Biodegradable Municipal Waste Final Report Eunomia Research & Consulting, Scuola Agraria del Parco di Monza, HDRA Consultants, ZREU and LDK ECO on behalf of ECOTEC Research & Consulting i ECONOMIC ANALYSIS OF OPTIONS FOR ECONOMIC ANALYSIS OF OPTIONS FOR ECONOMIC ANALYSIS OF OPTIONS FOR ECONOMIC ANALYSIS OF OPTIONS FOR MANAGING BIODEGRADABLE MUNICIPAL MANAGING BIODEGRADABLE MUNICIPAL MANAGING BIODEGRADABLE MUNICIPAL MANAGING BIODEGRADABLE MUNICIPAL WASTE WASTE WASTE WASTE Final Report to the European Final Report to the European Final Report to the European Final Report to the European Commission Commission Commission Commission
Transcript of ECONOMIC ANALYSIS OF OPTIONS FOR MANAGING … · Economic Analysis of Options for Managing...

Economic Analysis of Options for Managing Biodegradable Municipal Waste � Final Report
Eunomia Research & Consulting, Scuola Agraria del Parco di Monza, HDRA Consultants, ZREU and LDK ECO onbehalf of ECOTEC Research & Consulting
i
ECONOMIC ANALYSIS OF OPTIONS FORECONOMIC ANALYSIS OF OPTIONS FORECONOMIC ANALYSIS OF OPTIONS FORECONOMIC ANALYSIS OF OPTIONS FORMANAGING BIODEGRADABLE MUNICIPALMANAGING BIODEGRADABLE MUNICIPALMANAGING BIODEGRADABLE MUNICIPALMANAGING BIODEGRADABLE MUNICIPAL
WASTEWASTEWASTEWASTE
Final Report to the EuropeanFinal Report to the EuropeanFinal Report to the EuropeanFinal Report to the EuropeanCommissionCommissionCommissionCommission


Economic Analysis of Options for Managing Biodegradable Municipal Waste � Final Report
Eunomia Research & Consulting, Scuola Agraria del Parco di Monza, HDRA Consultants, ZREU and LDK ECO onbehalf of ECOTEC Research & Consulting
i
TABLE OF CONTENTSTABLE OF CONTENTSTABLE OF CONTENTSTABLE OF CONTENTS1.0 INTRODUCTION AND SCOPE ................................................................................1
1.1 AIMS AND OBJECTIVES ................................................................................................11.2 SCOPE OF THE ANALYSIS .............................................................................................2
1.2.1 Definition of Municipal Waste............................................................................21.2.2 Policy Changes Being Considered .....................................................................41.2.3 Biodegradable Wastes Considered in ‘Standards Plus’ Scenario in the Study .41.2.4 Outline of Approach to the Study .......................................................................5
1.3 OUTLINE OF THE REPORT.............................................................................................7
2.0 POTENTIAL TREATMENTS FOR BIODEGRADABLE MUNICIPALWASTES ...................................................................................................................................9
2.1 LANDFILL ....................................................................................................................92.2 INCINERATION (WITH ENERGY RECOVERY) ..............................................................132.3 PYROLYSIS / GASIFICATION.......................................................................................16
2.3.1 Pyrolysis ...........................................................................................................162.3.2 Gasification ......................................................................................................19
2.4 MECHANICAL BIOLOGICAL TREATMENT ...................................................................212.5 COMPOSTING .............................................................................................................23
2.5.1 Technical Problems / Primary Constraints ......................................................262.5.2 Type and Quality of Waste Appropriate to the Option.....................................272.5.3 Characteristics and Quality of End Products and Potential Markets..............27
2.6 ANAEROBIC DIGESTION.............................................................................................292.6.1 Pre-treatment....................................................................................................312.6.2 Digestion...........................................................................................................312.6.3 Post-treatment Processes .................................................................................322.6.4 Technical Problems / Primary Constraints ......................................................322.6.5 Type and Quality of Waste Appropriate to the Option.....................................332.6.6 Characteristics and Quality of End Products and Potential Markets..............342.6.7 Northern and Southern Europe ........................................................................35
2.7 A NOTE ON PAPER RECYCLING .................................................................................372.8 OVERVIEW.................................................................................................................40
3.0 CURRENT SITUATION REGARDING MUNICIPAL WASTE - ARISINGS,COMPOSITION AND TREATMENTS ..............................................................................44
3.1 SURVEY AND APPRAISAL OF MEMBER STATE DATA .................................................443.2 MEMBER STATE DEFINITIONS OF ‘MUNICIPAL WASTE’ ............................................463.3 QUANTITIES OF MUNICIPAL WASTE ARISINGS ..........................................................463.4 COMPOSITION ............................................................................................................483.5 RELATIVE SIGNIFICANCE OF TREATMENT TECHNOLOGIES ........................................563.6 IMPORTANCE OF SEPARATE COLLECTION ..................................................................593.7 STATUS OF SEPARATE COLLECTION IN MEMBER STATES AND ACCESSION COUNTRIES
623.8 STANDARDS FOR COMPOSTING IN EU MEMBER STATES AND ACCESSION COUNTRIES
66

Economic Analysis of Options for Managing Biodegradable Municipal Waste � Final Report
Eunomia Research & Consulting, Scuola Agraria del Parco di Monza, HDRA Consultants, ZREU and LDK ECO onbehalf of ECOTEC Research & Consulting
ii
3.8.1 The Importance of Standards ...........................................................................663.9 SUMMARY .................................................................................................................78
4.0 THE ECONOMIC ANALYSIS OF OPTIONS FOR MANAGINGBIODEGRADABLE MUNICIPAL WASTE – EXTERNAL COSTS ..............................80
4.1 INTRODUCTION ..........................................................................................................804.1.1 A Note on Climate Change Effects ...................................................................814.1.2 A Note on Energy Displacement.......................................................................834.1.3 Avoided External Cost Data .............................................................................854.1.4 Discounting and ‘Country-specific’ Externalities............................................88
4.2 RESULTS FOR LANDFILL ............................................................................................894.3 RESULTS FOR INCINERATION .....................................................................................954.4 RESULTS FOR COMPOSTING .......................................................................................984.5 RESULTS FOR ANAEROBIC DIGESTION.....................................................................1014.6 NOTE ON TRANSPORT EXTERNALITIES ....................................................................105
4.6.1 External Costs of Separate Collection of Garden Wastes ..............................1054.6.2 Kerbside Collections.......................................................................................1064.6.3 Transport Externalities and Degrees of Internalisation.................................107
4.7 NOTE ON MECHANICAL BIOLOGICAL TREATMENT ..................................................108
5.0 THE ECONOMIC ANALYSIS OF OPTIONS FOR MANAGINGBIODEGRADABLE MUNICIPAL WASTE – FINANCIAL COSTS............................110
5.1 COSTS OF SEPARATE COLLECTION...........................................................................1115.2 RESULTS FOR LANDFILL ..........................................................................................1155.3 RESULTS FOR INCINERATION ...................................................................................1195.4 RESULTS FOR COMPOSTING .....................................................................................1225.5 RESULTS FOR ANAEROBIC DIGESTION.....................................................................125
6.0 RESULTS OF THE ECONOMIC ANALYSIS.....................................................1326.1 FINANCIAL AND ECONOMIC COSTS AND BENEFITS OF SEPARATE COLLECTION.......132
6.1.1 A Note on Methodology ..................................................................................1336.2 SWITCHING FROM LANDFILL TO COMPOSTING.........................................................133
6.2.1 External Benefits.............................................................................................1366.2.2 Private Costs...................................................................................................1366.2.3 Costs Net of External Benefits ........................................................................1406.2.4 Comment on Landfill Taxes............................................................................141
6.3 SWITCHING FROM LANDFILL TO ANAEROBIC DIGESTION ........................................1416.3.1 External Benefits.............................................................................................1416.3.2 Private Costs...................................................................................................1416.3.3 Costs Net of External Benefits ........................................................................147
6.4 SWITCHING FROM INCINERATION TO COMPOSTING..................................................1476.4.1 External Benefits.............................................................................................1476.4.2 Private Costs...................................................................................................1506.4.3 Costs Net of External Benefits ........................................................................1506.4.4 Comment on Incinerator Taxes ......................................................................150
6.5 SWITCHING FROM INCINERATION TO ANAEROBIC DIGESTION .................................1516.5.1 External Benefits.............................................................................................1516.5.2 Private Costs...................................................................................................1516.5.3 Costs Net of External Benefits ........................................................................151
6.6 SUMMARY ...............................................................................................................151

Economic Analysis of Options for Managing Biodegradable Municipal Waste � Final Report
Eunomia Research & Consulting, Scuola Agraria del Parco di Monza, HDRA Consultants, ZREU and LDK ECO onbehalf of ECOTEC Research & Consulting
iii
7.0 FUTURE SCENARIOS ...........................................................................................1557.1 BASELINE SCENARIO - INFLUENCE OF THE LANDFILL DIRECTIVE............................155
7.1.1 Treatments Under the Baseline ......................................................................1607.2 EFFECTS OF IMPLEMENTING A REQUIREMENT FOR SOURCE SEPARATION OFMATERIALS (AS WELL AS STANDARDS)................................................................................164
7.2.1 Effects Relative to Baseline – Quantity of Biowastes Separately Collected...1647.2.2 Costs and Benefits of Implementing a Requirement for Source Separation...1657.2.3 Costs and Benefits of A Policy of Source Separation.....................................173
7.3 EFFECTS OF IMPLEMENTING A SYSTEM OF STANDARDS FOR QUALITY COMPOSTING180
7.3.1 Quantification of Impacts of Implementing Standards Systems .....................1817.4 THE POTENTIAL IMPACT OF AGRI-ENVIRONMENTAL POLICIES ................................1827.5 INTERNAL MARKET AND TRADE ISSUES ..................................................................184
8.0 OBSERVATIONS, CONCLUSIONS AND RECOMMENDATIONS................1858.1 INTRODUCTION ........................................................................................................1858.2 KEY OBSERVATIONS................................................................................................1858.3 CONCLUSIONS..........................................................................................................1868.4 RECOMMENDATIONS FOR FUTURE INVESTIGATIONS................................................189

Economic Analysis of Options for Managing Biodegradable Municipal Waste � Final Report
Eunomia Research & Consulting, Scuola Agraria del Parco di Monza, HDRA Consultants, ZREU and LDK ECO onbehalf of ECOTEC Research & Consulting
iv
Preface
We are grateful to the many individuals who have assisted in the preparation of thisreport. In particular, we would like to thank Pierre Strosser, Sonia Fumagalli and LucaMarmo of the European Commission for their helpful comments throughout the course ofthe report�s preparation.
Economic Analysis of Options for Managing Biodegradable Municipal Waste � Final Report
Eunomia Research & Consulting, Scuola Agraria del Parco di Monza, HDRA Consultants, ZREU and LDK ECO onbehalf of ECOTEC Research & Consulting
v
ABBREVIATIONS
AD Anaerobic Digestion
BMW Biodegradable Municipal Waste
CA site Civic Amenity Site
CAP Common Agricultural Policy
CCGT Combined Cycle Gas Turbine
CHP Combined Heat and Power
FEAD Féderation Européenne des Activités du Dechet et de l�Environment
GDP Gross Domestic Product
GMOs Genetically Manipulated Organisms
IPPC Integrated Pollution Prevention and Control
MBT Mechanical Biological Treatment
MHV Medium Heating Value
MSW Municipal Solid Waste
NFFO Non-Fossil Fuel Obligation
OECD Organisation for Economic Co-operation and Development
PCBs Poly-chlorinated Biphenyls
PFI Private Finance Initiative
PRNs Packaging Recovery Notes
RCVs Refuse Collection Vehicles
RDF Refuse-Derived Fuel
RVF Swedish Association of Waste Management
Economic Analysis of Options for Managing Biodegradable Municipal Waste � Final Report
Eunomia Research & Consulting, Scuola Agraria del Parco di Monza, HDRA Consultants, ZREU and LDK ECO onbehalf of ECOTEC Research & Consulting
vi
SO Standards Only (scenario)
SP Standards Plus (scenario)
TEQs Toxic Equivalents
VOCs Volatile Organic Compounds
Eunomia Research & Consulting, Scuola Agraria del Parco di Monza, HDRA Consultants, ZREU and LDK ECO onbehalf of ECOTEC Research & Consulting
vii
ECONOMIC ANALYSIS OF OPTIONS FORECONOMIC ANALYSIS OF OPTIONS FORECONOMIC ANALYSIS OF OPTIONS FORECONOMIC ANALYSIS OF OPTIONS FORMANAGING BIODEGRADABLE MUNICIPALMANAGING BIODEGRADABLE MUNICIPALMANAGING BIODEGRADABLE MUNICIPALMANAGING BIODEGRADABLE MUNICIPAL
WASTEWASTEWASTEWASTE
Final Report to the EuropeanFinal Report to the EuropeanFinal Report to the EuropeanFinal Report to the EuropeanCommissionCommissionCommissionCommission
Dominic Hogg, Enzo Favoino, Nick Nielsen,
Jo Thompson, Kalen Wood, Alexandra Penschke,
Dimitris Economides, Sophia Papageorgiou.
120 Cotham Brow
Cotham
Bristol
BS6 6AR
UNITED KINGDOM
Tel +44 (0)117 9426678

Economic Analysis of Options for Managing Biodegradable Municipal Waste � Final Report
Eunomia Research & Consulting, Scuola Agraria del Parco di Monza, HDRA Consultants, ZREU and LDK ECO onbehalf of ECOTEC Research & Consulting
viii
Fax +44 (0)117 9426679

Economic Analysis of Options for Managing Biodegradable Municipal Waste � Final Report
Eunomia Research & Consulting, Scuola Agraria del Parco di Monza, HDRA Consultants, ZREU and LDK ECO onbehalf of ECOTEC Research & Consulting
ix


Economic Analysis of Options for Managing Biodegradable Municipal Waste � Final Report
Eunomia Research & Consulting, Scuola Agraria del Parco di Monza, HDRA Consultants, ZREU and LDK ECOon behalf of ECOTEC Research & Consulting
1
11..00 IINNTTRROODDUUCCTTIIOONN AANNDD SSCCOOPPEEECOTEC Research and Consulting Limited (ECOTEC), in association with EunomiaResearch & Consulting, HDRA Consultants Ltd (UK), Zentrum für RationelleEnergieanwendung und Umwelt GmbH (ZREU) (Centre for Rational Use of Energyand Environment Ltd.) (Germany), Scuola Agraria del Parco di Monza (Italy), and LDKConsultants (Greece), has been asked by the European Commission to carry out anEconomic Analysis of Options for Managing Biodegradable Municipal Waste. Thistakes place at a time when many countries, especially those that are heavilydependent upon landfill, are considering options of this nature in the context of theArticle 5 targets in the Council Directive on the Landfill of Waste (the LandfillDirective).1
11..11 AAiimmss aanndd OObbjjeeccttiivveess
The main objective of the study is:
To conduct an economic evaluation, that considers both private and social welfarecosts and benefits, of existing options for managing the biodegradable fraction ofmunicipal solid waste.
Although all management options (anaerobic digestion, composting, landfilling,incineration, etc.) are considered in the study, the main emphasis is on the separatecollection and recycling of the biodegradable fraction of MSW. The study focuses onthe Member States of the European Union and on the first wave of Accessioncountries, i.e. the Czech Republic, Poland, Hungary, Estonia, Slovenia and Cyprus.
Specific tasks are:
• To identify the main private and public stakeholders that are involved in themanagement and recycling of organic municipal solid waste (MSW), along withtheir main technical, social, financial / economic and legal constraints
• For the different management options (anaerobic digestion, composting, land-filling, incineration etc.) that are currently practised, and in particular, for theseparate collection and recycling options that will be identified, to specify:
a) the technical problems and primary constraints related to theimplementation of the option;
b) the quantity, the type and the quality of waste that may potentially betargeted by the option;
1 OJ L 182/1, 26.4.1999.
Economic Analysis of Options for Managing Biodegradable Municipal Waste � Final Report
Eunomia Research & Consulting, Scuola Agraria del Parco di Monza, HDRA Consultants, ZREU and LDK ECOon behalf of ECOTEC Research & Consulting
2
c) the characteristics and quality of the end product, and its potential markets(types of use, market size, marketing constraints);
d) the quality and characteristics of any final residues generated by thetreatment option, and any issues associated with their management andtreatment;
e) the financial and economic costs and benefits of each option;
f) for the different quantitative figures provided, to give a range according tothe most distinct observed situations (urban versus rural areas, differentfeedstock, different physical environment or states, etc)
• To compare the costs of alternatives to the end-products (bio-methane versusother sources of energy, nitrate/phosphate to plants from different types ofcomposts versus manure or fertilisers, etc)
• Based on the results of the above mentioned tasks, to undertake the economic(cost-benefit) analysis of possible changes in EU legislation for managingbiodegradable municipal waste in the different Member States and the entireEuropean Union
• To perform appropriate sensitivity analyses on the main assumptions made forestimating costs and benefits / elements and for undertaking the cost-benefitanalysis of the implementation of the proposed Directive (implementation scenarioon the Directive, technological change, Common Agricultural Policy (CAP) reform,etc.)
• To identify and qualify any significant potential internal market and trade issuesthat may arise as a result of different National legislation on composting, and toassess the impact of harmonised legislation on these issues.
11..22 SSccooppee ooff tthhee AAnnaallyyssiiss
11..22..11 DDeeffiinniittiioonn ooff MMuunniicciippaall WWaassttee
It was intended that the study should use the definition of �municipal waste� as it isused in specific Member States. Definitions of �municipal waste� differ greatly betweencountries, as is made clear in a report by the University of Louvain-la-Neuve BusinessSchool (1998), who make the point that: �While almost all municipalities haveresponsibility for the management of household waste, the definition and responsibilityof non-household municipal solid waste, or industrial waste, or construction wastevary greatly from system to system [between countries].� In addition, the EuropeanTopic Centre on Waste has noted the discrepancies in Member State definitions, aswell as the fact that the terms �household waste� and municipal waste� are often usedas though the two were interchangeable, even though they are not the same thing(Christiansen and Munck-Kampmann 2000).

Economic Analysis of Options for Managing Biodegradable Municipal Waste � Final Report
Eunomia Research & Consulting, Scuola Agraria del Parco di Monza, HDRA Consultants, ZREU and LDK ECOon behalf of ECOTEC Research & Consulting
3
The problems associated with the different definitions are magnified when one tries tounderstand the composition of municipal waste. This is because it is not alwaysobvious what it is whose composition is being measured. For example, wherecomposition relates to waste collected at the doorstep of households, this may be avery poor approximation to the composition of municipal waste where large amountsof commercial waste are collected, or where households make extensive use of civicamenity sites or containerparks.
Economic Analysis of Options for Managing Biodegradable Municipal Waste � Final Report
Eunomia Research & Consulting, Scuola Agraria del Parco di Monza, HDRA Consultants, ZREU and LDK ECOon behalf of ECOTEC Research & Consulting
4
11..22..22 PPoolliiccyy CChhaannggeess BBeeiinngg CCoonnssiiddeerreedd
No policy measure has yet been agreed by the European Commission concerningbiodegradable municipal wastes other than the Landfill Directive itself. Two policyvariants are considered in this report. These can be characterised as:
• Standards-only (SO) a policy which establishes only technical standards formaterials collection and composting processes (in terms of, for example, heavymetals content); and
• Standards-plus (SP)a policy which not only establishes standards, but whichalso puts in place requirements for the separate collection of, and / or homecomposting of, biodegradable municipal waste.
For the sake of argument, and for purposes of clarity, these are referred to as the�standards-only� (SO) and �standards-plus� (SP) scenarios. The focus is very much onthe SO scenario for two reasons. In the first instance, the effect of a standards onlypolicy is much less straightforward to predict. Secondly, the SP policy has morecertain outcomes and lends itself more readily to quantification of impacts, thoughthese are by no means straightforward to estimate.
11..22..33 BBiiooddeeggrraaddaabbllee WWaasstteess CCoonnssiiddeerreedd iinn ‘‘SSttaannddaarrddss PPlluuss’’ SScceennaarriioo iinn tthheeSSttuuddyy
For purposes of clarification, in the SP scenario, only �biowastes� are beingconsidered. Other biodegradable wastes such as paper, textiles and nappies are notpart of the study�s key focus. Biowastes as defined here include:
• Kitchen wastes from households
• Yard wastes from gardens; and
• Where included in the definition of �municipal waste�, kitchen wastes fromrestaurants, green waste from parks, and wastes similar to kitchen wastes /parks from commerce and industry.
The choice reflects the principal intent of any possible new policy instrument that maybe introduced, and the focus of the current study in terms of treatments.
It is appreciated that significant quantities of paper can be composted, but compostingof paper is not a focus of this study. In addition, it is appreciated that biologicaltreatment methods can deal with more wastes than those which are the primary focushere. However, the study was asked to focus on those fractions which are mostcommonly targeted for biological treatments post-separation.
Compositional data should help to identify how much biodegradable waste other than�biowaste� (as defined above), especially paper, is present in MSW. This is importantsince in this study, the impact of the proposed policy change has to be measuredagainst a baseline. The baseline is now, effectively, the situation as it will look under

Economic Analysis of Options for Managing Biodegradable Municipal Waste � Final Report
Eunomia Research & Consulting, Scuola Agraria del Parco di Monza, HDRA Consultants, ZREU and LDK ECOon behalf of ECOTEC Research & Consulting
5
the Landfill Directive. The key part of the Directive from the point of view of this studyis Article 5 (2), which is shown in Box 1.
Other aspects of the Directive will have an impact on the options used to treatmunicipal waste. For example, where Member States do not have landfills dedicatedto the treatment of hazardous waste only, landfilling of hazardous wastes will only beable to continue if such landfills are established. Hence, it may become more difficultto find outlets for fly ash from incinerators and their disposal may become more costly,depending upon the way in which the Landfill Directive is transposed into MemberState legislation.
BOX 1: ARTICLE 5 (2) OF THE COUNCIL DIRECTIVE ON THE LANDFILLING OF WASTE
2. This strategy shall ensure that:
not later than five years after the date laid down in Article 18(1), biodegradable municipal waste going to landfillsmust be reduced to 75% of the total amount (by weight) of biodegradable municipal waste produced in1995 or the latest year before 1995 for which standardised Eurostat data is available.
not later than eight years after the date laid down in Article 18(1), biodegradable municipal waste going to landfillsmust be reduced to 50% of the total amount (by weight) of biodegradable municipal waste produced in1995 or the latest year before 1995 for which standardised Eurostat data is available.
not later than 15 years after the date laid down in Article 18(1), biodegradable municipal waste going to landfills mustbe reduced to 35% of the total amount (by weight) of biodegradable municipal waste produced in 1995 orthe latest year before 1995 for which standardised Eurostat data is available.
Two years before the date referred to in paragraph © the Council shall re-examine the above target, on the basis ofa report from the Commission on the practical experience gained in Member States in the pursuance of the targetslaid down in paragraphs (a) and (b) accompanied, if appropriate, by a proposal with a view to confirming oramending this target in order to ensure a high level of environmental protection.
Member States which, in 1995 or the latest year before 1995 for which standardised Eurostat data is available, putmore than 80% of their collected municipal waste to landfill may postpone the attainment of one or more targets etout in paragraphs (a), (b) or (c) by a period of not exceeding four years. Member States intending to make use ofthis provision shall inform the Commission of their decision in advance. The Commission shall inform otherMembers States of these decisions.
The implementation of the provisions set out in the preceding subparagraph may in no circumstances lead to theattainment of the target set out in paragraph (c) at a date later than four years after the date set out in paragraph (c).
11..22..44 OOuuttlliinnee ooff AApppprrooaacchh ttoo tthhee SSttuuddyy
The way in which the study has been carried out is represented schematically inFigure 1. Essentially, there are 6 steps in the process:
• Step 1: This involves analysing the external costs and benefits of the differentoptions. The bulk of this work is carried out in Section 4 and in the relatedAppendices. The shortcomings and omissions in this analysis are identified;
• Step 2: This assesses the private costs of the different treatment options. Agate fee approach has been adopted, which is less than ideal for this type of
Economic Analysis of Options for Managing Biodegradable Municipal Waste � Final Report
Eunomia Research & Consulting, Scuola Agraria del Parco di Monza, HDRA Consultants, ZREU and LDK ECOon behalf of ECOTEC Research & Consulting
6
analysis. This work is based on country investigations and is carried out inSection 5;
• Step 3: Based on Steps 1 and 2, the private and external costs and benefits ofchanging fro landfill or incineration, to either composting or anaerobic digestionare estimated. This analysis is carried out for each individual country and theresults are outlined in Section 6;
• Step 4: Based on investigations of the current situation (Section 3) andMember State (and Accession state) plans, countries are assigned a countryclassification based on how far they are expected to have achieved sourceseparation of wastes for composting or digestion by the year 2010;
• Step 5: These country classifications and associated scenarios (Section 7) areused to estimate the amount of waste going to each of the key treatment routesin 2010 under a scenario in which only the Landfill Directive in place. This isdone for different rates of growth in municipal waste. The changes in theamount of waste going to each of the treatment routes implied by a policyrecommending source separation are then estimated, the extent of the changebeing related to the country classification;
• Step 6: The final step involves bringing the results of Steps 3 and 5 together(Section 7). The estimated movement of waste away from landfill andincineration and towards composting and anaerobic digestion is combined withthe unit values of costs and benefits associated with switching betweentreatments. These two pieces of information enable one to derive an estimateof total costs and benefits of the policy change proposed.
Figure 1: Schematic Outline of Approach

Economic Analysis of Options for Managing Biodegradable Municipal Waste � Final Report
Eunomia Research & Consulting, Scuola Agraria del Parco di Monza, HDRA Consultants, ZREU and LDK ECOon behalf of ECOTEC Research & Consulting
7
Composting Anaerobic Digestion Landfill IncinerationStep 1:External Cost / Benefit Analysis
Step 2: Private Cost Analysis
Step 3: Total Cost / Benefit Analysis (per tonne) for Switching Between Treatments
Composting Anaerobic Digestion Landfill Incineration
Landfill to Composting
Landfill to Anaerobic Digestion
Incineration to Composting
Incineration to Anaerobic Digestion
Step 4: Country Classification (estimated trajectory under Landfill Directive to 2010)
Class 1: High Source Separation
Class 2: Medium Source Separation
Class 3: Low Source Separation
Step 5: Calculate Waste Treatments With and Without Policy Change (Various Growth Rates)
Step 6: Combine Steps 3 and 5 to Estimate Costs and Benefits of Policy Change Under Different Growth Rate Scenarios
11..33 OOuuttlliinnee ooff tthhee RReeppoorrtt
This report presents the results of the work undertaken. The analysis seeks to capturecosts and benefits in a comprehensive framework. However, as with all analyses ofthis nature, there are omissions, possibly significant ones, and uncertainties reflectingthe lack of scientific knowledge and / or consensus around some of the effects forwhich valuations are sought. This, it should be added, applies to all the wastemanagement options which the study addresses (and it does not address alltreatments in a comprehensive manner).
The study follows the following lay-out.
Section 2: Potential Treatments for Biodegradable Municipal Wastes
Section 3: Current Situation Regarding Municipal Waste - Arisings,Composition And Treatments
Section 4: The Economic Analysis Of Options For Managing BiodegradableMunicipal Waste � External Costs
Section 5: The Economic Analysis Of Options For Managing BiodegradableMunicipal Waste � Financial Costs

Economic Analysis of Options for Managing Biodegradable Municipal Waste � Final Report
Eunomia Research & Consulting, Scuola Agraria del Parco di Monza, HDRA Consultants, ZREU and LDK ECOon behalf of ECOTEC Research & Consulting
8
Section 6: Results Of The Economic Analysis (in which the external and privatecost analyses are combined)
Section 7: Future Scenarios (in which country-specific projections are made,and the private and external costs are estimated to the year 2010)
Section 8: Observations, Conclusions and Recommendations.
Further details are to be found in the supporting Appendices.

Economic Analysis of Options for Managing Biodegradable Municipal Waste � Final Report
Eunomia Research & Consulting, Scuola Agraria del Parco di Monza, HDRA Consultants, ZREU and LDK ECOon behalf of ECOTEC Research & Consulting
9
22..00 PPOOTTEENNTTIIAALL TTRREEAATTMMEENNTTSS FFOORRBBIIOODDEEGGRRAADDAABBLLEE MMUUNNIICCIIPPAALL WWAASSTTEESS
Municipal waste is treated in different ways in different countries in the EU and theAccession States. The variation across countries reflects a combination of:
• Differing levels of emphasis on source separation, enabling different approachesto treatment of waste; and
• Different approaches, relating to historical, economic, geological and culturalfactors, to waste treatment (these approaches and the cultural factors beingrelated, in a dialectical way, to the approaches to collection of waste � the two �co-evolve�).
As will become clear, some parts of Europe collect separately as much as 60% of allmunicipal waste (Flanders) whilst others carry out very little separation of wastes. Asregards residual waste, some rely very heavily on incineration of household wastes(e.g. Denmark), whilst others landfill the majority of the municipal waste collected(e.g., Ireland, Italy, Spain, UK, Portugal, Accession States).
This Chapter reviews the different treatment options available for the treatment ofmunicipal waste.
22..11 LLaannddffiillll
The landfilling of waste has occurred for many years. All Member States andAccession States landfill some waste though several Member States areimplementing, or have implemented restrictions or bans on the landfilling of municipalwaste other than under specific conditions. In some countries, the majority ofmunicipal waste is landfilled. The technical barriers can be said to be relatively few.However, it should be recognised that the term �landfill� is used to refer to a widerange of facilities across Member States, from primitive dumps to sites which areengineered specifically for the purpose (and sometimes, for specific wastes), andfrequently inspected. In some of the countries being examined, a significant quantityof municipal waste is landfilled in uncontrolled fashion in sites which are barelyengineered, if at all.
The degradation of biodegradable wastes under landfill conditions creates methane.Methane is a powerful greenhouse gas (30 times or so more powerful than carbondioxide) and the Landfill Directive is designed partly to address the issue of methaneemissions from landfills. Notwithstanding the fact that inspections take place, andacknowledging the intentions to reduce impacts of landfilling, accidents do happen.Methane gas can build up in pockets and create explosions. For this reason, biologicaltreatment to stabilise waste before landfilling is becoming an important pre-treatmentfor landfill in some countries. Furthermore, the land area occupied by landfills isconsiderable.
Economic Analysis of Options for Managing Biodegradable Municipal Waste � Final Report
Eunomia Research & Consulting, Scuola Agraria del Parco di Monza, HDRA Consultants, ZREU and LDK ECOon behalf of ECOTEC Research & Consulting
10
As long as landraises are not deemed acceptable to communities where they areproposed, the availability of landfill void space might be expected to be conditioned bydemand for primary minerals and aggregates, which generates the void space thatpotentially becomes a landfill. Since many countries are seeking to encourage greaterre-use of construction and demolition materials, and re-use of parts of buildings, itmight be expected that where these initiatives are successful, the rate at which voidspace is created in the future will fall.
In addition, some countries use waste materials (including incinerator bottom ash, ashfrom other power stations and �glasphalt�, a product of recycled glass) to displaceaggregates in construction and road-building projects. This will also slow down therate at which void space is created. Since waste arisings are not falling, theconclusion that one might draw is that the supply of landfill void space will come underincreasing pressure to meet demand under any scenario which represents �business-as-usual� for wastes other than those used for construction purposes.
The business-as-usual scenario is increasingly difficult to define as the situation ischanging. Quite apart from space, the principal influences on the degree to whichlandfill is used may be expected to be:
• Public opinion � landfills create significant disamenity effects (though thesemay fall over time as neighbours become accustomed to them); and
• Member State / Accession State legislation / plans.
Obviously, the Landfill Directive is a most important driver where the latter isconcerned. Article 5 (2) sets out a schedule for Member States to reduce the amountof biodegradable municipal waste (BMW) landfilled. This has to be reduced in thefollowing ways:
• By 2006, to 75% of the amount of BMW that was landfilled in 1995;
• By 2009, to 50% of the amount of BMW that was landfilled in 1995;
• By 2016, to 35% of the amount of BMW that was landfilled in 1995.
A 4 year derogation period exists for those Member States who were landfilling morethan 80% of all municipal waste in 1995. This includes the following countries:
• Greece
• Ireland
• Italy
• Portugal
• Spain
• United Kingdom
• Cyprus
• Estonia
• Hungary
• Poland

Economic Analysis of Options for Managing Biodegradable Municipal Waste � Final Report
Eunomia Research & Consulting, Scuola Agraria del Parco di Monza, HDRA Consultants, ZREU and LDK ECOon behalf of ECOTEC Research & Consulting
11
• Slovenia
All municipal wastes can be accepted by landfill. These wastes generate differentemissions depending upon their potential to degrade under landfill conditions, and thisaffects the impacts of landfilling (see Figure 2). Different materials also degrade atdifferent rates, and the contribution of different fractions to leachate will vary. Leachatewill quite possibly affect groundwater at some later date. Whether, and if so, whenleachate will become a problem will be determined in part by the landfill lining and thegeological characteristics of the site.
The only �end product� for landfills is landfill gas, which if collected can be used togenerate energy. There will be markets for the energy, and some countries effectivelysupport the generation of energy from landfill gas. The UK has done so explicitlyunder the Non-fossil Fuel Obligation (NFFO) and will do so implicitly (in future)through exemptions from the climate change levy (which will be introduced for otherpower sources in 2001).
The final residues in landfills consist of material which has not degraded (in landfillconditions) and the leachate residues which may be treated through variousapproaches. The former may have substantial carbon content. As such, to the extentthat certain materials which might degrade under aerobic conditions do not do so inlandfills, landfills may be considered to be a net sequester of carbon. Bramryd (1998)has likened them to a peat-bog for this reason.
Figure 2: Emissions to Air from Landfill and Exposure Pathways
Source: Gregory et al (1999)
Two broad types of landfill strategies can be identified. Traditional landfills areuncontrolled and allow leachate to be released into the soil surrounding the landfillwithout restriction. This 'dilute and disperse' method is, however, no longer consideredan appropriate operation method in view of the serious risk posed by leachate togroundwater supplies and the potential uncontrolled accumulation, and movement, of
Economic Analysis of Options for Managing Biodegradable Municipal Waste � Final Report
Eunomia Research & Consulting, Scuola Agraria del Parco di Monza, HDRA Consultants, ZREU and LDK ECOon behalf of ECOTEC Research & Consulting
12
landfill gas. Most modern MSW landfills are therefore controlled and operated usingthe principle of 'containment'. Landfilled waste is separated from the environment byliners, and both leachate and landfill gas are collected and treated, including after theclosure of the landfill.
Containment of waste combined with the operation of the landfill as a large 'bioreactor'has been proposed. This involves operating the landfill to accelerate thedecomposition processes, such that the production of leachate and landfill gas occursas early as possible and when the collection and treatment systems are in workingorder (Bramryd 1998).
Mechanical biological treatment (MBT) is a valuable tool for pre-treating wastes priorto landfilling. Such pre-treatment can lead to the material to be landfilled beingrelatively benign in respect of its potential to generate methane and leachate (MBT isexamined below).
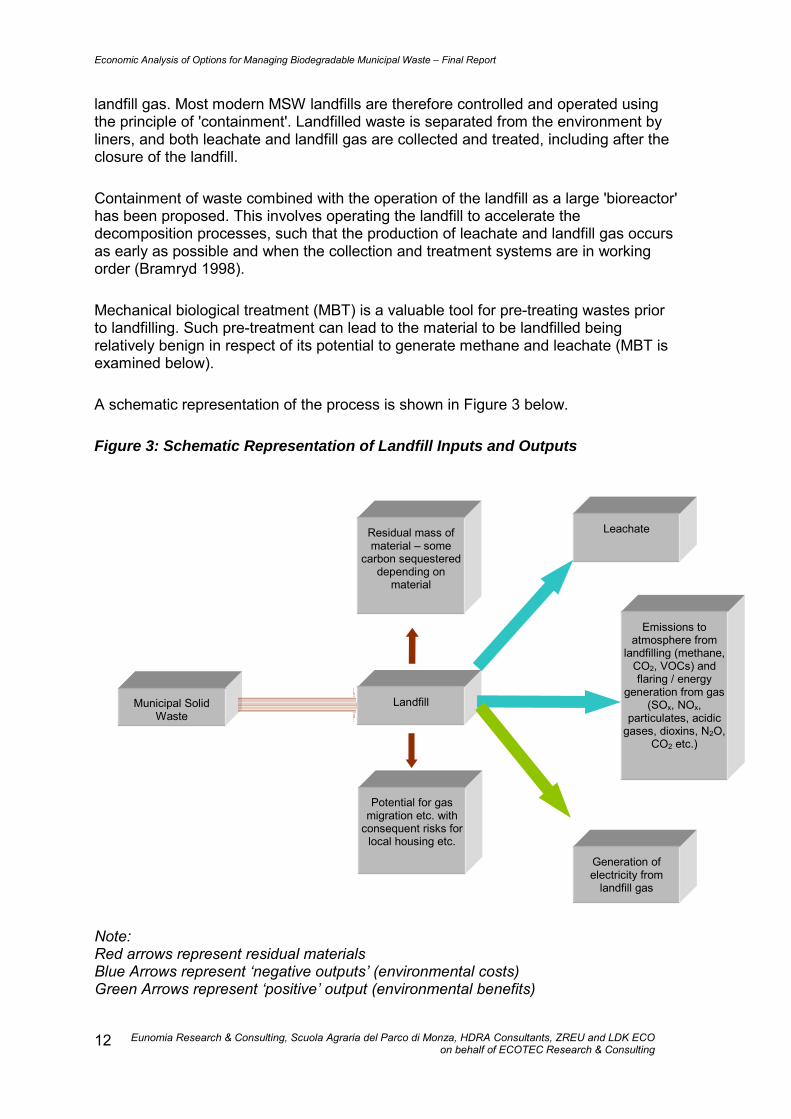
A schematic representation of the process is shown in Figure 3 below.
Figure 3: Schematic Representation of Landfill Inputs and Outputs
Note:Red arrows represent residual materialsBlue Arrows represent �negative outputs� (environmental costs)Green Arrows represent �positive� output (environmental benefits)
Municipal SolidWaste
Residual mass ofmaterial � some
carbon sequestereddepending on
material
Landfill
Potential for gasmigration etc. with
consequent risks forlocal housing etc.
Emissions toatmosphere from
landfilling (methane,CO2, VOCs) andflaring / energy
generation from gas(SOx, NOx,
particulates, acidicgases, dioxins, N2O,
CO2 etc.)
Leachate
Generation ofelectricity from
landfill gas
Economic Analysis of Options for Managing Biodegradable Municipal Waste � Final Report
Eunomia Research & Consulting, Scuola Agraria del Parco di Monza, HDRA Consultants, ZREU and LDK ECOon behalf of ECOTEC Research & Consulting
13
There are still uncertainties in the available knowledge as to how landfills affecthuman health. Recent work in the UK mentions the possibility (though no firm cause-effect relationship is suggested) of landfills being responsible for birth defects in thesurrounding area (see Elliott et al 2001). Further work is being undertaken in thiscontext.
22..22 IInncciinneerraattiioonn ((WWiitthh EEnneerrggyy RReeccoovveerryy))
This section treats mass-burn incineration, fluidised bed incineration and incinerationof refuse-derived fuel under the same heading. Of these different technologies, massburn technology appears to be the most widely used.
In mass burn incinerators, waste is first fed into a feed chute where a ram pushes thewaste on to the first section of the incinerator grate. The grate (rather like a downwardescalator) may comprise a series of rocking sections (Rocker Grate); rotating rollers(Rolling Grate); or alternate fixed and moving sections (Reciprocating Grate). Eachgrate design aims to move the waste through the combustion chamber (furnace) withmaximum exposure to oxygen at a high temperature. As the waste is propelledthrough the furnace, the carbonaceous/hydrogenous waste is dried and oxidised(combusted) with air supplied through the grate. The reaction leaves ash and fluegases to be quenched prior to cleaning and emission to the atmosphere. Energyrecovery is obtained by the combustion gases transferring their heat to refractory-linedwater tube sections as well as convective heat exchangers � both of which feed theboiler. Steam from the boiler can be used for district heating or in a turbine for powerproduction to an electricity grid.
Refuse derived fuel (RDF) is manufactured by sorting wastes to remove wetputrescibles and heavy inerts (stones, glass, etc.) so as to leave combustible material.The remaining waste is then shredded and either burned directly, or pelletised prior tocombustion (usually where the material is burned off-site, so that a densified fuelreduces transport costs). Manufacture of RDF is often an objective of MBT plants andthe material may be incinerated in dedicated facilities, or co-incineration plants.
Fluidised bed incinerators operate with a bed of hot sand. The feedstock is preparedso that it is all of an equal size, sometimes using methods similar to that describedabove for RDF. The particles of sand and the feedstock are maintained underconstant motion (fluidised) by a gaseous agent (air), which ensures good mixing ofoxygen and the feedstock. The feedstock is maintained in the furnace until thecarbonaceous and hydrogenous matter within the waste is oxidised (combusted),leaving ash and flue gases for cleaning and subsequent emission to the atmosphere.Variations on the basic design exist, but with all, either the sand never leaves the bed,or else it is re-circulated.
Incineration can, depending upon waste composition (which may exhibit seasonalvariation), handle unsorted municipal wastes as well as wastes from which materialshave already been separated. The different incineration technologies mentionedabove may make more or less deliberate attempts to remove specific fractions ofwaste from the waste stream. For example, garden wastes may be best treatedthrough composting both because of their seasonal nature, and due to the fact thatmuch of the material (e.g. grass clippings) may have quite low calorific value.
Economic Analysis of Options for Managing Biodegradable Municipal Waste � Final Report
Eunomia Research & Consulting, Scuola Agraria del Parco di Monza, HDRA Consultants, ZREU and LDK ECOon behalf of ECOTEC Research & Consulting
14
An issue of significance for the operation of incineration plants is the calorific value ofthe input waste. Mass-burn grate incinerators tend to be designed for operation usingmaterial of a reasonably well-known calorific value. If the calorific value increases ordecreases significantly, the input of waste to the plant has to reduced or increased toreflect the change. With fluctuations in the composition of wastes, the efficiency of thecombustion process may change, altering the associated emissions. Where wastesreach very high calorific values, or where they are very wet, either changes incomposition (separation at front-end, or mixing) may be required, or desirable. Inextreme cases, the process itself may find the composition of waste difficult to copewith. This is generally believed to be less of a problem for fluidised bed incinerators.
One of the principal constraints on the use of incinerators is public opposition. Insome countries, people simply do not want to live near these plants owing toproblems of disamenity, and the emissions of NOx, SOx, HCl, particulates, heavymetals and dioxins associated with the plant. The first five of these are known tohave effects upon human health.
For dioxins, the case is somewhat controversial. Draft reviews from the USEPAsuggest the effects of dioxins may be worse than had originally been thought. It isimportant to note that the Incinerator Directive limit values refer only to the 17chlorinated dioxins which are added to make up TEQs (toxic equivalents). Emissionsof dioxin-like polychlorinated biphenyls (PCBs) are not included in any of the studiesreviewing health impacts of incinerators. Also, Weber and Greim (1997) suggest thatthe similarity in action of chlorinated and brominated dibenzo-p-dioxins anddibenzofurans, would appear to imply that environmental and health assessmentsshould be based on molar body burdens without discrimination of the nature of thehalogen (characterizing the dioxin). This is not unimportant since there are about5,100 halogenated dioxins, as well as polychlorinated dibenzothiophenes andthianthrenes, which are sulphur analogues of the dibenzodioxins and furans, andpolychlorinated azobenzenes and azoxybenzenes (the list of potentially harmfulchemicals is not a short one).
Hansen (2000), in a report from the Danish EPA, suggests that incinerators are amajor source of dioxins in the country. Greenpeace Nordic (1999) suggest that theeffect of controls of atmospheric emissions has been to shift dioxins away from fluegas emissions and into ash residues, which are frequently less well controlled thanemissions to air. Furthermore, a study by De Fre and Wevers (1998) suggests thatdioxin emissions to the atmosphere are underestimated at incinerator plants due tothe way in which they are monitored (and this was recognised as a potentiallyimportant issue in the Hansen (2000) report).
Most mixed municipal wastes can be handled by incinerators as long as theconstraints in respect of composition and calorific value are respected. Largerfractions may pose problems and may be inappropriate if they compromise thecompleteness of the combustion process.
It is possible to extract metals, such as steel and aluminium, from the bottom ash.Indeed, this may be an advantage where wastes consist of mixed materials. However,the price paid for recovery of this material is usually far lower than in cases where the

Economic Analysis of Options for Managing Biodegradable Municipal Waste � Final Report
Eunomia Research & Consulting, Scuola Agraria del Parco di Monza, HDRA Consultants, ZREU and LDK ECOon behalf of ECOTEC Research & Consulting
15
material has been source�separated since they are usually contaminated (beingderived from the slag).
Some countries have given subsidies, or above-market prices for the energygenerated by incinerators. This is usually mirrored in the local scenario for gate fees,as subsidies can sharply reduce the overall unit fee to be applied in order to offsetmanaging costs. Italian provisions (the �CIP 6� Decree, then the �Green Certificates�)and UK ones (Non-Fossil Fuel Obligation) are known to have affected the averagegate fees significantly.2
Final residues include bottom ash and fly ash, as well as waste waters. It is possibleto use the bottom ash in construction applications, although some concerns remain asto the potential impact of this activity (if not now, then over the longer-term). Somecountries also use fly-ash in construction post-stabilisation. Again, there are concernsthat weathering will eventually lead to the release of what are often persistent andtoxic chemicals contained in fly ash (and potentially, the presence of these willincrease as requirements to clean flue gas become more strict). In th UK recently,concerns have arisen at plants where the mixing of bottom ash and fly ash hasoccurred prior to use of the material in construction applications.
Because various gaseous emissions from incinerators are known to have impactsupon human health (see above), a good deal of emphasis has been placed on fluegas cleaning. Depending upon the system used, a combination of solid and liquidresidues will result from this process. These solid and liquid residues then have to bedealt with. In the case of fly ash, the toxic nature of residues requires careful handlingand disposal to hazardous waste landfill facilities. There are likely to be importanteffects stemming from the Landfill Directive where disposal to hazardous waste landfillis concerned, though these will be especially significant where co-disposal is acommon practice at present (this will have to cease). Fly ash generation tends to begreater at fluidised bed incinerators.
Figure 4: Schematic Representation of Incineration Inputs and Outputs
2 In the UK, the NFFO scheme is effectively being replaced by a system of trading of Renewables ObligationCertificates. A statutory consultation document issued by UK Government on the Renewables Obligation suggestsincineration will be excluded from this, but that gasification and pyrolysis will be included. The implication wouldbe that the price support for electricity generated via incineration would be removed.
Fly ash and flue gascleaning residues to
hazardous wastelandfill
Emissions to water

Economic Analysis of Options for Managing Biodegradable Municipal Waste � Final Report
Eunomia Research & Consulting, Scuola Agraria del Parco di Monza, HDRA Consultants, ZREU and LDK ECOon behalf of ECOTEC Research & Consulting
16
Note:Red arrows represent residual materialsBlue Arrows represent �negative outputs� (environmental costs)Green Arrows represent �positive� output (environmental benefits)
22..33 PPyyrroollyyssiiss // GGaassiiffiiccaattiioonn
Pyrolysis and gasification are relatively new methods for treatment of municipal solidwaste and remain relatively unproven in European usage compared with classicalmoving grate methods. Although the technology is widely used and well establishedas an industrial process for energy recovery from hydrocarbons feedstock, their useas processes for dealing with heterogeneous, mixed municipal waste streams is at anearly stage of development.
22..33..11 PPyyrroollyyssiiss
Pyrolysis is a process which transforms waste into a medium calorific gas, liquid and achar fraction in the absence of oxygen, through the combination of thermo-crackingand condensation reactions.
Pyrolysis involves indirect heating of carbon rich material. The aim is to achievethermal degradation of the material at a temperature of some 500°C (a range 450-600°C is observable) in the absence of oxygen and under pressure. The temperatureis usually maintained through indirect heating.
Suitable feedstocks that can be treated by a pyrolysis facility include sewage sludge,agricultural wastes, mixed organic waste including food waste, garden waste, paperpulp and pre-separated residual waste.
Pyrolysis produces gas, liquid and solid char. Specifically:
• Gas stream (uncondensed gases from pyrolysis), containing CO, CO2, H2,CH4, C2H6, C2H4;
• Tar/oil (condensed gases from pyrolysis) - acetic acid, acetone, methane; and
Municipal SolidWaste
Incineration
Bottom ash to landfillor for use inconstruction
Emissions toatmosphere (SOx,NOx, particulates,
acidic gases,dioxins, N2O, CO2
etc.)
Generation ofelectricity and / or
heat energy fordistrict heating

Economic Analysis of Options for Managing Biodegradable Municipal Waste � Final Report
Eunomia Research & Consulting, Scuola Agraria del Parco di Monza, HDRA Consultants, ZREU and LDK ECOon behalf of ECOTEC Research & Consulting
17
• Char - pure carbon, with other inert material and heavy metals.
The relative proportions of these products depends on the type of pyrolysis employedand the reaction parameters. The process may be followed by a combustion stepand/or extraction of pyrolytic oil.
There are three main types of pyrolysis: (i) Slow pyrolysis or carbonisation, (ii)conventional pyrolysis and (iii) fast/flash pyrolysis (further separated into vacuum andfluidised bed). The cost of pyrolysis depends on the technology employed and ingeneral it can be said to vary from medium to high. When compared with anaerobicdigestion the cost is similar, but it is typically higher than the cost of an incinerationfacility. On the other hand, the plant scale is usually much smaller and it might beargued that if incinerators were constructed at the same scale, they would havecomparable or even higher costs (as the diseconomies of reduced scale areconsiderable). Hence, such facilities may be better-suited than incineration toscenarios where residual waste is mechanically separated into a smaller fraction forpyrolysis.
In fast pyrolysis, the carbonaceous material is fed into a chamber and rapidly heatedto medium temperatures (400-700oC) such that it reaches vapour phase almostinstantly. It is then extracted from the chamber and quenched (cooled) rapidly. Thevery fast heating/rapid quenching means that few of the long carbon-hydrogen chainsare broken and so the vapours condense into a liquid fuel (bio-oil), as opposed to agas, as would be the case for slower heating and quenching.
In vacuum fast pyrolysis, the feedstock is introduced to the reactor in a vacuum,where it is pyrolysed on a transported bed at 450oC. Some gas is evolved andprovides heat for the process. The vacuum technique has been developed primarilyfor the recycling of chemicals from tyres to the chemicals industry, since largequantities of pyrolytic oils can be obtained. Fast pyrolysis usually occurs in a reducingatmosphere, with a complete absence of oxygen to avoid widespread gasification,thereby maximising bio-oil recovery.
The chemical reactions involved are influenced by three factors:
• Input materials (chemical composition, water content)
• Reactor design (vertical shaft or batch reactor, rotating tubular or fluidised bedreactors, under vacuum or controlled atmosphere)
• Operating conditions (temperature, pressure, reaction time).
High reaction rates minimise the formation of char, to maximise bio-oil production (upto 80% mass yield of bio-oil). The degree of �vacuum� is a key influence on thequantities produced. Higher temperatures used lead to greater gas formation. Energyfor reaction can be directly or indirectly provided.
The fact that the gaseous, liquid and solid fractions are relatively homogeneousmakes thermal valorization less problematic (at least in theory) than in the case ofincineration. Residence times in the furnace vary, usually being shorter for rotating kilnor fluidised bed designs and longer for fixed bed designs.

Economic Analysis of Options for Managing Biodegradable Municipal Waste � Final Report
Eunomia Research & Consulting, Scuola Agraria del Parco di Monza, HDRA Consultants, ZREU and LDK ECOon behalf of ECOTEC Research & Consulting
18
The char, which is evacuated through an airlock system, is typically screened forvarious metal fractions. There is usually some contamination with heavy metals.Following screening, in integrated processes, the fuel may be sent to a combustion orgasification unit. Alternatively, it may be washed. If the pyrolysis process hasincorporated liming in the process, this can lead to leaching out of chlorine as calciumchloride, enabling the remaining fine coke residue to be used as auxiliary fuel inindustrial applications, such as coal-fired power plants and in cement rotary kilns.Where the desired output is chemicals for synthesis, a second gasification process isused to generate syngas, which is converted chemically into methyl alcohol orethanol. Generally the synthesis gas can be used either to substitute natural gas or togenerate electricity.
The recoverable energy content varies from 200 to 400 kWh/t of waste, althoughreports differ regarding these claims. Energy production and greenhouse gasproduction are lowered due to the starved air conditions. Less volatile heavy metalspecies remain in char while volatile species need to be captured by gas cleaningsystems and treated as hazardous materials.
Regarding the flue gases and wastewater generated by the facility these can betreated by means of common pollution prevention technologies. The heat from the fluegas can be recovered by means of a boiler with a super heater and economiser for thegeneration of high-pressure steam.
Major technical issues with pyrolysis include: heat transfer to the waste material;precise process control to achieve the desired mix and yield of products; and productseparation and collection, especially of bio-oil, which needs to be condensed. Processenergy is self-propagating. Pyrolysis tends not to be an efficient energy conversiontechnology since much of the fuel produced is consumed within the operation.
For municipal waste, it would appear that the major technical problems relate to theinput materials. It is generally accepted that these have to be relatively homogeneousin order for the process to function without problems. For this reason, plants tend to beequipped with front-end equipment designed to transform the waste through pre-processing to ensure the proper operation of the facility (such as a shear shredder toadjust the particles size of the feedstock). Equally, pyrolysis may be a suitableprocess for treating the output of mechanical biological treatment plants.
Figure 5: Schematic Representation of Single Pyrolysis Process Inputs andOutputs3
3 Note, the variety of designs makes it difficult to characterise this as one process. See Fontana and Jung (2001).
Exhaust gas) Emissions to water(from washing char)Water from
drying

Economic Analysis of Options for Managing Biodegradable Municipal Waste � Final Report
Eunomia Research & Consulting, Scuola Agraria del Parco di Monza, HDRA Consultants, ZREU and LDK ECOon behalf of ECOTEC Research & Consulting
19
Note:Red arrows represent residual materialsBlue Arrows represent �negative outputs� (environmental costs)Green Arrows represent �positive� output (environmental benefits)
22..33..22 GGaassiiffiiccaattiioonn
Gasification involves heating carbon rich waste in an atmosphere with slightly reducedoxygen concentration. The majority of carbon is converted to a gaseous form leavingan inert residue from break down of organic molecules.
Gasification is a thermo chemical process involving several steps. First, carbonaceousmaterial is dried to evaporate moisture. Depending on the process, pyrolysis thentakes place in a controlled, low air environment in a primary chamber, at around450oC, converting the feedstock into gas, vapourised liquids and a solid char residue.Finally gasification occurs, in a secondary chamber at between 700-1000oC(dependent on gasification reactor type). Here the pyrolysis gases and liquids andsolid char undergo partial oxidation into a gaseous fuel, comprising a variety of gases(dependent on reactor configuration and oxidant used). These gases include carbonmonoxide, carbon dioxide, hydrogen, water, and methane (and much smallerconcentrations of larger hydrocarbon molecules, such as ethane/ethene). Oils, ashtars and small char particles are also formed in the reaction, acting as contaminants.The heat source for the gasification process can be heated coke. Superheated steamcan also be injected at this point to facilitate the conversion into gaseous fuel.
Process description varies for different specific technologies and is generallypatented. The conversion process can utilise air, oxygen, steam or a combination ofthese gases. Gasification using air � the most widely used technique � produces afuel gas suitable for boiler/engine use, but it is difficult to transport in pipelines.Nitrogen is evolved since air is used in the oxidation process.
Gasification using oxygen (which is more expensive due to cost/hazard of oxygengeneration) produces a medium heating value (MHV) gas which can either be used as
Municipal SolidWaste
Pyrolysis
Emissions toatmosphere
(various, dependingupon energy
recovery processetc.)
Energy recovery fromgases and pyrolytic oils
(where used for thispurpose)
RecoveredMinerals and
Metals
Waste Pre-processing
(shredding etc.)
Ash from thermalvalorisation of char

Economic Analysis of Options for Managing Biodegradable Municipal Waste � Final Report
Eunomia Research & Consulting, Scuola Agraria del Parco di Monza, HDRA Consultants, ZREU and LDK ECOon behalf of ECOTEC Research & Consulting
20
a synthesis gas (e.g. for conversion to methanol) or for limited pipeline distribution.Steam (or pyrolytic) gasification produces a MHV gas.
A variety of gasification reactors (running at either atmospheric pressure orpressurised) have been developed, including fluidised and fixed bed. There arenumerous advantages/disadvantages to each configuration. Incomplete oxidation dueto reactor design and feedstock anomalies can contaminate the product gas, andwhere air is used, this will result in higher than expected NOx emissions. Circulatingfluidised bed gasifiers are seen as more versatile since char can be recycled.
The fuel gas can be used in thermal combustion engines to produce energy; in asteam turbine or a boiler; or as a raw material resource to produce methanol,hydrogen or methylacid. Syngas includes carbon dioxide, methane, carbon monoxide,hydrogen, nitrogen and ammonia. Small quantities of hydrochloric acid, hydrofluoricacid, hydrobaric acid, sulphur dioxide and nitrogen oxides and particulates areproduced along with trace metals or heavy metals, notably cadmium and mercury.
Gasification is widely considered as an energy efficient technique for reducing thevolume of solid waste and for recovering energy. Useable energy of some 500 to 600kWh per tonne of waste is generated by gasification.
Gasification technologies have been operated for over a century for coal producing�town gas� and have long been promoted as being a viable, cleaner alternative toincineration for residual municipal wastes.
Gasification is more widely used and more developed than pyrolysis for severalreasons. First, a highly efficient process produces a single gaseous product. Second,gasification does not have the heat transfer problems associated with pyrolysis.However, plants are known to have closed down due to waste variability and materialhandling problems. Newer processes have been developed in order to overcomethese problems through extensive pre-processing of the feedstock waste.
A number of Gasification and Pyrolysis processes are at commercial scale at themoment, applying a number of combinations of different techniques such as pyrolysis,combustion and gasification. According to a survey carried out in 1997 [Juniper, 1997]there were 16 technologies at varying stages of development with Siemens,Thermoselect and Von Roll being the most advanced European technologies with thefirst commercial plants in various stages of completion by that time. The Thermoselectplant at Karlsruhe, however, recently suffered problems associated with heavy metalemissions. Siemens has also effectively withdrawn from this market, having hadproblems with carbon monoxide emissions at a plant in Furth.

Economic Analysis of Options for Managing Biodegradable Municipal Waste � Final Report
Eunomia Research & Consulting, Scuola Agraria del Parco di Monza, HDRA Consultants, ZREU and LDK ECOon behalf of ECOTEC Research & Consulting
21
Figure 6: Schematic Representation of Gasification Inputs and Outputs
Note:Red arrows represent residual materialsBlue Arrows represent �negative outputs� (environmental costs)Green Arrows represent �positive� output (environmental benefits)
22..44 MMeecchhaanniiccaall BBiioollooggiiccaall TTrreeaattmmeenntt
Mechanical biological treatment is a process designed to optimise the use ofresources remaining in residual waste. Usually, it is designed to recover materials forone or more purpose, and to stabilise the organic fraction of residual waste. Thebenefits of this process are that materials and energy may be recovered, void spacerequirements are reduced and gas and leachate emissions from landfill aresignificantly reduced.
The mechanical treatment phase involves segregation and conditioning of wastes.The process involves primarily the shredding / crushing and screening of materials soas to:
Municipal SolidWaste
Fly ash and gascleaning residues to
landfill
Gasification
Emissions toatmosphere fromenergy recovery
process
Waste water fortreatment
Generation ofenergy from syngasRecovered
Minerals andMetals

Economic Analysis of Options for Managing Biodegradable Municipal Waste � Final Report
Eunomia Research & Consulting, Scuola Agraria del Parco di Monza, HDRA Consultants, ZREU and LDK ECOon behalf of ECOTEC Research & Consulting
22
• Open waste bags (where necessary);
• Extract undesirable components that may obstruct subsequent processing;
• Optimise particle size for subsequent processing;
• Segregate biodegradable materials in the underflows of primary screening, to besent to the biological treatment process;
• Segregate materials with high calorific value, such as textiles, paper and plastics,in the overflows of primary screening, to be sent for RDF production. Also,segregate those suitable for further material recovery or to be landfilled; and
• Homogenise materials destined for biological treatment.
The type of shredding and crushing machinery to be used will be determined by thematerials to be handled, the objectives of the treatment and the required processingcapacity. One type of plant design is shown in Figure 7.
Figure 7: Schematic Representation of Mechanical Biological Treatment Inputsand Outputs
Municipal SolidWaste
Magnetic and eddycurrent separation ofaluminium and steel
MBT
Biodegradablefraction for
stabilisation throughtreatment process(then to landfill or
one-off landscaping)
High Calorific Fraction(either with or without
densimetric separation,for RDF, incineration,
pyrolysis, gasification etc.� sometimes landfilled
Screening
Over-sizedfraction
Under-sizedfraction

Economic Analysis of Options for Managing Biodegradable Municipal Waste � Final Report
Eunomia Research & Consulting, Scuola Agraria del Parco di Monza, HDRA Consultants, ZREU and LDK ECOon behalf of ECOTEC Research & Consulting
23
Note:Red arrows represent residual materialsBlue Arrows represent �negative outputs� (environmental costs)Green Arrows represent �positive� output (environmental benefits)The permutations regarding the design of the plant are many and varied (seeZeschmar-Lahl et al 2000). In principle, however, all materials can be accepted atsuch plant, the intention often being, with some of them, to pre-treat / separate prior tolandfill / thermal treatment / recycling / recovering specific fractions. In Figure 7 above,it is assumed that the plant is designed to separate a biodegradable fraction fromresidual waste for biological treatment prior to landfilling, or perhaps, one-offlandscaping applications (�grey compost� or �stabilised biodegradable waste�). Apartfrom this, the plant may include equipment for metals recovery, extraction of mineralfractions, and for partitioning of high calorific fractions which could be sent for thermaltreatment (sometimes through manufacture of RDF). Inert fractions may be landfilled /recycled as appropriate.
22..55 CCoommppoossttiinngg
Composting is the biodegredation of organic matter through a self heating, solidphase, aerobic process. This converts organic matter into a stable humic substance.The microorganisms that carry out this process fall into three groups; bacteria, fungiand actinomycetes. While there are no strictly defined boundaries, the biologicalactivity can be seen in three stages:
• Stage one is the consumption of easily available sugars by bacteria whichcauses a rapid rise in temperature.
• Stage two involves the break-down of cellulose by bacteria and actinomycetes;and
• Stage three concerns the break-down of the tougher lignins by fungi as thecompost cools.
For this to take place efficiently, five key factors need to be considered; temperature,air supply, moisture content, the porosity of the material and its carbon to nitrogenratio.
Figure 9 below illustrates the emissions from the composting process. These include:
• emissions to air, including:o gaseous emissions such as carbon dioxide, by far the most prevalent
gas released in the process, ammonia, methane, and some VOCs(some of which may be derived from biofilters using woody materials);
o bioaerosols, usually most prevalent when materials are being turned;o odours (though these can be controlled in enclosed processes through
use of biofilters); and
Rejects to landfill
Economic Analysis of Options for Managing Biodegradable Municipal Waste � Final Report
Eunomia Research & Consulting, Scuola Agraria del Parco di Monza, HDRA Consultants, ZREU and LDK ECOon behalf of ECOTEC Research & Consulting
24
o dust
• emissions to land, related to reject fractions (which can be minimised throughsource separation). To the extent that these are not biodegradable, or havebeen stabilised, they are less likely to give rise to problematic emissions iflandfilled (where the process deals with source-separated waste); and
• in open processes, where no controls exist, leachate.
Probably the most problematic of these are issues associated with odour, andpotentially, though clear relationships are difficult to establish, bioaerosols.
European policy exhibits a trend towards the development of source separated wastecollection and composting and the promotion of home composting. Although thepopularity of mixed waste composting is declining, it is carried out in France, Greece,Spain, and Portugal, whilst in Italy, Germany, Austria, and other countries, it is beingprogressively or totally �converted� to MBT of residual waste. Several countries in theEU advocate the collection of source separated waste using a variety of collection andcomposting methods.
Economic Analysis of Options for Managing Biodegradable Municipal Waste � Final Report
Eunomia Research & Consulting, Scuola Agraria del Parco di Monza, HDRA Consultants, ZREU and LDK ECOon behalf of ECOTEC Research & Consulting
25
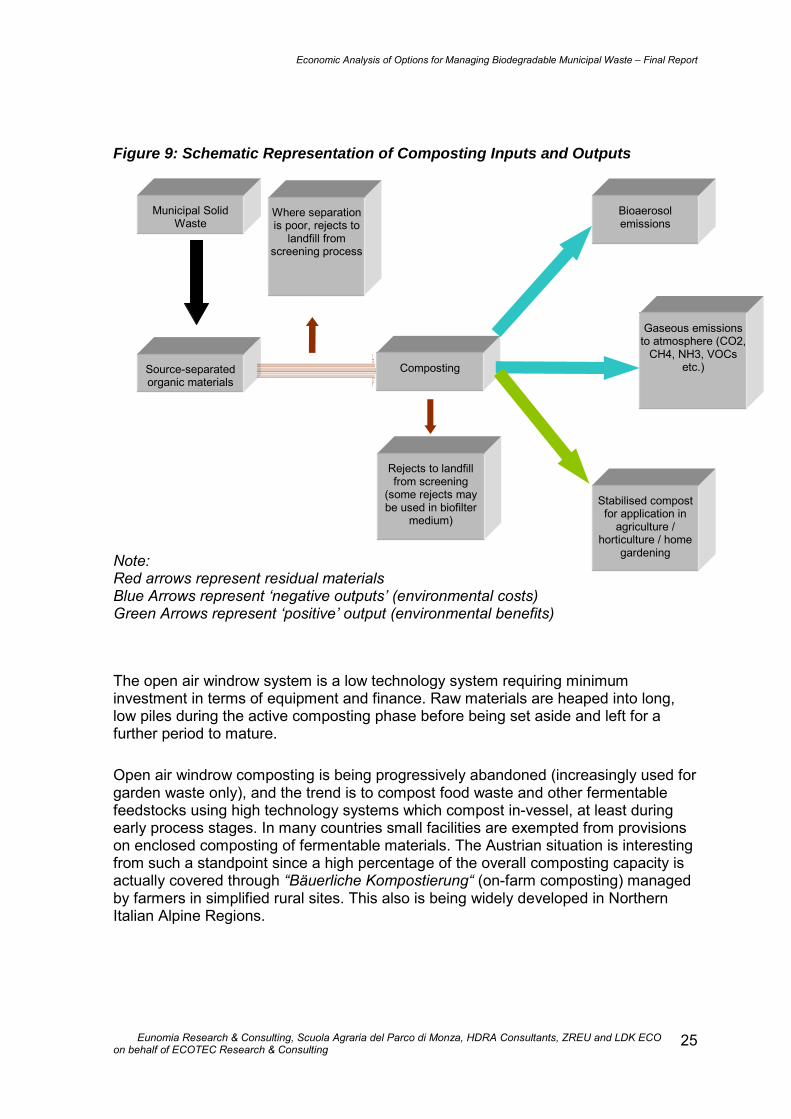
Figure 9: Schematic Representation of Composting Inputs and Outputs
Note:Red arrows represent residual materialsBlue Arrows represent �negative outputs� (environmental costs)Green Arrows represent �positive� output (environmental benefits)
The open air windrow system is a low technology system requiring minimuminvestment in terms of equipment and finance. Raw materials are heaped into long,low piles during the active composting phase before being set aside and left for afurther period to mature.
Open air windrow composting is being progressively abandoned (increasingly used forgarden waste only), and the trend is to compost food waste and other fermentablefeedstocks using high technology systems which compost in-vessel, at least duringearly process stages. In many countries small facilities are exempted from provisionson enclosed composting of fermentable materials. The Austrian situation is interestingfrom such a standpoint since a high percentage of the overall composting capacity isactually covered through �Bäuerliche Kompostierung� (on-farm composting) managedby farmers in simplified rural sites. This also is being widely developed in NorthernItalian Alpine Regions.
Source-separatedorganic materials
Composting
Rejects to landfillfrom screening
(some rejects maybe used in biofilter
medium)
Gaseous emissionsto atmosphere (CO2,
CH4, NH3, VOCsetc.)
Bioaerosolemissions
Stabilised compostfor application in
agriculture /horticulture / home
gardening
Municipal SolidWaste
Where separationis poor, rejects to
landfill fromscreening process

Economic Analysis of Options for Managing Biodegradable Municipal Waste � Final Report
Eunomia Research & Consulting, Scuola Agraria del Parco di Monza, HDRA Consultants, ZREU and LDK ECOon behalf of ECOTEC Research & Consulting
26
In addition to open air windrowing there are a wide range of technologies available forproducing compost. These include reactor systems, tunnels and static piles. The moreintensive technologies are used especially to compost so-called problem wastes suchas sewage sludge and food waste.4 Greater control can be maintained over theprocess so any pathogens present are more likely to be destroyed. The initialdegradative phase can also be completed in a shorter time than with windrowsystems, which is valuable if rapid processing of material is required.
All the systems require the material to be left for some time in piles for maturation, orcuring. The duration of this phase varies widely with technology and end-productrequirements, with potting applications requiring a very high maturation degree(usually achievable through a 90-120 days overall processing time).
22..55..11 TTeecchhnniiccaall PPrroobblleemmss // PPrriimmaarryy CCoonnssttrraaiinnttss
There are few major problems with composting processes as long as material is wellaerated so that the process does not become an anaerobic one as opposed to one ofaerobic composting. This is relatively straightforward to ensure. The degree to whichaeration and / or turning occurs also has implications for the requirements in terms ofstructural stability of the input material. Table 1 illustrates some of these basic points
Table 1. Categorisation of Composting Methods
Method Principles forfeeding andturning
Demands onstructure-stability of finalinput material
Type of Facility Odour ControlPossibilities (onscale of 1-4:1 = poor,4 = excellent)
Withoutforcedaeration
Batch-wise andStatic
Very highHigh
Mattress/bedWindrow
11
Batch-wise andstatic
HighHighHigh
Aerated-windrowSemi-permeable coverContainer/box/tunnel-static
234
With forcedaeration Continuously
and agitatedMediumMediumMediumMediumLow
Indoor-mattress/agitated-bedChannel/agitated-bayTunnel-agitatedTower multi-floorDrum
44444
Source: Adapted from Amlinger (2000)
There is increasing attention being paid to ensuring that processes achievesatisfactory levels of pathogen reduction, principally through ensuring the materialreaches specific temperatures for minimum periods of time. This also implies thedesirability of some form of monitoring.
4 The importance of dealing with sewage sludge has increased since the banning of disposal of sewage sludge tosea waters.

Economic Analysis of Options for Managing Biodegradable Municipal Waste � Final Report
Eunomia Research & Consulting, Scuola Agraria del Parco di Monza, HDRA Consultants, ZREU and LDK ECOon behalf of ECOTEC Research & Consulting
27
Other constraints may be linked to issues of siting compost facilities, which may beproblematic because of odour-related issues (see Table 1 above). Lastly, a constrainthas been, historically, the nature of the materials composted. Impurities in thefeedstock lead to poor quality products. Such products can undermine the markets forquality composts. In this context, standards act as a means of maintaining markets forquality composts and their absence makes it less likely that such markets can bereliably developed.
22..55..22 TTyyppee aanndd QQuuaalliittyy ooff WWaassttee AApppprroopprriiaattee ttoo tthhee OOppttiioonn
In the quest to produce quality composts, the process is largely confined to sourceseparated fractions of biodegradable fractions. However, it is important to appreciatethat, as far as municipal wastes are concerned, paper and card can also becomposted as can some textiles. All kitchen wastes and garden wastes can becomposted. To some extent, which wastes one chooses to collect for composting hasto be related to the location and type of plant to which the materials are to be sent.
22..55..33 CChhaarraacctteerriissttiiccss aanndd QQuuaalliittyy ooff EEnndd PPrroodduuccttss aanndd PPootteennttiiaall MMaarrkkeettss
The characteristics and quality of the end products are very much determined by:
• The nature of the feedstock (how pure);
• The nature of the feedstock (its composition); and
• The extent of product maturation.
These, as well as process control, will determine product quality. This in turndetermines the potential market for the product. Figure 10 shows typical prices andthe size of different market outlets for composts in the EU.
Products made from cleaner feedstocks and with longer maturation times are morelikely to reach quality markets (such as horticultural markets), but the nature offeedstock (for example, the relative mix of kitchen and garden waste) will alsodetermine the nature of the product. �Fresher� products (with shorter maturation times)are more likely to be appropriate for agricultural purposes.
Figure 10: Compost Marketing Hierarchy Indicating Market Prices and Volumes

Economic Analysis of Options for Managing Biodegradable Municipal Waste � Final Report
Eunomia Research & Consulting, Scuola Agraria del Parco di Monza, HDRA Consultants, ZREU and LDK ECOon behalf of ECOTEC Research & Consulting
28
High-qualitycompost
GreenhousesM EUR 20-40
Sports turfS EUR 15-40
LandscapingL EUR 10-20
Top soil mixM EUR 10-15
Nurseries S EUR 10-30
Pri. gardensL EUR 5-20
ReclamationS EUR 0-4
Wine and fruit M EUR 1-6
Organic farmsM EUR 2-6
AgricultureXXL EUR 0-3 Segment
Size m3 - value
Legend
High price
High volume
Note: The volume is indicated as the relative size (small (S) to extra-extra-large (XXL))of the market segment. Prices are known ranges for compost products within themarket segment (EUR/m3). M. Carlsbæk, SOLUM (personal communication), inAmlinger (2000)

Economic Analysis of Options for Managing Biodegradable Municipal Waste � Final Report
Eunomia Research & Consulting, Scuola Agraria del Parco di Monza, HDRA Consultants, ZREU and LDK ECOon behalf of ECOTEC Research & Consulting
29
22..66 AAnnaaeerroobbiicc DDiiggeessttiioonn
Anaerobic digestion (AD) is the bacterial decomposition of organic material in the(relative) absence of oxygen. The by-products of this process include biogas(comprising principally carbon dioxide and methane, which is capable of combustionto generate energy), as well as a semi-solid residue, referred to as a digestate. Withfurther treatment � normally through composting � the digestate from source-separated biowastes may be used for agricultural/horticultural purposes. Somecountries allow direct application of the digestate onto farmlands (e.g. Sweden,Denmark).
The high degree of flexibility associated with AD is claimed to be one of the mostimportant advantages of the method, since it can treat several types of waste, rangingfrom wet to dry and from clean organics to grey waste. The suitability of the methodfor very wet materials, for instance, has been addressed as an important feature inthose scenarios where source separated food waste cannot be mixed up with enoughquantities of bulking agents such as yard waste (namely, many metropolitan districts).AD of MSW has been commercially available for approximately 10 years and in thattime, the heterogeneous and variable nature of the feedstock has given rise to aconsiderable number of different processes in operation in many different countries.
This study is concerned primarily with the digestion of derivatives of municipal wastes(specifically source-separated biowaste because of the associated benefits examinedbelow). The inclusion of other feedstocks, such as sewage sludge, alters thequantitative aspects of digestate. However, it is important to note that the mixing ofhousehold waste with these feedstocks may improve both the environmental andeconomic aspects of the process and has been adopted in a number of plants(particularly, co-digestion with slurries and manure at small-scale farm based plants)and may be more adopted widely in the future. For example, the addition of sewage tothe organic fraction of MSW will increase the nutrient level as well as adding moisturecontent. The heavy metal concentration in sludge should be carefully addressed asthe tight limit values for quality composted products which exist in some countriesmight be difficult to meet where sludge is used.
In Germany, there is a situation in which residual waste, consisting mainly of foodresidues and non-recyclable paper, goes through a sieving process (a form ofmechanical biological treatment) and the undersize fraction is fed to the digester.Digestion of mixed or residual waste is adopted also in other Member States such asFrance, Italy, and increasingly in Spain. Hence, the term anaerobic digestion can beused to cover the range of processes covering those that occur in bioreactorcells/landfills to the digestion of source separated materials.
Anaerobic digestion generally involves three stages:
• pre treatment;
• anaerobic digestion; and

Economic Analysis of Options for Managing Biodegradable Municipal Waste � Final Report
Eunomia Research & Consulting, Scuola Agraria del Parco di Monza, HDRA Consultants, ZREU and LDK ECOon behalf of ECOTEC Research & Consulting
30
• post-treatment.

Economic Analysis of Options for Managing Biodegradable Municipal Waste � Final Report
Eunomia Research & Consulting, Scuola Agraria del Parco di Monza, HDRA Consultants, ZREU and LDK ECOon behalf of ECOTEC Research & Consulting
31
22..66..11 PPrree--ttrreeaattmmeenntt
In general, it is accepted, just as with composting, that source separated MSW makesmaterials handling much easier. Even source-separated MSW will, however, requirefurther separation to remove wrongly sorted materials such as plastics, metals andoversized components.5 Separation can be carried out under wet or dry conditions.Following this, a process of size reduction is used to create a more homogenousmaterial which will aid fermentation and facilitate processing. The size-reduction canuse screw-cutting, milling, drumming, pulping or shredding machines.
22..66..22 DDiiggeessttiioonn
Just as in the case of composting, there are a number of different techniques fallingunder the definition of anaerobic digestion (AD). They are usually distinguished on thebasis of operating temperature (thermophilic plants operate at around 55oC andmesophilic at around 35 oC) and the percentage of dry matter in the feedstock (drysystems with more than 20% dry matter, wet systems have less than 20% dry matter).
As regards the AD of MSW in-vessel, technologies include
• wet single-step, in which MSW is slurried with process water to provide adiluted feedstock for feeding in to a mix tank digester. the process can be usedfor MSW on its own, but the wet process lends itself to co-digestion with dilutedfeedstocks such as animal manure and organic industrial wastes;
• wet multi-step, in which MSW is again slurried and fermented by hydrolytic andfermentative bacteria to release volatile fatty acids which are then converted tobiogas in a high-rate industrial wastewater anaerobic digester. The systemlends itself to digestion of MSW and wet organic waste from food processors;
• dry continuous, in which a digestion vessel is continuously fed with a materialwith 20-40 percent dry matter through batch loading. In both mixed and plug-flow variants, the heat balance is favourable to thermophilic digestion;
• dry batch, in which a batch is inoculated with digestate from another reactorand left to digest naturally. Leachate is re-circulated to maintain moisturecontent and redistribute methane bacteria throughout the vessel;
• sequencing batch, essentially a variant of the dry batch process, in whichleachate is exchanged between established and new batches to facilitate startup, inoculation and removal of volatile materials from the active reactor. Afterdigestion becomes established, the digester is uncoupled from the establishedbatch and coupled to a new batch in another vessel.6
5 Note that this is a consequence of the technical features of the AD process which requires coarse inerts to beremoved. This is not always necessary at composting plants where separation achieves a purity in excess of 95% orso.
6 The concept of bioreactor landfills is not discussed here.

Economic Analysis of Options for Managing Biodegradable Municipal Waste � Final Report
Eunomia Research & Consulting, Scuola Agraria del Parco di Monza, HDRA Consultants, ZREU and LDK ECOon behalf of ECOTEC Research & Consulting
32
As will be clear from the aforementioned discussion, the picture regarding AD (andindeed composting too) as applied to MSW is complicated slightly by the fact thatthere may be advantages in some circumstances to treating MSW in conjunction withother wastes such as organic industrial wastes, food processing wastes andagricultural wastes. As such, there may be specific localities where co-digestion ismore feasible than in others.
22..66..33 PPoosstt--ttrreeaattmmeenntt PPrroocceesssseess
After digestion, if the feedstock is wet, the material may be spread directly to land(especially where co-digestion with other wastes has occurred). Usually, this requireslicensing as digestate is often considered as a �sludge�. Sometimes (e.g., in Denmark)it is considered as a product and can thus be applied onto farmlands with no licensingprocedure.
Alternatively, solid and liquid fractions can be separated in which case, after two tofour weeks� maturation (sometimes longer depending upon the application), a fullystabilised compost will have been developed. The liquid fraction may either berecycled for dilution of fresh waste, applied to land as a liquid fertiliser (again,frequently under licensing), or sent to a wastewater treatment plant (often followingsome separation of solids). The possibilities for spreading of liquid wastes on land arelikely to be regulated in different Member States.
22..66..44 TTeecchhnniiccaall PPrroobblleemmss // PPrriimmaarryy CCoonnssttrraaiinnttss
Whilst it is recognised that a there is a lot of potential in AD, at present a number ofbarriers exist to its widespread adoption. In spite of an increasing amount ofinformation being published on AD, it still remains relatively scarce. There is a needfor definitive information for the different processes, both regarding economics and theenvironment, as the available information gives conflicting messages regardingenvironmental impacts, commercial viability, etc. In addition, some of the informationis based on theoretical studies, or on commercial literature, highlighting the need forindependent data from monitoring real plants.
There are a number of areas of risk associated with AD at present:
• The main area of concern in AD is the guarantee of long term performance of aplant which is key to its economical feasibility. This risk can be reduced throughtechnological developments but the associated costs may affect the economicsin the short term. More plants being built in the future will enable learning tooccur and this may increase confidence;
• As use of the technology increases, there is a risk that plants will be competingfor the �best� feedstocks;
• Specific investment costs are generally much higher than with compostingitself. These could be partially offset by subsidies to the energy produced,though these should clearly be introduced with care and not with the explictobjective of �making AD commercially viable� in mind;
Economic Analysis of Options for Managing Biodegradable Municipal Waste � Final Report
Eunomia Research & Consulting, Scuola Agraria del Parco di Monza, HDRA Consultants, ZREU and LDK ECOon behalf of ECOTEC Research & Consulting
33
• A close integration between waste management and water management wouldbe helpful to further development. This would reduce the extra costs related todischarge of excess waters from AD to a waste-water treatment plant. Such acondition occurs only rarely across Europe, most often where water utilities areinvolved in the process;
• Finally, more plant failures would reinforce the technology's relatively poorreputation at present. This has been an issue recently in Denmark due to anumber of technical problems.
As mentioned above, the financial aspect is an important issue. Because thetreatment method is both relatively rare at present (it is only part of wastemanagement strategies in three countries, Germany, Austria, Belgium and Denmark,with some application on mixed or residual waste in France, Spain and Italy, though asmall-scale plant is in operation in the UK), there is still a good deal of uncertainty asto its viability. Poor performance in the past has not helped matters.
22..66..55 TTyyppee aanndd QQuuaalliittyy ooff WWaassttee AApppprroopprriiaattee ttoo tthhee OOppttiioonn
As mentioned above, stimulating markets for digestate is very important and requiresthe maximising of nutrient content and the minimising of the presence of toxic andunwanted materials (including heavy metals, pathogens and inert materials). Whilstthe process is an important aspect, the quality of the feedstock probably has thebiggest effect and so it is vital to maximise its quality. Both admissible waste typesand separation processes are important here.
There are a number of possible feedstocks which can be used in anaerobic digestion.These include the following: source separated food waste, sludge, agro-industrial by-products, manure, slurries, and yard waste. This study is concerned with MSW. Oneof the main limits on the AD process is its inability to degrade lignin (a majorcomponent of wood). This is in contrast with the process of aerobic biodegradation(i.e. composting). It is an important consideration when locating AD plants anddesigning collection methods.
Anaerobic digestion is better suited to waste with a higher moisture content thancomposting which requires �drier� wastes. The process of AD can occur between 60%and 99% moisture content (IEA Bioenergy 1997). Therefore kitchen waste and otherputrescible wastes, which by themselves may be too wet and lacking in structure foraerobic composting, provide an excellent feedstock for AD. Woody wastes contain ahigher proportion of lignocellulosic materials and may be better suited to aerobiccomposting. Liquids are often added to the AD processes (either water or recycledeffluent) to maintain a high moisture content.
Any non-biodegradable components of MSW which are fed into an anaerobic digester,will not be affected by the process and are simply taking up unnecessary space. Tomaximise the benefit (both environmental and economic) and minimise the cost it istherefore important to minimise their presence in the AD feedstock. Minimising thequantity of potentially toxic materials is also an important consideration for the qualityof the end-product. As with composting, the methods of MSW collection have abearing on both.
Economic Analysis of Options for Managing Biodegradable Municipal Waste � Final Report
Eunomia Research & Consulting, Scuola Agraria del Parco di Monza, HDRA Consultants, ZREU and LDK ECOon behalf of ECOTEC Research & Consulting
34
There are two main alternatives for waste separation, and the choice between themhas an important bearing on AD feedstock quality.
Source separation is actively encouraged in a number of member states. It includesthe separation of the putrescible organic fraction (biowaste). It is generally acceptedthat source separation provides the best quality feedstock for both AD and compostingwith both a maximum organic content and minimum contamination with heavy metals,glass and plastics. After digestion in a reliable process, this will result in the formationof a quality digestate and a high volume of biogas.
Centralised separation is the only route for obtaining a digestible fraction from residualwaste. The techniques involved include mechanical processing, optical processingand hand-picking. The digestible fraction obtained tends to be more contaminatedthan source separated biowaste with inevitable consequences for the digestate�sultimate utilisation.7 There is also the risk of larger non-separated components of thewaste causing physical damage to treatment plants further downstream (by abrasion,blockages or tangling).
22..66..66 CChhaarraacctteerriissttiiccss aanndd QQuuaalliittyy ooff EEnndd PPrroodduuccttss aanndd PPootteennttiiaall MMaarrkkeettss
Biogas
The production of biogas from controlled anaerobic digestion is one of the principaladvantages of the process. Stabilisation in the AD process is linked to methaneproduction, with a theoretical methane production of 0.348 m3/kg of Chemical OxygenDemand (at standard temperature and pressure) being achieved by completestabilisation (IWM 1998). In general, AD produces 100-200 m3/tonne of BMWprocessed and it has a typical composition of 55-70% methane, 30-45% carbondioxide and 200-4,000 ppm hydrogen sulphide.
Biogas generation is very sensitive to feedstock, one plant found volumes to rangefrom 80 to 120 m³ per tonne depending on waste input. There are also otherconstituents in smaller concentrations including carbon monoxide, hydrogen, nitrogenand oxygen. As mentioned above, a larger proportion of inorganics and pollutingsubstances in the process will lead to smaller amounts of a �dirtier� biogas.
The constituents of biogas (other than carbon dioxide and methane) can be quiteimportant in its end-use. They include:
Hydrogen sulphide is particularly important where the gas is to be used for heat andpower generation. Due to its corrosive qualities, care must be taken in the design ofplant and the choice of materials which will come into contact with the gas. Removalof hydrogen sulphide from the biogas can be achieved by using iron salts in scrubbing
7 There is some evidence that where pulping is used as a pre-process sorting phase, liquid separation can lead toremoval of some more hazardous elements.

Economic Analysis of Options for Managing Biodegradable Municipal Waste � Final Report
Eunomia Research & Consulting, Scuola Agraria del Parco di Monza, HDRA Consultants, ZREU and LDK ECOon behalf of ECOTEC Research & Consulting
35
the gas, or adding them to the digester. Hydrogen sulphide provides the largest risk topersonnel.
Hydrogen is a very important constituent in the process as it is used by methanogensto reduce carbon dioxide to methane gas.
Carbon monoxide is another important intermediate in the process and can be usedas an indicator of heavy metal and organic toxification.
Because biogas is used to generate energy (possibly in the form of electricity andheat), it is the emissions after combustion that are important in terms of measuring itsenvironmental impact. The biogas produced under optimum conditions has an energycontent of around 20-25 MJ/m3. Electrical conversion efficiencies will vary according tocombustion plant. Practical experience with small-scale combustion engines with arated capacity of less than 200 kW indicate an electrical conversion efficiency ofaround 25%, larger plants (up to 17,000 kW) can have a higher conversion efficiencyof around 36%. There is also the added possibility of heating water from the engine�sexhaust which can increase the overall conversion efficiency to 65-85% (IEABioenergy 1997).
Estimates concerning the utilisation of electricity by the plant vary a great deal. In ruralAD plants, approximately 20 % of the electricity produced in the process is requiredfor the plant operation while urban plants may utilise 2/3rds of the electricity produced.Biogas can also be both burned in boilers to produce hot water and steam forindustrial purposes, and used as an alternative fuel in light and heavy-duty vehicles.
Digestate
In order to extract the maximum recovery value from the organic waste input, thedigestate from AD should have a useful purpose and positive benefit should bederived from its production. In practice this varies from use as landfill cover material,through direct application of the digestate to land for agricultural benefit, to furthermaturation and refinement of the digestate to produce a quality soil conditioner. Thepost-digestion composting phase is (as mentioned above) likely to be important tomake the end product attractive to potential users in agriculture and elsewhere.
As well as the main product from the process, a solid digestate, small quantities ofsurplus liquor are also available which can be dewatered to provide liquid fertiliser. Asstated above, the feedstock and process quality will have a significant effect on thecharacteristics of the end-products. A high nutrient content is important for use as aquality soil conditioner or fertiliser, as is a low concentration of potentially toxicmaterials such as heavy metals, inert materials and pathogens. Even so, the use ofsuch materials may occur only under licence in some countries.
22..66..77 NNoorrtthheerrnn aanndd SSoouutthheerrnn EEuurrooppee
As mentioned above, AD development in Southern Europe is likely to take place laterthan in Northern Europe (this is already evident) although the extent of diffusion ineither case is difficult to gauge. Recent developments in source separation schemes
Economic Analysis of Options for Managing Biodegradable Municipal Waste � Final Report
Eunomia Research & Consulting, Scuola Agraria del Parco di Monza, HDRA Consultants, ZREU and LDK ECOon behalf of ECOTEC Research & Consulting
36
in Italy and Spain paint an optimistic picture regarding the future availability of qualityfeedstock. It is also worth mentioning that AD is experiencing the fastest growthacross Europe in Spain, thanks to public funding of facilities through EU fundingprograms, which reduce the overall management costs since depreciation is one ofmain cost items.
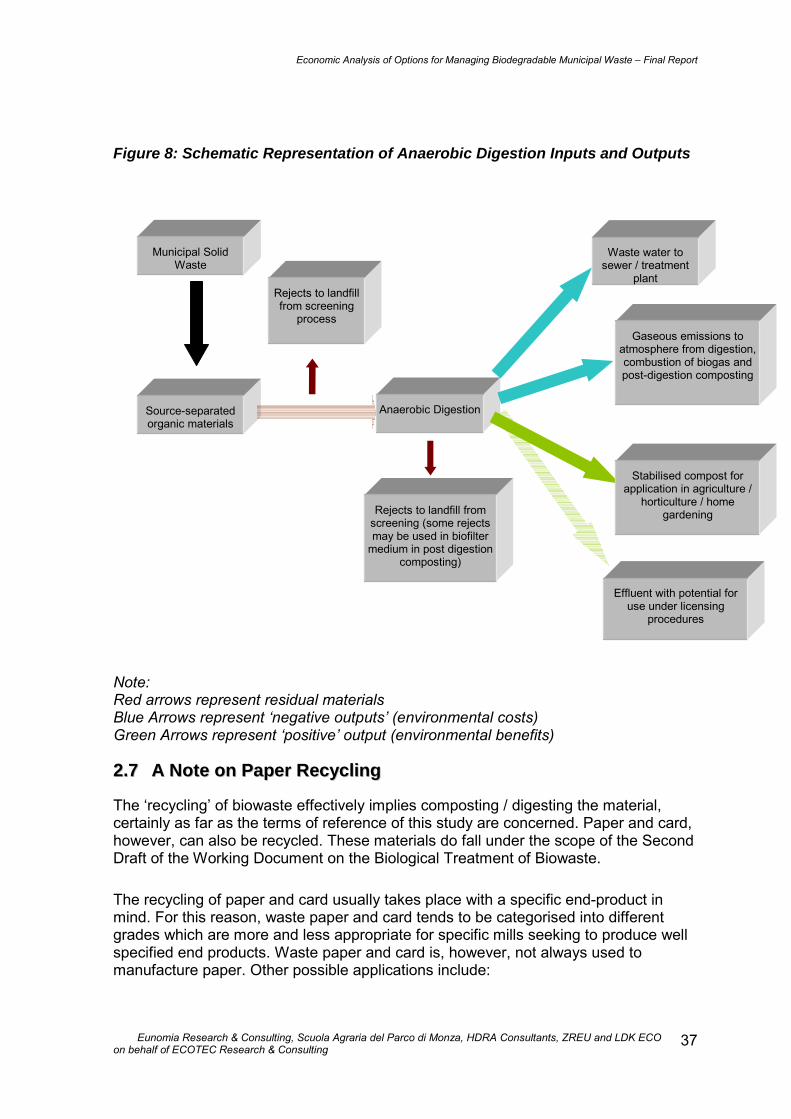
Economic Analysis of Options for Managing Biodegradable Municipal Waste � Final Report
Eunomia Research & Consulting, Scuola Agraria del Parco di Monza, HDRA Consultants, ZREU and LDK ECOon behalf of ECOTEC Research & Consulting
37
Figure 8: Schematic Representation of Anaerobic Digestion Inputs and Outputs
Note:Red arrows represent residual materialsBlue Arrows represent �negative outputs� (environmental costs)Green Arrows represent �positive� output (environmental benefits)
22..77 AA NNoottee oonn PPaappeerr RReeccyycclliinngg
The �recycling� of biowaste effectively implies composting / digesting the material,certainly as far as the terms of reference of this study are concerned. Paper and card,however, can also be recycled. These materials do fall under the scope of the SecondDraft of the Working Document on the Biological Treatment of Biowaste.
The recycling of paper and card usually takes place with a specific end-product inmind. For this reason, waste paper and card tends to be categorised into differentgrades which are more and less appropriate for specific mills seeking to produce wellspecified end products. Waste paper and card is, however, not always used tomanufacture paper. Other possible applications include:
Source-separatedorganic materials
Anaerobic Digestion
Rejects to landfill fromscreening (some rejectsmay be used in biofilter
medium in post digestioncomposting)
Gaseous emissions toatmosphere from digestion,combustion of biogas andpost-digestion composting
Waste water tosewer / treatment
plant
Stabilised compost forapplication in agriculture /
horticulture / homegardening
Municipal SolidWaste
Rejects to landfillfrom screening
process
Effluent with potential foruse under licensing
procedures

Economic Analysis of Options for Managing Biodegradable Municipal Waste � Final Report
Eunomia Research & Consulting, Scuola Agraria del Parco di Monza, HDRA Consultants, ZREU and LDK ECOon behalf of ECOTEC Research & Consulting
38
• road surfacing (using cellulose fibres to help retain the bitumen and bind thestone-to-stone matrix);
• loose-fill heat insulation materials;
• moulded packaging (e.g. fruit trays, egg boxes);
• board products (e.g. noise insulation);
• animal bedding;
• automotive brake linings;
• refractory cement binders;
• artificial snow; and
• feedstock for ethanol production.
Many of these applications, whilst being relatively low value ones, require less sortingof paper and hence a cheaper feedstock. Recycling of paper and card into new paperand card products benefits from source separation and the higher quality of materialsthis provides.
All of these processes make use of energy, and generate emissions of variouspollutants. Furthermore, they generate residues which, in the case of pulp, can beused in mills to generate energy. The question that is usually asked is whether thematerials are more or less polluting than those processes with which they compete, orwhich they displace / replace.
Recycling is generally regarded favourably in terms of the economic analyses carriedout thus far. However, this analysis has to be contextualised by consideration of thedifferent materials, for which the analysis is quite distinct. There is little debate,generally, that the recycling of glass, aluminium and steel (less work has been doneon textiles, which are often collected in recycling schemes) is positive, but the case forrecycling of plastics and paper has been disputed on grounds that it may be better tocombust these materials and generate energy from them rather than recycling them.In what follows, the emphasis is on the debate as it affects paper.
Regarding paper, the recycling of newsprint and magazines into secondary newsprinthas generally received a favourable review on environmental grounds fromresearchers. This is the message of a number of studies carried out in this regard.8 Areview by Ecologika (1998) of the arguments put forward by those who proposecombustion of waste paper portrays the argument not so much one of recyclingversus incineration, but one between recycling, ending with incineration after the fulleconomic life of the fibre, and �premature incineration� (i.e. incineration prior torecycling). This is because modern secondary newsprint plants can make use of oldfibre (which is too short to include in paper manufacturing) to generate their ownenergy.
8 This includes work carried out by Broome et al (2000), ECOTEC and CSERGE (1999), Coopers and Lybrand etal (1997), Brisson and Powell (1995), Powell et al (1995) and Powell et al (1996).

Economic Analysis of Options for Managing Biodegradable Municipal Waste � Final Report
Eunomia Research & Consulting, Scuola Agraria del Parco di Monza, HDRA Consultants, ZREU and LDK ECOon behalf of ECOTEC Research & Consulting
39
It is also true to say that (as will be made clear) the time dimension of what actuallyoccurs is critical in the overall environmental analysis, especially when considered ineconomic terms (because of the effects of discounting). To argue that carbon dioxidefrom incinerated paper can be absorbed by forests is to ignore the fact that trees taketime to grow and to sequester the carbon released in the combustion process.9 This isone reason why this study seeks to incorporate recognition of time as an importantelement in the economic analysis. Reporting all life cycle emissions as though theyoccurred simultaneously is misleading from the economic perspective. On the otherhand, life-cycle analyses can illustrate a broader range of emissions than cancurrently be dealt with through economic analysis.
A recent study of the Aylesford recycled newsprint mill by Ecobilan (1998) comparingthis with incineration of waste newsprint and magazines and the manufacture ofprimary newsprint (outside the UK) arrived at the following key conclusions:
• The Aylesford system required only 64% the primary energy used by the�incinerator system�;
• It generated 11% less carbon dioxide, was responsible for 44% lessacidification and used 12% fewer hydrocarbons;
• The total contribution to global warming was 17% less than for the incineratorsystem over 20 years and 15% less over 100 years;
• The Aylesford system performed better in respect of eutrophication;
• The Aylesford system used more natural gas than the incinerator system butthe total use of non-renewable resources was less;
• Regarding emissions to water, these had less nitrogenous matter andsuspended matter and lower chemical oxygen demand than the incineratorsystem, but produced more phosphates;
• It used less water than the incinerator system;
• Regarding transport, the recycling system used only 37% the oil consumed bythe incinerator system in transport phases. Virgin paper production (certainlyfor the UK market) relies on long distance transport. The recycling systememitted less than half the oxides of nitrogen than the incinerator system.
The study�s conclusions appear to support those reached in a number of others.Collectively, though space and resources preclude a more detailed discussion (andthere are complex issues involved in these debate), the evidence tends to support theCommission�s ordering of rank in terms of treatments of paper, at least as regards�recycling� versus �premature incineration�. It is not clear whether the production of, forexample, moulded paper pulp packaging (from the old, shortened fibres) might bemore beneficial than incineration. Nor does analysis undertaken thus far allow us topronounce upon the relative position of composting of paper or card with respect torecycling or �premature incineration�.
9 A USEPA report looked at the impact, on greenhouse gas emissions, of paper recycling. This work incorporated amodel of the US forest sector to understand the impact of recycling. This also concluded that the recycling of paperhad beneficial impacts in terms of greenhouse gas emissions (USEPA 1998). See also Smith et al (2001).
Economic Analysis of Options for Managing Biodegradable Municipal Waste � Final Report
Eunomia Research & Consulting, Scuola Agraria del Parco di Monza, HDRA Consultants, ZREU and LDK ECOon behalf of ECOTEC Research & Consulting
40
22..88 OOvveerrvviieeww
Table 2 gives an overview of the technologies discussed in the above Sections.

Economic Analysis of Options for Managing Biodegradable Municipal Waste � Final Report
Eunomia Research & Consulting, Scuola Agraria del Parco di Monza, HDRA Consultants, ZREU and LDK ECO on behalf of ECOTEC Research & Consulting 41
Table 2. Overview of Technologies for the Treatment of Biodegradable Municipal Waste
Overview oftechnologies forBiodegradable Waste
Biological MethodThermal Method
Mechanical BiologicalTreatment
Compost Anaerobic Digestion Incineration Pyrolysis Gasification
Waste acceptance Residual waste Principally, sourceseparatedbiodegradable wastesince matter andnutrients are to berecovered withminimalcontamination �composting ofresidual waste orseparated fractionsthereof increasinglyuncommon
Principally, sourceseparatedbiodegradable wastesince matter andnutrients are to berecovered with minimalcontamination �composting of residualwaste or separatedfractions thereofincreasinglyuncommon.
Residual waste Most suitable forwell defined drywaste fractions(from residualwaste)
Source separated drywaste only unlesscombined with bettercleaning technology
Acceptance of WetOrganic Fraction(kitchen wastes)
Technically, yes, but notapplied to source-separatedfractions
Yes, frequentlyconditional onpresence of somestructural material
Yes Technically, yes, butnot applied to source-separated fractions(especially given lowcalorific value)
Technicallypossible, but notlikely to be appliedto source-separated fractions
Technically possible, butnot likely to be applied tosource-separatedfractions
Acceptance of Gardenand Park Waste
Technically, yes, but notapplied to source-separatedfractions
Yes Not usually Technically, yes, butnot applied to source-separated fractions(especially given lowcalorific value)
Yes Possible
Acceptance of OrganicWaste from Hotels andRestaurants
Technically, yes, but notapplied to source-separatedfractions
Yes Yes Technically, yes, butnot applied to source-separated fractions(especially given lowcalorific value)
Yes Possible but normally no

Economic Analysis of Options for Managing Biodegradable Municipal Waste � Final Report
Eunomia Research & Consulting, Scuola Agraria del Parco di Monza, HDRA Consultants, ZREU and LDK ECO on behalf of ECOTEC Research & Consulting42
Overview oftechnologies forBiodegradable Waste
Biological MethodThermal Method
Mechanical BiologicalTreatment
Compost Anaerobic Digestion Incineration Pyrolysis Gasification
Acceptance of Paperand Board
Technically, yes, but notapplied to source-separatedfractions
Yes No Technically, yes, butnot usually applied tosource-separatedfractions which arereadily recyclable
Yes Possible
Excluded wastefractions
None Metal, plastic, glass,mixed municipalwaste as far aspossible
Metal, plastic, glass,animal wasteundesirable at plantswithout hygienisation,degradation of ligninrequires post-digestioncomposting
None Wet householdwaste
Wet household waste
Proven technology,track record
Yes; Very common Yes; Very common Yes; becomingcommon in someMember States
Yes; very common Relatively fewplants with longperiods ofcontinuousoperation
Relatively few plants withlong periods ofcontinuous operation
Basic principle Degradation by aerobic(and/or) anaerobic micro-organisms
Degradation byaerobic micro-organisms
Degradation byanaerobic micro-organisms
Combustion Anaerobic thermo-chemicalconversion
Thermo- chemicalconversion
Cost of treatment Costs of whole treatmentdepends upon destinationof separated / treatedfractions
Low to medium Medium to high Medium to very high Medium to high Medium to very high
Nutrient recovery Yes2.5 �10 kg N/ tonne ofbiowaste recovered0.5 �1 kg P / tonne ofbiowaste recovered1 � 2 kg K / tonne ofbiowaste recovered
Yes;2 �4 kg N / tonne1 � 2 kg P/ tonne1 � 2 kg K / tonne
Yes;4.0-4.5 kg N pr tonnes0.5-1 kg P pr tonnes2.5-3 kg K pr tonnes
No No No

Economic Analysis of Options for Managing Biodegradable Municipal Waste � Final Report
Eunomia Research & Consulting, Scuola Agraria del Parco di Monza, HDRA Consultants, ZREU and LDK ECO on behalf of ECOTEC Research & Consulting 43
Overview oftechnologies forBiodegradable Waste
Biological MethodThermal Method
Mechanical BiologicalTreatment
Compost Anaerobic Digestion Incineration Pyrolysis Gasification
Energy recovery Likely (e.g. through drysabilisation / separationprocesses to manufactureRDF)Depending uponconfiguration, RDF may be(typically) 0.2-0.5 tonneswith calorific value around15-20MJ/kg (sometimeshigher).In addition, in someconfigurations, digestionprocesses can recoverenergy from degradation ofbiodegradable fractions(can be >100kWhdepending on composition)
No Yes; 100-250 kWh (0.4-0.9 MJ) per tonne ofwaste electricityIn addition, CHP plantsmay generate a similarquantity of heat
Yes;Approx: 500kWh(2MJ) per tonnewaste if electricityonlyCHP plants maygenerate lowerelectrical output buttotal energyrecovered increasesapprox threefold(approx. 6-7MJ/tonne)
Yes;0.7-1 MJ / tonneAlso, energycontaining product(char)
Yes;Approx. 2MJ per tonnewaste
Total solid residuals,depending on waste(tonnes/tonnes waste)
0.7-0.91 0.4 � 0.6 0.3 � 0.6 0.17 - 0.3 0.2 - 0.4 0.17 - 0.3
Quality products forrecycling(recovery, tonnes/tonnewaste)
Metals (0.05) 1 Compost (0.5) Fibres (0.3) - Char (0.2-0.4) 0.17 - 0.28
Other residuals possiblefor reuse withrestrictions (tonnes/tonne waste)
RDF (0.3-0.4) 1
Stabilised organic fraction(0.07-0.2) 1
- Fluids (0.6) Metals (0.05)Bottom Ash (0.15 �0.22)
Grit, Glass, Slag,Metals andChemical bulk)
Clinker, Grit, Glass, Slag,Metals and Chemical bulk
Residuals for land fillingor other waste treatment
heavy and light rejects (0.2-0.4) 1
Overflow sieving(0.02 � 0.1)
Overflow sieving(0.02 �0.1)
Fly ash etc.(0.02 � 0.04)
(Char)(0.02-0.3)
Ash(0.03)
Source: Adapted from European Environment Agency (2001)
1 These figures depend upon detailed system configuration
Economic Analysis of Options for Managing Biodegradable Municipal Waste � Final Report
Eunomia Research & Consulting, Scuola Agraria del Parco di Monza, HDRA Consultants, ZREU and LDK ECOon behalf of ECOTEC Research & Consulting
44
33..00 CCUURRRREENNTT SSIITTUUAATTIIOONN RREEGGAARRDDIINNGG MMUUNNIICCIIPPAALLWWAASSTTEE -- AARRIISSIINNGGSS,, CCOOMMPPOOSSIITTIIOONN AANNDDTTRREEAATTMMEENNTTSS
This Chapter considers the way in which municipal waste is currently treated inMember States. This question has to be considered in the light of appreciation of thevariation in understanding, across Member States, as to what constitutes �municipalwaste�. Two approaches were used to try to derive an accurate picture of the way inwhich municipal waste, and more specifically, biodegradable municipal waste iscurrently treated:
1. A review of published data; and
2. A survey of data available at the Member State level.
The latter is outlined briefly below.
33..11 SSuurrvveeyy aanndd AApppprraaiissaall ooff MMeemmbbeerr SSttaattee DDaattaa
In this study, each of the team members was designated responsibility for gatheringdata covering a sub-set of the countries being studied. The assignment of countrieswas based, as far as possible, upon existing experience of the team partners.
For each country, the aim was to elicit data and information regarding:
• Definitions of municipal waste;
• the composition of municipal waste � the information sources were the sameas those above;
• the way in which municipal waste is currently treated in the country concerned
• the way in which municipal waste is likely to be treated in future (throughreference to, e.g., plans for meeting the requirements of the Landfill Directive,or other strategies);
• the status of source separation of biodegradable municipal wastes; and
• the relative roles of composting and anaerobic digestion in treating source-separated fractions.
This survey work included seeking information from Member State Ministries, seekingpublications concerning the waste situation in that country, and trying to projectforward on the basis of existing and planed legislation, as well as published strategies.During this project, representatives of Member States and Accession States were

Economic Analysis of Options for Managing Biodegradable Municipal Waste � Final Report
Eunomia Research & Consulting, Scuola Agraria del Parco di Monza, HDRA Consultants, ZREU and LDK ECOon behalf of ECOTEC Research & Consulting
45
encouraged to comment on the data derived following a meeting held by theEuropean Commission in Brussels. Furthermore, the work has benefited from beingable to use information emerging from a study on waste management policies inCentral and Eastern European countries, an edited version of which has recently beenpublished (Speck and Markovic 2001).

Economic Analysis of Options for Managing Biodegradable Municipal Waste � Final Report
Eunomia Research & Consulting, Scuola Agraria del Parco di Monza, HDRA Consultants, ZREU and LDK ECOon behalf of ECOTEC Research & Consulting
46
33..22 MMeemmbbeerr SSttaattee DDeeffiinniittiioonnss ooff ‘‘MMuunniicciippaall WWaassttee’’
The definition of municipal waste exhibits some variation across countries. However,for most countries, where there is a formal definition, municipal waste includeshousehold waste (of all different types, including bulky materials) as well ascommercial waste collected by the local authorities / municipalities concerned, andwastes generated from maintenance of parks, and street cleaning activities.
It is interesting that the definition of municipal waste does not exist as such in manycountries, even though this is the fraction to which key EU legislation applies. It raisesinteresting questions (given the variation in definition) as to what the Landfill Directive,and any subsequent legislation, should be applied to. The reference data in theLandfill Directive is �harmonised� Eurostat data from 1995, yet by common consent,there is no harmonised definition of �municipal waste�. This raises interestingquestions as to how the targets under the Landfill Directive are to be enforced,especially if the term is simply applied to �all waste collected by municipalities�. Thiscould lead to a situation in which, in an aim to comply with legislation, theresponsibilities of municipalities are altered either through legislation, or implicitly,through discouraging collection of certain fractions (perhaps leaving them to becollected by private sector operators).
A clearer definition of municipal waste is required for use in legislation. The definitionshould ensure that the wastes being referred to are not subject to changes throughwhat are essentially changes in administrative responsibilities of municipalities.
33..33 QQuuaannttiittiieess ooff MMuunniicciippaall WWaassttee AArriissiinnggss
Municipal waste arisings from Member States ought to be relatively well known.Member States are required to generate such information as a requirement of theWaste Framework Directive. In addition, planning for waste, and tracing theeffectiveness of certain interventions, is impossible without adequate data.
There are issues, however, concerning data accuracy and comparability which makeeasy comparisons close to impossible. With regard to accuracy, the key point is,obviously, that weights of waste should be assessed before treatment. Certainly, it isnot the case in all countries that waste is accurately weighed prior to treatment. Inaddition to the Waste Framework Directive, economic instruments and legislation suchas the Packaging Directive will have focused more attention on the quality of data, andthe Landfill Directive should also concentrate greater attention on municipal wastedata (since without such data, progress towards Article 5 targets cannot be judged).
The treatment of home composting deserves mention. This is clearly of relevance tothis study, yet estimates of the extent of active engagement in home composting, letalone, the weight of material diverted through this option, are generally not veryreliable. Whether this should be included in the definition of �waste� at all isquestionable (it is usually regarded as waste minimisation as the material is not being�discarded�) but it is important to understand the extent to which this activity is being

Economic Analysis of Options for Managing Biodegradable Municipal Waste � Final Report
Eunomia Research & Consulting, Scuola Agraria del Parco di Monza, HDRA Consultants, ZREU and LDK ECOon behalf of ECOTEC Research & Consulting
47
used to treat material which might otherwise be collected as part of the municipalwaste stream.10 Some municipalities in Germany and Austria may be treating 60% ormore of their biowastes through home or community based composting. In suchcircumstances, to omit measurement of this fraction would be to give a falseimpression of the composition and quantity of material which has the potential to enterthe municipal waste stream.
Eurostat has undertaken work in this area, whilst the OECD also collects data (seeTable 3 below). The European Environment Agency, and the European Topic Centrefor Waste in particular, have been keen to point out limitations in data comparability(because of the absence of common protocols and definitions). Countries such asDenmark and the Netherlands are reported to have household waste generationfigures of about 500 kg/capita/annum. This is twice that reported for Iceland andFinland and 50% higher than that reported for Austria and Norway. Similarly, widevariations can be found for municipal waste.
The European Topic Centre lists the following possible explanations for variations:
• different definitions of waste and differences in systems used for waste datacollection;
• differences in waste policy;
• differences in economic structure and lifestyle; and
• real differences in waste quantities produced.
The last of these is not so much an explanation as an observation. Other factors thatwill affect results are the level of home composting (since this is usually excluded fromstatistics) and the way in which waste is collected (larger containers may lead to morewaste being collected, and garden waste collections may lead to material entering thewaste stream that might otherwise have been home composted (or burned). Formunicipal waste, the extent of trade (i.e. commercial, industrial and construction anddemolition wastes) is obviously a crucial factor. Lastly, it is somewhat odd thathousehold numbers have not been given more serious consideration (as opposed topopulation numbers). To the extent that waste is produced by household units, thefragmentation of families, and the increasing �individualisation� of society (which as asocial phenomenon, affects different European countries to varying degrees), hasbeen left under-explored.
10 Where municipalities have introduced kerbside collections for green waste, this has usually led to majorincreases in waste collected. It is not always easy to trace whether this is due to a reduction in waste delivered tocivic amenity / bulky waste collection sites, or whether this reflects the collection of materials which wouldotherwise have been composted at home.

Economic Analysis of Options for Managing Biodegradable Municipal Waste � Final Report
Eunomia Research & Consulting, Scuola Agraria del Parco di Monza, HDRA Consultants, ZREU and LDK ECOon behalf of ECOTEC Research & Consulting
48
Table 3. Generation of Household and Municipal Waste in EEA MemberCountries (kg per capita).
Country Household waste Municipal wasteAustria 344 654Belgium Brussels 366 655Belgium Flanders 479 492Belgium Walloon 1995 367 460Denmark 496 540Finland 1994 171 413France 1995 435 597Germany 1993 . 536Greece . 344Iceland 242 558Ireland 368 .Italy . 455Luxembourg . 461The Netherlands 482 562Norway 293 630Portugal 1995 . 353Spain . 390Sweden 1994 . 364United Kingdom 442 476
Source: Eurostat 1999 (data for 1996 or latest year available according to OECD and Eurostat surveys).
33..44 CCoommppoossiittiioonn
Understanding the composition of waste is not straightforward. Waste compositionvaries not only across countries, but also by region according to:
• Socioeconomic status;
• Consumption habits;
• Season;
• Whether or not households have gardens;
• Presence (or otherwise) of tourists,
and many other factors besides. Furthermore, the reported statistics will be dependentupon methodologies used. Where fractions are co-mingled, and wet weights arereported, then transfer of moisture from one fraction to another is likely to occur(increasing the apparent quantity of paper and reducing the biowaste fraction). If the
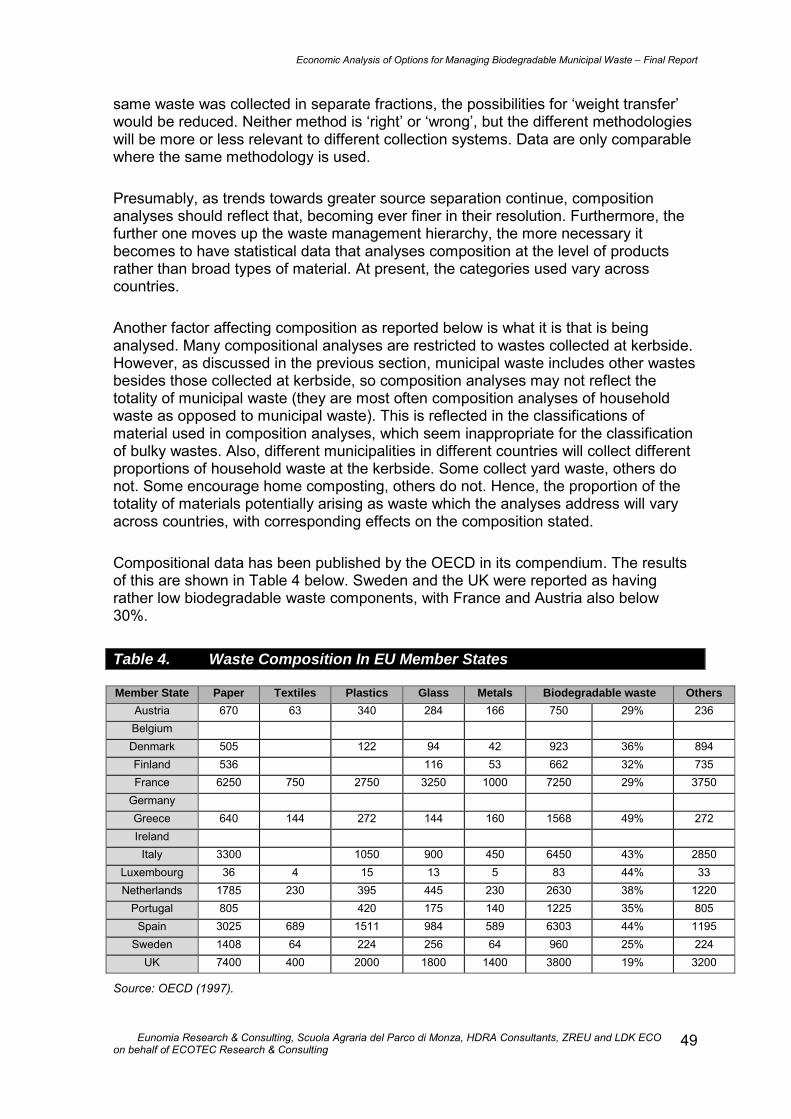
Economic Analysis of Options for Managing Biodegradable Municipal Waste � Final Report
Eunomia Research & Consulting, Scuola Agraria del Parco di Monza, HDRA Consultants, ZREU and LDK ECOon behalf of ECOTEC Research & Consulting
49
same waste was collected in separate fractions, the possibilities for �weight transfer�would be reduced. Neither method is �right� or �wrong�, but the different methodologieswill be more or less relevant to different collection systems. Data are only comparablewhere the same methodology is used.
Presumably, as trends towards greater source separation continue, compositionanalyses should reflect that, becoming ever finer in their resolution. Furthermore, thefurther one moves up the waste management hierarchy, the more necessary itbecomes to have statistical data that analyses composition at the level of productsrather than broad types of material. At present, the categories used vary acrosscountries.
Another factor affecting composition as reported below is what it is that is beinganalysed. Many compositional analyses are restricted to wastes collected at kerbside.However, as discussed in the previous section, municipal waste includes other wastesbesides those collected at kerbside, so composition analyses may not reflect thetotality of municipal waste (they are most often composition analyses of householdwaste as opposed to municipal waste). This is reflected in the classifications ofmaterial used in composition analyses, which seem inappropriate for the classificationof bulky wastes. Also, different municipalities in different countries will collect differentproportions of household waste at the kerbside. Some collect yard waste, others donot. Some encourage home composting, others do not. Hence, the proportion of thetotality of materials potentially arising as waste which the analyses address will varyacross countries, with corresponding effects on the composition stated.
Compositional data has been published by the OECD in its compendium. The resultsof this are shown in Table 4 below. Sweden and the UK were reported as havingrather low biodegradable waste components, with France and Austria also below30%.
Table 4. Waste Composition In EU Member States
Member State Paper Textiles Plastics Glass Metals Biodegradable waste OthersAustria 670 63 340 284 166 750 29% 236BelgiumDenmark 505 122 94 42 923 36% 894Finland 536 116 53 662 32% 735France 6250 750 2750 3250 1000 7250 29% 3750
GermanyGreece 640 144 272 144 160 1568 49% 272Ireland
Italy 3300 1050 900 450 6450 43% 2850Luxembourg 36 4 15 13 5 83 44% 33Netherlands 1785 230 395 445 230 2630 38% 1220
Portugal 805 420 175 140 1225 35% 805Spain 3025 689 1511 984 589 6303 44% 1195
Sweden 1408 64 224 256 64 960 25% 224UK 7400 400 2000 1800 1400 3800 19% 3200
Source: OECD (1997).

Economic Analysis of Options for Managing Biodegradable Municipal Waste � Final Report
Eunomia Research & Consulting, Scuola Agraria del Parco di Monza, HDRA Consultants, ZREU and LDK ECOon behalf of ECOTEC Research & Consulting
50
The reviews of Barth (2000) and Amlinger (2000) of biodegradable fractions ofmunicipal waste again shows the UK, France, Ireland and Austria to be the onlycountries with biodegradable components less than 30% (see Table 5). Barth (2000)suggests an EU average figure of 32%. This is important since it suggests that of allfractions of the waste stream, this is usually the largest one (so that treatmentseparate collection potentially removes large quantities of material from othertreatment options).
Table 5. Size Of Organic Fraction In European Municipal Solid Waste MSW
Country Organic part in MSW (Barth) Organic part in MSW (Amlinger)Austria 29 % (1991) 29% hhld (1995)
17% MSW (1998)Belgium 48 % Flanders (1996),
45 % Wallonia (1991)Flanders: 48% (1996)Wallonia: 45% (1991
Denmark 37 % (1994) 37% (1994)Finland 35 % (1998) 35% (1993)France 29 % (1993) 29%Germany 32 % (1992) 32%Greece 49 % (1987 � 1993) 49%Ireland 29 % (1995) 29%Italy 32 � 35 % (1999) 33%Luxembourg 44 % (1994) 44%Netherlands 46 % (1995) 38%Portugal 35 % (1996) 44%Spain 44 % (1996) 44%Sweden 40 % (1996) 25%UK 22 % (1997) 21%EU average 32 %
Sources: Barth (2000) Amlinger (2000).
Investigations for this study have produced the figures presented in Table 6 below.These would need further investigation to check their accuracy (and theirconsistency). However, some comments and notes on the specific country data follow:
• It is clear that for most of the countries, the biowaste component constitutesbetween 35-45% of municipal waste. The exceptions appear to be Germany,Austria, Belgium (which is Flanders data) the UK and Ireland.
• However, the German and Austrian data do not include the relatively largequantities of waste believed to be composted at home in these countries. Forboth countries, home composting is believed to account for 10-12% ofmaterials that would otherwise have to be collected (separately or otherwise).Hence, the composition of MSW that is biowaste in these countries might beexpected to be lower than in other countries as the material is being �diverted�from collection. Home composting is also widely practised in Flanders;

Economic Analysis of Options for Managing Biodegradable Municipal Waste � Final Report
Eunomia Research & Consulting, Scuola Agraria del Parco di Monza, HDRA Consultants, ZREU and LDK ECOon behalf of ECOTEC Research & Consulting
51
• Flanders data includes only the source separated fraction. As such, assumingtwo-thirds of the waste is captured, the total biowaste fraction could beexpected to be probably 50% greater (or of the order 33%);
• UK waste composition data have been analysed in more detail elsewhere(ECOTEC 2000; House of Commons 2001). The official statistics are notreliable. They are based on old data capturing bin wastes only (approximatelytwo-thirds of total MSW) using a methodology that has been subject to somecriticism. Several localised compositional studies carried out in the UK showthe biowaste fraction to be in the range 35-45%, in line with the rest of Europe.For example, 18 compositional studies carried out in London in 1998 gave anaverage figure of 38%, with London tower blocks yielding biowaste fractions inexcess of 30% (Ecologika 1998). The basis for the Irish compositional datawas not established. However, for the UK, it is proposed that the London datais used in this study in the absence of more robust data from official sources; 11
• There is a suggestion that the figure for Ireland is as low as it s due to the factthat approximately one-third of the material to which the data refers is ofcommercial origin. This is reported in Ireland as having a 58.6% paper content.As such, the paper fraction is relatively high, and the biowaste fractions aresmall (the organics fraction in commercial waste is estimated at 15.1% asopposed to 32.9% in the household fraction);12 and
• Particularly high figures for the paper and board fraction come from Ireland, theUnited Kingdom and Finland. The UK and Irish figures were discussed brieflyabove. One can speculate that in the UK, the explanation may simply arisefrom the fact that mixing of the waste leads to transfer of moisture from thebiowaste fraction to the paper fraction. Arguably, this is not important wheresource-separation schemes are not in operation. The UK still operates with lowlevels of source separation, especially for biowaste fractions, and this mayexplain the lack of attention given to these issues in the past. Why the paperfraction should be so high in Finland is not known, though clearly Finland is amajor producer of paper and paper products.
For comparison, Table 7 shows data recently gathered by the European Topic Centrefor Waste. The Table shows the tonnages of biodegradable municipal waste as well
11 The Environment Agency for England and Wales is to carry out a major research project into waste compositionin the near future.
12 The transparency of the Irish data leads one to speculate as to whether, given the fact that most municipalities arecollecting trade waste, the compositional data are not generally lacking in their accounting for this fraction ofmunicipal waste, which may be considerable as in Ireland.

Economic Analysis of Options for Managing Biodegradable Municipal Waste � Final Report
Eunomia Research & Consulting, Scuola Agraria del Parco di Monza, HDRA Consultants, ZREU and LDK ECOon behalf of ECOTEC Research & Consulting
52
as the fraction of municipal waste that is biodegradable. As in the data obtained forthis study, the biodegradable fraction of MSW in Finland is very high reflecting thelarge paper fraction. The French figure is low because the data has been calculatedusing the figure for all municipal waste (excluding sewage sludge), whilst only baggedwaste is effectively included in the biodegradable fraction. Were cleaning residues andtrade wastes to be taken from the municipal waste figure, the biodegradable fractionwould fall into line with that of most other countries.

Economic Analysis of Options for Managing Biodegradable Municipal Waste � Final Report
Eunomia Research & Consulting, Scuola Agraria del Parco di Monza, HDRA Consultants, ZREU and LDK ECO on behalf of ECOTEC Research & Consulting 53
Table 6. Quantity And Composition Of Municipal Waste In Member States And Applicant Countries (composition in %MSW)
AU BE DK FIN FRA GER GRE IRL ITA LUX NL POR SPA SWE UK CZ CYP EST HUN POL SLOYEAR(quantities)
1998 1997 1998 1997 1998 1998 1997 1998 1998 1997 1998 1999 1997 1998 1998/99
1998 1993 1996 1998 1996 1995
Total MSW(million tonnes)
4.85 4.69 2.93 2.51 44.4(38)
49.1 3.9 2.06 26.9 0.30 8.22 3.8 17.2 3.81 31.5 3.24 0.37 0.56 4.3 11.8 1.02
Total (OECD)(1997 data, orlatest year)
4.1 4.85 2.95 2.1 28.8 40.0 3.9 2.03 26.6 0.19 8.72 3.8 15.3 3.2 28.0 3.2(2.6)
5.0 12.2
Kitchen andYard Waste
29.2 34.9 37 40 29 29.9 47 27 33.6 43.8 42.0 37 44.1 40 38.1 - 35 53.0 37.5 31.7 32.3
Yard Waste 13.4 5.0 11Kitchen Waste 21.6 28.5 24Paper and card 24 18.9 36.8 16 20 32.5 22.8 19.2 34.4 26 22.2 37 26.1 - 25 8.1 16.8 18.6 14.9Paper 17Cardboard 8Timber 1.4 1.9 I 1 1.3 -Textiles 2.8 2.6 0.8 2 2.1 5.1 2.3 2.0 3 4.8 1 3.3 - 3.9Nappies 2.8 2.0 4.0 -Plastics 8.2 6.8 4.5 5.4 4.5 11.4 10.3 7.9 5.8 10 10.6 7 8.3 - 13 3.0 5.2 3.7 9.7Glass 9.4 5.1 2.3 9.2 4.5 4.8 7.2 6.7 10.0 6 6.9 2.6 8.7 - 3 7.4 3.8 7.5 5.3Metals 7.2 3.7 3.2 3.2 4.5 2.6 3.0 2.7 2.6 2 4.1 3.5 3.4 - 4 4.3 3.6 3.5 6.6Ferrous metals 1.7 2.1 3.4 2.9Non-ferrousmetals
0.9 0.5 0.7 0.5
Other 17.8 26.0 12.4 37.3 31.5 15.5 19.2 15.9 12.9 4.2 16 6.6 6.6 12.1 - 20 24.2 29.2 36 31.4YEAR(Composition)
1998 Early90s
1993 1997 1998 1998 1994 1996 1997 Early�90s
1993 1996 1998 1995

Economic Analysis of Options for Managing Biodegradable Municipal Waste � Final Report
Eunomia Research & Consulting, Scuola Agraria del Parco di Monza, HDRA Consultants, ZREU and LDK ECO on behalf of ECOTEC Research & Consulting54
Notes and Data Sources:Austria: Umweltbundesamt, Klagenfurt 1998. Compositional data applies to household waste, estimated at 2.8 million ones in 1996. The data excludes material which is home
composted, estimated at around 0.3 million tonnes.Belgium Personal communication with OVAM staff. Compositional data is from Flanders only (which produces the majority of Belgium�s waste)Denmark Waste Statistics 1997, Environmental Review from the Danish Environmental Protection Agency, No. xx. In addition to this household waste, some 0.86 million tonnes of
waste from institutions / offices were collected. Danish EPA comment � no figures describing the total composition of MSW. They are planning a project to describe thetotal composition of MSW and to evaluate the present home composting solutions that some regions have chosen in order to reduce the amount of waste produced. Theestimated fraction of kitchen and yard waste comes from Amlinger (2000).
Finland The National Waste Plan Until 2005, Finnish Ministry of the Environment, 1999; Data from the Finnish Environment Institute. Composition data is from the early 1990s.France Data from ADEME. The French definition of municipal waste includes wastes from waste water treatment and sewage sludge. These account for an estimated 9.5 million
tonnes in 1995. Hence, MSW was estimated at 38 million tonnes in 1995 (Amlinger (2000)). The 29% figure for Kitchen and Yard waste applies to 21 million tonnes ofhousehold waste.
Germany Prognos, 1999. Compositional data excludes home composted materials, estimated at 4.5 million tonnes.Greece From the National Plan for SWM (data covering 30% of the country�s population)Ireland National Waste Database 1998. Composition data refers to collected waste only (i.e. 1.85 million tonnes of the 2.06 million tonnes arising).Italy ANPA estimates for 1998; Federambiente survey (2000)Luxembourg Hofmann, F-J. (1996) Hausabfallanalyse 1992-1994im Grosherzogtum Luxemburg, in proceedings of Luxembourgeois Symposium sur le Gestion de Dechets,
Luxembourg 1996. Composition refers to household waste only (circa 0.141 million tonnes)Netherlands Ministry of Housing, Spatial Planning and the Environment, household waste only. Composition data are derived from author�s calculation from composition of residual, and
capture rates of separately collected materials.Portugal Compositional data are from LIPOR for Lisbon.Spain Medio Ambiente en España 1998Sweden The two sets of compositional data are, firstly, from RVF in 1998 (samples of household waste excluding bulky materials) and, secondly, from RVF (1993) for MSW.UK Data from DETR (2000) Municipal Waste Surveys, SEPA (1999) Waste Strategy for Scotland, and Northern Ireland Heritage Service. Compositional data are based on
Ecologika (1998)Czech Rep. Czech Ministry of the EnvironmentCyprus World Bank: Republic of Cyprus. Environmental Review and Action Plan, 1993; Evaluation report of present Waste Management situation in Cyprus, 1993, prepared by
Carl Bro Environment a/s and NV ConsultantsEstonia EST-101:Final Report Estonia composition is waste landfilled onlyHungary Hungarian Ministry of EnvironmentPoland Polish Ministry for EnvironmentSlovenia Statistical Office of the Republic of SloveniaWe are also grateful for having had access to information emerging from an ongoing project funded by the Regional Environment Centre in Szentendre concerning waste management
policies in Central and Eastern Europe.

Economic Analysis of Options for Managing Biodegradable Municipal Waste � Final Report
Eunomia Research & Consulting, Scuola Agraria del Parco di Monza, HDRA Consultants, ZREU and LDK ECO onbehalf of ECOTEC Research & Consulting
55
In Germany, the low figure for the biodegradable fraction emerges because thebiodegradable fraction of municipal waste estimated here refers to the biodegradablefraction of household waste only. The figures would seem to indicate that a very largefraction of municipal waste in Germany arises from non-household sources. The lowItalian figure is something of an anomaly since this was estimated on the assumption thatonly 35% of bagged municipal waste (i.e. residual waste) was biodegradable. In fact, thekitchen and yard waste fraction alone probably accounts for 35%, but the totalbiodegradable fraction (including paper, wood, biodegradable textiles etc.) most likelylies between 60-65% of the bagged waste (given that a relatively small, thoughincreasing, fraction is separated at source). Note, lastly, that the figure used for municipalwaste in Austria appears to be the household fraction only, whilst that for the UnitedKingdom is apparently for England and Wales only.
Table 7. Baseline Data For Landfill Directive
Country Year MSW BiodegradableMSW
LandfilledBiodegradable MSW
BiodegradableFraction of MSW
Austria 1995 2644 1495 302 57%Belgium(Flanders)
1995 2890 1671 623 58%
Denmark 1995 2787 1813 205 65%
Finland 1994 2100 1664 928 79%France 1995 36200 15746 5988 43%Germany 1993 43486 12000 N/A 28%Greece 1997 3900 2613 N/A 67%Ireland 1995 1503 990 903 66%Italy 1996 25960 9170 6821 35%
Luxembourg 1995 N/A N/A N/A No dataNorway 1995 2722 1572 1069 58%Portugal 1995 3340 N/A N/A No dataSpain 1996 17175 12196 N/A 71%Sweden 1998 4000 N/A N/A No dataThe Netherlands 1995 7105 4830 1365 68%
U.Kingdom 1996/97 25980 16366 14675 63%
Source: European Topic Centre for Waste (2001)
On the basis of this examination of the data, investigations for this piece of work appearto have generated a consistent dataset. Some reservations remain concerning theGerman, Austrian and French datasets in particular since in each of these cases, a largefraction of non-household waste appears to be collected. This will imply that the use ofcompositional data, most probably based on household waste, will not necessarily reflectthe composition of municipal waste as a whole. For Austria, Amlinger (2000) suggeststhat the amount of organic wastes in total municipal waste is little different to the amountin household waste (despite a marked difference in total municipal and total householdwaste). Barth�s (2000) figures for Germany indicate the same may be true for Germany(see below).
Economic Analysis of Options for Managing Biodegradable Municipal Waste � Final Report
Eunomia Research & Consulting, Scuola Agraria del Parco di Monza, HDRA Consultants, ZREU and LDK ECO onbehalf of ECOTEC Research & Consulting
56
33..55 RReellaattiivvee SSiiggnniiffiiccaannccee ooff TTrreeaattmmeenntt TTeecchhnnoollooggiieess
Data on treatment methods ought to be fairly reliable for the same reasons as discussedunder waste arisings. As discussed in the section on composition, issues may arise ininterpreting data on home composting and re-use. No country explicitly reported re-use,though deposit-refund schemes are in operation in several countries. Presumably, theseare captured mainly in the recycling treatment approach (or in the relative absence ofcertain materials such as glass in the waste stream).
Table 8 shows the data collected through the review carried out for this project. Thefollowing comments can be made:
• There is considerable variation in treatment across countries. Some countrieshave already made significant moves towards materials recovery, others havenot. Those that have made significant progress are Austria, Belgium (especiallyFlanders and Wallonia), Denmark, Finland, Germany, Netherlands, and Sweden;
• Reflecting this, a number of countries have already begun to compost significantfractions of their municipal waste, though progress here has not been as rapid aswith dry recyclables (despite the fact that the relative proportions of dryrecyclables and biowastes are similar - note that the figures here do not generallyconsider the impact of home composting, which as discussed earlier is subject toconsiderable uncertainty in its estimation); and
• Accession States (and some others dependent upon low-cost landfill solutions)face a dual problem in not only diverting material from landfill, but also, improvingmanagement of existing landfill sites.
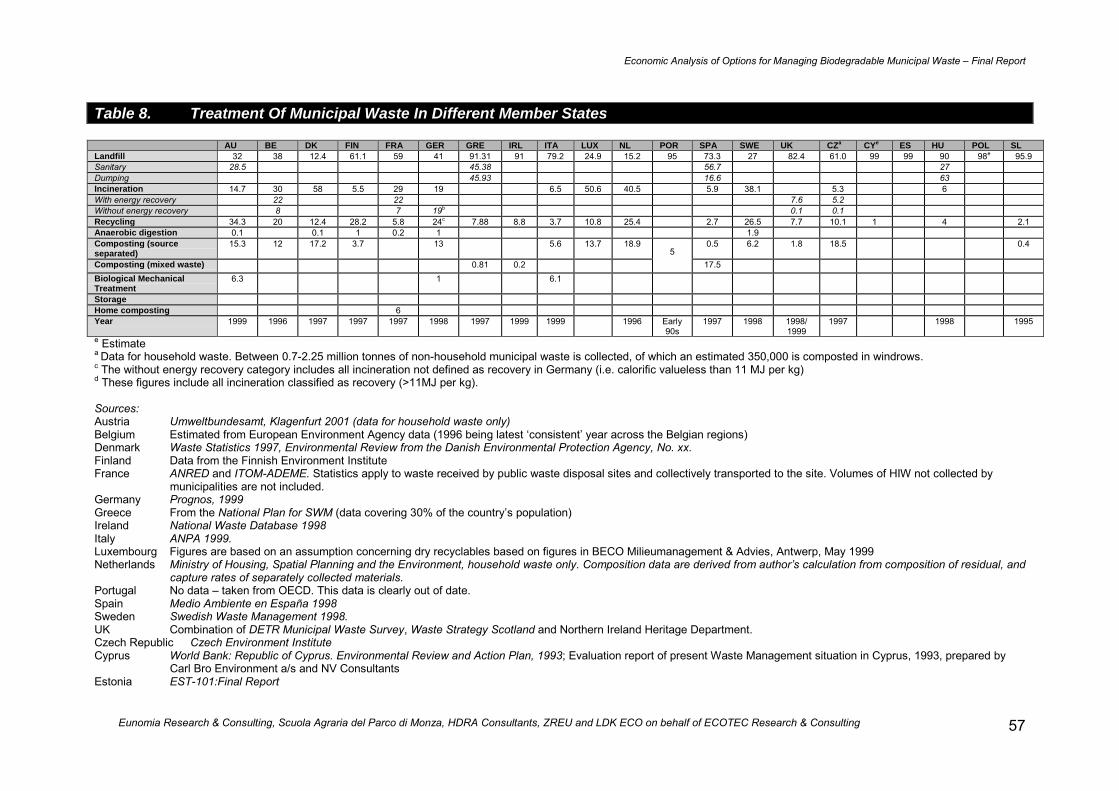
Economic Analysis of Options for Managing Biodegradable Municipal Waste � Final Report
Eunomia Research & Consulting, Scuola Agraria del Parco di Monza, HDRA Consultants, ZREU and LDK ECO on behalf of ECOTEC Research & Consulting 57
Table 8. Treatment Of Municipal Waste In Different Member States
AU BE DK FIN FRA GER GRE IRL ITA LUX NL POR SPA SWE UK CZa CYe ES HU POL SLLandfill 32 38 12.4 61.1 59 41 91.31 91 79.2 24.9 15.2 95 73.3 27 82.4 61.0 99 99 90 98e 95.9Sanitary 28.5 45.38 56.7 27Dumping 45.93 16.6 63Incineration 14.7 30 58 5.5 29 19 6.5 50.6 40.5 5.9 38.1 5.3 6With energy recovery 22 22 7.6 5.2Without energy recovery 8 7 19b 0.1 0.1Recycling 34.3 20 12.4 28.2 5.8 24c 7.88 8.8 3.7 10.8 25.4 2.7 26.5 7.7 10.1 1 4 2.1Anaerobic digestion 0.1 0.1 1 0.2 1 1.9Composting (sourceseparated)
15.3 12 17.2 3.7 13 5.6 13.7 18.9 0.5 6.2 1.8 18.5 0.4
Composting (mixed waste) 0.81 0.25
17.5Biological MechanicalTreatment
6.3 1 6.1
StorageHome composting 6Year 1999 1996 1997 1997 1997 1998 1997 1999 1999 1996 Early
90s1997 1998 1998/
19991997 1998 1995
e Estimatea Data for household waste. Between 0.7-2.25 million tonnes of non-household municipal waste is collected, of which an estimated 350,000 is composted in windrows.c The without energy recovery category includes all incineration not defined as recovery in Germany (i.e. calorific valueless than 11 MJ per kg)d These figures include all incineration classified as recovery (>11MJ per kg).
Sources:Austria Umweltbundesamt, Klagenfurt 2001 (data for household waste only)Belgium Estimated from European Environment Agency data (1996 being latest �consistent� year across the Belgian regions)Denmark Waste Statistics 1997, Environmental Review from the Danish Environmental Protection Agency, No. xx.Finland Data from the Finnish Environment InstituteFrance ANRED and ITOM-ADEME. Statistics apply to waste received by public waste disposal sites and collectively transported to the site. Volumes of HIW not collected by
municipalities are not included.Germany Prognos, 1999Greece From the National Plan for SWM (data covering 30% of the country�s population)Ireland National Waste Database 1998Italy ANPA 1999.Luxembourg Figures are based on an assumption concerning dry recyclables based on figures in BECO Milieumanagement & Advies, Antwerp, May 1999Netherlands Ministry of Housing, Spatial Planning and the Environment, household waste only. Composition data are derived from author�s calculation from composition of residual, and
capture rates of separately collected materials.Portugal No data � taken from OECD. This data is clearly out of date.Spain Medio Ambiente en España 1998Sweden Swedish Waste Management 1998.UK Combination of DETR Municipal Waste Survey, Waste Strategy Scotland and Northern Ireland Heritage Department.Czech Republic Czech Environment InstituteCyprus World Bank: Republic of Cyprus. Environmental Review and Action Plan, 1993; Evaluation report of present Waste Management situation in Cyprus, 1993, prepared by
Carl Bro Environment a/s and NV ConsultantsEstonia EST-101:Final Report

Economic Analysis of Options for Managing Biodegradable Municipal Waste � Final Report
Eunomia Research & Consulting, Scuola Agraria del Parco di Monza, HDRA Consultants, ZREU and LDK ECO on behalf of ECOTEC Research & Consulting58
Hungary Hungarian Ministry of EnvironmentPoland See final note belowSlovenia Statistical Office of the Republic of Slovenia
We are also grateful for having had access to information emerging from an ongoing project funded by the Regional Environment Centre in Szentendre concerning waste managementpolicies in Central and Eastern Europe.

Economic Analysis of Options for Managing Biodegradable Municipal Waste � Final Report
Eunomia Research & Consulting, Scuola Agraria del Parco di Monza, HDRA Consultants, ZREU and LDK ECOon behalf of ECOTEC Research & Consulting
59
33..66 IImmppoorrttaannccee ooff SSeeppaarraattee CCoolllleeccttiioonn
At a general level, the rationale for source-separation of wastes is that it makes iteasier to deal with, and to recover value from, the resulting streams in the mostappropriate manner. The quality of the materials recovered tends to be higherbecause of lower levels of cross-contamination with other components of the wastestream. Arguably, determining the best option for specific components of themunicipal waste stream implies that they are collected separately. Furthermore, thereis anecdotal evidence to support the view that the act of separation increasesawareness amongst citizens of waste as an environmental issue. It is, after all,impossible to separate waste into specific fractions without first assessing what wasteone has to separate in the first place. The act of separation thus becomes an activitywhich serves to educate citizens as to what wastes they produce, and in whatquantities.
Experiences with attempts to derive �compost� from mechanical separation of mixedresidual waste have tended to reveal two things:
• The end-product is generally of a low quality, and has led to problems (andrejection) when attempts have been made to use the material on land. Typicalcontaminants are heavy metals, glass and plastics;
• The attempt to market such materials can severely compromise the market formaterials of higher quality, derived from source-separated materials. It is no co-incidence that in countries where the utilisation of compost from sourceseparated municipal wastes is furthest advanced, the attempt to derive �usableproducts� from residual wastes is frowned upon (or banned, other than for quitespecific, low-grade applications) for exactly this reason.
The situation in respect of separate collection of biodegradable waste is, therefore,reflected in the development of standards for compost and composting processes. Inthis respect, one can say that systems of standards and the systems for separatecollection co-evolve. Standards facilitate the marketing of compost since they givepotential users confidence in the quality of the materials they are buying, ensuringfitness for purpose of the composted products concerned. Equally, separate collectionis seen as a pre-requisite for producing composts of a consistent and reliable quality.
The biodegradable fraction of waste (as defined here) is of particular significance inthe context of waste management. The cycling of carbon, which in �wilderness areas�,occurs naturally and in the course of time, has been seriously altered by the activitiesof human beings. In particular, the disturbance of soils leads to the oxidation of soilcarbon with the release of carbon dioxide into the atmosphere. The quantity of carboneffectively emitted to the atmosphere over time (relative to this �wilderness� baseline)due to soil disturbance is believed to be enormous.
The consumption of increasing quantities of crops grown in this way has continued togrow (with population growth and the demand for protein-rich diets) yet in most(perhaps all) countries, organic matter is not being returned to soils at the same rateat which it is being removed (and removal occurs both in the form of the cropsthemselves, and the oxidation processes mentioned above, which are related to tillageof the soil). Farm mechanisation and consequent specialisation has also facilitated

Economic Analysis of Options for Managing Biodegradable Municipal Waste � Final Report
Eunomia Research & Consulting, Scuola Agraria del Parco di Monza, HDRA Consultants, ZREU and LDK ECOon behalf of ECOTEC Research & Consulting
60
regional specialisation in arable and livestock farming units such that just as soils arebeing depleted of organic matter in some areas, excess production of organic sourcesof nutrients occur in others. Estimates show that topsoil C levels are 20-50 percent oftheir pre-cultivation values in mineral soils converted to agriculture. These losses aremuch higher for organic soils converted to agricultural use. If some or all of this carbonwere reabsorbed by agricultural soils, this would constitute significant mitigation.
Quite apart from the carbon content of materials, biodegradable materials containnutrients which are also of value to the soil. Indeed, the fact that carbon has been lostin soils over time can be traced partly to the increasing dependence of agriculture oninorganic fertilisers, synthesised specifically for the purpose of soil fertilisation. Theprimacy of the production of synthetic fertilisers for agricultural production reflects theevolution of disciplines in the field of agricultural science.
There are believed to be a number of potential advantages associated with the use oforganic matter in the soil, and those related to the biological properties of /associations with organic material are likely to be somewhat less well-accepted /appreciated for the reasons mentioned above. Benefits of using organic materials arediscussed further elsewhere in this report, but they include:
• Improved soil structure, porosity and density, improving root environment;
• Increased infiltration and permeability, reducing runoff and erosion;
• Improved water holding capacity, reducing water loss and leaching in sandy soils;
• Supply of macro and micronutrients;
• Control / suppression of soil-borne pathogens;
• Organic matter;
• Cation exchange capacity of soils / growing media improved (so increasing abilityto hold nutrients for plant use);
• Supply of beneficial micro-organisms to soils and growing media;
• Improves / stabilises soil pH;
• Potential to bind and degrade some pollutants; and
• Potential to facilitate associations with mycorrhyzal fungi in soil (which areimportant in facilitating the uptake of micronutrients from the soil.
These suggest there may be considerable benefits from returning organic matter tosoils in the form of composted materials. These are examined in further detail inAppendix 4.
Economic Analysis of Options for Managing Biodegradable Municipal Waste � Final Report
Eunomia Research & Consulting, Scuola Agraria del Parco di Monza, HDRA Consultants, ZREU and LDK ECOon behalf of ECOTEC Research & Consulting
61

Economic Analysis of Options for Managing Biodegradable Municipal Waste � Final Report
Eunomia Research & Consulting, Scuola Agraria del Parco di Monza, HDRA Consultants, ZREU and LDK ECOon behalf of ECOTEC Research & Consulting
62
33..77 SSttaattuuss ooff SSeeppaarraattee CCoolllleeccttiioonn iinn MMeemmbbeerr SSttaatteess aannddAAcccceessssiioonn CCoouunnttrriieess
Some Member States and Accession Countries are already well advanced in terms ofputting in place systems for the separate collection of biodegradable municipal waste(see Figure 11 below). These Member States tend also to have in place a system ofstandards for treatment processes and / or end products for compost and digestate.
At the other extreme are Member States and Accession Countries who are currentlydoing very little in the way of composting / digestion. These countries tend also tohave little in place by way of standards for processes / end-products.
Figure 11: Stage of Implementation of Source Separation for Organic Waste in Europe
Source: Barth (2001).
Several studies have been undertaken in the past by DHV et al (1997), Barth (2000),FEAD (for International Solid Waste Association, u.d.), Amlinger (2000) and theEuropean Topic Centre for Waste (2001), whilst some data is also published in theVienna Workshop report (Federal Ministry for the Environment, Youth and Family
Economic Analysis of Options for Managing Biodegradable Municipal Waste � Final Report
Eunomia Research & Consulting, Scuola Agraria del Parco di Monza, HDRA Consultants, ZREU and LDK ECOon behalf of ECOTEC Research & Consulting
63
Affairs 1999).13 In Table 9, the results of investigations carried out for this project areshown alongside the results of other work.
It is interesting to compare collected quantities with the potential for collection (on thebasis of the putrescible content of municipal waste as outlined in the discussion above� see Table 10). This serves as a cross check on the municipal waste data andcomposition data. It shows the countries with the best rates of collection to beDenmark, Austria, Belgium (especially Flanders � see footnote in Table), Germany,Luxembourg and the Netherlands with the Czech Republic also performing well. Thisdoes not show the degree to which home composting plays a role. This is clearlyconsiderable in Austria, Germany, Flanders, Luxembourg and possibly for some othercountries too. Swedish estimates are for 40,000 tonnes of home composting.
13 We are grateful to the ISWA Working Group on Biological Treatment for allowing us to access theFEAD data.

Economic Analysis of Options for Managing Biodegradable Municipal Waste � Final Report
Eunomia Research & Consulting, Scuola Agraria del Parco di Monza, HDRA Consultants, ZREU and LDK ECO on behalf of ECOTEC Research & Consulting64
Table 9. Status Of Separate Collection Of Compostable Fractions (‘million tonnes)
This Study Barth DHV Amlinger (2000) FEAD (2000)
Amount Year Amount Year Amount Year Amount Year Amount
Doorstep Green only Doorstep Green only Bio/Green waste Doorstep Green only Mixed
Austria 0.36b 1996 0.88a 0.85a 1996 0.88a 1996a 0.60 1998/99 - -
Belgium 0.265 0.282 0.95
Wallonia 0.088 1997 0.12 1994 0.163 2002 (?) 0.120 1996
Flanders 0.344 0.388 0.752
19981999
0.33 0.39 1998 0.09 1995 0.738 1999 -
Brussels 1996
Denmark 0.051c 0.586 c 1998 0.028 0.49 1997 0.034 1995 0.520 1997 0.035 0.434 -
Finland 0.093 - 1997 0.1 1998 0.069 1995 0.100 1998 - -
France 0.07 0.9 0.08 0.76 1998 - - 0.861 1998 0.04 0.5 1.7
Germany 5 2000 7 1998 - - 7.000 1998 6.4 -
Greece 0.03 Mixedwaste only
1999 1995
Ireland 0.006 c 1998 - - - - 1998 0 -
Italy 1.5 - 1999 1.5 1999 - - 1.500 1998/99 0.405 -
Luxembourg 0.034 - 1998 0.03 1998 0.007 1994 0.030 1998 0.025 0.05 -
Netherlands 1.5 0.29 c 1998 1.5 0.8 1996 1.45 1995 1.800 1998 1.5 0.4 -
Portugal 0.014c 1998
Spain 0.013 (Cat) - 1999 0.06 (Cat) 1998 - - 0.040 (Cat) 2000 - 0.302
Sweden 0.119c 0.15 1998 0.13 0.15 1997 0.04 1994 0.400 1999 0.05 0.15 0.02
UK 0.042 0.573 1998 0.039 0.86 1998 - - 0.910 1998 0.013 0.3 -
Cyprus None known
Czech Rep. 0.01 0.375 1999
Estonia 0.001 1998
Hungary None known -
Poland 0.222 1999
Slovenia 0.01e 1999

Economic Analysis of Options for Managing Biodegradable Municipal Waste � Final Report
Eunomia Research & Consulting, Scuola Agraria del Parco di Monza, HDRA Consultants, ZREU and LDK ECO on behalf of ECOTEC Research & Consulting 65
Sources: European Commission DG XI (1997), Barth (2000), Amlinger (2000), European Topic Centre for Waste (2001) Federation Europeenne des Activites du Dechet et de l�Environment (u.d.)Notes: The figures emboldened are believed taken to be the best estimatesa The Austrian data includes home composting.b The information obtained by the study team is consistent with that from Barth, DHV et al and Amlinger in that it appears to be for separate collection from the doorstep only. DHV note that 0.36Mt is collectedfrom biobins while Amlinger gives a similar figure.cThese figures are taken from the report European Topic Centre for Waste (2001)
Table 10. Proportion Of Available Organic Municipal Waste Materials Treated Through Separate Collection
AU BE DK FIN FRA GER GRE IRL ITA LUX NL POR SPA SWE UK CZ CYP EST HUN POL SLO
Total MSW (million tonnes) 2.800 4.690 2.780 2.510 28.000 49.100 3.900 2.060 26.850 0.25 8.220 3.800 17.200 3.810 31.500 3.240 0.370 0.560 4.300 11.800 1.020
Kitchen and Yard Waste (%) 0.292 0.350 0.350 0.400 0.350 0.299 0.470 0.270 0.336 0.438 0.420 0.370 0.441 0.400 0.381 0.400 0.350 0.530 0.375 0.350 0.323
Theoretical Collection Potential 0.650 1.310 0.780 0.800 7.840 11.740 1.470 0.440 7.220 0.09 2.760 1.120 6.070 1.220 9.600 1.040 0.100 0.240 1.290 3.300 0.260
Current Level of Collection 0.360 0.840 0.490 0.093 0.970 5.000 0.000 0.000 1.500 0.034 1.500 0.264 0.615 0.385 0.001 0.222 0.010
Current as % Maximum 55% 64% 63% 12% 12% 43% 0% 0% 21% 39% 54% 0% 0% 22% 6% 37% 0% 0% 0% 7% 4%
Notes:Amlinger (2000) gives a figure of 68% for Austria (1998/99) based on figures of 4.86 million tonnes MSW with a composition 17% biodegradable.Amlinger (2000) gives a figure of 82% for Flanders (1999)Barth (2000) gives a figure of 77% for Germany (1998)If ones uses official composition data for England and Wales, the figure rises to 9%.The key discrepancies across datasets probably relate to the application of what are probably household waste compositions to the total municipal stream. For those countries where large quantities of non-household waste are collected in the municipal fraction, the errors which are incurred in making this assumption are likely to be considerable.
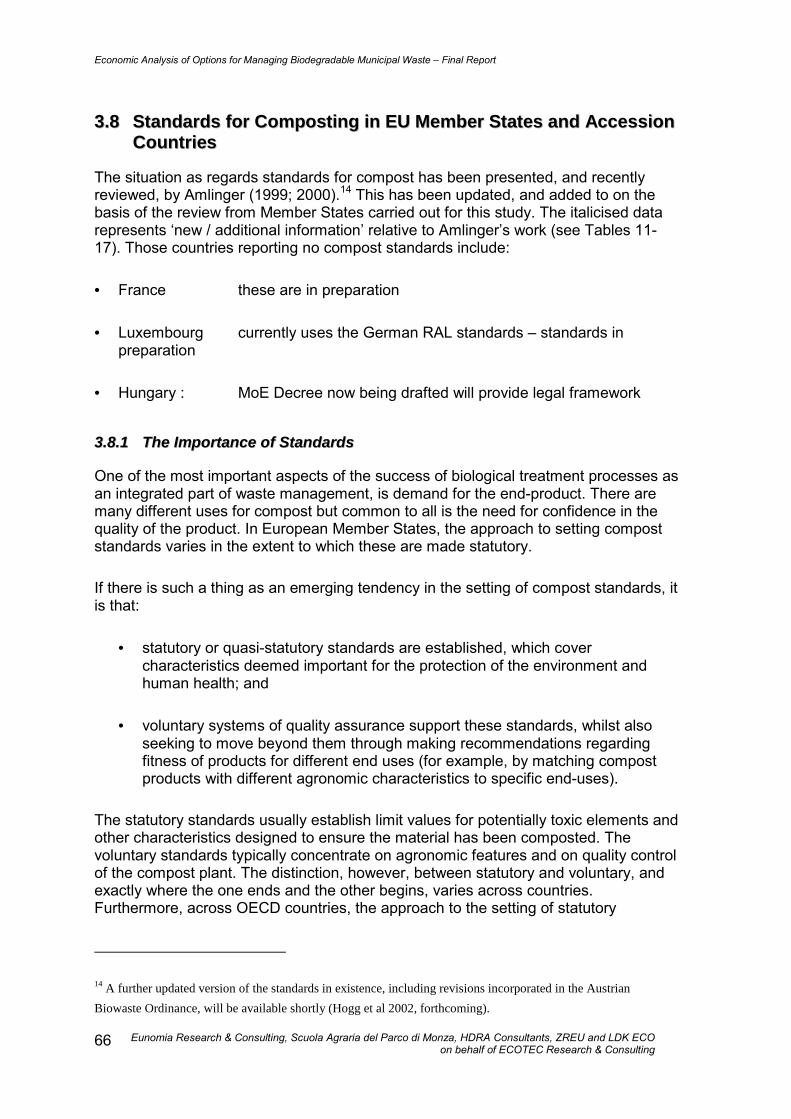
Economic Analysis of Options for Managing Biodegradable Municipal Waste � Final Report
Eunomia Research & Consulting, Scuola Agraria del Parco di Monza, HDRA Consultants, ZREU and LDK ECOon behalf of ECOTEC Research & Consulting
66
33..88 SSttaannddaarrddss ffoorr CCoommppoossttiinngg iinn EEUU MMeemmbbeerr SSttaatteess aanndd AAcccceessssiioonnCCoouunnttrriieess
The situation as regards standards for compost has been presented, and recentlyreviewed, by Amlinger (1999; 2000).14 This has been updated, and added to on thebasis of the review from Member States carried out for this study. The italicised datarepresents �new / additional information� relative to Amlinger�s work (see Tables 11-17). Those countries reporting no compost standards include:
• France these are in preparation
• Luxembourg currently uses the German RAL standards � standards inpreparation
• Hungary : MoE Decree now being drafted will provide legal framework
33..88..11 TThhee IImmppoorrttaannccee ooff SSttaannddaarrddss
One of the most important aspects of the success of biological treatment processes asan integrated part of waste management, is demand for the end-product. There aremany different uses for compost but common to all is the need for confidence in thequality of the product. In European Member States, the approach to setting compoststandards varies in the extent to which these are made statutory.
If there is such a thing as an emerging tendency in the setting of compost standards, itis that:
• statutory or quasi-statutory standards are established, which covercharacteristics deemed important for the protection of the environment andhuman health; and
• voluntary systems of quality assurance support these standards, whilst alsoseeking to move beyond them through making recommendations regardingfitness of products for different end uses (for example, by matching compostproducts with different agronomic characteristics to specific end-uses).
The statutory standards usually establish limit values for potentially toxic elements andother characteristics designed to ensure the material has been composted. Thevoluntary standards typically concentrate on agronomic features and on quality controlof the compost plant. The distinction, however, between statutory and voluntary, andexactly where the one ends and the other begins, varies across countries.Furthermore, across OECD countries, the approach to the setting of statutory
14 A further updated version of the standards in existence, including revisions incorporated in the AustrianBiowaste Ordinance, will be available shortly (Hogg et al 2002, forthcoming).

Economic Analysis of Options for Managing Biodegradable Municipal Waste � Final Report
Eunomia Research & Consulting, Scuola Agraria del Parco di Monza, HDRA Consultants, ZREU and LDK ECOon behalf of ECOTEC Research & Consulting
67
standards also varies with the US, for example, following an approach to setting limitvalues for toxic element based more upon risk assessment than precautionaryapproaches based upon the load of, e.g., heavy metals applied to the soil.
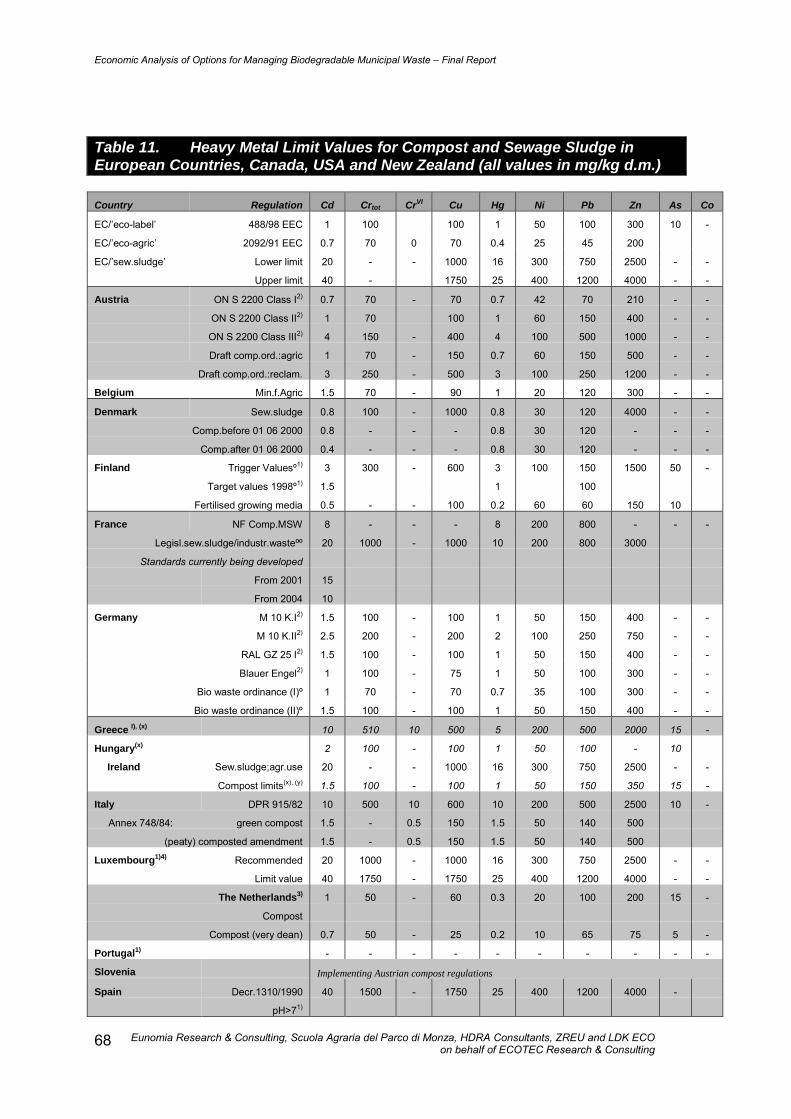
Economic Analysis of Options for Managing Biodegradable Municipal Waste � Final Report
Eunomia Research & Consulting, Scuola Agraria del Parco di Monza, HDRA Consultants, ZREU and LDK ECOon behalf of ECOTEC Research & Consulting
68
Table 11. Heavy Metal Limit Values for Compost and Sewage Sludge inEuropean Countries, Canada, USA and New Zealand (all values in mg/kg d.m.)
Country Regulation Cd Crtot CrVI Cu Hg Ni Pb Zn As Co
EC/�eco-label� 488/98 EEC 1 100 100 1 50 100 300 10 -
EC/�eco-agric� 2092/91 EEC 0.7 70 0 70 0.4 25 45 200
EC/�sew.sludge� Lower limit 20 - - 1000 16 300 750 2500 - -
Upper limit 40 - 1750 25 400 1200 4000 - -
Austria ON S 2200 Class I2) 0.7 70 - 70 0.7 42 70 210 - -
ON S 2200 Class II2) 1 70 100 1 60 150 400 - -
ON S 2200 Class III2) 4 150 - 400 4 100 500 1000 - -
Draft comp.ord.:agric 1 70 - 150 0.7 60 150 500 - -
Draft comp.ord.:reclam. 3 250 - 500 3 100 250 1200 - -
Belgium Min.f.Agric 1.5 70 - 90 1 20 120 300 - -
Denmark Sew.sludge 0.8 100 - 1000 0.8 30 120 4000 - -
Comp.before 01 06 2000 0.8 - - - 0.8 30 120 - - -
Comp.after 01 06 2000 0.4 - - - 0.8 30 120 - - -
Finland Trigger Valuesº1) 3 300 - 600 3 100 150 1500 50 -
Target values 1998º1) 1.5 1 100
Fertilised growing media 0.5 - - 100 0.2 60 60 150 10
France NF Comp.MSW 8 - - - 8 200 800 - - -
Legisl.sew.sludge/industr.wasteºº 20 1000 - 1000 10 200 800 3000
Standards currently being developed
From 2001 15
From 2004 10
Germany M 10 K.I2) 1.5 100 - 100 1 50 150 400 - -
M 10 K.II2) 2.5 200 - 200 2 100 250 750 - -
RAL GZ 25 I2) 1.5 100 - 100 1 50 150 400 - -
Blauer Engel2) 1 100 - 75 1 50 100 300 - -
Bio waste ordinance (I)º 1 70 - 70 0.7 35 100 300 - -
Bio waste ordinance (II)º 1.5 100 - 100 1 50 150 400 - -
Greece I), (x) 10 510 10 500 5 200 500 2000 15 -
Hungary(x) 2 100 - 100 1 50 100 - 10
Ireland Sew.sludge;agr.use 20 - - 1000 16 300 750 2500 - -
Compost limits(x), (y) 1.5 100 - 100 1 50 150 350 15 -
Italy DPR 915/82 10 500 10 600 10 200 500 2500 10 -
Annex 748/84: green compost 1.5 - 0.5 150 1.5 50 140 500
(peaty) composted amendment 1.5 - 0.5 150 1.5 50 140 500
Luxembourg1)4) Recommended 20 1000 - 1000 16 300 750 2500 - -
Limit value 40 1750 - 1750 25 400 1200 4000 - -
The Netherlands3)
Compost
1 50 - 60 0.3 20 100 200 15 -
Compost (very dean) 0.7 50 - 25 0.2 10 65 75 5 -
Portugal1) - - - - - - - - - -
Slovenia Implementing Austrian compost regulations
Spain Decr.1310/1990
pH>71)
40 1500 - 1750 25 400 1200 4000 -

Economic Analysis of Options for Managing Biodegradable Municipal Waste � Final Report
Eunomia Research & Consulting, Scuola Agraria del Parco di Monza, HDRA Consultants, ZREU and LDK ECOon behalf of ECOTEC Research & Consulting
69
Country Regulation Cd Crtot CrVI Cu Hg Ni Pb Zn As Co
pH>71) 20 1000 - 1000 16 300 750 2500 -
B.O.E.n�m.131.2 June 1998 10 400 - 450 7 120 300 1100 -
Sweden1) 2 100 - 600 2.5 100 100 800 -
Guideline values of QAS 1 100 - 100 1 50 100 300
UK Sewage sludge/pasture land - - - - - - 1.000 - -
UKROFS fertil.org.farming 10 1000 - 400 2 100 250 1000 -
Composting Association Quality Label 1.5 100 - 200 1 50 150 400 -
Canada2) 20 - - - 5.0 180 500 1850 75 0
USA1)5) EPA/High Quality 39 (1200) - 1500 17 420 300 2800 41
EPA/Others 85 3000 - 4300 57 420 840 7500 75
Composting Council
1996
39 - - 1500 17 420 300 2800 41
Recommend. USDA (Min.f.agric.) 21 - - - - - - - 54
New Zealand 15 1000 - 1000 10 200 600 2000 -
1) Limit Values for sewagesludge in agricultural use
4) in preparation: valuesreferring to RAL GZ 251
º related to maximum application rate of 20and 30 t.d.m./ha (3a respectively)
2) referring to 30% o.s. 5) for all organic waste ºº Cr+Cu+Ni+Zn: max. 4000 mg/kg d.m.o.3) >20% o.s. in d.m.
(x). taken from partner data
(y). also have limits for Mo = 5 mg/kg d.m., and Se = 2 mg/kg d.m.

Economic Analysis of Options for Managing Biodegradable Municipal Waste � Final Report
Eunomia Research & Consulting, Scuola Agraria del Parco di Monza, HDRA Consultants, ZREU and LDK ECOon behalf of ECOTEC Research & Consulting
70
Table 12. Limit Values for Heavy Metal Concentrations in the Soil Comparingthe EU, Canada, USA and New Zealand (mg/kg d.m.)
Country Regulation Cd Cr Cu Hg Ni Pb Zn As Mo Se
EC/sludge Lower limit 1.0 1007) 50 1.0 30 50 150 - - -
Upper limit 3.0 150 140 1.5 75 300 300
Austria ON L 1075 1.0 100 100 0.7 60 100 300 - - -
Belgium Flanders1)6) 1.2 78 109 1.3 55 120 330 - - -
Wollonia1) 1.0 100 50 1.0 50 100 200 - - -
Denmark 0.5 30 40 0.5 15 40 100 - - -
Finland1) 0.5 200 100 0.2 60 60 150 - - -
France1) 2 150 100 1.0 50 100 300 - - -
Germany5) Clay 1.5 100 60 1 70 100 200 - - -
Loam 1 60 40 0.5 50 70 150 - - -
Sand 0.4 30 20 0.1 15 40 60 - - -
Greece - - - - - - - - - -
Ireland 1.0 - 50 1.0 30 50 150 - - -
Italy 3.0 4) 100 2.0 50 100 300 - - -
Italy1) 1.5 - 100 1.0 75 100 300 - - -
Luxembourg1) Recommended 1.0 100 50 1.0 30 50 150 - - -
Limit value 3.0 200 140 1.5 75 300 300 - - -
The Netherlands1) 0.8 100 36 0.3 35 85 140 29 - -
Portugal - - - - - - - - - -
Sweden1) 0.4 30 40 0.3 30 40 75 - -
Spain 1310/1990pH>71)
3.0 150 210 1.5 112 300 450 - - -
pH>71) 1.0 100 50 1.0 30 50 150 - - -
UnitedKingdom1)4)
3.0 4003) 1352
)1.0 752) 300 3002) 50 4 3
UKROFS 2.0 150 50 1.0 50 100 150 - - -
Canada 2.0 - - 0.5 18 50 185 7.5 2.0 1.4
USA8) 19.5 1500 750 8.5 210 150 1400 20.5 9 50
New Zealand 3.0 600 140 1.0 35 300 300 - - -
1) Limit Values for application ofsewage sludge
4) in preparation: values referring Chromium (VI)3mg/kg and chromium (III) 50mg/kg
6) soil with 10% clayand 2% OM
2) Soil pH 6.0 � 7.0 5) Compost Ordinance 7) planned3) preliminary 8) EPA 503
proposed regulation

Economic Analysis of Options for Managing Biodegradable Municipal Waste � Final Report
Eunomia Research & Consulting, Scuola Agraria del Parco di Monza, HDRA Consultants, ZREU and LDK ECOon behalf of ECOTEC Research & Consulting
71
Table 13. Admissible load of heavy metals in several European countriesand the USA (kg/ha.y)
Country Regulation Cd Crtot CrVI Cu Hg Ni Pb Zn As Mo
EC/’sew.sludge’* 0.15 3.04) - 12 0.1 3.0 15 30 - -
Austria Sewage sludge1) 0.02 1.25 - 1.25 0.02 0.25 1.0 5.0 - -
Fertiliser ordinance 0.001 0.63 - 0.63 0.001 0.038 0.63 2.5 - -
ON S 22002) 0.015 1.5 - 1.5 0.015 0.9 1.5 4.5 - -
Draftcom.,:agric2)
0.008 0.56 - 1.2 0.006 0.048 1.2 4.0 - -
Draft comp.:reclam.2) 0.02 1.67 - 2.67 0.02 0.67 1.67 13.3 - -
Belgium VLAREA 0.012 0.5 - 0.25 0.01 0.1 0.6 0.6 0.3 -
Finland From 1995 0.003 0.3 - 0.6º 0.002 - 0.15 1.5º
From 1998 0.0015 0.001 0.1
France** s.sludge/industr.waste 0.03ºº 1.5 1.5 0.015 0.3 1.5 4.5
pH <6 0.015 1.2 1.2 0.012 0.3 0.9 3
Germany Sewage sludge 0.016 1.5 - 1.3 0.013 0.3 1.5 4.1 - -
Bio waste ordinance (I)2) 0.01 0.7 - 0.7 0.007 0.35 1.0 3.0
Bio waste ordinance (II)2) 0.01 0.67 - 0.67 0.007 0.33 1.0 2.67
Italy 0.015 2.0 0.015 3.0 0.015 1.0 0.5 10 0.1
The Netherlands2) Compost 0.006 0.3 - 0.36 0.002 0.18 0.6 1.2 0.09 -
Spain Decr.877/1991ººº
0.15 3.0 - 50 0.1 3.0 15 30 - -
Sweden From 1995 0.0018 0.1 - 0.6 0.0025 0.05 0.1 0.8 - -
From 2000 0.0008 0.04 - 0.3 0.0015 0.025 0.025 0.6 - -
United Kingdom 0.15 155) - 7.5 0.1 3.0 15 15 0.7 0.2
USA6) 1.9 150 - 75 0.85 21 15 140 2.0 0.9
* Directive 86/276/EEC; average withina period of 10 years
2. calculated from maximumcompost dosage/ha*a
º if deficit of Cu or Zn, theaddition may be maxdoubled
** max. mean load per year within aperiod of 10 years; Cr+Cu+Ni+Zn:6kg/ha.y (Ph <6,0:4 kg/ha.y Se onpasture land: 0.12 kg/ha.y
3. Maximum average within aperiod of 10 years
4. Planned5. Preliminary
ºº 0.015 kg/ha.y from 2001
1. sew.Sludge Ordinance, Lower Austria(Class III)
6. Only for sewage sludge thatexceeds �high quality�
7. For secondary raw materials
ººº over a period of 10 years

Economic Analysis of Options for Managing Biodegradable Municipal Waste � Final Report
Eunomia Research & Consulting, Scuola Agraria del Parco di Monza, HDRA Consultants, ZREU and LDK ECOon behalf of ECOTEC Research & Consulting
72
Table 14. Provisions For The Exclusion Of Pathogens And GerminatingWeeds And Plant Propagules In Several European Countries
Indirect Direct methodsºC % H2O Days Application area Pathogens / weeds Product (P) / approval of technology (AT)
EC/’eco-label’ Gardening Salmonella sp. None
488/98 EEC E.coli <1000 MPN (most probable number)/g
Austria draft 60 40 7 Land reclam. Salmonella sp. None
55 14
Comp.ordinance Agriculture Salmonella sp. Non
E.coli If ded., recomm. For the safe use
Sacked, sport / playground Salmonella sp.
E.coli
None
None
Camylobacter, None
Yersinia sp., Listeria None
Technical use - No requirements
Reclam. + agric. Weeds/propagules Germination ≤ 3 plants /l
Belgium VLACO 60 40 3 General Non
Eelworms None
Weeds None
Denmark 55 14
Finland No harmful micro-organisms to such an extent that they may endanger man, animals or the environment
France 60 4
(AT):c)
Germany Bio waste 55 40 14 Salmonella senft None
ordinance 60a) 40 7 Plasmodoph. Brass. Infection index: ≤ 0.5
Nicotiana virus 1 Guide value bio-test: ≤ 2%
65b) 40 7 Tomato seeds Germination rate/sample: ≤ 2%
(P):Salmonella senft None in 50g sample
Weeks/propagules Germination ≤ 2 plants/l
Greece(x) 40 Enterobacteriaceae None
Hungary(x) Faecal Coliforms <10/gFaecal Spectroccochi <10/gSalmonella Not present in two 10g samplesHuman Parasites Not present in 100g sample
Ireland(x), (q) 21 Salmonella None (<3 MPN/4g)
Faecal coliforms < 1000 MPN/g
Plasmodiophora brassicae
Tobacco-mosaic-virus (TMV)
Tomato seeds
None
None
None
Italy 55 3
Fertil.law Salmonella sp. None in 25g sample
Enterobacteriaceae ≤ 1.0 x 10³ UFC/g
Fecal Streptococcus ≤ 1.0 x 10³ MPN/g
Nematodes None in 50g sample
Trematodes None in 50g sample
Cestodes None in 50 g sample
The Netherlands(z) 55 4 Eelworms None
BRL K256/02 Rhizomania virus None
Plasmodoph. Brass. None
Weeds Germination ≤ 2 plant/I
UK Quality label(x) Salmonella spp Absent in 25 g
E. coli 1000 CFU g-1
Weed propagules 5 viable propagules l-1
Plant tolerance 20 % below control
a) in vessel compostingb) open windrow compostingc) 2 approvals (1 in winter) for windrow composting(x). taken from partner data(z). water content depends on organic matter content(q). Irish limits on maturity are divided into sets of options.

Economic Analysis of Options for Managing Biodegradable Municipal Waste � Final Report
Eunomia Research & Consulting, Scuola Agraria del Parco di Monza, HDRA Consultants, ZREU and LDK ECOon behalf of ECOTEC Research & Consulting
73
Table 15. Impurities Proportions In Compost Comparing Germany, Italy, TheNetherlands And Austria
Country Impurities Ø Meshsize
Limit Values% d.m. (m/m)
Austria Draft compost Total: agriculture 2 mm ≤ 0.5% Ordinance Total: land reclamation > 2 mm < 1%
Total: technical use > 2 mm < 2%Plastics: agriculture > 2mm < 0.2%Plastics: land reclamation > 2mm < 0.4%Plastics: technical use > 2mm < 1%Plastics: agric. excl. arable land > 20mm < 0.02%Plastics: technical use > 20mm < 0.2%Metals: agriculture - < 0.2%
Belgium Flanders Total > 2mm < 0.5%Stones > 5mm < 2%
Finland Fertil.Legislation
Total - < 0.5%
France NF Composting of (A) (B)Municipal waste Plastics > 5mm < 0.5% < 1.2%
Heavy materials < 6% < 12%Total inert material < 20% < 35%
Germany Bio waste Glass, plastics, metal > 2mm < 0.5%ordinance Stones > 5mm < 5%Greece(x) Plastic <0.3%
Glass <0.3%Grading for 90% per weight < 10mm
Hungary(x) Glass ≥ 2mm < 1%Plastic ≥ 2mm < 1%Metal ≥ 2mm < 0.5%Other inert substances (wood etc) ≥ 2mm < 1%
Ireland(x) Foreign matter < 25mm ≤ 1.5%Italy DPR 915/82 Total ≤ 3
Glass ≤ 3≤ 1
Metals ≤ 0.5Fertil. Law Plastics < 3.33 mm < 0.45%
Plastics > 3,33 <10mm
< 0.05%
Other inert materia < 3.33mm < 0.9%The Netherlands BOOM Total > 2mm < 0.2%
Glass > 2mm < 0.2%Glass > 16mm 0Stones > 5mm < 2%
UK Quality label(x) Total glass, metal and plastic > 2 mm < 1% (of which < 0.5%is plastic)
Stones and other consolidated mineralcontaminants
> 2 mm < 5%

Economic Analysis of Options for Managing Biodegradable Municipal Waste � Final Report
Eunomia Research & Consulting, Scuola Agraria del Parco di Monza, HDRA Consultants, ZREU and LDK ECOon behalf of ECOTEC Research & Consulting
74
Table 16. Additional Limits
Country Organicmatter
Chloride(mg/kgd.m.)
EC(µµµµS/cm)
Stability C/Nratio
Oxygen uptakerate(O2/kg volatilesolids per hour)
pH
The Netherlands(x) > 20%d.m.
< 5000 < 5.5 < 50oC <6.5
Greece(x) 6-8Ireland(x), (q) < 25 < 50mg
(x). taken from partner data(q). Irish limits on maturity are divided into sets of options.
Table 17. Load Limits
Country Phosphate(kg P2O5/ha)
Compost(tonnes/ha.y)
Netherlands(i), (ii) Arable land 110 6 (12 in 2 years) Maize land 110 6 (12 in 2 years) Meadow 135 3 (6 in 2 years)
Other land (specific nature protection areas) 70 0(i). phosphate loads apply to both compost and high quality compost(ii). compost loads apply just to compost
Concentrating on compost standards in particular, and the factors associated withthem, there are a number of important issues related to them forming a part of anyproposed policy change. In facilitating the production of what can be considered ascompost of a sufficient quality, it will be important to examine the feedstock andprocess, as well as the end-product. Furthermore, standards for compost caneffectively draw the line between �compost�, which is a product, and �waste�, which isnot. Waste is subject, under European law, to different legislation to that governingproducts.
Standards for Feedstock
For obvious reasons, the nature of the feedstock will have a large effect on the qualityof the end-product. Feedstocks used in biological treatment processes include mixedmunicipal waste, source separated biowaste, sewage sludge, agro-industrial by-products, manure, slurries, yard waste, etc. Using source-separated biowaste, asopposed to mixed waste, results in a higher quality compost end-product with lowerquantities of potentially hazardous materials (see Figure 12). In the absence ofregulations concerning source separation, this raises the possibility of settingstandards on the types of feedstock used in biological processes if the end-product isto be considered �compost�.
Economic Analysis of Options for Managing Biodegradable Municipal Waste � Final Report
Eunomia Research & Consulting, Scuola Agraria del Parco di Monza, HDRA Consultants, ZREU and LDK ECOon behalf of ECOTEC Research & Consulting
75
Figure 12: Concentrations of Heavy Metals in Soil Improvers from DifferentFeedstocks Compared to Italian Fertiliser Law Limit Values
Source: Centemero 2000
It can be seen from Figure 12 not only that the choice of feedstock used influences theconcentration of heavy metals in the end product, but also that the effect of usingcompost derived from source separated biodegradable municipal wastes entails very
Municipal Solid Waste Compost from Biowaste (BW)
Compost from Sewage Sludge (SS) Compost from green waste (GV)
Compost from liquid slurries (LS) Soil Improvers for hobby gardening (HG)
Manure (M) ___ Fertilisers Law (n° 748/84 mod.
Decree 27.3.98)
Cr
0
50
100
150
M SW SS LS BW GW HG M
mg
kg -1
s.s
.
Cd
0
1
2
3
4
MSW SS LS BW GW HG M
mg
kg -1
s.s
.
\
Cu
0
100
200
300
400
MSW SS LS BW GW HG M
mg
kg -1
s.s
.
Ni
0
20
40
60
80
MSW SS LS BW GW HG M
mg
kg -1
s.s
.
Pb
0
100
200
300
400
MSW SS LS BW GW HG M
mg
kg -1
s.s
.
Zn
0
300
600
900
1200
1500
1800
RSU F+V Z +V A+V V T. H. L
mg
kg -1
s.s
.

Economic Analysis of Options for Managing Biodegradable Municipal Waste � Final Report
Eunomia Research & Consulting, Scuola Agraria del Parco di Monza, HDRA Consultants, ZREU and LDK ECOon behalf of ECOTEC Research & Consulting
76
little by way of changes in the loading of heavy metals. Indeed, the principal changewhich can be discerned from the Figure is the way in which using source-separatedbiowastes as the feedstock, as opposed to mixed municipal wastes, reduces theheavy metal content of the material. It should be said, however, that other impurities inmixed waste composts (glass, plastics, etc.) are as, if not more, important in reducingtheir desirability from the perspective of end users.
Setting standards on anything but the inclusion of broad categories of waste (includingthe examples given above), would be unrealistic as feedstock types are likely to varyconsiderably across the Member States. This gives rise to two main possibilities interms of setting requirements on feedstock categories to be used in biologicaltreatment processes:
1. specify categories of waste which can be used; or
2. specify categories of waste which should not be used.
Both alternatives will avoid the practices of �mixing� and �dilution� of wastes high inpotentially hazardous materials, and will also ensure traceability of batches whichproduce sub-standard products (which is an important aspect of quality assurance).There are advantages and disadvantages to both possibilities. Specifying categoriesof waste which can be used will lead to a greater understanding of the feedstocksutilised and allow their more rigorous regulation. Specifying which feedstocks shouldnot be used however will make possible the �development� of feedstocks that wouldnot be typically linked to composting, but subsequently could also provide a �loop-hole�surrounding potentially undesirable wastes that do not fit into the prescribedcategories. Enshrining such categories in law is also problematic in that if mistakesare made, the law has to be �re-opened�, and this may be difficult to do without re-opening the space for complete re-negotiation of the law.
Standards for Process
The processes relating to biological treatment vary considerably across Europe. Thereare some characteristics which could be included in standards. An example is thecompost curing time which will affect its maturity/stability. Irish regulations includestipulations under maturity that compost must be cured for at least 21 days; and it willnot reheat upon standing to greater than 200C above ambient temperature, if it doesnot meet a number of other criteria.
Another parameter would be the temperature / time profile to which compost would berequired to be subjected (this is usually specified as a certain minimum temperature tobe reached for a minimum duration � see Table 14 above). This is specified to enablepasteurisation of the end product to ensure that certain pathogens, harmful either tohumans or to livestock or plants, would be destroyed before compost was applied toland. It should also be remembered that the biological activity which �makes� compostalso has the effect of destroying pathogens (it is not just the pasteurisation effectwhich achieves this).

Economic Analysis of Options for Managing Biodegradable Municipal Waste � Final Report
Eunomia Research & Consulting, Scuola Agraria del Parco di Monza, HDRA Consultants, ZREU and LDK ECOon behalf of ECOTEC Research & Consulting
77
Other process related regulations that affect end-product quality might relate to thedegree to which compost is aerated or turned. This will be important to ensure thecomposting process proceeded in the presence of sufficient air to avoid anaerobicactivity.
Standards for End-products
Establishing standards on the end-products of biological treatment processes isgenerally accepted to be the most important area of regulation, especially since few�process-related� standards can guarantee quality in the end product. Standards in theprevious areas (feedstock and process) will, therefore, usually be complementary tostandards on the end-product rather than substitutes for them. Only through tests onthe end product can hygienisation and heavy metal limits be examined.
The main uses, in terms of market share, for compost (in descending order ofimportance) are: agriculture and special cultures, landscaping, hobby gardening,horticulture, earth works, landfill-restoration, and export. Each use has varyingrequirements, some similar and some different. The value of parameters such asmaturity, conductivity, particle size, and nutrient content will be different acrossapplications.
Examining national end-product standards across Europe, the most common oneslimit the amount of potentially hazardous materials such as heavy metals and inertmaterials. Others include elements such as pathogens, which effectively act tosupport standards for the process (since the elimination of pathogens would beexpected to follow from a well managed process), and the presence of weed seedscapable of germination.
As stated previously, compost has a number of end-uses. These include use inagriculture, landscaping, hobby gardening, horticulture, earth works, landfill-restoration, etc. Each use will have different requirements in terms of the quality of thecompost required. For example, horticulture and agriculture will require higherstandards than landscaping and landfill-restoration. From the end-user perspective,either statutory standards or voluntary quality assurance regimes can act as amechanism to guarantee the quality of materials for specific end-uses. From theperspective of producers, standards act as a mechanism for segmenting markets, aswell as a mechanism to ensure the higher value markets are not compromised by themarketing of low value products into markets for which they are unfit for purpose.
A number of countries, including Austria and the Netherlands, have set multiplestandards for quality (class I & II; and �compost� and �very good compost�respectively). This raises the possibility of setting multiple standards according to end-use and/or quality. While this has the advantage of ensuring users obtain qualityproducts, there are a number of complications including the fact that the localenvironments in the various member states will vary considerably, requiring differentcomposts according to soil type, climate, etc. On the other hand, setting a singlestandards regime for compost across Europe would ease the process of regulation,and would facilitate marketing of compost (and composting / mechanical biologicaltreatment processes) across national borders.

Economic Analysis of Options for Managing Biodegradable Municipal Waste � Final Report
Eunomia Research & Consulting, Scuola Agraria del Parco di Monza, HDRA Consultants, ZREU and LDK ECOon behalf of ECOTEC Research & Consulting
78
It may also be beneficial to set standards for maturity to distinguish between end-products that have gone through an extensive biological treatment process, stabilisedmaterials, and those where the process produces a fresher product. Such standardsmay be especially important when considering the issue of stabilised biowastesarising from mechanical biological treatment. This is because the terms under whichMember States may accept specific material in landfills, and / or the conditions underwhich waste treated through mechanical biological treatment may be considered �nolonger biodegradable� for the purposes of the Landfill Directive, have an importantbearing upon the validity of such treatments and their �competitiveness� in the marketplace for alternative waste treatments.
Standards to Protect Soil Quality
While setting limits on certain characteristics of compost is important, there are anumber of other factors associated with compost use that need to be considered,including regulating its application to minimise negative environmental impacts.Examining existing standards at the EC level and across Member States, there aretwo main sets of limits, aside from simple composition constraints. These are:
• limit values for heavy metal concentrations in the soil (mg/kg d.m.)
• admissible loads of heavy metals (kg/ha.y)
• admissible loads for nutrients, such as nitrogen and phosphorous.
The last of these is often influenced by Member State implementation of the NitrateDirective. It is worth pointing out that, particularly for composts from source-separatedmaterials, the limits on application to soil are more usually reached in the context oflimits on nitrate applications before limits on heavy metal loading are reached.
33..99 SSuummmmaarryy
Key points that arise from this analysis of performance and standards are:
• In a number of countries, the source separation of biowastes is already faradvanced. The role of composting in treating these materials is far moreadvanced than that of anaerobic digestion;
• Those countries / regions with the highest combined recycling / compostingrates are those with systems in place for source-separation of compostablewastes. The contribution of this to landfill diversion is potentially considerable;
• These countries are also, in the main, those who have the most developedsystems of standards for compost. This suggests an appreciation of theimportance of these in developing end-use markets for compost; and
• However, there is not any �agreed� system of standards and no obvious sign of�clear convergence� towards some harmonised norm. This may reflect, in part,the different markets for end-products in the countries concerned, but it is also

Economic Analysis of Options for Managing Biodegradable Municipal Waste � Final Report
Eunomia Research & Consulting, Scuola Agraria del Parco di Monza, HDRA Consultants, ZREU and LDK ECOon behalf of ECOTEC Research & Consulting
79
likely to be a reflection of different regulatory approaches (and this reveals itselfin the �coverage� of the standards in place).
It would appear, therefore, that the source separation of biowastes has potential toimpact considerably upon the generation of residual waste for recovery / disposal. Asregards an approach to diversion of biodegradable municipal waste from landfill (asrequired under Article 5 of the Landfill Directive), it would appear to be a promisingapproach for those who have barely considered this route. Where countries take thisapproach seriously, the potential volume of compost generated makes it important tohave in place a clear system of standards allowing the product to be properlymarketed.

Economic Analysis of Options for Managing Biodegradable Municipal Waste � Final Report
Eunomia Research & Consulting, Scuola Agraria del Parco di Monza, HDRA Consultants, ZREU and LDK ECOon behalf of ECOTEC Research & Consulting
80
44..00 TTHHEE EECCOONNOOMMIICC AANNAALLYYSSIISS OOFF OOPPTTIIOONNSS FFOORRMMAANNAAGGIINNGG BBIIOODDEEGGRRAADDAABBLLEE MMUUNNIICCIIPPAALLWWAASSTTEE –– EEXXTTEERRNNAALL CCOOSSTTSS
44..11 IInnttrroodduuccttiioonn
The approach adopted to assessing the external costs of the treatment options isprincipally �top-down� in the sense that no dispersion modelling of atmosphericpollutants takes place. The environmental costs of different processes are addressedprincipally through quantitative measurements of emissions, these being multiplied byunit damage cost estimates to arrive at final figures for the externality.
There are a number of caveats that need to be borne in mind when considering theanalysis:15
• As with most analyses of this nature, the external cost analysis is focusedprincipally on air pollutants. Extension of the analysis has been made wherepossible, but the science underlying the impacts from emissions to other mediais less clear (and potentially, less amenable to the marginalist analysis whichcharacterises this type of analysis). Hence, there are a number of omissionsfrom the analysis. These are made clear for each of the treatments;
• The impacts associated with plant construction have not been considered; and
• The use of unit damage costs to carry out the analysis effectively assumes thatimpacts are invariant with respect to the source of the emission. In reality,population density and the height from which emissions are discharged willhave important effects on the actual external costs as would (in theory) thewealth of those located near to the plant (affecting willingness to pay to avoidthe effects of pollution). Without more detailed modelling, making suchadjustments is somewhat speculative. Separate analysis to assess transporteffects has been carried out.
Partly for the reason just mentioned, ranges of estimates for the unit damage costs ofspecific pollutants have been used. In the case of greenhouse gases, the residencetime of the gases is an important factor in determining their effect over time. The purerate of time preference used (not, strictly speaking, the same as a discount rate)therefore affects the unit damage costs associated with these gaseous emissions. Anaccount of the choice of unit damage costs is given in Appendix 1. For the most part,figures used by, or derived from studies by COWI (2000) and Brown et al (2000) havebeen used.
15 For incineration and landfill, these are stated more fully in Broome et al (2000).

Economic Analysis of Options for Managing Biodegradable Municipal Waste � Final Report
Eunomia Research & Consulting, Scuola Agraria del Parco di Monza, HDRA Consultants, ZREU and LDK ECOon behalf of ECOTEC Research & Consulting
81
Whilst the following chapters include new work to understand the external costs andbenefits of composting and anaerobic digestion, work on landfill and incineration iscarried out principally through reference to existing work for Friends of the Earth andWaste Watch in the UK (Broome et al 2001) and by COWI (2000) for the EuropeanCommission, though with adaptation of emissions data used and unit damage costsapplied.16 No new work is carried out in, for example, consideration of gasification andpyrolysis technologies, which are already playing a role in strategies to meet LandfillDirective (LFD) targets. These are not considered further in this analysis.
The study does not take the approach, adopted in a number of studies, of linking aparticular transport routing to a particular treatment option. This can lead to erroneousconclusions not least because:
• Both across and within different countries, the transport distances implied by alltreatment options are likely to vary considerably;
• The transport distances are associated with the collection logistics whichdetermine not just the vehicles used, but the nature of the materials collectedand the frequency of their collection; and
• The transport-related externalities are not dependent on distance only. Theywill vary in accordance with the choice of transportation mode, the likelihood ofaccidents occurring and the location of any gaseous emissions (so, the routingof the journey undertaken). They also contribute to site-related disamenityaffects.
For these reasons, transport related externalities are considered separately (seeSection 4.6 below).
44..11..11 AA NNoottee oonn CClliimmaattee CChhaannggee EEffffeeccttss
The way in which climate change is treated in studies of this nature is deserving ofsome discussion. This is usually treated in such a way as total emissions over timeare compared across the waste management options. Furthermore, the effect ofcarbon dioxide emissions from biogenic sources is usually treated as a �neutralprocess� since the �baseline assumption� is a situation in which the material wouldhave degraded at ambient temperatures.
This is a flawed approach since it ignores the time dimension in understanding the fluxof greenhouse gases into the atmosphere. Furthermore, the impacts of differentgreenhouse gases change in their relative economic significance as the discount rateapplied is changed. This is because the gases have different residence times in theatmosphere.
16 Other relevant studies are PIRA et al (1998), Rabl et al (1998), AEA Technology (1997) Brisson and Pearce(1995), Brisson and Powell (1995), Powell et al (1995) and Powell et al (1996).

Economic Analysis of Options for Managing Biodegradable Municipal Waste � Final Report
Eunomia Research & Consulting, Scuola Agraria del Parco di Monza, HDRA Consultants, ZREU and LDK ECOon behalf of ECOTEC Research & Consulting
82
For this reason, a more sophisticated treatment must look at the time profile of these(and all other emissions). This applies to the biogenic greenhouse gas emissions aswell as the non-biogenic ones (and as far as possible, it ought to apply to all impacts).In this analysis, therefore, there is no �subtraction� of the �carbon dioxide emissionswhich would have occurred anyway� if the material degraded aerobically over time(other studies use the distinction between �short-� and �long-term� carbon). Of principalconcern here is the comparative analysis of the options, not the measurement of aninventory of emissions against pre-established criteria. Furthermore, theseinventories, assessed on a year-by-year basis, ought to allocate emissions to the yearin which they are produced. It is quite clear that from this perspective, the emissionsfrom processes, such as incineration, which occur immediately, should be treateddifferently from those of compost and landfill, which occur over more protractedperiods of time.
Once one appreciates the time dimension (and this may be significant in the context ofdecisions regarding climate change emissions, and in terms of their valuation atdifferent rates of discount), one begins to appreciate the limitations of setting to oneside emissions from biogenic sources. Table 18 below shows a comparison ofassumptions made in this study with those that have typically been made in paststudies. These assumptions imply a more �correct� comparison across options,certainly from the perspective of appreciation of, and valuation of, environmentalimpacts at different rates of discount.
Table 18. Comparison of Assumptions Made Affecting Treatment ofGreenhouse Gas Emissions Relative to ‘Standard’ Assumptions
Key Assumption Landfill Incineration CompostingTypical Life-cycleapproach:Emissions ofcarbon dioxide frombiogenic sourcescan be ignored
Emissions of Methane arecalculated. Emissions ofcarbon dioxide areignored. Where methaneis captured and flared /used for energy recovery,the assumption impliesthere is no net greenhousegas effect. All emissionsare effectively treated asthough they occurinstantaneously.
Only carbon dioxide fromnon-biogenic sources (andnitrous oxide, where this isconsidered) are assessed.Where there areassumptions madeconcerning displacedenergy sources, theseemissions are offsetagainst emissions whichwould have occurred hadthe energy beengenerated using anothersource.
All emissions are assumedto be of biogenic origin,therefore as long as theprocess is entirely aerobic,there are no �netgreenhouse gasemissions.� Whereemissions of methane areassumed, these areaccounted for.There may be accountingfor avoided emissions fromfertiliser manufacture.
This study:Emissions of allgreenhouse gasesare accounted forand allocated to theyear in which theyoccur
Emissions of allgreenhouse gases areaccounted for and areallocated to the year inwhich they occur. Theeconomic impacts are thenevaluated at differentdiscount rates and the netpresent value of theimpact of these emissionsis calculated.
All greenhouse gasemissions fromincineration, includingN2O, are assessed,irrespective of the natureof the material incinerated.Different assumptionsconcerning energydisplacement areconsidered in respect ofoffsetting greenhouse gascredits.
Emissions from theprocess are consideredfirst. However, when theproduct is �used�, carbon isreturned to the soil. There,it is progressivelymineralised over time. Allemissions are allocated(both those from theprocess, and those post-application to the soil) overtime, as well as the effectin terms of fertiliserdisplacement etc. as thisoccurs in time.

Economic Analysis of Options for Managing Biodegradable Municipal Waste � Final Report
Eunomia Research & Consulting, Scuola Agraria del Parco di Monza, HDRA Consultants, ZREU and LDK ECOon behalf of ECOTEC Research & Consulting
83
44..11..22 AA NNoottee oonn EEnneerrggyy DDiissppllaacceemmeenntt
The recovery of energy from waste is preferable to one where energy is generatedwithout any recovery of the resulting energy. How should that benefit be accounted forin environmental terms, if at all (should the benefits be viewed solely in terms of anadditional private benefit from the recovery process)?
The approach usually adopted in studies of this nature is to assume that energy fromwaste �displaces� emissions which would be derived from another energy source if itwere used to supply the equivalent energy. The process is then credited with these�avoided emissions�.
But which energy source is being �displaced� by these processes? The question ismore than merely academic since all studies indicate that the effect of this assumptionis absolutely critical in the analysis of external costs of those waste treatments whichrecover energy.
Typically, a marginalist approach is adopted. Hence, for example, in recent workundertaken for the Commission,
electricity and heat recovery will displace the least profitable form of electricitygeneration in the electricity system, which means that the recovery of energy willdisplace pollution from those sources. This gives rise to external benefits for society.
[�]the external benefit of displaced emissions depends on the energy source that theenergy replaces. [�]
When valuing the benefit of displaced emissions, emphasis should be placed ondetermining/assuming the marginal source of both the heat and the power replaced. InCSERGE et al (1993), EC (1996d) and Brisson (1997) the marginal source of power isassumed being coal-fired power stations. This is still a common source to productionof primary energy in several European countries. Coal-fired power stations are verypolluting and therefore this assumption results in significant external benefits fromdisplaced emissions. However, EC (1996d) and Brisson (1997) also present analternative scenario assuming an average European fuel mix. To choose the rightenergy source replaced in actual calculations, the current and the likely futuremarginal source of power should be reviewed for the specific country.
Sometimes it is argued that it is not always correct to assume that the marginal sourceof power is coal-fired power stations. It is argued that the alternative to using energyfrom incineration of waste could very well be energy from new, efficient power plants.However, the marginal alternative should always be assessed in the short term fromthe existing power plants, in which case coal-fired power stations are the rightmarginal source in most EC countries (COWI 2000).
It is debatable whether this analysis is strictly correct. First of all, even if themarginalist approach were the correct one, the fact that different energy sources areused at on- and off-peak times in many countries would require one to allocate,somewhat absurdly, different external benefits depending upon the time at which a
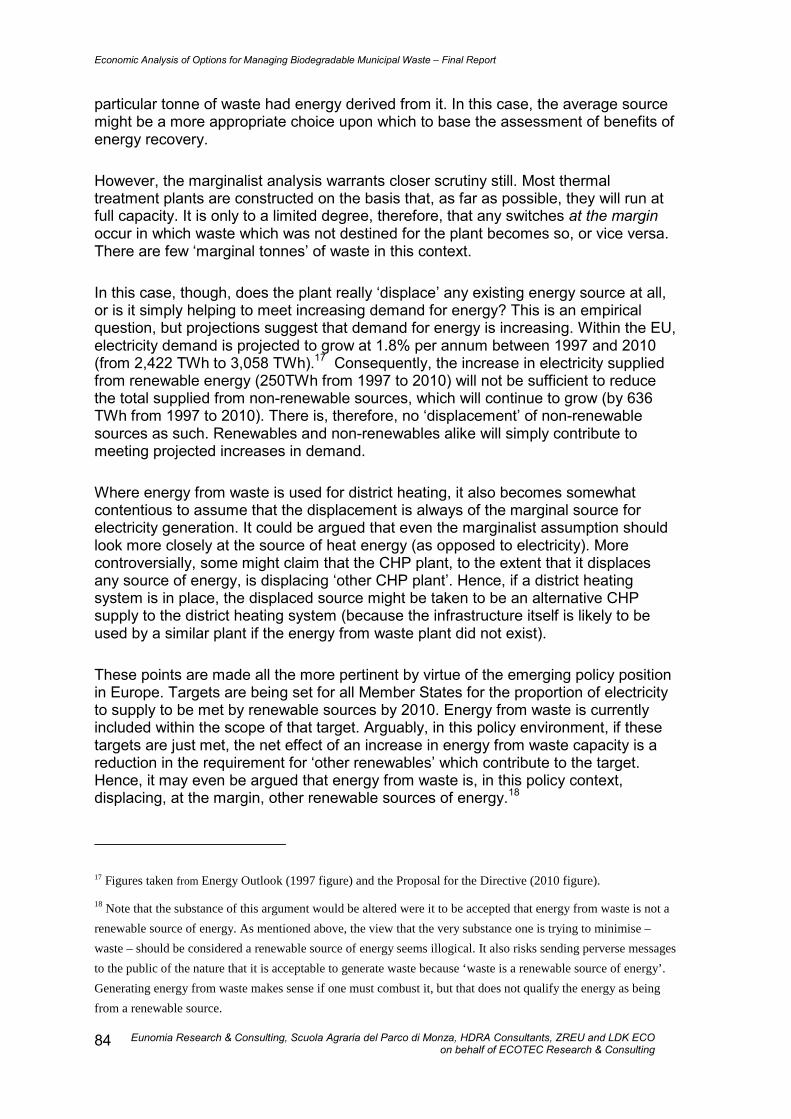
Economic Analysis of Options for Managing Biodegradable Municipal Waste � Final Report
Eunomia Research & Consulting, Scuola Agraria del Parco di Monza, HDRA Consultants, ZREU and LDK ECOon behalf of ECOTEC Research & Consulting
84
particular tonne of waste had energy derived from it. In this case, the average sourcemight be a more appropriate choice upon which to base the assessment of benefits ofenergy recovery.
However, the marginalist analysis warrants closer scrutiny still. Most thermaltreatment plants are constructed on the basis that, as far as possible, they will run atfull capacity. It is only to a limited degree, therefore, that any switches at the marginoccur in which waste which was not destined for the plant becomes so, or vice versa.There are few �marginal tonnes� of waste in this context.
In this case, though, does the plant really �displace� any existing energy source at all,or is it simply helping to meet increasing demand for energy? This is an empiricalquestion, but projections suggest that demand for energy is increasing. Within the EU,electricity demand is projected to grow at 1.8% per annum between 1997 and 2010(from 2,422 TWh to 3,058 TWh).17 Consequently, the increase in electricity suppliedfrom renewable energy (250TWh from 1997 to 2010) will not be sufficient to reducethe total supplied from non-renewable sources, which will continue to grow (by 636TWh from 1997 to 2010). There is, therefore, no �displacement� of non-renewablesources as such. Renewables and non-renewables alike will simply contribute tomeeting projected increases in demand.
Where energy from waste is used for district heating, it also becomes somewhatcontentious to assume that the displacement is always of the marginal source forelectricity generation. It could be argued that even the marginalist assumption shouldlook more closely at the source of heat energy (as opposed to electricity). Morecontroversially, some might claim that the CHP plant, to the extent that it displacesany source of energy, is displacing �other CHP plant�. Hence, if a district heatingsystem is in place, the displaced source might be taken to be an alternative CHPsupply to the district heating system (because the infrastructure itself is likely to beused by a similar plant if the energy from waste plant did not exist).
These points are made all the more pertinent by virtue of the emerging policy positionin Europe. Targets are being set for all Member States for the proportion of electricityto supply to be met by renewable sources by 2010. Energy from waste is currentlyincluded within the scope of that target. Arguably, in this policy environment, if thesetargets are just met, the net effect of an increase in energy from waste capacity is areduction in the requirement for �other renewables� which contribute to the target.Hence, it may even be argued that energy from waste is, in this policy context,displacing, at the margin, other renewable sources of energy.18
17 Figures taken from Energy Outlook (1997 figure) and the Proposal for the Directive (2010 figure).
18 Note that the substance of this argument would be altered were it to be accepted that energy from waste is not arenewable source of energy. As mentioned above, the view that the very substance one is trying to minimise –waste – should be considered a renewable source of energy seems illogical. It also risks sending perverse messagesto the public of the nature that it is acceptable to generate waste because ‘waste is a renewable source of energy’.Generating energy from waste makes sense if one must combust it, but that does not qualify the energy as beingfrom a renewable source.

Economic Analysis of Options for Managing Biodegradable Municipal Waste � Final Report
Eunomia Research & Consulting, Scuola Agraria del Parco di Monza, HDRA Consultants, ZREU and LDK ECOon behalf of ECOTEC Research & Consulting
85
The significance of this discussion is that, depending upon the viewpoint adopted (andit seems unlikely that there will be agreement as to which assumption should becarried forward because of the different interests involved), the �avoided emission�credited on the basis of energy produced from waste can change radically.
In this study, two assumptions are carried forward:
• The first is that energy from waste acts to displace sources of energy whichwould otherwise have to be built (because demand for energy is,disconcertingly, one might say, increasing). Therefore, the source of energybeing displaced is assumed to be one representative of new build energy. Inthis study, these are taken to be combined cycle gas turbines (CCGT). This isthe same assumption used in recent work on PVC Waste Management (Brownet al 2000); and
• The second is that no source of energy is being displaced, which is broadlyequivalent to an assumption that one is displacing a clean source with little orno disamenity impact (such as, for example, photovoltaics). It could be arguedthat new renewable energy targets are likely to require that significantproportions of new-build will be renewable sources. This seems to be the bestalternative assumption to the one used above, and represents the desiredeffect of changing policies in this area.
Note that under the first assumption, where energy recovery is from combined heatand power plant, it would not be strictly correct to allocate the same �avoided burdens�from the heat recovery as from the electricity recovery. For the gas fuels cycle in theDanish case under the ExternE programme, the external costs from heat generationvia CHP were allocated on the basis of exergy. This led to externalities per kilowatthour from heat energy generation being approximately a quarter those from thegeneration of electricity. In the German case study, the same approach led to the heatenergy externalities being two-thirds of those from electricity generation. In this study,an assumption is made that for CHP plant, where burdens are assumed to beavoided, the avoided burdens per unit of thermal energy generation are one half thosefrom electricity generation.
44..11..33 AAvvooiiddeedd EExxtteerrnnaall CCoosstt DDaattaa
In terms of the treatment of avoided external costs of energy, in order to give theanalysis greater relevance at the country specific level, country-specific estimates ofexternal costs of energy supply, taken from the ExternE national implementationstudies, have been used for the �avoided energy� assumption (European Commission1999a).
The approach taken has been to use the figures for the externality per kWh and perGJ associated with electricity generation from combined cycle gas fired power stationsin the countries concerned. For Sweden, Ireland and Finland, since no results for thegas cycle are reported in those countries, the figures used are 35% of the valuesreported for the coal-fired power station (this relationship holds approximately true forthe other Member States reporting on both cycles) (see Table 19). The ExternEresults have been updated through applying European GDP inflators to the 1995values. Since the whole ExternE valuation process was conducted in Euros (and the

Economic Analysis of Options for Managing Biodegradable Municipal Waste � Final Report
Eunomia Research & Consulting, Scuola Agraria del Parco di Monza, HDRA Consultants, ZREU and LDK ECOon behalf of ECOTEC Research & Consulting
86
country specific variations relate to factors such as population density etc.) no accounthas been taken of exchange rate movements. However, an inflation of the valuation oflife has been assumed to reflect increases in real GDP.

Economic Analysis of Options for Managing Biodegradable Municipal Waste � Final Report
Eunomia Research & Consulting, Scuola Agraria del Parco di Monza, HDRA Consultants, ZREU and LDK ECOon behalf of ECOTEC Research & Consulting
87
Table 19. External Costs Associated With Electricity Production from Gas InDifferent Countries
AUS BEL DEN FIN FRA GER GRE IRE ITA LUX NL€ per MWh(1995)
Low 11 11 15 7 24 12 7 20.65 15 5 5
High 26 22 30 15.4 35 23 13 29.4 27 19 19€ per GJ(1999)
Low 3.46 3.46 4.72 2.20 7.55 3.78 2.20 6.50 4.72 1.57 1.57
High 8.18 6.92 9.44 4.85 11.01 7.24 4.09 9.25 8.50 5.98 5.98
POR SPA SWE UK CYP CZ EST HUNG POL SLO EU-15 AVE€ per MWh(1995)
Low 8 11 6.3 11
High 21 22 14.7 22€ per GJ(1999)
Low 2.52 3.46 1.98 3.46 3.54 3.54 3.54 3.54 3.54 3.54 3.54
High 6.61 6.92 4.63 6.92 7.10 7.10 7.10 7.10 7.10 7.10 7.10
Source: European Commission (1999a)
Note that these figures have their own shortcomings. First of all, they are based on olddata (so they may overstate the external costs if technologies for generation haveimproved). Secondly, they are based upon analysis carried out using the 3% discountrate as the central assumption (though the high and low ranges typically spandiscount rates of 1% and 3%). There is no available basis for varying theseexternalities as the discount rate changes (though the 3% case is the centralassumption in this analysis � see next section). Lastly, regarding the valuation ofhealth effects, although the ExternE approach looked at use of both the �value ofstatistical life� and the �years of life lost� approaches to placing values on mortality,most of the ranges reported reflect the latter approach. Given that there is still muchdebate about the appropriate approach, some may say this underestimates the effectsbeing valued (since using the value of statistical life generates higher external costestimates) (European Commission 1999b).
For the Accession States, the EU average has been used. There is a question as towhether this is valid. Two key criticisms of this approach could be advanced:
a) the plant used to generate electricity are likely to be �dirtier�; and
b) the willingness to pay for avoidance of pollution is not as high, reflecting thelower purchasing power of per capita GDP.
On the other hand, Accession States will, in due course, be required to comply withDirectives affecting, for example, both air quality in general, and emissions from largecombustion plant.

Economic Analysis of Options for Managing Biodegradable Municipal Waste � Final Report
Eunomia Research & Consulting, Scuola Agraria del Parco di Monza, HDRA Consultants, ZREU and LDK ECOon behalf of ECOTEC Research & Consulting
88
On those grounds, one could, over the medium- to long-term, work with EU averageson the assumption that similar emissions standards will be reached by power plants inAccession States. With regard to the willingness to pay issue, for the majority of theAccession States, the purchasing power of per capita GDP is clearly lower than in themajority of EU Member States. However, there is considerable variation within the EUalso. The ExternE research from which these figures are derived appear not toaccount for the relative PPP adjusted incomes in the different Member States tocalculate the external costs of electricity supply (for example, by adopting what wouldno doubt have been a controversial stance in using different values for statistical lifeand years of life lost). To this end, the EU average is used, though there are clearlyreasons why some might argue one should do otherwise.
These figures are used in all of the treatment options which involve assessment of theavoided external costs of electricity supply (including where processes use electricalenergy).
44..11..44 DDiissccoouunnttiinngg aanndd ‘‘CCoouunnttrryy--ssppeecciiffiicc’’ EExxtteerrnnaalliittiieess
The discounting of future benefits is always significant in any economic analysis. Thestudy attempts to introduce rather more of a time dimension into this analysis than inearlier studies. Those earlier studies have implicitly, by valuing all emissions in thelife-cycle at the same level even when they occur over protracted periods of time,employed a zero rate of discount. The approach in this study is different.
It is usual in analyses for the European Commission to work with discount rates of 2%,4% and 6%. The choice of discount rates which can be modelled has effectively beendictated by the discount rates for which damages associated with greenhouse gaseshave been estimated, that is, 1%, 3% and 5%. It will be increasingly important infuture analyses to recognise the significance of discounting and the effects this has onthe valuation of global warming externalities. This is more important in terms ofunderstanding the �relative� effects rather than the absolute ones, since any attempt tovalue marginal damages associated with incremental emissions of greenhouse gasesmust itself be treated with extreme caution (there is, after all, not so much certaintyabout the magnitude of the effects which should be valued).
The ExternE work (from which country-specific energy externalities are taken) wasalso used as a source of country-specific unit damage costs for SO2, NOx andparticulates (European Commission 1999a). The ExternE work used the 3% discountrate as the central assumption, using 1% and 10% for sensitivity analysis. Thissuggests that the 3% discount rate is likely to produce the most reliable results, and itis, perhaps, in any case, the most realistic result to use. Arguably, if one varies thediscount rate (and with it, the global warming unit damage costs), one ought also tovary the unit damage costs associated with any of the other pollutants which have aneffect which extends across time. There is no basis available for making suchadjustments, since the impacts of other pollutants (such as they are known) preventone from making such adjustments (where they might be necessary). Since theExternE programme did not look at Accession States (it is now doing so), no specificestimates for these countries exist. A wider range of valuation figures is used forAccession States based upon the ranges across the EU Member States.

Economic Analysis of Options for Managing Biodegradable Municipal Waste � Final Report
Eunomia Research & Consulting, Scuola Agraria del Parco di Monza, HDRA Consultants, ZREU and LDK ECOon behalf of ECOTEC Research & Consulting
89
The other reason for favouring the 3% discount rate is that the avoided energyexternalities were calculated using this discount rate as the central assumption.Consistency demands that the damages / avoided damages associated with energyuse / production should be varied as the discount rate changes. In this analysis, thishas not been possible so the 3% figure is the only one which is �consistent� withestimates of externalities from energy generation. That is why in the generation of theresults, the 3% discount rate assumption is given far greater significance.
44..22 RReessuullttss ffoorr LLaannddffiillll
The details of the analysis are given in Appendix 2. Table 20 shows which externalcosts are covered and which are not in this analysis. It is quite clear from this thatmany externalities which one would assume to be negative have not been quantifiedin the analysis. As such, this almost certainly constitutes an under-estimate of theexternal costs associated with landfill.
Table 20. External Costs of Landfill Covered In the Analysis
Category Covered Not CoveredAir Emissions Methane, Carbon dioxide, NOx,
CO2, N2O, CO, VOCs, dioxins,cadmium, chromium, lead,particulates19
All other air emissions, including H2S, HCl, HF,mercury, zinc etc.
Emissions toWater
Leachate (in a limited fashion)
Other Disamenity Accidents (fires, explosions, groundwatercontamination, etc.)Operator health issues (related to waste handling/ movements, respiratory effects)Plant (construction) related externalitiesOn-site fuel useNon-market benefits from recreational uses post-closure (to the extent that one accepts suchbenefits can be attributed to the process)Unproven effects (such as possible birth defects)
Avoidedburdens fromenergygeneration
Air emissions from CHP plant(covering various phases ofextraction to generation, butrestricted to air pollutants)
Other external costs of extraction etc. as well asconstruction of plant etc.
For the purpose of this analysis, the important results are those to do with externalcosts avoided (i.e. the external benefits generated) when a tonne of material collectedat source is removed from landfill. This analysis is shown for two cases, both using thecentral (3%) discount rate.
19 These were valued as PM10. Some studies use higher unit damage costs than for PM10 on the basis thatparticulates from incinerators are expected to be the sub-2.5 micron type, and these are believed to be moredamaging to human health (see, e.g., PIRA et al 1998).

Economic Analysis of Options for Managing Biodegradable Municipal Waste � Final Report
Eunomia Research & Consulting, Scuola Agraria del Parco di Monza, HDRA Consultants, ZREU and LDK ECOon behalf of ECOTEC Research & Consulting
90
In the first case, the results are shown using estimates for the gas collection efficiencyof landfills based on Smith et al (2001). Smith et al (2001) suggest as of 2000, 90% oflandfills in the UK had gas control systems in place, whilst figures for Austria andSpain were 33% and 23% respectively. Table 21 shows estimates for �country-specific� gas collection efficiencies based largely on those in Smith et al (2001). Table22 then shows the external benefits of reducing, by one tonne, the amount of biowastelandfilled using these country-specific estimates. In all cases, it was assumed that50% of the gas collected is used to generate energy, the efficiency of the engine being30%. Of the uncollected gas, 10% is assumed to be oxidised either at the cap or inleachate. Appendix 2 Illustrates how sensitive the analysis is to these assumptions.Note that individual landfills may perform better or worse than these figures suggest.
Table 22 reports the total external benefit from reducing landfilling of biowaste fromlandfill using different assumptions about disamenity and energy displacement. Thereason for showing the different results (i.e. with and without disamenity and avoidedburdens from energy generation) is to illustrate the significance of the assumptionsregarding energy recovery and disamenity. In the case of landfill, there is relativelylittle effect since:
• the energy recovered is relatively small and it is recovered over a period oftime (so that the discounted flow of benefits is relatively small); and
• the population density around the landfill is typically low and so the unitdisamenity-related externality is small also (since these are effectivelycalculated through a hedonic pricing equation relating disamenity to changes inhouse prices).
As Appendix 2 shows, the more important variables, in absolute terms, are thediscount rate used (because of the time profile for gas generation) and the parametersdefining landfill performance (such as efficiency of gas capture and energygeneration).
Given that, later in the analysis, one seeks to understand the likely evolution of wastemanagement in Member States, estimates have also been made for the externalbenefits of taking biodegradable waste away from landfill using, for all countries, acollection efficiency of 60%. This has the effect of reducing the external benefits ofremoving waste from landfill. This is deemed broadly representative of the situationwhich might prevail in 2010, by which time, implementation of the technical aspects fthe Landfill Directive will be complete. This requires landfills to have gas collectionequipment in place, for recovery where possible. The results are shown in Table 23.
Table 24 illustrates the differences in the external benefits under the �current� (Table21) and �with Landfill Directive� (Table 23) scenarios. The fact that the numbers arenegative indicates that, as would be expected, the benefits from removing waste fromlandfill will fall as the operation of landfills improves in the European Union. Thenumbers are greatest for those countries whose landfills are assumed to be furthestfrom good practice under the assumptions made in Table 21.
It should be emphasised that in the landfill case, as with all other treatments, thebenefits assessment for landfill covers a sub-set of the total externalities. It is almostcertainly the case that the externalities for landfill are underestimates.
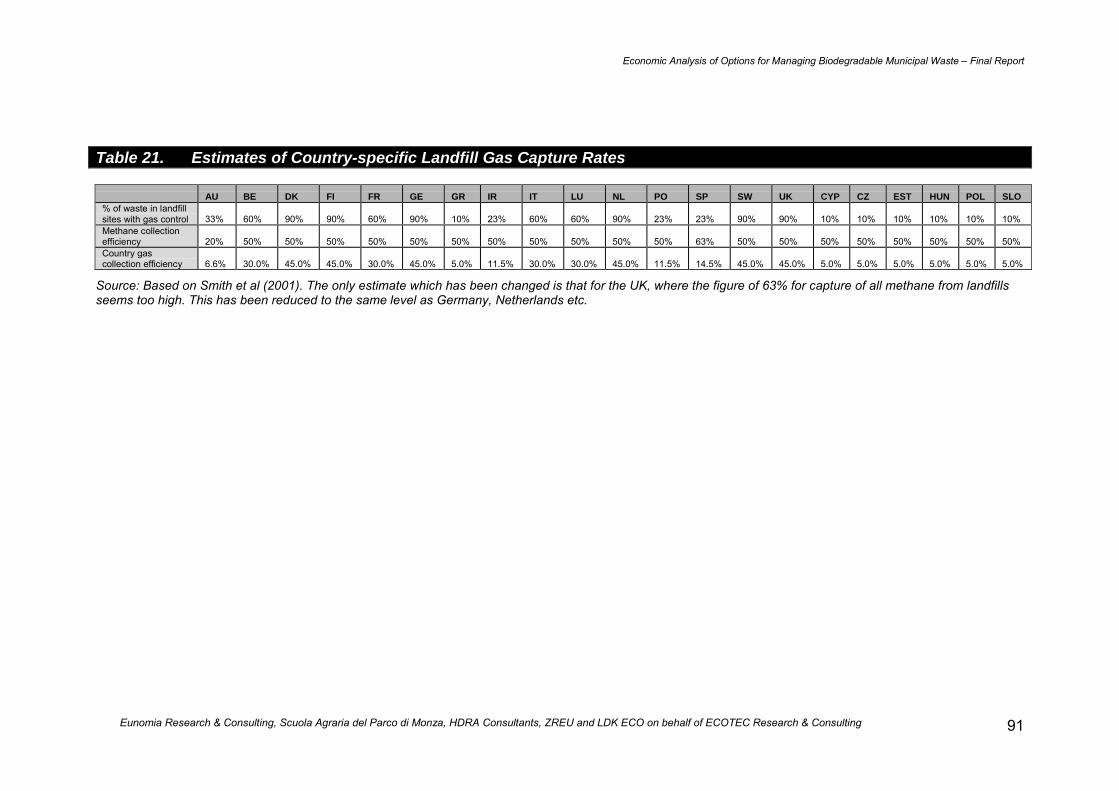
Economic Analysis of Options for Managing Biodegradable Municipal Waste � Final Report
Eunomia Research & Consulting, Scuola Agraria del Parco di Monza, HDRA Consultants, ZREU and LDK ECO on behalf of ECOTEC Research & Consulting 91
Table 21. Estimates of Country-specific Landfill Gas Capture Rates
AU BE DK FI FR GE GR IR IT LU NL PO SP SW UK CYP CZ EST HUN POL SLO% of waste in landfillsites with gas control 33% 60% 90% 90% 60% 90% 10% 23% 60% 60% 90% 23% 23% 90% 90% 10% 10% 10% 10% 10% 10%Methane collectionefficiency 20% 50% 50% 50% 50% 50% 50% 50% 50% 50% 50% 50% 63% 50% 50% 50% 50% 50% 50% 50% 50%Country gascollection efficiency 6.6% 30.0% 45.0% 45.0% 30.0% 45.0% 5.0% 11.5% 30.0% 30.0% 45.0% 11.5% 14.5% 45.0% 45.0% 5.0% 5.0% 5.0% 5.0% 5.0% 5.0%
Source: Based on Smith et al (2001). The only estimate which has been changed is that for the UK, where the figure of 63% for capture of all methane from landfillsseems too high. This has been reduced to the same level as Germany, Netherlands etc.
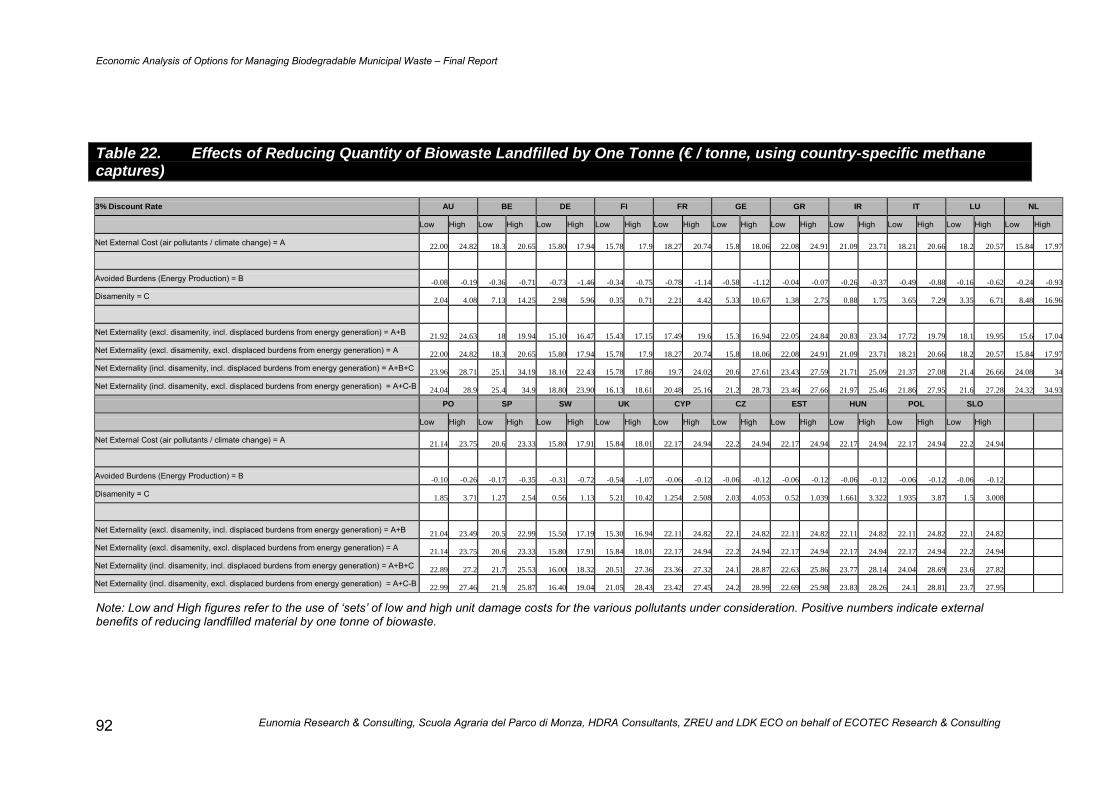
Economic Analysis of Options for Managing Biodegradable Municipal Waste � Final Report
Eunomia Research & Consulting, Scuola Agraria del Parco di Monza, HDRA Consultants, ZREU and LDK ECO on behalf of ECOTEC Research & Consulting92
Table 22. Effects of Reducing Quantity of Biowaste Landfilled by One Tonne (€ / tonne, using country-specific methanecaptures)
3% Discount Rate AU BE DE FI FR GE GR IR IT LU NL
Low High Low High Low High Low High Low High Low High Low High Low High Low High Low High Low High
Net External Cost (air pollutants / climate change) = A 22.00 24.82 18.3 20.65 15.80 17.94 15.78 17.9 18.27 20.74 15.8 18.06 22.08 24.91 21.09 23.71 18.21 20.66 18.2 20.57 15.84 17.97
Avoided Burdens (Energy Production) = B -0.08 -0.19 -0.36 -0.71 -0.73 -1.46 -0.34 -0.75 -0.78 -1.14 -0.58 -1.12 -0.04 -0.07 -0.26 -0.37 -0.49 -0.88 -0.16 -0.62 -0.24 -0.93
Disamenity = C 2.04 4.08 7.13 14.25 2.98 5.96 0.35 0.71 2.21 4.42 5.33 10.67 1.38 2.75 0.88 1.75 3.65 7.29 3.35 6.71 8.48 16.96
Net Externality (excl. disamenity, incl. displaced burdens from energy generation) = A+B 21.92 24.63 18 19.94 15.10 16.47 15.43 17.15 17.49 19.6 15.3 16.94 22.05 24.84 20.83 23.34 17.72 19.79 18.1 19.95 15.6 17.04
Net Externality (excl. disamenity, excl. displaced burdens from energy generation) = A 22.00 24.82 18.3 20.65 15.80 17.94 15.78 17.9 18.27 20.74 15.8 18.06 22.08 24.91 21.09 23.71 18.21 20.66 18.2 20.57 15.84 17.97
Net Externality (incl. disamenity, incl. displaced burdens from energy generation) = A+B+C 23.96 28.71 25.1 34.19 18.10 22.43 15.78 17.86 19.7 24.02 20.6 27.61 23.43 27.59 21.71 25.09 21.37 27.08 21.4 26.66 24.08 34
Net Externality (incl. disamenity, excl. displaced burdens from energy generation) = A+C-B 24.04 28.9 25.4 34.9 18.80 23.90 16.13 18.61 20.48 25.16 21.2 28.73 23.46 27.66 21.97 25.46 21.86 27.95 21.6 27.28 24.32 34.93
PO SP SW UK CYP CZ EST HUN POL SLO
Low High Low High Low High Low High Low High Low High Low High Low High Low High Low High
Net External Cost (air pollutants / climate change) = A 21.14 23.75 20.6 23.33 15.80 17.91 15.84 18.01 22.17 24.94 22.2 24.94 22.17 24.94 22.17 24.94 22.17 24.94 22.2 24.94
Avoided Burdens (Energy Production) = B -0.10 -0.26 -0.17 -0.35 -0.31 -0.72 -0.54 -1.07 -0.06 -0.12 -0.06 -0.12 -0.06 -0.12 -0.06 -0.12 -0.06 -0.12 -0.06 -0.12
Disamenity = C 1.85 3.71 1.27 2.54 0.56 1.13 5.21 10.42 1.254 2.508 2.03 4.053 0.52 1.039 1.661 3.322 1.935 3.87 1.5 3.008
Net Externality (excl. disamenity, incl. displaced burdens from energy generation) = A+B 21.04 23.49 20.5 22.99 15.50 17.19 15.30 16.94 22.11 24.82 22.1 24.82 22.11 24.82 22.11 24.82 22.11 24.82 22.1 24.82
Net Externality (excl. disamenity, excl. displaced burdens from energy generation) = A 21.14 23.75 20.6 23.33 15.80 17.91 15.84 18.01 22.17 24.94 22.2 24.94 22.17 24.94 22.17 24.94 22.17 24.94 22.2 24.94
Net Externality (incl. disamenity, incl. displaced burdens from energy generation) = A+B+C 22.89 27.2 21.7 25.53 16.00 18.32 20.51 27.36 23.36 27.32 24.1 28.87 22.63 25.86 23.77 28.14 24.04 28.69 23.6 27.82
Net Externality (incl. disamenity, excl. displaced burdens from energy generation) = A+C-B 22.99 27.46 21.9 25.87 16.40 19.04 21.05 28.43 23.42 27.45 24.2 28.99 22.69 25.98 23.83 28.26 24.1 28.81 23.7 27.95
Note: Low and High figures refer to the use of �sets� of low and high unit damage costs for the various pollutants under consideration. Positive numbers indicate externalbenefits of reducing landfilled material by one tonne of biowaste.

Economic Analysis of Options for Managing Biodegradable Municipal Waste � Final Report
Eunomia Research & Consulting, Scuola Agraria del Parco di Monza, HDRA Consultants, ZREU and LDK ECO on behalf of ECOTEC Research & Consulting 93
Table 23. Effects of Reducing Quantity of Biowaste Landfilled by One Tonne (€ / tonne, good practice in all countries)
3% Discount Rate AU BE DE FI FR GE GR IR IT LU NL
Low High Low High Low High Low High Low High Low High Low High Low High Low High Low High Low High
Net External Cost (air pollutants / climate change) = A 13.49 15.45 13.52 15.42 13.44 15.35 13.42 15.32 13.49 15.47 13.47 15.44 13.42 15.38 13.43 15.34 13.45 15.43 13.46 15.37 13.46 15.37
Avoided Burdens (Energy Production) = B -0.71 -1.69 -0.71 -1.43 -0.97 -1.95 -0.45 -1.00 -1.56 -2.27 -0.78 -1.49 -0.45 -0.84 -1.34 -1.91 -0.97 -1.75 -0.32 -1.23 -0.32 -1.23
Disamenity = C 2.04 4.08 7.13 14.25 2.98 5.96 0.35 0.71 2.21 4.42 5.33 10.67 1.38 2.75 0.88 1.75 3.65 7.29 3.35 6.71 8.48 16.96
Net Externality (excl. disamenity, incl. displaced burdens from energy generation) = A+B 12.78 13.77 12.80 13.99 12.46 13.40 12.96 14.32 11.93 13.20 12.69 13.95 12.97 14.53 12.09 13.43 12.48 13.67 13.14 14.14 13.14 14.14
Net Externality (excl. disamenity, excl. displaced burdens from energy generation) = A 13.49 15.45 13.52 15.42 13.44 15.35 13.42 15.32 13.49 15.47 13.47 15.44 13.42 15.38 13.43 15.34 13.45 15.43 13.46 15.37 13.46 15.37
Net Externality (incl. disamenity, incl. displaced burdens from energy generation) = A+B+C 14.82 17.85 19.93 28.24 15.44 19.36 13.31 15.03 14.14 17.62 18.02 24.62 14.35 17.28 12.97 15.18 16.13 20.96 16.49 20.85 21.62 31.10
Net Externality (incl. disamenity, excl. displaced burdens from energy generation) = A+C-B 15.53 19.53 20.65 29.67 16.42 21.31 13.77 16.03 15.70 19.89 18.80 26.11 14.80 18.13 14.31 17.09 17.10 22.72 16.81 22.08 21.94 32.33
PO SP SW UK CYP CZ EST HUN POL SLO
Low High Low High Low High Low High Low High Low High Low High Low High Low High Low High
Net External Cost (air pollutants / climate change) = A 13.46 15.36 13.45 15.41 13.43 15.33 13.46 13.46 15.39 13.46 15.39 13.46 15.39 13.46 15.39 13.46 15.39 13.46 15.39 15.39
Avoided Burdens (Energy Production) = B -0.52 -1.36 -0.71 -1.43 -0.41 -0.95 -0.71 -0.73 -1.47 -0.73 -1.47 -0.73 -1.47 -0.73 -1.47 -0.73 -1.47 -0.73 -1.47 -1.47
Disamenity = C 1.85 3.71 1.27 2.54 0.56 1.13 5.21 1.25 2.51 2.03 4.05 0.52 1.04 1.66 3.32 1.94 3.87 1.50 3.01 6.22
Net Externality (excl. disamenity, incl. displaced burdens from energy generation) = A+B 12.94 14.00 12.73 13.98 13.02 14.37 12.75 12.73 13.92 12.73 13.92 12.73 13.92 12.73 13.92 12.73 13.92 12.73 13.92 13.92
Net Externality (excl. disamenity, excl. displaced burdens from energy generation) = A 13.46 15.36 13.45 15.41 13.43 15.33 13.46 13.46 15.39 13.46 15.39 13.46 15.39 13.46 15.39 13.46 15.39 13.46 15.39 15.39
Net Externality (incl. disamenity, incl. displaced burdens from energy generation) = A+B+C 14.79 17.71 14.00 16.52 13.58 15.50 17.96 13.98 16.43 14.75 17.98 13.24 14.96 14.39 17.25 14.66 17.79 14.23 16.93 20.15
Net Externality (incl. disamenity, excl. displaced burdens from energy generation) = A+C-B 15.31 19.07 14.72 17.95 13.99 16.46 18.67 14.71 17.90 15.48 19.44 13.98 16.43 15.12 18.71 15.39 19.26 14.96 18.40 21.61
Note: Low and High figures refer to the use of �sets� of low and high unit damage costs for the various pollutants under consideration. Positive numbers indicate externalbenefits of reducing landfilled material by one tonne of biowaste.

Economic Analysis of Options for Managing Biodegradable Municipal Waste � Final Report
Eunomia Research & Consulting, Scuola Agraria del Parco di Monza, HDRA Consultants, ZREU and LDK ECO on behalf of ECOTEC Research & Consulting94
Table 24. Change in External Benefit From Reducing Landfilling of Biowaste by One Tonne Implied by Move to GoodPractice Landfilling (€/tonne)
3% Discount Rate AU BE DE FI FR GE GR IR IT LU NL
Low High Low High Low High Low High Low High Low High Low High Low High Low High Low High Low High
Net Externality (excl. disamenity, incl. displaced burdens from energy generation) = A+B -9.14 -10.86 -5.15 -5.95 -2.61 -3.08 -2.47 -2.83 -5.56 -6.41 -2.58 -3.00 -9.08 -10.31 -8.74 -9.91 -5.24 -6.11 -4.92 -5.81 -2.46 -2.91
Net Externality (excl. disamenity, excl. displaced burdens from energy generation) = A -8.51 -9.36 -4.80 -5.23 -2.37 -2.59 -2.36 -2.58 -4.78 -5.27 -2.38 -2.62 -8.66 -9.53 -7.65 -8.37 -4.75 -5.24 -4.76 -5.20 -2.38 -2.60
Net Externality (incl. disamenity, incl. displaced burdens from energy generation) = A+B+C -9.14 -10.86 -5.15 -5.95 -2.61 -3.08 -2.47 -2.83 -5.56 -6.41 -2.58 -3.00 -9.08 -10.31 -8.74 -9.91 -5.24 -6.11 -4.92 -5.81 -2.46 -2.91
Net Externality (incl. disamenity, excl. displaced burdens from energy generation) = A+C-B -8.51 -9.36 -4.80 -5.23 -2.37 -2.59 -2.36 -2.58 -4.78 -5.27 -2.38 -2.62 -8.66 -9.53 -7.65 -8.37 -4.75 -5.24 -4.76 -5.20 -2.38 -2.60
PO SP SW UK CYP CZ EST HUN POL SLO
Low High Low High Low High Low High Low High Low High Low High Low High Low High Low High
Net Externality (excl. disamenity, incl. displaced burdens from energy generation) = A+B -8.10 -9.49 -7.74 -9.01 -2.47 -2.82 -2.56 -2.97 -9.38 -10.89 -9.38 -10.89 -9.38 -10.89 -9.38 -10.89 -9.38 -10.89 -9.38 -10.89
Net Externality (excl. disamenity, excl. displaced burdens from energy generation) = A -7.68 -8.39 -7.20 -7.92 -2.36 -2.58 -2.38 -2.61 -8.71 -9.55 -8.71 -9.55 -8.71 -9.55 -8.71 -9.55 -8.71 -9.55 -8.71 -9.55
Net Externality (incl. disamenity, incl. displaced burdens from energy generation) = A+B+C -8.10 -9.49 -7.74 -9.01 -2.47 -2.82 -2.56 -2.97 -9.38 -10.89 -9.38 -10.89 -9.38 -10.89 -9.38 -10.89 -9.38 -10.89 -9.38 -10.89
Net Externality (incl. disamenity, excl. displaced burdens from energy generation) = A+C-B -7.68 -8.39 -7.20 -7.92 -2.36 -2.58 -2.38 -2.61 -8.71 -9.55 -8.71 -9.55 -8.71 -9.55 -8.71 -9.55 -8.71 -9.55 -8.71 -9.55

Economic Analysis of Options for Managing Biodegradable Municipal Waste � Final Report
Eunomia Research & Consulting, Scuola Agraria del Parco di Monza, HDRA Consultants, ZREU and LDK ECOon behalf of ECOTEC Research & Consulting
95
It is important to appreciate (with the total cost benefit analysis in mind) that somecountries operate policies which enable electricity generated from landfill gas to besold at a price above the prevailing market rate for electricity. This means that onemust be very careful in attributing environmental benefits to the energy generatedfrom landfills in the context of a full cost benefit analysis. To the extent that somecountries do offer subsidies, it can be argued that these benefits are alreadyinternalised in the subsidy regime so that they are reflected in private costs (see nextChapter).
Similarly, some countries have taxes on landfill in place. To the extent that thesereflect the external costs of landfilling, the taxes ought not to be considered in isolatonfrom the external cost analysis since this would imply double counting of theenvironmental costs of landfilling. Similar considerations apply with respect toincineration (see Section 4.3).
Lastly, for certain countries, the landfill option may become more or less irrelevant inyears to come. Several countries have, or intend to have, bans in place for landfillingof municipal waste, or specific fractions of municipal waste, or municipal waste whichhas not been pre-treated according to specific requirements.
44..33 RReessuullttss ffoorr IInncciinneerraattiioonn
Full details are given in Appendix 3. Table 25 shows which external costs are coveredand which are not in this analysis.
Table 25. External Costs of Incineration Covered In the Analysis
Category Covered Not CoveredAir Emissions SOx, NOx, CO2, N20, CO, VOCs,
dioxins, cadmium, chromium,lead, arsenic, particulates20
All other air emissions, including HCl, HF, mercuryetc.Exceedences of limit valuesConsistent �beyond Directive� performance
Emissions toWater
Assumed to be to some degree internalised through costs of waste water treatment (sonot explicitly covered)
Emissions toLand
Avoided external costs ofaggregates extractionassociated with use of bottomash in construction
Treatment / landfilling of fly-ashTreatment of bottom ash prior to utilisation
Other Disamenity Accidents (fires, etc.)Operator health issues (related to e.g. ashhandling)Primary resource extraction (related to water useand minerals used in flue gas treatment)Plant (construction) related externalities (includingthose related to district heating networks)On-site fuel useTransport of ash residues to final destinations
20 These were valued as PM10. Some studies use higher unit damage costs than for PM10 on the basis thatparticulates from incinerators are expected to be the sub-2.5 micron type, and these are believed to be moredamaging to human health.
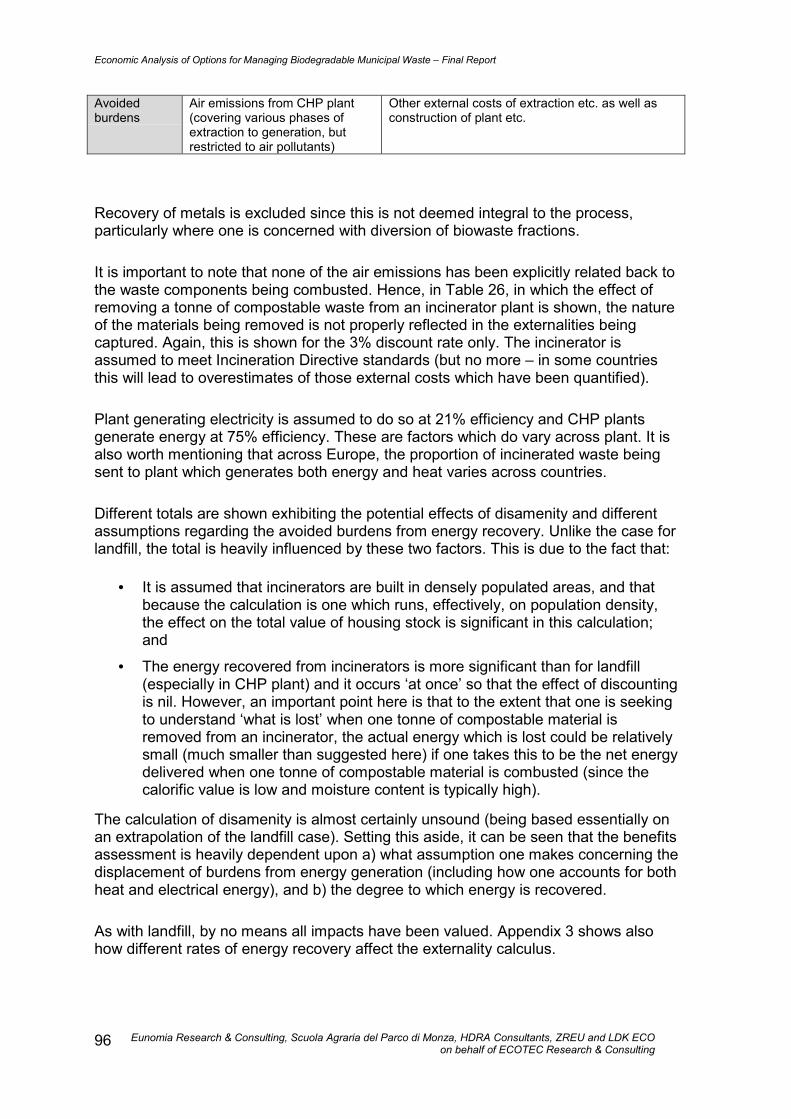
Economic Analysis of Options for Managing Biodegradable Municipal Waste � Final Report
Eunomia Research & Consulting, Scuola Agraria del Parco di Monza, HDRA Consultants, ZREU and LDK ECOon behalf of ECOTEC Research & Consulting
96
Avoidedburdens
Air emissions from CHP plant(covering various phases ofextraction to generation, butrestricted to air pollutants)
Other external costs of extraction etc. as well asconstruction of plant etc.
Recovery of metals is excluded since this is not deemed integral to the process,particularly where one is concerned with diversion of biowaste fractions.
It is important to note that none of the air emissions has been explicitly related back tothe waste components being combusted. Hence, in Table 26, in which the effect ofremoving a tonne of compostable waste from an incinerator plant is shown, the natureof the materials being removed is not properly reflected in the externalities beingcaptured. Again, this is shown for the 3% discount rate only. The incinerator isassumed to meet Incineration Directive standards (but no more � in some countriesthis will lead to overestimates of those external costs which have been quantified).
Plant generating electricity is assumed to do so at 21% efficiency and CHP plantsgenerate energy at 75% efficiency. These are factors which do vary across plant. It isalso worth mentioning that across Europe, the proportion of incinerated waste beingsent to plant which generates both energy and heat varies across countries.
Different totals are shown exhibiting the potential effects of disamenity and differentassumptions regarding the avoided burdens from energy recovery. Unlike the case forlandfill, the total is heavily influenced by these two factors. This is due to the fact that:
• It is assumed that incinerators are built in densely populated areas, and thatbecause the calculation is one which runs, effectively, on population density,the effect on the total value of housing stock is significant in this calculation;and
• The energy recovered from incinerators is more significant than for landfill(especially in CHP plant) and it occurs �at once� so that the effect of discountingis nil. However, an important point here is that to the extent that one is seekingto understand �what is lost� when one tonne of compostable material isremoved from an incinerator, the actual energy which is lost could be relativelysmall (much smaller than suggested here) if one takes this to be the net energydelivered when one tonne of compostable material is combusted (since thecalorific value is low and moisture content is typically high).
The calculation of disamenity is almost certainly unsound (being based essentially onan extrapolation of the landfill case). Setting this aside, it can be seen that the benefitsassessment is heavily dependent upon a) what assumption one makes concerning thedisplacement of burdens from energy generation (including how one accounts for bothheat and electrical energy), and b) the degree to which energy is recovered.
As with landfill, by no means all impacts have been valued. Appendix 3 shows alsohow different rates of energy recovery affect the externality calculus.

Economic Analysis of Options for Managing Biodegradable Municipal Waste � Final Report
Eunomia Research & Consulting, Scuola Agraria del Parco di Monza, HDRA Consultants, ZREU and LDK ECO on behalf of ECOTEC Research & Consulting 97
Table 26. Effects of Reducing Quantity of Biowaste Incinerated by One Tonne (€ / tonne)
Discount Rate 3% AU BE DE FI FR GE GR IR IT LU NL
Low High Low High Low High Low High Low High Low High Low High Low High Low High Low High Low High
Net Externality (air pollutants, climate change) = A 26.92 38.00 27.94 37.22 24.65 34.05 24.05 33.55 25.98 40.03 25.19 37.65 24.36 36.33 24.36 36.33 25.49 37.25 26.05 34.12 26.10 35.61
Avoided Burdens (Energy Production) Electricity only = B -4.08 -9.65 -4.08 -8.17 -5.57 -11.14 -2.60 -5.72 -8.91 -13.00 -4.46 -8.54 -2.60 -4.83 -2.60 -4.83 -5.57 -10.03 -1.86 -7.06 -1.86 -7.06
Avoided Burdens (Energy Production) CHP = C -9.34 -22.07 -9.34 -18.67 -12.73 -25.46 -5.94 -13.07 -20.37 -29.71 -10.19 -19.52 -5.94 -11.03 -5.94 -11.03 -12.73 -22.92 -4.24 -16.13 -4.24 -16.13
Disamenity = D 18.75 93.75 31.25 250.00 21.88 125.00 12.50 75.00 18.75 50.00 31.25 218.75 18.75 43.75 18.75 43.75 12.50 43.75 25.00 93.75 18.75 56.25
Net Externality (excl. disamenity, no displaced burdens from energy generation) = A 26.92 38.00 27.94 37.22 24.65 34.05 24.05 33.55 25.98 40.03 25.19 37.65 24.36 36.33 24.36 36.33 25.49 37.25 26.05 34.12 26.10 35.61
Net Externality (excl. disamenity, displaced burdens from energy generation, electricity only) = A+B 22.84 28.34 23.86 29.05 19.08 22.91 21.45 27.83 17.07 27.03 20.73 29.11 21.76 31.50 21.76 31.50 19.92 27.22 24.20 27.06 24.24 28.55
Net Externality (excl. disamenity, displaced burdens from energy generation, CHP) = A+C 17.58 15.93 18.61 18.55 11.92 8.59 18.11 20.47 5.61 10.32 15.01 18.13 18.42 25.30 18.42 25.30 12.76 14.33 21.81 17.99 21.86 19.48
Net Externality (incl. disamenity, no displaced burdens from energy generation) =A+D 45.67 131.75 59.19 287.22 46.53 159.05 36.55 108.55 44.73 90.03 56.44 256.40 43.11 80.08 43.11 80.08 37.99 81.00 51.05 127.87 44.85 91.86
Net Externality (incl. disamenity, displaced burdens from energy generation, electricity only) =A+B+D 41.59 122.09 55.11 279.05 40.96 147.91 33.95 102.83 35.82 77.03 51.98 247.86 40.51 75.25 40.51 75.25 32.42 70.97 49.20 120.81 42.99 84.80
Net Externality (incl. disamenity, displaced burdens from energy generation, CHP) = A+C+D 36.33 109.68 49.86 268.55 33.80 133.59 30.61 95.47 24.36 60.32 46.26 236.88 37.17 69.05 37.17 69.05 25.26 58.08 46.81 111.74 40.61 75.73
PO SP SW UK CYP CZ EST HUN POL SLO
Low High Low High Low High Low High Low High Low High Low High Low High Low High Low High
Net Externality (air pollutants, climate change) = A 25.31 35.44 25.06 37.06 24.45 33.95 25.70 36.81 25.48 36.72 25.49 37.21 25.51 37.78 25.50 37.40 25.51 37.73 25.48 36.95
Avoided Burdens (Energy Production) Electricity only = B -2.97 -7.80 -4.08 -8.17 -2.34 -5.46 -4.08 -8.17 -4.18 -8.38 -4.18 -8.38 -4.18 -8.38 -4.18 -8.38 -4.18 -8.38 -4.18 -8.38
Avoided Burdens (Energy Production) CHP = C -6.79 -17.82 -9.34 -18.67 -5.35 -12.48 -9.34 -18.67 -9.56 -19.15 -9.56 -19.15 -9.56 -19.15 -9.56 -19.15 -9.56 -19.15 -9.56 -19.15
Disamenity = D 9.38 15.63 25.00 156.25 18.75 50.00 31.25 218.75 12.50 43.75 18.75 93.75 12.50 31.25 18.75 93.75 18.75 93.75 12.50 12.50
Net Externality (excl. disamenity, no displaced burdens from energy generation) = A 25.31 35.44 25.06 37.06 24.45 33.95 25.70 36.81 25.48 36.72 25.49 37.21 25.51 37.78 25.50 37.40 25.51 37.73 25.48 36.95
Net Externality (excl. disamenity, displaced burdens from energy generation, electricity only) = A+B 22.34 27.64 20.97 28.89 22.11 28.49 21.61 28.64 21.29 28.34 21.31 28.83 21.33 29.40 21.31 29.02 21.32 29.35 21.30 28.57
Net Externality (excl. disamenity, displaced burdens from energy generation, CHP) = A+C 18.52 17.62 15.72 18.39 19.10 21.47 16.36 18.14 15.92 17.56 15.93 18.06 15.95 18.63 15.94 18.25 15.95 18.58 15.92 17.80
Net Externality (incl. disamenity, no displaced burdens from energy generation) =A+D 34.69 51.07 50.06 193.31 43.20 83.95 56.95 255.56 37.98 80.47 44.24 130.96 38.01 69.03 44.25 131.15 44.26 131.48 37.98 49.45
Net Externality (incl. disamenity, displaced burdens from energy generation, electricity only) =A+B+D 31.72 43.27 45.97 185.14 40.86 78.49 52.86 247.39 33.79 72.09 40.06 122.58 33.83 60.65 40.06 122.77 40.07 123.10 33.80 41.07
Net Externality (incl. disamenity, displaced burdens from energy generation, CHP) = A+C+D 27.90 33.24 40.72 174.64 37.85 71.47 47.61 236.89 28.42 61.31 34.68 111.81 28.45 49.88 34.69 112.00 34.70 112.33 28.42 30.30
Note: Low and High figures refer to the use of �sets� of low and high unit damage costs for the various pollutants under consideration. Positive figures indicate environmental benefitsof reducing biowaste incinerated by one tonne. CHP = combined heat and power.

Economic Analysis of Options for Managing Biodegradable Municipal Waste � Final Report
Eunomia Research & Consulting, Scuola Agraria del Parco di Monza, HDRA Consultants, ZREU and LDK ECOon behalf of ECOTEC Research & Consulting
98
44..44 RReessuullttss ffoorr CCoommppoossttiinngg
The analysis for composting incorporates a considerable amount of new material.Table 27 shows which external costs are covered and which are not in this analysis.
Table 27. External Costs of Composting Covered In the Analysis
Class of ExternalCost / Benefit
Covered Not Covered
Air Emissions CO2, N20, VOCsEmissions of CO2 followingcompost application
Other air emissions (most important ofwhich are ammonia and bioaerosols).
Emissions to Water It is assumed that excess water isused in the process
Emissions to Land Impacts from addition of heavy metalsRisks of animal infection throughpathogens (thought to be minimal whereprocesses are well-controlled)Full benefits of application of organicmatter to land (soil biodiversity etc.)
Other Energy used on-site Accidents (relating to e.g. process control)Disamenity (incl. odour etc.)Operator health issues (related to e.g.bioaerosols, ammonia)Plant (construction) related externalitiesTransport of compost to final marketBenefits from use of material forlandscaping
Avoided burdens External benefits from avoidedpesticide use (estimate)External costs of manufacture ofavoided fertiliser (air emissionsonly)Reduced phosphogypsum andprocess wastewater disposal fromphosphate fertiliser manufactureAvoided nitrous oxide emissionsfrom nitrate fertiliser applicationAvoided use of peat (air emissionsonly)
External costs from manufacture ofavoided pesticidesReduction in leaching of nitrate togroundwaterNon-air emission external costs ofmanufacture of fertiliser, extraction ofpeat.
The avoided burdens, to the extent that they have been quantified, have been relatedto a �typical� marketing mix for compost products. The analysis is described in moredetail in Appendix 4. The results of the benefits analysis are shown in Table 28. Again,these are shown only for the 3% discount rate.

Economic Analysis of Options for Managing Biodegradable Municipal Waste � Final Report
Eunomia Research & Consulting, Scuola Agraria del Parco di Monza, HDRA Consultants, ZREU and LDK ECO on behalf of ECOTEC Research & Consulting 99
Table 28. External Costs and Benefits of Composting (€ / tonne)
AU BE DE FI FR GE GR IR IT LUX NL
Low High Low High Low High Low High Low High Low High Low High Low High Low High Low High Low High
Greenhouse Gases
Carbon Dioxide (process) = A -8.56 -9.01 -8.56 -9.01 -8.56 -9.01 -8.56 -9.01 -8.56 -9.01 -8.56 -9.01 -8.56 -9.01 -8.56 -9.01 -8.56 -9.01 -8.56 -9.01 -8.56 -9.01
Carbon Dioxide (post application) = B -2.30 -2.42 -2.30 -2.42 -2.30 -2.42 -2.30 -2.42 -2.99 -3.14 -2.30 -2.42 -3.13 -3.30 -2.30 -2.42 -3.13 -3.30 -2.30 -2.42 -2.30 -2.42
Methane = C -0.44 -0.48 -0.44 -0.48 -0.44 -0.48 -0.44 -0.48 -0.44 -0.48 -0.44 -0.48 -0.44 -0.48 -0.44 -0.48 -0.44 -0.48 -0.44 -0.48 -0.44 -0.48
Nitrous Oxide = D -0.09 -0.16 -0.09 -0.16 -0.09 -0.16 -0.09 -0.16 -0.09 -0.16 -0.09 -0.16 -0.09 -0.16 -0.09 -0.16 -0.09 -0.16 -0.09 -0.16 -0.09 -0.16
Other Air Emissions = E -0.02 -0.08 -0.02 -0.08 -0.02 -0.08 -0.02 -0.07 -0.02 -0.07 -0.02 -0.08 -0.01 -0.05 -0.02 -0.08 -0.02 -0.07 -0.03 -0.13 -0.02 -0.08
Energy Use = F -0.62 -1.47 -0.62 -1.25 -0.85 -1.70 -0.40 -0.87 -1.36 -1.98 -0.68 -1.30 -0.40 -0.74 -1.17 -1.67 -0.85 -1.53 -0.28 -1.08 -0.28 -1.08
Fuel Emissions = G -0.57 -0.95 -0.70 -0.76 -0.28 -0.38 -0.18 -0.23 -0.59 -1.07 -0.57 -0.87 -0.20 -0.53 -0.26 -0.33 -0.36 -0.80 -0.42 -0.49 -0.42 -0.49
Total External Costs = A+B+C+D+E+F+G = H -12.61 -14.57 -12.74 -14.16 -12.55 -14.24 -11.99 -13.25 -14.05 -15.92 -12.67 -14.32 -12.83 -14.25 -12.85 -14.14 -13.46 -15.34 -12.13 -13.76 -12.12 -13.72
External Benefits from Nutrient Displacement = I 0.13 1.66 0.13 1.66 0.13 1.64 0.12 1.63 0.13 1.73 0.13 1.66 0.13 1.73 0.13 1.64 0.13 1.74 0.13 1.64 0.13 1.64
External Benefits from Pesticide Reduction = J 0.17 0.26 0.59 0.89 0.07 0.11 0.05 0.08 0.24 0.36 0.11 0.17 0.19 0.28 0.70 1.05 0.40 0.60 0.19 0.28 0.58 0.87
External Benefits from avoided nitrous oxide emissions = K 0.03 0.58 0.03 0.58 0.03 0.58 0.03 0.58 0.04 0.62 0.03 0.58 0.04 0.65 0.03 0.58 0.04 0.65 0.03 0.58 0.03 0.58
External Benefits from avoided process wastewater disposal =L 0.01 0.03 0.01 0.03 0.01 0.03 0.01 0.03 0.01 0.03 0.01 0.03 0.01 0.03 0.01 0.03 0.01 0.03 0.01 0.03 0.01 0.03
External Benefits from avoided peat extraction = M 0.43 0.57 0.47 0.52 0.33 0.39 0.30 0.34 0.42 0.64 0.43 0.55 0.31 0.43 0.32 0.37 0.36 0.52 0.38 0.43 0.38 0.43
Net Externality = H+I+J+K+L+M = N -11.84 -11.46 -11.50 -10.49 -11.97 -11.49 -11.47 -10.59 -13.20 -12.54 -11.95 -11.34 -12.16 -11.13 -11.65 -10.47 -12.52 -11.80 -11.39 -10.79 -10.99 -10.16
Net Externality (no CO2) =N - A -3.28 -2.45 -2.94 -1.47 -3.41 -2.48 -2.91 -1.58 -4.64 -3.52 -3.39 -2.32 -3.60 -2.12 -3.09 -1.46 -3.95 -2.79 -2.83 -1.78 -2.42 -1.15
Memorandum Items
Private savings from avoided fertiliser use 0.76 1.91 0.76 1.91 0.76 1.91 0.76 1.91 0.77 1.93 0.76 1.91 0.77 1.93 0.76 1.91 0.77 1.93 0.76 1.91 0.76 1.91
Private savings from avoided pesticide use 0.43 0.43 1.48 1.48 0.19 0.19 0.13 0.13 0.60 0.60 0.28 0.28 0.47 0.47 1.75 1.75 1.00 1.00 0.47 0.47 1.45 1.45
Note: Low and High figures refer to the use of �sets� of low and high unit damage costs for the various pollutants under consideration. Positive figures indicate externalbenefits from composting

Economic Analysis of Options for Managing Biodegradable Municipal Waste � Final Report
Eunomia Research & Consulting, Scuola Agraria del Parco di Monza, HDRA Consultants, ZREU and LDK ECO on behalf of ECOTEC Research & Consulting100
PO SP SW UK CYP CZ EST HUN POL SLO
Low High Low High Low High Low High Low High Low High Low High Low High Low High Low High
Greenhouse Gases
Carbon Dioxide (process) = A -8.56 -9.01 -8.56 -9.01 -8.56 -9.01 -8.56 -9.01 -8.56 -9.01 -8.56 -9.01 -8.56 -9.01 -8.56 -9.01 -8.56 -9.01 -8.56 -9.01
Carbon Dioxide (post application) = B -3.13 -3.30 -3.13 -3.30 -2.30 -2.42 -2.30 -2.42 -2.30 -2.42 -2.30 -2.42 -2.30 -2.42 -3.13 -3.30 -2.30 -2.42 -3.13 -3.30
Methane = C -0.44 -0.48 -0.44 -0.48 -0.44 -0.48 -0.44 -0.48 -0.44 -0.48 -0.44 -0.48 -0.44 -0.48 -0.44 -0.48 -0.44 -0.48 -0.44 -0.48
Nitrous Oxide = D -0.09 -0.16 -0.09 -0.16 -0.09 -0.16 -0.09 -0.16 -0.09 -0.16 -0.09 -0.16 -0.09 -0.16 -0.09 -0.16 -0.09 -0.16 -0.09 -0.16
Other Air Emissions = E 0.00 0.00 0.00 0.00 0.00 0.00 0.00 0.00 -0.02 -0.08 -0.02 -0.08 -0.02 -0.08 -0.01 -0.05 0.00 0.00 0.00 0.00
Energy Use = F -0.45 -1.19 -0.62 -1.25 -0.36 -0.83 -0.62 -1.25 -0.64 -1.28 -0.64 -1.28 -0.64 -1.28 -0.64 -1.28 -0.64 -1.28 -0.64 -1.28
Fuel Emissions = G -0.40 -0.46 -0.35 -0.72 -0.23 -0.28 -0.41 -0.65 -0.40 -0.60 -0.40 -0.60 -0.40 -0.60 -0.40 -0.60 -0.40 -0.60 -0.40 -0.60
Total External Costs = A+B+C+D+E+F+G = H -13.08 -14.59 -13.19 -14.91 -11.98 -13.18 -12.43 -13.96 -12.45 -14.03 -12.45 -14.03 -12.45 -14.03 -13.27 -14.87 -12.43 -13.95 -13.26 -14.82
External Benefits from Nutrient Displacement = I 0.13 1.72 0.13 1.74 0.12 1.63 0.13 1.65 0.13 1.65 0.13 1.65 0.13 1.65 0.13 1.73 0.13 1.65 0.13 1.73
External Benefits from Pesticide Reduction = J 0.26 0.39 0.10 0.15 0.05 0.08 0.28 0.41 0.59 0.89 0.59 0.89 0.07 0.11 0.19 0.28 0.58 0.87 0.26 0.39
External Benefits from avoided nitrous oxide emissions = K 0.04 0.65 0.04 0.65 0.03 0.58 0.03 0.58 0.03 0.58 0.03 0.58 0.03 0.58 0.04 0.65 0.03 0.58 0.04 0.65
External Benefits from avoided process wastewater disposal =L 0.01 0.03 0.01 0.03 0.01 0.03 0.01 0.03 0.01 0.03 0.01 0.03 0.01 0.03 0.01 0.03 0.01 0.03 0.01 0.03
External Benefits from avoided peat extraction = M 0.37 0.41 0.35 0.50 0.32 0.36 0.37 0.48 0.37 0.46 0.37 0.46 0.37 0.46 0.37 0.46 0.37 0.46 0.37 0.46
Net Externality = H+I+J+K+L+M = N -12.27 -11.39 -12.56 -11.84 -11.45 -10.51 -11.61 -10.80 -11.32 -10.42 -11.32 -10.42 -11.84 -11.20 -12.53 -11.71 -11.31 -10.36 -12.45 -11.56
Net Externality (no CO2) =N � A -3.71 -2.38 -4.00 -2.83 -2.89 -1.49 -3.05 -1.79 -2.76 -1.41 -2.76 -1.41 -3.27 -2.19 -3.97 -2.70 -2.75 -1.35 -3.89 -2.55
Memorandum Items
Private savings from avoided fertiliser use 0.77 1.93 0.77 1.93 0.76 1.91 0.76 1.91 0.76 1.91 0.76 1.91 0.76 1.91 0.77 1.93 0.76 1.91 0.77 1.93
Private savings from avoided pesticide use 0.64 0.64 0.25 0.25 0.13 0.13 0.69 0.69 1.48 1.48 1.48 1.48 0.19 0.19 0.47 0.47 1.45 1.45 0.64 0.64
Note: Low and High figures refer to the use of �sets� of low and high unit damage costs for the various pollutants under consideration. Positive figures indicate externalbenefits from composting

Economic Analysis of Options for Managing Biodegradable Municipal Waste � Final Report
Eunomia Research & Consulting, Scuola Agraria del Parco di Monza, HDRA Consultants, ZREU and LDK ECOon behalf of ECOTEC Research & Consulting
101
There is no basis for estimating disamenity from compost plants. By far the mostimportant contributor to the external costs of composting (such as they have beenvalued) are those associated with carbon dioxide emissions. It should be noted that insome studies, the carbon dioxide emissions from the biogenic fractions of waste areomitted. If this were the case in this study, the analysis of costs and benefits wouldappear to indicate that of all processes, composting is a relatively benign one.
However, this statement has to be conditioned by appreciation of the fact that not alleffects have been modelled. So, negative impacts, such as those of bioaerosols, havenot been captured, but equally, whilst attempts have been made to capture some ofthe benefits associated with the application of compost, probably the most significantone, and the one which most closely resonates with �strong sustainability� arguments �the return of organic matter to the soil � has been captured only �by proxy�. Anotherargument in favour of composting may be that the process, being relatively benign, isless likely to give rise to major accidents. This cannot be said of either landfill orincineration.
Some of the benefits from compost utilisation are highly uncertain. A considerabledeal of research needs to be undertaken before a clear picture of the costs andbenefits of compost application can emerge. At the simple level, this is a process ofmaintaining / building up soil organic carbon levels. The levels of application whichhave typically been assumed are not especially high since raising application rates islikely to generate potential negative effects owing to the application of higherquantities of heavy metals to the soil. This illustrates the point that the apparentlysimple process of applying compost to soil masks a much more complex interactionbetween soil chemistry and biological activity which is still rather poorly understood(though the state of knowledge clearly increases with time).
44..55 RReessuullttss ffoorr AAnnaaeerroobbiicc DDiiggeessttiioonn
Some of the analysis concerning anaerobic digestion (AD) is similar to that carried outfor composting. However, emissions are, of course, different, whilst the process alsogenerates energy. Table 29 shows the degree to which external costs and benefitsare covered (or not) in this study.
Results for the 3% discount rate case are shown in Table 30 below. The full ADanalysis is given in Appendix 5. The comparison with composting shows somereduction in the net external costs relative to composting where one assumes that theenergy generated displaces alternative fuels. However, the effects of this are not somarked as with incineration since the energy recovered is typically not so great. Itshould be borne in mind, however, that the issue of how much energy is generatedfrom incineration of biowastes needs closer analysis than has been possible in thisstudy. A more complex modelling exercise might show that the net energy generatedfrom combusting these wastes would be rather small (see Section 4.3 above).Otherwise, the analysis is similar. There is a suggestion (from the externalitiesassociated with methane and carbon dioxide) that the mass balance in the anaerobicdigestion module may need adjustment in line with the assumptions here concerningthe methane generated for subsequent combustion and the resultant mass of compostapplied to the soil.
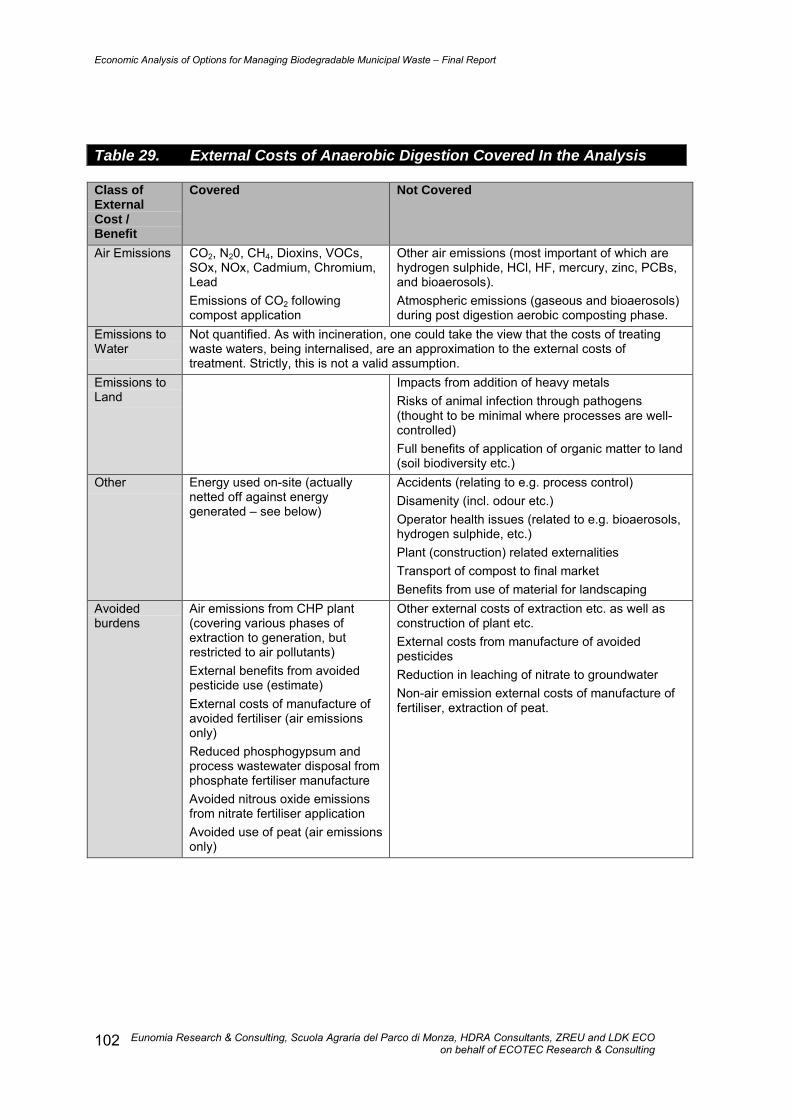
Economic Analysis of Options for Managing Biodegradable Municipal Waste � Final Report
Eunomia Research & Consulting, Scuola Agraria del Parco di Monza, HDRA Consultants, ZREU and LDK ECOon behalf of ECOTEC Research & Consulting
102
Table 29. External Costs of Anaerobic Digestion Covered In the Analysis
Class ofExternalCost /Benefit
Covered Not Covered
Air Emissions CO2, N20, CH4, Dioxins, VOCs,SOx, NOx, Cadmium, Chromium,LeadEmissions of CO2 followingcompost application
Other air emissions (most important of which arehydrogen sulphide, HCl, HF, mercury, zinc, PCBs,and bioaerosols).Atmospheric emissions (gaseous and bioaerosols)during post digestion aerobic composting phase.
Emissions toWater
Not quantified. As with incineration, one could take the view that the costs of treatingwaste waters, being internalised, are an approximation to the external costs oftreatment. Strictly, this is not a valid assumption.
Emissions toLand
Impacts from addition of heavy metalsRisks of animal infection through pathogens(thought to be minimal where processes are well-controlled)Full benefits of application of organic matter to land(soil biodiversity etc.)
Other Energy used on-site (actuallynetted off against energygenerated � see below)
Accidents (relating to e.g. process control)Disamenity (incl. odour etc.)Operator health issues (related to e.g. bioaerosols,hydrogen sulphide, etc.)Plant (construction) related externalitiesTransport of compost to final marketBenefits from use of material for landscaping
Avoidedburdens
Air emissions from CHP plant(covering various phases ofextraction to generation, butrestricted to air pollutants)External benefits from avoidedpesticide use (estimate)External costs of manufacture ofavoided fertiliser (air emissionsonly)Reduced phosphogypsum andprocess wastewater disposal fromphosphate fertiliser manufactureAvoided nitrous oxide emissionsfrom nitrate fertiliser applicationAvoided use of peat (air emissionsonly)
Other external costs of extraction etc. as well asconstruction of plant etc.External costs from manufacture of avoidedpesticidesReduction in leaching of nitrate to groundwaterNon-air emission external costs of manufacture offertiliser, extraction of peat.

Economic Analysis of Options for Managing Biodegradable Municipal Waste � Final Report
Eunomia Research & Consulting, Scuola Agraria del Parco di Monza, HDRA Consultants, ZREU and LDK ECO on behalf of ECOTEC Research & Consulting 103
Table 30. External Costs and Benefits of Anaerobic Digestion (€ / tonne)
AU BE DE FI FR GE GR IR IT LUX NL
Low High Low High Low High Low High Low High Low High Low High Low High Low High Low High Low High
Greenhouse Gases
Carbon Dioxide (process) = A -9.78 -10.30 -9.78 -10.30 -9.78 -10.30 -9.78 -10.30 -9.78 -10.30 -9.78 -10.30 -9.78 -10.30 -9.78 -10.30 -9.78 -10.30 -9.78 -10.30 -9.78 -10.30
Carbon Dioxide (post application) = B -2.30 -2.42 -2.30 -2.42 -2.30 -2.42 -2.30 -2.42 -2.99 -3.14 -2.30 -2.42 -3.13 -3.30 -2.30 -2.42 -3.13 -3.30 -2.30 -2.42 -2.30 -2.42
Methane = C 0.00 0.00 0.00 0.00 0.00 0.00 0.00 0.00 0.00 0.00 0.00 0.00 0.00 0.00 0.00 0.00 0.00 0.00 0.00 0.00 0.00 0.00
Nitrous Oxide = D 0.00 -0.71 0.00 -0.71 0.00 -0.71 0.00 -0.71 0.00 -0.71 0.00 -0.71 0.00 -0.71 0.00 -0.71 0.00 -0.71 0.00 -0.71 0.00 -0.71
Other Air Emissions = E -0.13 -0.22 -0.16 -0.17 -0.06 -0.07 -0.03 -0.03 -0.14 -0.23 -0.13 -0.20 -0.03 -0.11 -0.05 -0.06 -0.08 -0.18 -0.09 -0.10 -0.09 -0.10
Avoided Burdens (Energy Production) Electricity only = F 1.01 5.18 1.01 4.39 1.38 5.98 0.64 3.07 2.20 6.98 1.10 4.59 0.64 2.59 1.89 5.86 1.38 5.38 0.46 3.79 0.46 3.79
Avoided Burdens (Energy Production) CHP = G 1.45 7.44 1.45 6.29 1.97 8.58 0.92 4.40 3.15 10.01 1.58 6.58 0.92 3.72 2.71 8.41 1.97 7.72 0.66 5.43 0.66 5.43
Total external costs, no displaced burdens = A+B+C+D+E = H -12.21 -13.65 -12.24 -13.60 -12.14 -13.50 -12.11 -13.46 -12.91 -14.38 -12.21 -13.63 -12.95 -14.42 -12.13 -13.49 -12.99 -14.48 -12.17 -13.52 -12.17 -13.52
Total external costs, displaced burdens from electricity = A+B+C+D+E+F =I -11.20 -8.47 -11.23 -9.21 -10.76 -7.52 -11.47 -10.39 -10.71 -7.41 -11.11 -9.04 -12.30 -11.82 -10.24 -7.63 -11.61 -9.10 -11.71 -9.74 -11.71 -9.74
Total external costs, displaced energy from CHP = A+B+C+D+E+G = J -10.77 -6.21 -10.80 -7.31 -10.17 -4.92 -11.19 -9.06 -9.76 -4.37 -10.64 -7.05 -12.03 -10.70 -9.42 -5.08 -11.02 -6.76 -11.51 -8.09 -11.51 -8.09
External Benefits from Nutrient Displacement = K 0.11 1.59 0.11 1.59 0.11 1.58 0.11 1.58 0.12 1.65 0.11 1.59 0.12 1.66 0.11 1.58 0.12 1.67 0.11 1.58 0.11 1.58
External Benefits from Pesticide Reduction = L 0.17 0.26 0.59 0.89 0.07 0.11 0.05 0.08 0.24 0.36 0.11 0.17 0.19 0.28 0.70 1.05 0.40 0.60 0.19 0.28 0.58 0.87
External Benefits from avoided nitrous oxide emissions = M 0.03 0.58 0.03 0.58 0.03 0.58 0.03 0.58 0.04 0.62 0.03 0.58 0.04 0.65 0.03 0.58 0.04 0.65 0.03 0.58 0.03 0.58
External Benefits from avoided process wastewater disposal = N 0.01 0.02 0.01 0.02 0.01 0.02 0.01 0.02 0.01 0.02 0.01 0.02 0.01 0.02 0.01 0.02 0.01 0.02 0.01 0.02 0.01 0.02
External Benefits from avoided peat extraction = O 0.43 0.57 0.47 0.52 0.33 0.39 0.30 0.34 0.42 0.64 0.43 0.55 0.31 0.43 0.32 0.37 0.36 0.52 0.38 0.43 0.38 0.43
Total external costs, no displaced burdens = H+K+L+M+N+O -11.46 -10.63 -11.02 -10.00 -11.58 -10.82 -11.61 -10.87 -12.09 -11.10 -11.52 -10.72 -12.29 -11.37 -10.96 -9.88 -12.07 -11.02 -11.45 -10.63 -11.06 -10.04
Total external costs, displaced burdens from electricity = I+K+L+M+N+O -10.45 -5.44 -10.01 -5.62 -10.21 -4.84 -10.97 -7.80 -9.89 -4.12 -10.42 -6.14 -11.65 -8.77 -9.06 -4.02 -10.70 -5.64 -10.99 -6.84 -10.60 -6.26
Total external costs, displaced energy from CHP = J+K+L+M+N+O -10.01 -3.191 -9.579 -3.71 -9.611 -2.241 -10.69 -6.464 -8.935 -1.086 -9.944 -4.145 -11.37 -7.648 -8.24 -1.48 -10.1 -3.3 -10.8 -5.19 -10.4 -4.61
Memorandum Items
Private savings from avoided fertiliser use 0.572 1.43 0.572 1.43 0.572 1.43 0.572 1.43 0.577 1.442 0.572 1.43 0.578 1.446 0.572 1.43 0.578 1.446 0.572 1.43 0.572 1.43
Private savings from avoided pesticide use 0.43 0.43 1.48 1.48 0.187 0.187 0.127 0.127 0.6 0.6 0.278 0.278 0.472 0.472 1.75 1.75 0.996 0.996 0.469 0.469 1.446 1.446

Economic Analysis of Options for Managing Biodegradable Municipal Waste � Final Report
Eunomia Research & Consulting, Scuola Agraria del Parco di Monza, HDRA Consultants, ZREU and LDK ECO on behalf of ECOTEC Research & Consulting104
PO SP SW UK CYP CZ EST HUN POL SLO
Low High Low High Low High Low High Low High Low High Low High Low High Low High Low High
Greenhouse Gases
Carbon Dioxide (process) = A -9.78 -10.30 -9.78 -10.30 -9.78 -10.30 -9.78 -10.30 -9.78 -10.30 -9.78 -10.30 -9.78 -10.30 -9.78 -10.30 -9.78 -10.30 -9.78 -10.30
Carbon Dioxide (post application) = B -3.13 -3.30 -3.13 -3.30 -2.30 -2.42 -2.30 -2.42 -2.30 -2.42 -2.30 -2.42 -2.30 -2.42 -3.13 -3.30 -2.30 -2.42 -3.13 -3.30
Methane = C 0.00 0.00 0.00 0.00 0.00 0.00 0.00 0.00 0.00 0.00 0.00 0.00 0.00 0.00 0.00 0.00 0.00 0.00 0.00 0.00
Nitrous Oxide = D 0.00 -0.71 0.00 -0.71 0.00 -0.71 0.00 -0.71 0.00 -0.71 0.00 -0.71 0.00 -0.71 0.00 -0.71 0.00 -0.71 0.00 -0.71
Other Air Emissions = E -0.09 -0.09 -0.07 -0.16 -0.04 -0.05 -0.09 -0.14 -0.08 -0.13 -0.08 -0.13 -0.08 -0.13 -0.08 -0.13 -0.08 -0.13 -0.08 -0.13
Avoided Burdens (Energy Production) Electricity only = F 0.73 4.19 1.01 4.39 0.58 2.93 1.01 4.39 1.03 4.50 1.03 4.50 1.03 4.50 1.03 4.50 1.03 4.50 1.03 4.50
Avoided Burdens (Energy Production) CHP = G 1.05 6.01 1.45 6.29 0.83 4.20 1.45 6.29 1.48 6.45 1.48 6.45 1.48 6.45 1.48 6.45 1.48 6.45 1.48 6.45
Total external costs, no displaced burdens = A+B+C+D+E = H -13.00 -14.40 -12.99 -14.46 -12.13 -13.47 -12.17 -13.57 -12.17 -13.56 -12.17 -13.56 -12.17 -13.56 -13.00 -14.43 -12.17 -13.56 -13.00 -14.43
Total external costs, displaced burdens from electricity = A+B+C+D+E+F = I -12.27 -10.21 -11.98 -10.08 -11.55 -10.54 -11.16 -9.18 -11.14 -9.06 -11.14 -9.06 -11.14 -9.06 -11.96 -9.93 -11.14 -9.06 -11.96 -9.93
Total external costs, displaced energy from CHP = A+B+C+D+E+G = J -11.95 -8.39 -11.54 -8.17 -11.30 -9.27 -10.73 -7.27 -10.69 -7.10 -10.69 -7.10 -10.69 -7.10 -11.52 -7.98 -10.69 -7.10 -11.52 -7.97
External Benefits from Nutrient Displacement = K 0.12 1.66 0.12 1.67 0.11 1.58 0.11 1.59 0.11 1.58 0.11 1.58 0.11 1.58 0.12 1.67 0.11 1.58 0.12 1.67
External Benefits from Pesticide Reduction = L 0.26 0.39 0.10 0.15 0.05 0.08 0.28 0.41 0.59 0.89 0.59 0.89 0.07 0.11 0.19 0.28 0.58 0.87 0.26 0.39
External Benefits from avoided nitrous oxide emissions = M 0.04 0.65 0.04 0.65 0.03 0.58 0.03 0.58 0.03 0.58 0.03 0.58 0.03 0.58 0.04 0.65 0.03 0.58 0.04 0.65
External Benefits from avoided process wastewater disposal = N 0.01 0.02 0.01 0.02 0.01 0.02 0.01 0.02 0.01 0.02 0.01 0.02 0.01 0.02 0.01 0.02 0.01 0.02 0.01 0.02
External Benefits from avoided peat extraction = O 0.37 0.41 0.35 0.50 0.32 0.36 0.37 0.48 0.37 0.46 0.37 0.46 0.37 0.46 0.37 0.46 0.37 0.46 0.37 0.46
Total external costs, no displaced burdens = H+K+L+M+N+O -12.21 -11.27 -12.38 -11.48 -11.61 -10.87 -11.37 -10.48 -11.05 -10.02 -11.05 -10.02 -11.57 -10.80 -12.28 -11.35 -11.07 -10.04 -12.21 -11.25
Total external costs, displaced burdens from electricity = I+K+L+M+N+O -11.48 -7.08 -11.37 -7.09 -11.03 -7.93 -10.36 -6.10 -10.02 -5.52 -10.02 -5.52 -10.54 -6.30 -11.24 -6.85 -10.03 -5.54 -11.18 -6.75
Total external costs, displaced energy from CHP = J+K+L+M+N+O -11.16 -5.263 -10.93 -5.185 -10.78 -6.661 -9.926 -4.19 -9.575 -3.566 -9.575 -3.566 -10.09 -4.341 -10.8 -4.89 -9.59 -3.59 -10.7 -4.79
Memorandum Items
Private savings from avoided fertiliser use 0.578 1.446 0.578 1.446 0.572 1.43 0.572 1.43 0.572 1.43 0.572 1.43 0.572 1.43 0.578 1.446 0.572 1.43 0.578 1.446
Private savings from avoided pesticide use 0.642 0.642 0.246 0.246 0.125 0.125 0.689 0.689 1.48 1.48 1.48 1.48 0.187 0.187 0.472 0.472 1.446 1.446 0.642 0.642
Note: Low and High figures refer to the use of �sets� of low and high unit damage costs for the various pollutants under consideration. Positive figures indicate externalbenefits from composting.

Economic Analysis of Options for Managing Biodegradable Municipal Waste � Final Report
Eunomia Research & Consulting, Scuola Agraria del Parco di Monza, HDRA Consultants, ZREU and LDK ECOon behalf of ECOTEC Research & Consulting
105
This argument is given greater force when one considers that very few datasets foranaerobic digestion report the emissions to the atmosphere during the post-digestionaerobic composting phase (where this takes place). Not only would one expect furthermethane to be emitted from the residual anaerobic processes, but carbon dioxidewould also be emitted from the aerobic process. As such, the resultant mass ofcompost applied to land might be expected to be somewhat less than has beenassumed here. That having been said, this affects the attribution of benefits which are,by and large, relatively small (so reducing the quantity of biomass assumed to beapplied to land to say 300kg per tonne of biowaste would not affect the resultsappreciably).
County-to-country variation mostly reflects the assumptions made concerning externalcosts of energy being displaced. Where this assumption is implied, and where thedisplaced source has a relatively high external cost, the net externality is lowest.
44..66 NNoottee oonn TTrraannssppoorrtt EExxtteerrnnaalliittiieess
In this study, the principal issue of interest is the effect of the switch from one wastemanagement system to another. As such, one is interested in the changes in transportexternalities incurred by switching waste management systems.
In a number of studies concerning the environmental impacts of waste management,the approach has been to specify transport routes and modes that are inextricablylinked to one or other waste management system (e.g., Coppers & Lybrand et al1997; Broome et al 2000; CSERGE et al 1993; AEA 2001). The rather obvious pointto be made is that these distances vary enormously from one situation to another, somuch so that the distances themselves may be important in determining the treatmentoptions pursued.
In studies which have looked at the transport costs incurred in the collection of organicwastes, some studies have assumed that the bulk of waste is delivered to civicamenity sites. This was the assumption used by Coopers and Lybrand and CSERGE(1997) in an earlier study for the Commission. Furthermore, such studies haveassumed (implicitly or explicitly) that the journey is made specifically for that purpose.This effectively denies the potential of the very changes being examined. This is not tosay that such materials might not continue to be delivered to Civic Amenity sites /containerparks / recycling centres. However, to the extent that such materials are notalways composted in all countries, it is quite clear that similar transport externalitiesshould be attributed to the landfilling / incineration of materials collected in the sameway (on a proportionate basis) to reflect the role of Civic Amenity sites (and othersimilar facilities) in the collection of waste materials.
44..66..11 EExxtteerrnnaall CCoossttss ooff SSeeppaarraattee CCoolllleeccttiioonn ooff GGaarrddeenn WWaasstteess
In this study, the delivery of garden wastes to Civic Amenity sites / containerparks tosome extent constitutes the baseline in a �no separate collection� scenario. Of course,many countries, among them Germany, Austria, Flanders (Belgium), Denmark and theNetherlands are already collecting a significant proportion (estimates as high as 90%in Denmark) of all garden wastes through this route for composting. But in those

Economic Analysis of Options for Managing Biodegradable Municipal Waste � Final Report
Eunomia Research & Consulting, Scuola Agraria del Parco di Monza, HDRA Consultants, ZREU and LDK ECOon behalf of ECOTEC Research & Consulting
106
countries where such material is not currently composted, the net transportexternalities incurred by the decision to collect such materials separately forcomposting are zero, at least in terms of the collection side (since the materials arebeing delivered there anyway � all that is changing is that those making deliveries arebeing given the opportunity to put materials in containers specifically for garden wasteas opposed to ones for mixed waste. Furthermore, disposal costs are being avoided).
For those materials which are separately collected at Civic Amenity sites /containerparks / recycling centres where they were not previously, the net effect ontransport externalities arises through consideration of the change in the external costsof the delivery route to the treatment facility. This reduces to a question as to whethera compost facility is likely to be closer to, or further away from the Civic Amenity site,than the �counterfactual� treatment facility.21
One could manufacture arguments as to why the distance is likely to be greater orsmaller, but the fact of the matter is that no one can say without examination of thespecific situation. The most plausible argument might be that since capacities ofcompost plants are typically lower than for mass-burn incinerators and landfills, themore �decentralised� nature of the compost facilities might be more likely to reduce thetransport externalities than to increase them. On the other hand, the potential forsmaller thermal treatment plants to penetrate the market (which is not known atpresent) might alter this perspective. Furthermore, mass-burn facilities can deal withall wastes, whilst compost plants deal with specific fractions.
The matter is further complicated by the issue of residuals. All plant other than landfillswill tend to generate residual materials which require treatment off-site. For compost,this will be rejected materials which might typically be sent to landfill. For incinerators,the fly-ash will require disposal to hazardous waste landfill with bottom ash potentiallyused in construction. Again, the distances involved are amenable only to guesswork,and in some countries, they may change with the end to co-disposal required by theLandfill Directive. It makes little sense to make such guesses here.
The upshot of this discussion is that at the least for the garden waste fraction, thetransport implications of separate collection are not knowable, but likely to be close tozero. It cannot be stated, unequivocally, whether the impact will be positive ornegative. Positive situations in some specific circumstances are likely to be offset bynegative ones elsewhere. The picture is also a dynamic one. The more the activityproceeds, and the more the market for materials is expanded, the greater the densityof the network of compost facilities. This would incline one toward a view thattransport externalities could be reduced.
44..66..22 KKeerrbbssiiddee CCoolllleeccttiioonnss
The effect on transport externalities of kerbside collections is also not straightforwardto predict. Intuitively, the response might be to suggest that the transport externalities
21 Note, in the case of garden waste, it is more likely to be a compost facility rather than a digestion facilityowing to the lignin content of the feedstock.

Economic Analysis of Options for Managing Biodegradable Municipal Waste � Final Report
Eunomia Research & Consulting, Scuola Agraria del Parco di Monza, HDRA Consultants, ZREU and LDK ECOon behalf of ECOTEC Research & Consulting
107
must increase. Yet many countries are already collecting biowaste in such a way asthey reduce the frequency of residual waste collection. The effect is most pronouncedin Southern Member States. In parts of Italy, flat-bottomed trucks with no compactionmechanism collect kitchen waste fractions three times weekly. This has enabled thefrequency of residual waste collection to fall from three times weekly to once weekly.Although the capacities of the trucks are smaller than for refuse collection vehicles(RCVs), and so the external cost per unit weight of material collected might beassumed to be greater, the fact that some of these vehicle fleets are powered byelectricity makes it possible that the net external costs of the system are no greaterthan (and possibly less than) those of the system they effectively displace, in whichRCVs collect material three times weekly. Note that where kitchen waste only iscollected, the absence of need for compaction mechanisms also implies an energysaving.
Similar effects can be observed in Northern Member States. Here, it is increasinglycommon to see collection of residual / rest waste operating on alternate weeks to thecollection of kitchen and garden waste. Sometimes, the collection of the biowastefractions increases in frequency in the summer months.
Note that most systems operating in Northern Member States collect both kitchen andgarden wastes. This necessitates use of compactors to achieve high bulk densities.From the perspective of transport externalities, there are interesting, inter-relatedeffects. In the first instance, the decision to collect garden waste as well as kitchenwaste typically results in higher per capita waste collection. It is not always clearwhether this increase occurs at the expense of home composting (or leaving grasscuttings on a lawn) or whether it results in less garden waste delivered to civic amenitysites. To the extent that it does the former, the transport externalities are increased.But, to the extent that it also does the latter, transport externalities may be reduceddepending upon the extent to which journeys to the Civic Amenity site made by thehouseholder would have been made anyway.
Similar discussions in respect of distances to treatment plant apply as with gardenwaste systems (see above). It is not possible to estimate a net effect on transportexternalities associated with the changing treatment systems.
Again, the net effect depends upon a range of factors. However, under theassumption that biowaste collection can, because it removes fermentable fractionsfrom rest / residual waste, reduce the frequency of rest / residual waste collection, thenet effect is again likely to be close to zero. This, incidentally, is also reflected in thecollection costs in best practice schemes. In the next Chapter, it is argued that theseare likely to be close to zero.
44..66..33 TTrraannssppoorrtt EExxtteerrnnaalliittiieess aanndd DDeeggrreeeess ooff IInntteerrnnaalliissaattiioonn
Quite apart from the points made above, where road transport is used to movematerials form one location to another, it may well be that transport externalities arealready internalised in the costs of road transport through fiscal measures such as fueltaxes. Consequently, there may be cases where double-counting exists in thecalculation of transport externalities associated with waste collection since these may

Economic Analysis of Options for Managing Biodegradable Municipal Waste � Final Report
Eunomia Research & Consulting, Scuola Agraria del Parco di Monza, HDRA Consultants, ZREU and LDK ECOon behalf of ECOTEC Research & Consulting
108
already be internalised in the cost of fuel. Such taxes are increasingly common inEurope.
There is, at present, a debate as to whether, and if so, which of these taxes, is�environmental.� That aside, the effect in the real world is the same (to make transportmore expensive). Appendix 6 gives a slightly rough-and-ready analysis of the degreeto which transport externalities are likely to be internalised in collection costs throughexisting levels of duties and taxes on diesel fuels in different countries. This suggeststhat even if one does not accept the argument put forward here (that the net change inexternality is difficult to estimate), the external costs of waste transport may already beinternalised to a significant degree by duties paid on fuel in different Member States.
44..77 NNoottee oonn MMeecchhaanniiccaall BBiioollooggiiccaall TTrreeaattmmeenntt
In the wake of growing interest in mechanical biological treatment (MBT), a number ofstudies have been produced looking at this approach to managing waste. None thusfar has attempted to assess the external costs of the treatment. However, there is agrowing body of environmental data available for such an analysis.
Recent studies include those undertaken by the Umweltbundesamt (Lahl et al 2000),the VITO (2001) study in Flanders and the pan-European study by Zeschmar- Lahl etal (2000). The first and last of these provide the most wide-ranging analysis of theprocesses. These processes are quite diverse. The diversity reflects the differentobjectives (and hence designs) of the plants. This makes it somewhat awkward todescribe a �typical� process. Furthermore, the ultimate destiny of the different fractionsmakes it difficult to give a clear picture of emissions and environmental impacts otherthan in the case of specific plants.
Given that the shifts to MBT are not central to the interests of this study, no attempthas been made to elicit external costs of such processes. However, it should be notedthat where a municipality�s strategy is pushed further towards source separation ofmunicipal waste by virtue of a specific policy instrument, the impact on thatmunicipality�s treatment of residual waste may include a shift towards mechanicalbiological treatment approaches in conjunction with �smarter� use of high-calorificfractions in preference to treatments such as mass burn incineration, which may bemade less likely by a requirement for source separation of municipal waste.
There are three reasons for positing this: a) the suitable scale of thermal treatmentplant decreases (introducing diseconomies of reduced scale into the equation whereincineration is concerned); b) under some situations, the calorific value of residualmaterial may become sufficiently high as to cause problems for conventional grateincinerators; and c) in the face of local opposition to incineration (where this occurs),the requirement to source separate biowastes makes the achievement of LandfillDirective targets through a combination of source separation / MBT more viable. Thiswould be especially true if stabilised waste meeting certain conditions was treated asthough it was no longer �biodegradable municipal waste� for the purposes of the Article5 targets for Member States under the Landfill Directive (and the rationale for this liesin the intent to stabilise the biodegradable fraction of residual waste).
Economic Analysis of Options for Managing Biodegradable Municipal Waste � Final Report
Eunomia Research & Consulting, Scuola Agraria del Parco di Monza, HDRA Consultants, ZREU and LDK ECOon behalf of ECOTEC Research & Consulting
109
Already, the process treats something of the order 4% of residual waste in Germany(Zeschmarr-Lahl et al 2000). In excess of 30 plants are already in existence. InAustria, MBT is an accepted method of pre-treating waste before landfill. Waste whichhas not undergone an acceptable pre-treatment will no longer be permitted in Austrianlandfills after 2004. According to the Austrian Landfill Regulation (164/1996), bothincineration and MBT are accepted as long as the residue achieves certain standardsand the process meets certain standards. For MBT, the main criterion is that thewaste has a gross calorific value of less than 6 MJ / kg TS (total solid). At least elevenplants already exist and the most recent statistics suggest that 6.3% of waste wasbeing treated in this way. As a percentage of residual waste, this figure equates to12.7% of the total whilst 57.6% of residual waste is still landfilled. This suggests that amajor expansion in the use of MBT is likely in the face of existing regulations.
Many plants exist in Italy and new plants are emerging in the Netherlands. The Italian�Ex-Maserati� plant on the outskirts of Milan Town is one of the largest in the world.Flanders, also, looks likely to develop MBT capacity significantly in conjunction withthermal treatment facilities as mass-burn incinerators have become less popular.Plans are for four new MBT facilities.

Economic Analysis of Options for Managing Biodegradable Municipal Waste � Final Report
Eunomia Research & Consulting, Scuola Agraria del Parco di Monza, HDRA Consultants, ZREU and LDK ECOon behalf of ECOTEC Research & Consulting
110
55..00 TTHHEE EECCOONNOOMMIICC AANNAALLYYSSIISS OOFF OOPPTTIIOONNSS FFOORRMMAANNAAGGIINNGG BBIIOODDEEGGRRAADDAABBLLEE MMUUNNIICCIIPPAALLWWAASSTTEE –– FFIINNAANNCCIIAALL CCOOSSTTSS
When discussing the financial costs of waste management options, the tendency hasbeen to report costs on a gate fee basis. Gate fees are, effectively, unit prices paid bythe customer for the service provided (e.g. the price paid for the landfilling, orincineration of a tonne of waste). From the perspective of a local authority seeking tounderstand the annual costs of managing its waste, this makes some sense.However, more generally, gate fees do not necessarily represent the financialresources required to establish and operate a waste treatment facility. Furthermore,depending upon contractual design, they may fluctuate over time.
The degree to which reported gate fees and the �true� financial costs of wastemanagement diverge is likely to be related to the development of the market for wastetreatment facilities and the structures of ownership and responsibility within thatmarket. Changes in legislation can significantly affect the amount of waste sent to oneor other treatment facility, and the consequences of such changes are that in marketsituations, gate fees within the market place have to take account of, or to anticipate,these changes. On the other hand, where systems are in public hands, the adjustmentis less likely to occur through the market, and will be controlled by the relevant actors.
This Section addresses the costs of those technologies of greatest concern to thisstudy. The following processes / technologies are considered:
• Separate collection of compostable wastes;
• Landfilling;
• Incineration with energy recovery;
• Composting;
• Anaerobic digestion; and
• Mechanical biological treatment (MBT).
In the case of the typical treatments, it has been necessary to resort to the use oftypical gate fees in this study. Gate fees still vary enormously across Europe despiteattempts to harmonise waste legislation. This partly reflects continuing differences inlegislation and standards, but it also reflects the way in which markets for the supplyof waste management services varies across countries. The degree to which the gatefee approach represents a problem is discussed in passing and is raised as a morespecific concern in Chapter 6. In the general case, it should not be assumed that gatefees will be representative of underlying costs. This is especially true in the context ofmajor regulatory changes such as the Landfill Directive, the implementation of which

Economic Analysis of Options for Managing Biodegradable Municipal Waste � Final Report
Eunomia Research & Consulting, Scuola Agraria del Parco di Monza, HDRA Consultants, ZREU and LDK ECOon behalf of ECOTEC Research & Consulting
111
will inevitably lead to strategic behaviour and significant changes in the market forwaste management services.
In this chapter, the factors which affect underlying costs are discussed. However, whatis being reported are gate fees. It is important to understand the distinction betweenthe two. In an analysis such as this, it would be preferable to identify costs. The gatefees charged do not, in all cases, change in step with changes in costs.
55..11 CCoossttss ooff SSeeppaarraattee CCoolllleeccttiioonn
In the current context, one of the most important issues is the cost incurred by theimplementation of source separation of biowastes. If local authorities are required tocollect compostable materials separately, how will this affect costs?
The collection of resources from the waste stream and the collection of residualfractions is undertaken in different ways in different countries. There is no one �right�way to organise collection systems, though there is good reason to believe that someare more effective than others. Where systems work well, they tend to beevolutionary, and incorporate the outcome of what is essentially a learning process. Itis also vitally important, when considering separate collection of compostables, tounderstand the implications for existing collection schemes.
It is not straightforward to estimate the costs of implementing separate collectionschemes where they do not already exist. The normal presumption is that the costs ofwaste collection will increase significantly as a consequence of the introduction ofseparate collection systems. However, this need not be the case for compostablewastes.
The separate collection of biowastes has consequences for the collection system as awhole. Successful collection at kerbside / doorstep of the kitchen waste fraction canfacilitate a reduction in the required frequency of collection of the residual wastefraction. This already happens in various municipalities in a number of countries, andis an especially important consideration in Southern countries where the climatedemands more frequent collection of putrescible wastes (though this �frequencyreduction� effect is by no means confined to Southern Member States).
The other interesting point concerning kitchen wastes is that they are dense. For thisreason, there is not the same requirement for compaction vehicles to achieve higherbulk densities that there might be with, for example, packaging materials, or mixedkitchen and garden wastes, or residual municipal waste. There is, therefore, noreason why one has to incur the expense of such vehicles. Essentially, flat-bottomedtrucks can be used to collect the material, and again, this is already the case inmunicipalities in some European countries (with commercial and industrial wastes aswell as municipal waste).
Where separate collection of only kitchen wastes is in place, collection of gardenwastes could be achieved through two possible routes (or a combination of these),though it makes sense to encourage home composting of this material as far aspossible:

Economic Analysis of Options for Managing Biodegradable Municipal Waste � Final Report
Eunomia Research & Consulting, Scuola Agraria del Parco di Monza, HDRA Consultants, ZREU and LDK ECOon behalf of ECOTEC Research & Consulting
112
1. through requiring householders to take such waste to civic amenity sites (ashappens, for example, in Denmark, partly because municipalities wish toreduce costs to themselves); or
2. through implementing periodic collections for bulk garden wastes (perhapslimited to spring / summer months).
These decisions should also be considered in the context of the effects on wasteminimisation through home composting. Schemes which collect both kitchen andgarden waste at the kerbside / doorstep, as well as being potentially more costly torun because of the need to make use of compactors, are likely to draw much morematerial from the waste stream (and so be more expensive to run both on a per tonnebasis, and on a per household / per inhabitant basis). Unless such schemes are alsoaccompanied by variable charging (i.e. pay-as-you-throw) schemes, there will be littleincentive for householders to engage in home composting.
Appreciating these possibilities, it is easier to see why it may not be true to say thatseparate collection schemes for organic wastes incur considerable additional costs.Collection methods which are optimised for their �systemic� suitability to a specific areacan ensure that any additional costs are kept to a minimum, and intelligent adaptationof schemes may even lead to savings in collection costs relative to those whichprevailed before separate collection was introduced.
Even where savings are not realised in collection per se, they may be realised throughthe avoided costs of disposal / treatment of the residual waste fraction. In a number ofcountries, the costs of composting are already below those of alternative treatments(which have exhibited a tendency to increase through use of economic instrumentsand regulations). For example, in Austria, one source suggests that collection andrecycling of separate collected biogenic waste costs €30 per tonne or so less thancollection and treatment of residual waste.22
Another way of minimising additional costs (relative to the situation in which no suchcollection scheme exists) is to use split-bodied vehicles. These have certain problemsbut the potential exists to use these to collect kitchen waste and residual wastefractions. Given that the incremental costs of such vehicles above and beyondstandard refuse collection vehicles may be of the order €15,000, and given that thesemay collect of the order 2,000 tonnes per annum, the annualised incremental costsmay be relatively small, though much depends upon the material capture rates in suchschemes. At a capture rate of 50%, the additional cost of the collection system mightbe €6-7/tonne collected, though this would fall at higher capture rates (which, asChapter 3 showed, are already being achieved nationwide in some countries).
Note that comparisons of collection costs per tonne of separately collected kitchenwaste and of residual waste become relatively meaningless once one appreciates thesignificance of considering collection approaches as systems. What happens in manyschemes is that the collection of residual waste becomes less expensive (measured inper tonne terms) as a result of reduced collection frequencies. At the same time, the
22 Personal comm.. Wolfgang Stark, GUA Group.
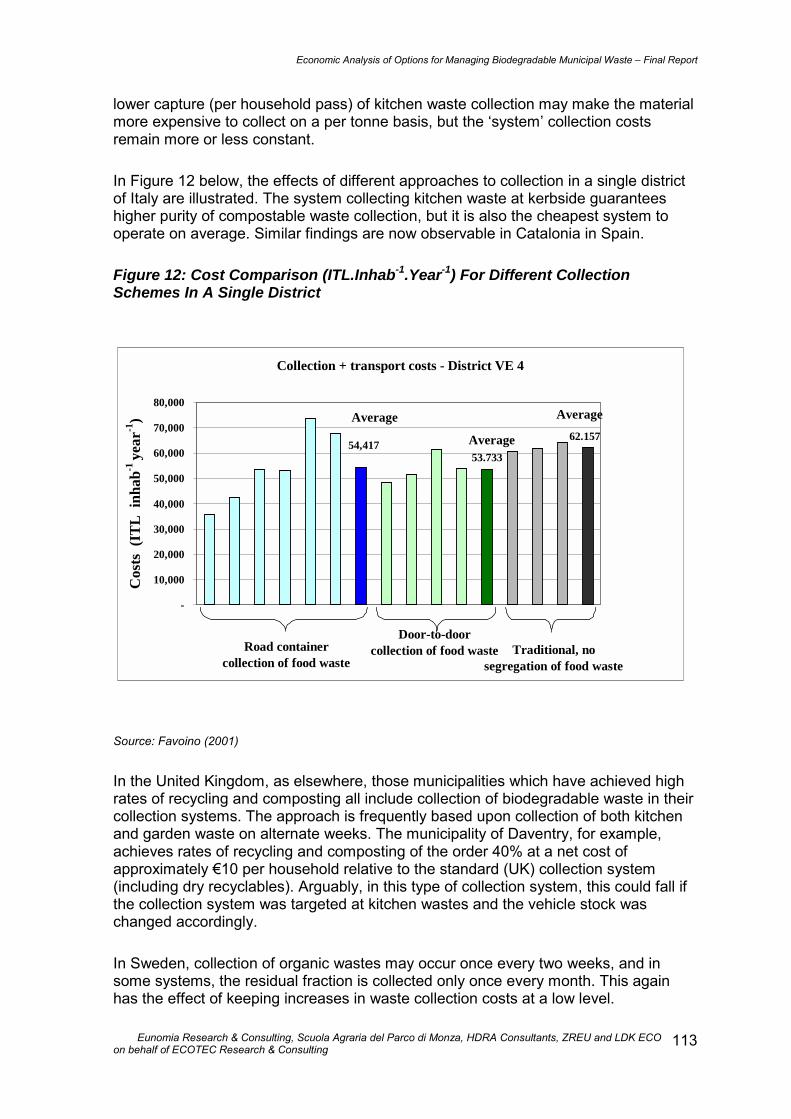
Economic Analysis of Options for Managing Biodegradable Municipal Waste � Final Report
Eunomia Research & Consulting, Scuola Agraria del Parco di Monza, HDRA Consultants, ZREU and LDK ECOon behalf of ECOTEC Research & Consulting
113
lower capture (per household pass) of kitchen waste collection may make the materialmore expensive to collect on a per tonne basis, but the �system� collection costsremain more or less constant.
In Figure 12 below, the effects of different approaches to collection in a single districtof Italy are illustrated. The system collecting kitchen waste at kerbside guaranteeshigher purity of compostable waste collection, but it is also the cheapest system tooperate on average. Similar findings are now observable in Catalonia in Spain.
Figure 12: Cost Comparison (ITL.Inhab-1.Year-1) For Different CollectionSchemes In A Single District
Source: Favoino (2001)
In the United Kingdom, as elsewhere, those municipalities which have achieved highrates of recycling and composting all include collection of biodegradable waste in theircollection systems. The approach is frequently based upon collection of both kitchenand garden waste on alternate weeks. The municipality of Daventry, for example,achieves rates of recycling and composting of the order 40% at a net cost ofapproximately €10 per household relative to the standard (UK) collection system(including dry recyclables). Arguably, in this type of collection system, this could fall ifthe collection system was targeted at kitchen wastes and the vehicle stock waschanged accordingly.
In Sweden, collection of organic wastes may occur once every two weeks, and insome systems, the residual fraction is collected only once every month. This againhas the effect of keeping increases in waste collection costs at a low level.
Collection + transport costs - District VE 4
54,41762.157
53.733
-
10,000
20,000
30,000
40,000
50,000
60,000
70,000
80,000
Cos
ts (
ITL
inh
ab-1
year
-1)
Road container collection of food waste
Door-to-doorcollection of food waste Traditional, no
segregation of food waste
Average
Average
Average
Economic Analysis of Options for Managing Biodegradable Municipal Waste � Final Report
Eunomia Research & Consulting, Scuola Agraria del Parco di Monza, HDRA Consultants, ZREU and LDK ECOon behalf of ECOTEC Research & Consulting
114
In Denmark, consideration of the establishment of separate collections for organichousehold waste (as opposed to garden waste, which is already effectively collectedin Denmark) are underway. Waste Management Plan 1998-2004 states that:
Establishment of separate collection and biological treatment of organic fractionsrequires that investments are made in collection systems and treatment capacity.Calculations show that costs of total operation (including interest payment anddepreciation) will not necessarily exceed costs of today's single-string system (DanishEPA 1999).
Having made these points, it is worth adding that it is certainly not necessarily truethat in all situations at present, the separate collection of compostable materials leadsto zero increase in waste management costs to householders. It does seem likely,however, that where waste management systems are carefully designed, increases incollection costs are more likely to be attributable to separate collection of dryrecyclables, which are typically of much lower bulk density, and which have little or noimpact upon the required frequency of residual waste collection where no biowastecollection is in place. Equally, as with composting, the costs of recycling net ofrevenues generated may be comparable, or lower in cost, than residual wastecollection and alternative treatments.
For the purposes of this study, it is assumed that for each tonne of biowaste collectedseparately, the incremental cost relative to existing collection is between €0-15 pertonne of biowaste collected (the incremental costs of introducing separate collectionare greater when expressed �per tonne of biowaste collected� than when expressed�per tonne of total waste collected�, or �per household served�). This is based on theview that even though collection costs per tonne of collected biowaste may be higherthan for residual waste, offsetting effects (shift to alternate / less frequent collection ofresidual waste) will act to restrain any increase in costs. The possibility that net costsof collection fall is a very real one, but this assumption has not been used in themodelling.
Note that some will argue that collection costs should reflect the population density ofthe location from which waste is being collected. That is likely to be true, but here oneis interested in a combination of:
• the incremental costs over and above a situation in which no such schemeexists - the costs of the existing collection scheme will vary by type of location;and /or
• the incremental costs (potentially negative) of making participation in existingschemes mandatory where it might not be today.
Recognising these facts, the additional costs for the total collection system are likelyto be low where the system is well-designed, and especially where legislation makesseparate collection mandatory for householders, or where variable chargingencourages householders, through differential collection costs, to separate out

Economic Analysis of Options for Managing Biodegradable Municipal Waste � Final Report
Eunomia Research & Consulting, Scuola Agraria del Parco di Monza, HDRA Consultants, ZREU and LDK ECOon behalf of ECOTEC Research & Consulting
115
biowastes (and dry recyclables).23 These are the sorts of implementing measures thatmight flow from any policy which requires municipalities to collect biowastesseparately, and indeed, in areas of Europe where such collection is widespread, thesemeasures are already in place.
55..22 RReessuullttss ffoorr LLaannddffiillll
The financial costs of landfilling include the cost of site acquisition and the engineeringcosts for landfilling, the latter including any installations put in place to collect andgenerate energy from landfill gas. Acquisition costs may reflect the age of the siteconcerned. Engineering costs may depend upon the situation of the landfill withrespect to major aquifers. In addition, operating costs include monitoring and leachatetreatment, as well as ongoing engineering costs (since modern practices requireongoing activity in respect of capping etc.).
One earlier study gave figures on the basis of costs in one country with the figuresextrapolated to other countries on the basis of relative costs of capital, labour andother factors. Whilst intuitively plausible, the key point is that the relative costs indifferent countries are affected by the type of landfill under consideration and theexisting regulatory regime. Since one is interested here in municipal waste, oneclearly needs to be looking at municipal waste landfills, but the costs of running thesewill be determined by the extent to which other wastes are accepted, and theregulatory / licensing regimes in different countries. Furthermore, geologicalcharacteristics will affect engineering costs, and the size of the landfill will determinethe contribution that these make to unit prices charged for landfill disposal.
Probably more significantly, the degree to which Member States implement policieswhich reflect the waste management will influence the quantities of waste beinglandfilled. It is the rate of tipping, as much as size per se, that is likely to affect the unitcosts. Where waste is being diverted from landfill in significant quantities, the tippingrates at sites are likely to be lower, requiring gate fees to be higher if the costs of fixedinvestments are to be covered. It is often felt that diversion of waste from landfill isgreatest in countries where landfill gate fees are higher. It may be equally true,however, to state that where landfill gate fees are higher, they are higher becausewaste is being diverted from landfill (tipping rates are lower). Energy recovery is likelyto make some positive contribution to revenues, though the magnitude of revenues isclearly influenced by energy policies in the country concerned.
Taken together, these suggest that in-country landfill costs will exhibit some variation,but also, that the regulatory regime will be a key determinant of costs (bothoperational, and engineering). There is variation both within and across countries, onlypart of this being related to differences in the cost of input factors. Currently, the
23 Note that increasing attention is being paid to designing collection systems and incentive mechanismswhich encourage (or which do not discourage) home composting. This helps to minimise the degree to whichconvenient biowaste collections simply increase quantities collected by pulling into the collection streammaterial which could readily be composted at home.

Economic Analysis of Options for Managing Biodegradable Municipal Waste � Final Report
Eunomia Research & Consulting, Scuola Agraria del Parco di Monza, HDRA Consultants, ZREU and LDK ECOon behalf of ECOTEC Research & Consulting
116
cross-country variation in costs is enormous given the different approach to regulationof landfilling across the Member States and Accession Countries.
It is important to emphasise that costs and gate fees are different. To the extent thatthe landfill is owned by a municipality, arguably the distinction is not relevant since thecosts and the price could be considered to be the same, although even here,accounting conventions may affect the costs as reported. Where the landfill is notowned by the municipality, the fee charged for landfilling municipal waste and thecosts of supplying the service are likely to be different. The reasons for the differencesand their magnitude, as well as their direction, are likely to be influenced by thedegree to which it can be said that there is a �market� for waste management services(spanning landfill and other treatments), as well as the strategies of the companiesconcerned. The latter are likely to be affected by the Member States� implementationof the Landfill Directive, making the next few years, potentially, a period ofconsiderable uncertainty in the price charged for provision of landfill services.
Landfill operators� strategies also vary. Some may seek to maximise revenue in theshort term, others may seek to preserve void space in the hope of benefiting fromhigher gate fees later in time. From this perspective, the ratio of non-recurring capitalcosts to �recurring capital costs plus operating costs� becomes an important ratio,again being determined by regulatory requirements.
Arguably, with the passing of time, the underlying costs for landfilling are likely toconverge towards the higher end of existing ranges, though the influence of theLandfill Directive on gate fees charged may also be considerable, especially incountries where co-disposal (of hazardous and non-hazardous wastes) is currentlypracticed (not least because the higher gate fees from hazardous materials may belost, requiring costs and profits to be covered by non-hazardous waste gate fees).
In Table 31 below, the gate fees for landfilling as suggested by the survey carried outfor this study are shown. These are compared with the �costs� quoted in Coopers &Lybrand et al (1997). It would be preferable to use cost data but this is not available.The Table, which includes some gaps, highlights the likely limitations of using anapproach which does not account for the differing approaches which exist in MemberStates and Accession States. Notwithstanding the points made about the potentialdivergence between �gate fees� and costs, the Table suggests greater variation thancould be explained by an approach which assumes that costs vary only with therelative cost of certain input factors.
Also noteworthy from the Table is the significance of the landfill levies now in place.These are a significant component of overall costs of landfilling in those countrieswhere they are in force. Account of the existence of these taxes should be made for inthe cost-benefit analysis.
In the context of cost-benefit analyses concerning what may happen in the future,using current landfill gate fees would give a poor representation of what the relativecosts and benefits might be of different options. Landfill costs, and probably gate fees,are likely to rise in those countries where gate fees are currently low. The extent ofany such rise will depend upon, amongst other things, the way in which differentMember States implement various aspects of the Landfill Directive, including the pre-
Economic Analysis of Options for Managing Biodegradable Municipal Waste � Final Report
Eunomia Research & Consulting, Scuola Agraria del Parco di Monza, HDRA Consultants, ZREU and LDK ECOon behalf of ECOTEC Research & Consulting
117
treatment requirements. For example, in work under preparation (Eunomia et al,2002), the costs of landfilling in Italy might be expected to rise to €50 from what wererecently low levels (€20 or so).

Economic Analysis of Options for Managing Biodegradable Municipal Waste � Final Report
Eunomia Research & Consulting, Scuola Agraria del Parco di Monza, HDRA Consultants, ZREU and LDK ECO on behalf of ECOTEC Research & Consulting118
Table 31. Costs Of Landfilling In Different Countries, (€ / tonne MSW) (note becoming irrelevant for DK and NL)
LANDFILL Coopers & Lybrand et al (1997) This Study
No Energy Recovery With Energy Recovery Landfill (excl. levies) Landfill Levy
Urban Rural Urban Rural Low Med High Tax (best practice / low rate) Tax (not best practice / high rate)
Austria 55 110 43
Belgium 22 17 22 17
Flanders 52 56 Flanders � €52 with energy recovery, €55 without
Wallonia 41 0 42 25 43
Denmark 48 28 47 27 44 50
Finland 16 28 56 15
France 21 15 20 14 31 46 85 9
Germany 51 29 51 28 35 120 220 None
Greece 20 15 20 14 5 21 None
Ireland 34 23 34 22 34 44 78 22
Italy 25 18 24 16 50 70 10Note � set at regional level
50Note � set at regional level
Luxembourg 53 37 52 36 123 147 None
Netherlands 36 21 36 21 75 60
Portugal 21 15 20 15 6 15 None
Spain 25 14 24 16 9 15 30 None
Sweden 22 82 30
UK 26 19 25 18 10 24 34 19
Cyprus No data (estimated as Greece) None
Czech Republic 15 25 1
Estonia No data (estimated as CZ Rep) Landfill tax set by local authorities
Hungary No data (estimated as CZ Rep) None
Poland No data (estimated as CZ Rep) None
Slovenia 5 In preparation
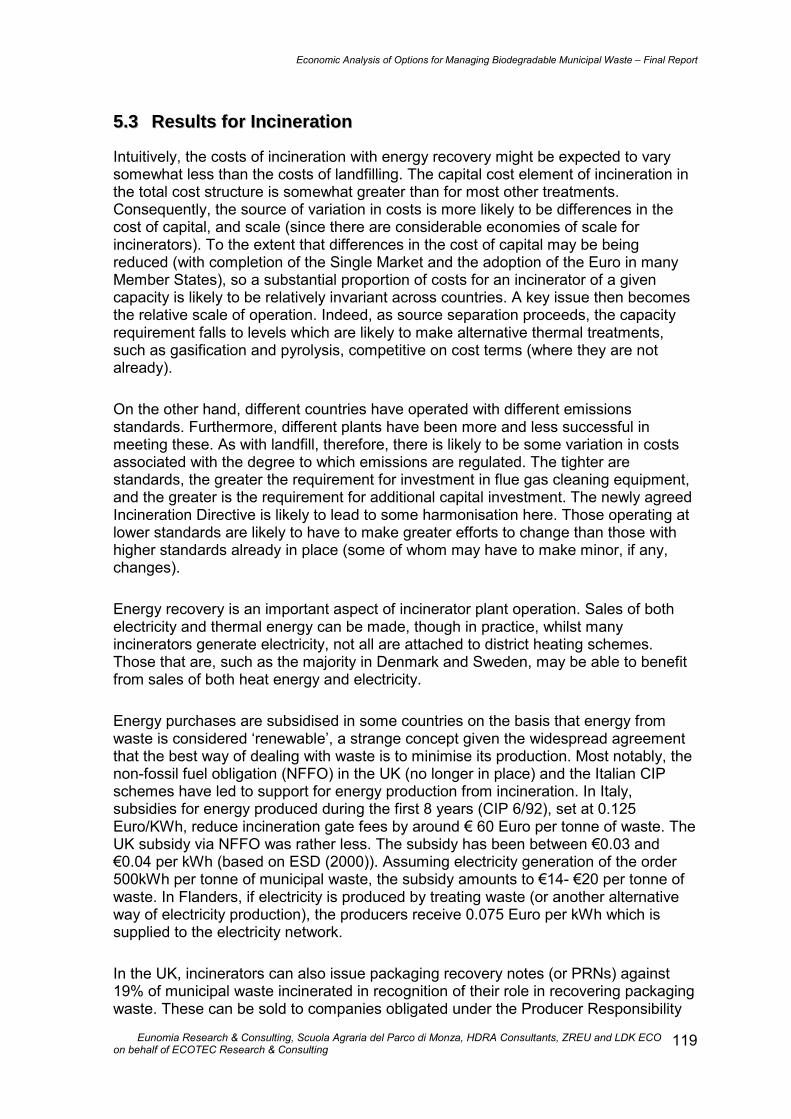
Economic Analysis of Options for Managing Biodegradable Municipal Waste � Final Report
Eunomia Research & Consulting, Scuola Agraria del Parco di Monza, HDRA Consultants, ZREU and LDK ECOon behalf of ECOTEC Research & Consulting
119
55..33 RReessuullttss ffoorr IInncciinneerraattiioonn
Intuitively, the costs of incineration with energy recovery might be expected to varysomewhat less than the costs of landfilling. The capital cost element of incineration inthe total cost structure is somewhat greater than for most other treatments.Consequently, the source of variation in costs is more likely to be differences in thecost of capital, and scale (since there are considerable economies of scale forincinerators). To the extent that differences in the cost of capital may be beingreduced (with completion of the Single Market and the adoption of the Euro in manyMember States), so a substantial proportion of costs for an incinerator of a givencapacity is likely to be relatively invariant across countries. A key issue then becomesthe relative scale of operation. Indeed, as source separation proceeds, the capacityrequirement falls to levels which are likely to make alternative thermal treatments,such as gasification and pyrolysis, competitive on cost terms (where they are notalready).
On the other hand, different countries have operated with different emissionsstandards. Furthermore, different plants have been more and less successful inmeeting these. As with landfill, therefore, there is likely to be some variation in costsassociated with the degree to which emissions are regulated. The tighter arestandards, the greater the requirement for investment in flue gas cleaning equipment,and the greater is the requirement for additional capital investment. The newly agreedIncineration Directive is likely to lead to some harmonisation here. Those operating atlower standards are likely to have to make greater efforts to change than those withhigher standards already in place (some of whom may have to make minor, if any,changes).
Energy recovery is an important aspect of incinerator plant operation. Sales of bothelectricity and thermal energy can be made, though in practice, whilst manyincinerators generate electricity, not all are attached to district heating schemes.Those that are, such as the majority in Denmark and Sweden, may be able to benefitfrom sales of both heat energy and electricity.
Energy purchases are subsidised in some countries on the basis that energy fromwaste is considered �renewable�, a strange concept given the widespread agreementthat the best way of dealing with waste is to minimise its production. Most notably, thenon-fossil fuel obligation (NFFO) in the UK (no longer in place) and the Italian CIPschemes have led to support for energy production from incineration. In Italy,subsidies for energy produced during the first 8 years (CIP 6/92), set at 0.125Euro/KWh, reduce incineration gate fees by around € 60 Euro per tonne of waste. TheUK subsidy via NFFO was rather less. The subsidy has been between €0.03 and€0.04 per kWh (based on ESD (2000)). Assuming electricity generation of the order500kWh per tonne of municipal waste, the subsidy amounts to €14- €20 per tonne ofwaste. In Flanders, if electricity is produced by treating waste (or another alternativeway of electricity production), the producers receive 0.075 Euro per kWh which issupplied to the electricity network.
In the UK, incinerators can also issue packaging recovery notes (or PRNs) against19% of municipal waste incinerated in recognition of their role in recovering packagingwaste. These can be sold to companies obligated under the Producer Responsibility

Economic Analysis of Options for Managing Biodegradable Municipal Waste � Final Report
Eunomia Research & Consulting, Scuola Agraria del Parco di Monza, HDRA Consultants, ZREU and LDK ECOon behalf of ECOTEC Research & Consulting
120
(Packaging Waste) Obligations as evidence of compliance with their recovery targets(which were established to ensure compliance with the Packaging Directive). The�recovery PRN� price in 2000 was of the order €13-€16, implying a subsidy of €2.6-€3.2 per tonne of MSW. The level of revenue generated is likely to increase in 2001as the market for PRNs tightens (as company obligations to recycle / recoverpackaging increase in the UK).
Ironically, whilst these subsidies exist, a number of countries are now taxingincineration as well as landfill. Flanders and Denmark (as well as Norway) already dothis. In addition, taxes on NOx emissions affect incineration in some countries, notablySweden, where although the NOx tax is refunded to energy producers, it is refundedin proportion to thermal output. Incineration, being a relatively large producer of NOxper unit of thermal output in Sweden, is a net loser under this refunding mechanism(see ECOTEC et al 2001, Hoglund 1999a;1999b).
Also important is the approach taken to dealing with residues. In several countries,bottom ash is used in construction applications. In some, fly ash is also used. Someconcerns remain regarding the use of these as, especially in the case of fly ash, theweathering of the material and the eventual dismantling of the construction itself maylead to new concerns regarding pollution.
Although other applications exist, ash is still landfilled in many cases. The LandfillDirective may affect the costs of disposal to landfill, especially where co-disposalcurrently occurs, depending upon how pre-treatment is defined, and whether ashes,and if so, which ashes, are defined as hazardous waste. The costs of treating anddisposing / recycling ash residues varies considerably across countries and willcontinue to do so. Table 32 below again gives a comparison of the figures obtained forthis study against the Coopers and Lybrand et al (1997) report.
Note that, reflecting the discussion above, with the exception of data from Sweden(supplied by RVF), and the UK (which includes subsidies for energy generation andthe issuing of PRNs), the costs vary less across countries. The Swedish figures arelow reflecting the sales of heat energy. UK figures are also low reflecting the range ofimplicit and explicit subsidies to incineration. Some local authorities in the UK have thegate fee effectively lowered even further by a system of financing of capital projects inwhich qualifying projects have the capital sum effectively paid for by centralgovernment (the credits scheme under so-called Private Finance Initiative).
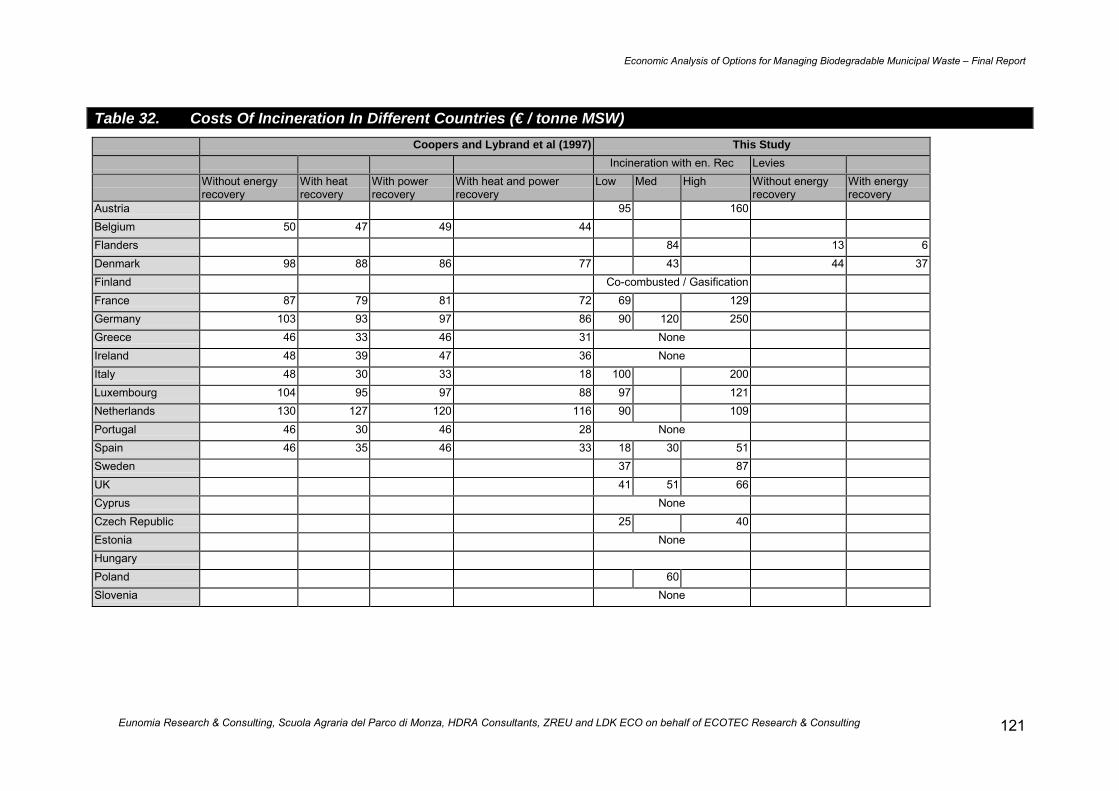
Economic Analysis of Options for Managing Biodegradable Municipal Waste � Final Report
Eunomia Research & Consulting, Scuola Agraria del Parco di Monza, HDRA Consultants, ZREU and LDK ECO on behalf of ECOTEC Research & Consulting 121
Table 32. Costs Of Incineration In Different Countries (€ / tonne MSW)Coopers and Lybrand et al (1997) This Study
Incineration with en. Rec LeviesWithout energyrecovery
With heatrecovery
With powerrecovery
With heat and powerrecovery
Low Med High Without energyrecovery
With energyrecovery
Austria 95 160Belgium 50 47 49 44Flanders 84 13 6Denmark 98 88 86 77 43 44 37Finland Co-combusted / GasificationFrance 87 79 81 72 69 129Germany 103 93 97 86 90 120 250Greece 46 33 46 31 NoneIreland 48 39 47 36 NoneItaly 48 30 33 18 100 200Luxembourg 104 95 97 88 97 121Netherlands 130 127 120 116 90 109Portugal 46 30 46 28 NoneSpain 46 35 46 33 18 30 51Sweden 37 87UK 41 51 66Cyprus NoneCzech Republic 25 40Estonia NoneHungaryPoland 60Slovenia None

Economic Analysis of Options for Managing Biodegradable Municipal Waste � Final Report
Eunomia Research & Consulting, Scuola Agraria del Parco di Monza, HDRA Consultants, ZREU and LDK ECOon behalf of ECOTEC Research & Consulting
122
55..44 RReessuullttss ffoorr CCoommppoossttiinngg
Costs of the composting process are likely to exhibit considerable variation. The keyvariable, in terms of process, is likely to be whether the process is carried out in-vessel, or in open air windrows. Pollution control equipment, front end separationtechnologies and techniques to reduce odours also affect the costs of the technology.Apart from the process costs, the costs of marketing are also an importantconsideration (though they are not considered in this section).
Open air windrow composting can cost less than €20 per tonne. This makescomposting potentially one of the cheapest treatment technologies for municipal waste(see the Tables above for comparisons with landfill and incineration). However, inseveral situations, open-air windrowing of mixed biowastes might not be consideredappropriate. The modelling of best practice technologies in this work (see Figure 13and Table 33) suggests that a figure of €45 per tonne (excluding revenue) may be anappropriate figure for a plant of 20,000 tonnes capacity. Note that this best practiceapproach assumes quality separation of materials (i.e., greater than 95% purity) sothat a primary screening step is not considered necessary.
A recent Austrian study suggested the figures in Table 34 below for composting.Similar figures apply to Germany, although an RVF report suggests much higheroperating costs of €80-160 per tonne (Wannholt 1998). The same study gave a figurefor a Danish plant of €106 per tonne, which again seems high. Figures for Greece(mixed waste) are at the lower end of this range, whilst lower tech approaches in Italymay be as low as €20 per tonne. Figures for high tech composting in Luxembourgappear to be relatively high at more than €70 per tonne.
Figure 13: Schematic Representation Of Best Practice, High-Tech Composting
Yard Waste Shredding8000 tonnes/year
exhaust air
21 days, enclosed in a hallFood Waste Mixing Windrows turned 5 times
12000 tonnes/year Blowers @ 20 Normal cu.m/hr.tonne average specific air supply
Biofilter Retention time: 36"
60 days, outside the buildingStatic piles
2000 tonnes/yrOversieves
Biomass Sieve Eddy current COMPOST 7000 tonnes/yr
Air
Rejects 1000 tonnes/yr
Active Composting Time
24.000 cu.m/hr
60.000 cu.m/hr 20.000 cu.m/hr
Curing Section
Heavy and light rejects (plastics, glass, stones, etc)

Economic Analysis of Options for Managing Biodegradable Municipal Waste � Final Report
Eunomia Research & Consulting, Scuola Agraria del Parco di Monza, HDRA Consultants, ZREU and LDK ECOon behalf of ECOTEC Research & Consulting
123
Table 33. Costs of 20,000tpa Composting Plant
Hi-Tech composting facility, 20.000 tpy
Capital Costs Unit Quantity Unit cost, € Cost Depreciation time Depreciation at 6% Euro/tonne Maintainan
Civil WorksPaving, concrete sq.m. 17000 35 595,000 20 51,875- 1Process Buidings sq.m. 3950 150 592,500 20 51,657- 1Pool(s) cu.m. 200 100 20,000 20 1,744- 1Biofilter cu.m. 588 200 117,600 5 27,918- 2Weighing Bridge # 1 30,000 30,000 10 4,076- 2Offices cu.m. 300 300 90,000 20 7,847- 2Utilities as a whole 1 300,000 300,000 10 40,760- 5Wall m 600 100 60,000 20 5,231- 1
Total 1,805,100 191,107- EquipmentShredder # 1 150,000 150,000 8 24,155- 5Screw mixer # 1 100,000 100,000 8 16,104- 5Turning Machine # 1 250,000 250,000 8 40,259- 5Sieve # 1 100,000 100,000 8 16,104- 5Eddy current separator # 1 100,000 100,000 8 16,104- 5Loader # 2 80,000 160,000 6 32,538- 5Hopper # 1 30,000 30,000 8 4,831- 5Blowers, Fans as a whole 1 250,000 250,000 8 40,259- 5
Total 1,140,000 190,353-
TOTAL 2,945,100 381,461- -19.07 -42.01 %specific cost 147 €/tonne.year
Operating costs Unit Quantity Unit cost, € Cost Euros
Manpower 225,000 11.25 24.78 %Director # 1 50000 50,000 Accounter # 1 35000 35,000 Operators # 5 28000 140,000
Fuels litres 80,506 0.7 56,354 56,354 2.82 6.21 %
Energy kWh 944,813 0.075 70,861 70,861 3.54 7.80 %
Maintainance see box "S28" 89,427 89,427 4.47 9.85 %
Analysis as a whole 1 25000 25,000 25,000 1.25 2.75 %
Disposal of rejects tonnes/yea 1,000 60 60,000 60,000 3.00 6.61 %
Euro/tonneTOTAL 908,103 € 45.41 45.41
Type Quantity Sale price, €Sale of compost Fresh compost 40% 2800 tonnes/yr
field crops 30% 2100 5 10,500
horticulture 10% 700 40 28,000
Ripe compost 60% 4200 tonnes/yr
bulk 40% 2800 15 42,000
retail 20% 1400 40 56,000
136,500 € 6.83
Brief Decription: ACT phase in windrows on aerated floor (retention time: 21 days); exhaust air from the hall sucked and treated through a Biofilter (retention time: 36"). Maturation in static piles, outside the building (retention time: 60 days)
end product: 7000 tonnes/yr
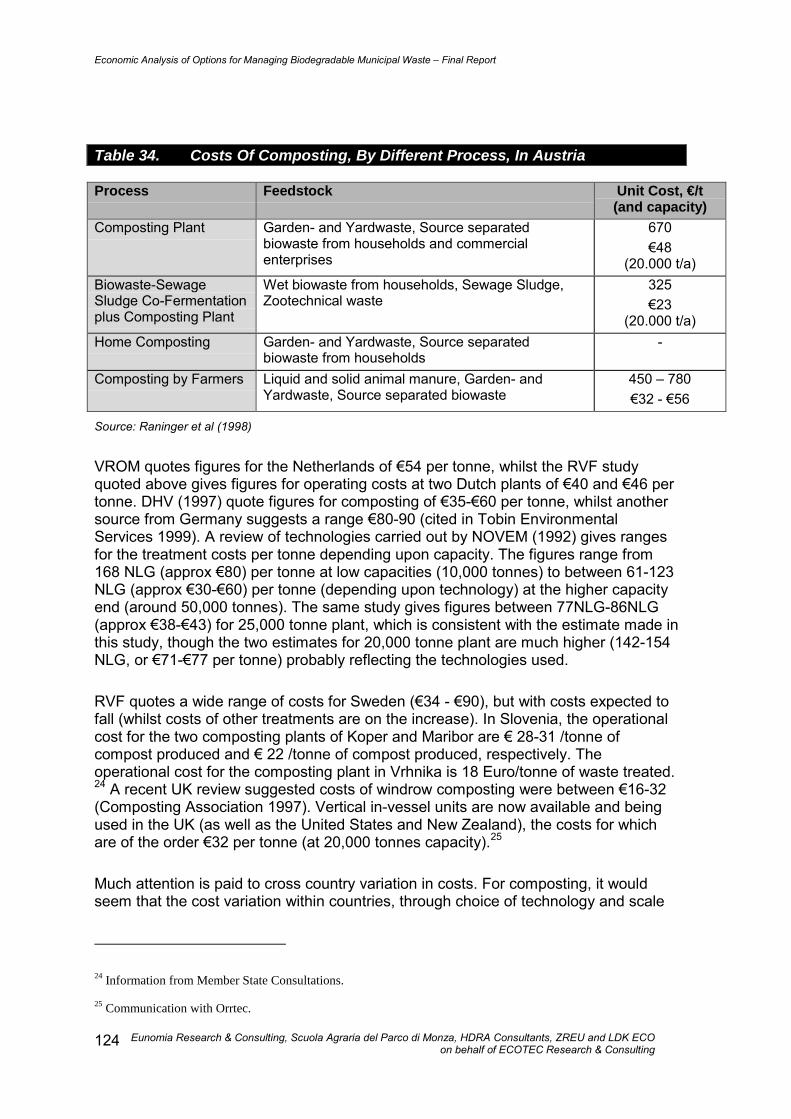
Economic Analysis of Options for Managing Biodegradable Municipal Waste � Final Report
Eunomia Research & Consulting, Scuola Agraria del Parco di Monza, HDRA Consultants, ZREU and LDK ECOon behalf of ECOTEC Research & Consulting
124
Table 34. Costs Of Composting, By Different Process, In Austria
Process Feedstock Unit Cost, €/t(and capacity)
Composting Plant Garden- and Yardwaste, Source separatedbiowaste from households and commercialenterprises
670€48
(20.000 t/a)Biowaste-SewageSludge Co-Fermentationplus Composting Plant
Wet biowaste from households, Sewage Sludge,Zootechnical waste
325€23
(20.000 t/a)Home Composting Garden- and Yardwaste, Source separated
biowaste from households-
Composting by Farmers Liquid and solid animal manure, Garden- andYardwaste, Source separated biowaste
450 � 780€32 - €56
Source: Raninger et al (1998)
VROM quotes figures for the Netherlands of €54 per tonne, whilst the RVF studyquoted above gives figures for operating costs at two Dutch plants of €40 and €46 pertonne. DHV (1997) quote figures for composting of €35-€60 per tonne, whilst anothersource from Germany suggests a range €80-90 (cited in Tobin EnvironmentalServices 1999). A review of technologies carried out by NOVEM (1992) gives rangesfor the treatment costs per tonne depending upon capacity. The figures range from168 NLG (approx €80) per tonne at low capacities (10,000 tonnes) to between 61-123NLG (approx €30-€60) per tonne (depending upon technology) at the higher capacityend (around 50,000 tonnes). The same study gives figures between 77NLG-86NLG(approx €38-€43) for 25,000 tonne plant, which is consistent with the estimate made inthis study, though the two estimates for 20,000 tonne plant are much higher (142-154NLG, or €71-€77 per tonne) probably reflecting the technologies used.
RVF quotes a wide range of costs for Sweden (€34 - €90), but with costs expected tofall (whilst costs of other treatments are on the increase). In Slovenia, the operationalcost for the two composting plants of Koper and Maribor are € 28-31 /tonne ofcompost produced and € 22 /tonne of compost produced, respectively. Theoperational cost for the composting plant in Vrhnika is 18 Euro/tonne of waste treated.24 A recent UK review suggested costs of windrow composting were between €16-32(Composting Association 1997). Vertical in-vessel units are now available and beingused in the UK (as well as the United States and New Zealand), the costs for whichare of the order €32 per tonne (at 20,000 tonnes capacity).25
Much attention is paid to cross country variation in costs. For composting, it wouldseem that the cost variation within countries, through choice of technology and scale
24 Information from Member State Consultations.
25 Communication with Orrtec.

Economic Analysis of Options for Managing Biodegradable Municipal Waste � Final Report
Eunomia Research & Consulting, Scuola Agraria del Parco di Monza, HDRA Consultants, ZREU and LDK ECOon behalf of ECOTEC Research & Consulting
125
of plant, is likely to be at least as large as the variation in costs across countries for anestablished technology. Indeed, cost data from �best practice� composting in SouthernMember States was circulated to process engineers and consultants in NorthernMember States and in some cases, the latter quote lower figures for comparabletreatments. Much clearly depends on the detail of the process (capital equipment,separation, aeration, maturation period etc.) and the assumptions regarding thecomposition of input wastes.
In each of the above cases, it is assumed that the process is being applied to sourcesegregated municipal waste. It is well known that attempts to compost mixedmunicipal waste (i.e. waste that is not collected at source) leads to much higher levelsof contamination with various materials, including heavy metals. These contaminantsmake the material less suitable for useful applications. Well-defined standards assistin establishing the fitness-for-purpose of different grades of compost.
In this study, the figures used are representative of good practice compostingincorporating biofilters to reduce emissions (so the costs of green waste composting inwindrows may be over-estimated). The figures incorporate an estimated sales value of€6-7 per tonne of waste based on typical marketing mixes and sales prices. The netcost (after sales) is of the order €40 per tonne. This assumes a €60 per tonne cost fordisposal of rejects (accounting for 6.6% of total costs). Manpower, fuels and energywill vary in cost across Member States. Fuels and energy comprise 14% of theannualised per tonne costs whilst manpower accounts for 25% of costs. If, for thepurposes of sensitivity analysis, one doubles the cost of each of these variable items,the net per tonne cost increases to €60. Equally, there would be reason to believe thatthe unit labour costs used in the study are well above what would apply in some of thecountries under consideration, notably the Accession States.
These costs can be compared with those given by the European Topic Centre forWaste (2001). The figures quoted in that study are somewhat higher. The operatingcosts of a 20,000 tonne compost plant with forced aeration are equivalent to €80 pertonne. Even the higher estimates discussed above suggest this is very high indeed. Ifone adds an estimate of the annualised capital costs, the per tonne costs net ofrevenue appear to be of the order €130 per tonne, which seems far too high.
Given that plant capacities are likely to vary across different situations, �high� and �low�costs per unit of waste composted are estimated. These figures are based upon the�best practice model� described above, though equally, the variation in technologiesavailable could lead to much higher, or (depending upon the situation) much lowercosts. The range used is €35-60 for best practice plant.
55..55 RReessuullttss ffoorr AAnnaaeerroobbiicc DDiiggeessttiioonn
For anaerobic digestion, different approaches to treatment will have different costs.Similarly, since some processes incorporate co-digestion of wastes, the costs may beaffected by the materials which are treated alongside the source-separated MSW. Theway in which these affect the costs of the system are likely to depend upon the way inwhich they affect other cost factors such as the need for pre-treatment of the wastes,the need for waste waster treatment, the quality of the digestate, the amount of biogasproduced and its energy content, and revenues generated from sales of energy (and

Economic Analysis of Options for Managing Biodegradable Municipal Waste � Final Report
Eunomia Research & Consulting, Scuola Agraria del Parco di Monza, HDRA Consultants, ZREU and LDK ECOon behalf of ECOTEC Research & Consulting
126
whether both electricity and thermal energy are sold). These factors will themselvesbe influenced by different regulations in different countries. As with incineration,subsidy regimes for renewable energy may have an important role to play.
Few countries have operating anaerobic digestion (AD) plants in place for thetreatment of municipal wastes. For Austria, figures are given in Table 35. Additionalfigures from a study by RVF are given in Table 36.
Table 35. Costs Of Anaerobic Digestion Of Different Materials In Austria
Process Feedstock Unit Cost, €/t (andcapacity)
Biowaste Fermentationplus Composting Plant
Source separated biowaste from households andcommercial enterprises, Foodwaste
(€80)(20.000 t/a)
Biowaste-Sewage SludgeCo-Fermentation plusComposting Plant
Wet biowaste from households, Sewage Sludge,Zootechnical waste
(€23)(20.000 t/a)
Source: Raninger et al (1998)
Table 36. Operating Costs Of Anaerobic Digestion Plants In DifferentCountries
Country NL GER B FIN F SLocation Tilburg Baden-Baden Brecht Vaasa Amiens Sobacken / BorasPer tonne costs (€) 139.82 159.01 65.94 48.55 55.75 56.51
Source: Wannholt (1998)
A recent UK study suggests costs could lie between €80-€96 net of electricity salesestimated at approximately €5-€8/tonne. This report suggests that though the capitalcosts fall with scale, the efficiency of energy production falls with increasingthroughput (Waterman BBT 1999). Some European schemes appear to generatesignificant revenue from the sale of digestates since these may have significantnutrient values (IWM Anaerobic Digestion Working Group 1998). A review by NOVEM(1992) suggested net treatment costs, including electricity supply, as high as €130 forsmall systems (10,000 tonnes) but falling to around €50 for systems of capacity50,000 tonnes or so. However, the different systems examined exhibited somevariation in costs.
The review above has identified a number of different variables which alter anaerobicdigestion�s costs, environmental impacts and end-product quality. This study musttherefore identify best practice from the available data to model the impacts of a futureAD plant. It is important to note however that because of the flexibility inherent in thetechnology, it can effectively model itself around local priorities and pressures whichmay vary significantly, for example, requirements for energy recovery, completeremoval of pathogens, specific feedstock types, etc. Furthermore, what is appropriatefor urban environments will not be appropriate for rural areas and so best practiceought to distinguish between the two locations. The situation will also differ betweenNorthern and Southern Europe. The following best practice model will address theprocess characteristics, separation techniques and plant capacity according to the

Economic Analysis of Options for Managing Biodegradable Municipal Waste � Final Report
Eunomia Research & Consulting, Scuola Agraria del Parco di Monza, HDRA Consultants, ZREU and LDK ECOon behalf of ECOTEC Research & Consulting
127
urban and rural scenarios. It will also examine probable differences between thesituations in Northern and Southern Europe.

Economic Analysis of Options for Managing Biodegradable Municipal Waste � Final Report
Eunomia Research & Consulting, Scuola Agraria del Parco di Monza, HDRA Consultants, ZREU and LDK ECOon behalf of ECOTEC Research & Consulting
128
Process characteristics
In general, the analysis above highlighted the advantages attributed to thermophilicdigestion in terms of pathogen destruction, biogas production rate, retention time, etc.Therefore in spite of it being comparatively underused in comparison with mesophilicdigestion (62% of AD plants operate at mesophilic temperatures across Europe), thisstudy will consider the thermophilic process as best practice as it combines hygienicaspects with high rates of digestion.
Urban digestion
There are a number of important factors associated with urban areas relevant todigestion. A high biogas production would be favourable as it would lead to a lowerdigestate output (digestate is not as important an end-product in more populatedareas). This high biogas production subsequently leads to more energy recovery interms of electricity and also heat because a higher population density means morecan be utilised. Therefore, this supports the argument for thermophilic digestion. Itshould be noted that as mentioned above, in general larger centralised plants requirelarger proportions of their generated electricity for plant operation. In terms ofcapacity, the argument here is for larger centralised plants, compared with rural areas,which maximise cost efficiency (plant and collection) and serve a higher percentage ofthe population, thus diverting a significant portion of biowaste from landfill.
Rural digestion
Classically anaerobic digestion is more widespread in rural areas where the needs arequite different. AD can be a valuable process for farmers in particular, in terms ofadditional income (end-product sales), reduced odour dispersion in comparison withthe spreading of manure, and digested manure is more homogenous and easier toapply. There will be a much higher demand for digestate for agricultural or horticulturalpurposes compared with urban areas and whilst that might contradict the argumentsarticulated above, end-product quality is a key factor. The higher-temperaturetechnology ensures a higher destruction of potentially toxic materials such aspathogens which make the digestate more useful, easier to handle and more hygienicin general. Whilst energy recovery is an important aspect, it is doubtful that all theenergy (heat and electricity) could be utilised on site. Smaller capacities are morelogical here because of the lower population densities and because of the possibilitiesof farm-based AD plants. This also raises the option of co-digestion (also potentiallyimportant for urban plants) with other wastes such as manure, an important factor butone which cannot be modelled in this study. However, AD's flexibility in co-digestingwaste from agricultural origin with municipal biowaste can make it preferablecompared with composting.
Important developments on this side are currently being reported for example inNorthern Italian Alpine Regions, where local regulations promote farm-scale ADfacilities to treat manure and source separated food waste.
Costs are detailed for centralised AD using source separated MSW in more urbanisedenvironments (see Table 37) and for on-farm digestion in rural areas (see Table 38).

Economic Analysis of Options for Managing Biodegradable Municipal Waste � Final Report
Eunomia Research & Consulting, Scuola Agraria del Parco di Monza, HDRA Consultants, ZREU and LDK ECOon behalf of ECOTEC Research & Consulting
129

Economic Analysis of Options for Managing Biodegradable Municipal Waste � Final Report
Eunomia Research & Consulting, Scuola Agraria del Parco di Monza, HDRA Consultants, ZREU and LDK ECOon behalf of ECOTEC Research & Consulting
130
Table 37. Costs For Best Practice Scenario Centralised Plant For TheTreatment Of 15,000 Tons Biodegradable Waste Per Year
Centralised ADProcessingcapacity
15.000 tonne biowaste per annum
Capital cost interest rate 7.5 %,operating time 10 years
70 Euro per tonne biowasteprocessing capacity
Operating cost 48 Euro per tonne biowasteValue of outputsSurplus Electricity 0.075 Euro/kWh 3.8 Euro per tonne biowasteHeat 0.02 Euro/kWh
(assuming that 40 %could be used)
2.4 Euro per tonne biowaste
Compost 10 Euro per tonneproduced
3 Euro per tonne biowaste
Net cost 108.8 Euro/ton
Source: ZREU (2000)
Table 38. Cost Data For On-Farm Anaerobic Digestion
Farm ADPlant capacity 2,500 tonne biowaste per annumCapital cost interest rate 7.5 %,
operating time 10 years30 Euro per tonne biowasteprocessing capacity
Operating cost 60 Euro per tonne biowasteValue of outputsSurplus Electricity 0.075 Euro/kWh 9 Euro per tonne biowasteHeat 0.02 Euro/kWh
(assuming that 25 %could be used as addedvalue)
1.5 Euro per tonne biowaste
Net cost 79.5 Euro/tonne
Source: ZREU (2000)
For centralised digestion, source-separated MSW is used and costs are higher at€108.8 per tonne. The on farm figures are based on a German plant the costs forwhich are €79.5 for the treatment. Note that both include a post-digestion compostingphase which is not typical in Denmark and Sweden (where digestate tends to beapplied direct to land). Swedish figures suggest that a 15-20,000 tonne digester wouldhave a gate fee of €60-70 excluding a post-digestion composting phase. Thissuggests the costs of the centralised digestion costs estimated above are in the rightarea for one which includes a composting stage to stabilise the digestate.

Economic Analysis of Options for Managing Biodegradable Municipal Waste � Final Report
Eunomia Research & Consulting, Scuola Agraria del Parco di Monza, HDRA Consultants, ZREU and LDK ECOon behalf of ECOTEC Research & Consulting
131
The best practice system used in centralised systems is assumed to operate witha post-digestion composting phase. In some countries where the process iscontrolled by farmers (such as Denmark) the digested material is applied withoutgoing through this type of stabilisation phase. This may reduce costs.26 The costdata used in this study are €80-110. Again, this can be compared with the costsquoted in the recent European Topic Centre for Waste (2001) report. There, operatingcosts are very low indeed, whilst capital costs are lower than for compost plants of thesame capacity. This has the effect of making anaerobic digestion appear a cheapertechnology than composting, even without forced aeration. Indeed, the operating costsfor composting without forced aeration are more than seven times those for quotedthe equivalent size anaerobic digestion plant. The ETCW figures appear low unless itis being assumed that extremely high revenues are generated from energy sales, or ifit is assumed that the aerobic phase is always omitted (with delivery of digestate directto farmers, so avoiding also the costs of waste water treatment).
26 Simon Lundberg of the Swedish EPA points out that in Sweden, the costs are between 60-70€ per tonne wherewet waste is applied to land.

Economic Analysis of Options for Managing Biodegradable Municipal Waste � Final Report
Eunomia Research & Consulting, Scuola Agraria del Parco di Monza, HDRA Consultants, ZREU and LDK ECOon behalf of ECOTEC Research & Consulting
132
66..00 RREESSUULLTTSS OOFF TTHHEE EECCOONNOOMMIICC AANNAALLYYSSIISS
66..11 FFiinnaanncciiaall aanndd EEccoonnoommiicc CCoossttss aanndd BBeenneeffiittss ooff SSeeppaarraatteeCCoolllleeccttiioonn
Bringing together the data concerning environmental and economic costs and benefitsof different waste management options is a process full of pitfalls. It is difficult enoughto find or generate reliable quantitative data on either aspect of any individualtreatment option. As shown in Section 4, assessment of the external costs of each ofthe treatments is inevitably incomplete given gaps in relevant scientific and economicrelationships. Section 5 illustrates that it is not only the external costs which aresubject to some conjecture. Within any given country, private costs for treatments alsoexhibit variation in accordance with local factors, scale, choice of technology, etc. Inthis context, it is quite a hazardous enterprise to seek to amalgamate the two sets ofdata.
As a minimum, one ought to have some confidence that the environmental costs andthe financial costs one is using at least relate to the same process. This is lessstraightforward than it might at first appear. First of all, not all incinerators in Europecurrently meet all the standards laid down in the most recent Incineration Directive, yetin the external cost modelling, it was effectively assumed that all of them do. Whereincinerators do not meet these standards, costs will be incurred in bringing them up tothese standards. Equally, where incinerators are routinely well within such limits, theenvironmental costs may be overstated relative to the actual situation.
The equivalent problem in respect of landfill is especially awkward to deal with. In theexternal cost analysis, it is assumed that landfills would be �well-behaved�, on thebasis that the time taken to introduce a policy on separate collection would probablybe such that the ramifications of the Landfill Directive would be being felt in thecountries concerned. However, the financial cost data relate, in some cases, tolandfills which are a long way from meeting the requirements of the Landfill Directive.As such, for many countries, the financial costs reported are almost certainly wellbelow those which would prevail if landfills of the standards assessed in this documentexisted in all countries. Furthermore, as diversion of material away from landfillproceeds under the Landfill Directive, the fill rates for landfills will decline, puttingupward pressure on gate fees (other things being equal). There is, therefore, adynamic in the process which is extraordinarily difficult to capture and whichconfounds any attempt to make sensible forward projections.
Having said that, to the extent that the Landfill Directive is concerned with diversion ofmaterials away from landfill, it could be argued that the key issues are how thediversion of material from landfill evolves over time. A policy requiring the separatecollection of biowastes will tend to shift the balance of diversion in favour ofcomposting and anaerobic digestion and away from alternatives such as incineration(and pyrolysis, gasification, mechanical biological treatment etc., which are notconsidered in this study). Even here, the future for treatments such as MBT and themore modular scale thermal treatments is difficult to estimate. Certainly, it wouldappear that mass-burn incineration plants would become less favoured, whilst theremaining residual fractions could be treated by combinations of MBT and anaerobicdigestion, pyrolysis and gasification.

Economic Analysis of Options for Managing Biodegradable Municipal Waste � Final Report
Eunomia Research & Consulting, Scuola Agraria del Parco di Monza, HDRA Consultants, ZREU and LDK ECOon behalf of ECOTEC Research & Consulting
133
For the financial cost data, the figures from Chapter 5 were used. This suggests thatthe separate collection itself will cost an additional €0-15 per tonne (low and highadditional costs under best practice).
The figures used for compost and anaerobic digestion are given in Table 39 below.These are representative of variation in choice of technology, variation in costs ofdisposal of rejects (which vary locally as much as they do nationally), the incomederived from sales of compost etc. For anaerobic digestion, assuming that thedigestate is de-watered and stabilised through an aerobic composting phase prior tobeing utilised as compost, figures of €80-110 were used.
Table 39. Financial Costs Used for Composting and Anaerobic Digestion
Process Low (€/t) High (€/t)Separate Collection (increment above standard residualcollection, expressed per tonne biowaste collected)
0 15
Composting 35 60Anaerobic Digestion 80 110Separate Collection Plus Composting 35 75Separate Collection Plus Anaerobic Digestion 80 125
66..11..11 AA NNoottee oonn MMeetthhooddoollooggyy
The approach taken in deriving the results which follow is to look at combinations ofscenarios where the results of the externality analysis, using both high and low unitdamage cost, are combined with the low and high cost figures for the differenttreatments. This gives broad ranges for the results. This is an appropriate approachrather than assuming that one can know what the �best� estimate of the external orprivate costs actually is in the given situation. The fact remains that without betterknowledge of the specific situations, positing so-called best estimates, or mid-pointestimates, can be misleading since these will frequently be taken as �the answer�whilst the more illuminating analysis concerning the ranges which may exist becomeslost.
The future private costs of the treatment options, and the external costs associatedwith each of those options, are both difficult to predict. For the most part the externalcosts of each option should fall as private costs increase.
66..22 SSwwiittcchhiinngg ffrroomm LLaannddffiillll ttoo CCoommppoossttiinngg
Table 40 below shows the external benefits, the private costs and the total economiccost of the switch from landfill to incineration. The figures in Table 40 showexternalities for the landfills operating at currently estimated gas collection efficienciesand private costs estimated at the current level. Landfill taxes are included in the finalrow although, arguably, doing so implies a degree of double counting of costs wheresuch taxes are intended to reflect the external costs of landfilling.

Economic Analysis of Options for Managing Biodegradable Municipal Waste � Final Report
Eunomia Research & Consulting, Scuola Agraria del Parco di Monza, HDRA Consultants, ZREU and LDK ECO on behalf of ECOTEC Research & Consulting134
Table 40. Net External Costs And Private Costs Of Change From Landfill To Composting (€ / tonne of waste switched,current landfill practice)
AU BE DE FI FR GE GR IR IT LUX NL
Low High Low High Low High Low High Low High Low High Low High Low High Low High Low High Low High
External Benefits
Raw Score (direct emissions only) = A 10.2 13.4 6.8 10.2 3.8 6.4 4.3 7.3 5.1 8.2 3.9 6.7 9.9 13.8 9.4 13.2 5.7 8.9 6.8 9.8 4.9 7.8
plus Avoided External Costs Energy = B 10.1 13.2 6.5 9.5 3.1 5.0 4.0 6.6 4.3 7.1 3.3 5.6 9.9 13.7 9.2 12.9 5.2 8.0 6.7 9.2 4.6 6.9
plus Disamenity = C 12.1 17.2 13.6 23.7 6.1 10.9 4.3 7.3 6.5 11.5 8.6 16.3 11.3 16.5 10.1 14.6 8.9 15.3 10.0 15.9 13.1 23.8
plus Avoided Private Costs Fertiliser = D 12.9 19.2 14.4 25.6 6.8 12.9 5.1 9.2 7.3 13.4 9.4 18.2 12.0 18.4 10.8 16.5 9.6 17.2 10.8 17.8 13.9 25.8
plus Avoided Private Costs of Pesticides = E 13.3 19.6 15.8 27.1 7.0 13.0 5.2 9.3 7.9 14.0 9.7 18.5 12.5 18.9 12.6 18.3 10.6 18.2 11.3 18.2 15.3 27.2
Private Costs
Landfill = F Low 55.0 55.0 52.0 52.0 44.0 44.0 28.0 28.0 31.0 31.0 35.0 35.0 5.0 5.0 34.0 34.0 50.0 50.0 123.0 123.0 75.0 75.0
High 110.0 110.0 56.0 56.0 44.0 44.0 56.0 56.0 85.0 85.0 220.0 220.0 21.0 21.0 78.0 78.0 70.0 70.0 147.0 147.0 75.0 75.0
Compost plus Separate Collection = G Low 35.0 35.0 35.0 35.0 35.0 35.0 35.0 35.0 35.0 35.0 35.0 35.0 35.0 35.0 35.0 35.0 35.0 35.0 35.0 35.0 35.0 35.0
High 75.0 75.0 75.0 75.0 75.0 75.0 75.0 75.0 75.0 75.0 75.0 75.0 75.0 75.0 75.0 75.0 75.0 75.0 75.0 75.0 75.0 75.0
Net Private Cost = (G � F) = H Low -20.0 -20.0 -17.0 -17.0 -9.0 -9.0 7.0 7.0 4.0 4.0 0.0 0.0 30.0 30.0 1.0 1.0 -15.0 -15.0 -88.0 -88.0 -40.0 -40.0
High -35.0 -35.0 19.0 19.0 31.0 31.0 19.0 19.0 -10.0 -10.0 -145.0 -145.0 54.0 54.0 -3.0 -3.0 5.0 5.0 -72.0 -72.0 0.0 0.0
Totals
Low -30.2 -33.4 -23.8 -27.2 -12.8 -15.4 2.7 -0.3 -1.1 -4.2 -3.9 -6.7 20.1 16.2 -8.4 -12.2 -20.7 -23.9 -94.8 -97.8 -44.9 -47.8Costs Net of External Benefits, Raw Score =H - A
High -45.2 -48.4 12.2 8.8 27.2 24.6 14.7 11.7 -15.1 -18.2 -148.9 -151.7 44.1 40.2 -12.4 -16.2 -0.7 -3.9 -78.8 -81.8 -4.9 -7.8
Low -30.1 -33.2 -23.5 -26.5 -12.1 -14.0 3.0 0.4 -0.3 -3.1 -3.3 -5.6 20.1 16.3 -8.2 -11.9 -20.2 -23.0 -94.7 -97.2 -44.6 -46.9Costs Net of External Benefits, Including AvoidedExternal Costs of Energy = H - B
High -45.1 -48.2 12.5 9.5 27.9 26.0 15.0 12.4 -14.3 -17.1 -148.3 -150.6 44.1 40.3 -12.2 -15.9 -0.2 -3.0 -78.7 -81.2 -4.6 -6.9
Low -73.1 -76.2 -75.5 -78.5 -62.1 -64.0 -12.0 -14.6 -9.3 -12.1 -3.3 -5.6 20.1 16.3 -30.2 -33.9 -30.2 -33.0 -94.7 -97.2 -104.6 -106.9Costs Net of External Benefits, Including AvoidedExternal Costs of Energy and Landfill Tax
= H-B + landfill taxHigh -88.1 -91.2 -42.5 -42.5 -22.1 -24.0 0.0 -2.6 -23.3 -26.1 -148.3 -150.6 44.1 40.3 -34.2 -37.9 -50.2 -53.0 -78.7 -81.2 -64.6 -66.9

Economic Analysis of Options for Managing Biodegradable Municipal Waste � Final Report
Eunomia Research & Consulting, Scuola Agraria del Parco di Monza, HDRA Consultants, ZREU and LDK ECO on behalf of ECOTEC Research & Consulting 135
PO SP SW UK CYP CZ EST HUN POL SLO
External Benefits Low High Low High Low High Low High Low High Low High Low High Low High Low High Low High
External Benefits
Raw Score (direct emissions only) = A 8.06 9.16 7.45 8.42 3.81 4.73 3.41 4.04 9.72 10.91 9.72 10.91 9.72 10.90 8.90 10.07 9.74 10.99 8.91 10.12
plus Avoided External Costs Energy = B 7.96 8.90 7.28 8.08 3.50 4.01 2.88 2.97 9.66 10.79 9.66 10.79 9.65 10.78 8.83 9.95 9.68 10.87 8.85 9.99
plus Disamenity = C 9.81 12.61 8.55 10.62 4.06 5.14 8.09 13.39 10.91 13.30 11.68 14.84 10.17 11.82 10.50 13.27 11.61 14.74 10.35 13.00
plus Avoided Private Costs Fertiliser = D 10.59 14.54 9.32 12.55 4.83 7.05 8.85 15.30 11.67 15.21 12.45 16.75 10.94 13.73 11.27 15.20 12.38 16.65 11.12 14.93
plus Avoided Private Costs of Pesticides = E 11.23 15.18 9.57 12.79 4.95 7.18 9.54 15.99 13.15 16.69 13.93 18.23 11.13 13.92 11.74 15.67 13.82 18.10 11.77 15.58
Private Costs
Landfill = F Low 6 6 6 6 22 22 10 10 5 5 15 15 15 15 15 15 15 15 5 5
High 15 15 30 30 82 82 34 34 21 21 25 25 25 25 25 25 25 25 5 5
Compost plus Separate Collection = G Low 35 35 35 35 35 35 35 35 35 35 35 35 35 35 35 35 35 35 35 35
High 75 75 75 75 75 75 75 75 75 75 75 75 75 75 75 75 75 75 75 75
Net Private Cost = (G � F) = H Low 29 29 29 29 13 13 25 25 30 30 20 20 20 20 20 20 20 20 30 30
High 60 60 45 45 -7 -7 41 41 54 54 50 50 50 50 50 50 50 50 70 70
Totals
Low 20.94 19.84 21.55 20.58 9.19 8.27 21.59 20.96 20.28 19.09 10.28 9.09 10.28 9.10 11.10 9.93 10.26 9.01 21.09 19.88Costs Net of External Benefits, Raw Score =H - A
High 51.94 50.84 37.55 36.58-
10.81-
11.73 37.59 36.96 44.28 43.09 40.28 39.09 40.28 39.10 41.10 39.93 40.26 39.01 61.09 59.88
Low 21.04 20.10 21.72 20.92 9.50 8.99 22.12 22.03 20.34 19.21 10.34 9.21 10.35 9.22 11.17 10.05 10.32 9.13 21.15 20.01Costs Net of External Benefits, Including Avoided External Costs ofEnergy = H - B
High 52.04 51.10 37.72 36.92-
10.50-
11.01 38.12 38.03 44.34 43.21 40.34 39.21 40.35 39.22 41.17 40.05 40.32 39.13 61.15 60.01
Low 21.0 20.1 21.7 20.9 -20.5 -21.0 3.1 3.0 20.3 19.2 9.3 8.2 10.3 9.2 11.2 10.1 10.3 9.1 21.2 20.0Costs Net of External Benefits, Including Avoided External Costs ofEnergy and Landfill Tax
= H-B + landfill taxHigh 52.0 51.1 37.7 36.9 -40.5 -41.0 19.1 19.0 44.3 43.2 39.3 38.2 40.3 39.2 41.2 40.1 40.3 39.1 61.2 60.0

Economic Analysis of Options for Managing Biodegradable Municipal Waste � Final Report
Eunomia Research & Consulting, Scuola Agraria del Parco di Monza, HDRA Consultants, ZREU and LDK ECO onbehalf of ECOTEC Research & Consulting
136
66..22..11 EExxtteerrnnaall BBeenneeffiittss
These vary across countries depending upon the estimates of gas collection efficiency.For countries with landfills which perform well in this respect (e.g. Germany, UnitedKingdom), external benefits can be as low as €3-4 per tonne. Where landfills performless well (e.g. Accession States, Greece), benefits are of the order €10 per tonne. Italmost certainly the case that this analysis does not pick up all the benefits of the switchowing to the incomplete nature of the analysis.
In future, the performance of landfills in the countries where performance is less goodwill improve. This will increase costs and reduce the benefits of the switch. Hence, inTable 41, the results are shown for the case in which all countries have landfills whichperform well. The landfills are characterised by the following parameters:
Oxidation rate 10%
Landfill gas capture 10%
Used for energy recovery 0%
The private costs of landfilling are estimated to rise to €55 in all countries where gatefees are currently estimated below this.
In this case, the external benefits of the switch are much lower. This is due to the factthat in the relatively high performance landfill being posited, a lot of methane is capturedand converted to carbon dioxide. The process of methanogenesis is effectively occurringover a more extended period of time (in the modelling) than in compost, where much ofthe carbon is liberated swiftly as carbon dioxide in the composting process. This meansthat carbon dioxide and methane emissions (which are reduced owing to oxidation andhigh capture rates for flaring / energy recovery) from landfill are reduced by the effect ofdiscounting. The same is true to some extent of composting, but only for the carbondioxide emissions from the organic matter in the composted material.
The analysis, such as it stands, is also significantly affected by how one treats theproduction of energy from landfill gas, and on the external costs associated with energyuse at the composting site. The greater both of these become, the more the benefitsassociated with switching to composting and away from landfill (as estimated here) fall.Indeed, the net benefits can switch negative, as indicated in the results in the Table.
66..22..22 PPrriivvaattee CCoossttss
Unsuprisingly, in those countries where most headway has been made with composting,the net private costs of the switch are negative. Arguably, this explains the progressmade. It should be made clear, however, that whether or not a landfill tax is in place isnot the key factor in ensuring the switch can occur at negative cost. This itself is animportant observation since it suggests a need to understand the variation in privatecosts better than the present state of knowledge allows.

Economic Analysis of Options for Managing Biodegradable Municipal Waste � Final Report
Eunomia Research & Consulting, Scuola Agraria del Parco di Monza, HDRA Consultants, ZREU and LDK ECO onbehalf of ECOTEC Research & Consulting
137
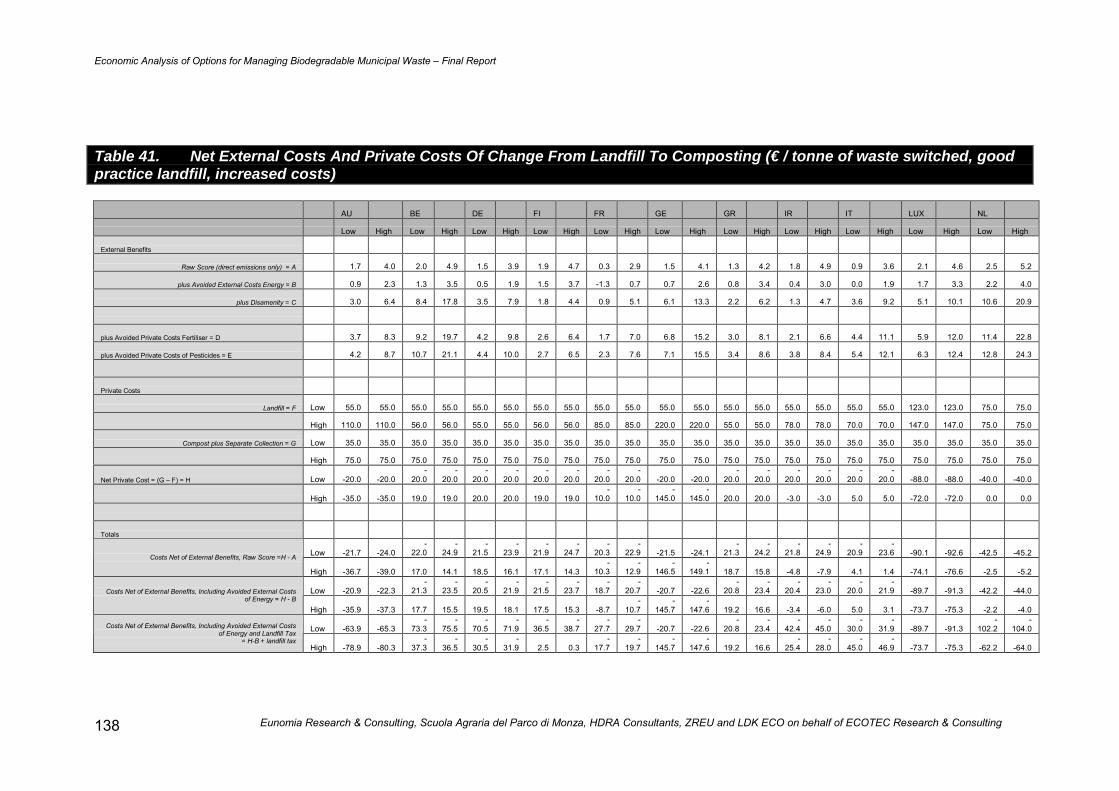
Economic Analysis of Options for Managing Biodegradable Municipal Waste � Final Report
Eunomia Research & Consulting, Scuola Agraria del Parco di Monza, HDRA Consultants, ZREU and LDK ECO on behalf of ECOTEC Research & Consulting138
Table 41. Net External Costs And Private Costs Of Change From Landfill To Composting (€ / tonne of waste switched, goodpractice landfill, increased costs)
AU BE DE FI FR GE GR IR IT LUX NL
Low High Low High Low High Low High Low High Low High Low High Low High Low High Low High Low High
External Benefits
Raw Score (direct emissions only) = A 1.7 4.0 2.0 4.9 1.5 3.9 1.9 4.7 0.3 2.9 1.5 4.1 1.3 4.2 1.8 4.9 0.9 3.6 2.1 4.6 2.5 5.2
plus Avoided External Costs Energy = B 0.9 2.3 1.3 3.5 0.5 1.9 1.5 3.7 -1.3 0.7 0.7 2.6 0.8 3.4 0.4 3.0 0.0 1.9 1.7 3.3 2.2 4.0
plus Disamenity = C 3.0 6.4 8.4 17.8 3.5 7.9 1.8 4.4 0.9 5.1 6.1 13.3 2.2 6.2 1.3 4.7 3.6 9.2 5.1 10.1 10.6 20.9
plus Avoided Private Costs Fertiliser = D 3.7 8.3 9.2 19.7 4.2 9.8 2.6 6.4 1.7 7.0 6.8 15.2 3.0 8.1 2.1 6.6 4.4 11.1 5.9 12.0 11.4 22.8
plus Avoided Private Costs of Pesticides = E 4.2 8.7 10.7 21.1 4.4 10.0 2.7 6.5 2.3 7.6 7.1 15.5 3.4 8.6 3.8 8.4 5.4 12.1 6.3 12.4 12.8 24.3
Private Costs
Landfill = F Low 55.0 55.0 55.0 55.0 55.0 55.0 55.0 55.0 55.0 55.0 55.0 55.0 55.0 55.0 55.0 55.0 55.0 55.0 123.0 123.0 75.0 75.0
High 110.0 110.0 56.0 56.0 55.0 55.0 56.0 56.0 85.0 85.0 220.0 220.0 55.0 55.0 78.0 78.0 70.0 70.0 147.0 147.0 75.0 75.0
Compost plus Separate Collection = G Low 35.0 35.0 35.0 35.0 35.0 35.0 35.0 35.0 35.0 35.0 35.0 35.0 35.0 35.0 35.0 35.0 35.0 35.0 35.0 35.0 35.0 35.0
High 75.0 75.0 75.0 75.0 75.0 75.0 75.0 75.0 75.0 75.0 75.0 75.0 75.0 75.0 75.0 75.0 75.0 75.0 75.0 75.0 75.0 75.0
Net Private Cost = (G � F) = H Low -20.0 -20.0-
20.0-
20.0-
20.0-
20.0-
20.0-
20.0-
20.0-
20.0 -20.0 -20.0-
20.0-
20.0-
20.0-
20.0-
20.0-
20.0 -88.0 -88.0 -40.0 -40.0
High -35.0 -35.0 19.0 19.0 20.0 20.0 19.0 19.0-
10.0-
10.0-
145.0-
145.0 20.0 20.0 -3.0 -3.0 5.0 5.0 -72.0 -72.0 0.0 0.0
Totals
Low -21.7 -24.0-
22.0-
24.9-
21.5-
23.9-
21.9-
24.7-
20.3-
22.9 -21.5 -24.1-
21.3-
24.2-
21.8-
24.9-
20.9-
23.6 -90.1 -92.6 -42.5 -45.2Costs Net of External Benefits, Raw Score =H - A
High -36.7 -39.0 17.0 14.1 18.5 16.1 17.1 14.3-
10.3-
12.9-
146.5-
149.1 18.7 15.8 -4.8 -7.9 4.1 1.4 -74.1 -76.6 -2.5 -5.2
Low -20.9 -22.3-
21.3-
23.5-
20.5-
21.9-
21.5-
23.7-
18.7-
20.7 -20.7 -22.6-
20.8-
23.4-
20.4-
23.0-
20.0-
21.9 -89.7 -91.3 -42.2 -44.0Costs Net of External Benefits, Including Avoided External Costsof Energy = H - B
High -35.9 -37.3 17.7 15.5 19.5 18.1 17.5 15.3 -8.7-
10.7-
145.7-
147.6 19.2 16.6 -3.4 -6.0 5.0 3.1 -73.7 -75.3 -2.2 -4.0
Low -63.9 -65.3-
73.3-
75.5-
70.5-
71.9-
36.5-
38.7-
27.7-
29.7 -20.7 -22.6-
20.8-
23.4-
42.4-
45.0-
30.0-
31.9 -89.7 -91.3-
102.2-
104.0Costs Net of External Benefits, Including Avoided External Costsof Energy and Landfill Tax
= H-B + landfill taxHigh -78.9 -80.3
-37.3
-36.5
-30.5
-31.9 2.5 0.3
-17.7
-19.7
-145.7
-147.6 19.2 16.6
-25.4
-28.0
-45.0
-46.9 -73.7 -75.3 -62.2 -64.0
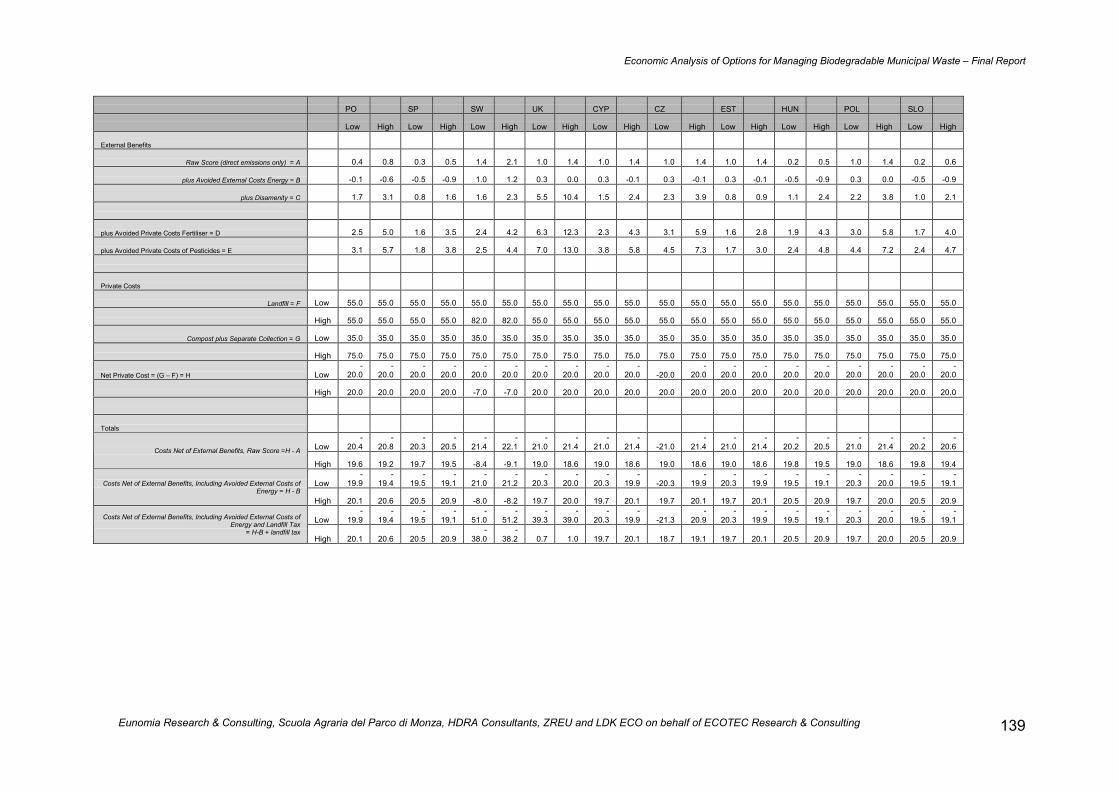
Economic Analysis of Options for Managing Biodegradable Municipal Waste � Final Report
Eunomia Research & Consulting, Scuola Agraria del Parco di Monza, HDRA Consultants, ZREU and LDK ECO on behalf of ECOTEC Research & Consulting 139
PO SP SW UK CYP CZ EST HUN POL SLO
Low High Low High Low High Low High Low High Low High Low High Low High Low High Low High
External Benefits
Raw Score (direct emissions only) = A 0.4 0.8 0.3 0.5 1.4 2.1 1.0 1.4 1.0 1.4 1.0 1.4 1.0 1.4 0.2 0.5 1.0 1.4 0.2 0.6
plus Avoided External Costs Energy = B -0.1 -0.6 -0.5 -0.9 1.0 1.2 0.3 0.0 0.3 -0.1 0.3 -0.1 0.3 -0.1 -0.5 -0.9 0.3 0.0 -0.5 -0.9
plus Disamenity = C 1.7 3.1 0.8 1.6 1.6 2.3 5.5 10.4 1.5 2.4 2.3 3.9 0.8 0.9 1.1 2.4 2.2 3.8 1.0 2.1
plus Avoided Private Costs Fertiliser = D 2.5 5.0 1.6 3.5 2.4 4.2 6.3 12.3 2.3 4.3 3.1 5.9 1.6 2.8 1.9 4.3 3.0 5.8 1.7 4.0
plus Avoided Private Costs of Pesticides = E 3.1 5.7 1.8 3.8 2.5 4.4 7.0 13.0 3.8 5.8 4.5 7.3 1.7 3.0 2.4 4.8 4.4 7.2 2.4 4.7
Private Costs
Landfill = F Low 55.0 55.0 55.0 55.0 55.0 55.0 55.0 55.0 55.0 55.0 55.0 55.0 55.0 55.0 55.0 55.0 55.0 55.0 55.0 55.0
High 55.0 55.0 55.0 55.0 82.0 82.0 55.0 55.0 55.0 55.0 55.0 55.0 55.0 55.0 55.0 55.0 55.0 55.0 55.0 55.0
Compost plus Separate Collection = G Low 35.0 35.0 35.0 35.0 35.0 35.0 35.0 35.0 35.0 35.0 35.0 35.0 35.0 35.0 35.0 35.0 35.0 35.0 35.0 35.0
High 75.0 75.0 75.0 75.0 75.0 75.0 75.0 75.0 75.0 75.0 75.0 75.0 75.0 75.0 75.0 75.0 75.0 75.0 75.0 75.0
Net Private Cost = (G � F) = H Low-
20.0-
20.0-
20.0-
20.0-
20.0-
20.0-
20.0-
20.0-
20.0-
20.0 -20.0-
20.0-
20.0-
20.0-
20.0-
20.0-
20.0-
20.0-
20.0-
20.0
High 20.0 20.0 20.0 20.0 -7.0 -7.0 20.0 20.0 20.0 20.0 20.0 20.0 20.0 20.0 20.0 20.0 20.0 20.0 20.0 20.0
Totals
Low-
20.4-
20.8-
20.3-
20.5-
21.4-
22.1-
21.0-
21.4-
21.0-
21.4 -21.0-
21.4-
21.0-
21.4-
20.2-
20.5-
21.0-
21.4-
20.2-
20.6Costs Net of External Benefits, Raw Score =H - A
High 19.6 19.2 19.7 19.5 -8.4 -9.1 19.0 18.6 19.0 18.6 19.0 18.6 19.0 18.6 19.8 19.5 19.0 18.6 19.8 19.4
Low-
19.9-
19.4-
19.5-
19.1-
21.0-
21.2-
20.3-
20.0-
20.3-
19.9 -20.3-
19.9-
20.3-
19.9-
19.5-
19.1-
20.3-
20.0-
19.5-
19.1Costs Net of External Benefits, Including Avoided External Costs ofEnergy = H - B
High 20.1 20.6 20.5 20.9 -8.0 -8.2 19.7 20.0 19.7 20.1 19.7 20.1 19.7 20.1 20.5 20.9 19.7 20.0 20.5 20.9
Low-
19.9-
19.4-
19.5-
19.1-
51.0-
51.2-
39.3-
39.0-
20.3-
19.9 -21.3-
20.9-
20.3-
19.9-
19.5-
19.1-
20.3-
20.0-
19.5-
19.1Costs Net of External Benefits, Including Avoided External Costs ofEnergy and Landfill Tax
= H-B + landfill taxHigh 20.1 20.6 20.5 20.9
-38.0
-38.2 0.7 1.0 19.7 20.1 18.7 19.1 19.7 20.1 20.5 20.9 19.7 20.0 20.5 20.9
Economic Analysis of Options for Managing Biodegradable Municipal Waste � Final Report
Eunomia Research & Consulting, Scuola Agraria del Parco di Monza, HDRA Consultants, ZREU and LDK ECO onbehalf of ECOTEC Research & Consulting
140
In many respects, it should not be so surprising that landfills might have higher coststhan composting plants. The emissions from composting are, in the main, more benignthan those from landfills, which are also likely to be less easily controlled. The potentialfor accidents at landfill sites, as well as long-term, irreversible damage to groundwaters,may justify measures to control landfill sites more closely, though the external benefitsderived from this are extremely difficult to quantify. This in turn relates to the nature ofthe materials being treated. Source separated biowastes, where the process is well-managed, can be dealt with in the absence of major risks whilst landfills, because of theheterogeneity of input wastes, have to be designed to cope with a range of materials.The composting process takes place over a relatively short period of time, whereas thecosts of landfilling have much to do with aftercare once the material has been mademore or less inaccessible (especially following implementation of the Landfill Directive).
It is difficult to look at the above Table without passing comment on the enormousvariation in the net private costs across countries. This is a reflection of the variation inlandfill gate fees across the countries being assessed. This variation is deserving of amore detailed study in its own right to seek to understand the source of the variation. It isto be expected that these would converge over time, but there is also good reason tobelieve that complete convergence is a long way off. Several countries and / or regionsnow have, or are soon to implement, bans on specific wastes, or, as in Austria andGermany, bans on landfilling of wastes without first pre-treating them.
66..22..33 CCoossttss NNeett ooff EExxtteerrnnaall BBeenneeffiittss
The costs net of external benefits are shown to shed some light upon whether theexternal benefits generated are worth paying for. A negative figure suggests that thebenefits exceed the costs of the change. Where the costs are positive, this suggests thatthe ratio of quantifiable benefits to costs is less than one. In theory, this implies thechange is not something worthy of current investment. In this case, however, theincomplete nature of the analysis makes such statements difficult to make with anycertainty.
Table 40 shows that the net cost-benefit balance is not negative for al countries. Figuresare positive for Greece, Portugal, Spain, the UK and the Accession States. Table 41indicates that in the scenario in which the landfills perform well, but where the costs arehigher, the countries for which the balance is negative are Finland, Greece, Portugal,Spain and the Accession States, but only in the high cost scenario. This shows that forthis scenario, the benefits from the switch fall, but in the low cost scenario the costs ofthe switch are lower than the costs for separate collection and composting.
The key issues seem to be a) whether the landfill gate fees are greater or less than theincremental costs of source separation plus the gate fee for composting in future; and b)the degree to which the omissions on the externality assessment affect the analysis. Theformer question will be influenced by how much the costs for landfilling will increase as aconsequence of implementation of the Landfill Directive (since the external costs andbenefits are assessed with respect to a landfill performing at �post-implementation�levels).
Economic Analysis of Options for Managing Biodegradable Municipal Waste � Final Report
Eunomia Research & Consulting, Scuola Agraria del Parco di Monza, HDRA Consultants, ZREU and LDK ECO onbehalf of ECOTEC Research & Consulting
141
66..22..44 CCoommmmeenntt oonn LLaannddffiillll TTaaxxeess
Looking at the differential external costs of landfill and composting, one could look at thelevel of landfill taxes and argue that they are too high (given the absence of similarinstruments applied to composting). This is less than clear.
First of all, the incompleteness of the externality assessments cautions against suchstatements. In the case of landfill, the externalities left unquantified are without exception�negative externalities�. Secondly, the orthodox interpretation implied by such a commentsuggests that there is no room for alternative rationales for the existence of landfill taxes.Different countries have different reasons for introducing such instruments. Arguably,landfill / waste taxes are very useful revenue raising instruments from the perspective ofTreasuries. More likely, the design of such taxes is intended to a) encourage wasteminimisation and b) encourage a shift in waste management up the waste managementhierarchy. In this context, it is worth noting that a number of studies have suggested thatthe net external benefits of recycling a typical basket of recyclables vis a viscompostables would be of the order €100 and more. As a means to encourage recycling,therefore, and source separation more generally, landfill / waste taxes are not devoid ofutility and are not excessive.
66..33 SSwwiittcchhiinngg ffrroomm LLaannddffiillll ttoo AAnnaaeerroobbiicc DDiiggeessttiioonn
Tables 42 and 43 below shows the external benefits, the private costs and the totaleconomic costs of the switch from landfill to anaerobic digestion. Again, this is shown forcurrent practice landfilling (Table 42) and for the case in which landfills perform betterand are higher in cost (Table 43).
66..33..11 EExxtteerrnnaall BBeenneeffiittss
Measured with reference to the raw scores, the external benefits associated with thisswitch are generally similar to those for the switch from landfill to composting. They alsofollow the same pattern as indicated above for composting. However, once oneintroduces avoided burdens associated with energy generated from AD, the externalbenefits move more strongly in favour of AD.
Again, as with the switch from landfill to compost, the external benefits are much smallerwhere landfills perform better. There is, however, no case where the benefits arenegative under either scenario. This is due to the external benefits of energy production.
66..33..22 PPrriivvaattee CCoossttss
Despite the larger external benefits from AD, these come at a considerably increasedprice. Hence, the net private costs are much less favourable than in the switch fromlandfilling to composting. Indeed, in Table 43 (where landfill costs are high) the costs ofthe switch are positive in most cases.
Economic Analysis of Options for Managing Biodegradable Municipal Waste � Final Report
Eunomia Research & Consulting, Scuola Agraria del Parco di Monza, HDRA Consultants, ZREU and LDK ECO onbehalf of ECOTEC Research & Consulting
142

Economic Analysis of Options for Managing Biodegradable Municipal Waste � Final Report
Eunomia Research & Consulting, Scuola Agraria del Parco di Monza, HDRA Consultants, ZREU and LDK ECO on behalf of ECOTEC Research & Consulting 143
Table 42. Net External Costs And Private Costs Of Change From Landfill To AD (€ / tonne of waste switched, current landfillpractice)
AU BE DE FI FR GE GR IR IT LUX NL
Low High Low High Low High Low High Low High Low High Low High Low High Low High Low High Low High
External Benefits
Raw Score (direct emissions only) = A 10.5 14.2 7.3 10.7 4.2 7.1 4.2 7.0 6.2 9.6 4.3 7.3 9.8 13.5 10.1 13.8 6.1 9.6 6.8 9.9 4.8 7.9plus Avoided External Costs Energy (from landfill =
B) 10.5 14.0 6.9 9.9 3.5 5.7 3.8 6.3 5.4 8.5 3.7 6.2 9.8 13.5 9.9 13.5 5.6 8.8 6.6 9.3 4.5 7.0plus Avoided External Costs Energy (from AD,
electricity) = C 11.5 19.2 7.9 14.3 4.9 11.6 4.5 9.3 7.6 15.5 4.8 10.8 10.4 16.1 11.8 19.3 7.0 14.1 7.1 13.1 5.0 10.8plus Avoided External Costs Energy (from AD, CHP)
= D 11.9 21.4 8.4 16.2 5.5 14.2 4.7 10.7 8.6 18.5 5.3 12.8 10.7 17.2 12.6 21.9 7.6 16.5 7.3 14.8 5.2 12.4
plus Landfill Disamenity = E 13.9 25.5 15.5 30.5 8.4 20.2 5.1 11.4 10.8 22.9 10.7 23.5 12.1 19.9 13.5 23.6 11.3 23.8 10.6 21.5 13.7 29.4
plus Avoided Private Costs Fertiliser = F 14.7 27.4 16.3 32.4 9.2 22.1 5.9 13.3 11.5 24.9 11.4 25.4 12.8 21.9 14.2 25.5 12.0 25.7 11.4 23.4 14.4 31.3
plus Avoided Private Costs of Pesticides = G 15.1 27.9 17.8 33.9 9.4 22.3 6.0 13.4 12.1 25.5 11.7 25.7 13.3 22.3 16.0 27.3 13.0 26.7 11.9 23.8 15.9 32.8
Private Costs
Landfill = H Low 55.0 55.0 52.0 52.0 44.0 44.0 28.0 28.0 31.0 31.0 35.0 35.0 5.0 5.0 34.0 34.0 50.0 50.0 123.0 123.0 75.0 75.0
High 110.0 110.0 56.0 56.0 44.0 44.0 56.0 56.0 85.0 85.0 220.0 220.0 21.0 21.0 78.0 78.0 70.0 70.0 147.0 147.0 75.0 75.0
AD plus Separate Collection = I Low 80.0 80.0 80.0 80.0 80.0 80.0 80.0 80.0 80.0 80.0 80.0 80.0 80.0 80.0 80.0 80.0 80.0 80.0 80.0 80.0 80.0 80.0
High 125.0 125.0 125.0 125.0 125.0 125.0 125.0 125.0 125.0 125.0 125.0 125.0 125.0 125.0 125.0 125.0 125.0 125.0 125.0 125.0 125.0 125.0
Net Private Cost = (I � H) = J Low 25.0 25.0 28.0 28.0 36.0 36.0 52.0 52.0 49.0 49.0 45.0 45.0 75.0 75.0 46.0 46.0 30.0 30.0 -43.0 -43.0 5.0 5.0
High 15.0 15.0 69.0 69.0 81.0 81.0 69.0 69.0 40.0 40.0 -95.0 -95.0 104.0 104.0 47.0 47.0 55.0 55.0 -22.0 -22.0 50.0 50.0Net Private Cost Including Tax= J - landfill tax = K Low -18.0 -18.0 -24.0 -24.0 -14.0 -14.0 37.0 37.0 40.0 40.0 45.0 45.0 75.0 75.0 24.0 24.0 20.0 20.0 -43.0 -43.0 -55.0 -55.0
High -28.0 -28.0 14.0 17.0 31.0 31.0 54.0 54.0 31.0 31.0 -95.0 -95.0 104.0 104.0 25.0 25.0 5.0 5.0 -22.0 -22.0 -10.0 -10.0
Total Costs Net of External Benefits
Low -28.5 -32.2 -31.3 -34.7 -18.2 -21.1 32.8 30.0 33.8 30.4 40.7 37.7 65.2 61.5 13.9 10.2 13.9 10.4 -49.8 -52.9 -59.8 -62.9Using Raw Score = K-A
High -38.5 -42.2 6.7 6.3 26.8 23.9 49.8 47.0 24.8 21.4 -99.3 -102.3 94.2 90.5 14.9 11.2 -1.1 -4.6 -28.8 -31.9 -14.8 -17.9
Low -29.5 -37.2 -31.9 -38.3 -18.9 -25.6 32.5 27.7 32.4 24.5 40.2 34.2 64.6 58.9 12.2 4.7 13.0 5.9 -50.1 -56.1 -60.0 -65.8Including Avoided External Costs of Energy (ADelectricity) = K-B
High -39.5 -47.2 6.1 2.7 26.1 19.4 49.5 44.7 23.4 15.5 -99.8 -105.8 93.6 87.9 13.2 5.7 -2.0 -9.1 -29.1 -35.1 -15.0 -20.8
Low -29.9 -39.4 -32.4 -40.2 -19.5 -28.2 32.3 26.3 31.4 21.5 39.7 32.2 64.3 57.8 11.4 2.1 12.4 3.5 -50.3 -57.8 -60.2 -67.4Including Avoided External Costs of Energy (ADCHP) = K-C
High -39.9 -49.4 5.6 0.8 25.5 16.8 49.3 43.3 22.4 12.5 -100.3 -107.8 93.3 86.8 12.4 3.1 -2.6 -11.5 -29.3 -36.8 -15.2 -22.4

Economic Analysis of Options for Managing Biodegradable Municipal Waste � Final Report
Eunomia Research & Consulting, Scuola Agraria del Parco di Monza, HDRA Consultants, ZREU and LDK ECO on behalf of ECOTEC Research & Consulting144
PO SP SW UK CYP CZ EST HUN POL SLO
Low High Low High Low High Low High Low High Low High Low High Low High Low High Low High
External Benefits
Raw Score (direct emissions only) = A 8.9 12.5 8.3 11.9 4.2 7.0 4.5 7.5 11.1 14.9 11.1 14.9 10.6 14.1 9.9 13.6 11.1 14.9 10.0 13.7
plus Avoided External Costs Energy (from landfill = B) 8.8 12.2 8.1 11.5 3.9 6.3 3.9 6.5 11.1 14.8 11.1 14.8 10.5 14.0 9.8 13.5 11.0 14.8 9.9 13.6plus Avoided External Costs Energy (from AD, electricity) =
C 9.6 16.4 9.1 15.9 4.5 9.3 4.9 10.8 12.1 19.3 12.1 19.3 11.6 18.5 10.9 18.0 12.1 19.3 10.9 18.1
plus Avoided External Costs Energy (from AD, CHP) = D 9.9 18.2 9.5 17.8 4.7 10.5 5.4 12.7 12.5 21.3 12.5 21.3 12.0 20.5 11.3 19.9 12.5 21.2 11.4 20.0
plus Landfill Disamenity = E 11.7 21.9 10.8 20.3 5.3 11.7 10.6 23.2 13.8 23.8 14.6 25.3 12.5 21.5 13.0 23.2 14.5 25.1 12.9 23.0
plus Avoided Private Costs Fertiliser = F 12.5 23.9 11.6 22.3 6.0 13.6 11.4 25.1 14.6 25.7 15.3 27.2 13.3 23.4 13.7 25.2 15.2 27.0 13.7 25.0
plus Avoided Private Costs of Pesticides = G 13.1 24.5 11.8 22.5 6.2 13.7 12.0 25.8 16.0 27.2 16.8 28.7 13.5 23.6 14.2 25.6 16.7 28.5 14.3 25.6
Private Costs
Landfill = H Low 6.0 6.0 6.0 6.0 22.0 22.0 10.0 10.0 5.0 5.0 15.0 15.0 15.0 15.0 15.0 15.0 15.0 15.0 5.0 5.0
High 15.0 15.0 30.0 30.0 82.0 82.0 34.0 34.0 21.0 21.0 25.0 25.0 25.0 25.0 25.0 25.0 25.0 25.0 5.0 5.0
AD plus Separate Collection = I Low 80.0 80.0 80.0 80.0 80.0 80.0 80.0 80.0 80.0 80.0 80.0 80.0 80.0 80.0 80.0 80.0 80.0 80.0 80.0 80.0
High 125.0 125.0 125.0 125.0 125.0 125.0 125.0 125.0 125.0 125.0 125.0 125.0 125.0 125.0 125.0 125.0 125.0 125.0 125.0 125.0
Net Private Cost = (I � H) = J Low 74.0 74.0 74.0 74.0 58.0 58.0 70.0 70.0 75.0 75.0 65.0 65.0 65.0 65.0 65.0 65.0 65.0 65.0 75.0 75.0
High 110.0 110.0 95.0 95.0 43.0 43.0 91.0 91.0 104.0 104.0 100.0 100.0 100.0 100.0 100.0 100.0 100.0 100.0 120.0 120.0Net Private Cost Including Tax= J - landfill tax = K Low 74.0 74.0 74.0 74.0 28.0 28.0 51.0 51.0 75.0 75.0 64.0 64.0 65.0 65.0 65.0 65.0 65.0 65.0 75.0 75.0
High 110.0 110.0 95.0 95.0 13.0 13.0 72.0 72.0 104.0 104.0 99.0 99.0 100.0 100.0 100.0 100.0 100.0 100.0 120.0 120.0
Total Costs Net of External Benefits
Low 65.1 61.5 65.7 62.1 23.8 21.0 46.5 43.5 63.9 60.1 52.9 49.1 54.4 50.9 55.1 51.4 53.9 50.1 65.0 61.3Using Raw Score = K-A
High 101.1 97.5 86.7 83.1 8.8 6.0 67.5 64.5 92.9 89.1 87.9 84.1 89.4 85.9 90.1 86.4 88.9 85.1 110.0 106.3
Low 64.4 57.6 64.9 58.1 23.5 18.7 46.1 40.2 62.9 55.7 51.9 44.7 53.4 46.5 54.1 47.0 52.9 45.7 64.1 56.9Including Avoided External Costs of Energy (AD electricity)= K-B
High 100.4 93.6 85.9 79.1 8.5 3.7 67.1 61.2 91.9 84.7 86.9 79.7 88.4 81.5 89.1 82.0 87.9 80.7 109.1 101.9
Low 64.1 55.8 64.5 56.2 23.3 17.5 45.6 38.3 62.5 53.7 51.5 42.7 53.0 44.5 53.7 45.1 52.5 43.8 63.6 55.0Including Avoided External Costs of Energy (AD CHP) = K-C
High 100.1 91.8 85.5 77.2 8.3 2.5 66.6 59.3 91.5 82.7 86.5 77.7 88.0 79.5 88.7 80.1 87.5 78.8 108.6 100.0

Economic Analysis of Options for Managing Biodegradable Municipal Waste � Final Report
Eunomia Research & Consulting, Scuola Agraria del Parco di Monza, HDRA Consultants, ZREU and LDK ECO on behalf of ECOTEC Research & Consulting 145
Table 43. Net External Costs And Private Costs Of Change From Landfill To AD (€ / tonne of waste switched, current landfillpractice)
AU BE DE FI FR GE GR IR IT LUX NL
Low High Low High Low High Low High Low High Low High Low High Low High Low High Low High Low High
External Benefits
Raw Score (direct emissions only) = A 2.0 4.8 2.5 5.4 1.9 4.5 1.8 4.4 1.4 4.4 1.9 4.7 1.1 4.0 2.5 5.5 1.4 4.4 2.0 4.7 2.4 5.3plus Avoided External Costs Energy (from landfill =
B) 1.3 3.1 1.8 4.0 0.9 2.6 1.4 3.4 -0.2 2.1 1.2 3.2 0.7 3.2 1.1 3.5 0.4 2.6 1.7 3.5 2.1 4.1tplus Avoided External Costs Energy (from AD,
electricity) = C 2.3 8.3 2.8 8.4 2.3 8.6 2.0 6.5 2.0 9.1 2.3 7.8 1.3 5.8 3.0 9.4 1.8 8.0 2.1 7.3 2.5 7.9plus Avoided External Costs Energy (from AD, CHP)
= D 2.8 10.6 3.2 10.3 2.9 11.2 2.3 7.9 3.0 12.1 2.7 9.8 1.6 6.9 3.8 12.0 2.4 10.4 2.3 8.9 2.7 9.5
plus Landfill Disamenity = E 4.8 14.7 10.4 24.5 5.8 17.1 2.6 8.6 5.2 16.5 8.1 20.5 3.0 9.6 4.7 13.7 6.0 17.7 5.7 15.7 11.2 26.5
plus Avoided Private Costs Fertiliser = F 5.6 16.6 11.1 26.4 6.6 19.0 3.4 10.5 6.0 18.5 8.8 22.4 3.7 11.6 5.5 15.6 6.8 19.6 6.5 17.6 12.0 28.4
plus Avoided Private Costs of Pesticides = G 6.0 17.0 12.6 27.9 6.8 19.2 3.5 10.6 6.6 19.1 9.1 22.7 4.2 12.0 7.2 17.4 7.8 20.6 6.9 18.0 13.4 29.8
Private Costs
Landfill = H Low 55.0 55.0 55.0 52.0 55.0 55.0 55.0 55.0 55.0 55.0 55.0 55.0 55.0 55.0 55.0 55.0 55.0 55.0 123.0 123.0 75.0 75.0
High 110.0 110.0 56.0 56.0 55.0 55.0 56.0 56.0 85.0 85.0 220.0 220.0 55.0 55.0 78.0 78.0 70.0 70.0 147.0 147.0 75.0 75.0
AD plus Separate Collection = I Low 80.0 80.0 80.0 80.0 80.0 80.0 80.0 80.0 80.0 80.0 80.0 80.0 80.0 80.0 80.0 80.0 80.0 80.0 80.0 80.0 80.0 80.0
High 125.0 125.0 125.0 125.0 125.0 125.0 125.0 125.0 125.0 125.0 125.0 125.0 125.0 125.0 125.0 125.0 125.0 125.0 125.0 125.0 125.0 125.0
Net Private Cost = (I � H) = J Low 25.0 25.0 25.0 28.0 25.0 25.0 25.0 25.0 25.0 25.0 25.0 25.0 25.0 25.0 25.0 25.0 25.0 25.0 -43.0 -43.0 5.0 5.0
High 15.0 15.0 69.0 69.0 70.0 70.0 69.0 69.0 40.0 40.0 -95.0 -95.0 70.0 70.0 47.0 47.0 55.0 55.0 -22.0 -22.0 50.0 50.0Net Private Cost Including Tax= J - landfill tax = K Low -18.0 -18.0 -27.0 -24.0 -25.0 -25.0 10.0 10.0 16.0 16.0 25.0 25.0 25.0 25.0 3.0 3.0 15.0 15.0 -43.0 -43.0 -55.0 -55.0
High -28.0 -28.0 14.0 17.0 20.0 20.0 54.0 54.0 31.0 31.0 -95.0 -95.0 70.0 70.0 25.0 25.0 5.0 5.0 -22.0 -22.0 -10.0 -10.0
Total Costs Net of External Benefits
Low -20.0 -22.8 -29.5 -29.4 -26.9 -29.5 8.2 5.6 14.6 11.6 23.1 20.3 23.9 21.0 0.5 -2.5 13.6 10.6 -45.0 -47.7 -57.4 -60.3Using Raw Score = K-A
High -30.0 -32.8 11.5 11.6 18.1 15.5 52.2 49.6 29.6 26.6 -96.9 -99.7 68.9 66.0 22.5 19.5 3.6 0.6 -24.0 -26.7 -12.4 -15.3
Low -20.3 -26.3 -29.8 -32.4 -27.3 -33.6 8.0 3.5 14.0 6.9 22.7 17.2 23.7 19.2 0.0 -6.4 13.2 7.0 -45.1 -50.3 -57.5 -62.9Including Avoided External Costs of Energy (ADelectricity) = K-B
High -30.3 -36.3 11.2 8.6 17.7 11.4 52.0 47.5 29.0 21.9 -97.3 -102.8 68.7 64.2 22.0 15.6 3.2 -3.0 -24.1 -29.3 -12.5 -17.9
Low -20.8 -28.6 -30.2 -34.3 -27.9 -36.2 7.7 2.1 13.0 3.9 22.3 15.2 23.4 18.1 -0.8 -9.0 12.6 4.6 -45.3 -51.9 -57.7 -64.5Including Avoided External Costs of Energy (ADCHP) = K-C
High -30.8 -38.6 10.8 6.7 17.1 8.8 51.7 46.1 28.0 18.9 -97.7 -104.8 68.4 63.1 21.2 13.0 2.6 -5.4 -24.3 -30.9 -12.7 -19.5

Economic Analysis of Options for Managing Biodegradable Municipal Waste � Final Report
Eunomia Research & Consulting, Scuola Agraria del Parco di Monza, HDRA Consultants, ZREU and LDK ECO on behalf of ECOTEC Research & Consulting146
PO SP SW UK CYP CZ EST HUN POL SLO
Low High Low High Low High Low High Low High Low High Low High Low High Low High Low High
External Benefits
Raw Score (direct emissions only) = A 1.2 4.1 1.1 3.9 1.8 4.5 2.1 4.9 2.4 5.4 2.4 5.4 1.9 4.6 1.2 4.0 2.4 5.3 1.2 4.1
plus Avoided External Costs Energy (from landfill = B) 0.7 2.7 0.4 2.5 1.4 3.5 1.4 3.5 1.7 3.9 1.7 3.9 1.2 3.1 0.4 2.6 1.7 3.9 0.5 2.7plus Avoided External Costs Energy (from AD, electricity) =
C 1.5 6.9 1.4 6.9 2.0 6.4 2.4 7.9 2.7 8.4 2.7 8.4 2.2 7.6 1.5 7.1 2.7 8.4 1.5 7.2
plus Avoided External Costs Energy (from AD, CHP) = D 1.8 8.7 1.8 8.8 2.2 7.7 2.8 9.8 3.2 10.4 3.2 10.4 2.6 9.6 1.9 9.0 3.1 10.3 2.0 9.1
plus Landfill Disamenity = E 3.6 12.4 3.1 11.3 2.8 8.8 8.0 20.2 4.4 12.9 5.2 14.4 3.2 10.6 3.6 12.4 5.1 14.2 3.5 12.1
plus Avoided Private Costs Fertiliser = F 4.4 14.4 3.8 13.3 3.6 10.8 8.8 22.1 5.2 14.8 5.9 16.3 3.9 12.5 4.4 14.3 5.8 16.1 4.3 14.1
plus Avoided Private Costs of Pesticides = G 5.0 15.0 4.1 13.5 3.7 10.9 9.5 22.8 6.6 16.3 7.4 17.8 4.1 12.7 4.8 14.8 7.3 17.6 4.9 14.7
Private Costs
Landfill = H Low 55.0 55.0 55.0 55.0 55.0 55.0 55.0 55.0 55.0 55.0 55.0 55.0 55.0 55.0 55.0 55.0 55.0 55.0 55.0 55.0
High 55.0 55.0 55.0 55.0 82.0 82.0 55.0 55.0 55.0 55.0 55.0 55.0 55.0 55.0 55.0 55.0 55.0 55.0 55.0 55.0
AD plus Separate Collection = I Low 80.0 80.0 80.0 80.0 80.0 80.0 80.0 80.0 80.0 80.0 80.0 80.0 80.0 80.0 80.0 80.0 80.0 80.0 80.0 80.0
High 125.0 125.0 125.0 125.0 125.0 125.0 125.0 125.0 125.0 125.0 125.0 125.0 125.0 125.0 125.0 125.0 125.0 125.0 125.0 125.0
Net Private Cost = (I � H) = J Low 25.0 25.0 25.0 25.0 25.0 25.0 25.0 25.0 25.0 25.0 25.0 25.0 25.0 25.0 25.0 25.0 25.0 25.0 25.0 25.0
High 70.0 70.0 70.0 70.0 43.0 43.0 70.0 70.0 70.0 70.0 70.0 70.0 70.0 70.0 70.0 70.0 70.0 70.0 70.0 70.0Net Private Cost Including Tax= J - landfill tax = K Low 25.0 25.0 25.0 25.0 -5.0 -5.0 6.0 6.0 25.0 25.0 24.0 24.0 25.0 25.0 25.0 25.0 25.0 25.0 25.0 25.0
High 70.0 70.0 70.0 70.0 13.0 13.0 51.0 51.0 70.0 70.0 69.0 69.0 70.0 70.0 70.0 70.0 70.0 70.0 70.0 70.0
Total Costs Net of External Benefits
Low 23.8 20.9 23.9 21.1 -6.8 -9.5 3.9 1.1 22.6 19.6 21.6 18.6 23.1 20.4 23.8 21.0 22.6 19.7 23.8 20.9Using Raw Score = K-A
High 68.8 65.9 68.9 66.1 11.2 8.5 48.9 46.1 67.6 64.6 66.6 63.6 68.1 65.4 68.8 66.0 67.6 64.7 68.8 65.9
Low 23.5 18.1 23.6 18.1 -7.0 -11.4 3.6 -1.9 22.3 16.6 21.3 15.6 22.8 17.4 23.5 17.9 22.3 16.6 23.5 17.8Including Avoided External Costs of Energy (AD electricity)= K-B
High 68.5 63.1 68.6 63.1 11.0 6.6 48.6 43.1 67.3 61.6 66.3 60.6 67.8 62.4 68.5 62.9 67.3 61.6 68.5 62.8
Low 23.2 16.3 23.2 16.2 -7.2 -12.7 3.2 -3.8 21.8 14.6 20.8 13.6 22.4 15.4 23.1 16.0 21.9 14.7 23.0 15.9Including Avoided External Costs of Energy (AD CHP) = K-C
High 68.2 61.3 68.2 61.2 10.8 5.3 48.2 41.2 66.8 59.6 65.8 58.6 67.4 60.4 68.1 61.0 66.9 59.7 68.0 60.9

Economic Analysis of Options for Managing Biodegradable Municipal Waste � Final Report
Eunomia Research & Consulting, Scuola Agraria del Parco di Monza, HDRA Consultants, ZREU and LDK ECO onbehalf of ECOTEC Research & Consulting
147
66..33..33 CCoossttss NNeett ooff EExxtteerrnnaall BBeenneeffiittss
In the case of this switch, the costs net of benefits are more often positive (representinga positive cost to the change). This is the case for, in the low cost case, Finland, France,Greece, Italy, Portugal, Spain, UK and the Accession States. In the high cost case, thecosts net of benefits are only negative in Austria, Germany, Luxembourg and theNetherlands.
66..44 SSwwiittcchhiinngg ffrroomm IInncciinneerraattiioonn ttoo CCoommppoossttiinngg
Table 44 below shows the external benefits, the private costs and the total economiccost of the switch from landfill to incineration. Incineration taxes are shown where theyexist to illustrate how these would affect the calculus were they also to be included.
66..44..11 EExxtteerrnnaall BBeenneeffiittss
The external benefits in this case are rather larger than in the switch from landfill.Certainly, only where the incinerators are CHP plants, and under specific assumptionsoutlined earlier concerning the attribution of benefits to CHP incineration on the basis of�avoided burdens�, are there net disbenefits associated with switching to composting fromincineration. Furthermore, this is only true in certain countries (Denmark, France andItaly). These are the countries in which the gas-fired power plants assessed in theExternE study are the worst performers (in terms of their external costs) as assessed inthe ExternE national implementation studies (European Commission 1999a). To put itanother way, if these energy sources were cleaner, the benefits of a switch tocomposting become even less controversial than they already are.
This serves to underpin the way in which the benefits analysis hinges upon assumptionsabout �avoided burdens� regarding energy generation, especially where the casesexamined are energy from waste plants. The attribution of benefits to �energy generated�from combustion of combustible wastes is likely to be especially controversial sincesome experts suggest that the low calorific value of these wastes makes it possible that ifthey were to be combusted on their own, they would not generate �net energy�. Theanalysis is somewhat simplified in this regard since it simply uses calorific values ofwaste to derive net energy output without considering thresholds at which �net energy�might be delivered.
Furthermore, it should be recalled that the costs of incineration often incorporaterevenues for energy sales which are supported by energy recovery policies in thecountries concerned. Therefore, to the extent that these enhancements for the price ofenergy delivered are in recognition of �avoided burdens�, potentially, the avoided burdensare being double-counted through their inclusion in the private and the external costanalysis.
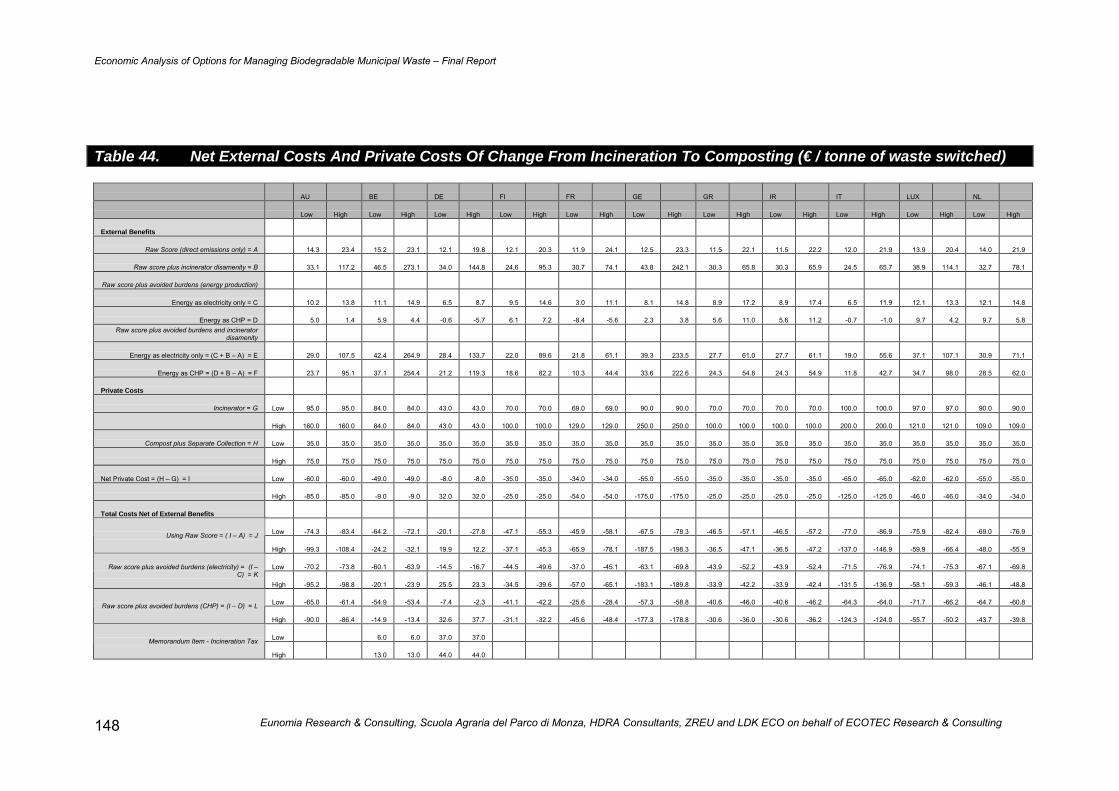
Economic Analysis of Options for Managing Biodegradable Municipal Waste � Final Report
Eunomia Research & Consulting, Scuola Agraria del Parco di Monza, HDRA Consultants, ZREU and LDK ECO on behalf of ECOTEC Research & Consulting148
Table 44. Net External Costs And Private Costs Of Change From Incineration To Composting (€ / tonne of waste switched)
AU BE DE FI FR GE GR IR IT LUX NL
Low High Low High Low High Low High Low High Low High Low High Low High Low High Low High Low High
External Benefits
Raw Score (direct emissions only) = A 14.3 23.4 15.2 23.1 12.1 19.8 12.1 20.3 11.9 24.1 12.5 23.3 11.5 22.1 11.5 22.2 12.0 21.9 13.9 20.4 14.0 21.9
Raw score plus incinerator disamenity = B 33.1 117.2 46.5 273.1 34.0 144.8 24.6 95.3 30.7 74.1 43.8 242.1 30.3 65.8 30.3 65.9 24.5 65.7 38.9 114.1 32.7 78.1
Raw score plus avoided burdens (energy production)
Energy as electricity only = C 10.2 13.8 11.1 14.9 6.5 8.7 9.5 14.6 3.0 11.1 8.1 14.8 8.9 17.2 8.9 17.4 6.5 11.9 12.1 13.3 12.1 14.8
Energy as CHP = D 5.0 1.4 5.9 4.4 -0.6 -5.7 6.1 7.2 -8.4 -5.6 2.3 3.8 5.6 11.0 5.6 11.2 -0.7 -1.0 9.7 4.2 9.7 5.8Raw score plus avoided burdens and incinerator
disamenity
Energy as electricity only = (C + B � A) = E 29.0 107.5 42.4 264.9 28.4 133.7 22.0 89.6 21.8 61.1 39.3 233.5 27.7 61.0 27.7 61.1 19.0 55.6 37.1 107.1 30.9 71.1
Energy as CHP = (D + B � A) = F 23.7 95.1 37.1 254.4 21.2 119.3 18.6 82.2 10.3 44.4 33.6 222.6 24.3 54.8 24.3 54.9 11.8 42.7 34.7 98.0 28.5 62.0
Private Costs
Incinerator = G Low 95.0 95.0 84.0 84.0 43.0 43.0 70.0 70.0 69.0 69.0 90.0 90.0 70.0 70.0 70.0 70.0 100.0 100.0 97.0 97.0 90.0 90.0
High 160.0 160.0 84.0 84.0 43.0 43.0 100.0 100.0 129.0 129.0 250.0 250.0 100.0 100.0 100.0 100.0 200.0 200.0 121.0 121.0 109.0 109.0
Compost plus Separate Collection = H Low 35.0 35.0 35.0 35.0 35.0 35.0 35.0 35.0 35.0 35.0 35.0 35.0 35.0 35.0 35.0 35.0 35.0 35.0 35.0 35.0 35.0 35.0
High 75.0 75.0 75.0 75.0 75.0 75.0 75.0 75.0 75.0 75.0 75.0 75.0 75.0 75.0 75.0 75.0 75.0 75.0 75.0 75.0 75.0 75.0
Net Private Cost = (H � G) = I Low -60.0 -60.0 -49.0 -49.0 -8.0 -8.0 -35.0 -35.0 -34.0 -34.0 -55.0 -55.0 -35.0 -35.0 -35.0 -35.0 -65.0 -65.0 -62.0 -62.0 -55.0 -55.0
High -85.0 -85.0 -9.0 -9.0 32.0 32.0 -25.0 -25.0 -54.0 -54.0 -175.0 -175.0 -25.0 -25.0 -25.0 -25.0 -125.0 -125.0 -46.0 -46.0 -34.0 -34.0
Total Costs Net of External Benefits
Low -74.3 -83.4 -64.2 -72.1 -20.1 -27.8 -47.1 -55.3 -45.9 -58.1 -67.5 -78.3 -46.5 -57.1 -46.5 -57.2 -77.0 -86.9 -75.9 -82.4 -69.0 -76.9Using Raw Score = ( I � A) = J
High -99.3 -108.4 -24.2 -32.1 19.9 12.2 -37.1 -45.3 -65.9 -78.1 -187.5 -198.3 -36.5 -47.1 -36.5 -47.2 -137.0 -146.9 -59.9 -66.4 -48.0 -55.9
Low -70.2 -73.8 -60.1 -63.9 -14.5 -16.7 -44.5 -49.6 -37.0 -45.1 -63.1 -69.8 -43.9 -52.2 -43.9 -52.4 -71.5 -76.9 -74.1 -75.3 -67.1 -69.8Raw score plus avoided burdens (electricity) = (I �C) = K
High -95.2 -98.8 -20.1 -23.9 25.5 23.3 -34.5 -39.6 -57.0 -65.1 -183.1 -189.8 -33.9 -42.2 -33.9 -42.4 -131.5 -136.9 -58.1 -59.3 -46.1 -48.8
Low -65.0 -61.4 -54.9 -53.4 -7.4 -2.3 -41.1 -42.2 -25.6 -28.4 -57.3 -58.8 -40.6 -46.0 -40.6 -46.2 -64.3 -64.0 -71.7 -66.2 -64.7 -60.8Raw score plus avoided burdens (CHP) = (I � D) = L
High -90.0 -86.4 -14.9 -13.4 32.6 37.7 -31.1 -32.2 -45.6 -48.4 -177.3 -178.8 -30.6 -36.0 -30.6 -36.2 -124.3 -124.0 -55.7 -50.2 -43.7 -39.8
Low 6.0 6.0 37.0 37.0 Memorandum Item - Incineration Tax
High 13.0 13.0 44.0 44.0

Economic Analysis of Options for Managing Biodegradable Municipal Waste � Final Report
Eunomia Research & Consulting, Scuola Agraria del Parco di Monza, HDRA Consultants, ZREU and LDK ECO on behalf of ECOTEC Research & Consulting 149
PO SP SW UK CYP CZ EST HUN POL SLO
Low High Low High Low High Low High Low High Low High Low High Low High Low High Low High
External Benefits
Raw Score (direct emissions only) = A 13.0 24.1 12.5 25.2 13.0 23.4 14.1 26.0 14.2 26.3 14.2 26.8 13.7 26.6 13.0 25.7 14.2 27.4 13.0 25.4
Raw score plus incinerator disamenity = B 22.4 39.7 37.5 181.5 31.8 73.4 45.3 244.8 26.7 70.1 32.9 120.5 26.2 57.8 31.7 119.4 32.9 121.1 25.5 37.9
Raw score plus avoided burdens (energy production)
Energy as electricity only = C 10.1 16.3 8.4 17.1 10.7 18.0 10.0 17.8 10.0 17.9 10.0 18.4 9.5 18.2 8.8 17.3 10.0 19.0 8.9 17.0
Energy as CHP = D 6.3 6.2 3.2 6.5 7.7 11.0 4.8 7.3 4.6 7.1 4.6 7.6 4.1 7.4 3.4 6.5 4.6 8.2 3.5 6.2
Raw score plus avoided burdens and incinerator disamenity
Energy as electricity only = (C + B � A) = E 19.4 31.9 33.4 173.3 29.4 68.0 41.3 236.6 22.5 61.7 28.7 112.2 22.0 49.5 27.5 111.1 28.8 112.7 21.4 29.5
Energy as CHP = (D + B � A) = F 15.6 21.9 28.2 162.8 26.4 61.0 36.0 226.1 17.1 50.9 23.4 101.4 16.6 38.7 22.2 100.3 23.4 102.0 16.0 18.7
Private Costs
Incinerator = G Low 70.0 70.0 18.0 18.0 37.0 37.0 41.0 41.0 70.0 70.0 25.0 25.0 70.0 70.0 70.0 70.0 60.0 60.0 70.0 70.0
High 100.0 100.0 51.0 51.0 87.0 87.0 66.0 66.0 100.0 100.0 40.0 40.0 100.0 100.0 100.0 100.0 60.0 60.0 100.0 100.0
Compost plus Separate Collection = H Low 35.0 35.0 35.0 35.0 35.0 35.0 35.0 35.0 35.0 35.0 35.0 35.0 35.0 35.0 35.0 35.0 35.0 35.0 35.0 35.0
High 75.0 75.0 75.0 75.0 75.0 75.0 75.0 75.0 75.0 75.0 75.0 75.0 75.0 75.0 75.0 75.0 75.0 75.0 75.0 75.0
Net Private Cost = (H � G) = I Low -35.0 -35.0 17.0 17.0 -2.0 -2.0 -6.0 -6.0 -35.0 -35.0 10.0 10.0 -35.0 -35.0 -35.0 -35.0 -25.0 -25.0 -35.0 -35.0
High -25.0 -25.0 24.0 24.0 -12.0 -12.0 9.0 9.0 -25.0 -25.0 35.0 35.0 -25.0 -25.0 -25.0 -25.0 15.0 15.0 -25.0 -25.0
Total Costs Net of External Benefits
Low -48.0 -59.1 4.5 -8.2 -15.0 -25.4 -20.1 -32.0 -49.2 -61.3 -4.2 -16.8 -48.7 -61.6 -48.0 -60.7 -39.2 -52.4 -48.0 -60.4Using Raw Score = ( I � A) = J
High -38.0 -49.1 11.5 -1.2 -25.0 -35.4 -5.1 -17.0 -39.2 -51.3 20.8 8.2 -38.7 -51.6 -38.0 -50.7 0.8 -12.4 -38.0 -50.4
Low -45.1 -51.3 8.6 -0.1 -12.7 -20.0 -16.0 -23.8 -45.0 -52.9 0.0 -8.4 -44.5 -53.2 -43.8 -52.3 -35.0 -44.0 -43.9 -52.0Raw score plus avoided burdens (electricity) = (I � C) = K
High -35.1 -41.3 15.6 6.9 -22.7 -30.0 -1.0 -8.8 -35.0 -42.9 25.0 16.6 -34.5 -43.2 -33.8 -42.3 5.0 -4.0 -33.9 -42.0
Low -41.3 -41.2 13.8 10.5 -9.7 -13.0 -10.8 -13.3 -39.6 -42.1 5.4 2.4 -39.1 -42.4 -38.4 -41.5 -29.6 -33.2 -38.5 -41.2Raw score plus avoided burdens (CHP) = (I � D) = L
High -31.3 -31.2 20.8 17.5 -19.7 -23.0 4.2 1.7 -29.6 -32.1 30.4 27.4 -29.1 -32.4 -28.4 -31.5 10.4 6.8 -28.5 -31.2
Low Memorandum Item - Incineration Tax
High

Economic Analysis of Options for Managing Biodegradable Municipal Waste � Final Report
Eunomia Research & Consulting, Scuola Agraria del Parco di Monza, HDRA Consultants, ZREU and LDK ECO onbehalf of ECOTEC Research & Consulting
150
Note that incinerator disamenity, as assessed here (through an extension of the hedonicpricing meta-analysis used by COWI (2000)), serves to swing the benefits equationmassively in favour of composting. However, it must be recalled that a) this analysis ishighly suspect (see Appendix 3) and b) there is no measurement here of disamenityarising from compost plants. These would certainly be expected to be non-zero, but tothe extent that compost plants might be located in less densely populated areas (andthey are not always), the disamenity as measured through hedonic pricing methodswould be expected to be much lower than in the case of incineration (irrespective of theabsolute magnitude of these). The estimates of incinerator disamenity canot be reliedupon.
66..44..22 PPrriivvaattee CCoossttss
In most countries, the costs of treating waste through incineration are significantly inexcess of the costs of treating waste through composting. As with landfill, however, thevariation is large. Indeed, it is a feature of European waste management that gate feesfor the different treatments still exhibit so much variation despite the effects of legislationwhich would appear to be harmonising the regulation of these treatments.
66..44..33 CCoossttss NNeett ooff EExxtteerrnnaall BBeenneeffiittss
In almost all cases, the costs net of external benefits are negative. This suggests thatcosts outweigh benefits. The exceptions are in Denmark, Spain, the UK (CHP only) andthe Czech Republic. In Denmark, the costs of incineration exceed the costs of sourceseparation and composting, but the differential is less than the magnitude of the Danishincineration tax. In Spain and the Czech Republic, the low gate fees for incineration arethe reason. In the UK, the gate fees are relatively low, but it is only for CHP plant that thenet external benefits are less than private costs. It is worth noting that only one facility inthe UK runs as a CHP plant.
66..44..44 CCoommmmeenntt oonn IInncciinneerraattoorr TTaaxxeess
Perhaps the most obvious comment that springs to mind is that the justification forimplementing taxes on incineration appears at least as strong as that that which existsfor taxing landfill. It is surprising, therefore, that more countries do not employ thisinstrument as a means to stimulate further source separation not only of compostables,but also of dry recyclables.
One explanation is that some countries have a more favourable view of the technologythan others, so have tended to reduce gate fees through a range of explicit and implicitsubsidies. Others, on the other hand, have regulated the technology more tightly, withthe net effect that costs of running plant are higher in the first place. Another explanationthat can be offered is that the �market� for waste treatment becomes more competitive incountries which already achieve high rates of recycling and composting. In this context,issues of potential over-capacity in incineration start to become more prominent, so thata tax may have counter-productive effects.
Economic Analysis of Options for Managing Biodegradable Municipal Waste � Final Report
Eunomia Research & Consulting, Scuola Agraria del Parco di Monza, HDRA Consultants, ZREU and LDK ECO onbehalf of ECOTEC Research & Consulting
151
66..55 SSwwiittcchhiinngg ffrroomm IInncciinneerraattiioonn ttoo AAnnaaeerroobbiicc DDiiggeessttiioonn
The equivalent results for the switch from incineration to AD are shown in Table 45. Thepatterns are already well-established from the previous Tables.
66..55..11 EExxtteerrnnaall BBeenneeffiittss
This is the switch for which the external benefits are greatest. The benefits are greatestfor the raw scores (i.e. with no �credits� attributed for energy generation). Once avoidedburdens for energy generation are introduced into the equation, the external benefitsstart to decline since the energy generated from AD is less than that from incineration inthis analysis. Note that it was assumed that both plants either generate electricity only, orCHP. If the AD plant generated CHP and the incinerator delivered electricity only, the netexternal benefit would be increased (and vice versa).
66..55..22 PPrriivvaattee CCoossttss
The net private costs of this switch are negative in some countries and positive in others.The comments made concerning the earlier switches explain this.
66..55..33 CCoossttss NNeett ooff EExxtteerrnnaall BBeenneeffiittss
Although this is the switch for which the external benefits are greatest, the costs net ofexternal benefits are less favourable than in the case of the switch from composting toincineration. This is once again an illustration of the sensitivity of the net figure to thevariation in private costs across countries.
66..66 SSuummmmaarryy
The analysis confirms that, subject to the many limitations of the analysis, there appearto be external benefits associated with the separate collection of biowastes forcomposting / anaerobic digestion. The magnitude of these benefits is generally higher forthe anaerobic digestion case where one assumes that the energy generated displacesburdens associated with energy generation from alternative sources (so that the �bestcase� is that where anaerobic digestion is designed to deliver CHP). This is broadlyconsistent with other studies.
At the same time, in this analysis, the costs of AD and those of composting are assumedto be quite different. In this analysis, the additional costs of AD do not appear to justifythe additional benefits. This conclusion should not be taken as a �strong� conclusion, butit does suggest that those studies which suggest that merely because AD generatesenergy, it is superior to composting, have to be examined more closely. In particular, onecomes back to the question of how it is that one treats the energy generated in terms ofany external benefits assumed to be derived. If the underlying assumptions held thatthese were much higher (for example, where one assumes that the displaced source isthe most polluting coal-fired power station), the additional benefits might justify the costs.Furthermore, were one to extend this assumption to incineration plants, these would thenappear to perform more favourably.

Economic Analysis of Options for Managing Biodegradable Municipal Waste � Final Report
Eunomia Research & Consulting, Scuola Agraria del Parco di Monza, HDRA Consultants, ZREU and LDK ECO on behalf of ECOTEC Research & Consulting152
Table 45. Net External Costs And Private Costs Of Change From Incineration To AD (€ / tonne of waste switched)
AU BE DE FI FR GE GR IR IT
Low High Low High Low High Low High Low High Low High Low High Low High Low
External Benefits
Raw Score (direct emissions only) = A 15.5 27.4 16.9 27.2 13.1 23.2 12.4 22.7 13.9 28.9 13.7 26.9 12.1 25.0 13.4 26.4 13.4
Raw score plus incinerator disamenity = B 34.2 121.1 48.2 277.2 34.9 148.2 24.9 97.7 32.6 78.9 44.9 245.7 30.8 68.7 32.2 70.2 25.9
Raw score plus avoided burdens (energy production)
Incinerator and AD With Electricity only = C 12.4 22.9 13.8 23.4 8.9 18.1 10.5 20.0 7.2 22.9 10.3 23.0 10.1 22.7 12.7 27.5 9.2
Incinerator and AD with CHP = D 7.6 12.7 9.0 14.8 2.3 6.3 7.4 14.0 -3.3 9.2 5.1 14.0 7.0 17.6 10.2 23.8 2.7
Raw score plus avoided burdens and incinerator disamenity
Incinerator and AD With Electricity only = (C + B � A) = E 31.1 116.7 45.1 273.4 30.8 143.1 23.0 95.0 25.9 72.9 41.6 241.7 28.9 66.5 31.4 71.2 21.7
Incinerator and AD with CHP = (D + B � A) = F 26.3 106.5 40.3 264.8 24.2 131.3 19.9 89.0 15.4 59.2 36.3 232.7 25.8 61.4 28.9 67.6 15.2
Private Costs
Incinerator = G Low 95.0 95.0 84.0 84.0 43.0 43.0 70.0 70.0 69.0 69.0 90.0 90.0 70.0 70.0 70.0 70.0 100.0
High 160.0 160.0 84.0 84.0 43.0 43.0 100.0 100.0 129.0 129.0 250.0 250.0 100.0 100.0 100.0 100.0 200.0
AD plus Separate Collection = H Low 80.0 80.0 80.0 80.0 80.0 80.0 80.0 80.0 80.0 80.0 80.0 80.0 80.0 80.0 80.0 80.0 80.0
High 125.0 125.0 125.0 125.0 125.0 125.0 125.0 125.0 125.0 125.0 125.0 125.0 125.0 125.0 125.0 125.0 125.0
Net Private Cost = (H � G) = I Low -15.0 -15.0 -4.0 -4.0 37.0 37.0 10.0 10.0 11.0 11.0 -10.0 -10.0 10.0 10.0 10.0 10.0 -20.0
High -35.0 -35.0 41.0 41.0 82.0 82.0 25.0 25.0 -4.0 -4.0 -125.0 -125.0 25.0 25.0 25.0 25.0 -75.0
Total Costs Net of External Benefits
Low -30.5 -42.4 -20.9 -31.2 23.9 13.8 -2.4 -12.7 -2.9 -17.9 -23.7 -36.9 -2.1 -15.0 -3.4 -16.4 -33.4Using Raw Score = (I � A) = J
High -50.5 -62.4 24.1 13.8 68.9 58.8 12.6 2.3 -17.9 -32.9 -138.7 -151.9 12.9 0.0 11.6 -1.4 -88.4
Low -27.4 -37.9 -17.8 -27.4 28.1 18.9 -0.5 -10.0 3.8 -11.9 -20.3 -33.0 -0.1 -12.7 -2.7 -17.5 -29.2Raw score plus avoided burdens (electricity) = (I � C) = K
High -47.4 -57.9 27.2 17.6 73.1 63.9 14.5 5.0 -11.2 -26.9 -135.3 -148.0 14.9 2.3 12.3 -2.5 -84.2
Low -22.6 -27.7 -13.0 -18.8 34.7 30.7 2.6 -4.0 14.3 1.8 -15.1 -24.0 3.0 -7.6 -0.2 -13.8 -22.7Raw score plus avoided burdens (CHP) = (I � D) = L
High -42.6 -47.7 32.0 26.2 79.7 75.7 17.6 11.0 -0.7 -13.2 -130.1 -139.0 18.0 7.4 14.8 1.2 -77.7
Low 6.0 6.0 37.0 37.0 Memorandum Item - Incineration Tax
High 13.0 13.0 44.0 44.0

Economic Analysis of Options for Managing Biodegradable Municipal Waste � Final Report
Eunomia Research & Consulting, Scuola Agraria del Parco di Monza, HDRA Consultants, ZREU and LDK ECO on behalf of ECOTEC Research & Consulting 153
PO SP SW UK CYP CZ EST HUN POL
Low High Low High Low High Low High Low High Low High Low High Low High Low
External Benefits
Raw Score (direct emissions only) = A 13.1 24.2 12.7 25.6 12.8 23.1 14.3 26.3 14.4 26.7 14.4 27.2 13.9 27.0 13.2 26.1 14.4
Raw score plus incinerator disamenity = B 22.5 39.8 37.7 181.8 31.6 73.1 45.6 245.1 26.9 70.4 33.2 120.9 26.4 58.2 32.0 119.8 33.2
Raw score plus avoided burdens (energy production)
Incinerator and AD With Electricity only = C 10.9 20.6 9.6 21.8 11.1 20.6 11.2 22.5 11.3 22.8 11.3 23.3 10.8 23.1 10.1 22.2 11.3
Incinerator and AD with CHP = D 7.4 12.4 4.8 13.2 8.3 14.8 6.4 13.9 6.3 14.0 6.4 14.5 5.9 14.3 5.1 13.4 6.4
Raw score plus avoided burdens and incinerator disamenity
Incinerator and AD With Electricity only = (C + B � A) = E 20.2 36.2 34.6 178.1 29.8 70.6 42.5 241.3 23.8 66.6 30.0 117.1 23.3 54.4 28.8 115.9 30.0
Incinerator and AD with CHP = (D + B � A) = F 16.7 28.0 29.8 169.5 27.1 64.8 37.7 232.7 18.8 57.7 25.1 108.2 18.4 45.5 23.9 107.1 25.1
Private Costs
Incinerator = G Low 70.0 70.0 18.0 18.0 37.0 37.0 41.0 41.0 70.0 70.0 25.0 25.0 70.0 70.0 70.0 70.0 60.0
High 100.0 100.0 51.0 51.0 87.0 87.0 66.0 66.0 100.0 100.0 40.0 40.0 100.0 100.0 100.0 100.0 60.0
AD plus Separate Collection = H Low 80.0 80.0 80.0 80.0 80.0 80.0 80.0 80.0 80.0 80.0 80.0 80.0 80.0 80.0 80.0 80.0 80.0
High 125.0 125.0 125.0 125.0 125.0 125.0 125.0 125.0 125.0 125.0 125.0 125.0 125.0 125.0 125.0 125.0 125.0
Net Private Cost = (H � G) = I Low 10.0 10.0 62.0 62.0 43.0 43.0 39.0 39.0 10.0 10.0 55.0 55.0 10.0 10.0 10.0 10.0 20.0
High 25.0 25.0 74.0 74.0 38.0 38.0 59.0 59.0 25.0 25.0 85.0 85.0 25.0 25.0 25.0 25.0 65.0
Total Costs Net of External Benefits
Low -3.1 -14.2 49.3 36.4 30.2 19.9 24.7 12.7 -4.4 -16.7 40.6 27.8 -3.9 -17.0 -3.2 -16.1 5.6Using Raw Score = (I � A) = J
High 11.9 0.8 61.3 48.4 25.2 14.9 44.7 32.7 10.6 -1.7 70.6 57.8 11.1 -2.0 11.8 -1.1 50.6
Low -0.9 -10.6 52.4 40.2 31.9 22.4 27.8 16.5 -1.3 -12.8 43.7 31.7 -0.8 -13.1 -0.1 -12.2 8.7Raw score plus avoided burdens (electricity) = (I � C) = K
High 14.1 4.4 64.4 52.2 26.9 17.4 47.8 36.5 13.7 2.2 73.7 61.7 14.2 1.9 14.9 2.8 53.7
Low 2.6 -2.4 57.2 48.8 34.7 28.2 32.6 25.1 3.7 -4.0 48.6 40.5 4.1 -4.3 4.9 -3.4 13.6Raw score plus avoided burdens (CHP) = (I � D) = L
High 17.6 12.6 69.2 60.8 29.7 23.2 52.6 45.1 18.7 11.0 78.6 70.5 19.1 10.7 19.9 11.6 58.6
Low Memorandum Item - Incineration Tax
High

Economic Analysis of Options for Managing Biodegradable Municipal Waste � Final Report
Eunomia Research & Consulting, Scuola Agraria del Parco di Monza, HDRA Consultants, ZREU and LDK ECO onbehalf of ECOTEC Research & Consulting
154
That having been said, the assumptions made regarding energy displacement seemmore defensible than those of earlier studies (which have tended to assumedisplacement of the most polluting energy source). This is not really tenable in thecontext of analysis of the effects of policy decisions the effects of which are likely to befelt not only today, but ten to twenty years in the future. In this period, it is expected thatelectricity generation will shift more sharply towards renewable sources, and there will becontinuing pressure applied to all power generation sources to reduce emissions of allpollutants (for example, through the IPPC Directive).
The fundamental impact that this assumption has on the results of the analysis cannot,however, be denied. This is effectively shown in the way in which the external costschange as one moves from the �raw scores� to the scores generated assuming someavoided burdens associated with energy generation.
Another reason for the �weakness� of this conclusion is that the private costs of anaerobicdigestion are expected to fall. This will occur as understanding of the bacteriologicalprocesses improves, speeding up throughput of material, and enabling more material tobe treated for a given cost.
Lastly, the continued variation in private costs of landfill and incineration across Europeis deserving of much closer examination. It seems clear that in those countries wheresource separation has been pursued most vigorously, landfill gate fees are relativelyhigh. This may be either, or both, an explanatory variable in the shift towards moresource separation, or the consequence of a wider policy aimed at encouraging theactivity (for example, through mandating the public / local authorities, or establishingtargets, as has happened in several EU countries / regions).
The variation in incineration gate fees probably reflects a range of implicit and explicitsubsidies associated with capital financing, the generation of �renewable energy�, andother distorting instruments applied at the level of Member States (including differencesin regulatory measures). Once again, however, with the exception of Denmark, the gatefees in countries where source separation is far advanced are relatively high. Denmark,however, has the highest incineration tax of any country in Europe (the world). Indeed,the tax alone is greater than the total gate fee paid in many countries such as Spain, theCzech Republic and the UK (in some cases).
These comments suggest that those countries where the waste management hierarchyis most closely followed are those where the structure of gate fees reflects that hierarchy.By implication, if the intention is to ensure other Member States do the same, theargument for ensuring still closer harmonisation in the legislation, regulation andincentives which deliver such varied gate fees seems a strong one. In particular, in thosenations where measures have been introduced which reduce the costs of residual wastetreatments, these should be examined for the potentially distorting and environmentallyperverse incentives which they convey with respect to source separation for bothrecycling and composting / AD. Indeed, recyclers / composters may see these as beingunjustified state aids to specific industries. The need to ensure incentive compatibilityacross instruments emanating from the �renewable energy� domain and those related towaste policy seems particularly pertinent at the present moment.
Economic Analysis of Options for Managing Biodegradable Municipal Waste � Final Report
Eunomia Research & Consulting, Scuola Agraria del Parco di Monza, HDRA Consultants, ZREU and LDK ECO onbehalf of ECOTEC Research & Consulting
155
77..00 FFUUTTUURREE SSCCEENNAARRIIOOSS
77..11 BBaasseelliinnee SScceennaarriioo -- IInnfflluueennccee ooff tthhee LLaannddffiillll DDiirreeccttiivvee
In order to understand how different policies might affect municipal waste in EU MemberStates, one has to understand the nature of the changes which such policies wouldimply. In this context, the �baseline� scenario against which new policy interventions mustbe measured is a world in which the full effects of the Landfill Directive are taken intoaccount. The issues arising in this context are discussed in more detail in Appendix 7.
Forward projections for the baseline �Landfill Directive Only� scenario require projectionsof:
• Arisings (i.e. rates of growth in arisings);
• Composition and its evolution; and
• Likely future treatment options.
In the ideal world, the first two are well known, and the assignment of different wastefractions to specific treatment options follows a more or less well understood NationalPlan. In practice:
• growth rates are not easy to anticipate, especially over the twenty year periodover which the Landfill Directive takes effect (Figure 14 seeks to illustrate somerelationship between per capita MSW and purchasing power index). Projectingforward on the basis of recently quoted growth rates / aims in waste plans is anapparently futile exercise given the improbability of the resulting divergentquantities of waste generated when these are projected forward for longer periodsof time (see Figure 15);
• composition, though it is bound to change, will change in ways that are difficult toestimate. It is not possible to predict such changes in advance an over extendedperiod of time; and
• the future treatment options are not so well known over this period.
The following country classification is proposed for modelling purposes (see Appendix 7for further details regarding projections). From the perspective of the model, this defineswhat treatment options are likely to be used to meet the Landfill Directive targets in thecountries concerned:

Economic Analysis of Options for Managing Biodegradable Municipal Waste � Final Report
Eunomia Research & Consulting, Scuola Agraria del Parco di Monza, HDRA Consultants, ZREU and LDK ECO onbehalf of ECOTEC Research & Consulting
156
Figure 14: Plot Of Per Capita MSW (kg) .v. GDP per Capita (Purchasing PowerIndex)
• Group 1 - Germany, Austria, Netherlands, Belgium (Flanders) (Amlingerestimates 65-80% coverage) and Luxembourg � here, there is unlikely to be anymajor change from the current situation under either the Landfill Directive or anypolicy changes aimed at encouraging source-separation. The effect may begreatest in some larger cities where collection has been problematic. But if theproposed Directive makes exemptions for certain �justifiable cases�, it may well bethat these countries experience little or no effect given the progress already madeand the direction in which they are moving. It is assumed that the LandfillDirective will lead to further increases in source separation for recycling of paperand materials suitable for composting / digestion. Efforts in respect of the latterare likely to focus on kitchen wastes since yard wastes are already dealt withhighly effectively in some countries (including Denmark in Group 2 � see below).Flanders appears to collect separately more than 90% of yard wastes. Anincrease in mechanical biological treatment is also expected as a means of pre-treating residual waste prior to landfilling or �one-off� landscaping applications;
y = 123Ln(x) - 67.75R2 = 0.3504
0
100
200
300
400
500
600
700
0 20 40 60 80 100 120 140 160 180 200GDP per Capita (Purchasing Power Parity Index)
MSW
per
Cap
ita (k
g)
Series1Log. (Series1)

Economic Analysis of Options for Managing Biodegradable Municipal Waste � Final Report
Eunomia Research & Consulting, Scuola Agraria del Parco di Monza, HDRA Consultants, ZREU and LDK ECO onbehalf of ECOTEC Research & Consulting
157
Figure 15: Evolution of Per Capita MSW in Member States
0.00
200.00
400.00
600.00
800.00
1000.00
1200.00
1400.00
1600.00
1800.00
2000.00
1998 1999 2000 2001 2002 2003 2004 2005 2006 2007 2008 2009 2010 2011 2012 2013 2014 2015 2016 2017 2018 2019 2020
Year
Per C
apita
MSW
(kg)
AustriaBelgiumDenmarkFinlandFranceGermanyGreeceIreland
0.00
200.00
400.00
600.00
800.00
1000.00
1200.00
1998 1999 2000 2001 2002 2003 2004 2005 2006 2007 2008 2009 2010 2011 2012 2013 2014 2015 2016 2017 2018 2019 2020
Year
Per C
apita
MSW
(kg) Italy
LuxembourgNetherlandsPortugalSpainSwedenUnited Kingdom


Economic Analysis of Options for Managing Biodegradable Municipal Waste � Final Report
Eunomia Research & Consulting, Scuola Agraria del Parco di Monza, HDRA Consultants, ZREU and LDK ECO onbehalf of ECOTEC Research & Consulting
159
• Group 2 - Finland, Belgium (Wallonia), Slovenia, Estonia, Sweden, Denmark,Spain, Italy, France, Poland, Wales (UK) and Scotland (UK) � in these countries,there is an intention to develop separate collection quite swiftly, but this is notespecially widely diffused at present. In these countries, additional diversion ofbiodegradable wastes from landfill is expected to be achieved through increasedrecycling of paper (though in Denmark, Sweden and Finland, this is already well-advanced), more source separation of compostables, and incineration. It isanticipated that the switch from the Landfill Directive compliance trajectory to thatrequired under a proposed Biowaste Directive would be principally one fromincineration of unseparated biowastes to composting / anaerobic digestion ofseparately collected fractions, possibly with MBT used as source separation isdeveloped (see below). This shift is unlikely to be extremely pronounced. Inparticular, Finland has set high targets for the recovery of both paper and kitchenand yard waste, with recovery understood to be principally recycling, compostingand anaerobic digestion. Finland, therefore, could be a �Group 1� country;
• Group 3: Ireland, England (UK), Northern Ireland (UK), Portugal, Belgium(Brussels), Czech Republic, Cyprus and Hungary. In these countries, relativelylittle separate collection of compostables is being undertaken at present. LandfillDirective targets likely to be met through a mix of incineration, paper recycling,and composting of yard waste. Some composting of source separated kitchenwastes may occur, but mixed waste composting and incineration are likely to bethe most common routes for treatment of biowaste other than yard wastedelivered to containerparks / civic amenity sites. The effect of a requirement forsource separation would be a pronounced shift away from incineration / mixedwaste composting towards composting / digestion of source separated waste and,possibly, MBT (used as pre-treatment whilst source separation develops � seebelow); and
• Group 4: Greece. Very little separate collection is being undertaken at presentand there appear to be no major pushes for this to occur in future. LandfillDirective compliance is likely to be pursued through mixed waste composting andpaper recycling. There may be some incineration but public support for this isabsent. The proposed policy change would require radical changes

Economic Analysis of Options for Managing Biodegradable Municipal Waste � Final Report
Eunomia Research & Consulting, Scuola Agraria del Parco di Monza, HDRA Consultants, ZREU and LDK ECO onbehalf of ECOTEC Research & Consulting
160
77..11..11 TTrreeaattmmeennttss UUnnddeerr tthhee BBaasseelliinnee
The approach to estimating how treatments might develop under the Landfill Directivefollows partly from the analysis above. However, the quantity of biodegradable municipalwaste required to be diverted from landfill changes in absolute terms depending upon thegrowth rate being assumed. This is the subject of considerable uncertainty over theyears ahead, and there is reason to believe that countries which are taking measures tominimise growth in arisings will experience lower growth rates than others. Ranges of theorder �1% - +3% seem reasonable to use over this period with those undertakingminimisation measures more likely to be at lower end of this range.
Attention is focussed on the fate of the kitchen and garden wastes under the Directive,though the fate of paper clearly influences the trajectory for compliance under the LandfillDirective. Effectively, it has been assumed that the Article 5 targets, which apply tobiodegradable wastes as a whole, are being applied to the kitchen and garden wastesspecifically. This is a tolerable approximation given all the other confounding factorswhich hinder this type of analysis.
Country groupings established above have been used to develop decision rules for theimplications of the Landfill Directive for the remaining landfilled kitchen and gardenwastes. These are:
• Group 1: separate collection developed up to 80% of total kitchen and gardenwaste fraction, remainder dealt through incineration and MBT (in a 50:50 ratio upto required level of landfill diversion in line with Article 5 of the Landfill Directive):
• Group 2: separate collection developed to 60% of total kitchen and garden waste,remainder dealt through incineration and MBT (in a 75:25 ratio up to requiredlevel of landfill diversion in line with Article 5 of the Landfill Directive); and
• Group 3: separate collection developed to 35% of total kitchen and garden waste,remainder dealt with through incineration and MBT (in a 75:25 ratio up to requiredlevel of landfill diversion in line with Article 5 of the Landfill Directive).
For the purposes of this analysis, the whole of the UK is treated as a Group 3 countrywith Greece also in the same Group. The �baseline� parameters characterising thesituation posed by the Landfill Directive is shown in Table 46. Landfill diversion assumedto occur in the year 2010 for different growth rates is shown in Table 47.

Economic Analysis of Options for Managing Biodegradable Municipal Waste � Final Report
Eunomia Research & Consulting, Scuola Agraria del Parco di Monza, HDRA Consultants, ZREU and LDK ECO on behalf of ECOTEC Research & Consulting 161
Table 46. Baseline Parameters for Biowaste Going to Landfill Under Landfill Directive (tonnes)
AU BE DK FI FR GER GRE IRE IT LUX NL1 1 2 2 3 1 3 3 2 1 1
Biowaste collected (latest) 594,793 800,000 637,000 93,000 970,000 7,000,000 0 6,000 1,500,000 34,000 1,790,000Biowaste collected 1995 (estimate) 505,574 700,000 541,450 79,050 824,500 5,950,000 0 5,100 1,275,000 28,900 1,521,500Total biowaste available 905,200 1,668,795 1,028,600 1,004,000 11,020,000 14,680,900 1,833,000 556,200 9,021,600 130,962 3,452,400Biowaste remaining (1995) 912,086 968,795 487,150 924,950 10,195,500 8,730,900 1,833,000 551,100 7,746,600 102,062 1,930,900Fraction biowaste landfilled (1995) 601,723 541,386 85,805 848,565 6,835,619 5,966,115 1,833,000 551,100 7,159,052 33,660 526,924Allowed to Landfill (2010) 300,862 270,693 42,902 424,283 5,126,714 2,983,058 1,374,750 413,325 5,369,289 16,830 263,462
POR SP SW UK CYP CZ EST HUN POL SLO3 3 2 3 3 2 2 2 2 2
Biowaste collected (latest) 14,000 0 400,000 615,000 0 385,000 1,000 0 222,000 10,000Biowaste collected 1995 (estimate) 11,900 0 340,000 522,750 0 327,250 850 0 188,700 8,500Total biowaste available 1,406,000 7,585,200 1,524,000 12,001,500 132,258 1,466,500 301,570 1,875,000 4,680,460 330,752Biowaste remaining (1995) 1,394,100 7,585,200 1,184,000 11,478,750 132,258 1,139,250 300,720 1,875,000 4,491,760 322,252Fraction biowaste landfilled (1995) 1,394,100 7,020,141 491,060 11,478,750 121,685 1,139,250 300,720 1,757,813 4,446,389 322,252Allowed to Landfill (2010) 1,045,575 5,265,106 245,530 8,609,063 91,264 569,625 225,540 1,318,359 3,334,792 241,689

Economic Analysis of Options for Managing Biodegradable Municipal Waste � Final Report
Eunomia Research & Consulting, Scuola Agraria del Parco di Monza, HDRA Consultants, ZREU and LDK ECO onbehalf of ECOTEC Research & Consulting
162
Table 47. Estimated Baseline Treatments of Biowaste (‘000 tonnes) Under theLandfill Directive at Different Growth Rates, 2010
AU BE DK FI FR GER GRE IRE IT LUX NL
Total Biowaste -1% 802 1,479 912 890 9,768 13,013 1,625 493 7,997 116 3,060
Growth 0% 905 1,669 1,029 1,004 11,020 14,681 1,833 556 9,022 131 3,452
Rates 1% 1,020 1,880 1,159 1,131 12,418 16,543 2,065 627 10,166 148 3,890
2% 1,148 2,116 1,305 1,273 13,976 18,619 2,325 705 11,442 166 4,378
Apportioned Biowaste 0 0 0 0 0 0 0 0 0 0 0
-1% SS 642 1,183 547 534 2,930 10,410 487 148 4,798 93 2,448
AD 64 118 55 53 293 1,041 49 15 480 9 245
COMP 578 1,065 492 481 2,637 9,369 439 133 4,318 84 2,203
REMAINDER 160 296 365 356 6,838 2,603 1,137 345 3,199 23 612
INCIN 80 148 274 267 1,283 1,301 0 0 0 12 306
MBT 80 148 91 89 428 1,301 0 0 0 12 306
LANDFILL NO PRE-
TREATMENT 0 0 0 0 5,127 0 1,137 345 3,199 0 0
0 0 0 0 0 0 0 0 0 0 0
0% SS 724 1,335 617 602 3,306 11,745 550 167 5,413 105 2,762
AD 72 134 62 60 331 1,174 55 17 541 10 276
COMP 652 1,202 555 542 2,975 10,570 495 150 4,872 94 2,486
REMAINDER 181 334 411 402 7,714 2,936 1,283 389 3,609 26 690
INCIN 91 167 309 301 1,940 1,468 0 0 0 13 345
MBT 91 167 103 100 647 1,468 0 0 0 13 345
LANDFILL NO PRE-
TREATMENT 0 0 0 0 5,127 0 1,283 389 3,609 0 0
0 0 0 0 0 0 0 0 0 0 0
1% SS 816 1,504 695 679 3,725 13,234 620 188 6,099 118 3,112
AD 82 150 70 68 373 1,323 62 19 610 12 311
COMP 734 1,354 626 611 3,353 11,911 558 169 5,490 106 2,801
REMAINDER 204 376 464 453 8,692 3,309 1,446 439 4,066 30 778
INCIN 102 188 348 339 2,674 1,654 53 19 0 15 389
MBT 102 188 116 113 891 1,654 18 6 0 15 389
LANDFILL NO PRE-
TREATMENT 0 0 0 0 5,127 0 1,375 413 4,066 0 0
0 0 0 0 0 0 0 0 0 0 0
2% SS 918 1,693 783 764 4,193 14,895 697 212 6,865 133 3,503
AD 92 169 78 76 419 1,490 70 21 686 13 350
COMP 827 1,524 704 688 3,774 13,406 628 190 6,178 120 3,153
REMAINDER 230 423 522 509 9,783 3,724 1,627 494 4,577 33 876
INCIN 115 212 391 382 3,492 1,862 189 60 0 17 438
MBT 115 212 130 127 1,164 1,862 63 20 0 17 438
LANDFILL NO PRE-
TREATMENT 0 0 0 0 5,127 0 1,375 413 4,577 0 0
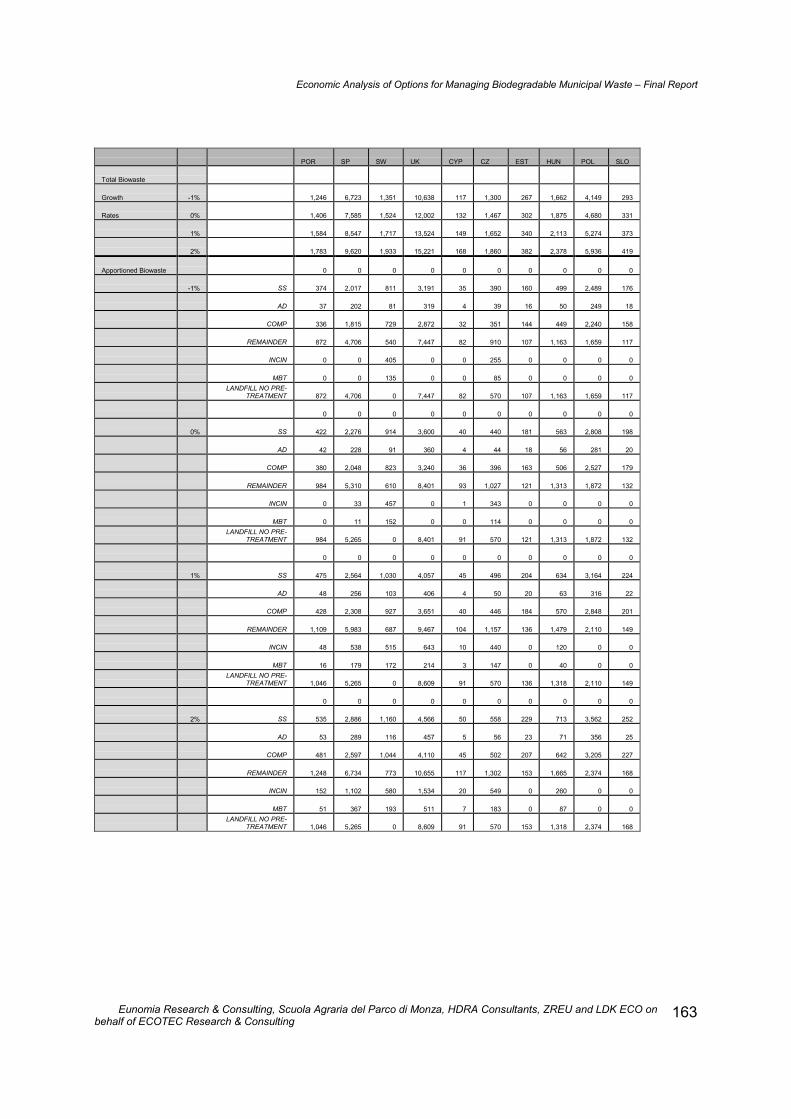
Economic Analysis of Options for Managing Biodegradable Municipal Waste � Final Report
Eunomia Research & Consulting, Scuola Agraria del Parco di Monza, HDRA Consultants, ZREU and LDK ECO onbehalf of ECOTEC Research & Consulting
163
POR SP SW UK CYP CZ EST HUN POL SLO
Total Biowaste
Growth -1% 1,246 6,723 1,351 10,638 117 1,300 267 1,662 4,149 293
Rates 0% 1,406 7,585 1,524 12,002 132 1,467 302 1,875 4,680 331
1% 1,584 8,547 1,717 13,524 149 1,652 340 2,113 5,274 373
2% 1,783 9,620 1,933 15,221 168 1,860 382 2,378 5,936 419
Apportioned Biowaste 0 0 0 0 0 0 0 0 0 0
-1% SS 374 2,017 811 3,191 35 390 160 499 2,489 176
AD 37 202 81 319 4 39 16 50 249 18
COMP 336 1,815 729 2,872 32 351 144 449 2,240 158
REMAINDER 872 4,706 540 7,447 82 910 107 1,163 1,659 117
INCIN 0 0 405 0 0 255 0 0 0 0
MBT 0 0 135 0 0 85 0 0 0 0
LANDFILL NO PRE-
TREATMENT 872 4,706 0 7,447 82 570 107 1,163 1,659 117
0 0 0 0 0 0 0 0 0 0
0% SS 422 2,276 914 3,600 40 440 181 563 2,808 198
AD 42 228 91 360 4 44 18 56 281 20
COMP 380 2,048 823 3,240 36 396 163 506 2,527 179
REMAINDER 984 5,310 610 8,401 93 1,027 121 1,313 1,872 132
INCIN 0 33 457 0 1 343 0 0 0 0
MBT 0 11 152 0 0 114 0 0 0 0
LANDFILL NO PRE-
TREATMENT 984 5,265 0 8,401 91 570 121 1,313 1,872 132
0 0 0 0 0 0 0 0 0 0
1% SS 475 2,564 1,030 4,057 45 496 204 634 3,164 224
AD 48 256 103 406 4 50 20 63 316 22
COMP 428 2,308 927 3,651 40 446 184 570 2,848 201
REMAINDER 1,109 5,983 687 9,467 104 1,157 136 1,479 2,110 149
INCIN 48 538 515 643 10 440 0 120 0 0
MBT 16 179 172 214 3 147 0 40 0 0
LANDFILL NO PRE-
TREATMENT 1,046 5,265 0 8,609 91 570 136 1,318 2,110 149
0 0 0 0 0 0 0 0 0 0
2% SS 535 2,886 1,160 4,566 50 558 229 713 3,562 252
AD 53 289 116 457 5 56 23 71 356 25
COMP 481 2,597 1,044 4,110 45 502 207 642 3,205 227
REMAINDER 1,248 6,734 773 10,655 117 1,302 153 1,665 2,374 168
INCIN 152 1,102 580 1,534 20 549 0 260 0 0
MBT 51 367 193 511 7 183 0 87 0 0
LANDFILL NO PRE-
TREATMENT 1,046 5,265 0 8,609 91 570 153 1,318 2,374 168

Economic Analysis of Options for Managing Biodegradable Municipal Waste � Final Report
Eunomia Research & Consulting, Scuola Agraria del Parco di Monza, HDRA Consultants, ZREU and LDK ECO onbehalf of ECOTEC Research & Consulting
164
77..22 EEffffeeccttss ooff IImmpplleemmeennttiinngg aa RReeqquuiirreemmeenntt ffoorr SSoouurrccee SSeeppaarraattiioonn ooffMMaatteerriiaallss ((aass wweellll aass ssttaannddaarrddss))
It is possible (though certainly not straightforward) to estimate the changes in thetreatments which Member States might apply to the biowaste fraction of municipal wasteif there was a requirement to collect separately all biodegradable wastes. A requirementto source separate municipal wastes would certainly lead to greater resort to compostand anaerobic digestion systems. This might also have a knock-on effects onapproaches to waste collection and treatment. In particular, source separation of othermaterials might well be introduced more widely alongside separate collection ofbiowastes. Furthermore, the instatement of separate collection of biowastes probablymakes the introduction of direct charging systems both more appropriate and moreeffective. Consequently, a positive indirect effect of implementing source separationschemes might be to encourage the reduction in waste materials set out for collection,both through enabling direct charging for wastes (without the otherwise-more-likely side-effect of increased fly-tipping) and through sensitising citizens to the nature of the wasteswhich they generate in their daily lives.
Most obviously, those countries which are likely to seek to divert greater proportions ofbiowaste from landfill (under the Landfill Directive) through incineration and MBT will berequired to achieve more of their diversion through composting and anaerobic digestion.The degree to which this occurs as a consequence of the policy depends upon:
a) the degree to which this path would have been followed anyway (as a means toachieve Landfill Directive targets �estimates as to what will happen are outlined above);and
b) the maximum level of materials capture achievable through these systems.
The former is the subject of some conjecture. The latter is likely to be of the order 85%for all biowastes, though higher rates are reported for garden wastes individually (e.g. inDenmark, where 95% of garden wastes are collected for composting).
77..22..11 EEffffeeccttss RReellaattiivvee ttoo BBaasseelliinnee –– QQuuaannttiittyy ooff BBiioowwaasstteess SSeeppaarraatteellyy CCoolllleecctteedd
The impacts of the proposed policy change, requiring separate collection, are estimatedthrough modelling the capture rate for kitchen and yard wastes rising to a maximum of85% in 2010 from households which are covered by the Directive. The estimatedchanges in quantities collected separately, and the implied switches from landfill andincineration (relative to a �Landfill Directive only� scenario) are shown in Table 48. Notethat these are changes for the specific year, not for a cumulative change which occursover time.
The analysis focuses on shifts of kitchen and yard wastes between the four principaltreatments examined in this model, landfill, incineration, composting and anaerobicdigestion. This means it has been assumed that shifts are away from landfill and

Economic Analysis of Options for Managing Biodegradable Municipal Waste � Final Report
Eunomia Research & Consulting, Scuola Agraria del Parco di Monza, HDRA Consultants, ZREU and LDK ECO onbehalf of ECOTEC Research & Consulting
165
incineration. The wisdom of projecting forward through to the years beyond 2010 is takento highly questionable. Already, the approach implies a considerable level of guess-workand interpolation (given the low quality of much of the data available and theuncertainties surrounding future waste management strategies). To pretend that theanalysis being undertaken here has validity to the year 2020 is likely to mislead as muchas it is to inform. Even the results to 2010 should be treated with considerable caution.
Table 48. Changes in Level of Source Separation and Switches BetweenTreatments for Biowaste Resulting From Implementation of a Requirement forSource Separation (tonnes biowaste in year 2010)
AU BE DK FI FR GER GRE IRE IT LUX NL
Total
-1% 40,118 73,960 227,934 222,483 5,372,379 650,646 893,609 271,154 1,999,152 5,804 153,008
0% 45,260 83,440 257,150 251,000 6,061,000 734,045 1,008,150 305,910 2,255,400 6,548 172,620
1% 51,000 94,022 289,763 282,833 6,829,687 827,140 1,136,009 344,707 2,541,441 7,379 194,513
2% 57,401 105,822 326,128 318,329 7,686,814 930,947 1,278,578 387,968 2,860,393 8,305 218,924
Switch from landfill
-1% 0 0 0 0 4,089,235 0 893,609 271,154 1,999,152 0 0
0% 0 0 0 0 4,120,536 0 1,008,150 305,910 2,255,400 0 0
1% 0 0 0 0 4,155,476 0 1,082,699 325,662 2,541,441 0 0
2% 0 0 0 0 4,194,436 0 1,089,180 327,629 2,860,393 0 0
Switch from incineration
-1% 40,118 73,960 227,934 222,483 1,283,144 650,646 0 0 0 5,804 153,008
0% 45,260 83,440 257,150 251,000 1,940,464 734,045 0 0 0 6,548 172,620
1% 51,000 94,022 289,763 282,833 2,674,210 827,140 53,309 19,045 0 7,379 194,513
2% 57,401 105,822 326,128 318,329 3,492,377 930,947 189,398 60,339 0 8,305 218,924
POR SP SW UK CYP CZ EST HUN POL SLO
Total -1% 685,441 3,697,874 337,713 5,850,871 64,477 714,936 66,827 914,084 1,037,172 73,293
0% 773,300 4,171,860 381,000 6,600,825 72,742 806,575 75,393 1,031,250 1,170,115 82,688
1% 871,374 4,700,956 429,320 7,437,975 81,967 908,869 84,954 1,162,038 1,318,515 93,175
2% 980,731 5,290,927 483,200 8,371,442 92,254 1,022,932 95,616 1,307,874 1,483,989 104,868
Switch from landfill
-1% 685,441 3,697,874 0 5,850,871 64,477 459,716 66,827 914,084 1,037,172 73,293
0% 773,300 4,138,459 0 6,600,825 71,754 463,881 75,393 1,031,250 1,170,115 82,688
1% 823,789 4,162,509 0 6,794,887 72,174 468,531 84,954 1,041,589 1,318,515 93,175
2% 828,760 4,189,326 0 6,837,317 72,641 473,716 95,616 1,048,218 1,483,989 104,868
Switch from incineration
-1% 0 0 337,713 0 0 255,220 0 0 0 0
0% 0 33,401 381,000 0 987 342,694 0 0 0 0
1% 47,585 538,447 429,320 643,088 9,794 440,338 0 120,449 0 0
2% 151,971 1,101,601 483,200 1,534,125 19,613 549,216 0 259,656 0 0
77..22..22 CCoossttss aanndd BBeenneeffiittss ooff IImmpplleemmeennttiinngg aa RReeqquuiirreemmeenntt ffoorr SSoouurrccee SSeeppaarraattiioonn

Economic Analysis of Options for Managing Biodegradable Municipal Waste � Final Report
Eunomia Research & Consulting, Scuola Agraria del Parco di Monza, HDRA Consultants, ZREU and LDK ECO onbehalf of ECOTEC Research & Consulting
166
The external benefits of the changes being required under the requirement for separatecollection are shown in Table 49. For the �central estimates� of the external benefits ofswitching which are reported, the following assumptions were used:
• For landfill to compost: the figure which includes avoided external costsassociated with energy generated by the landfill, but not landfill disamenity.
• For landfill to AD: the figure which includes avoided external costs associated withelectricity generated by both, but not landfill disamenity;
• For incineration to compost: the figure which includes avoided external costsassociated with electricity from the incinerator, but not incinerator disamenity;
• For incineration to AD: the figure which includes avoided external costsassociated with electricity generated by both, but not incinerator disamenity.
Note that as with the changes in quantities, this does not assume a specific �projection�,so the results are not cumulative but indicative of the costs and benefits associated withthe year 2010 situation. Table 50 gives the EU Totals at different growth rates.
Note that this assumes that all landfills are performing well. Were this switch to occurwith landfills operating at their current gas collection efficiencies, the picture would lookrather different (Tables 51 and 52).
In all cases, the situation shown is that in which waste diverted from landfill andincineration is diverted in a fixed proportion to compost and anaerobic digestion. Thisproportion reflects current practice and is set at a low figure of 5% for AD and 95% forcomposting.
The following observations can be made:
• The absolute magnitude of the benefits is affected by the growth rate of thestream. The higher the growth rate, the greater will be the benefits. This stands toreason. The more waste that needs to be treated, the greater the benefits ofdealing with it in more benign and useful ways;
• Ideally, of course, growth rates are small. It is very important for this reason tounderstand that the growth rates may not be completely independent of thecollection approach itself. Where source separation occurs, the potential forintroducing instruments such as variable charging, designed to influence not only

Economic Analysis of Options for Managing Biodegradable Municipal Waste � Final Report
Eunomia Research & Consulting, Scuola Agraria del Parco di Monza, HDRA Consultants, ZREU and LDK ECO onbehalf of ECOTEC Research & Consulting
167
patterns of separation but also waste arisings, clearly increases. Hence, this � theeffect in terms of public education / behavioural change - may be an importantbenefit of a requirement to source separate which is not being picked up here;27
27 Equally, one can state that the way in which separate collection is enacted has important consequences for the totalquantity of waste collected.

Economic Analysis of Options for Managing Biodegradable Municipal Waste � Final Report
Eunomia Research & Consulting, Scuola Agraria del Parco di Monza, HDRA Consultants, ZREU and LDK ECO on behalf of ECOTEC Research & Consulting168
Table 49. External Benefits of Separate Collection Resulting From a Requirement for Source Separation (‘000 € in year 2010,well-behaved landfills)
AU BE DE FI FR GE GR IR IT LUX NL
Low High Low High Low High Low High Low High Low High Low High Low High Low High Low High Low High
From switch from landfill
-1% 0 0 0 0 0 0 0 0 -4,522 4,413 0 0 746 3,148 154 891 111 4,363 0 0 0 0
0% 0 0 0 0 0 0 0 0 -4,557 4,447 0 0 841 3,551 174 1,005 125 4,923 0 0 0 0
1% 0 0 0 0 0 0 0 0 -4,595 4,484 0 0 903 3,814 185 1,070 141 5,547 0 0 0 0
2% 0 0 0 0 0 0 0 0 -4,638 4,526 0 0 909 3,836 186 1,076 159 6,243 0 0 0 0From switch fromincineration
-1% 414 571 832 1,133 1,516 2,084 2,117 3,304 4,144 15,022 5,322 9,887 0 0 0 0 0 0 70 79 1,866 2,327
0% 468 644 939 1,278 1,710 2,351 2,388 3,728 6,267 22,718 6,004 11,155 0 0 0 0 0 0 79 89 2,106 2,626
1% 527 726 1,058 1,440 1,927 2,649 2,691 4,201 8,637 31,308 6,765 12,569 479 934 173 340 0 0 89 101 2,373 2,959
2% 593 817 1,191 1,621 2,169 2,982 3,029 4,728 11,280 40,886 7,614 14,147 1,702 3,319 549 1,078 0 0 101 113 2,670 3,330
TOTALS
-1% 414 571 832 1,133 1,516 2,084 2,117 3,304 -378 19,435 5,322 9,887 746 3,148 154 891 111 4,363 70 79 1,866 2,327
0% 468 644 939 1,278 1,710 2,351 2,388 3,728 1,711 27,164 6,004 11,155 841 3,551 174 1,005 125 4,923 79 89 2,106 2,626
1% 527 726 1,058 1,440 1,927 2,649 2,691 4,201 4,042 35,792 6,765 12,569 1,382 4,748 359 1,410 141 5,547 89 101 2,373 2,959
2% 593 817 1,191 1,621 2,169 2,982 3,029 4,728 6,641 45,413 7,614 14,147 2,610 7,155 736 2,154 159 6,243 101 113 2,670 3,330

Economic Analysis of Options for Managing Biodegradable Municipal Waste � Final Report
Eunomia Research & Consulting, Scuola Agraria del Parco di Monza, HDRA Consultants, ZREU and LDK ECO on behalf of ECOTEC Research & Consulting 169
PO SP SW UK CYP CZ EST HUN POL SLO
Low High Low High Low High Low High Low High Low High Low High Low High Low High Low High
From switch from landfill
-1% -42 -150 -1,364 -1,997 0 0 2,471 2,332 26 21 182 147 25 18 -407 -498 430 409 -32 -36
0% 781 2,013 5,696 15,519 0 0 10,016 25,544 -79 77 377 1,332 63 266 587 3,388 65 2,554 146 293
1% 832 2,144 5,730 15,609 0 0 10,311 26,295 -80 78 380 1,345 71 299 593 3,422 73 2,878 165 330
2% 837 2,157 5,766 15,710 0 0 10,375 26,460 -80 78 385 1,360 80 337 597 3,444 82 3,239 186 371From switch fromincineration
-1% 0 0 0 0 3,608 6,116 0 0 0 0 2,566 4,763 0 0 0 0 0 0 0 0
0% 0 0 283 577 4,070 6,900 0 0 10 18 3,446 6,395 0 0 0 0 0 0 0 0
1% 481 784 4,560 9,309 4,587 7,775 6,473 11,622 98 178 4,428 8,217 0 0 1,066 2,115 0 0 0 0
2% 1,537 2,503 9,330 19,044 5,162 8,751 15,443 27,724 197 356 5,523 10,249 0 0 2,298 4,559 0 0 0 0
TOTALS
-1% -42 -150 -1,364 -1,997 3,608 6,116 2,471 2,332 26 21 2,748 4,910 25 18 -407 -498 430 409 -32 -36
0% 781 2,013 5,979 16,097 4,070 6,900 10,016 25,544 -69 95 3,823 7,727 63 266 587 3,388 65 2,554 146 293
1% 1,314 2,928 10,290 24,918 4,587 7,775 16,784 37,917 19 256 4,808 9,563 71 299 1,659 5,537 73 2,878 165 330
2% 2,374 4,660 15,096 34,754 5,162 8,751 25,818 54,184 117 435 5,908 11,610 80 337 2,894 8,002 82 3,239 186 371
Table 50. External Benefits of Separate Collection Resulting From a Requirement for Source Separation (‘000 € in year 2010)(switching ratios 95% to compost, 5% to AD, well behaved landfills)
EU Growth Rate Low High -1% 20,233 58,347 0% 42,006 123,390 1% 61,123 164,542 2% 85,229 215,046

Economic Analysis of Options for Managing Biodegradable Municipal Waste � Final Report
Eunomia Research & Consulting, Scuola Agraria del Parco di Monza, HDRA Consultants, ZREU and LDK ECO on behalf of ECOTEC Research & Consulting170
Table 51. External Benefits of Separate Collection Resulting From a Requirement for Source Separation (‘000 € in year 2010,landfills with current gas collection efficiencies)
AU BE DE FI FR GE GR IR IT LUX NL
Low High Low High Low High Low High Low High Low High Low High Low High Low High Low High Low High
From switch from landfill
-1% 0 0 0 0 0 0 0 0 18203 30604 0 0 8860 12359 2523 3578 10581 16585 0 0 0 0
0% 0 0 0 0 0 0 0 0 18342 30839 0 0 9995 13943 2847 4036 11938 18711 0 0 0 0
1% 0 0 0 0 0 0 0 0 18497 31100 0 0 10734 14974 3031 4297 13452 21084 0 0 0 0
2% 0 0 0 0 0 0 0 0 18671 31392 0 0 10799 15064 3049 4323 15140 23730 0 0 0 0
From switch from incineration
-1% 414 571 832 1133 1516 2084 2117 3304 4144 15022 5322 9887 0 0 0 0 0 0 70 79 1866 2327
0% 468 644 939 1278 1710 2351 2388 3728 6267 22718 6004 11155 0 0 0 0 0 0 79 89 2106 2626
1% 527 726 1058 1440 1927 2649 2691 4201 8637 31308 6765 12569 479 934 173 340 0 0 89 101 2373 2959
2% 593 817 1191 1621 2169 2982 3029 4728 11280 40886 7614 14147 1702 3319 549 1078 0 0 101 113 2670 3330
TOTALS
-1% 414 571 832 1,133 1,516 2,084 2,117 3,304 22,347 45,627 5,322 9,887 8,860 12,359 2,523 3,578 10,581 16,585 70 79 1,866 2,327
0% 468 644 939 1,278 1,710 2,351 2,388 3,728 24,609 53,556 6,004 11,155 9,995 13,943 2,847 4,036 11,938 18,711 79 89 2,106 2,626
1% 527 726 1,058 1,440 1,927 2,649 2,691 4,201 27,135 62,408 6,765 12,569 11,213 15,909 3,204 4,637 13,452 21,084 89 101 2,373 2,959
2% 593 817 1,191 1,621 2,169 2,982 3,029 4,728 29,950 72,278 7,614 14,147 12,500 18,383 3,598 5,401 15,140 23,730 101 113 2,670 3,330

Economic Analysis of Options for Managing Biodegradable Municipal Waste � Final Report
Eunomia Research & Consulting, Scuola Agraria del Parco di Monza, HDRA Consultants, ZREU and LDK ECO on behalf of ECOTEC Research & Consulting 171
PO SP SW UK CYP CZ EST HUN POL SLO
Low High Low High Low High Low High Low High Low High Low High Low High Low High Low High
From switch from landfill
-1% 5512 6355 27259 31310 0 0 17428 19682 630 723 4495 5155 652 746 8169 9459 10160 11707 656 762
0% 7851 10413 27025 40133 0 0 26347 44212 319 537 1571 2723 747 1043 9596 13607 6193 9707 553 773
1% 8363 11093 27182 40367 0 0 27121 45511 321 540 1587 2750 842 1175 9693 13744 6979 10938 623 872
2% 8414 11160 27357 40627 0 0 27291 45796 323 544 1605 2780 948 1322 9754 13831 7855 12311 701 981
From switch from incineration
-1% 0 0 0 0 3608 6116 0 0 0 0 2566 4763 0 0 0 0 0 0 0 0
0% 0 0 283 577 4070 6900 0 0 10 18 3446 6395 0 0 0 0 0 0 0 0
1% 481 784 4560 9309 4587 7775 6473 11622 98 178 4428 8217 0 0 1066 2115 0 0 0 0
2% 1537 2503 9330 19044 5162 8751 15443 27724 197 356 5523 10249 0 0 2298 4559 0 0 0 0
TOTALS
-1% 5,512 6,355 27,259 31,310 3,608 6,116 17,428 19,682 630 723 7,061 9,918 652 746 8,169 9,459 10,160 11,707 656 762
0% 7,851 10,413 27,308 40,711 4,070 6,900 26,347 44,212 329 555 5,017 9,118 747 1,043 9,596 13,607 6,193 9,707 553 773
1% 8,844 11,877 31,742 49,675 4,587 7,775 33,595 57,133 420 718 6,015 10,967 842 1,175 10,758 15,858 6,979 10,938 623 872
2% 9,950 13,663 36,687 59,671 5,162 8,751 42,733 73,520 520 900 7,127 13,030 948 1,322 12,052 18,390 7,855 12,311 701 981
Table 52. External Benefits of Separate Collection Resulting From a Requirement for Source Separation (‘000 € in year 2010)(switching ratios 95% to compost, 5% to AD, landfills with current gas collection efficiencies)
EU Growth Rate Low High -1% 137,585 194,313 0% 151,095 249,156 1% 174,839 295,671 2% 202,291 350,068
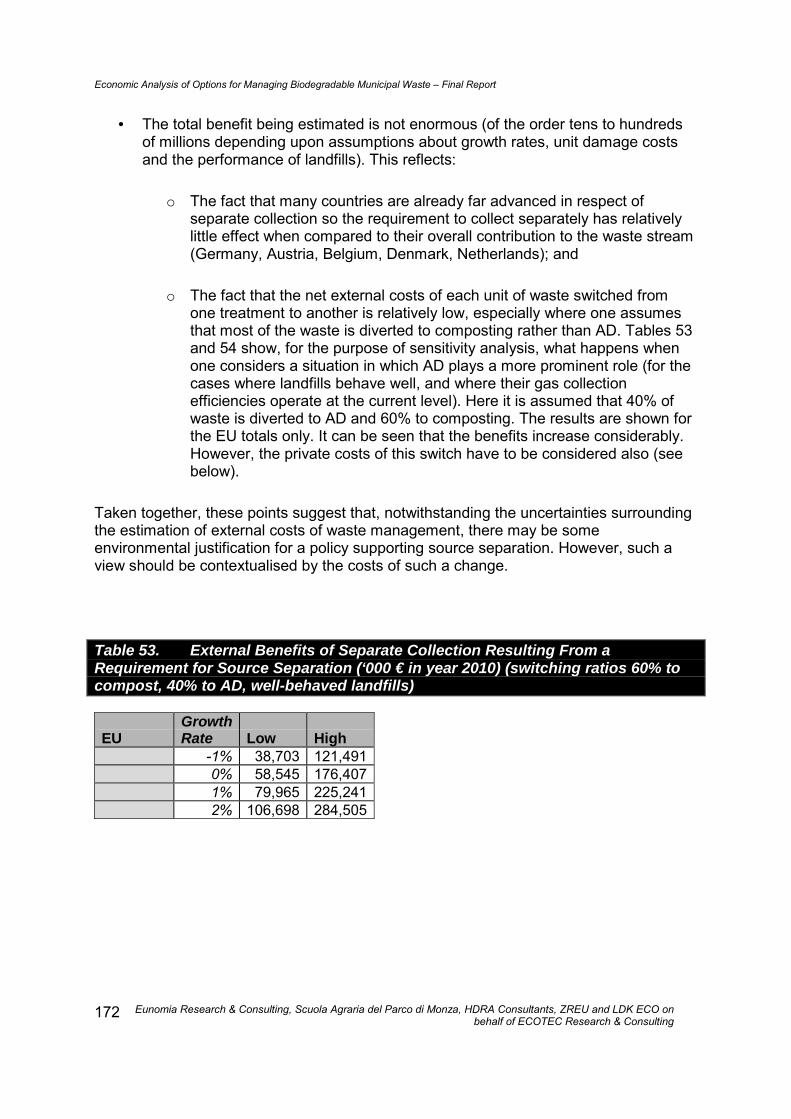
Economic Analysis of Options for Managing Biodegradable Municipal Waste � Final Report
Eunomia Research & Consulting, Scuola Agraria del Parco di Monza, HDRA Consultants, ZREU and LDK ECO onbehalf of ECOTEC Research & Consulting
172
• The total benefit being estimated is not enormous (of the order tens to hundredsof millions depending upon assumptions about growth rates, unit damage costsand the performance of landfills). This reflects:
o The fact that many countries are already far advanced in respect ofseparate collection so the requirement to collect separately has relativelylittle effect when compared to their overall contribution to the waste stream(Germany, Austria, Belgium, Denmark, Netherlands); and
o The fact that the net external costs of each unit of waste switched fromone treatment to another is relatively low, especially where one assumesthat most of the waste is diverted to composting rather than AD. Tables 53and 54 show, for the purpose of sensitivity analysis, what happens whenone considers a situation in which AD plays a more prominent role (for thecases where landfills behave well, and where their gas collectionefficiencies operate at the current level). Here it is assumed that 40% ofwaste is diverted to AD and 60% to composting. The results are shown forthe EU totals only. It can be seen that the benefits increase considerably.However, the private costs of this switch have to be considered also (seebelow).
Taken together, these points suggest that, notwithstanding the uncertainties surroundingthe estimation of external costs of waste management, there may be someenvironmental justification for a policy supporting source separation. However, such aview should be contextualised by the costs of such a change.
Table 53. External Benefits of Separate Collection Resulting From aRequirement for Source Separation (‘000 € in year 2010) (switching ratios 60% tocompost, 40% to AD, well-behaved landfills)
EUGrowthRate Low High
-1% 38,703 121,4910% 58,545 176,4071% 79,965 225,2412% 106,698 284,505
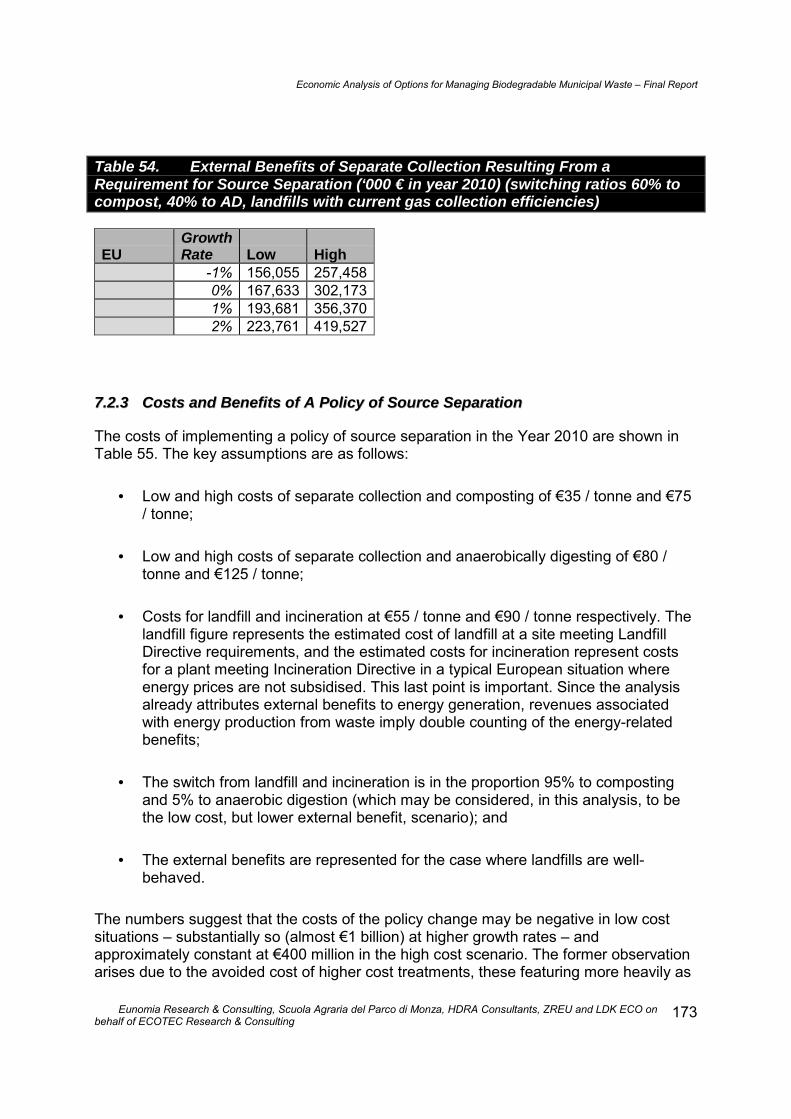
Economic Analysis of Options for Managing Biodegradable Municipal Waste � Final Report
Eunomia Research & Consulting, Scuola Agraria del Parco di Monza, HDRA Consultants, ZREU and LDK ECO onbehalf of ECOTEC Research & Consulting
173
Table 54. External Benefits of Separate Collection Resulting From aRequirement for Source Separation (‘000 € in year 2010) (switching ratios 60% tocompost, 40% to AD, landfills with current gas collection efficiencies)
EUGrowthRate Low High
-1% 156,055 257,4580% 167,633 302,1731% 193,681 356,3702% 223,761 419,527
77..22..33 CCoossttss aanndd BBeenneeffiittss ooff AA PPoolliiccyy ooff SSoouurrccee SSeeppaarraattiioonn
The costs of implementing a policy of source separation in the Year 2010 are shown inTable 55. The key assumptions are as follows:
• Low and high costs of separate collection and composting of €35 / tonne and €75/ tonne;
• Low and high costs of separate collection and anaerobically digesting of €80 /tonne and €125 / tonne;
• Costs for landfill and incineration at €55 / tonne and €90 / tonne respectively. Thelandfill figure represents the estimated cost of landfill at a site meeting LandfillDirective requirements, and the estimated costs for incineration represent costsfor a plant meeting Incineration Directive in a typical European situation whereenergy prices are not subsidised. This last point is important. Since the analysisalready attributes external benefits to energy generation, revenues associatedwith energy production from waste imply double counting of the energy-relatedbenefits;
• The switch from landfill and incineration is in the proportion 95% to compostingand 5% to anaerobic digestion (which may be considered, in this analysis, to bethe low cost, but lower external benefit, scenario); and
• The external benefits are represented for the case where landfills are well-behaved.
The numbers suggest that the costs of the policy change may be negative in low costsituations � substantially so (almost €1 billion) at higher growth rates � andapproximately constant at €400 million in the high cost scenario. The former observationarises due to the avoided cost of higher cost treatments, these featuring more heavily as
Economic Analysis of Options for Managing Biodegradable Municipal Waste � Final Report
Eunomia Research & Consulting, Scuola Agraria del Parco di Monza, HDRA Consultants, ZREU and LDK ECO onbehalf of ECOTEC Research & Consulting
174
the growth rate increases (the proportion of the increase in separately collected wastewhich is being diverted from incineration increases as the growth rate increases).
At higher growth rates, the magnitude of the benefits approaches the magnitude of thecosts as estimated in the �high cost� scenario. In other words, for the high cost scenario,the benefit:cost ratio increases as the growth rate increases.

Economic Analysis of Options for Managing Biodegradable Municipal Waste � Final Report
Eunomia Research & Consulting, Scuola Agraria del Parco di Monza, HDRA Consultants, ZREU and LDK ECO on behalf of ECOTEC Research & Consulting 175
Table 55. Additional Costs, Avoided Costs, Total Private Costs and Costs Net of External Costs For A Source SeparationPolicy, €’000 in 2010, (switching ratios 95% to compost, 5% to AD)
Additional PrivateCosts of BiowasteCollection andTreatment
AdditionalTonnage for
SeparateCollection
Additional Collection / Treatment Costs forBiowaste
Growth Rate (= A) Low (= B) High (= C)-1% 23,352,935 869,897 1,809,8520% 26,346,270 981,399 2,041,8361% 29,687,637 1,105,864 2,300,7922% 33,413,441 1,244,651 2,589,542
Avoided PrivateCosts of Landfilland Incineration
Material Divertedfrom Landfill
Material Divertedfrom Incineration Avoided Treatment Costs
Total AvoidedCosts
Landfill @ (€55 /tonne)
Incineration @(€90/tonne)
Growth Rate (=D) (=E) (= 55 x D/1000 = F) (= 90 x E /1000 = G)= (D x F) +(E x G) = H
-1% 20,102,907 3,250,029 1,105,660 292,503 1,398,1620% 22,097,661 4,248,609 1,215,371 382,375 1,597,7461% 22,965,402 6,722,235 1,263,097 605,001 1,868,0982% 23,606,089 9,807,352 1,298,335 882,662 2,180,997
Summary Cost-Benefit Analysis Net Costs of Collection / Treatment Total External Benefits
Total Costs Net of ExternalBenefits
Growth RateLow
(= (B � H) = I)High
(=(C � H) = J)Low(= K)
High(= L)
Low(= I � K)
High(= J � L)
-1% -528,266 411,690 20,233 58,347 -548,499 353,3430% -616,348 444,090 42,006 123,390 -658,354 320,6991% -762,234 432,694 61,123 164,542 -823,356 268,1522% -936,346 408,545 85,229 215,046 -1,021,575 193,499

Economic Analysis of Options for Managing Biodegradable Municipal Waste � Final Report
Eunomia Research & Consulting, Scuola Agraria del Parco di Monza, HDRA Consultants, ZREU and LDK ECO onbehalf of ECOTEC Research & Consulting
176
Even so, at high costs, the costs potentially exceed the magnitude of the benefits.Indeed, the range in estimated costs also exceeds the range in estimated benefits quitesignificantly. This is surprising at first sight. It suggests that the private costs of thechange are not necessarily known with any greater certainty than the external costs. Thismay well be true given the range of parameters which may affect these costs, although ithas to be re-stated that the external costs as used here do not cover the full range ofestimates, and nor do any of the estimates cover the full range of external costs.
To illustrate sensitivity, two further situations are shown. The first is the situation were theprevalence of AD increases in the same way as was shown for the external costs (Table56). This shows once again that the benefits are greater but it shows that theseenhanced benefits come at a much increased cost.
The second is the situation where the private costs of incineration are increased to €100per tonne and the private costs of landfill are increased to the point where the total costsnet of external benefits are always positive even in the high cost scenario (Table 57).This situation arises when the landfill costs reach €71 per tonne.
This last situation represents an interesting scenario. It is the situation in which the policyeffectively has a negative cost even in the worst case scenario. The point deserves to bemade that landfill and incineration costs are not so different from these levels in thosecountries which are already furthest down this route. The suggestion is, therefore, that analternative to an instrument requiring all countries to source separate waste materialswould be a strategy in which the costs of residual waste treatments are raised to levelsthat make source separation the most desirable option from the financial point of view.
Such a policy has, effectively, already begun in the design of Directives on Landfill andIncineration. However, Member States may implement such legislation in different ways.To the extent that what is proposed is seen as desirable, the intention ought to be toensure that Member States do not seek to implement these Directives in ways which arelikely to reduce the costs of these treatments through side-stepping the intent of theDirectives.
The effect of excluding the benefits of energy recovery in this analysis is shown in Table58. The effect is not dramatic in absolute terms, although the benefits are doubled atlower growth rates. This is an important point since this change in benefits does notsignificantly affect the cost-benefit analysis. However, supporting the price of electricityby €0.02 per kWh electricity can generate considerable additional revenue forincinerators (of the order €10 per tonne of mixed municipal waste). To the extent thatthese revenues reduce costs by the same margin, they do have a significant impact onthe overall analysis.
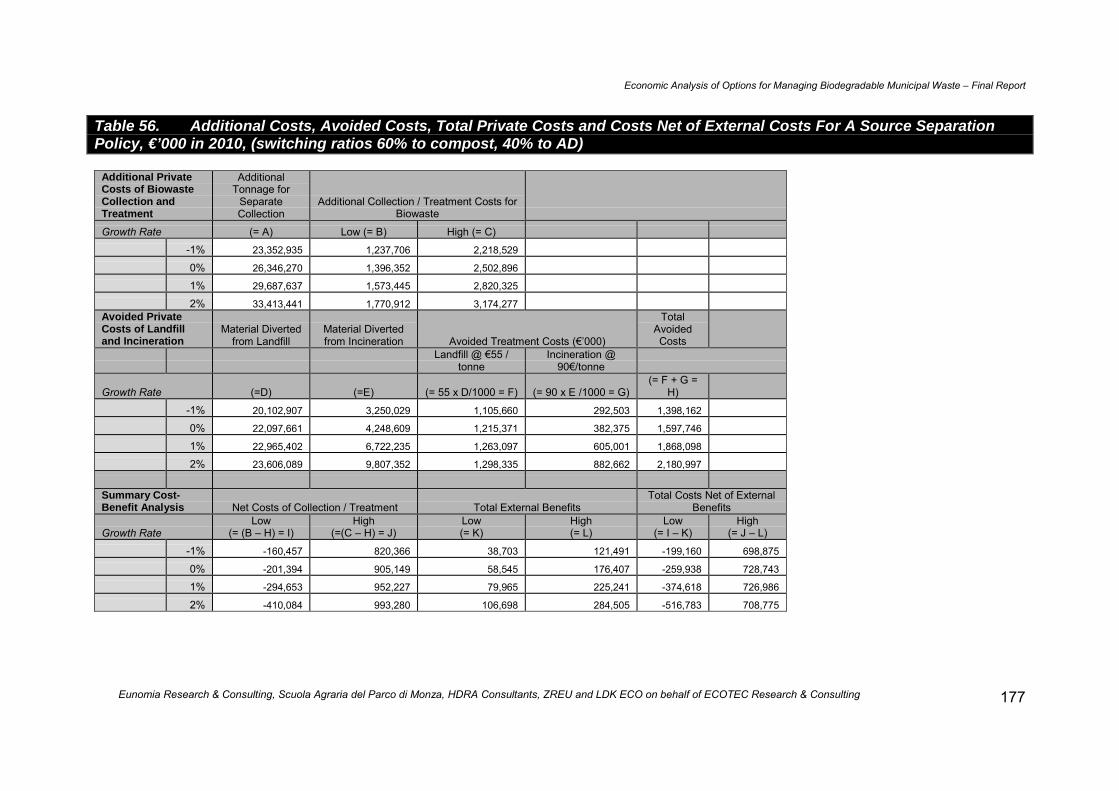
Economic Analysis of Options for Managing Biodegradable Municipal Waste � Final Report
Eunomia Research & Consulting, Scuola Agraria del Parco di Monza, HDRA Consultants, ZREU and LDK ECO on behalf of ECOTEC Research & Consulting 177
Table 56. Additional Costs, Avoided Costs, Total Private Costs and Costs Net of External Costs For A Source SeparationPolicy, €’000 in 2010, (switching ratios 60% to compost, 40% to AD)
Additional PrivateCosts of BiowasteCollection andTreatment
AdditionalTonnage for
SeparateCollection
Additional Collection / Treatment Costs forBiowaste
Growth Rate (= A) Low (= B) High (= C)-1% 23,352,935 1,237,706 2,218,529
0% 26,346,270 1,396,352 2,502,896
1% 29,687,637 1,573,445 2,820,325
2% 33,413,441 1,770,912 3,174,277Avoided PrivateCosts of Landfilland Incineration
Material Divertedfrom Landfill
Material Divertedfrom Incineration Avoided Treatment Costs (€�000)
TotalAvoidedCosts
Landfill @ €55 /tonne
Incineration @90€/tonne
Growth Rate (=D) (=E) (= 55 x D/1000 = F) (= 90 x E /1000 = G)(= F + G =
H)-1% 20,102,907 3,250,029 1,105,660 292,503 1,398,162
0% 22,097,661 4,248,609 1,215,371 382,375 1,597,746
1% 22,965,402 6,722,235 1,263,097 605,001 1,868,098
2% 23,606,089 9,807,352 1,298,335 882,662 2,180,997
Summary Cost-Benefit Analysis Net Costs of Collection / Treatment Total External Benefits
Total Costs Net of ExternalBenefits
Growth RateLow
(= (B � H) = I)High
(=(C � H) = J)Low(= K)
High(= L)
Low(= I � K)
High(= J � L)
-1% -160,457 820,366 38,703 121,491 -199,160 698,875
0% -201,394 905,149 58,545 176,407 -259,938 728,743
1% -294,653 952,227 79,965 225,241 -374,618 726,986
2% -410,084 993,280 106,698 284,505 -516,783 708,775

Economic Analysis of Options for Managing Biodegradable Municipal Waste � Final Report
Eunomia Research & Consulting, Scuola Agraria del Parco di Monza, HDRA Consultants, ZREU and LDK ECO on behalf of ECOTEC Research & Consulting178
Table 57. Additional Costs, Avoided Costs, Total Private Costs and Costs Net of External Costs For A SourceSeparation Policy, €’000 in 2010, (switching ratios 95% to compost, 5% to AD) – ‘Win-win’ Scenario
Additional PrivateCosts of BiowasteCollection andTreatment
AdditionalTonnage for
SeparateCollection
Additional Collection / Treatment Costs forBiowaste
Growth Rate (= A) Low (= B) High (= C)-1% 23,352,935 869,897 1,809,852
0% 26,346,270 981,399 2,041,836
1% 29,687,637 1,105,864 2,300,792
2% 33,413,441 1,244,651 2,589,542Avoided PrivateCosts of Landfilland Incineration
Material Divertedfrom Landfill
Material Divertedfrom Incineration Avoided Treatment Costs
Total AvoidedCosts
Landfill @ (€ 71/tonne)
Incineration @(€100/tonne)
Growth Rate (=D) (=E) (= 71 x D/1000 = F) (= 100 x E /1000 = G)= (D x F) +(E x G) = H
-1% 20,102,907 3,250,029 1,427,306 325,003 1,752,309
0% 22,097,661 4,248,609 1,568,934 424,861 1,993,795
1% 22,965,402 6,722,235 1,630,544 672,223 2,302,767
2% 23,606,089 9,807,352 1,676,032 980,735 2,656,768
Summary Cost-Benefit Analysis Net Costs of Collection / Treatment Total External Benefits
Total Costs Net of ExternalBenefits
Growth RateLow
(= (B � H) = I)High
(=(C � H) = J)Low(= K)
High(= L)
Low(= I � K)
High(= J � L)
-1% -882,412 57,543 20,233 58,347 -902,646 -804
0% -1,012,396 48,041 42,006 123,390 -1,054,403 -75,349
1% -1,196,903 -1,975 61,123 164,542 -1,258,025 -166,517
2% -1,412,117 -67,226 85,229 215,046 -1,497,346 -282,272

Economic Analysis of Options for Managing Biodegradable Municipal Waste � Final Report
Eunomia Research & Consulting, Scuola Agraria del Parco di Monza, HDRA Consultants, ZREU and LDK ECO on behalf of ECOTEC Research & Consulting 179
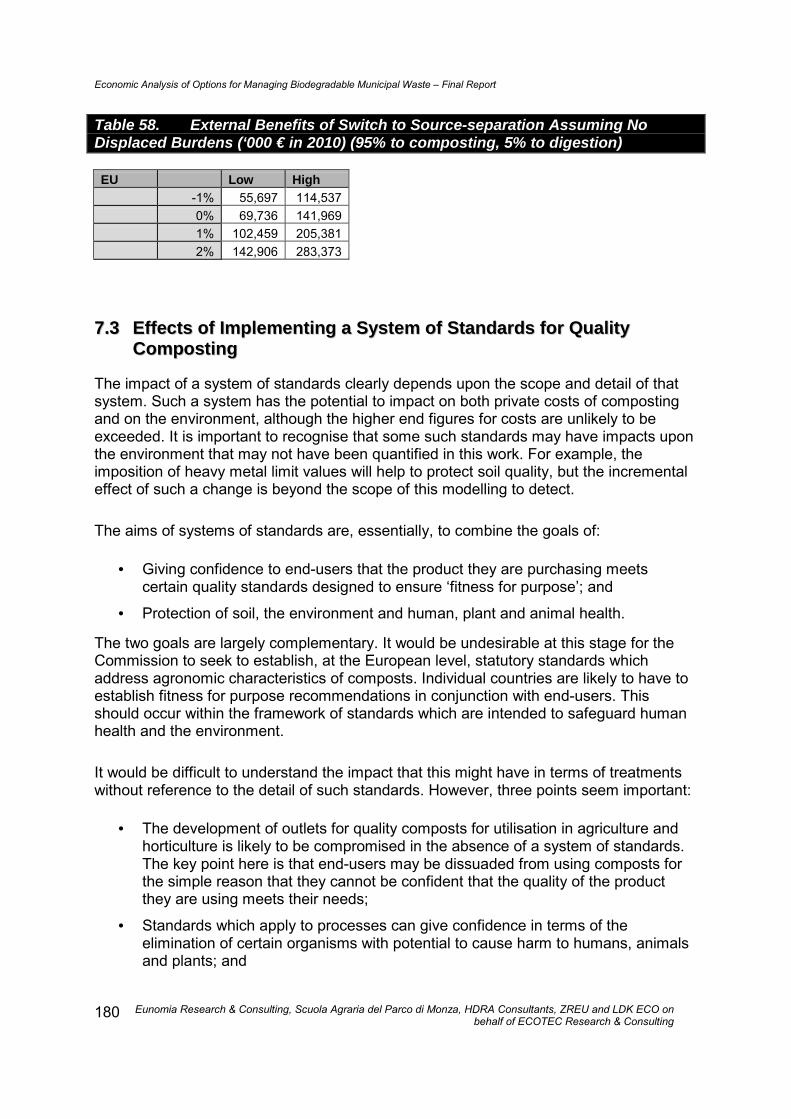
Economic Analysis of Options for Managing Biodegradable Municipal Waste � Final Report
Eunomia Research & Consulting, Scuola Agraria del Parco di Monza, HDRA Consultants, ZREU and LDK ECO onbehalf of ECOTEC Research & Consulting
180
Table 58. External Benefits of Switch to Source-separation Assuming NoDisplaced Burdens (‘000 € in 2010) (95% to composting, 5% to digestion)
EU Low High-1% 55,697 114,5370% 69,736 141,9691% 102,459 205,3812% 142,906 283,373
77..33 EEffffeeccttss ooff IImmpplleemmeennttiinngg aa SSyysstteemm ooff SSttaannddaarrddss ffoorr QQuuaalliittyyCCoommppoossttiinngg
The impact of a system of standards clearly depends upon the scope and detail of thatsystem. Such a system has the potential to impact on both private costs of compostingand on the environment, although the higher end figures for costs are unlikely to beexceeded. It is important to recognise that some such standards may have impacts uponthe environment that may not have been quantified in this work. For example, theimposition of heavy metal limit values will help to protect soil quality, but the incrementaleffect of such a change is beyond the scope of this modelling to detect.
The aims of systems of standards are, essentially, to combine the goals of:
• Giving confidence to end-users that the product they are purchasing meetscertain quality standards designed to ensure �fitness for purpose�; and
• Protection of soil, the environment and human, plant and animal health.
The two goals are largely complementary. It would be undesirable at this stage for theCommission to seek to establish, at the European level, statutory standards whichaddress agronomic characteristics of composts. Individual countries are likely to have toestablish fitness for purpose recommendations in conjunction with end-users. Thisshould occur within the framework of standards which are intended to safeguard humanhealth and the environment.
It would be difficult to understand the impact that this might have in terms of treatmentswithout reference to the detail of such standards. However, three points seem important:
• The development of outlets for quality composts for utilisation in agriculture andhorticulture is likely to be compromised in the absence of a system of standards.The key point here is that end-users may be dissuaded from using composts forthe simple reason that they cannot be confident that the quality of the productthey are using meets their needs;
• Standards which apply to processes can give confidence in terms of theelimination of certain organisms with potential to cause harm to humans, animalsand plants; and

Economic Analysis of Options for Managing Biodegradable Municipal Waste � Final Report
Eunomia Research & Consulting, Scuola Agraria del Parco di Monza, HDRA Consultants, ZREU and LDK ECO onbehalf of ECOTEC Research & Consulting
181
• Drawing distinctions between materials which are �products� and materials thatare �wastes� makes clear that where certain qualities are not met, the resultingmaterials must be treated in line with legislation and controls which apply to wastematerials. This means that unless such materials qualify for exemptions frompermitting under Member State implementation of the Waste FrameworkDirective, they must be subject to licensing controls.
One can speculate as to the effects that a desirable system of standards might have onthe different country groupings listed above. Group 1 countries would be affected only tothe extent that existing systems of standards differed measurably from those proposed atthe European level. Given the apparent success of these existing standards in providinga baseline standard for quality compost, significant departures are probably unlikely(although, equally, there is not universal agreement as to exactly what the completesystem of standards should look like).
A system of standards should be helpful for Group 2 countries in giving confidence toend-users in what would be developing markets for quality compost. The design ofsource separation systems could be influenced by quality standards, recognising that thelower the rates of contamination, the more likely it becomes that the highest qualitystandards are met.
The same should apply to Group 3 countries, though to the extent that some of thesemight have anticipated making use of low-grade materials from mixed waste�composting� as soil amelioration products, the re-definition of these materials as �wastes�might discourage such treatments. Whether this would increase the degree to whichsource separation was implemented, or whether instead, the resort to incineration andother treatments increased as a result, cannot be determined in this analysis. MemberState (and municipality) attitudes are clearly important here.
77..33..11 QQuuaannttiiffiiccaattiioonn ooff IImmppaaccttss ooff IImmpplleemmeennttiinngg SSttaannddaarrddss SSyysstteemmss
It is difficult to quantify any impact resulting from this scenario. On the external costsside, the effects of changing the quality of composts cannot be quantified. This does notmean the effects are unimportant. Certainly, in Southern Member States, given thedegree to which soil organic matter is, increasingly, a limiting factor in agriculturalproduction, the temptation might be to make use of all organic material of whateverquality in an attempt to improve soil organic matter status. The risks associated with thiswould be that in solving one problem, one creates another (or others) related to heavymetals and, potentially, organic pollutants.
Standards can establish confidence in the minds of users of composts and thosecharged with dealing with the consequences of their application. To the extent that thelack of standards makes it difficult to develop the market for compost usage, standardshave to be seen as integral to the process of ensuring that the benefits from compostutilisation can be captured.
Economic Analysis of Options for Managing Biodegradable Municipal Waste � Final Report
Eunomia Research & Consulting, Scuola Agraria del Parco di Monza, HDRA Consultants, ZREU and LDK ECO onbehalf of ECOTEC Research & Consulting
182
It would be possible for a system of standards to have a very similar effect as arequirement for source separation. This would be the case in the followingcircumstances:
• There was a target for municipalities / provinces / regions for recycling andcomposting; and
• The standard effectively defined �compost� in such a way that the quality requiredcould only be achieved through source separation.
In these circumstances, the targets would effectively require source separation.
Such a standard could also have a �protective� role in the sense that it would require thatwastes which fell outside the standard still had to be treated as wastes. This wouldsupport a proper treatment of low quality outputs from biological treatment processes.
77..44 TThhee PPootteennttiiaall IImmppaacctt ooff AAggrrii--eennvviirroonnmmeennttaall PPoolliicciieess
Clearly the development of markets for compost is an important aspect of a system ofstandards. Furthermore, market development is necessary where source separation ismade mandatory. EU experience thus far suggests that requirements for sourceseparation need to be supported by standards for composting.
Further support for the marketing of compost could be given in those situations where itwas felt appropriate to support the use of compost by farmers. The rationale for thismight be different in different areas of Europe. Two important considerations in thisrespect might be the time-limited sequestration of carbon in soils, the implications ofwhich are felt at a global level, and the related objective of building up soil organic mattercontent where this is already falling to low levels.
In Italy, support for the latter already occurs in three regions of the country. Paymentsmade to farmers in Emilia Romagna amount to €155 per hectare for applications whichbuild up soil organic matter on depleted soils. The Piemonte region pays €220 perhectare for applications of 25 tonnes dry matter per hectare applied over a five year timeframe. The justification for such payments comes from Regulation EC 1257 onSustainable Agriculture.
Discussions have already taken place in various international for a concerning thepotential for awarding credits to farmers for the role played by composting insequestering carbon in the soil. Similarly, in Canada, TransAlta has been seeking toacquire carbon credits through promotion of no-till soil management techniques which,because of the reduced disturbance experienced by the soil, do not lead to the samelevels of mineralization of carbon as conventional agricultural techniques.
Regarding organic farming, the potential for enhanced use f composts seems, at onelevel, considerable. At the same time, however, organic standards bodies have displayed

Economic Analysis of Options for Managing Biodegradable Municipal Waste � Final Report
Eunomia Research & Consulting, Scuola Agraria del Parco di Monza, HDRA Consultants, ZREU and LDK ECO onbehalf of ECOTEC Research & Consulting
183
a great deal of concern regarding the potential for composts based on source-separatedmunicipal waste feedstocks, to b contaminated by genetically manipulated organisms(GMOs). Until this issue is resolved, the use of composts from source separatedmunicipal wastes is likely to be restricted to those derived from garden wastes.

Economic Analysis of Options for Managing Biodegradable Municipal Waste � Final Report
Eunomia Research & Consulting, Scuola Agraria del Parco di Monza, HDRA Consultants, ZREU and LDK ECO onbehalf of ECOTEC Research & Consulting
184
77..55 IInntteerrnnaall MMaarrkkeett aanndd TTrraaddee IIssssuueess
The study requires us to comment upon any significant potential internal market andtrade issues that may arise as a result of different National legislation on composting,and to assess the impact of harmonised legislation on these issues.
Probably the most important internal market issue that could arise in the context ofdifferences in National legislation is that which could occur through different MemberStates drawing different distinctions between �wastes� and �products�. This is a distinctionwhich has statutory force in some countries. The movement of such materials acrossborders could clearly face some problems where one country�s definition classified amaterial as product whilst the receiving country classified it as a waste.
Harmonising legislation in this regard would have clear advantages. This would enablecompost products to marketed freely throughout the EU unencumbered by differingdefinitions as to when a �waste� ceases to be a waste.
Beyond this issue, no new issues would seem to arise in the context of differinglegislation on composting.

Economic Analysis of Options for Managing Biodegradable Municipal Waste � Final Report
Eunomia Research & Consulting, Scuola Agraria del Parco di Monza, HDRA Consultants, ZREU and LDK ECO onbehalf of ECOTEC Research & Consulting
185
88..00 OOBBSSEERRVVAATTIIOONNSS,, CCOONNCCLLUUSSIIOONNSS AANNDDRREECCOOMMMMEENNDDAATTIIOONNSS
88..11 IInnttrroodduuccttiioonn
This report has sought understand, from a cost-benefit perspective, the implications ofimplementing a requirement for source separation of biodegradable municipal waste.The data requirements, and the information and technical demands placed upon thoseseeking to carry out such a study are immense. As those with experience in the field ofwaste management will know, the situation in respect of data is not good.
88..22 KKeeyy OObbsseerrvvaattiioonnss
The following observations can be made:
1. Many countries already have quite well-developed systems for the collection ofsource separated biodegradable municipal wastes. These countries typically:
a. Have relatively comprehensive systems of standards in place for compost.These standards usually seek to ensure protection of human health andthe environment. They are supported by quality assurance systems forcompost procducers;
b. Treat the vast majority of this material through composting processes;
c. Appear to have a strong motivation for doing so because the costs ofresidual treatments in these countries typically exceed the costs ofseparate collection-plus-composting;
2. For the EU as a whole, the effect of policy which seeks only to establish aEurope-wide system of standards, whilst of some utility, loses much of itstransformative power unless:
a. Member States have established targets for recycling and composting; and
b. The targets, or the standards, or both draw a clear distinction betweencompost, defined as a product, and �other materials�, defined as wastes.
Only in this situation would it seem likely that a �standards only� policy would havea clear and positive effect;
3. Generally, the analysis of external costs and benefits is favourable to the separatecollection and treatment of biowastes through composting or anaerobic digestion.
Economic Analysis of Options for Managing Biodegradable Municipal Waste � Final Report
Eunomia Research & Consulting, Scuola Agraria del Parco di Monza, HDRA Consultants, ZREU and LDK ECO onbehalf of ECOTEC Research & Consulting
186
4. However, the magnitude of these benefits relative to other treatments is notlarge. This reflects the limitations of the economic analysis of external costs andbenefits, which in turn. These, in turn, reflect the many limitations of the scientificknowledge concerning the actual effects one is seeking to quantify;
5. There is good reason to believe that a complete analysis of external costs andbenefits of all waste treatment options would show compost and anaerobicdigestion in a rather more positive light than has been the case in this analysis.This reflects the fact that some of the more negative aspects of landfilling andincineration have not been captured. Whilst the same can be said for someaspects of composting, these emissions tend to be relatively benign. Those thatare potentially harmful are believed to be localised, and likely to affect only certaintarget groups. On the benefits side those associated with energy generation fromincineration, landfill and anaerobic digestion are rather well understood. On theother hand, the benefits of compost utilisation are relatively poorly understood andnot so easily quantified;
6. The private costs of different waste treatment options are not as well-establishedas one would like in carrying out this type of analysis;
7. In many countries (e.g. Austria, Germany and the Netherlands) the private costsof separate collection and composting are less than those of collecting residualwaste and either landfilling or incinerating it. In other countries, the opposite maybe the case (depending upon assumptions).
8. Whether the quantifiable benefits of the switch to separate collection andcomposting justify the costs depends upon how well-behaved alternativetreatments are (do incinerators meet standards laid down in the latest IncinerationDirective? Do landfills collect gas efficiently, and if so, do they generate energyfrom gas collected?). The worse these treatments behave, the greater thequantifiable external benefits of the switch to separate collection and biologicaltreatment. Equally, the quantifiable benefits of the switch are likely to fall onlyonce costs increase;
9. A number of Member State-specific policies affect the unit cost of the wastetreatments being examined. These include policies on renewable energy (whichcan support prices for energy derived from waste), policies on packaging recoveryand environmental taxes on landfill, incineration, transport and air emissions. Inaddition, Member States implement EU Directives, such as the Landfill Directive,the Incineration Directive and the IPPC Directive, in quite different ways. Becausean increasing number of regulatory and economic instruments impinge uponcosts, it is increasingly difficult to be clear about whether or not one is doublecounting, or benefits, in assessing the total private and external costs and benefitsof the different approaches;
88..33 CCoonncclluussiioonnss

Economic Analysis of Options for Managing Biodegradable Municipal Waste � Final Report
Eunomia Research & Consulting, Scuola Agraria del Parco di Monza, HDRA Consultants, ZREU and LDK ECO onbehalf of ECOTEC Research & Consulting
187
An important conclusion to be drawn from this study is that neither the private costs, northe external costs and benefits, can be specified with much certainty. This implies thatone has to treat the results with some considerable caution.
Regarding external costs and benefits, the analysis which has been carried out is, for alltreatments:
• Incomplete (in the sense that it has not been possible to quantify all external costsand benefits);
• Affected by significant uncertainty; and
• Influenced by certain key assumptions which have material affects on results. It isunlikely that agreement could easily be reached on the correct nature of theassumptions.
Regarding private costs:
• The range of available technologies is increasing and each has different costimplications;
• Costs are affected by scale of treatment technology; and
• The structure of costs varies across countries, and within countries, owing todifferences in policy at the Member State level (taxes, subsidies). Indeed, thecosts vary over time as policy continues to evolve.
It seems reasonable to state that cost-benefit analysis alone cannot be used as a basisupon which to make decisions regarding waste management policy. The incompletenature of such an analysis calls for other tools and criteria to support proposed changesin policy.
On the balance of evidence that has been presented, it seems that a policy of sourceseparation will be justified where the collection system for source-separated biowastes iscarried out in such a way as to optimise costs. Furthermore, where the costs ofcomposting itself are kept to a reasonable level, it becomes likely that the net costincrease will be minimal, and may become negative (as is already the case in severalcountries) as costs for other treatments increase. It is worth noting that the costs oflandfilling and incineration have shown a tendency to rise (owing to controls on pollutantsetc.,) whereas those for enclosed composting and anaerobic digestion have, if anything,shown a tendency to fall. The costs for composting are likely to be lower undermandatory separate collection to the extent that this increases typical plant scale.
Other factors which may weigh in favour of this type of policy are:

Economic Analysis of Options for Managing Biodegradable Municipal Waste � Final Report
Eunomia Research & Consulting, Scuola Agraria del Parco di Monza, HDRA Consultants, ZREU and LDK ECO onbehalf of ECOTEC Research & Consulting
188
• The fact that separate collection increases the possibility for implementingvariable charging schemes, which can influence waste generation, and act tosensitise citizens to waste as an environmental issue;
• The relative unpopularity of larger treatments such as landfills and incinerators;and
• The potential linkages with agri-environmental / rural development policies, inwhich compost utilisation (and production) could be encouraged.
It is worth noting that if the private costs of the change to source separation werenegative, this is a change which would be likely to occur anyway. It may well be the casethat a �policy� which seeks to reduce the level of the subsidies to incineration, and whichseeks to ensure that the spirit and letter of the Landfill Directive is correctly applied(including, for example, issues related to the destiny of incinerator ash residues, andwhat should be seen to constitute pre-treatment) has a similar effect in terms ofencouraging source separation as a mandatory requirement to implement this service.The separate collection of biowastes would flow naturally as an outcome of the relativecosts of different waste management options.
The more difficult it becomes to ensure the relative costs of treatment options favour thesource separation approach (for example, due to Member State initiatives to support thedevelopment of energy from waste as a renewable energy source), the stronger theargument becomes for implementing a requirement for source separation. This wouldconstitute recognition of the fact that, however desirable (or not) the objective ofsupporting energy from waste might be in the context of a target for electricity generationfrom renewable energy, such policies have the potential to distort waste managementdecisions. This perspective is especially important given the �so-far-limited� exploration ofthe potential external benefits of applying compost to the soil. In either context, theestablishment of Europe-wide standards might enable compost products to be marketedmore freely across Europe.
To conclude, a policy requiring source separation might not be necessary in a worldwhere the Landfill Directive is fully implemented and where subsidies distorting the netcosts of residual waste treatments were less prevalent than they are. However small theexternal benefits of such a proposed policy might appear (owing partly to the level ofsource separation already being achieved, but also, to the relatively low unit benefits ofsuch a switch), these are benefits that can be captured at low or negative cost relative tothe costs of alternative treatments. Where the net costs are not negative, they may be inthe future.
It is quite possible, even likely, that the external benefits of applying compost to land willappear greater as understanding improves concerning the complex interactions betweencompost and soil. It should be borne in mind that the externality assessment leavescertain negative consequences of waste treatments under-explored, whilst the benefitsside is relatively well-established for energy recovery facilities (being linked to the well-researched area of energy-related externalities). For compost, estimating the benefitshas something more of an art about it. As such, over time, society may come to
Economic Analysis of Options for Managing Biodegradable Municipal Waste � Final Report
Eunomia Research & Consulting, Scuola Agraria del Parco di Monza, HDRA Consultants, ZREU and LDK ECO onbehalf of ECOTEC Research & Consulting
189
understand that the benefits of applying quality composts to the soil, and hence, of apolicy mandating source separation, are much greater than have been anticipated thusfar.
88..44 RReeccoommmmeennddaattiioonnss ffoorr FFuuttuurree IInnvveessttiiggaattiioonnss
There are several recommendations which flow from the above considerations:
a. A systematic attempt to understand the different influences on the costs ofwaste management options in the EU is urgently needed. For example,whilst the external cost assessment suggests that anaerobic digestion is asuperior option in environmental terms, the assumption is that the higherprivate costs may not justify the additional external benefits. Thisconclusion would alter, however, if the costs of anaerobic digestion werelower than assumed here. Such a study should focus on the differenteconomic and regulatory instruments which currently affect the relativecosts of different waste management options in the EU. Regarding theLandfill Directive, this would require some check on the adequacy offinancial provisions, an assessment of the mechanism through which itwas ensured that full costs were passed on to waste producers (with someagreement as to the basis for ensuring this is done), and a review of theapplication of the requirements for pre-treatment of landfilled waste. Thesewould affect the costs of landfilling. In addition, the way in which the end toco-disposal affects landfilling of incinerator ash residues will have animpact on the costs of incineration. Other instruments requiringinvestigation are the Incineration Directive, the IPPC Directive, MemberState-specific taxes on landfill and incineration, and policies in place tosupport energy production from waste. The presence or absence ofspecific measures raises questions as to the degree to which an analysisof external costs and benefits, as carried out here, actually involves doublecounting of costs and benefits (since these may already be internalised inprivate costs).
b. Although this work constitutes the first attempt to quantify, in acomprehensive manner, the external benefits associated with use ofcompost, these estimates are subject to great uncertainty. They do,however, provide a reference point for further work which should seek, forexample, to:
i. Investigate further the potential for compost applications tocontribute to the sequestration of carbon, and also, the build up oforganic matter in the soil. Note that in conventional life-cycleapproaches, which effectively ignore all biogenic carbon emissions,the scope for such an analysis is not possible owing to theassumptions made;
Economic Analysis of Options for Managing Biodegradable Municipal Waste � Final Report
Eunomia Research & Consulting, Scuola Agraria del Parco di Monza, HDRA Consultants, ZREU and LDK ECO onbehalf of ECOTEC Research & Consulting
190
ii. Investigate further the potential of compost applications to reducerequirements for pesticide use in agriculture and other forms ofcultivation;
iii. Understand more clearly the potential of nutrient applied to offsetnitrous oxide emissions associated with the use of manures andsynthetic nitrogenous fertilisers;
iv. Seek to quantify the external benefits associated with the reductionin the likelihood of flooding which might be occasioned by greateruse of compost, owing to its tendency to support greater infiltrationand retention of water;
c. The external cost analysis does not cover all impacts. Key omissionswhich could be addressed are:
i. For all treatments, the disamenity associated with the plant. Thisanalysis has to be undertaken with great care, and indeed, whilstthere is uncertainty concerning health effects of differenttreatments, an assessment of disamenity is unlikely to bestraightforward, with hedonic pricing approaches potentiallygenerating much lower estimates than contingent valuationmethods;
ii. For all treatments, the impact of the treatments on operator health;
iii. For compost, as well as the positive aspects outlined above, on thenegative side, the health effects of bioaerosols in the surroundingarea, the impact of heavy metal applications to the soil (relative toalternative soil improvers), and the potential for impacts from anyorganic pollutants in compost; and
iv. For incineration, the impacts of all air pollutants as opposed to asub-set thereof. The issue of non-chlorinated (e.g. brominated)dioxins and related compounds needs to be addressed. In addition,the impacts of various treatment routes for ash residues (includingthe use of residues in construction applications) need carefulconsideration.
v. For landfill, the external costs associated with leachate and the fullrange of gaseous emissions;