2013年3月期 第11四半期決算説明会資料Net Sales are down to ¥362 million (-11.1% YoY)...
16
2012年8月1日 2013年3月期 2013年3月期 第1四半期決算説明会資料 四半期決算説明会資料 第1四半期決算説明会資料 四半期決算説明会資料 Presentation on Financial Results Presentation on Financial Results for the First Three Months of for the First Three Months of the Fiscal Year Ending March 31, 2013 the Fiscal Year Ending March 31, 2013 Copyright 2012 NSD CO., LTD. V1.0
Transcript of 2013年3月期 第11四半期決算説明会資料Net Sales are down to ¥362 million (-11.1% YoY)...

2012年8月1日
2013年3月期2013年3月期
第第11四半期決算説明会資料四半期決算説明会資料第第11四半期決算説明会資料四半期決算説明会資料Presentation on Financial Results Presentation on Financial Results for the First Three Months offor the First Three Months ofthe Fiscal Year Ending March 31, 2013the Fiscal Year Ending March 31, 2013
Copyright 2012 NSD CO., LTD.V1.0

目次目次
ページ
2013年3月期第1四半期連結累計期間 決算の概況 3
連結 業績の概要 第1四半期(4~6月) 5
連結 セグメント別売上高と売上総利益 第1四半期(4~6月) 6
連 (参考) 想 7連結 (参考)業績の実績と予想 7
単独 業績の概要 第1四半期(4~6月) 8
単独 セグメント別売上高と売上総利益 第1四半期(4~6月) 9
単独 (参考)業績の実績と予想 10
単独 業種別売上高 (ソフトウエア開発・コンピュータ室運営管理) 第1四半期(4~6月) 11
単独 金融業業態別売上高 (ソフトウエア開発 コンピュ タ室運営管理) 第1四半期(4~6月) 12単独 金融業業態別売上高 (ソフトウエア開発・コンピュータ室運営管理) 第1四半期(4~6月) 12
単独 ソフトウエア開発受注動向 13
単独 製造費用とセグメント別外注費比率 14
会社概要 15
※ この資料において、表示単位未満の金額は全て切り捨てて処理しております。
また、パーセントで表示してある数値は全て四捨五入しております。
Copyright 2012 1

IndexIndex
page
Summary of Consolidated Financial Results for cumulative 1Q of FY Mar. 2013 4
Operating Results for the three-month period (Apr.-Jun.) : Consolidated 5
Net Sales and Gross Profit by Division for the three-month period (Apr.-Jun.) : Consolidated 6
(Ref.) Operating Results and Estimates : Consolidated 7( ) p g
Operating Results for the three-month period (Apr.-Jun.) : Non-Consolidated 8
Net Sales and Gross Profit by Division for the three-month period (Apr.-Jun.) : Non-Consolidated 9
(Ref.) Operating Results and Estimates : Non-Consolidated 10
Net Sales by User Industry (Software Development and Facilities Management) for the three-month period (Apr.-Jun.) : Non-Consolidated 11
Sales Breakdown by Financial Business Category(Software Development and Facilities Management) for the three-month period (Apr.-Jun.) : Non-Consolidated 12y g y( p g ) p ( p )
Software Development: Order, Net Sales and Order Backlog Trend : Non-Consolidated 13
Manufacturing Costs and Subcontracting Costs Breakdown : Non-Consolidated 14
Corporate Profile 15
Notes: In this report fractions in yen are rounded off. Percent is rounded to its closest value.
Copyright 2012 2
20132013年年33月期月期 第第11四半期連結累計期間四半期連結累計期間決算の概況決算の概況
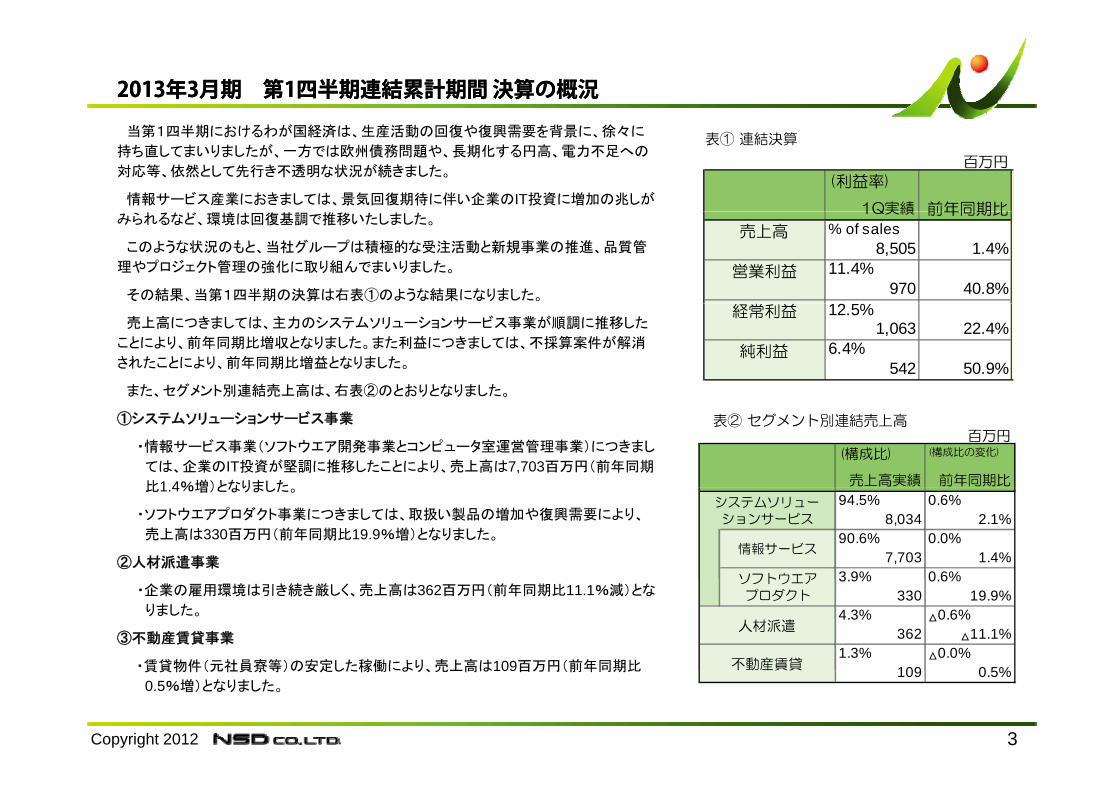
表① 連結決算当第1四半期におけるわが国経済は、生産活動の回復や復興需要を背景に、徐々に
持ち直してまいりましたが、一方では欧州債務問題や、長期化する円高、電力不足への
対応等、依然として先行き不透明な状況が続きました。
情報サービス産業におきましては、景気回復期待に伴い企業のIT投資に増加の兆しが
百万円
(利益率)
1Q実績 前年同期比みられるなど、環境は回復基調で推移いたしました。
このような状況のもと、当社グループは積極的な受注活動と新規事業の推進、品質管
理やプロジェクト管理の強化に取り組んでまいりました。
その結果、当第1四半期の決算は右表①のような結果になりました。
1Q実績 前年同期比
売上高 % of sales8,505 1.4%
営業利益 11.4%970 40.8%
12 %売上高につきましては、主力のシステムソリューションサービス事業が順調に推移した
ことにより、前年同期比増収となりました。また利益につきましては、不採算案件が解消
されたことにより、前年同期比増益となりました。
また、セグメント別連結売上高は、右表②のとおりとなりました。
経常利益 12.5%1,063 22.4%
純利益 6.4%542 50.9%
表② セグメント別連結売上高
また、セグメント別連結売上高は、右表②のとおりとなりました。
①システムソリューションサービス事業
・情報サービス事業(ソフトウエア開発事業とコンピュータ室運営管理事業)につきまし
ては、企業のIT投資が堅調に推移したことにより、売上高は7,703百万円(前年同期
比1 4%増)となりました
百万円
(構成比) (構成比の変化)
売上高実績 前年同期比比1.4%増)となりました。
・ソフトウエアプロダクト事業につきましては、取扱い製品の増加や復興需要により、
売上高は330百万円(前年同期比19.9%増)となりました。
②人材派遣事業
94.5% 0.6%8,034 2.1%
90.6% 0.0%7,703 1.4%
3 9% 0 6%
システムソリュー
ションサービス
情報サービス
ソフトウエア・企業の雇用環境は引き続き厳しく、売上高は362百万円(前年同期比11.1%減)とな
りました。
③不動産賃貸事業
・賃貸物件(元社員寮等)の安定した稼働により、売上高は109百万円(前年同期比
3.9% 0.6%330 19.9%
4.3% 0.6%362 11.1%
1.3% 0.0%109 0 5%不動産賃貸
ソフトウエア
プロダクト
人材派遣
Copyright 2012 3
賃貸物件(元社員寮等)の安定した稼働により、売上高は109百万円(前年同期比
0.5%増)となりました。109 0.5%

Summary of Consolidated Financial Results for the First Three Months of the Fiscal Year ending March 2013Summary of Consolidated Financial Results for the First Three Months of the Fiscal Year ending March 2013
Th J d i th fi t th th f th FY 2013 h d llTable-1. Consolidated Financial Results
The Japanese economy during the first three months of the FY 2013 has gradually improved backed by recovery of production activities and restoration demands. On the other hand, the future prospect has remained unpredictable because of the factors such as the European debt crisis, prolonged strong Yen, and concerns over measures for power shortages.
I th i f ti i i d t i th d l i t d f b i i t
millions of yen(Margin)
Results YoY (%)In the information services industries, the underlying tendency of business environment
has been toward recovery as there are some signs of increase in IT investment hand in hand with the expectation of economic recovery.
Under these circumstances NSD group has engaged in positive sales activities and promotion of new businesses, and has exerted every effort to strengthen quality control
d j t t
% of sales8,505 1.4%
11.4%970 40.8%
OperatingIncome
Net Sales
and project management.
As the result, Consolidated Financial results for this first three months are shown in Table-1: Net Sales have increased year-on-year basis thanks to favorable sales in system solution services, our main segment. Profits have also increased year-on-year basis as the problem of the unprofitable project has been settled.
12.5%1,063 22.4%
6.4%542 50.9%
Ordinary Income
Net Income
Table-2. Consolidated Net Sales by DivisionConsolidated Net Sales by Division are as shown in Table-2:
(1) System Solution Services Division
* Information Services(Software Development and Facilities Management):
Net Sales have increased to ¥7,703 million (+1.4% YoY) thanks to steady
millions of yen(% of total)
Sales Results
YoY (%)of total of Net Sales( ) y
IT investment by companies.
* Software Products:
Net Sales have increased to ¥330 million (+19.9% YoY) thanks to the increase of handling products, and restoration demands.
94.5% 0.6%8,034 2.1%
90.6% 0.0%7,703 1.4%
3 9% 0 6%
System SolutionServices
InformationServices
(2) Staffing Services Division
Net Sales are down to ¥362 million (-11.1% YoY) as the corporate employment environment has remained severe.
(3) Real Estate Services
3.9% 0.6%330 19.9%
4.3% 0.6%362 11.1%
1 3% 0 0%
Staffing Services
R l E t t
SoftwareProducts
Copyright 2012 4
Net sales have slightly increased to ¥109 million (+0.5% YoY) thanks to the steadyoccupancy rate at the company-owned properties (former dormitories for employees).
1.3% 0.0%109 0.5%
Real EstateServices

連結連結 業績の概要業績の概要 第第11四半期(四半期(44~~66月)月)Operating Results for the ThreeOperating Results for the Three--month Period (Apr.month Period (Apr.--Jun.) : ConsolidatedJun.) : Consolidated
8,000
12,000売上高 Net Sales
百万円 millions of yen
ResultsIncrease orDecrease YoY (%)
% of sales % of sales % of sales
2012/6
売上高
2011/62010/6
0
4,000
2010/6 2011/6 2012/6
8,325 8,386 8,505 119 1.4%
80.5% 83.2% 80.2%
6,702 6,981 6,824 157 2.2%
19.5% 16.8% 19.8%
Net Sales
売上原価Cost of Sales
売上総利益
20%
30%
2,000
3,000
売上総利益
Gross Profit
売上総利益率Gross Profit Margin
20%
30%
2,000
3,000
営業利益
Operating Income1,623 1,404 1,681 276 19.7%
8.8% 8.5% 8.4%
734 715 711 4 0.6%
10 7% 8 2% 11 4%
売上総利益Gross Profit
販売費及び一般管理費
SG & A Expenses
0%
10%
0
1,000
0%
10%
0
1,000
営業利益率Operating Income Margin
10.7% 8.2% 11.4%
888 689 970 281 40.8%
11.9% 10.4% 12.5%
992 868 1,063 194 22.4%経常利益
Ordinary Income
営業利益Operating Income
2010/6 2011/6 2012/6 2010/6 2011/6 2012/6
30%3,000
経常利益
Ordinary Income30%3,000
四半期純利益
Quarterly Net Income
0.2% 0.0% 0.0%
19 0 0 0 100.0%
0.1% 0.6% 0.1%
10 47 4 43 90 8%
特別利益Extraordinary Gains
特別損失Extraordinary
L
10%
20%
1,000
2,000
経常利益率Ordinary Income Margin
10%
20%
1,000
2,000
四半期純利益率Quarterly Net Income Margin
10 47 4 43 90.8%
12.0% 9.8% 12.5%
1,001 821 1,059 237 28.9%
6.4% 4.3% 6.4%
Losses
税金等調整前
四半期純利益Quarterly Income
before Tax
四半期純利益Quarterly Net
Copyright 2012 5
0%02010/6 2011/6 2012/6
0%02010/6 2011/6 2012/6
535 359 542 182 50.9%Quarterly Net
Income

連結連結 セグメント別売上高と売上総利益セグメント別売上高と売上総利益 第第11四半期(四半期(44~~66月)月)Net Sales and Gross Profit by Division for the ThreeNet Sales and Gross Profit by Division for the Three--month Period (Apr.month Period (Apr.--Jun.) : ConsolidatedJun.) : Consolidated
f
7 331 7,593 7,703480 275 330418 407 36295 108 1099,000
売上高 Net Sales売上高 Net Sales百万円 millions of yen
Results Increase orDecrease YoY (%)
93.8% 93.8% 94.5%7,811 7,869 8,034 164 2.1%
2011/62010/62012/6
システムソリューション
売 上 高Net Sales売上総利益 7,331
3,000
6,0001,551 1,339 1,618 278 20.8%
19.9% 17.0% 20.1% 3.1% ―88.0% 90.5% 90.6%
7,331 7,593 7,703 109 1.4%情報サービス
売 上 高Net Sales売上総利益
システムソリュ ションサービス
System Solution Services
売上総利益Gross Profit
売上総利益率Gross Profit Margin
02010/6 2011/6 2012/6
■ 情報サービス ■ ソフトウエアプロダクト
1,437 1,249 1,520 271 21.7%
19.6% 16.5% 19.7% 3.3% ―5.8% 3.3% 3.9%
480 275 330 54 19.9%
情報サ ビスInformation Services
売上総利益Gross Profit
売上総利益率Gross Profit Margin
ソフトウエアプロダクト
売 上 高Net Sales売上総利益
売上総利益率 Gross Profit Margin
Information Services Sof tware Products
■ 人材派遣 ■ 不動産賃貸
Staf f ing Services Real Estate Services
113 90 98 7 8.5%
23.6% 32.9% 29.7% 3.1% ―5.0% 4.9% 4.3%
418 407 362 45 11.1%
32 25 29 3 12 2%
プロダクトSoftware Products Gross Profit
売上総利益率Gross Profit Margin
人材派遣St ffi S i
売 上 高Net Sales売上総利益G P fit
40%
32 25 29 3 12.2%
7.7% 6.4% 8.0% 1.7% ―1.2% 1.3% 1.3%
95 108 109 0 0.5%
39 39 34 5 12 8%
Staffing Services Gross Profit売上総利益率
Gross Profit Margin
不動産賃貸Real Estate Services
売 上 高Net Sales売上総利益Gross Profit
20%
39 39 34 5 12.8%
41.7% 36.0% 31.3% 4.7% ―100.0% 100.0% 100.0%
8,325 8,386 8,505 119 1.4%
1,623 1,404 1,681 276 19.7%
Real Estate Services Gross Profit
売上総利益率Gross Profit Margin
合 計Total
売 上 高Net Sales売上総利益Gross Profit
Copyright 2012 6
0%2010/6 2011/6 2012/619.5% 16.8% 19.8% 3.0% ―
※ 左上の比率は構成比 The rates on the upper-left corners are percentages of total.
売上総利益率Gross Profit Margin

連結連結 (参考)業績の実績と予想(参考)業績の実績と予想(Ref.) Operating Results and Estimates : Consolidated(Ref.) Operating Results and Estimates : Consolidated
百万円 millions of yen
Estimates Increase orDecrease YoY (%) Estimates Increase or
Decrease YoY (%) Estimates Increase orDecrease YoY (%)
% of sales % of sales % of sales % of sales % of sales % of sales
16 771 17 400 628 3 7% 17 640 19 600 1 959 11 1% 34 412 37 000 2 587 7 5%
上期 1st-Half 下期 2nd-Half 通期 Full-Year
2011/92012/9E
2012/32013/3E
2012/32013/3E
売上高Net Sales 16,771 17,400 628 3.7% 17,640 19,600 1,959 11.1% 34,412 37,000 2,587 7.5%
16.6% 18.1% 19.0% 20.7% 17.8% 19.5%2,781 3,150 368 13.2% 3,344 4,050 705 21.1% 6,125 7,200 1,074 17.5%
8.5% 9.5% 7.5% 7.9% 8.0% 8.6%1,424 1,650 225 15.9% 1,315 1,550 234 17.9% 2,739 3,200 460 16.8%
8.1% 8.6% 11.5% 12.8% 9.8% 10.8%
Net Sales
売上総利益Gross Profit
販売費及び一般管理費SG & A Expenses
営業利益
1,357 1,500 142 10.5% 2,028 2,500 471 23.2% 3,386 4,000 613 18.1%9.3% 9.2% 11.9% 12.8% 10.7% 11.1%
1,566 1,600 33 2.1% 2,101 2,500 398 19.0% 3,668 4,100 431 11.8%0.1% 0.0% 0.5% 0.0% 0.3% 0.0%
10 0 10 100.0% 92 0 92 100.0% 102 0 102 100.0%1 0% 0 0% 1 1% 2 3% 1 0% 1 2%
営業利Operating Income
経常利益Ordinary Income
特別利益Extraordinary Gains
1.0% 0.0% 1.1% 2.3% 1.0% 1.2%165 0 165 100.0% 185 450 264 142.5% 351 450 98 28.1%
8.4% 9.2% 11.4% 10.5% 9.9% 9.9%1,411 1,600 188 13.4% 2,007 2,050 42 2.1% 3,419 3,650 230 6.8%
4.2% 5.2% 6.6% 6.1% 5.4% 5.7%708 900 191 27 1% 1 159 1 200 40 3 5% 1 867 2 100 232 12 5%
特別損失Extraordinary Losses
税金等調整前当期純利益Income before Income Taxes
当期純利益Net Income 708 900 191 27.1% 1,159 1,200 40 3.5% 1,867 2,100 232 12.5%
30,000
45,000
売上高
Net Sales
20%
30%
10,000
15,000
売上総利益
Gross Profit
10%
15%
10,000
15,000
営業利益
Operating Income
10%
15%
10,000
15,000
経常利益Ordinary Income
10%
15%
10,000
15,000
当期純利益
Net Income
0
15,000
2012/3 2013/3E0%
10%
0
5,000
2012/3 2013/3E0%
5%
0
5,000
2012/3 2013/3E0%
5%
0
5,000
2012/3 2013/3E0%
5%
0
5,000
2012/3 2013/3E
Copyright 2012 7
■ 上期 1st-half ■ 下期 2nd-half ■ ■ 利益率 Profit margin
2012/3 2013/3E 2012/3 2013/3E

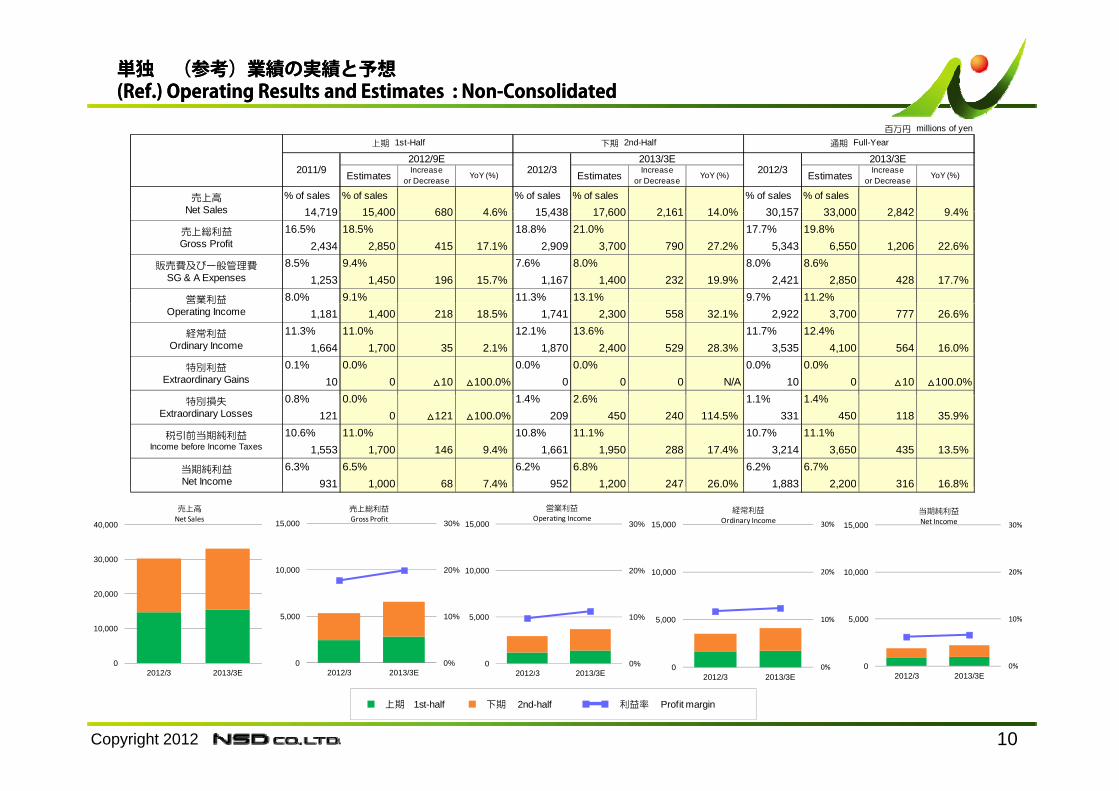
単独単独 業績の概要業績の概要 第第11四半期(四半期(44~~66月)月)Operating Results for the ThreeOperating Results for the Three--month Period (Apr.month Period (Apr.--Jun.) : NonJun.) : Non--ConsolidatedConsolidated
百万円 millions of yen
Results Increase orDecrease
YoY (%)
% of sales % of sales % of sales
2012/62011/62010/6
6,000
9,000
売上高
Net Sales
% of sales % of sales % of sales
7,328 7,294 7,515 220 3.0%80.2% 83.3% 80.3%
5,879 6,074 6,033 41 0.7%19 8% 16 7% 19 7%
売上高Net Sales
売上原価Cost of Sales
0
3,000
2010/6 2011/6 2012/619.8% 16.7% 19.7%
1,448 1,220 1,482 261 21.5%9.0% 8.7% 8.4%
657 635 628 6 1.1%
売上総利益Gross Profit
販売費及び
一般管理費SG & A Expenses
/ / /
20%
30%
2,000
3,000
売上総利益
Gross Profit
売上総利益率Gross Profit Margin
20%
30%
2,000
3,000
営業利益
Operating Income
10.8% 8.0% 11.4%
790 584 853 268 46.0%13.3% 13.8% 16.0%
972 1,006 1,205 199 19.8%
営業利益Operating Income
経常利益Ordinary Income 0%
10%
0
1,000
2010/6 2011/6 2012/60%
10%
0
1,000
2010/6 2011/6 2012/6
営業利益率Operating Income
Margin
972 1,006 1,205 199 19.8%0.2% 0.0% 0.0%
17 0 0 0 N/A0.1% 0.0% 0.1%
10 3 4 1 36 5%特別損失
Extraordinary Losses
特別利益Extraordinary Gains
20%
30%
2,000
3,000
四半期純利益
Quarterly Net Income
/ / / 2010/6 2011/6 2012/6
20%
30%
2 000
3,000
経常利益
Ordinary Income
経常利益率O di I M i10 3 4 1 36.5%
13.4% 13.7% 16.0%
980 1,002 1,200 198 19.7%7.8% 8.2% 9.9%
四半期純利益Quarterly Net Income
税引前四半期純利益Quarterly Income
before Tax
0%
10%
20%
0
1,000
2,000
四半期純利益率Quarterly net Income
Margin
0%
10%
20%
0
1,000
2,000 Ordinary Income Margin
Copyright 2012 8
573 597 746 149 25.0%Quarterly Net Income 0%0
2010/6 2011/6 2012/60%0
2010/6 2011/6 2012/6

単独単独 セグメント別売上高と売上総利益セグメント別売上高と売上総利益 第第11四半期(四半期(44~~66月)月)Net Sales and Gross Profit by Division for the ThreeNet Sales and Gross Profit by Division for the Three--month Period (Apr.month Period (Apr.--Jun.) : NonJun.) : Non--ConsolidatedConsolidated
f百万円 millions of yen
ResultsIncrease orDecrease YoY (%)
87.8% 90.4% 91.9%
6,437 6,595 6,905 309 4.7%
2010/6
売 上 高Net Sales
2011/62012/6
6 43 6 5956,905459 465392431 233 217
6 000
9,000売上高 Net Sales
6,437 6,595 6,905 309 4.7%
1,224 1,031 1,329 297 28.9%
19.0% 15.6% 19.3% 3.6% -
ソフトウエア開 発
SoftwareDevelopment
Net Sales
売上総利益Gross Profit
売上総利益率Gross Profit Margin
6,437 6,595
3,000
6,000
6.3% 6.4% 5.2%
459 465 392 73 15.7%
117 104 71 33 31.6%
コンピュータ室運営管理Facilities
Management
売 上 高Net Sales
売上総利益Gross Profit
ソフトウエア開発 Software Development■
02010/6 2011/6 2012/6
25.6% 22.5% 18.3% 4.2% -
5.9% 3.2% 2.9%
431 233 217 16 7.0%ソフトウエア
売 上 高Net Sales
Management売上総利益率
Gross Profit Margin
ソフトウエア開発 Software Development
コンピュータ室運営管理 Facilities Management
ソフトウエアプロダクト Software Products
■
■
■
40%売上総利益率 Gross Profit Margin
106 83 81 2 3.3%
24.7% 35.9% 37.4% 1.4% -
100 0% 100 0% 100 0%
売上総利益率Gross Profit Margin
売 上 高
ソフトウエアプロダクトSoftwareProducts
売上総利益Gross Profit
30%
40%売 総利益率 g
100.0% 100.0% 100.0%
7,328 7,294 7,515 220 3.0%
1,448 1,220 1,482 261 21.5%
売 上 高Net Sales
売上総利益Gross Profit
売上総利益率
合 計Total
20%
Copyright 2012 9
19.8% 16.7% 19.7% 3.0% -
※ 左上の比率は構成比 The rates on the upper-left corners are percentages of total.
売上総利益率Gross Profit Margin
10%2010/6 2011/6 2012/6
単独単独 (参考)業績の実績と予想(参考)業績の実績と予想(Ref.) Operating Results and Estimates : Non(Ref.) Operating Results and Estimates : Non--ConsolidatedConsolidated
百万円 millions of yen
Estimates Increaseor Decrease
YoY (%) Estimates Increaseor Decrease
YoY (%) Estimates Increaseor Decrease
YoY (%)
% of sales % of sales % of sales % of sales % of sales % of sales14 719 15 400 680 4 6% 15 438 17 600 2 161 14 0% 30 157 33 000 2 842 9 4%
上期 1st-Half 下期 2nd-Half 通期 Full-Year
2011/92012/9E
2012/32013/3E
2012/32013/3E
売上高Net Sales 14,719 15,400 680 4.6% 15,438 17,600 2,161 14.0% 30,157 33,000 2,842 9.4%
16.5% 18.5% 18.8% 21.0% 17.7% 19.8%2,434 2,850 415 17.1% 2,909 3,700 790 27.2% 5,343 6,550 1,206 22.6%
8.5% 9.4% 7.6% 8.0% 8.0% 8.6%1,253 1,450 196 15.7% 1,167 1,400 232 19.9% 2,421 2,850 428 17.7%
8.0% 9.1% 11.3% 13.1% 9.7% 11.2%
Net Sales
売上総利益Gross Profit
販売費及び一般管理費SG & A Expenses
営業利益
1,181 1,400 218 18.5% 1,741 2,300 558 32.1% 2,922 3,700 777 26.6%11.3% 11.0% 12.1% 13.6% 11.7% 12.4%
1,664 1,700 35 2.1% 1,870 2,400 529 28.3% 3,535 4,100 564 16.0%0.1% 0.0% 0.0% 0.0% 0.0% 0.0%
10 0 10 100.0% 0 0 0 N/A 10 0 10 100.0%0 8% 0 0% 1 4% 2 6% 1 1% 1 4%
営業利益Operating Income
経常利益Ordinary Income
特別利益Extraordinary Gains
0.8% 0.0% 1.4% 2.6% 1.1% 1.4%121 0 121 100.0% 209 450 240 114.5% 331 450 118 35.9%
10.6% 11.0% 10.8% 11.1% 10.7% 11.1%1,553 1,700 146 9.4% 1,661 1,950 288 17.4% 3,214 3,650 435 13.5%
6.3% 6.5% 6.2% 6.8% 6.2% 6.7%931 1,000 68 7.4% 952 1,200 247 26.0% 1,883 2,200 316 16.8%
特別損失Extraordinary Losses
税引前当期純利益Income before Income Taxes
当期純利益Net Income 931 1,000 68 7.4% 952 1,200 247 26.0% 1,883 2,200 316 16.8%
20%
30%
10,000
15,000
売上総利益
Gross Profit
20%
30%
10,000
15,000
営業利益
Operating Income
30,000
40,000
売上高
Net Sales
20%
30%
10,000
15,000
経常利益Ordinary Income
20%
30%
10,000
15,000
当期純利益
Net Income
0%
10%
0
5,000
2012/3 2013/3E0%
10%
0
5,000
2012/3 2013/3E0
10,000
20,000
2012/3 2013/3E0%
10%
0
5,000
0%
10%
0
5,000
Copyright 2012 10
■ 上期 1st-half ■ 下期 2nd-half ■ ■ 利益率 Profit margin
2012/3 2013/3E 2012/3 2013/3E2012/3 2013/3E 2012/3 2013/3E 2012/3 2013/3E

単独単独 業種別売上高(ソフトウエア開発・コンピュータ室運営管理)業種別売上高(ソフトウエア開発・コンピュータ室運営管理) 第第11四半期(四半期(44~~66月)月)Net Sales by User Industry (SoftwareNet Sales by User Industry (Software DevelopmentDevelopment and Facilities Management) and Facilities Management) for the Threefor the Three--month Period (Apr.month Period (Apr.--Jun.) : NonJun.) : Non--ConsolidatedConsolidated
百万円 millions of yen
Results % of Total Results % of Total Results % of Total Increase or Decrease YoY (%)
金 融 業Finance 2,262 32.8% 2,581 36.6% 2,283 31.3% 297 11.5%
サ ー ビ ス 業
2012/62011/62010/6
サ ー ビ ス 業Services 2,323 33.7% 2,086 29.5% 2,387 32.7% 300 14.4%
製 造 業Manufacturing 1,506 21.8% 1,602 22.7% 1,531 21.0% 70 4.4%
商 業Commercial 291 4.2% 346 4.9% 493 6.8% 147 42.6%
運 輸 業T t ti 177 2 6% 138 2 0% 230 3 1% 92 66 8%Transportation 177 2.6% 138 2.0% 230 3.1% 92 66.8%
通 信 業Telecommunication 111 1.6% 115 1.6% 166 2.3% 50 43.6%
建 設 業Construction 133 1.9% 115 1.6% 100 1.4% 14 12.8%
電 力 ・ ガ スElectricity & Gas 18 0.3% 33 0.5% 50 0.7% 16 49.8%公 共 団 体
Public 65 1.0% 39 0.6% 36 0.5% 2 6.9%そ の 他
Others 5 0.1% 2 0.0% 17 0.2% 14 590.3%合 計
Total 6,897 100.0% 7,061 100.0% 7,297 100.0% 236 3.4%
金融業Finance
製造業
商業
Commercial4.9%
■ 金融業 Finance
■ サービス業 Services
■ 製造業 Manufacturing
■ 商業 C i l
金融業
Finance 31.3%
商業
Commercial6.8%
36.6%
サービス業
製造業
Manufacturing 22.7% 2011/6
■ 商業 Commercial
■ 運輸業 Transportation
■ 通信業 Telecommunication
■ 建設業 Construction
■ 電力・ガス Electricity & Gas
■ 公共団体 Public
■ その他 Others サービス業
製造業
Manufacturing 21.0%
2012/6
Copyright 2012 11
サ ビス業
Services29.5%
■ その他 Others サ ビス業
Services32.7%

単独単独 金融業業態別売上高(ソフトウエア開発・コンピュータ室運営管理)金融業業態別売上高(ソフトウエア開発・コンピュータ室運営管理)第第11四半期(四半期(44~~66月)月)Sales Breakdown by Financial Business CategorySales Breakdown by Financial Business Category((Software Development and Facilities Software Development and Facilities ManagementManagement)) for the Threefor the Three--month Period (Apr.month Period (Apr.--Jun.) : NonJun.) : Non--Consolidated Consolidated
百万円 millions of yen
Results % of Total Results % of Total Results % of Total Increase orDecrease YoY (%)
メ ガ バ ン ク
2012/62011/62010/6
メ ガ バ ン クLargest Banks 562 24.8% 610 23.7% 580 25.4% 30 4.9%
信 託 銀 行Trust Banks 215 9.5% 276 10.7% 421 18.5% 144 52.0%
地 銀 ・ 信 金 他Regional / Local / Other Banks 406 18 0% 642 24 9% 329 14 4% 312 48 7%Regional / Local / Other Banks 406 18.0% 642 24.9% 329 14.4% 312 48.7%
生 保 ・ 損 保Insurance Companies 698 30.9% 691 26.8% 705 30.9% 13 1.9%
証 券 会 社Securities Companies 98 4.4% 100 3.9% 34 1.5% 65 65.5%
ノ ン バ ン ク 他ノ ン バ ン ク 他Nonbanks and Others 280 12.4% 259 10.0% 212 9.3% 46 18.0%合 計
Total 2,262 100.0% 2,581 100.0% 2,283 100.0% 297 11.5%
メガバンク
Large / National Banks23.7%
生保 損保
ノンバンク他
Others10.0%
メガバンク
Large / National Banks25.4%
生保・損保
ノンバンク他
Others9.3%
■ メガバンク
Large / National Banks■ 信託銀行
Trust Banks■ 地銀・信金他
Regional / Local / OtherBanks信託銀行
Trust Banks10.7%
地銀・信金他
Regional / Local /
生保・損保
Insurances Companies26.8%
2011/6
信託銀行
Trust Banks18.5%地銀・信金他
Regional / Local
生保 損保
Insurances Companies30.9%
2012/6Regional / Local / Other Banks
■ 生保・損保
Insurances Companies■ 証券会社
Securities Companies ■ ノンバンク他
Oth
Copyright 2012 12
g / /Other Banks
24.9%
g // Other Banks
14.4%
Others
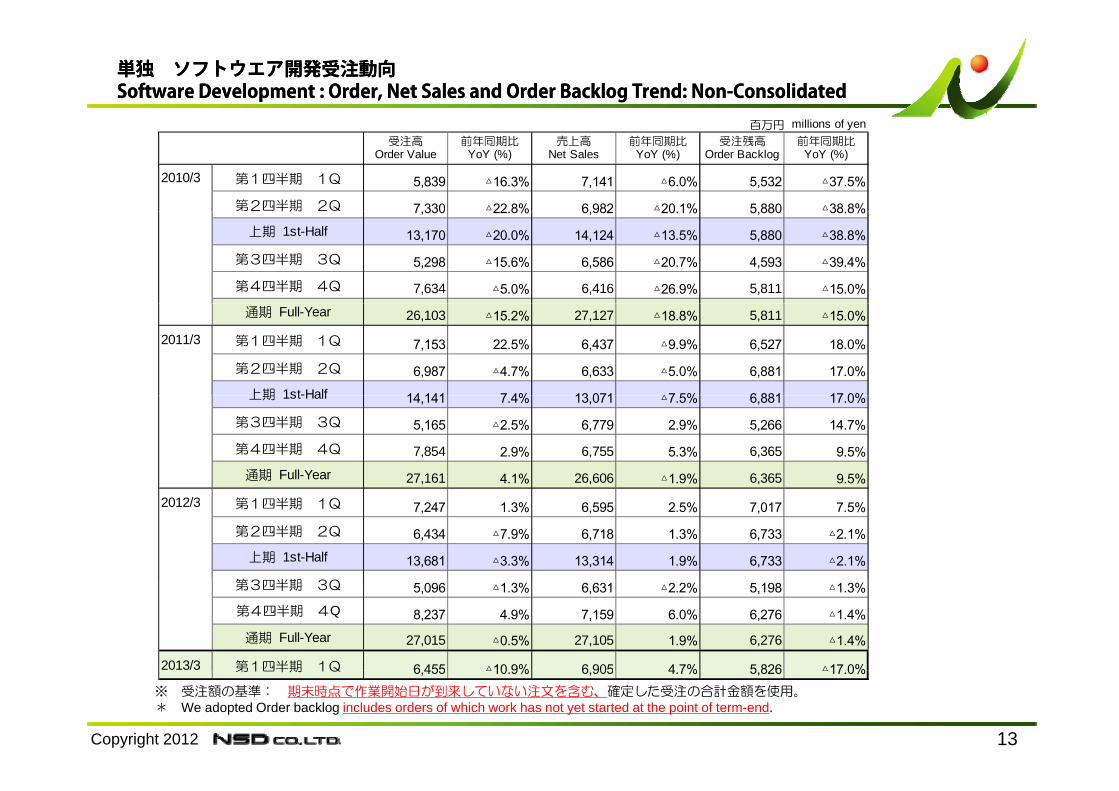
単独単独 ソフトウエア開発受注動向ソフトウエア開発受注動向Software Development : Order, Net Sales and Order Backlog Trend: NonSoftware Development : Order, Net Sales and Order Backlog Trend: Non--ConsolidatedConsolidated
illi f百万円 millions of yen受注高
Order Value前年同期比
YoY (%)売上高
Net Sales前年同期比
YoY (%)受注残高
Order Backlog前年同期比
YoY (%)
2010/3 第1四半期 1Q 5,839 △16.3% 7,141 △6.0% 5,532 △37.5%
第2四半期 2Q 7 330 △22 8% 6 982 △20 1% 5 880 △38 8%期 7,330 22.8% 6,982 20.1% 5,880 38.8%上期 1st-Half 13,170 △20.0% 14,124 △13.5% 5,880 △38.8%
第3四半期 3Q 5,298 △15.6% 6,586 △20.7% 4,593 △39.4%
第4四半期 4Q 7,634 △5.0% 6,416 △26.9% 5,811 △15.0%通期 Full-Year 26,103 △15.2% 27,127 △18.8% 5,811 △15.0%
2011/3 第1四半期 1Q 7,153 22.5% 6,437 △9.9% 6,527 18.0%
第2四半期 2Q 6,987 △4.7% 6,633 △5.0% 6,881 17.0%上期 1st-Half 14 141 7 4% 13 071 △7 5% 6 881 17 0%上期 1st-Half 14,141 7.4% 13,071 △7.5% 6,881 17.0%
第3四半期 3Q 5,165 △2.5% 6,779 2.9% 5,266 14.7%
第4四半期 4Q 7,854 2.9% 6,755 5.3% 6,365 9.5%通期 Full-Year 27,161 4.1% 26,606 △1.9% 6,365 9.5%
2012/3 第1四半期 1Q 7,247 1.3% 6,595 2.5% 7,017 7.5%
第2四半期 2Q 6,434 △7.9% 6,718 1.3% 6,733 △2.1%上期 1st-Half 13,681 △3.3% 13,314 1.9% 6,733 △2.1%
第 半期第3四半期 3Q 5,096 △1.3% 6,631 △2.2% 5,198 △1.3%第4四半期 4Q 8,237 4.9% 7,159 6.0% 6,276 △1.4%
通期 Full-Year 27,015 △0.5% 27,105 1.9% 6,276 △1.4%
2013/3 第1四半期 1Q 6 455 △10 9% 6 905 4 7% 5 826 △17 0%
Copyright 2012 13
※ 受注額の基準: 期末時点で作業開始日が到来していない注文を含む、確定した受注の合計金額を使用。* We adopted Order backlog includes orders of which work has not yet started at the point of term-end.
第1四半期 1Q 6,455 △10.9% 6,905 4.7% 5,826 △17.0%
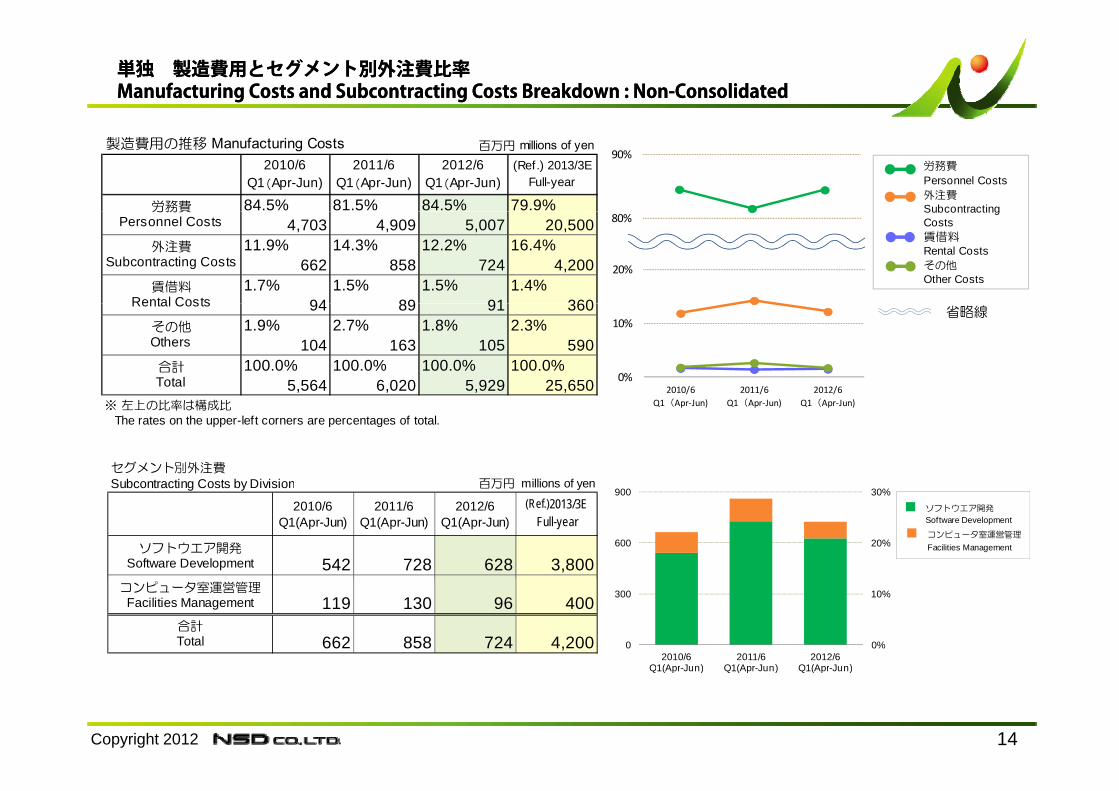
単独単独 製造費用とセグメント別外注費比率製造費用とセグメント別外注費比率Manufacturing Costs and Subcontracting Costs Breakdown : NonManufacturing Costs and Subcontracting Costs Breakdown : Non--ConsolidatedConsolidated
90%労務費
Personnel Costs外注費Subcontracting
製造費用の推移 Manufacturing Costs 百万円 millions of yen2010/6
Q1(Apr-Jun)2011/6
Q1(Apr-Jun)2012/6
Q1(Apr-Jun)(Ref.) 2013/3E
Full-year
84.5% 81.5% 84.5% 79.9%労務費
20%
80%Subcontracting Costs賃借料Rental Costsその他Other Costs
4,703 4,909 5,007 20,50011.9% 14.3% 12.2% 16.4%
662 858 724 4,2001.7% 1.5% 1.5% 1.4%
94 89 91 360
労務費Personnel Costs
外注費Subcontracting Costs
賃借料Rental Costs
0%
10%
2010/6 2011/6 2012/6
省略線94 89 91 3601.9% 2.7% 1.8% 2.3%
104 163 105 590100.0% 100.0% 100.0% 100.0%
5,564 6,020 5,929 25,650
Rental Costs
その他Others
合計Total
Q1(Apr‐Jun) Q1(Apr‐Jun) Q1(Apr‐Jun)※ 左上の比率は構成比 The rates on the upper-left corners are percentages of total.
セグメント別外注費Subcontracting Costs by Division 百万円 millions of yenSubcontracting Costs by Division 百万円 millions of yen
2010/6Q1(Apr-Jun)
2011/6Q1(Apr-Jun)
2012/6Q1(Apr-Jun)
(Ref.)2013/3EFull-year
ソフトウエア開発Software Development 542 728 628 3,800
20%
30%
600
900■ ソフトウエア開発
Software Development
■ コンピュータ室運営管理
Facilities Management
コンピュータ室運営管理Facilities Management 119 130 96 400
合計Total 662 858 724 4,200 0%
10%
0
300
2010/6Q1(Apr-Jun)
2011/6Q1(Apr-Jun)
2012/6Q1(Apr-Jun)
Copyright 2012 14
Q1(Apr Jun) Q1(Apr Jun) Q1(Apr Jun)

会社概要会社概要CorporateCorporate ProfileProfile
[ 2012年6月30日現在 ] [ As of June 30, 2012 ]
株式会社 N S D Name of Company : NSD CO., LTD.1969年4月8日 Foundation : April 8, 1969
会社名
設 立
7,205,864,914 円 Capital : 7,205,864,914 yen
200,000,000株 Number of Shares : Authorized : 200,000,000
48,172,160株 Outstanding : 48,172,160
自己株式の総数* 6,214,701株 Treasury stocks*: 6,214,701
*従業員持株ESOP信託口株数 543,000株を含む * Including shares of ESOP(Employee stock ownership program) trust account 543,000
発行済株式の総数
資本金
株式数 発行可能株式総数
従業員持株 信託 株数 , 株 含
上場証券取引所 東京証券取引所 市場第一部 Stock Listing : Tokyo Stock Exchange, 1st Section
[ 2012年3月31日現在 ] [ As of March 31, 2012 ]
大株主 IPC株式会社 Major Shareholders : IPC Co., Ltd.(*自己株式除く) 野村信託銀行株式会社(信託口) The Nomura Trust and Banking Co., Ltd. (Trust Account)* Treasury stocks信 銀 社(信 )
日本トラスティ・サービス信託㈱(信託口) Japan Trustee Services Bank, Ltd.(Trust Account)
有限会社KDアソシエイツ KD Associates, Ltd.
タイヨーパールファンドエルピー Taiyo Pearl Fund, L.P.
株主数 11,181名 (前期末 9,377名) Number of Shareholders : 11,181 (As of March 31, 2011 9,377)
are excluded
免責事項Disclaimer
従業員数 連結 3,867 名 (前期末 3,734名) Number of Employees : Consolidated 3,867 (As of March 31, 2011 3,734)
単独 3,016 名 (前期末 2,873名) Non-Consolidated 3,016 (As of March 31, 2011 2,873)
免責事項
本資料は、当社及び当グループ会社の業績・事業戦略に関する情報の提供を目的としたものであり、当社及び
当グループ会社の株式の購入や売却を勧誘するものではありません。本レポートの内容には、将来の業績に関す
る意見や予測等の情報を掲載することがありますが、これらの情報は、現時点の当社の判断に基づいて作成され
ております。よって、その実現・達成を約束するものではなく、また今後、予告なしに変更されることがありま
す。本レポート利用の結果生じたいかなる損害についても、当社は一切責任を負いません。また、本レポートの
無断での複製、転送等を行わないようにお願い致します。
This report is intended to provide information about the business performance and strategy of NSD CO., LTD.
(NSD) and the NSD Group. It is not intended and should not be construed as an inducement to purchase or sell
stock in NSD or NSD Group companies. Statements in this presentation that are not historical facts are
forward-looking statements, based on the current beliefs, estimates and expectations of management. As these
beliefs, estimates and expectations are subject to a number of risks, uncertainties, and assumptions, actual
results may be materially different. NSD undertakes no obligation to update any forward-looking statements, and
Copyright 2012 15
無断での複製、転送等を行わないようにお願い致します。
results may be materially different. NSD undertakes no obligation to update any forward looking statements, and
shall in no event be liable for any damages arising out of the use or interpretation of this material. Please refrain
from copying, disseminating or distributing this material without the prior consent of NSD.


![1014x09 説明会FINAL FINAL web [互換モード] › pdf › ir › setsumeikai › J091014ir.pdf第24期の業績ダイジェスト(前期比較) 3,802 4000 4,500 FY23期 FY24期](https://static.fdocuments.ec/doc/165x107/5f03b8d17e708231d40a72a5/1014x09-efinal-final-web-fff-a-pdf-a-ir-a-setsumeikai.jpg)