Tablas de rendimiento 2º Trimestre 2012-2013
7
Rendimiento escolar Área/Grupo 2º Trimestre Curso 2012-2013 (porcentajes) Grupo/Alum. Conocimiento de sí mismo y autonomía personal Conocimiento del Entorno Religión Lenguajes:comunicación y representación. Lenguajes: comunicación y representación ( Inglés) POS NEG POS NEG POS NEG POS NEG POS NEG Infantil ( 3 años) ( 22 )↑ 95,5 4,5 95,5 4,5 95 5 95,5 4,5 95,2 4,8 Infantil ( 4 años ) ( 22 )↑ 90,9 9,1 86,4 13,6 100 0 86,4 13,6 90,9 9,1 Infantil ( 5 años ) ( 17 )↓ 88,2 11,8 88,2 11,8 100 0 94,1 5,9 100 0 Porcentajes de Aprobados por Áreas Conocimiento de sí mismo y autonomía personal Conocimiento del Entorno Religión Lenguajes:comunicación y representación. Lenguajes: comunicación y representación ( Inglés) Evaluados ↑ 61 61 52 61 61 Aprobados ↑ 56 55 51 56 57 % 91,80 % 90,16 % 98 % 91,80 % 93,44 %
-
Upload
ceip-teobaldopower -
Category
Documents
-
view
214 -
download
1
description
Tablas de rendimiento 2º Trimestre 2012-2013
Transcript of Tablas de rendimiento 2º Trimestre 2012-2013

Rendimiento escolar Área/Grupo 2º Trimestre Curso 2012-2013
(porcentajes)
Grupo/Alum.
Conocimiento de sí
mismo y autonomía
personal
Conocimiento del
Entorno Religión
Lenguajes:comunicación y
representación.
Lenguajes: comunicación y
representación ( Inglés)
POS NEG POS NEG POS NEG POS NEG POS NEG
Infantil
( 3 años)
( 22 )↑
95,5 4,5 95,5 4,5 95 5 95,5 4,5 95,2 4,8
Infantil
( 4 años )
( 22 )↑
90,9 9,1 86,4 13,6 100 0 86,4 13,6 90,9 9,1
Infantil
( 5 años )
( 17 )↓
88,2 11,8 88,2 11,8 100 0 94,1 5,9 100 0
Porcentajes de Aprobados por Áreas
Conocimiento de sí
mismo y autonomía
personal
Conocimiento del
Entorno Religión
Lenguajes:comunicación y
representación. Lenguajes: comunicación y
representación ( Inglés)
Evaluados
↑ 61 61 52 61 61
Aprobados
↑ 56 55 51 56 57
%
91,80 % 90,16 % 98 % 91,80 % 93,44 %

PORCENTAJE DE APROBADOS POR CURSO Infantil 3 años Infantil 4 años Infantil 5 años
Aprobados 21 19 13
De 22 22 17
% 95,5% 86,4 % 76,5 %
PORCENTAJE DE ALUMNADO QUE APROBÓ TODO EL TRIMESTRE Infantil 3 años Infantil 4 años Infantil 5 años TOTALES
V M V M V M V M
Ev. 11 11 11 11 13 4 35 26
Apr. 10 11 9 10 10 3 29 24
% 45,5% 50% 40,9% 45,5% 58,8 % 17,6 % 82,85 % 92,30 %
PORCENTAJE DE ALUMNADO QUE APROBÓ TODO EL TRIMESTRE Infantil 3 años Infantil 4 años Infantil 5 años TOTALES
T V M T V M T V M T V M
Ev. 22 11 11 22 11 11 17 13 4 61 35 26
Apr. 21 10 11 19 9 9 13 10 3 53 29 24
% 95,5% 45,5% 50% 86,4% 40,8% 45,5% 76,5 % 58,8 % 17,6 % 86,88 % 82,85 % 92,30 %

PRIMER
TRIMESTRE
SEGUNDO
TRIMESTRE
PRIMER
TRIMESTRE
SEGUNDO
TRIMESTRE
PRIMER
TRIMESTRE
SEGUNDO
TRIMESTRE
Alumnos
con:
Infantil 3
años
Infantil 3
años
Infantil 4
años
Infantil 4
años
Infantil 5
años
Infantil 5
años
Nº de
alumnos por
grupo.
21 22 21 22 18 17
Nº
alum
% Nº
alum
% Nº
alum
% Nº
alum
% Nº
alum
% Nº
alum
%
0 suspensos 21 100 21 95,5 18 85,7 19 86,4 12 66,7 13 76,5
1 suspenso 0 0 0 0 0 0 0 0 4 22,2 3 17,6
2 suspensos 0 0 0 0 0 0 1 4,5 2 11,1 1 5,9
3 suspensos 0 0 0 0 0 0 0 0 0 0 0 0
Más de 3
suspensos
0 0 1 4,5 3 14,3 2 9,1 0 0 0 0
Rendimiento escolar Área/Grupo 2º Trimestre Curso 2012-2013
(porcentajes)
Grupo/Alum. Ed. Artística Ed. Física Religión Lengua Inglés C. del
Medio Matemáticas Francés
Ciudadanía PGE
POS NEG POS NEG POS NEG POS NEG POS NEG POS NE
G POS NEG POS NEG
POS NEG POS NEG
1º (20)↓ 100 0 100 0 100 0 80 20 100 0 95 5 85 15
2º (24)↑ 100 0 100 0 100 0 83,3 16,7 95,8 4,2 95,8 4,2 83,3 16,7
3º (17)↓ 94,1 5,9 100 0 100 0 70,6 29,4 100 0 88,2 11,8 64,7 35,3
4º (27)↓ 92,6 7,4 100 0 100 0 74,1 25,9 85,2 14,8 77,8 22,2 77,8 22,2
5º (24)↑ 91,7 8,3 100 0 100 0 87,5 12,5 91,7 8,3 66,7 33,3 91,7 8,3 100 0 100 0
6ºA ( 15)↓ 86,7 13,3 100 0 100 0 93,3 6,7 80 20 93,3 6,7 86,7 13,3 100 0 100 0 100 0
6º B (16 ) 81,3 18,8 100 0 100 0 56,3 43,8 81,3 18,8 100 0 68,8 31,3 100 0 100 0 75 25
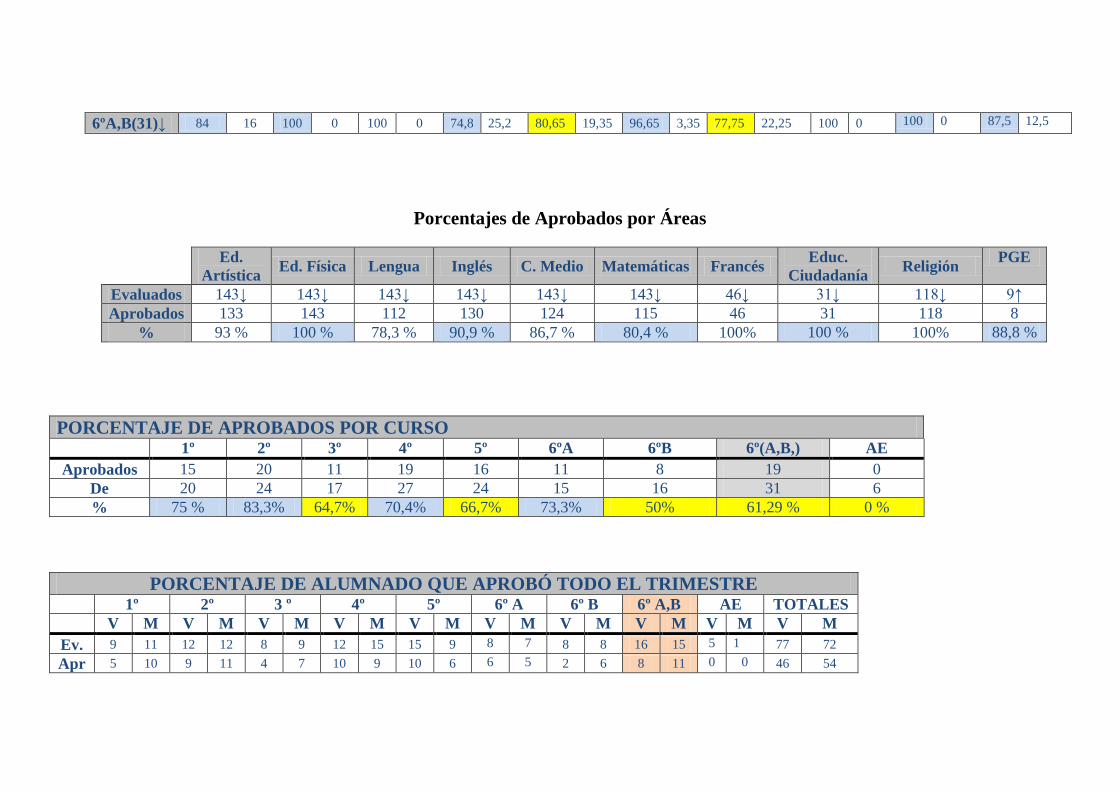
6ºA,B(31)↓ 84 16 100 0 100 0 74,8 25,2 80,65 19,35 96,65 3,35 77,75 22,25 100 0 100 0 87,5 12,5
Porcentajes de Aprobados por Áreas
Ed.
Artística Ed. Física Lengua Inglés C. Medio Matemáticas Francés
Educ.
Ciudadanía Religión
PGE
Evaluados 143↓ 143↓ 143↓ 143↓ 143↓ 143↓ 46↓ 31↓ 118↓ 9↑
Aprobados 133 143 112 130 124 115 46 31 118 8
% 93 % 100 % 78,3 % 90,9 % 86,7 % 80,4 % 100% 100 % 100% 88,8 %
PORCENTAJE DE APROBADOS POR CURSO
1º 2º 3º 4º 5º 6ºA 6ºB 6º(A,B,) AE
Aprobados 15 20 11 19 16 11 8 19 0
De 20 24 17 27 24 15 16 31 6
% 75 % 83,3% 64,7% 70,4% 66,7% 73,3% 50% 61,29 % 0 %
PORCENTAJE DE ALUMNADO QUE APROBÓ TODO EL TRIMESTRE 1º 2º 3 º 4º 5º 6º A 6º B 6º A,B AE TOTALES
V M V M V M V M V M V M V M V M V M V M
Ev. 9 11 12 12 8 9 12 15 15 9 8 7 8 8 16 15 5 1 77 72
Apr 5 10 9 11 4 7 10 9 10 6 6 5 2 6 8 11 0 0 46 54

% 55,5 90,9 75 91,6 50 77,7 83,3 60 66,6 66,6 75 71,4
25 75 50 73,3 0 0
59,7 75
PORCENTAJE DE ALUMNADO QUE APROBÓ TODO EL TRIMESTRE 1º 2º 3º 4º 5º 6ºA 6º B 6º A,B AE
T V M T V M T V M T V M T V M T V M T V M T V M T V M
Ev. 15 9 11 20 12 12 11 8 9 19 12 15 16 15 9 11 8 7 8 8 8 19 16 15 0 5 1
Apr. 20 5 10 24 9 11 17 4 7 27 10 9 24 10 6 15 6 5 16 2 6 31 8 11 6 0 0
% 75 55,5 90,9 83,3 75 91,6 64,7 50 77,7 70,4 83,3 60 66,7 66,6 66,6 73,3 75 71,4 50 25 75 61,29 50 73,3 0 0 0
% DE ALUMNADO QUE
APROBÓ TODO EL
TRIMESTRE
TOTALES
T V M
Ev. 149 77 72
Apr. 100 46 54
% 67,11 59,7 75
Ha mejorado. Ha empeorado. Sigue igual.
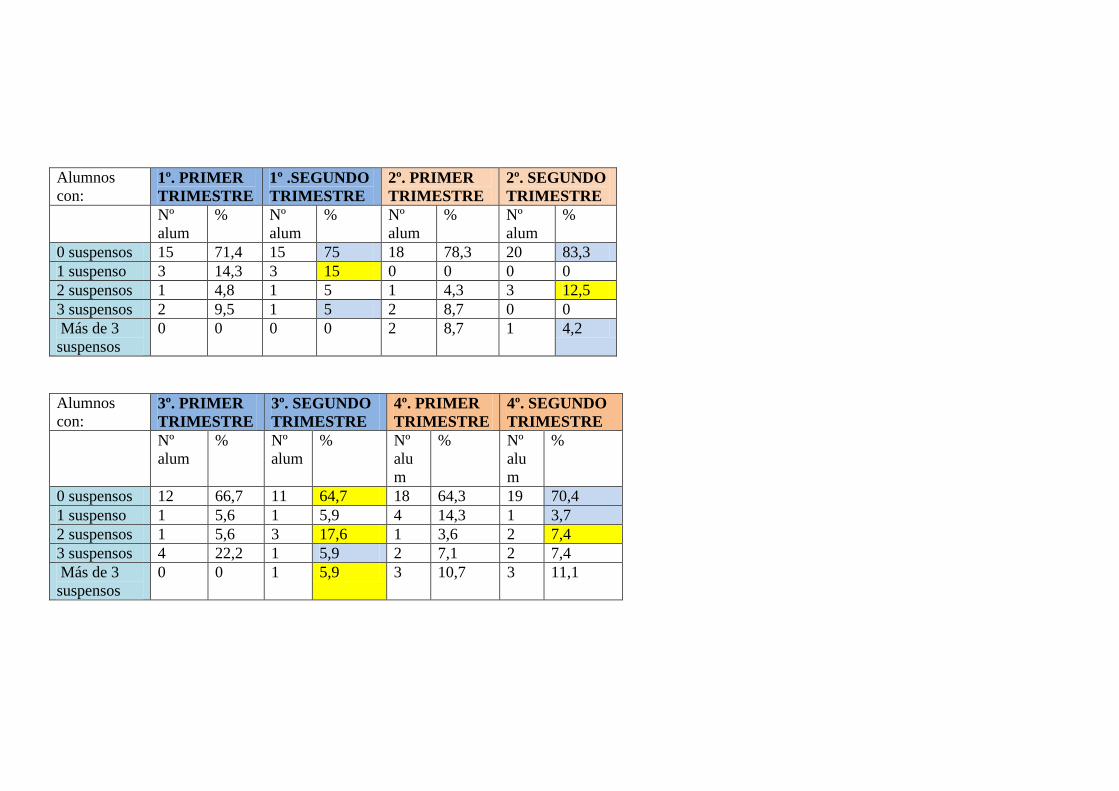
Alumnos
con: 1º. PRIMER
TRIMESTRE
1º .SEGUNDO
TRIMESTRE
2º. PRIMER
TRIMESTRE
2º. SEGUNDO
TRIMESTRE
Nº
alum
% Nº
alum
% Nº
alum
% Nº
alum
%
0 suspensos 15 71,4 15 75 18 78,3 20 83,3
1 suspenso 3 14,3 3 15 0 0 0 0
2 suspensos 1 4,8 1 5 1 4,3 3 12,5
3 suspensos 2 9,5 1 5 2 8,7 0 0
Más de 3
suspensos
0 0 0 0 2 8,7 1 4,2
Alumnos
con: 3º. PRIMER
TRIMESTRE
3º. SEGUNDO
TRIMESTRE
4º. PRIMER
TRIMESTRE
4º. SEGUNDO
TRIMESTRE
Nº
alum
% Nº
alum
% Nº
alu
m
% Nº
alu
m
%
0 suspensos 12 66,7 11 64,7 18 64,3 19 70,4
1 suspenso 1 5,6 1 5,9 4 14,3 1 3,7
2 suspensos 1 5,6 3 17,6 1 3,6 2 7,4
3 suspensos 4 22,2 1 5,9 2 7,1 2 7,4
Más de 3
suspensos
0 0 1 5,9 3 10,7 3 11,1
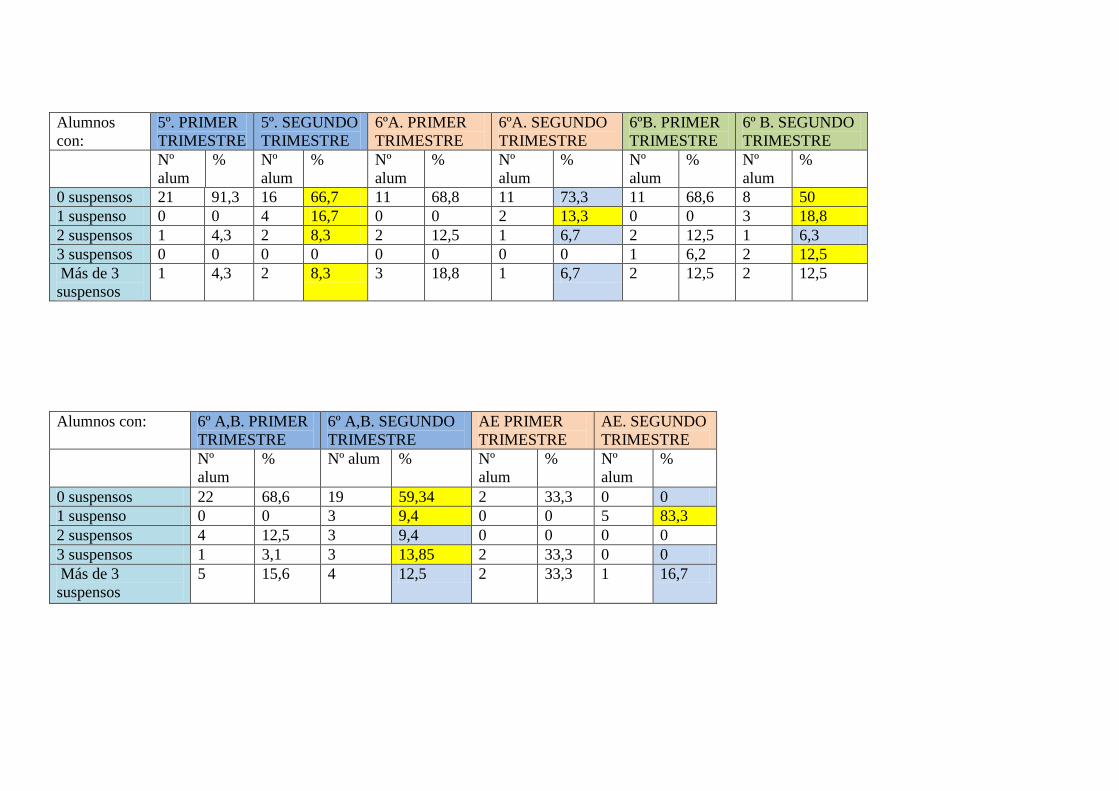
Alumnos
con:
5º. PRIMER
TRIMESTRE
5º. SEGUNDO
TRIMESTRE
6ºA. PRIMER
TRIMESTRE
6ºA. SEGUNDO
TRIMESTRE
6ºB. PRIMER
TRIMESTRE
6º B. SEGUNDO
TRIMESTRE
Nº
alum
% Nº
alum
% Nº
alum
% Nº
alum
% Nº
alum
% Nº
alum
%
0 suspensos 21 91,3 16 66,7 11 68,8 11 73,3 11 68,6 8 50
1 suspenso 0 0 4 16,7 0 0 2 13,3 0 0 3 18,8
2 suspensos 1 4,3 2 8,3 2 12,5 1 6,7 2 12,5 1 6,3
3 suspensos 0 0 0 0 0 0 0 0 1 6,2 2 12,5
Más de 3
suspensos
1 4,3 2 8,3 3 18,8 1 6,7 2 12,5 2 12,5
Alumnos con: 6º A,B. PRIMER
TRIMESTRE
6º A,B. SEGUNDO
TRIMESTRE
AE PRIMER
TRIMESTRE
AE. SEGUNDO
TRIMESTRE
Nº
alum
% Nº alum % Nº
alum
% Nº
alum
%
0 suspensos 22 68,6 19 59,34 2 33,3 0 0
1 suspenso 0 0 3 9,4 0 0 5 83,3
2 suspensos 4 12,5 3 9,4 0 0 0 0
3 suspensos 1 3,1 3 13,85 2 33,3 0 0
Más de 3
suspensos
5 15,6 4 12,5 2 33,3 1 16,7