Structural diagnosis of a concrete dam with cracking and ...
18
Structural diagnosis of a concrete dam with cracking and high non- recoverable displacements A. Campos a Ph.D, C. M. López b Ph.D, A. Blanco c* Ph.D and A. Aguado d Ph.D a Dept. of Structures, Universidade Estadual de Londrina, Londrina, Brazil ([email protected]) b Dept. of Geotechnical Engeneering and Geo-Sciences, Universitat Politècnica de Catalunya, Barcelona, Spain ([email protected]) c Dept. of Construction Engineering, Universitat Politècnica de Catalunya, Barcelona, Spain ([email protected]), * corresponding author d Dept. of Construction Engineering, Universitat Politècnica de Catalunya, Barcelona, Spain ([email protected]) Abstract: Expansions in concrete dams may be caused by chemical or physical sources; however in certain occasions the evidences observed in the dam may not be attributed to a single cause. Mequinenza is an example of a concrete dam affected by expansions and high non-recoverable displacements that cannot be explained by the most frequent pathologies. This paper presents new hypotheses that could justify such behavior by assuming the superposition of a global phenomenon of water induced expansion in concrete in the entire dam and a localized effect consisting in the opening of cracks in the construction joints located in one of the blocks. This is validated by conducting numerical analyses through 2D finite element models that consider the nonlinear behavior of the construction joints and use zero-thickness interface elements to simulate the potential cracking planes in the dam. The results confirmed the diagnosis proposed and the capability of the model to reproduce the behavior of the dam, revealing the significant contribution of the opening of the cracks to the non-recoverable displacements in the dam. Keywords: concrete dam; cracking; non-recoverable displacements, finite element models; diagnosis.
Transcript of Structural diagnosis of a concrete dam with cracking and ...
Structural diagnosis of a concrete dam with cracking and high non-recoverable displacements
A. Camposa Ph.D, C. M. Lópezb Ph.D, A. Blancoc* Ph.D and A. Aguadod Ph.D
a Dept. of Structures, Universidade Estadual de Londrina, Londrina, Brazil ([email protected]) b Dept. of Geotechnical Engeneering and Geo-Sciences, Universitat Politècnica de Catalunya, Barcelona, Spain ([email protected]) c Dept. of Construction Engineering, Universitat Politècnica de Catalunya, Barcelona, Spain ([email protected]), * corresponding author d Dept. of Construction Engineering, Universitat Politècnica de Catalunya, Barcelona, Spain ([email protected])
Abstract: Expansions in concrete dams may be caused by chemical or physical sources; however in certain occasions the evidences observed in the dam may not be attributed to a single cause. Mequinenza is an example of a concrete dam affected by expansions and high non-recoverable displacements that cannot be explained by the most frequent pathologies. This paper presents new hypotheses that could justify such behavior by assuming the superposition of a global phenomenon of water induced expansion in concrete in the entire dam and a localized effect consisting in the opening of cracks in the construction joints located in one of the blocks. This is validated by conducting numerical analyses through 2D finite element models that consider the nonlinear behavior of the construction joints and use zero-thickness interface elements to simulate the potential cracking planes in the dam. The results confirmed the diagnosis proposed and the capability of the model to reproduce the behavior of the dam, revealing the significant contribution of the opening of the cracks to the non-recoverable displacements in the dam.
Keywords: concrete dam; cracking; non-recoverable displacements, finite element models; diagnosis.
INTRODUCTION
Concrete dams are massive structures with high economical and social relevance. Among the problems that might affect the service life of the structure are expansive reactions. The expansions may generate internal stresses, cracking and non-recoverable displacements, altering the behavior of the structure and compromising its durability. In this regard, the diagnosis of the pathology is essential to conduct rehabilitation actions, estimate the extent of the damage and, if possible, avoid further degradation in the future.
The expansions observed in dams may be from various sources such as chemical reactions or physical phenomena. The most frequent cause is the alkali-aggregate reaction (AAR) (Stanton 1942; Hobbs 1988; Mehta and Monteiro 2006). Hence, the majority of reported dams with expansive reactions found in the literature are related with AAR (Shayan 1988, Regamey and Hammerschlag 1995, Ulm et al. 2000, Saouma et al. 2007), even though several cases were reported on internal sulfate attack (ISA) (Chinchón et al. 1995, Ayora et al. 1998, Oliveira et al. 2013a, Oliveira et al. 2013b, Oliveira et al. 2014, Ikumi et al. 2014, Chinchón-Payá et al. 2015) and alkali-carbonate reaction (ACR) (Neville 2004, Blanco et al. 2015).
However, on certain occasions the movements and the cracking found in the dam may not be explained by AAR, ISA and ACR or by a single source. In such cases there is a danger of falling into a false diagnosis due to an over-simplification of the hypotheses, which can conceal key elements of the pathology. Furthermore, certain phenomena occurring in the dam cannot be detected through monitoring or visual inspection; instead numerical analyses are required in order to confirm their existence.
In this context, the study of dams whose behavior may not be explained by the most traditional causes gains relevance. On one hand, the analysis of these structures might provide additional information about degradation processes yet scarcely documented in the literature. On the other hand, the validation of the cause through numerical tools might serve as a valuable example for future diagnosis.
In this regard, finite element (FE) studies frequently use smeared crack models for the crack formation. Such approach captures de deterioration process through a non-linear constitutive law to define the strain-softening behavior, thus smearing out the cracks over the continuum (an example of this approach applied to dams may be found in Bhattacharjee and Léger (1994) and (1995)). An alternative approach is the discrete crack models, which are not so commonly used. These models aim at simulating the initiation and propagation of dominant cracks by defining explicitly a discontinuity in the FE mesh. Nevertheless, the location of the crack must be known prior to the simulation. In the particular case of concrete dams, weak planes may be previously known given the construction process or due to past experience (e.g. construction joints, etc.). These weak planes are preferential pathways for the development of cracks.
The first numerical simulations of concrete dams using discrete crack models were conducted assuming linear elastic fracture mechanics (LEFM), which is convenient for large structures such as the case of the Fontana gravity dam (Elices et al. 1985; Sloan and Abraham 1978) and others (Linsbauer et al. 1989). Another example of discrete crack models applied to dams was presented by Shi et al. (2003). Currently, nonlinear fracture mechanics (NLFM) is more frequently employed through the fictitious crack model proposed by Hillerborg et al. (1976). This model considers a softening behavior in terms of stress-crack opening, thus providing a physically consistent method to model the discontinuity. In line with this, a convenient approach to simulate the cracks in finite element models (FEM) is using zero-thickness interface elements without thickness and with a nonlinear constitutive law that describes the cracking and allows considering the normal/shear coupling effect according to Mohr-Coulomb models. The literature reports several examples of interface laws that incorporate fracture concepts (Vonk, 1992; Stankowski et al., 1993; Carol et al. 1997, 2001), examples of application in the analysis of dams (Hohberg, 1992; Cervenka, 1994).
An example of a dam with a behavior not yet fully understood is Mequinenza, located in the northeast of Spain. This gravity dam shows evidences of small expansions manifested through cracking and high non-recoverable displacements, particularly in the block containing the intake pipes and turbines. The origin of these phenomena was the subject of several investigations (Fernández Cánovas 1980; Cervera et al. 1990), neither was conclusive nor explained the high displacements observed. In this case, the use of numerical tools is essential in order to confirm the diagnosis.
Considering the above, the aim of the paper is to present a conclusive diagnosis of Mequinenza dam through a numerical simulation. For that, an analysis of the previous studies and a reformulation of the hypotheses are conducted. Subsequently, a 2D finite element model is employed to reproduce the response of a block of the dam that contains the intake pipes and the turbines, including horizontal joints with a nonlinear behavior using the formulation proposed by Carol et al. (1997) and the subsequent versions (Carol et al. 2001, López et al. 2008a; Idiart, 2001a) to represent the cracks observed in the structure. This approach allows assessing the contribution of the damage and cracking on the registered movements.
The hypotheses herein proposed for the diagnosis of the Mequinenza dam have never been reported and validated previously in the literature, making this document of great interest for the field of dam engineering and the study of the associated pathologies. DESCRIPTION OF THE DAM
General characteristics
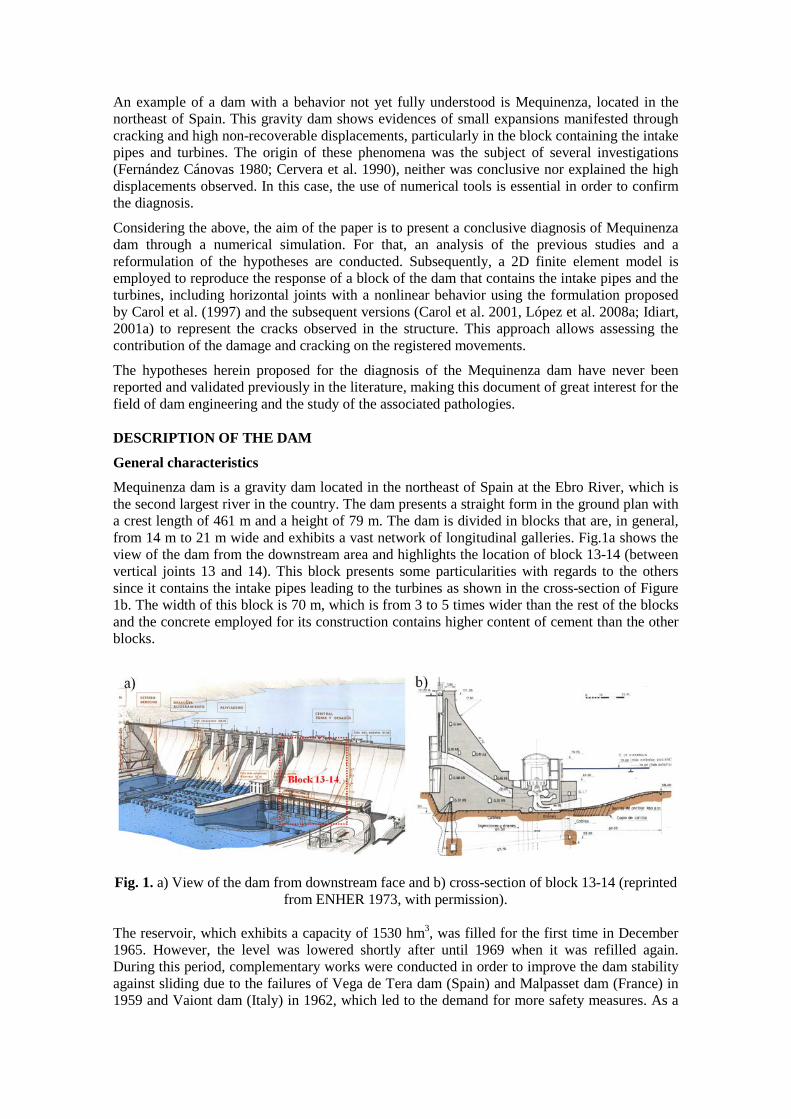
Mequinenza dam is a gravity dam located in the northeast of Spain at the Ebro River, which is the second largest river in the country. The dam presents a straight form in the ground plan with a crest length of 461 m and a height of 79 m. The dam is divided in blocks that are, in general, from 14 m to 21 m wide and exhibits a vast network of longitudinal galleries. Fig.1a shows the view of the dam from the downstream area and highlights the location of block 13-14 (between vertical joints 13 and 14). This block presents some particularities with regards to the others since it contains the intake pipes leading to the turbines as shown in the cross-section of Figure 1b. The width of this block is 70 m, which is from 3 to 5 times wider than the rest of the blocks and the concrete employed for its construction contains higher content of cement than the other blocks.
Fig. 1. a) View of the dam from downstream face and b) cross-section of block 13-14 (reprinted from ENHER 1973, with permission).
The reservoir, which exhibits a capacity of 1530 hm3, was filled for the first time in December 1965. However, the level was lowered shortly after until 1969 when it was refilled again. During this period, complementary works were conducted in order to improve the dam stability against sliding due to the failures of Vega de Tera dam (Spain) and Malpasset dam (France) in 1959 and Vaiont dam (Italy) in 1962, which led to the demand for more safety measures. As a
result, Mequinenza dam became one of the most monitored dams in Spain at that time. Furthermore, between 1968 and 1972 injection campaigns were performed mainly on block 13-14 to fill horizontal cracks and to stop water infiltrations detected in the downstream face at the level 112 m. Subsequently, until 1974, a drainage wall was built between the crest and the gallery at level 100 m, and from the latter to the gallery at level 81 m.
Current state of the dam
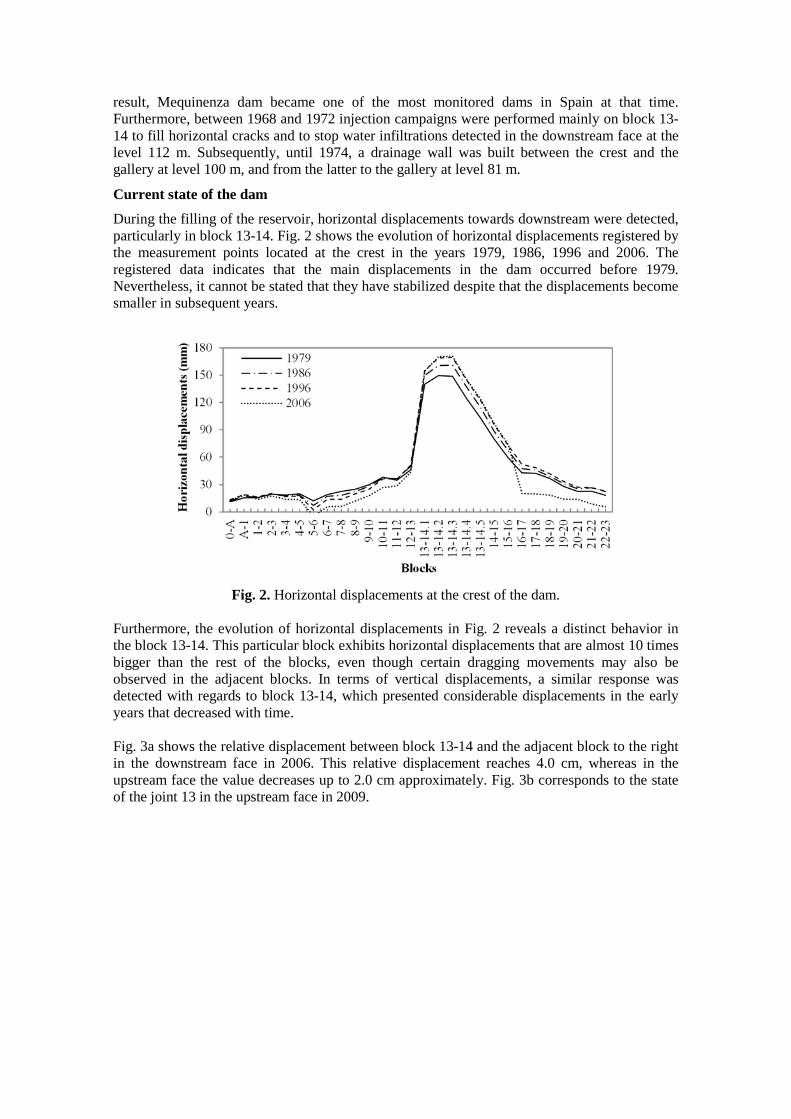
During the filling of the reservoir, horizontal displacements towards downstream were detected, particularly in block 13-14. Fig. 2 shows the evolution of horizontal displacements registered by the measurement points located at the crest in the years 1979, 1986, 1996 and 2006. The registered data indicates that the main displacements in the dam occurred before 1979. Nevertheless, it cannot be stated that they have stabilized despite that the displacements become smaller in subsequent years.
Fig. 2. Horizontal displacements at the crest of the dam.
Furthermore, the evolution of horizontal displacements in Fig. 2 reveals a distinct behavior in the block 13-14. This particular block exhibits horizontal displacements that are almost 10 times bigger than the rest of the blocks, even though certain dragging movements may also be observed in the adjacent blocks. In terms of vertical displacements, a similar response was detected with regards to block 13-14, which presented considerable displacements in the early years that decreased with time. Fig. 3a shows the relative displacement between block 13-14 and the adjacent block to the right in the downstream face in 2006. This relative displacement reaches 4.0 cm, whereas in the upstream face the value decreases up to 2.0 cm approximately. Fig. 3b corresponds to the state of the joint 13 in the upstream face in 2009.
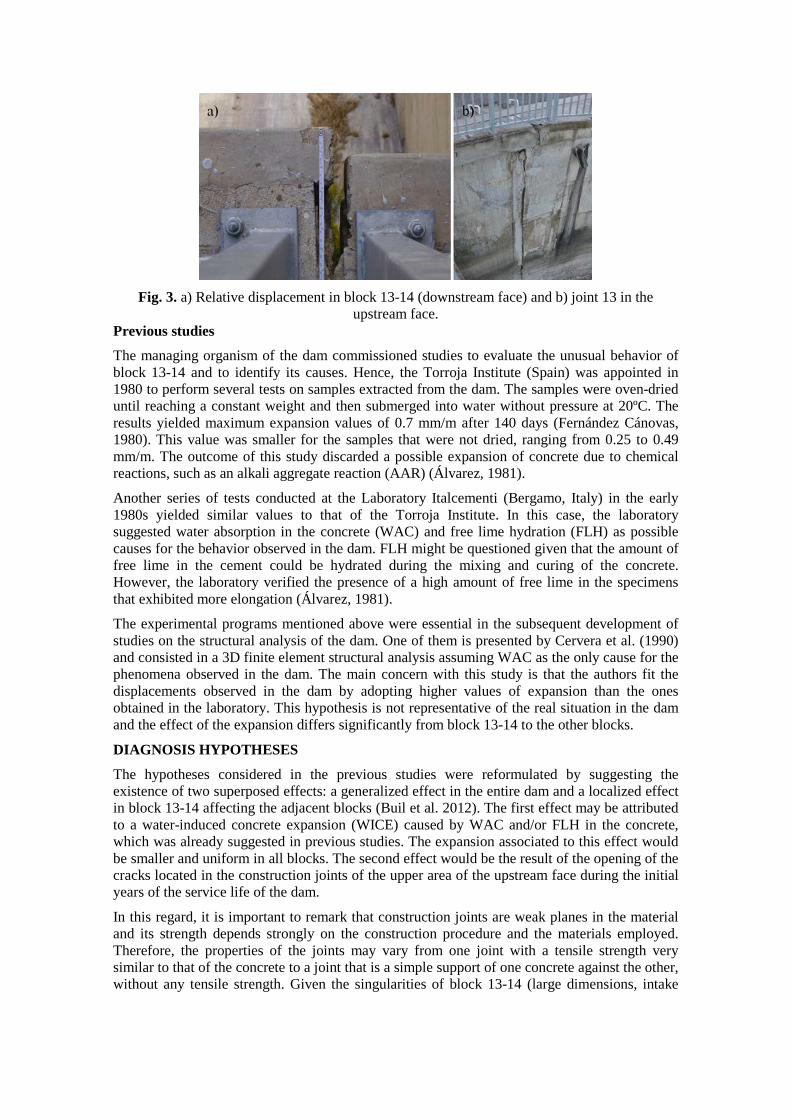
Fig. 3. a) Relative displacement in block 13-14 (downstream face) and b) joint 13 in the
upstream face. Previous studies
The managing organism of the dam commissioned studies to evaluate the unusual behavior of block 13-14 and to identify its causes. Hence, the Torroja Institute (Spain) was appointed in 1980 to perform several tests on samples extracted from the dam. The samples were oven-dried until reaching a constant weight and then submerged into water without pressure at 20ºC. The results yielded maximum expansion values of 0.7 mm/m after 140 days (Fernández Cánovas, 1980). This value was smaller for the samples that were not dried, ranging from 0.25 to 0.49 mm/m. The outcome of this study discarded a possible expansion of concrete due to chemical reactions, such as an alkali aggregate reaction (AAR) (Álvarez, 1981).
Another series of tests conducted at the Laboratory Italcementi (Bergamo, Italy) in the early 1980s yielded similar values to that of the Torroja Institute. In this case, the laboratory suggested water absorption in the concrete (WAC) and free lime hydration (FLH) as possible causes for the behavior observed in the dam. FLH might be questioned given that the amount of free lime in the cement could be hydrated during the mixing and curing of the concrete. However, the laboratory verified the presence of a high amount of free lime in the specimens that exhibited more elongation (Álvarez, 1981).
The experimental programs mentioned above were essential in the subsequent development of studies on the structural analysis of the dam. One of them is presented by Cervera et al. (1990) and consisted in a 3D finite element structural analysis assuming WAC as the only cause for the phenomena observed in the dam. The main concern with this study is that the authors fit the displacements observed in the dam by adopting higher values of expansion than the ones obtained in the laboratory. This hypothesis is not representative of the real situation in the dam and the effect of the expansion differs significantly from block 13-14 to the other blocks.
DIAGNOSIS HYPOTHESES
The hypotheses considered in the previous studies were reformulated by suggesting the existence of two superposed effects: a generalized effect in the entire dam and a localized effect in block 13-14 affecting the adjacent blocks (Buil et al. 2012). The first effect may be attributed to a water-induced concrete expansion (WICE) caused by WAC and/or FLH in the concrete, which was already suggested in previous studies. The expansion associated to this effect would be smaller and uniform in all blocks. The second effect would be the result of the opening of the cracks located in the construction joints of the upper area of the upstream face during the initial years of the service life of the dam.
In this regard, it is important to remark that construction joints are weak planes in the material and its strength depends strongly on the construction procedure and the materials employed. Therefore, the properties of the joints may vary from one joint with a tensile strength very similar to that of the concrete to a joint that is a simple support of one concrete against the other, without any tensile strength. Given the singularities of block 13-14 (large dimensions, intake
pipes and higher cement content), the concrete joints may have weakened due to thermal and shrinkage effects leading to the opening of cracks and the uplift pressure.
The hypothesis of a superposition of a global effect in the entire dam and a localized effect in block 13-14 is in line with the horizontal displacements towards the downstream face observed in the dam and shown in Figure 1. In order to verify this, block 13-14 of Mequinenza dam was modeled with finite elements (FEM).
MODELING OF THE DAM
Description of the FE model
Given that Mequinenza is a straight gravity dam with vertical joints between blocks, a 2D FEM analysis was selected to reproduce the behavior of block 13-14. Its suitability for plane strain conditions has been repeatedly confirmed in practice. The software GiD (CIMNE 2006) was used to define the geometry of the model, generate the finite element mesh and represent the results. The calculations were conducted by means of the finite element code DRAC, developed at the Department of Geotechnical Engineering and Geo-Sciences at UPC.
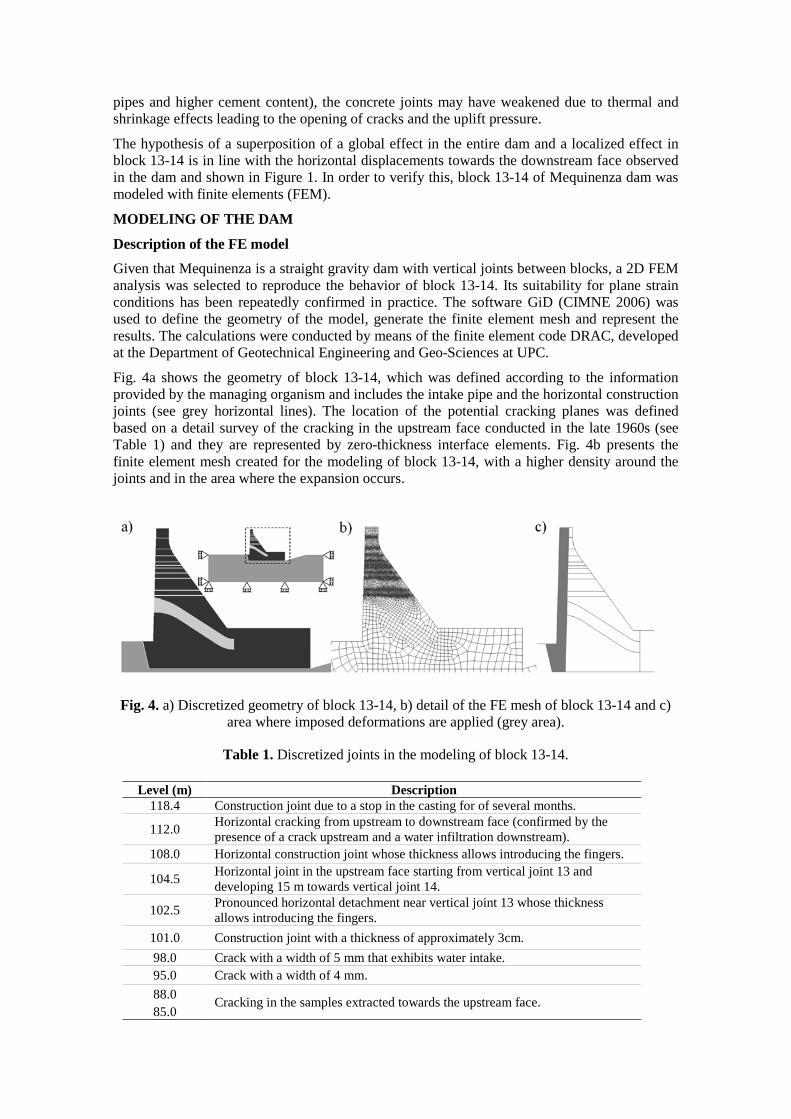
Fig. 4a shows the geometry of block 13-14, which was defined according to the information provided by the managing organism and includes the intake pipe and the horizontal construction joints (see grey horizontal lines). The location of the potential cracking planes was defined based on a detail survey of the cracking in the upstream face conducted in the late 1960s (see Table 1) and they are represented by zero-thickness interface elements. Fig. 4b presents the finite element mesh created for the modeling of block 13-14, with a higher density around the joints and in the area where the expansion occurs.
Fig. 4. a) Discretized geometry of block 13-14, b) detail of the FE mesh of block 13-14 and c) area where imposed deformations are applied (grey area).
Table 1. Discretized joints in the modeling of block 13-14.
Level (m) Description 118.4 Construction joint due to a stop in the casting for of several months.
112.0 Horizontal cracking from upstream to downstream face (confirmed by the presence of a crack upstream and a water infiltration downstream).
108.0 Horizontal construction joint whose thickness allows introducing the fingers.
104.5 Horizontal joint in the upstream face starting from vertical joint 13 and developing 15 m towards vertical joint 14.
102.5 Pronounced horizontal detachment near vertical joint 13 whose thickness allows introducing the fingers.
101.0 Construction joint with a thickness of approximately 3cm. 98.0 Crack with a width of 5 mm that exhibits water intake. 95.0 Crack with a width of 4 mm. 88.0 Cracking in the samples extracted towards the upstream face. 85.0
The actions considered in the modeling were the self-weight, the hydrostatic pressure, the uplift pressure and the imposed deformation derived from the expansion of concrete. In the case of the imposed deformations, these were assumed to start in the upstream face and progress up to a depth of 6.1 m, where the drainage is located, as shown in Fig. 4c (see grey area). In terms of the boundary conditions of the soil, the horizontal displacement is restrained in the sides and the vertical displacement is restrained at the bottom as indicated in Fig. 4a.
Regarding the properties of the materials, a Young’s modulus of 20 GPa and 45 GPa are considered for the concrete and the soil, respectively. The Young’s modulus of the pipe in block 13-14 is assumed to be equivalent to a concrete with a Young’s modulus of 13.3 GPa. This value corresponds to the proportion of the total length of the concrete divided by the total length of the block in the longitudinal section where the pipe is located. The Poisson coefficient adopted in all cases is 0.2.
The continuum is modeled by adopting a linear elastic constitutive law, whereas the behavior of the zero-thickness interface elements defined in the cracking planes is assumed nonlinear and is presented subsequently.
Constitutive law for zero-thickness interface elements
The constitutive law for zero-thickness interface elements used is based on the theory of elasto-plasticity and incorporates fracture mechanic concepts (Carol, Prat and López 1997). The interface behavior is formulated in terms of the normal and shear components of the stresses on the interface plane and the corresponding relative displacements, which may be identified as crack openings.
The elastic stiffness matrix is diagonal with constant KN (normal interface elastic stiffnesses) and KT (tangential interface elastic stiffnesses) values. These constants may be considered as penalty coefficients required to calculate the interface stresses. Notice that interface elements in the elastic regime should not add any elastic compliance. This means that their values should be as high as possible (the upper bound is set as a compromise between the added compliance and the numerical instabilities found for very high values).
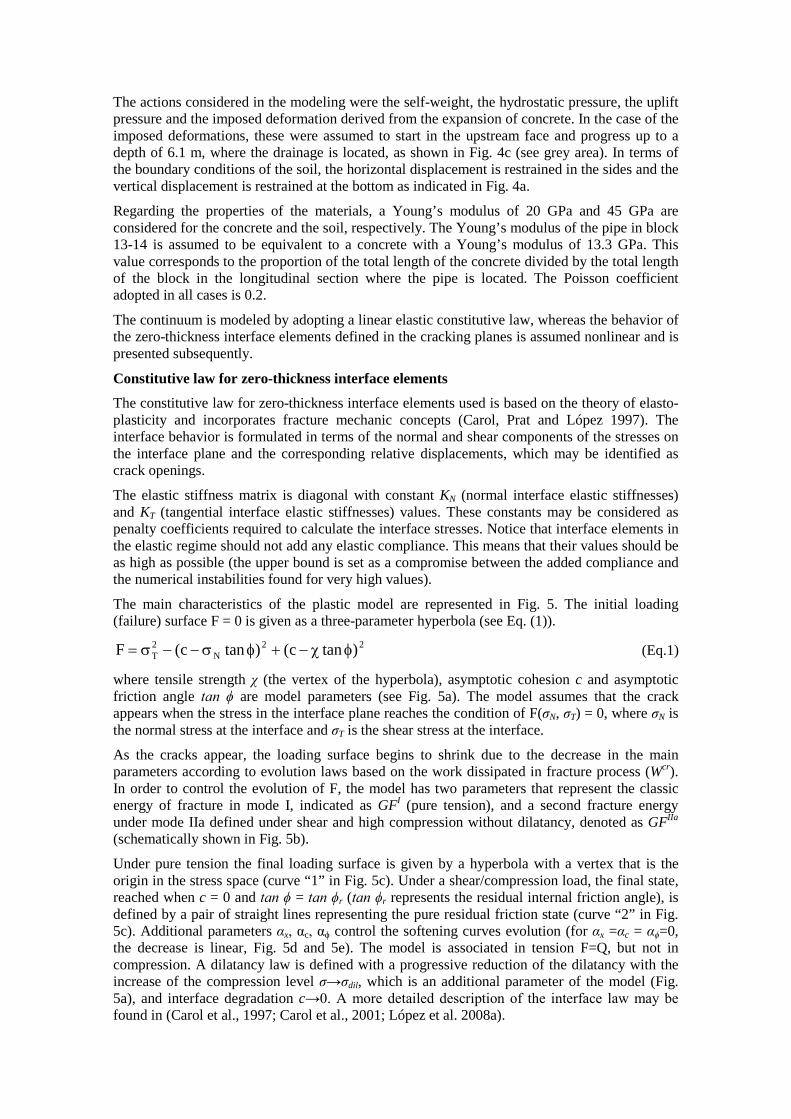
The main characteristics of the plastic model are represented in Fig. 5. The initial loading (failure) surface F = 0 is given as a three-parameter hyperbola (see Eq. (1)).
22N
2T )tanc()tanc(F φc−+φσ−−σ= (Eq.1)
where tensile strength χ (the vertex of the hyperbola), asymptotic cohesion c and asymptotic friction angle tan ϕ are model parameters (see Fig. 5a). The model assumes that the crack appears when the stress in the interface plane reaches the condition of F(σN, σT) = 0, where σN is the normal stress at the interface and σT is the shear stress at the interface.
As the cracks appear, the loading surface begins to shrink due to the decrease in the main parameters according to evolution laws based on the work dissipated in fracture process (Wcr). In order to control the evolution of F, the model has two parameters that represent the classic energy of fracture in mode I, indicated as GFI (pure tension), and a second fracture energy under mode IIa defined under shear and high compression without dilatancy, denoted as GFIIa (schematically shown in Fig. 5b).
Under pure tension the final loading surface is given by a hyperbola with a vertex that is the origin in the stress space (curve “1” in Fig. 5c). Under a shear/compression load, the final state, reached when c = 0 and tan ϕ = tan ϕr (tan ϕr represents the residual internal friction angle), is defined by a pair of straight lines representing the pure residual friction state (curve “2” in Fig. 5c). Additional parameters αx, αc, αϕ control the softening curves evolution (for αx =αc = αϕ=0, the decrease is linear, Fig. 5d and 5e). The model is associated in tension F=Q, but not in compression. A dilatancy law is defined with a progressive reduction of the dilatancy with the increase of the compression level σ→σdil, which is an additional parameter of the model (Fig. 5a), and interface degradation c→0. A more detailed description of the interface law may be found in (Carol et al., 1997; Carol et al., 2001; López et al. 2008a).
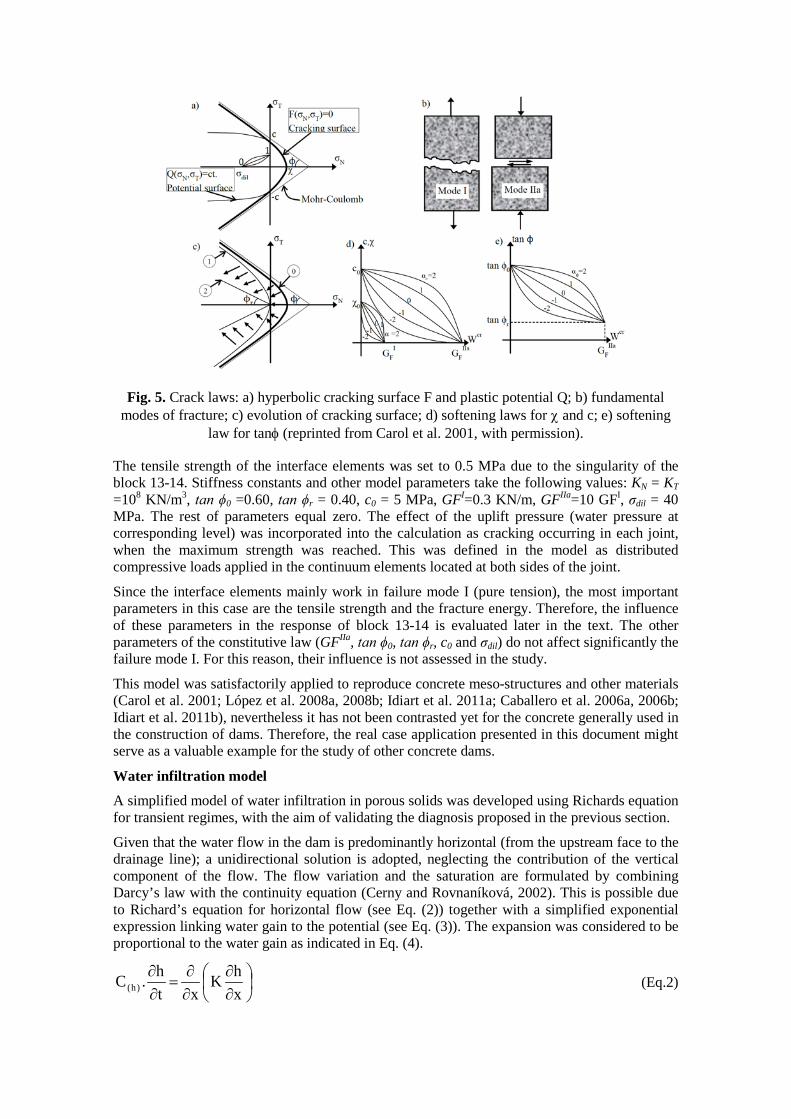
Fig. 5. Crack laws: a) hyperbolic cracking surface F and plastic potential Q; b) fundamental modes of fracture; c) evolution of cracking surface; d) softening laws for c and c; e) softening
law for tanφ (reprinted from Carol et al. 2001, with permission).
The tensile strength of the interface elements was set to 0.5 MPa due to the singularity of the block 13-14. Stiffness constants and other model parameters take the following values: KN = KT =108 KN/m3, tan ϕ0 =0.60, tan ϕr = 0.40, c0 = 5 MPa, GFI=0.3 KN/m, GFIIa=10 GFI, σdil = 40 MPa. The rest of parameters equal zero. The effect of the uplift pressure (water pressure at corresponding level) was incorporated into the calculation as cracking occurring in each joint, when the maximum strength was reached. This was defined in the model as distributed compressive loads applied in the continuum elements located at both sides of the joint.
Since the interface elements mainly work in failure mode I (pure tension), the most important parameters in this case are the tensile strength and the fracture energy. Therefore, the influence of these parameters in the response of block 13-14 is evaluated later in the text. The other parameters of the constitutive law (GFIIa, tan ϕ0, tan ϕr, c0 and σdil) do not affect significantly the failure mode I. For this reason, their influence is not assessed in the study.
This model was satisfactorily applied to reproduce concrete meso-structures and other materials (Carol et al. 2001; López et al. 2008a, 2008b; Idiart et al. 2011a; Caballero et al. 2006a, 2006b; Idiart et al. 2011b), nevertheless it has not been contrasted yet for the concrete generally used in the construction of dams. Therefore, the real case application presented in this document might serve as a valuable example for the study of other concrete dams.
Water infiltration model
A simplified model of water infiltration in porous solids was developed using Richards equation for transient regimes, with the aim of validating the diagnosis proposed in the previous section.
Given that the water flow in the dam is predominantly horizontal (from the upstream face to the drainage line); a unidirectional solution is adopted, neglecting the contribution of the vertical component of the flow. The flow variation and the saturation are formulated by combining Darcy’s law with the continuity equation (Cerny and Rovnaníková, 2002). This is possible due to Richard’s equation for horizontal flow (see Eq. (2)) together with a simplified exponential expression linking water gain to the potential (see Eq. (3)). The expansion was considered to be proportional to the water gain as indicated in Eq. (4).
∂∂
∂∂
=∂∂
xhK
xth.C )h( (Eq.2)
hsat)h( eC a−aθ= (Eq.3)
satmax .
θθ
ε=ε (Eq.4)
where K is the hydraulic conductivity, h is the potential (P/γ), P is the water pressure, γ is the water specific weight, x is the horizontal distance between upstream face and the point on concrete, t is the time, C(h) is the specific capacity of unsaturated medium (C(h)=∂θ/∂h ), θ is the water gain (water volume/total volume), θsat is the maximum value (saturation) of water gain, α is a parameter that controls the shape of the curve, ε is the expansion and εmax is the maximum expansion.
There are two important parameters that must be determined for the infiltration calculation: the maximum water gain for concrete saturation (θsat) and the hydraulic conductivity (K). In this case the value of the former was set to θsat= 7% (the average porosity of the concrete block is 7.4 %, according to the tests carried out by Italcementi (Álvarez, 1981), although it was observed that values between 5 and 10% have not significantly affected the results of one-dimensional calculations). The variation of the parameter α affects the shape of the curve but does not affect significantly the evolution in time of the water infiltration in the concrete. For this reason, the value adopted for all cases is 1.0, which is equivalent to a potential that saturates a certain point of the concrete with a 2.0 m water column. The values of εmax are presented in the section entitled Validation of the diagnosis.
The hydraulic conductivity (K) for concrete presents great variability according to previous studies in the literature, ranging from 10−9 to 10−14 m/s (El-Dieb and Hooton, 1995; Breysse and Gérard, 1997; Cerny and Rovnaníková, 2002). According to Vallarino (1991), the value of K in concrete dams is approximately 10−11 m/s; however, the presence of cracks, construction joints and defective executed areas may accelerate the infiltration process. Sensitivity analysis revealed that small variations in the value of K do not affect the shape of the water infiltration evolution, but significantly change the speed of the process (Campos, 2012). For the purpose of this study, a value of K = 3.10-10 m/s was employed.
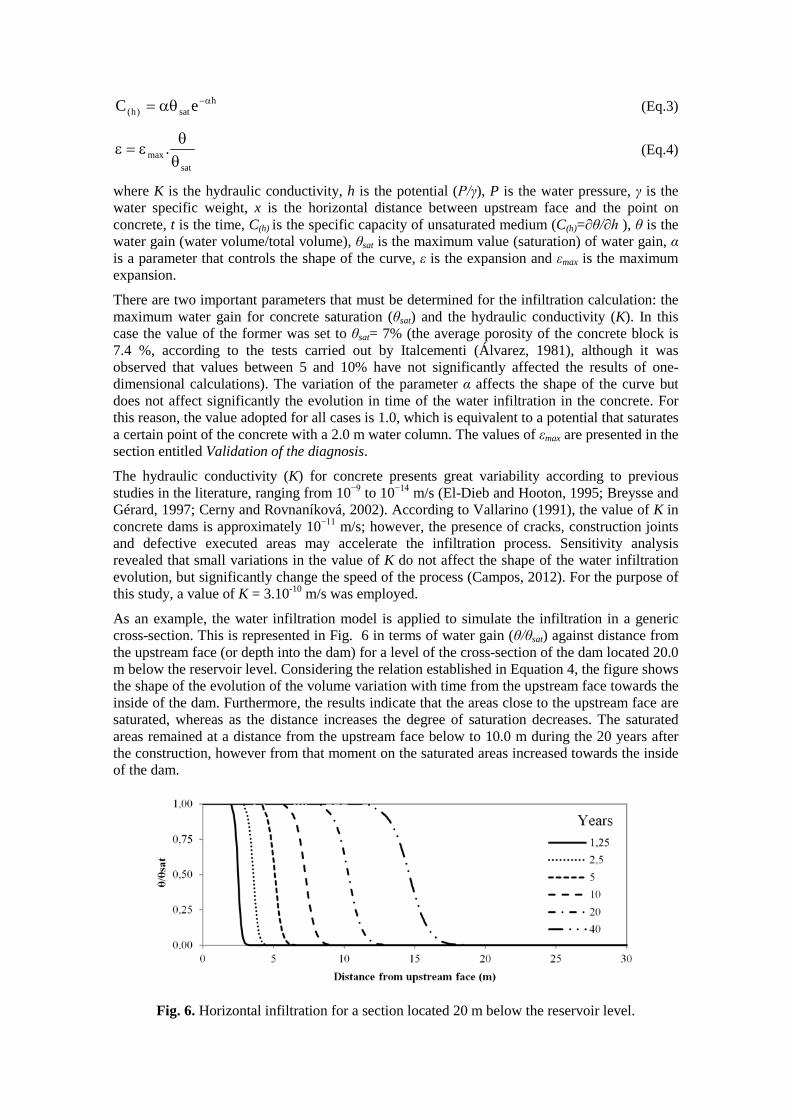
As an example, the water infiltration model is applied to simulate the infiltration in a generic cross-section. This is represented in Fig. 6 in terms of water gain (θ/θsat) against distance from the upstream face (or depth into the dam) for a level of the cross-section of the dam located 20.0 m below the reservoir level. Considering the relation established in Equation 4, the figure shows the shape of the evolution of the volume variation with time from the upstream face towards the inside of the dam. Furthermore, the results indicate that the areas close to the upstream face are saturated, whereas as the distance increases the degree of saturation decreases. The saturated areas remained at a distance from the upstream face below to 10.0 m during the 20 years after the construction, however from that moment on the saturated areas increased towards the inside of the dam.
Fig. 6. Horizontal infiltration for a section located 20 m below the reservoir level.
NUMERICAL RESULTS
In the results presented in this section, the expansions are imposed considering the water infiltration process presented in Fig. 6. The deformations are applied assuming that the infiltration begins in the upstream face and progresses up to a distance of 6.1 m, where the drainage is located. The expansion is defined in the model as imposed deformations in each node of the mesh as if it was variation of temperature. The water infiltration model is applied in the following section to validate the diagnosis.
Influence of the expansion and the behavior of the joints
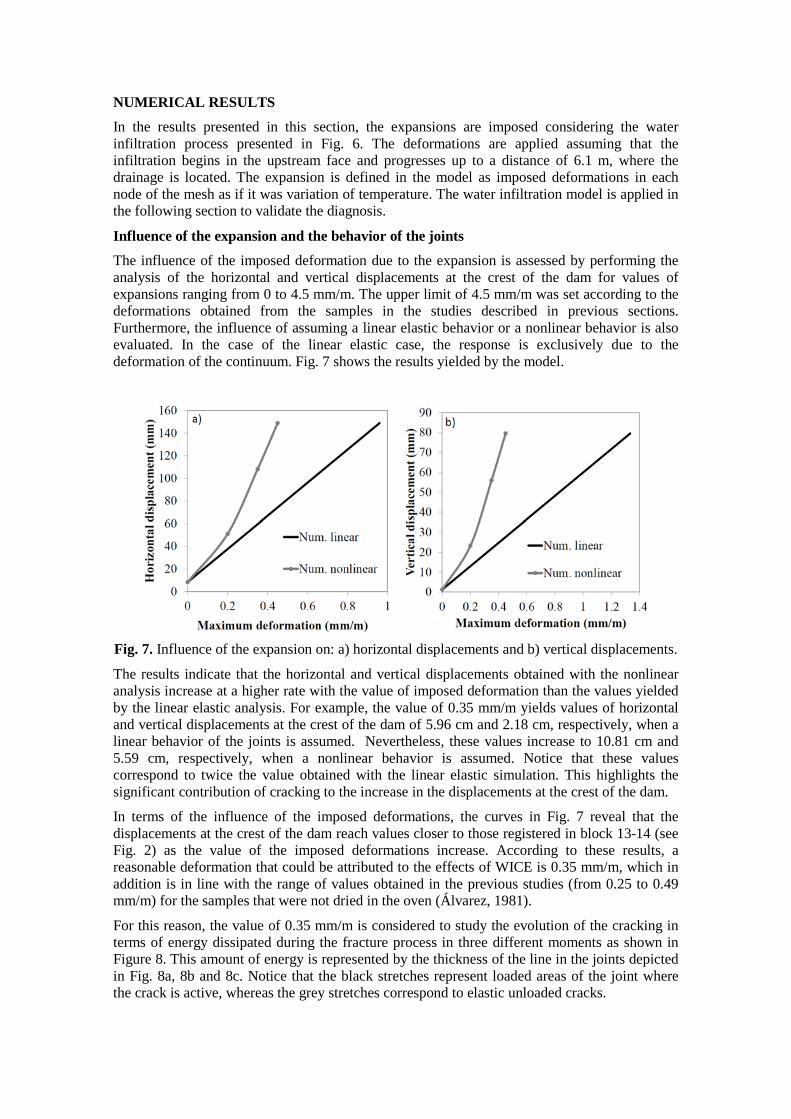
The influence of the imposed deformation due to the expansion is assessed by performing the analysis of the horizontal and vertical displacements at the crest of the dam for values of expansions ranging from 0 to 4.5 mm/m. The upper limit of 4.5 mm/m was set according to the deformations obtained from the samples in the studies described in previous sections. Furthermore, the influence of assuming a linear elastic behavior or a nonlinear behavior is also evaluated. In the case of the linear elastic case, the response is exclusively due to the deformation of the continuum. Fig. 7 shows the results yielded by the model.
Fig. 7. Influence of the expansion on: a) horizontal displacements and b) vertical displacements.
The results indicate that the horizontal and vertical displacements obtained with the nonlinear analysis increase at a higher rate with the value of imposed deformation than the values yielded by the linear elastic analysis. For example, the value of 0.35 mm/m yields values of horizontal and vertical displacements at the crest of the dam of 5.96 cm and 2.18 cm, respectively, when a linear behavior of the joints is assumed. Nevertheless, these values increase to 10.81 cm and 5.59 cm, respectively, when a nonlinear behavior is assumed. Notice that these values correspond to twice the value obtained with the linear elastic simulation. This highlights the significant contribution of cracking to the increase in the displacements at the crest of the dam.
In terms of the influence of the imposed deformations, the curves in Fig. 7 reveal that the displacements at the crest of the dam reach values closer to those registered in block 13-14 (see Fig. 2) as the value of the imposed deformations increase. According to these results, a reasonable deformation that could be attributed to the effects of WICE is 0.35 mm/m, which in addition is in line with the range of values obtained in the previous studies (from 0.25 to 0.49 mm/m) for the samples that were not dried in the oven (Álvarez, 1981).
For this reason, the value of 0.35 mm/m is considered to study the evolution of the cracking in terms of energy dissipated during the fracture process in three different moments as shown in Figure 8. This amount of energy is represented by the thickness of the line in the joints depicted in Fig. 8a, 8b and 8c. Notice that the black stretches represent loaded areas of the joint where the crack is active, whereas the grey stretches correspond to elastic unloaded cracks.
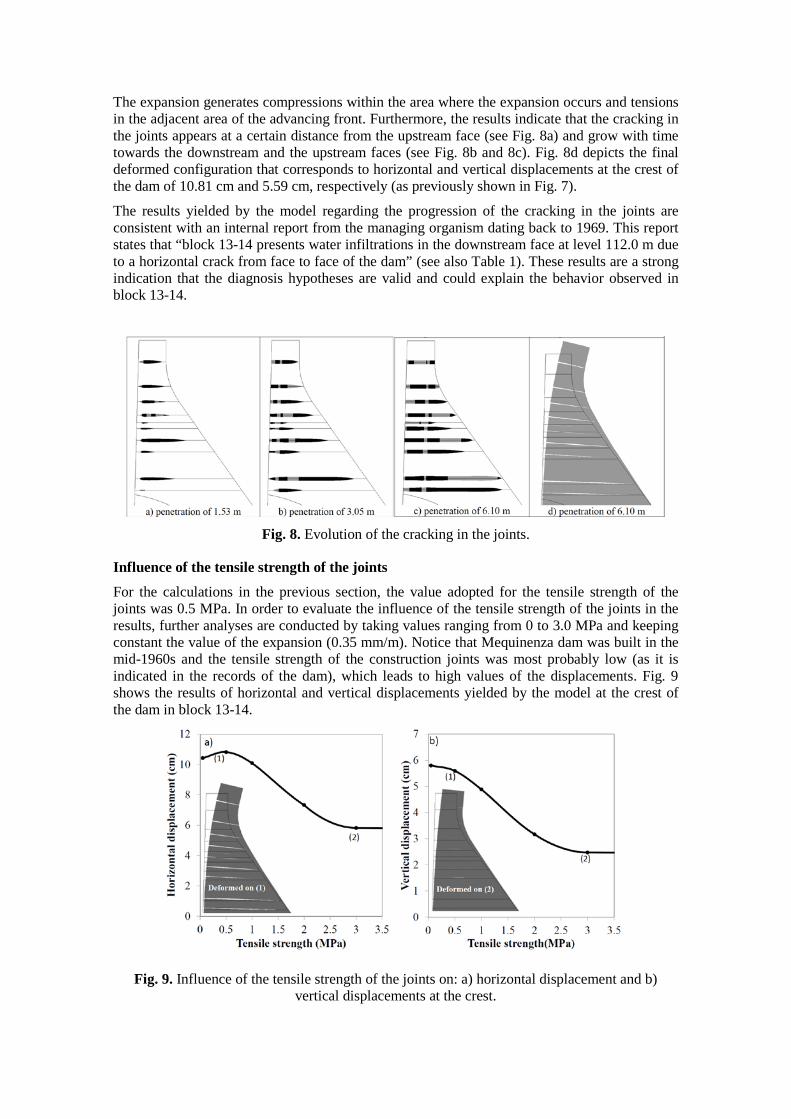
The expansion generates compressions within the area where the expansion occurs and tensions in the adjacent area of the advancing front. Furthermore, the results indicate that the cracking in the joints appears at a certain distance from the upstream face (see Fig. 8a) and grow with time towards the downstream and the upstream faces (see Fig. 8b and 8c). Fig. 8d depicts the final deformed configuration that corresponds to horizontal and vertical displacements at the crest of the dam of 10.81 cm and 5.59 cm, respectively (as previously shown in Fig. 7).
The results yielded by the model regarding the progression of the cracking in the joints are consistent with an internal report from the managing organism dating back to 1969. This report states that “block 13-14 presents water infiltrations in the downstream face at level 112.0 m due to a horizontal crack from face to face of the dam” (see also Table 1). These results are a strong indication that the diagnosis hypotheses are valid and could explain the behavior observed in block 13-14.
Fig. 8. Evolution of the cracking in the joints.
Influence of the tensile strength of the joints
For the calculations in the previous section, the value adopted for the tensile strength of the joints was 0.5 MPa. In order to evaluate the influence of the tensile strength of the joints in the results, further analyses are conducted by taking values ranging from 0 to 3.0 MPa and keeping constant the value of the expansion (0.35 mm/m). Notice that Mequinenza dam was built in the mid-1960s and the tensile strength of the construction joints was most probably low (as it is indicated in the records of the dam), which leads to high values of the displacements. Fig. 9 shows the results of horizontal and vertical displacements yielded by the model at the crest of the dam in block 13-14.
Fig. 9. Influence of the tensile strength of the joints on: a) horizontal displacement and b) vertical displacements at the crest.
The curves reveal that for a tensile strength between 0 MPa and 1.0 MPa the displacements do not vary significantly, taking values close to 11 cm for horizontal displacements and between 5 and 6 cm for the vertical displacements. Conversely, for higher values of the tensile strength both horizontal and vertical displacements are considerably reduced, particularly when the tensile strength increases from 1.0 MPa to 2.5 MPa. For tensile strengths over 3.0 MPa the displacements are stabilized and take similar values to those obtained with the linear elastic simulation.
This difference in the displacements between the points (1) and (2) may be attributed to the different contribution of the cracks as shown in the graphs of the deformed mesh in Fig. 9a and 9b. For the tensile strength associated to case (1), the opening of the cracks contributes to the vertical and horizontal displacements, whereas for case (2) no cracking is observed and, therefore, the displacements correspond to the elastic situation.
Influence of the uplift pressure and the fracture energy
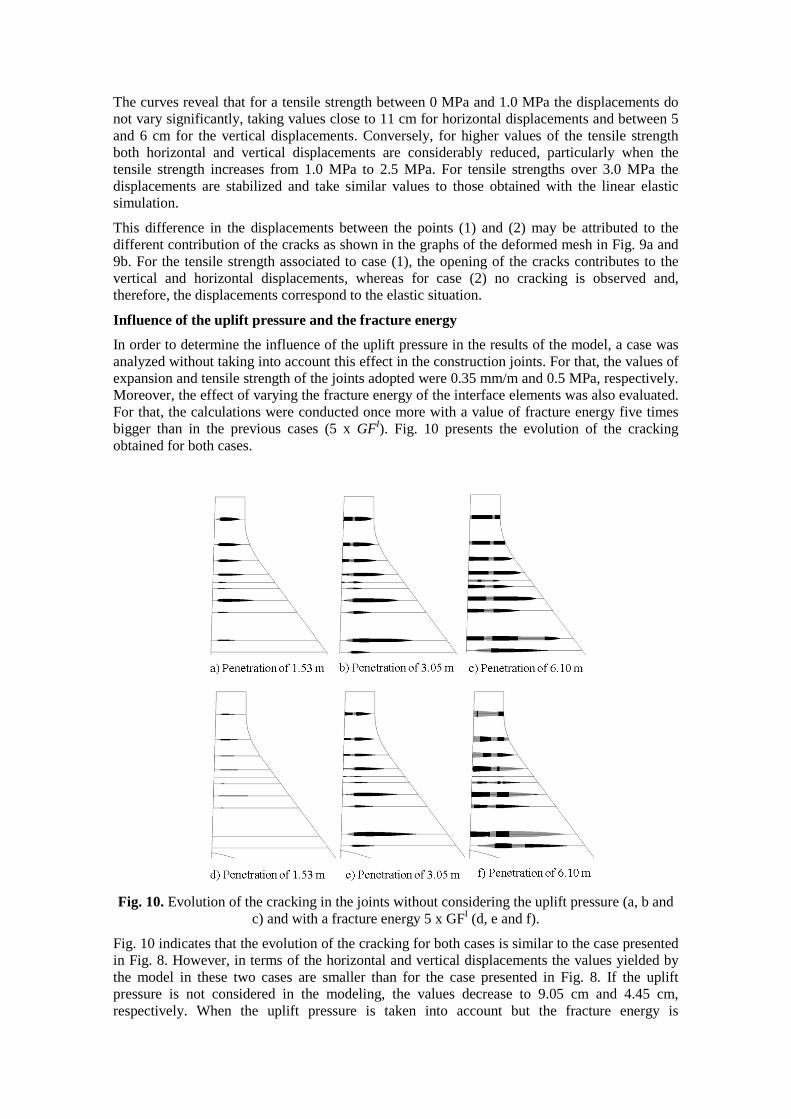
In order to determine the influence of the uplift pressure in the results of the model, a case was analyzed without taking into account this effect in the construction joints. For that, the values of expansion and tensile strength of the joints adopted were 0.35 mm/m and 0.5 MPa, respectively. Moreover, the effect of varying the fracture energy of the interface elements was also evaluated. For that, the calculations were conducted once more with a value of fracture energy five times bigger than in the previous cases (5 x GFI). Fig. 10 presents the evolution of the cracking obtained for both cases.
Fig. 10. Evolution of the cracking in the joints without considering the uplift pressure (a, b and
c) and with a fracture energy 5 x GFI (d, e and f).
Fig. 10 indicates that the evolution of the cracking for both cases is similar to the case presented in Fig. 8. However, in terms of the horizontal and vertical displacements the values yielded by the model in these two cases are smaller than for the case presented in Fig. 8. If the uplift pressure is not considered in the modeling, the values decrease to 9.05 cm and 4.45 cm, respectively. When the uplift pressure is taken into account but the fracture energy is
incremented 5 times, the values obtained are 9.16 cm and 4.55 cm, respectively. These results indicate that both parameters do not affect significantly the outcome of the model.
VALIDATION OF THE DIAGNOSIS
The hypotheses proposed for the diagnosis and the capability of the model to reproduce the behavior observed in Mequinenza dam are validated by comparing the results yielded by the model with the measurements registered in block 13-14. The validation was conducted in two stages: in the first one the displacements were plotted against the level of the dam, whereas in the second stage the evolution with time of the displacements was analyzed. Given the contradictions and uncertainties regarding the origin of the measurements of the vertical displacements, these were not compared.
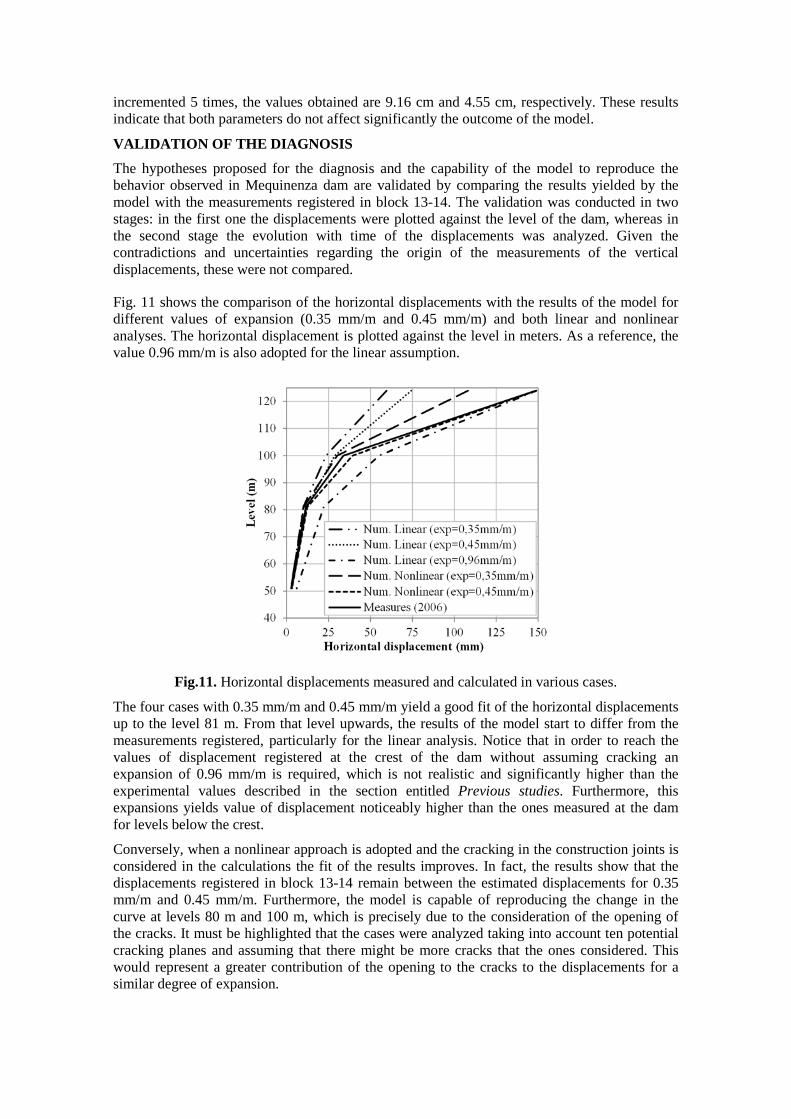
Fig. 11 shows the comparison of the horizontal displacements with the results of the model for different values of expansion (0.35 mm/m and 0.45 mm/m) and both linear and nonlinear analyses. The horizontal displacement is plotted against the level in meters. As a reference, the value 0.96 mm/m is also adopted for the linear assumption.
Fig.11. Horizontal displacements measured and calculated in various cases. The four cases with 0.35 mm/m and 0.45 mm/m yield a good fit of the horizontal displacements up to the level 81 m. From that level upwards, the results of the model start to differ from the measurements registered, particularly for the linear analysis. Notice that in order to reach the values of displacement registered at the crest of the dam without assuming cracking an expansion of 0.96 mm/m is required, which is not realistic and significantly higher than the experimental values described in the section entitled Previous studies. Furthermore, this expansions yields value of displacement noticeably higher than the ones measured at the dam for levels below the crest.
Conversely, when a nonlinear approach is adopted and the cracking in the construction joints is considered in the calculations the fit of the results improves. In fact, the results show that the displacements registered in block 13-14 remain between the estimated displacements for 0.35 mm/m and 0.45 mm/m. Furthermore, the model is capable of reproducing the change in the curve at levels 80 m and 100 m, which is precisely due to the consideration of the opening of the cracks. It must be highlighted that the cases were analyzed taking into account ten potential cracking planes and assuming that there might be more cracks that the ones considered. This would represent a greater contribution of the opening to the cracks to the displacements for a similar degree of expansion.
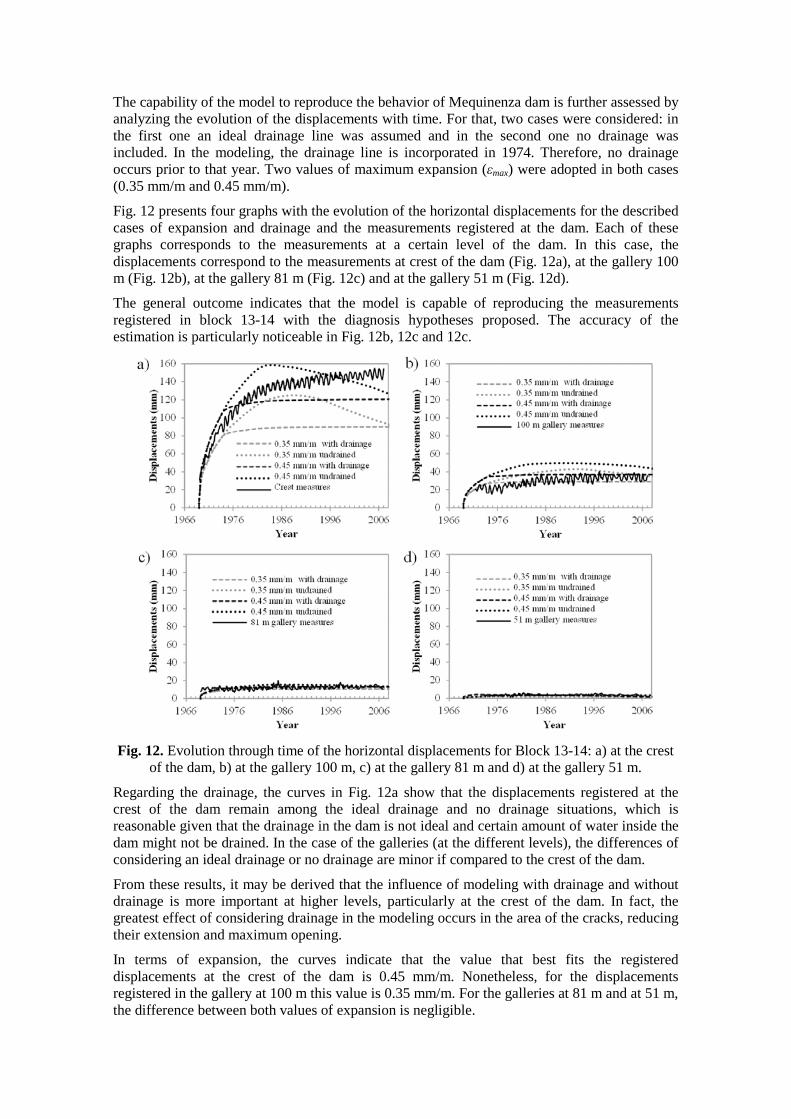
The capability of the model to reproduce the behavior of Mequinenza dam is further assessed by analyzing the evolution of the displacements with time. For that, two cases were considered: in the first one an ideal drainage line was assumed and in the second one no drainage was included. In the modeling, the drainage line is incorporated in 1974. Therefore, no drainage occurs prior to that year. Two values of maximum expansion (εmax) were adopted in both cases (0.35 mm/m and 0.45 mm/m).
Fig. 12 presents four graphs with the evolution of the horizontal displacements for the described cases of expansion and drainage and the measurements registered at the dam. Each of these graphs corresponds to the measurements at a certain level of the dam. In this case, the displacements correspond to the measurements at crest of the dam (Fig. 12a), at the gallery 100 m (Fig. 12b), at the gallery 81 m (Fig. 12c) and at the gallery 51 m (Fig. 12d).
The general outcome indicates that the model is capable of reproducing the measurements registered in block 13-14 with the diagnosis hypotheses proposed. The accuracy of the estimation is particularly noticeable in Fig. 12b, 12c and 12c.
Fig. 12. Evolution through time of the horizontal displacements for Block 13-14: a) at the crest
of the dam, b) at the gallery 100 m, c) at the gallery 81 m and d) at the gallery 51 m.
Regarding the drainage, the curves in Fig. 12a show that the displacements registered at the crest of the dam remain among the ideal drainage and no drainage situations, which is reasonable given that the drainage in the dam is not ideal and certain amount of water inside the dam might not be drained. In the case of the galleries (at the different levels), the differences of considering an ideal drainage or no drainage are minor if compared to the crest of the dam.
From these results, it may be derived that the influence of modeling with drainage and without drainage is more important at higher levels, particularly at the crest of the dam. In fact, the greatest effect of considering drainage in the modeling occurs in the area of the cracks, reducing their extension and maximum opening.
In terms of expansion, the curves indicate that the value that best fits the registered displacements at the crest of the dam is 0.45 mm/m. Nonetheless, for the displacements registered in the gallery at 100 m this value is 0.35 mm/m. For the galleries at 81 m and at 51 m, the difference between both values of expansion is negligible.
CONCLUSIONS
This paper presents the real case of Mequinenza dam that exhibits cracking and significant non-recoverable displacements, particularly in block 13-14, and whose origin cannot be explained by the most traditional causes. In the present study, the hypotheses for the diagnosis are reformulated by considering the superposition of a global phenomenon affecting the entire dam due to a WICE process and a localized effect altering the behavior of block 13-14 and the adjacent ones due to the opening of cracks. These hypotheses are validated through the 2D FE simulation of the dam, considering zero-thickness interface elements with a non-linear constitutive law to represent the cracking.
Based on the results obtained through the numerical analyses, the following conclusions may be derived the study:
• The diagnosis hypotheses are confirmed with the numerical results obtained with the model, which is capable of reproducing the non-recoverable displacements registered in the dam. The analyses reveal that the degree of expansion due to WICE that reproduced the registered behavior in the dam range between 0.35 mm/m and 0.45 mm/m, which are in line with the previous experimental studies performed in samples.
• The use of zero-thickness interface elements was essential to successfully reproduce the behavior. Notice that simulating only the continuum requires very high and unrealistic values of expansions. Conversely, the combined action of an expansion advancing from the upstream face and potential weak planes in block 13-14 allowed simulating the formation and subsequent development and opening of the cracks. Likewise, the results demonstrate the significant contribution of the opening of the cracks to the displacements of block 13-14 and the adjacent ones, particularly in the upper area.
• The uplift pressure and the fracture energy do not affect significantly the outcome yielded by the model. Conversely, the influence of the tensile strength of the construction joints on the results is larger and the value adopted affects the appearance of cracking. In fact, adopting values of 3.0 MPa at the construction joints (as could be expected in other adjacent blocks), the simulation reveals that the cracking and the displacements would reduce significantly. However, for low tensile strengths at the joints (as expected in block 13-14) the model yields displacements that are close to the ones registered in the crest of the dam and at level 100 m.
• The combined simulation of the water infiltration process and mechanical modeling with the interface elements demonstrates the great potential of the calculation tools used for the validation of the diagnosis.
The paper represents a significant contribution to the dam engineering profession by presenting the diagnosis of an uncommon behaviour in a concrete dam that is due to the combination of degradation processes that is scarcely documented in the literature. Furthermore, numerical simulation tools are employed to validate the diagnosis following an approach that may be applied to other real cases of dams affected by either external or internal actions that generate significant cracking, such as expansions produced by chemical reaction and/or physical phenomena.
ACKNOWLEDGEMENTS
The authors acknowledge the economic support provided by the Spanish Ministry of Science and Innovation through the projects BIA2010-20913-C02-02 and BIA2013-49106-C2-1-R. Furthermore, the authors wish to thank Endesa Generación S.A. the invaluable economical and technical support over the years, in particular to Felipe Río and Francisco José Conesa. The Spanish Ministry of Economy and Competitiveness supported the first author through the scholarship FPU.
REFERENCES
Álvarez, A. (1981). Presa de Mequinenza: Informe sobre el bloque 13-14 (Internal Document A02-50-162). Madrid, Endesa Generación.
Ayora, C., Chinchón, J.S., Aguado, A. and Guirado, F. (1998). “Weathering of Iron Sulfides and Concrete Alteration: Thermodynamic Model and Observation in Dams From Central Pyrenees, Spain”. Cement Concrete Res., 28(4), 591-603.
Bhattacharjee, S. S., Léger, P., (1994). “Application of NLFM Models to predict cracking in concrete gravity dams”. J. Struct. Eng., 120, 1255-1271.
Bhattacharjee, S. S., Léger, P., (1995). “Fracture response of gravity dams due to rise of reservoir elevation”. J. Struct. Eng., 121, 1298-1305.
Blanco, A., de la Fuente, A., Cavalaro, S.H.P. and Aguado, A. (2015). “A century of sand-cement: durability of the concrete in the Camarasa dam”. Accepted in J Perform Constr Fac.
Breysse, D., and Gérard, B. (1997). “Modelling of permeability in cement-based materials: Part 1: Uncracked medium”. Cement Concrete Res., 27(5), 761-775.
Buil, J., Rio, F., Campos, A., López, C. M., and Aguado, A. (2012). “Numerical analysis of Mequinenza dam”. Proc., 24eme Congres des Grands Barrages. Commission Internationale des Grands Barrages. Kyoto.
Caballero, A., Carol, I., and López, C. M. (2006a). « 3D meso-structural analysis of concrete specimens under uniaxial tension”. Comput. Method Appl. M., 195(52), 7182-7195.
Caballero, A., Carol, I., and López, C. M. (2006b). “3D meso-mechanical analysis of concrete specimens under biaxial loading”. Fatigue Fract. Eng. M., 30(9), 877-886.
Campos, A. (2012). Análisis numérico de presas de hormigón bajo acciones expansivas. Doctoral Thesis, Universidad Politécnica de Catalunya, Barcelona, Spain.
Carol, I., López, C. M., and Roa, O. (2001). “Micromechanical analysis of quasi-brittle materials using fracture interface elements”. Int. J. Numer. Meth. Eng., 52, 193-215.
Carol, I., Prat, P. C., and López, C. M. (1997). “Normal/Shear Cracking Model: Application to Discrete Crack Analysis”. J. Eng. Mech.-ASCE, 123, 765-773.
Cerny, R., and Rovnaníková, P. (2002). Transport processes in concrete. London: Spon Press.
Cervenka, J. (1994). Discrete crack modeling in concrete tructures. Doctoral Thesis, University of Colorado, Boulder, Colorado, USA.
Cervera, M., Oliver, J., and Galindo, M. (1990). Simulación numérica de patologias en presas de hormigón (Monograph 4), Barcelona, CIMNE.
Chinchón, J.S., Ayora, C., Aguado, A. and Guirado, F. (1995). “Influence of Weathering of Iron Sulphides Contained in Aggregates on Concrete. Durability”. Cement Concrete Res., 25(5), 1264-1272.
Chinchón-Payá, S., Aguado, A., Coloma F. and Chinchón, J.S. (2015). “Study of aggregate samples with iron sulphides trough micro X-Ray Fluorescence (µXRF) and X-ray Photoelectron Spectroscopy (XPS)”. Mater. Struct., 48(5), 1285-1290.
CIMNE. (2014). GiD The personal pre and postprocessor. Version 11.0. User Manual. International Center For Numerical Methods in Engineering (CIMNE).
El-Dieb, A. S., and Hooton, R. D. (1995). “Water-permeability measurement of high performace concrete using a high-pressure triaxial cell”. Cement Concrete Res., 25(6), 1199-1208.
Elices, M., Llorca, J., and Ingraffea, A. R. (1985). “Fractura del hormigón en régimen elástico y lineal. Un ejemplo: La presa de Fontana”. Informes de la Construcción, 37, 19-33.
Fernández Cánovas, M. (1980). “Entumecimiento higrométrico del hormigón”. Mater. Construcc., 383, 27-41.
Hillerborg, A., Modeer, M., Petersson, P., and Needleman, A. (1976). “Analysis of crack formation and crack growth in concrete by means of fracture mechanics and finite elements”. Cement Concrete Res., 6, 773-782.
Hobbs, D. W. (1988). Alkali-silica reaction in concrete. Michigan: Telford.
Hohberg, J. (1992). A joint element for the nonlinear dynamic analysis of arch dams. Technical Report 186. ETH Zurich, Suiza, Institute of Structural Engeneering.
Idiart, A. E., López, C. M., and Carol, I. (2011a). “Modeling of drying shrinkage of concrete specimens at the meso-level”. Mater. Struct., 44(2), 415-435.
Idiart, A. E., López, C. M., and Carol, I. (2011b). “Chemo-mechanical analysis of concrete cracking and degradation due to external sulfate attack: A meso-scale model”. Cement Concrete Comp., 33(2), 411-423.
Ikumi, T., Segura, I., Cavalaro, S.H.P. and Aguado, A. (2014). “External sulfate attack: Porosimetry and damage based mode”. Cement Concrete Res., 63(8), 105-116.
Linsbauer, H. N., Ingraffea, A. R., Rossmanith, H. P. and Wawrzynek, A. (1989). “Simulation of cracking in large arch dam: Part I”. J. Struct. Eng., 115, 1599-1615.
López, C. M., Carol, I., and Aguado, A. (2008a). “Meso-structural study of concree fracture using interface elements. I: numerical model and tensile behavior”. Mater. Struct., 41, 583-599.
López, C. M., Carol, I., and Aguado, A. (2008b). “Meso-structural study of concrete fracture using interface elements. II: compression, biaxial and Brasilian test”. Mater. Struct., 41, 601-620.
Mehta, P. K., and Monteiro, P. J. (2006). Concrete Microstructure, properties, and materials (3 ed.). New York: McGraw-Hill.
Neville, A. (2004). “The confused world of sulfate attack on concrete”. Cement Concrete Res., 34(8), 1275-1296.
Oliveira, I., Cavalaro, S.H.P. andAguado, A. (2013a). “New kinetic model to quantify the internal sulfate attack in concrete”. Cement Concrete Res., 43(1), 95-106.
Oliveira, I., Cavalaro, S.H.P. andAguado, A. (2013b). “New unreacted-core model to predict pyrrhotite oxidation in concrete dams”. J. Mater. Civil Eng., 25 (3), 372-381.
Oliveira, I., Cavalaro, S.H.P. and Aguado, A. (2014). “Evolution of pyrrhotite oxidation in aggregates for concrete”. Mater. Construcc., 64 (316).
Regamey, J.M. and Hammerschlag, J.G. (1995). “Barrage d’Illsee—assaintment”. Proc., Research and development in the field of dams, Crans-Montana, Switzerland.
Saouma, V., Perotti, L., and Shimpo, T. (2007). “Stress Analysis of concrete Structures Subjected to Alkali-Aggregate Reactions”. ACI Struct. J., 104(5), 532-541.
Shayan, A. (1988). “Alkali aggregate reaction in a 60-year-old dam in Australia”. International Journal of Cement Composites and Lightweight Concrete, 10(4), 259-266.
Shi, Z., Suzuki, M., Nakano, M., (2003). “Numerical analysis of multiple discrete cracks in concrete dams using extended fictitious crack model”. J. Struct. Eng., 129, 324-336.
Sloan, R. C., and Abraham, T. J. (1978). TVS cuts deep slot in dam, ends cracking problems. Civil Engeneering, 48(1), 66-70.

Stankowski, T., Runesson, K., and Sture, S. (1993). “Fracture and slip of interfaces in cementitious composites. I: Characteritics; II: Implementation”. J. Eng. Mech.-ASCE, 119, 292-327.
Stanton, T. E. (1942). “Expansion of concrete through reaction between cement and aggregate”. Transactions of the American Society of Civil Engeneerings, 107(1), 57-84.
Ulm, F.-J., Coussy, O., Kefei, L., and Larive, C. (2000). “Thermo-Chemo-Mechanics of ASR Expansion in Concrete Structures”. J. Eng. Mech.-ASCE, 126(3), 233-242.
Vallarino, E. (1991). Tratato basico de presas. Madrid: Coleccion Senior.
Vonk, R. (1992). Softening of concrete loaded in compression. Doctoral Thesis, Technische Universiteit Eindhoven, Eindhoven, The Netherlands.