Prediction of Grapevine Yield Based on Reproductive ...
19
agronomy Article Prediction of Grapevine Yield Based on Reproductive Variables and the Influence of Meteorological Conditions Estefanía González-Fernández 1, * , Alba Piña-Rey 1 , María Fernández-González 1,2 , María J. Aira 3 and F. Javier Rodríguez-Rajo 1 1 CITACA, Agri-Food Research and Transfer Cluster, Campus da Auga, University of Vigo, 32004 Ourense, Spain; [email protected] (A.P.-R.); [email protected] (M.F.-G.); [email protected] (F.J.R.-R.) 2 Earth Sciences Institute (ICT), Pole of the Faculty of Sciences, University of Porto, 4169-007 Porto, Portugal 3 Department of Biology University of Santiago de Compostela, 15782 Santiago de Compostela, Spain; [email protected] * Correspondence: [email protected] Received: 20 April 2020; Accepted: 13 May 2020; Published: 16 May 2020 Abstract: Climate has a direct influence on crop development and final yield. The consequences of global climate change have appeared during the last decades, with increasing weather variability in many world regions. One of the derived problems is the maintenance of food supply in this unstable context and the needed changes in agricultural systems, looking for sustainable and adaptation strategies. The study was carried out from 2008 to 2017. Aerobiological data were obtained with a Lanzoni VPPS-2000 volumetric sampler, following the Spanish Aerobiological Network protocol. The pollen and flower production was studied on ten vines of the Godello grapevine cultivar. A HOBO Micro Station and a MeteoGalicia station were used to obtain meteorological information. We observed the detrimental effect of rain on airborne pollen presence, and we statistically corroborated the negative effect of high temperatures on fruit set and ripening. We developed an accurate multiple regression model to forecast the grape yield, applying a Spearman’s correlation test to identify the most influential variables. The use of aerobiological and meteorological studies for crop yield prediction has been widely used in different crops that suppose important engines for economy development. This enables growers to adapt their crop management and adjust the spent resources. Keywords: pollination dynamics; reproductive biology; grapevine; yield forecast; Godello 1. Introduction Aerobiological studies applied on crop yield prediction are becoming a valuable tool for agricultural practices in many crops. The use of pollen information with a forecast purpose has been widely explored for olive crops in the Mediterranean region [1–3], as well as for other important crops in this bioclimatic region, such as almond and grapevine [4,5]. Usually, climatological information is considered for aerobiological analyses because of their influence on aerobiological processes, such as pollen release or dispersion, and crop development. Meteorological factors exert a direct effect on the onset and duration of the phenological stages, acting as one of the main inputs that plants need to complete their vegetative-productive cycle [6]. Climatic conditions have a marked influence on grape and wine production, as factors such as temperature, light and humidity affect vegetal growth and development [7,8]. Combined with the edaphic elements (as soil water reserve or effective soil depth), these environmental components are considered the most important factors to define the winegrowing and production suitability of a region [9]. Furthermore, adverse weather conditions such as hailstorms may reduce grape yield by damaging flowers and fruits, affecting the total leaf area and the phenolic profile of berries at Agronomy 2020, 10, 714; doi:10.3390/agronomy10050714 www.mdpi.com/journal/agronomy
Transcript of Prediction of Grapevine Yield Based on Reproductive ...
agronomy
Article
Prediction of Grapevine Yield Based on ReproductiveVariables and the Influence of Meteorological Conditions
Estefanía González-Fernández 1,* , Alba Piña-Rey 1 , María Fernández-González 1,2 ,María J. Aira 3 and F. Javier Rodríguez-Rajo 1
1 CITACA, Agri-Food Research and Transfer Cluster, Campus da Auga, University of Vigo,32004 Ourense, Spain; [email protected] (A.P.-R.); [email protected] (M.F.-G.); [email protected] (F.J.R.-R.)
2 Earth Sciences Institute (ICT), Pole of the Faculty of Sciences, University of Porto, 4169-007 Porto, Portugal3 Department of Biology University of Santiago de Compostela, 15782 Santiago de Compostela, Spain;
[email protected]* Correspondence: [email protected]
Received: 20 April 2020; Accepted: 13 May 2020; Published: 16 May 2020�����������������
Abstract: Climate has a direct influence on crop development and final yield. The consequences ofglobal climate change have appeared during the last decades, with increasing weather variability inmany world regions. One of the derived problems is the maintenance of food supply in this unstablecontext and the needed changes in agricultural systems, looking for sustainable and adaptationstrategies. The study was carried out from 2008 to 2017. Aerobiological data were obtained witha Lanzoni VPPS-2000 volumetric sampler, following the Spanish Aerobiological Network protocol.The pollen and flower production was studied on ten vines of the Godello grapevine cultivar. A HOBOMicro Station and a MeteoGalicia station were used to obtain meteorological information. We observedthe detrimental effect of rain on airborne pollen presence, and we statistically corroborated the negativeeffect of high temperatures on fruit set and ripening. We developed an accurate multiple regressionmodel to forecast the grape yield, applying a Spearman’s correlation test to identify the most influentialvariables. The use of aerobiological and meteorological studies for crop yield prediction has beenwidely used in different crops that suppose important engines for economy development. This enablesgrowers to adapt their crop management and adjust the spent resources.
Keywords: pollination dynamics; reproductive biology; grapevine; yield forecast; Godello
1. Introduction
Aerobiological studies applied on crop yield prediction are becoming a valuable tool for agriculturalpractices in many crops. The use of pollen information with a forecast purpose has been widelyexplored for olive crops in the Mediterranean region [1–3], as well as for other important crops inthis bioclimatic region, such as almond and grapevine [4,5]. Usually, climatological information isconsidered for aerobiological analyses because of their influence on aerobiological processes, such aspollen release or dispersion, and crop development. Meteorological factors exert a direct effect on theonset and duration of the phenological stages, acting as one of the main inputs that plants need tocomplete their vegetative-productive cycle [6].
Climatic conditions have a marked influence on grape and wine production, as factors such astemperature, light and humidity affect vegetal growth and development [7,8]. Combined with theedaphic elements (as soil water reserve or effective soil depth), these environmental componentsare considered the most important factors to define the winegrowing and production suitability ofa region [9]. Furthermore, adverse weather conditions such as hailstorms may reduce grape yieldby damaging flowers and fruits, affecting the total leaf area and the phenolic profile of berries at
Agronomy 2020, 10, 714; doi:10.3390/agronomy10050714 www.mdpi.com/journal/agronomy
Agronomy 2020, 10, 714 2 of 19
harvest [10]. Hail damage on grapevine yield increased across the European winegrowing regionsdue to climate change impacts [11]. Rainfalls wash pollen grains from the atmosphere or the stigmasurface, which leads to a loss of fertilisation efficiency and a decrease in fecundated flowers [12].
Climate change has important consequences on biodiversity and ecosystem functioning. There arebeing registered many climate shifts in different world regions, such as the contraction of polar climatezones and the expansion of arid ones. This is the result of changes in intensity and frequency of extremeweather phenomena, such as extreme temperature events [13]. The intensity, frequency and durationof heat waves are projected to increase during the 21st century, as well as the frequency and intensityof droughts, which are projected to increase, particularly in the Mediterranean region and SouthernAfrica [14]. Studies conducted by [15] had confirmed that recent observed changes along Europeanviticultural regions followed the climate change predictions, especially for the Iberian Peninsula, wherea high increase of drought risk was detected. At a long-term scale, weather factors such as late springfrost in a warmer climate are expected to reshape the grapevine cultivars distribution in Europe [16].Nevertheless, other studies suggested the increase of agrobiodiversity as an effective buffer of climatechange effects on winegrape crop, using more climatically suitable cultivars for the climate warming.The authors of [17] found drastic reductions in winegrowing losses under warming scenarios withcultivar diversity.
Another important point to consider for a crop production study are the physiological andmorphological characteristics influenced by environmental conditions but deeply related to geneticload and expression. Flower formation and development in grapevines are highly influenced byenvironmental, genetic and cultural factors, which contribute to its variability [18].
The aim of the present study was to develop a prediction model to forecast the grape production forthe Godello cultivar, one of the four autochthonous dominant white varieties in the Ribeiro DesignationOrigin area, which represent an important percentage of the Northwest Spain total production [19].Aerobiological and meteorological variables, combined with pollen, flowers and grape production data,were considered to achieve an accurate prediction model for the final grape production as well as toassess the climatic influence on vegetal growth and the main detrimental factors affecting the consideredcultivar. The development of this kind of model makes possible an adjusted crop yield predictionsome months in advance, enhancing possible fraud detection due to the introduction of foreign grapeby the establishment of a preliminary grape weight value prior to the official measure of the allowedgrape varieties produced by the wineries covered by a Designation of Origin, the optimisation of thecultural and post-harvest tasks or the crop insurance hiring. Additionally, this information could beused to know the adaptation of the cultivars to the changing environmental conditions.
2. Material and Methods
2.1. Temporal and Geographic Delimitation
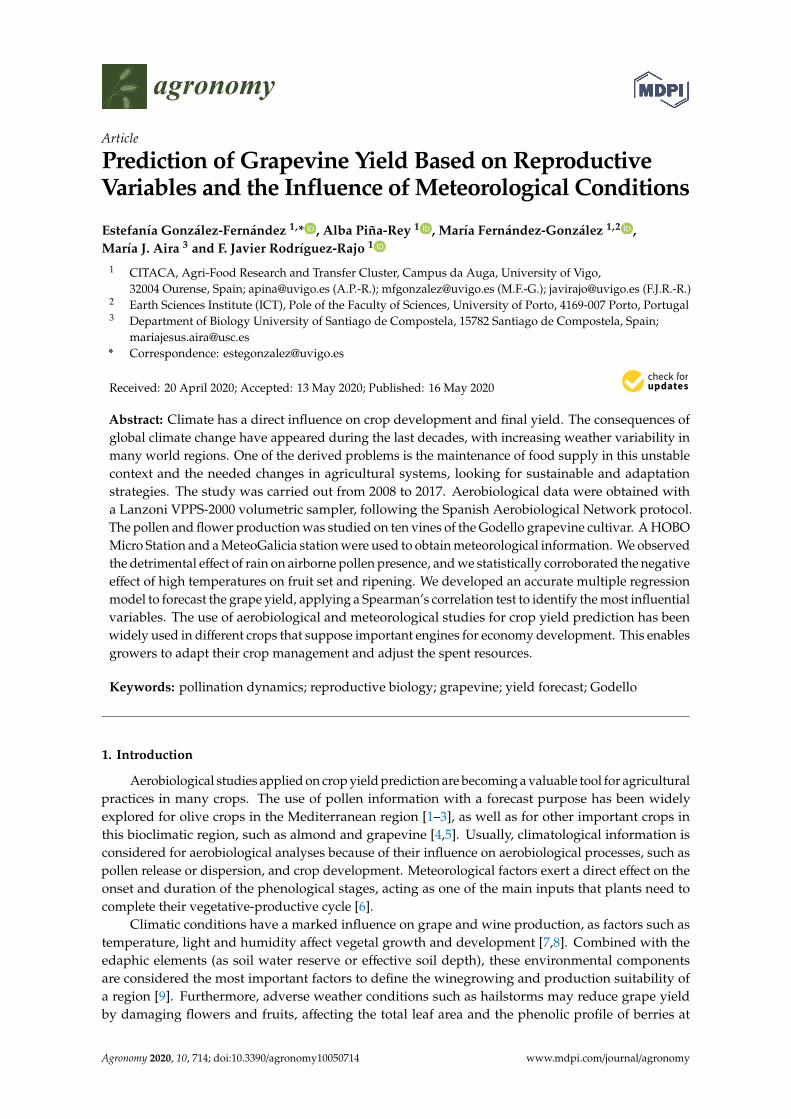
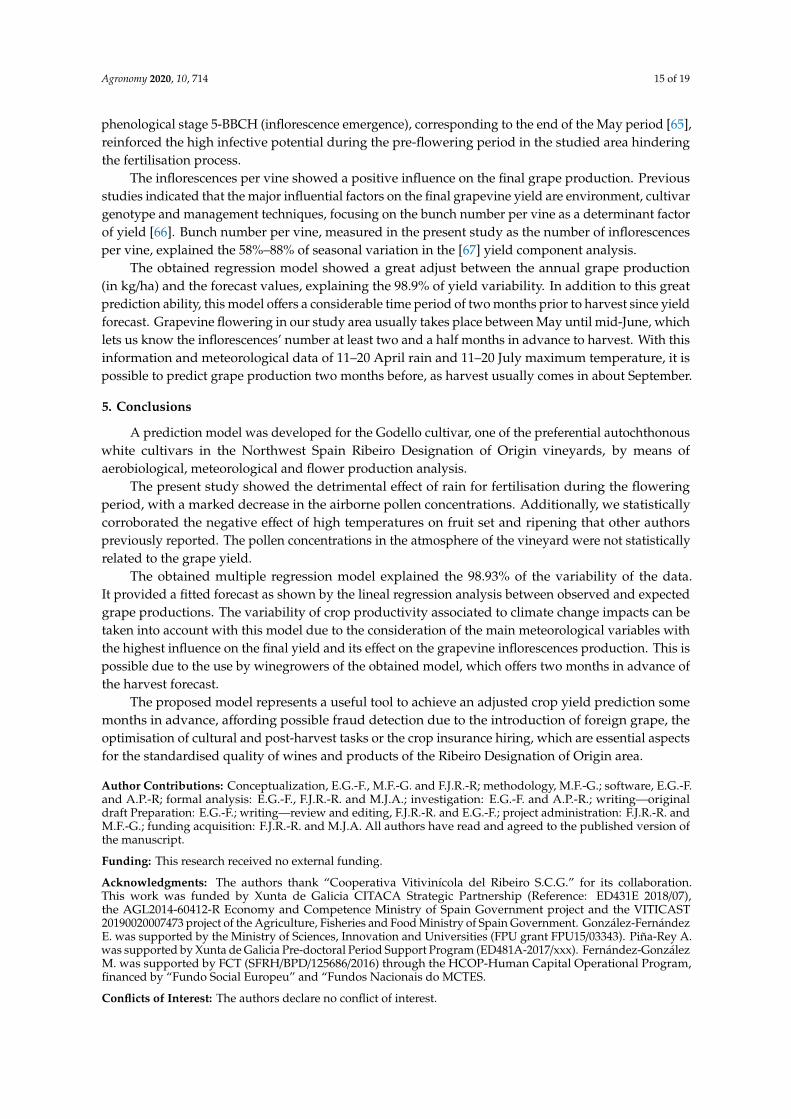
The study was conducted from 2008 to 2017 in a vineyard located in Cenlle (Ourense) in NorthwestSpain, which belongs to the Ribeiro Designation of Origin that actually covers a total area of 2250 ha(Figure 1). This winemaking region, watered by the Minho river, is defined as temperate andwarm, sub-humid and with very cold nights according to the Multicriteria Climatic ClassificationSystem (MCC) [19]. Natural barriers that protect this territory from sub-Atlantic storms and itssouthern situation in Galicia favour the Oceanic-Mediterranean transitional climate of this region,with warm temperatures and considerable precipitation. Steep valleys and hillsides characterise thegeomorphological structure of this area, with soils that have a granitic origin with a significant contentof stones and gravel [20].
Agronomy 2020, 10, 714 3 of 19Agronomy 2020, 10, 714 3 of 19
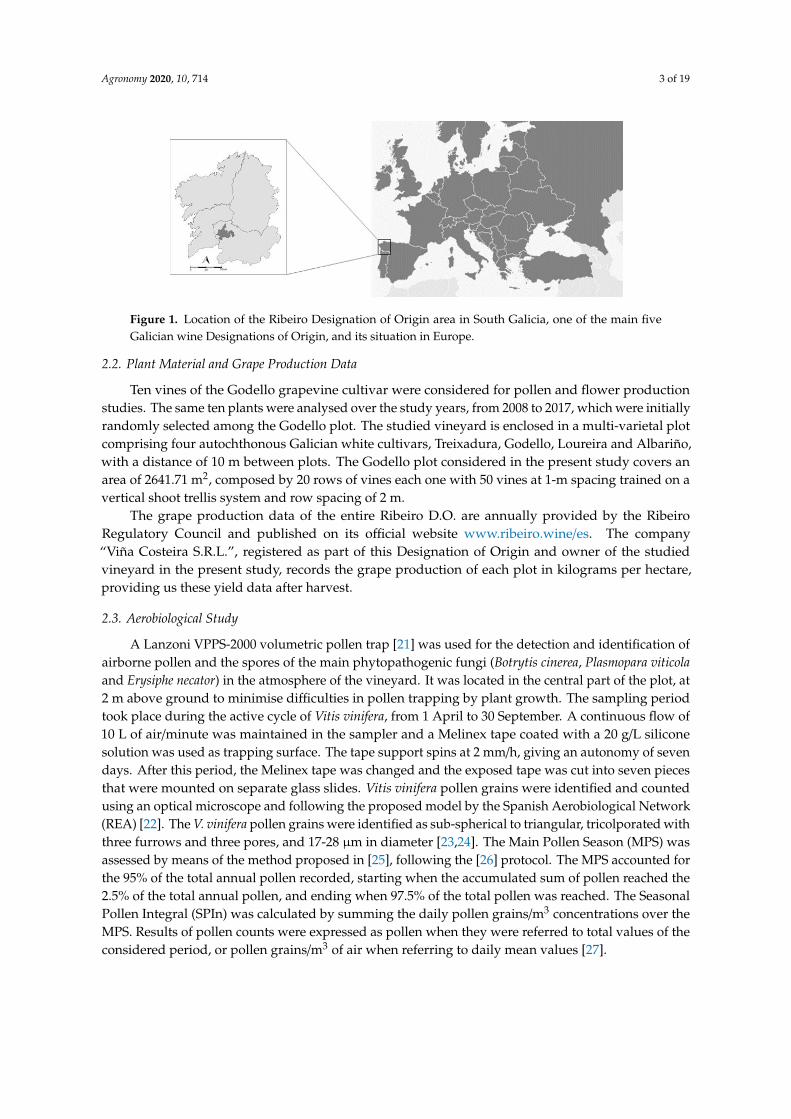
Figure 1. Location of the Ribeiro Designation of Origin area in South Galicia, one of the main five Galician wine Designations of Origin, and its situation in Europe.
2.1. Plant Material and Grape Production Data
Ten vines of the Godello grapevine cultivar were considered for pollen and flower production studies. The same ten plants were analysed over the study years, from 2008 to 2017, which were initially randomly selected among the Godello plot. The studied vineyard is enclosed in a multi-varietal plot comprising four autochthonous Galician white cultivars, Treixadura, Godello, Loureira and Albariño, with a distance of 10 m between plots. The Godello plot considered in the present study covers an area of 2641.71 m2, composed by 20 rows of vines each one with 50 vines at 1-m spacing trained on a vertical shoot trellis system and row spacing of 2 m.
The grape production data of the entire Ribeiro D.O. are annually provided by the Ribeiro Regulatory Council and published on its official website www.ribeiro.wine/es. The company “Viña Costeira S.R.L.”, registered as part of this Designation of Origin and owner of the studied vineyard in the present study, records the grape production of each plot in kilograms per hectare, providing us these yield data after harvest.
2.3. Aerobiological Study
A Lanzoni VPPS-2000 volumetric pollen trap [21] was used for the detection and identification of airborne pollen and the spores of the main phytopathogenic fungi (Botrytis cinerea, Plasmopara viticola and Erysiphe necator) in the atmosphere of the vineyard. It was located in the central part of the plot, at 2 m above ground to minimise difficulties in pollen trapping by plant growth. The sampling period took place during the active cycle of Vitis vinifera, from 1 April to 30 September. A continuous flow of 10 litres of air/minute was maintained in the sampler and a Melinex tape coated with a 20 g/litre silicone solution was used as trapping surface. The tape support spins at 2 mm/hour, giving an autonomy of seven days. After this period, the Melinex tape was changed and the exposed tape was cut into seven pieces that were mounted on separate glass slides. Vitis vinifera pollen grains were identified and counted using an optical microscope and following the proposed model by the Spanish Aerobiological Network (REA) [22]. The V. vinifera pollen grains were identified as sub-spherical to triangular, tricolporated with three furrows and three pores, and 17-28 μm in diameter [23,24]. The Main Pollen Season (MPS) was assessed by means of the method proposed in [25], following the [26] protocol. The MPS accounted for the 95% of the total annual pollen recorded, starting when the accumulated sum of pollen reached the 2.5% of the total annual pollen, and ending when 97.5% of the total pollen was reached. The Seasonal Pollen Integral (SPIn) was calculated by summing the daily pollen grains/m3 concentrations over the MPS. Results of pollen counts were expressed as pollen when they were referred to total values of the considered period, or pollen grains/m3 of air when referring to daily mean values [27].
2.4. Pollen and Flower Production Study
Figure 1. Location of the Ribeiro Designation of Origin area in South Galicia, one of the main fiveGalician wine Designations of Origin, and its situation in Europe.
2.2. Plant Material and Grape Production Data
Ten vines of the Godello grapevine cultivar were considered for pollen and flower productionstudies. The same ten plants were analysed over the study years, from 2008 to 2017, which were initiallyrandomly selected among the Godello plot. The studied vineyard is enclosed in a multi-varietal plotcomprising four autochthonous Galician white cultivars, Treixadura, Godello, Loureira and Albariño,with a distance of 10 m between plots. The Godello plot considered in the present study covers anarea of 2641.71 m2, composed by 20 rows of vines each one with 50 vines at 1-m spacing trained on avertical shoot trellis system and row spacing of 2 m.
The grape production data of the entire Ribeiro D.O. are annually provided by the RibeiroRegulatory Council and published on its official website www.ribeiro.wine/es. The company“Viña Costeira S.R.L.”, registered as part of this Designation of Origin and owner of the studiedvineyard in the present study, records the grape production of each plot in kilograms per hectare,providing us these yield data after harvest.
2.3. Aerobiological Study
A Lanzoni VPPS-2000 volumetric pollen trap [21] was used for the detection and identification ofairborne pollen and the spores of the main phytopathogenic fungi (Botrytis cinerea, Plasmopara viticolaand Erysiphe necator) in the atmosphere of the vineyard. It was located in the central part of the plot, at2 m above ground to minimise difficulties in pollen trapping by plant growth. The sampling periodtook place during the active cycle of Vitis vinifera, from 1 April to 30 September. A continuous flow of10 L of air/minute was maintained in the sampler and a Melinex tape coated with a 20 g/L siliconesolution was used as trapping surface. The tape support spins at 2 mm/h, giving an autonomy of sevendays. After this period, the Melinex tape was changed and the exposed tape was cut into seven piecesthat were mounted on separate glass slides. Vitis vinifera pollen grains were identified and countedusing an optical microscope and following the proposed model by the Spanish Aerobiological Network(REA) [22]. The V. vinifera pollen grains were identified as sub-spherical to triangular, tricolporated withthree furrows and three pores, and 17-28 µm in diameter [23,24]. The Main Pollen Season (MPS) wasassessed by means of the method proposed in [25], following the [26] protocol. The MPS accounted forthe 95% of the total annual pollen recorded, starting when the accumulated sum of pollen reached the2.5% of the total annual pollen, and ending when 97.5% of the total pollen was reached. The SeasonalPollen Integral (SPIn) was calculated by summing the daily pollen grains/m3 concentrations over theMPS. Results of pollen counts were expressed as pollen when they were referred to total values of theconsidered period, or pollen grains/m3 of air when referring to daily mean values [27].
Agronomy 2020, 10, 714 4 of 19
2.4. Pollen and Flower Production Study
Pollen and flower production was studied on 10 selected vines of the Godello cultivar maintainedover the studied years. Each annual value corresponded to the average value of the 10 considered plantsfor the different variables. The number of inflorescences, tertiary branches (third order ramificationin the inflorescence) and flowers per plant were estimated in the phenological phase BBCH-57 [28],corresponding to inflorescences fully developed, with flowers separating. To estimate the number offlowers per vine, we observed that 25 flowers composed a tertiary branch as a mean value, obtainedfrom the flower count of one inflorescence on each one of the ten selected vines. To assess the numberof anthers per flower, we observed in all collected flower samples that the Vitis vinifera androecium ofthe Godello cultivar is comprised of five stamens, each one with a bilocular anther, which coincidedwith previous descriptions of the Vitis vinifera floral biology and morphology [18].
The number of pollen grains per anther was calculated following the volumetric method describedin [29]. Anthers were collected from grapevine flowers near to anthesis, in the BBCH-57 stage. Eachanther was placed in 0.5 mL of ethanol 70% (v/v) with two drops of 1% basic fuchsin for pollen grainsstaining. The sample was crushed in the tube and vortexed to its homogenisation. A volume of 10 µLof this dilution was transferred to a slide for microscope analysis and total pollen grains were countedwith an optical microscope NIKON ECLIPSE E100 at 400×magnification. A total of 27 anthers wereanalysed corresponding to three inflorescences of each vine, selecting three flowers per bunch andthree anthers per flower. Three replicates were analysed for each sample. The number of pollen grainsper anther was obtained by extrapolation to the total dilution volume.
We calculated the pollen grains per vine considering the number of pollen grains per anther, theconstants of 5 anthers per flower and 25 flowers per tertiary branch, the number of tertiary branchesper inflorescence and the number of inflorescence. With all this information, it is possible to know thenumber of pollen grains per flower and flowers per vine, which defines the number of pollen grainsper vine.
2.5. Meteorological Data
Meteorological information was obtained from a HOBO Micro Station data logger, located at thecentral part of the cultivar Godello plot and in the same bracket than the aerobiological trap, at 0.75 mabove ground level. The monitored daily parameters with this station were maximum temperature,average temperature and minimum temperature. Information about the precipitation was obtainedfrom the Galician Institute for Meteorology and Oceanography METEOGALICIA station in Leiro(at 5 km from the studied vineyard). Based on these daily data, an average of 10 days, 15 days andone month periods were calculated for each temperature parameters from 1 April to 30 September foreach studied year, from 2008 to 2017. The rainfall values were obtained from the sum of rainfall dailyvalues during 10 days, 15 days and one month periods from 1st April to 30th September, from 2008 to2017. Each one of the considered variables for statistical analysis were formed by the correspondingten-days, fifteen-days and monthly periods over the studied years.
2.6. Statistical Analysis
A Spearman’s correlation test was applied to determine the influence of meteorological conditions,pollen and flowers production parameters on grape production using the 2008–2016 data set. We appliedthis non-parametric statistical analysis due to the non-normal distribution of data. Significance wascalculated for p ≤ 0.01 and p ≤ 0.05. In order to detect possible redundant correlation among thevariables and prevent its use for model development, we calculated correlation matrix in six blocks formeteorological variables, considering the ten-days, fifteen-days and monthly periods, and a separatedblock for pollen and flower production variables. We used the R software version 3.5.3 [30] for thispurpose, with the ‘corrplot’ 0.84 package for graphs generation [31].
Agronomy 2020, 10, 714 5 of 19
Based on the correlation results, we developed a multiple regression model to forecast thefinal grape production considering the 2008–2016 data set. The 2017 data were used for modelvalidation. Pollen and morphological production variables were considered as discrete variables:inflorescences/vine, tertiary branches/vine, flowers/vine, pollen/anther, pollen/vine and the total sumof pollen grains/m3 of air over the season (SPIn). The accuracy of the obtained model was assessedby means of a lineal regression analysis between the observed grape production and the expectedgrape production values obtained by the model, and a Leave-One-Out Cross Validation (LOOCV)to determine the forecast reliability by the iterative prediction of each observation by means of allsurrounding data as training data set [32]. The 2008–2016 data set was used as a training set in orderto calculate the training error rate as the Root Mean Square Error (RMSE) of the LOOCV iterations.The standard deviation was calculated in order to estimate the error magnitude. The 2017 yearwas used to describe the test error rate since it was not included for model development, with theapplication of a t-test for dependent samples for the evaluation of significant statistical differencesbetween real and forecast grape production in 2017. We used the IBM SPSS Statistics 25 software forthese statistical analyses.
3. Results
3.1. Aerobiological Analysis
Vitis vinifera L. Godello main pollen seasons were monitored between 2008 and 2017 from themiddle of May to the end of June (Table 1). This period, which identifies the main pollen presence inthe atmosphere, varied between the considered seasons, with a mean duration of 19 days and rangingfrom 15 to 27 days (in 2011 and 2012, respectively). The mean start date for the MPS was on 29 Mayand the mean end date on 16 June. In both cases, there is a month gap between the earliest and latestdates for starting and ending MPS among the considered years. The latest dates for the start and theend dates were detected in 2013, on 14 June for the start and 30 June for the end. The earliest dates forthe MPS start and end also coincided in the same year, in 2011, with the beginning on 14 May andthe end on 28 May. The 2011 season was additionally the year with the shortest MPS duration with15 days (Table 1).
The earliest peak date of airborne pollen concentrations was recorded on 23 May 2011, whilethe latest was registered on 23 June 2013. This monthly deviation among the studied years for thepeak date indicates a marked year-to-year difference on the pollination season. The maximum peakvalue of daily pollen concentration was registered in 2011 with 64 pollen grains/m3, which coincidedwith the earliest peak date among the studied years. On the other hand, the minimum daily pollenconcentration was registered in 2008 with 7 pollen grains/m3 (Table 1).
Table 1. Total pollen (SPIn), Main Pollen Season start, end and duration, and seasonal peak values foreach considered year.
YearSPIn
(Total Pollen)
Main Pollen Season (MPS) Seasonal Peak
StartDate
EndDate
Duration(Days) Peak Date Peak Value
(Pollen Grains/m3)
2008 84 8-June 27-June 20 12,13,14,20-June 72009 222 30-May 17-June 19 1-June 342010 225 29-May 21-June 24 7-June 342011 226 14-May 28-May 15 23-May 642012 142 29-May 24-June 27 6-June 172013 336 14-June 30-June 17 23-June 482014 224 29-May 13-June 16 6-June 562015 94 24-May 10-June 18 29-May 282016 293 6-June 24-June 19 21-June 422017 282 15-May 1-June 18 24-May 49
Agronomy 2020, 10, 714 6 of 19
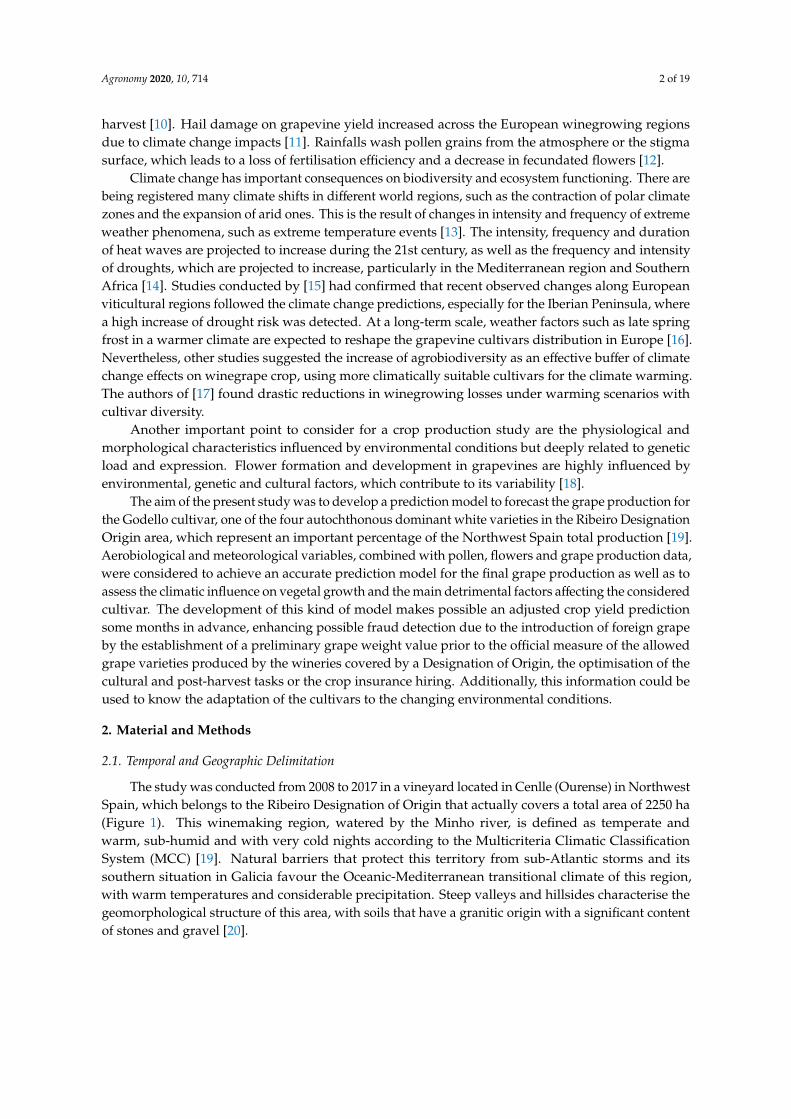
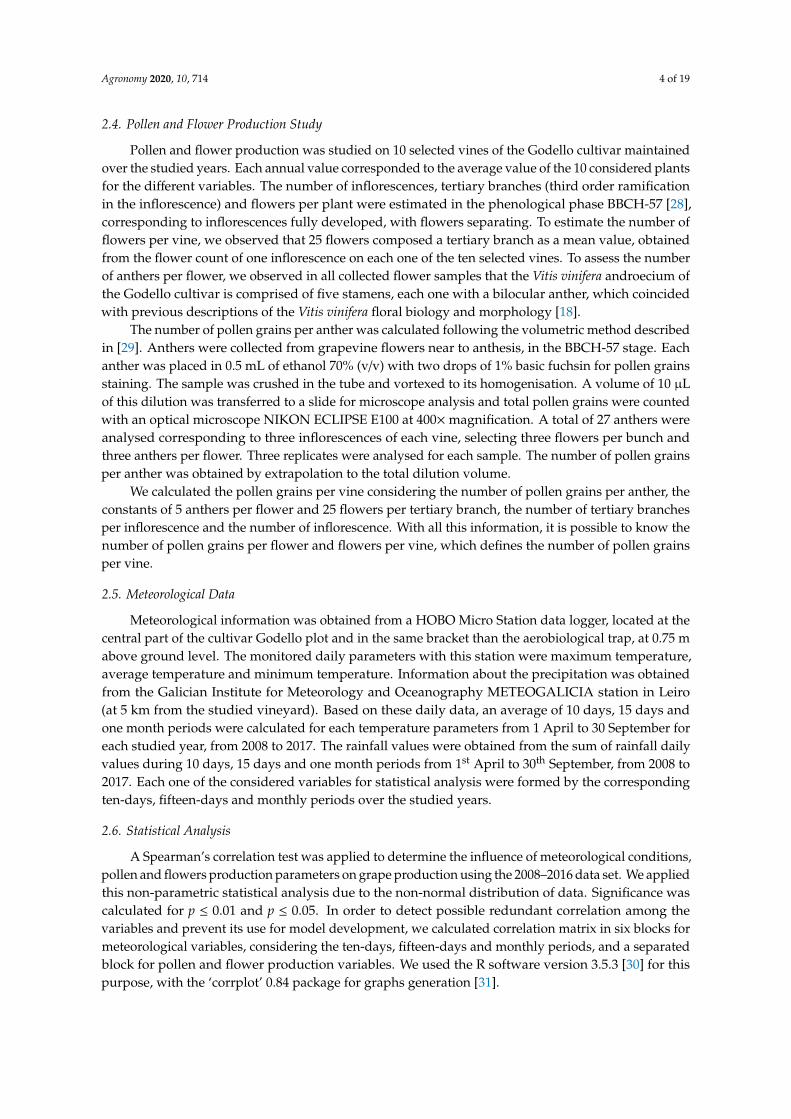
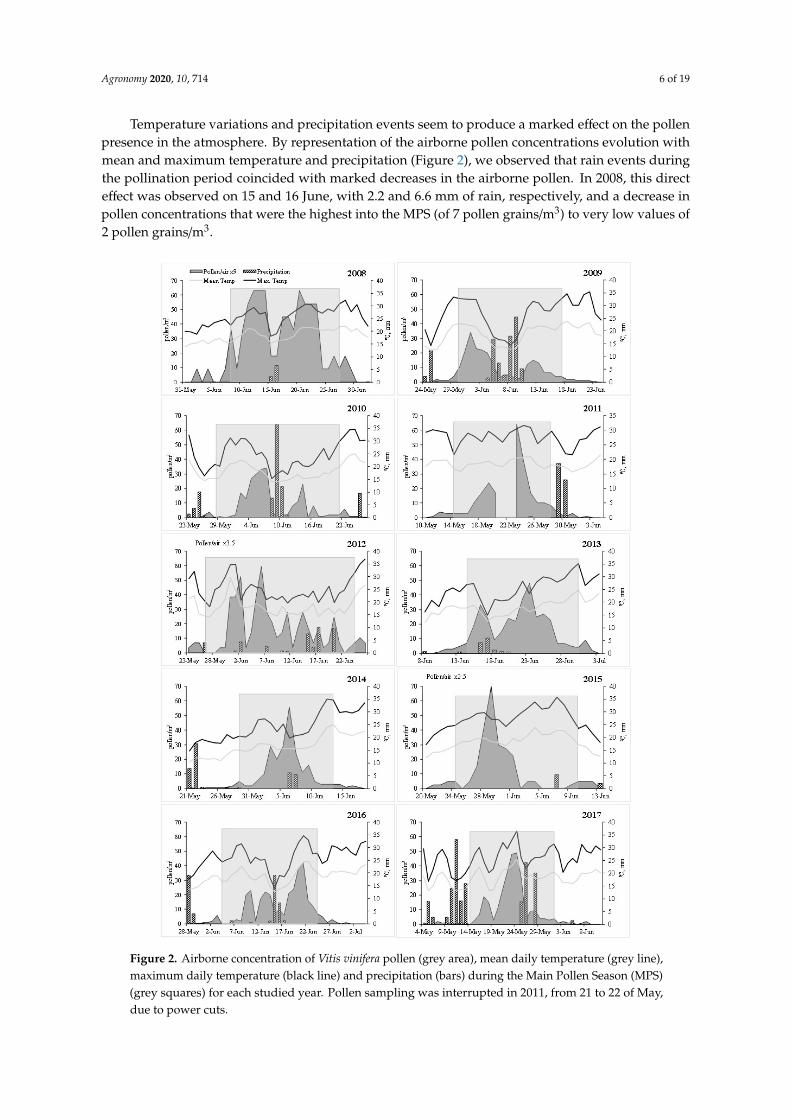
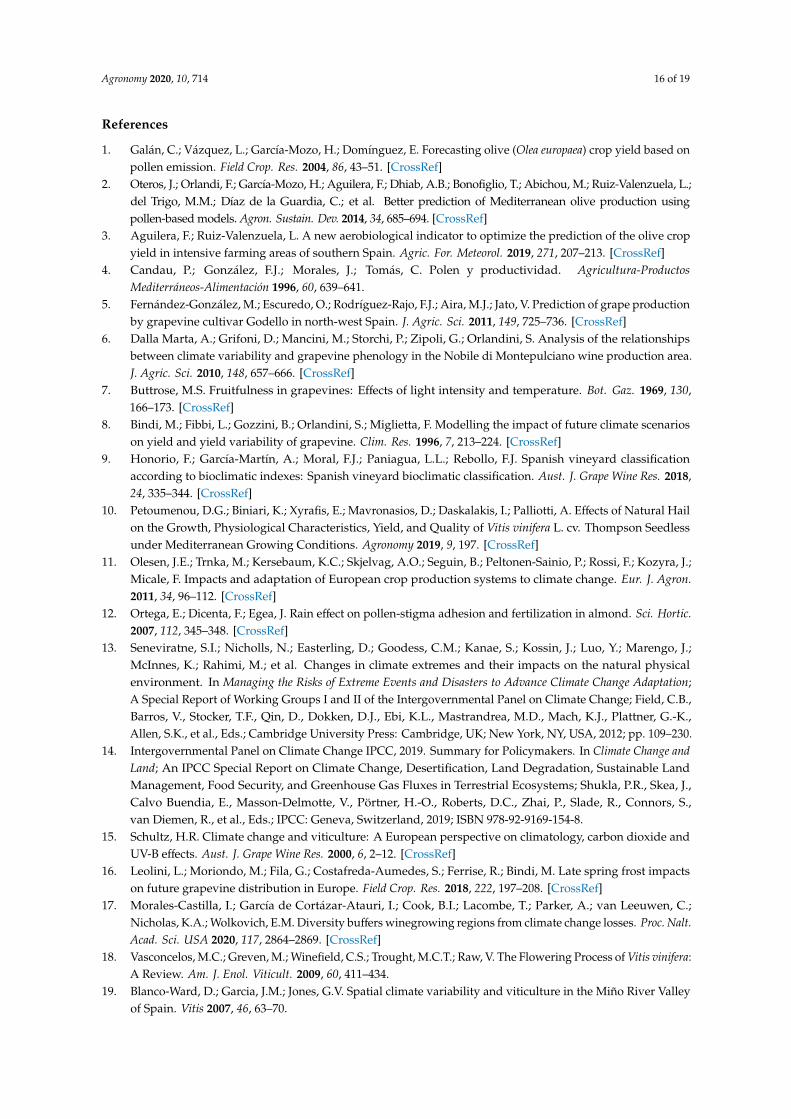
Temperature variations and precipitation events seem to produce a marked effect on the pollenpresence in the atmosphere. By representation of the airborne pollen concentrations evolution withmean and maximum temperature and precipitation (Figure 2), we observed that rain events duringthe pollination period coincided with marked decreases in the airborne pollen. In 2008, this directeffect was observed on 15 and 16 June, with 2.2 and 6.6 mm of rain, respectively, and a decrease inpollen concentrations that were the highest into the MPS (of 7 pollen grains/m3) to very low values of2 pollen grains/m3.
Agronomy 2020, 10, 714 7 of 19
Figure 2. Airborne concentration of Vitis vinifera pollen (grey area), mean daily temperature (grey line), maximum daily temperature (black line) and precipitation (bars) during the Main Pollen Season (MPS) (grey squares) for each studied year. Pollen sampling was interrupted in 2011, from 21 to 22 of May, due to power cuts.
3.2. Pollen and Flower Production
Figure 2. Airborne concentration of Vitis vinifera pollen (grey area), mean daily temperature (grey line),maximum daily temperature (black line) and precipitation (bars) during the Main Pollen Season (MPS)(grey squares) for each studied year. Pollen sampling was interrupted in 2011, from 21 to 22 of May,due to power cuts.
Agronomy 2020, 10, 714 7 of 19
In 2009 this detrimental effect was observed in the middle of the MPS, with a period of rain inconsecutive days from 4 to 10 June and much rain accumulated on 5 June (16.8 mm), 8 June (18 mm)and 9 June (25.6 mm). The continuous rain period made the airborne pollen concentrations descend,which previously were the maximum MPS values, containing the seasonal peak of 34 pollen grains/m3
on first June.During this precipitation period, the pollen concentrations went down to a range of 2–5 pollen
grains/m3 for the 6–10 June period. The same situation was observed in 2010 and 2016, with heavyrain events that promoted a marked decrease in airborne pollen concentrations.
In the 2012 MPS, the airborne pollen records were irregular and oscillating. Pollen concentrationswere not very high in this year and rain was widely distributed over the entire MPS, with severalevents on 1–3 June (0.8, 4.2, 0.2 mm, respectively), 7–8 June (2.6 and 0.2 mm), 10–13 June (0.8, 0.6,0.4 and 0.2 mm), 15–17 June (7.4, 2.2 and 10 mm) and 20–21 June (9.8 and 0.4 mm). This descendon the pollen concentrations promoted by rain was also observed in 2017, where the occurrence ofrain on 25 May, 26 May and 28 May (8.8, 24.2 and 20 mm, respectively), just after the seasonal pollenpeak, of 49 pollen grains/m3 on 24 May, promoted a fast decrease in the airborne pollen concentration.Moreover, temperature dropped during the precipitation events, which has an added adverse effect onthe atmospheric pollen presence (Figure 2).
Conversely, temperature rises coincided with high airborne pollen concentrations and in manycases with the highest seasonal pollen peak. The beneficial effect of the mean and maximum temperaturerise on the presence of atmospheric pollen was clearly observed in 2008, 2009, 2016 and 2017. In theseyears, the pollen increases seem to adjust with temperature rises (Figure 2). The average of meantemperatures during the MPS of the considered years 2008–2017 was 18.5 ◦C, and the average formaximum temperatures was 26.2 ◦C.
3.2. Pollen and Flower Production
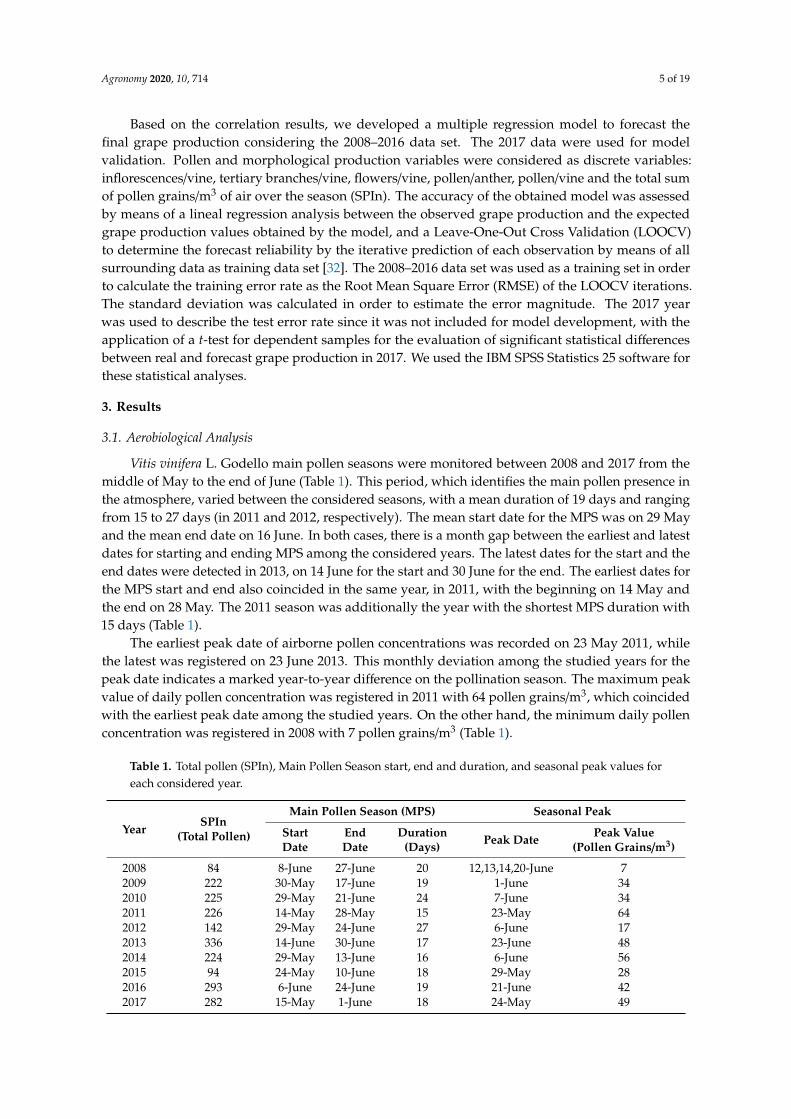
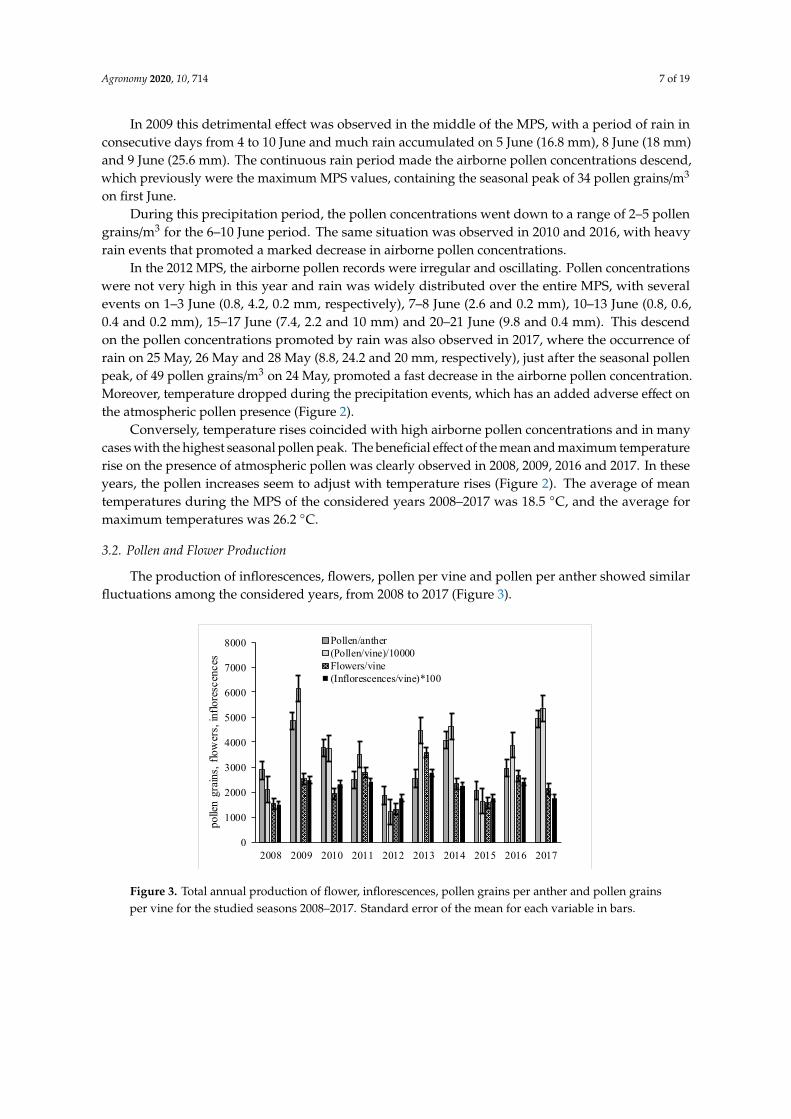
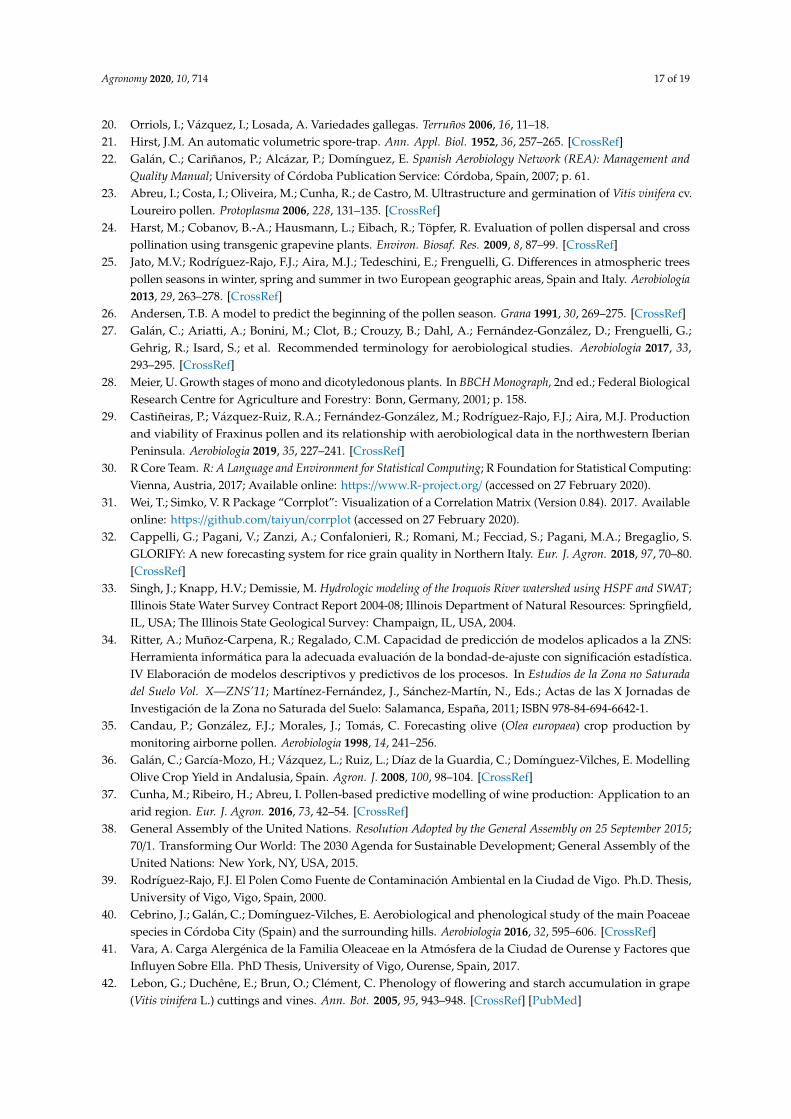
The production of inflorescences, flowers, pollen per vine and pollen per anther showed similarfluctuations among the considered years, from 2008 to 2017 (Figure 3).
Agronomy 2020, 10, 714 8 of 19
The production of inflorescences, flowers, pollen per vine and pollen per anther showed similar fluctuations among the considered years, from 2008 to 2017 (Figure 3).
Figure 3. Total annual production of flower, inflorescences, pollen grains per anther and pollen grains per vine for the studied seasons 2008–2017. Standard error of the mean for each variable in bars.
The flowers per vine, which presented an average value of 2238 flowers/vine for the considered plants among the complete studied period, showed the maximum in 2013 with 3581 flowers/vine and a minimum in 2012 with 1308 flowers/vine. The maximum annual record of flowers/vine coincided with the highest inflorescences´ number that was also registered in 2013 with 28 inflorescences, while the minimum was registered in 2008 with 15 inflorescences. The minimum records of pollen per anther and the pollen per vine coincided in the same year, in 2012, with 1863 pollen grains/anther and 12,138,912 pollen grains/vine, respectively. The maximum record of pollen per anther was obtained in 2017 with 4937 pollen grains/anther, while the maximum record of pollen per vine was registered in 2009 with 61,631,026 pollen grains/vine (Figure 3).
Nevertheless, important differences were found in 2011, 2014 and 2017, showing a dissimilar behaviour on the different pollen-flowers-inflorescences production variables. In 2011, despite the increase of 855 flowers/vine with respect to the previous year, the pollen/anther markedly decreased (from 3780 in 2010 to 2506 pollen/anther) and the pollen/vine had a slight descend (from 37,377,906 in 2010 to 35,083,187 pollen/vine). In 2014, these variables changed inversely, with a notable increase in pollen/anther (from 2546 to 4084 pollen/anther) and a slight increase in pollen/vine respect to the previous year (from 44,739,674 to 46,331,441 pollen/vine), but the number of flowers/vine descended to 1258 flowers with respect to the previous year. In 2017, the pollen/anther and pollen/vine markedly increased, from 2953 in 2016 to 4937 pollen/anther, and 38,773,450 in 2016 to 53,637,941 pollen/vine. Despite this, the number of flowers slightly descended to 504 flowers (Figure 3).
3.3. Statistical Analysis
A Spearman´s correlation test was applied to assess the main weather, pollen and flower production variables that have a significant influence on final grape production.
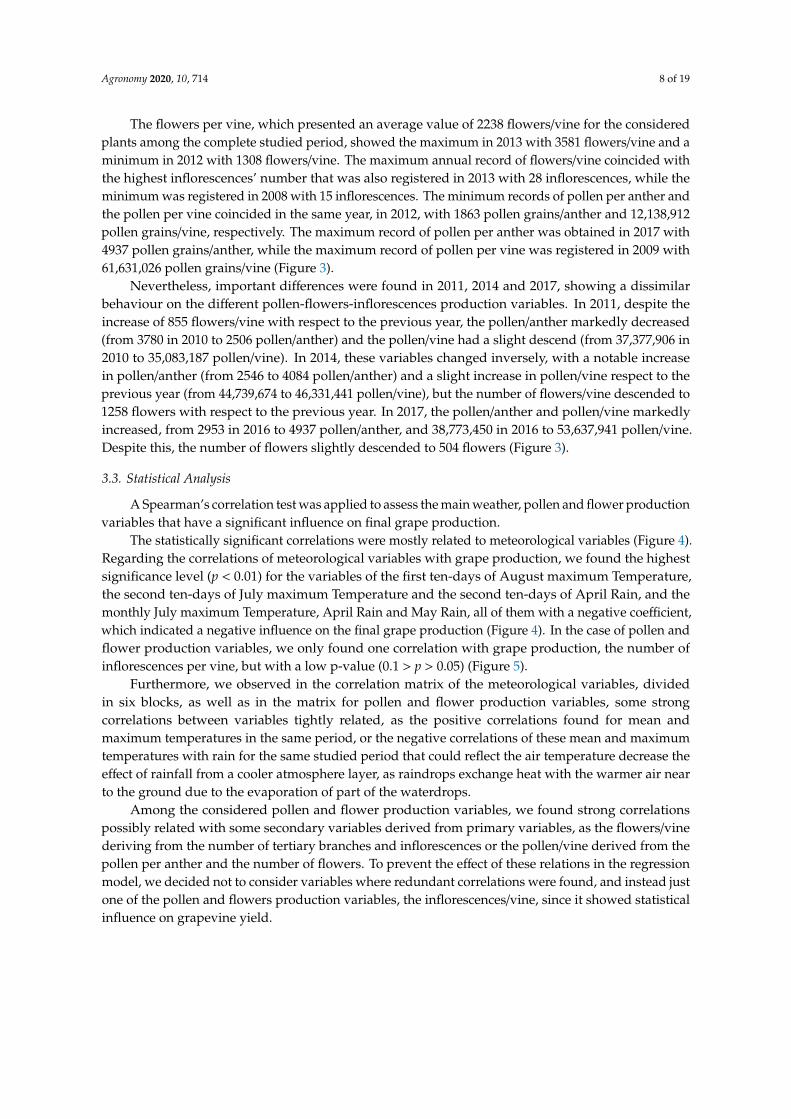
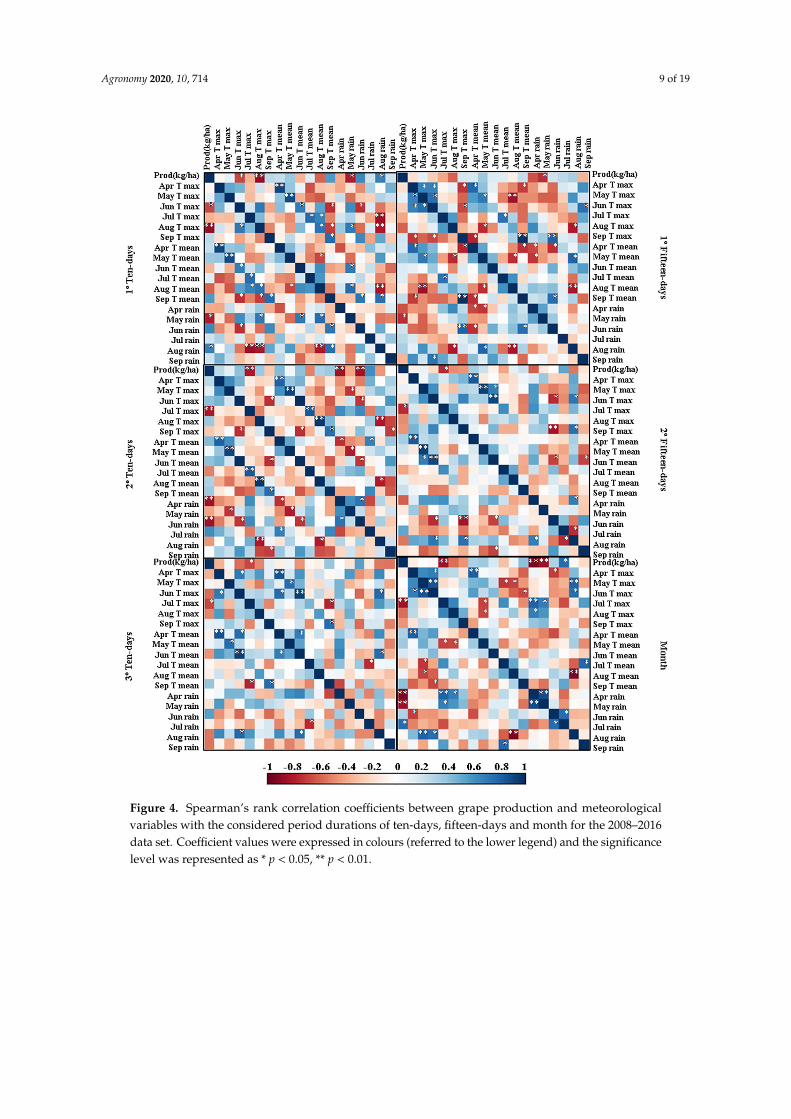
The statistically significant correlations were mostly related to meteorological variables (Figure 4). Regarding the correlations of meteorological variables with grape production, we found the highest significance level (p < 0.01) for the variables of the first ten-days of August maximum Temperature, the second ten-days of July maximum Temperature and the second ten-days of April Rain, and the monthly July maximum Temperature, April Rain and May Rain, all of them with a negative coefficient, which indicated a negative influence on the final grape production (Figure 4). In the case of pollen and flower production variables, we only found one correlation with grape production, the number of inflorescences per vine, but with a low p-value (0.1 > p > 0.05) (Figure 5).
0
1000
2000
3000
4000
5000
6000
7000
8000
2008 2009 2010 2011 2012 2013 2014 2015 2016 2017
polle
n gr
ains,
flow
ers,
inflo
resc
ence
s
Pollen/anther(Pollen/vine)/10000Flowers/vine(Inflorescences/vine)*100
Figure 3. Total annual production of flower, inflorescences, pollen grains per anther and pollen grainsper vine for the studied seasons 2008–2017. Standard error of the mean for each variable in bars.
Agronomy 2020, 10, 714 8 of 19
The flowers per vine, which presented an average value of 2238 flowers/vine for the consideredplants among the complete studied period, showed the maximum in 2013 with 3581 flowers/vine and aminimum in 2012 with 1308 flowers/vine. The maximum annual record of flowers/vine coincided withthe highest inflorescences’ number that was also registered in 2013 with 28 inflorescences, while theminimum was registered in 2008 with 15 inflorescences. The minimum records of pollen per anther andthe pollen per vine coincided in the same year, in 2012, with 1863 pollen grains/anther and 12,138,912pollen grains/vine, respectively. The maximum record of pollen per anther was obtained in 2017 with4937 pollen grains/anther, while the maximum record of pollen per vine was registered in 2009 with61,631,026 pollen grains/vine (Figure 3).
Nevertheless, important differences were found in 2011, 2014 and 2017, showing a dissimilarbehaviour on the different pollen-flowers-inflorescences production variables. In 2011, despite theincrease of 855 flowers/vine with respect to the previous year, the pollen/anther markedly decreased(from 3780 in 2010 to 2506 pollen/anther) and the pollen/vine had a slight descend (from 37,377,906 in2010 to 35,083,187 pollen/vine). In 2014, these variables changed inversely, with a notable increasein pollen/anther (from 2546 to 4084 pollen/anther) and a slight increase in pollen/vine respect to theprevious year (from 44,739,674 to 46,331,441 pollen/vine), but the number of flowers/vine descended to1258 flowers with respect to the previous year. In 2017, the pollen/anther and pollen/vine markedlyincreased, from 2953 in 2016 to 4937 pollen/anther, and 38,773,450 in 2016 to 53,637,941 pollen/vine.Despite this, the number of flowers slightly descended to 504 flowers (Figure 3).
3.3. Statistical Analysis
A Spearman’s correlation test was applied to assess the main weather, pollen and flower productionvariables that have a significant influence on final grape production.
The statistically significant correlations were mostly related to meteorological variables (Figure 4).Regarding the correlations of meteorological variables with grape production, we found the highestsignificance level (p < 0.01) for the variables of the first ten-days of August maximum Temperature,the second ten-days of July maximum Temperature and the second ten-days of April Rain, and themonthly July maximum Temperature, April Rain and May Rain, all of them with a negative coefficient,which indicated a negative influence on the final grape production (Figure 4). In the case of pollen andflower production variables, we only found one correlation with grape production, the number ofinflorescences per vine, but with a low p-value (0.1 > p > 0.05) (Figure 5).
Furthermore, we observed in the correlation matrix of the meteorological variables, dividedin six blocks, as well as in the matrix for pollen and flower production variables, some strongcorrelations between variables tightly related, as the positive correlations found for mean andmaximum temperatures in the same period, or the negative correlations of these mean and maximumtemperatures with rain for the same studied period that could reflect the air temperature decrease theeffect of rainfall from a cooler atmosphere layer, as raindrops exchange heat with the warmer air nearto the ground due to the evaporation of part of the waterdrops.
Among the considered pollen and flower production variables, we found strong correlationspossibly related with some secondary variables derived from primary variables, as the flowers/vinederiving from the number of tertiary branches and inflorescences or the pollen/vine derived from thepollen per anther and the number of flowers. To prevent the effect of these relations in the regressionmodel, we decided not to consider variables where redundant correlations were found, and instead justone of the pollen and flowers production variables, the inflorescences/vine, since it showed statisticalinfluence on grapevine yield.
Agronomy 2020, 10, 714 9 of 19
Agronomy 2020, 10, 714 9 of 19
Furthermore, we observed in the correlation matrix of the meteorological variables, divided in six blocks, as well as in the matrix for pollen and flower production variables, some strong correlations between variables tightly related, as the positive correlations found for mean and maximum temperatures in the same period, or the negative correlations of these mean and maximum temperatures with rain for the same studied period that could reflect the air temperature decrease the effect of rainfall from a cooler atmosphere layer, as raindrops exchange heat with the warmer air near to the ground due to the evaporation of part of the waterdrops.
Figure 4. Spearman´s rank correlation coefficients between grape production and meteorological variables with the considered period durations of ten-days, fifteen-days and month for the 2008–2016 data set. Coefficient values were expressed in colours (referred to the lower legend) and the significance level was represented as * p < 0.05, ** p < 0.01.
Figure 4. Spearman’s rank correlation coefficients between grape production and meteorologicalvariables with the considered period durations of ten-days, fifteen-days and month for the 2008–2016data set. Coefficient values were expressed in colours (referred to the lower legend) and the significancelevel was represented as * p < 0.05, ** p < 0.01.
Agronomy 2020, 10, 714 10 of 19Agronomy 2020, 10, 714 10 of 19
Figure 5. Spearman´s rank correlation coefficients between grape production and pollen and flower production variables for the 2008–2016 data set. Coefficient values were expressed in colours (referred to the right legend) and significance level was represented as * p < 0.05, ** p < 0.01. Infl: inflorescences; Ter. br: tertiary branches.
Among the considered pollen and flower production variables, we found strong correlations possibly related with some secondary variables derived from primary variables, as the flowers/vine deriving from the number of tertiary branches and inflorescences or the pollen/vine derived from the pollen per anther and the number of flowers. To prevent the effect of these relations in the regression model, we decided not to consider variables where redundant correlations were found, and instead just one of the pollen and flowers production variables, the inflorescences/vine, since it showed statistical influence on grapevine yield.
Based on the Spearman´s test results, we developed a multiple regression model to forecast the final grape production of the Godello cultivar (Table 2).
The Adjusted Coefficient of Determination (R2) was 0.9893, which indicated that the obtained equation explained a large proportion of data variance, higher than 95%.
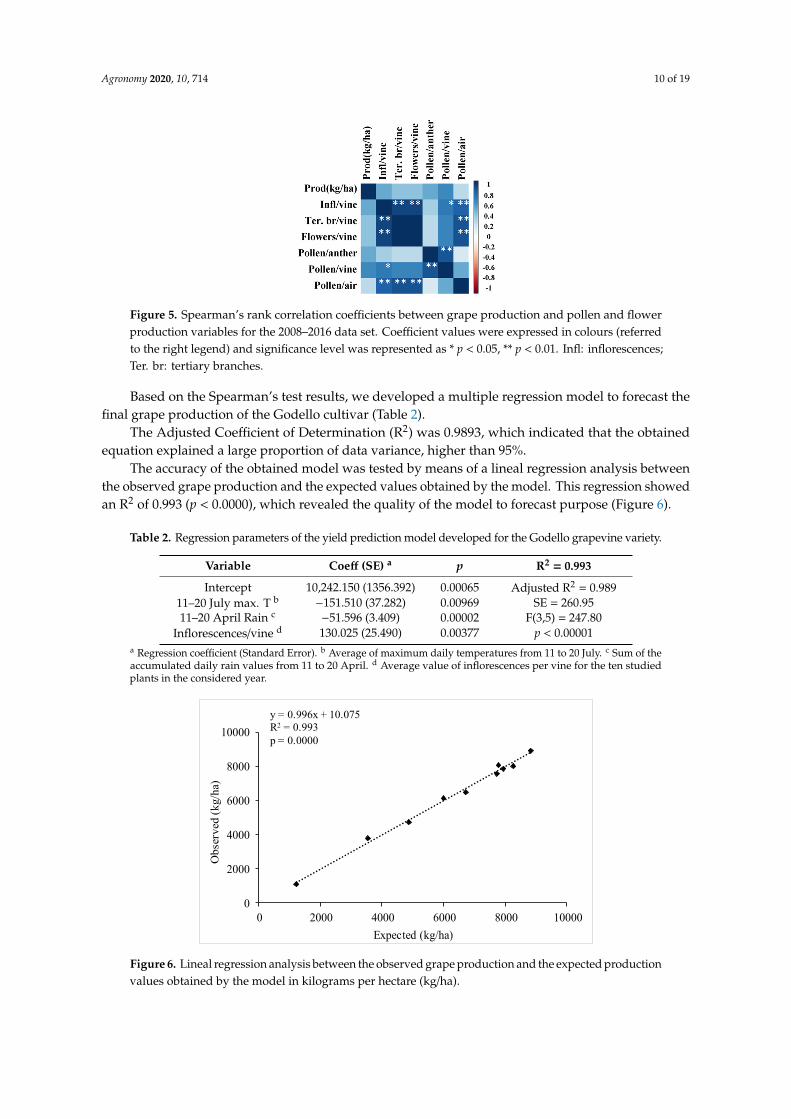
The accuracy of the obtained model was tested by means of a lineal regression analysis between the observed grape production and the expected values obtained by the model. This regression showed an R2 of 0.993 (p < 0.0000), which revealed the quality of the model to forecast purpose (Figure 6).
Table 2. Regression parameters of the yield prediction model developed for the Godello grapevine variety.
Variable Coeff (SE) a p R2 = 0.993 Intercept 10,242.150 (1356.392) 0.00065 Adjusted R2 = 0.989
11–20 July max. T b −151.510 (37.282) 0.00969 SE = 260.95 11–20 April Rain c −51.596 (3.409) 0.00002 F(3,5) = 247.80
Inflorescences/vine d 130.025 (25.490) 0.00377 p < 0.00001 a Regression coefficient (Standard Error). b Average of maximum daily temperatures from 11 to 20 July. c Sum of the accumulated daily rain values from 11 to 20 April. d Average value of inflorescences per vine for the ten studied plants in the considered year.
Figure 5. Spearman’s rank correlation coefficients between grape production and pollen and flowerproduction variables for the 2008–2016 data set. Coefficient values were expressed in colours (referredto the right legend) and significance level was represented as * p < 0.05, ** p < 0.01. Infl: inflorescences;Ter. br: tertiary branches.
Based on the Spearman’s test results, we developed a multiple regression model to forecast thefinal grape production of the Godello cultivar (Table 2).
The Adjusted Coefficient of Determination (R2) was 0.9893, which indicated that the obtainedequation explained a large proportion of data variance, higher than 95%.
The accuracy of the obtained model was tested by means of a lineal regression analysis betweenthe observed grape production and the expected values obtained by the model. This regression showedan R2 of 0.993 (p < 0.0000), which revealed the quality of the model to forecast purpose (Figure 6).
Table 2. Regression parameters of the yield prediction model developed for the Godello grapevine variety.
Variable Coeff (SE) a p R2 = 0.993
Intercept 10,242.150 (1356.392) 0.00065 Adjusted R2 = 0.98911–20 July max. T b −151.510 (37.282) 0.00969 SE = 260.9511–20 April Rain c
−51.596 (3.409) 0.00002 F(3,5) = 247.80Inflorescences/vine d 130.025 (25.490) 0.00377 p < 0.00001
a Regression coefficient (Standard Error). b Average of maximum daily temperatures from 11 to 20 July. c Sum of theaccumulated daily rain values from 11 to 20 April. d Average value of inflorescences per vine for the ten studiedplants in the considered year.
Agronomy 2020, 10, 714 11 of 19
Figure 6. Lineal regression analysis between the observed grape production and the expected production values obtained by the model in kilograms per hectare (kg/ha).
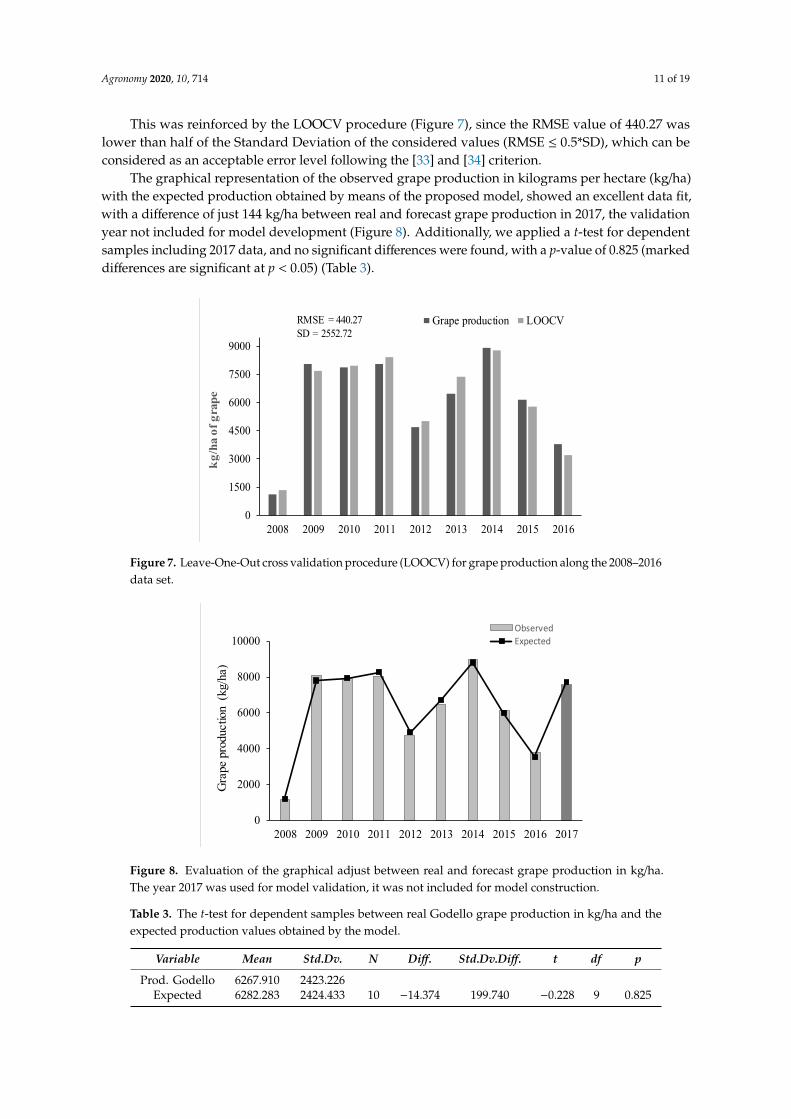
This was reinforced by the LOOCV procedure (Figure 7), since the RMSE value of 440.27 was lower than half of the Standard Deviation of the considered values (RMSE ≤ 0.5*SD), which can be considered as an acceptable error level following the [33] and [34] criterion.
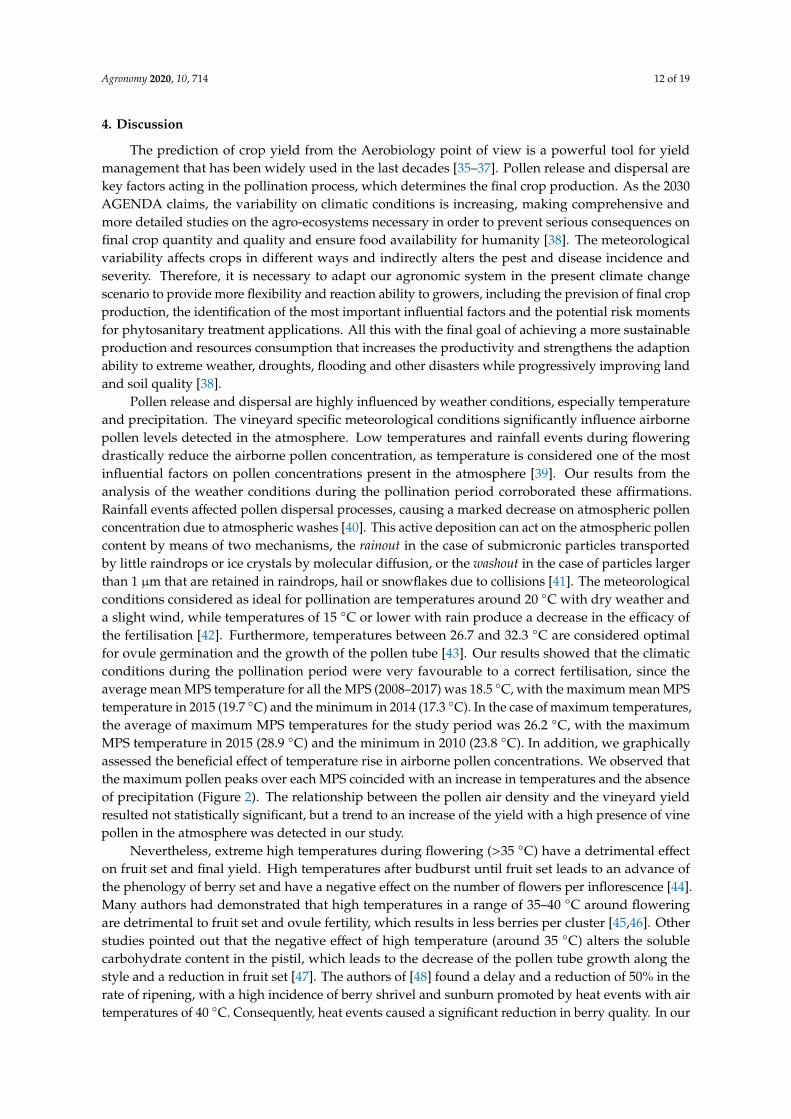
The graphical representation of the observed grape production in kilograms per hectare (kg/ha) with the expected production obtained by means of the proposed model, showed an excellent data fit, with a difference of just 144 kg/ha between real and forecast grape production in 2017, the validation year not included for model development (Figure 8). Additionally, we applied a t-test for dependent samples including 2017 data, and no significant differences were found, with a p-value of 0.825 (marked differences are significant at p < 0.05) (Table 3).
Figure 7. Leave-One-Out cross validation procedure (LOOCV) for grape production along the 2008–2016 data set.
0
2000
4000
6000
8000
10000
0 2000 4000 6000 8000 10000
Obs
erve
d (k
g/ha
)
Expected (kg/ha)
y = 0.996x + 10.075R2 = 0.993p = 0.0000
0
1500
3000
4500
6000
7500
9000
2008 2009 2010 2011 2012 2013 2014 2015 2016
kg/h
a of
gra
pe
Grape production LOOCVRMSE = 440.27SD = 2552.72
Figure 6. Lineal regression analysis between the observed grape production and the expected productionvalues obtained by the model in kilograms per hectare (kg/ha).
Agronomy 2020, 10, 714 11 of 19
This was reinforced by the LOOCV procedure (Figure 7), since the RMSE value of 440.27 waslower than half of the Standard Deviation of the considered values (RMSE ≤ 0.5*SD), which can beconsidered as an acceptable error level following the [33] and [34] criterion.
The graphical representation of the observed grape production in kilograms per hectare (kg/ha)with the expected production obtained by means of the proposed model, showed an excellent data fit,with a difference of just 144 kg/ha between real and forecast grape production in 2017, the validationyear not included for model development (Figure 8). Additionally, we applied a t-test for dependentsamples including 2017 data, and no significant differences were found, with a p-value of 0.825 (markeddifferences are significant at p < 0.05) (Table 3).
Agronomy 2020, 10, 714 11 of 19
Figure 6. Lineal regression analysis between the observed grape production and the expected production values obtained by the model in kilograms per hectare (kg/ha).
This was reinforced by the LOOCV procedure (Figure 7), since the RMSE value of 440.27 was lower than half of the Standard Deviation of the considered values (RMSE ≤ 0.5*SD), which can be considered as an acceptable error level following the [33] and [34] criterion.
The graphical representation of the observed grape production in kilograms per hectare (kg/ha) with the expected production obtained by means of the proposed model, showed an excellent data fit, with a difference of just 144 kg/ha between real and forecast grape production in 2017, the validation year not included for model development (Figure 8). Additionally, we applied a t-test for dependent samples including 2017 data, and no significant differences were found, with a p-value of 0.825 (marked differences are significant at p < 0.05) (Table 3).
Figure 7. Leave-One-Out cross validation procedure (LOOCV) for grape production along the 2008–2016 data set.
0
2000
4000
6000
8000
10000
0 2000 4000 6000 8000 10000
Obs
erve
d (k
g/ha
)
Expected (kg/ha)
y = 0.996x + 10.075R2 = 0.993p = 0.0000
0
1500
3000
4500
6000
7500
9000
2008 2009 2010 2011 2012 2013 2014 2015 2016
kg/h
a of
gra
pe
Grape production LOOCVRMSE = 440.27SD = 2552.72
Figure 7. Leave-One-Out cross validation procedure (LOOCV) for grape production along the 2008–2016data set.Agronomy 2020, 10, 714 12 of 19
Figure 8. Evaluation of the graphical adjust between real and forecast grape production in kg/ha. The year 2017 was used for model validation, it was not included for model construction.
Table 3. The t-test for dependent samples between real Godello grape production in kg/ha and the expected production values obtained by the model.
Variable Mean Std.Dv. N Diff. Std.Dv.Diff. t df p Prod. Godello 6267.910 2423.226
Expected 6282.283 2424.433 10 −14.374 199.740 −0.228 9 0.825
4. Discussion
The prediction of crop yield from the Aerobiology point of view is a powerful tool for yield management that has been widely used in the last decades [35–37]. Pollen release and dispersal are key factors acting in the pollination process, which determines the final crop production. As the 2030 AGENDA claims, the variability on climatic conditions is increasing, making comprehensive and more detailed studies on the agro-ecosystems necessary in order to prevent serious consequences on final crop quantity and quality and ensure food availability for humanity [38]. The meteorological variability affects crops in different ways and indirectly alters the pest and disease incidence and severity. Therefore, it is necessary to adapt our agronomic system in the present climate change scenario to provide more flexibility and reaction ability to growers, including the prevision of final crop production, the identification of the most important influential factors and the potential risk moments for phytosanitary treatment applications. All this with the final goal of achieving a more sustainable production and resources consumption that increases the productivity and strengthens the adaption ability to extreme weather, droughts, flooding and other disasters while progressively improving land and soil quality [38].
Pollen release and dispersal are highly influenced by weather conditions, especially temperature and precipitation. The vineyard specific meteorological conditions significantly influence airborne pollen levels detected in the atmosphere. Low temperatures and rainfall events during flowering drastically reduce the airborne pollen concentration, as temperature is considered one of the most influential factors on pollen concentrations present in the atmosphere [39]. Our results from the analysis of the weather conditions during the pollination period corroborated these affirmations. Rainfall events affected pollen dispersal processes, causing a marked decrease on atmospheric pollen concentration due to atmospheric washes [40]. This active deposition can act on the atmospheric pollen content by means of two mechanisms, the rainout in the case of submicronic particles transported by little raindrops or ice crystals by molecular diffusion, or the washout in the case of particles larger than 1 μm that are retained in raindrops, hail or snowflakes due to collisions [41]. The meteorological conditions considered as ideal for pollination are temperatures around 20 °C with dry weather and a slight wind, while temperatures of 15 °C or lower with rain produce a decrease in the
0
2000
4000
6000
8000
10000
2008 2009 2010 2011 2012 2013 2014 2015 2016 2017
Gra
pe p
rodu
ctio
n (k
g/ha
)
ObservedExpected
Figure 8. Evaluation of the graphical adjust between real and forecast grape production in kg/ha.The year 2017 was used for model validation, it was not included for model construction.
Table 3. The t-test for dependent samples between real Godello grape production in kg/ha and theexpected production values obtained by the model.
Variable Mean Std.Dv. N Diff. Std.Dv.Diff. t df p
Prod. Godello 6267.910 2423.226Expected 6282.283 2424.433 10 −14.374 199.740 −0.228 9 0.825
Agronomy 2020, 10, 714 12 of 19
4. Discussion
The prediction of crop yield from the Aerobiology point of view is a powerful tool for yieldmanagement that has been widely used in the last decades [35–37]. Pollen release and dispersal arekey factors acting in the pollination process, which determines the final crop production. As the 2030AGENDA claims, the variability on climatic conditions is increasing, making comprehensive andmore detailed studies on the agro-ecosystems necessary in order to prevent serious consequences onfinal crop quantity and quality and ensure food availability for humanity [38]. The meteorologicalvariability affects crops in different ways and indirectly alters the pest and disease incidence andseverity. Therefore, it is necessary to adapt our agronomic system in the present climate changescenario to provide more flexibility and reaction ability to growers, including the prevision of final cropproduction, the identification of the most important influential factors and the potential risk momentsfor phytosanitary treatment applications. All this with the final goal of achieving a more sustainableproduction and resources consumption that increases the productivity and strengthens the adaptionability to extreme weather, droughts, flooding and other disasters while progressively improving landand soil quality [38].
Pollen release and dispersal are highly influenced by weather conditions, especially temperatureand precipitation. The vineyard specific meteorological conditions significantly influence airbornepollen levels detected in the atmosphere. Low temperatures and rainfall events during floweringdrastically reduce the airborne pollen concentration, as temperature is considered one of the mostinfluential factors on pollen concentrations present in the atmosphere [39]. Our results from theanalysis of the weather conditions during the pollination period corroborated these affirmations.Rainfall events affected pollen dispersal processes, causing a marked decrease on atmospheric pollenconcentration due to atmospheric washes [40]. This active deposition can act on the atmospheric pollencontent by means of two mechanisms, the rainout in the case of submicronic particles transportedby little raindrops or ice crystals by molecular diffusion, or the washout in the case of particles largerthan 1 µm that are retained in raindrops, hail or snowflakes due to collisions [41]. The meteorologicalconditions considered as ideal for pollination are temperatures around 20 ◦C with dry weather anda slight wind, while temperatures of 15 ◦C or lower with rain produce a decrease in the efficacy ofthe fertilisation [42]. Furthermore, temperatures between 26.7 and 32.3 ◦C are considered optimalfor ovule germination and the growth of the pollen tube [43]. Our results showed that the climaticconditions during the pollination period were very favourable to a correct fertilisation, since theaverage mean MPS temperature for all the MPS (2008–2017) was 18.5 ◦C, with the maximum mean MPStemperature in 2015 (19.7 ◦C) and the minimum in 2014 (17.3 ◦C). In the case of maximum temperatures,the average of maximum MPS temperatures for the study period was 26.2 ◦C, with the maximumMPS temperature in 2015 (28.9 ◦C) and the minimum in 2010 (23.8 ◦C). In addition, we graphicallyassessed the beneficial effect of temperature rise in airborne pollen concentrations. We observed thatthe maximum pollen peaks over each MPS coincided with an increase in temperatures and the absenceof precipitation (Figure 2). The relationship between the pollen air density and the vineyard yieldresulted not statistically significant, but a trend to an increase of the yield with a high presence of vinepollen in the atmosphere was detected in our study.
Nevertheless, extreme high temperatures during flowering (>35 ◦C) have a detrimental effecton fruit set and final yield. High temperatures after budburst until fruit set leads to an advance ofthe phenology of berry set and have a negative effect on the number of flowers per inflorescence [44].Many authors had demonstrated that high temperatures in a range of 35–40 ◦C around floweringare detrimental to fruit set and ovule fertility, which results in less berries per cluster [45,46]. Otherstudies pointed out that the negative effect of high temperature (around 35 ◦C) alters the solublecarbohydrate content in the pistil, which leads to the decrease of the pollen tube growth along thestyle and a reduction in fruit set [47]. The authors of [48] found a delay and a reduction of 50% in therate of ripening, with a high incidence of berry shrivel and sunburn promoted by heat events with airtemperatures of 40 ◦C. Consequently, heat events caused a significant reduction in berry quality. In our
Agronomy 2020, 10, 714 13 of 19
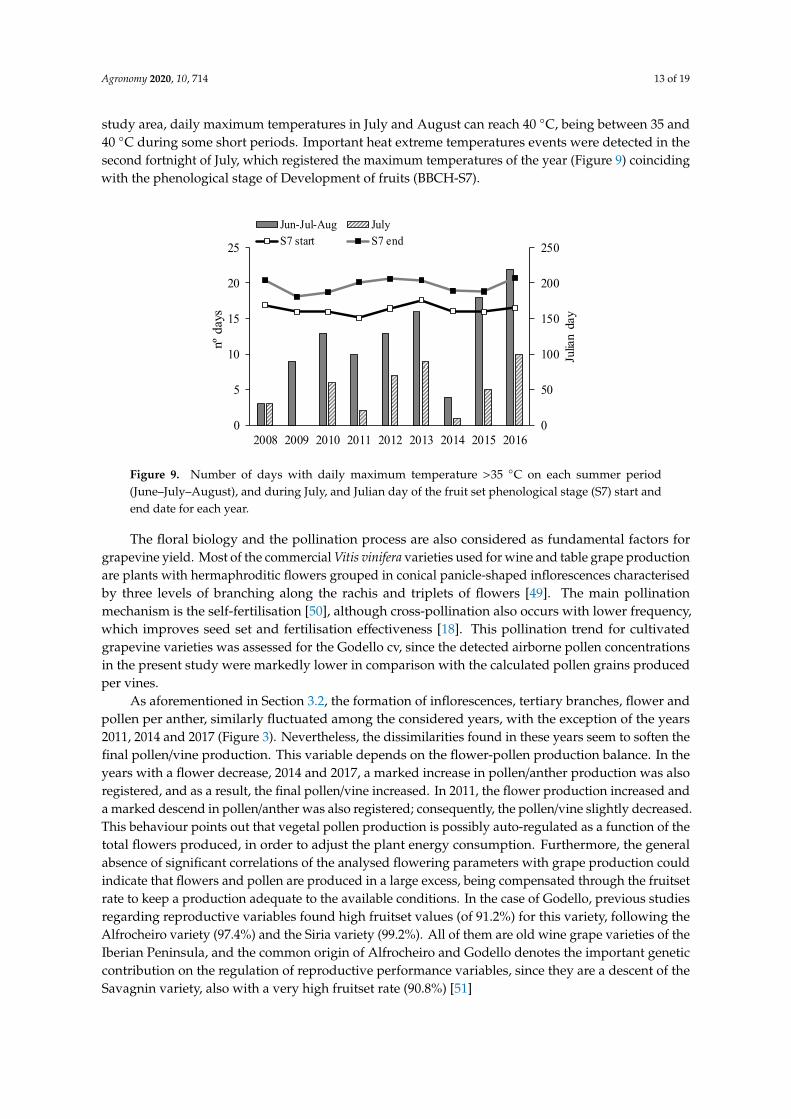
study area, daily maximum temperatures in July and August can reach 40 ◦C, being between 35 and40 ◦C during some short periods. Important heat extreme temperatures events were detected in thesecond fortnight of July, which registered the maximum temperatures of the year (Figure 9) coincidingwith the phenological stage of Development of fruits (BBCH-S7).
Agronomy 2020, 10, 714 13 of 19
efficacy of the fertilisation [42]. Furthermore, temperatures between 26.7 and 32.3 °C are considered optimal for ovule germination and the growth of the pollen tube [43]. Our results showed that the climatic conditions during the pollination period were very favourable to a correct fertilisation, since the average mean MPS temperature for all the MPS (2008–2017) was 18.5 °C, with the maximum mean MPS temperature in 2015 (19.7 °C) and the minimum in 2014 (17.3 °C). In the case of maximum temperatures, the average of maximum MPS temperatures for the study period was 26.2 °C, with the maximum MPS temperature in 2015 (28.9 °C) and the minimum in 2010 (23.8 °C). In addition, we graphically assessed the beneficial effect of temperature rise in airborne pollen concentrations. We observed that the maximum pollen peaks over each MPS coincided with an increase in temperatures and the absence of precipitation (Figure 2). The relationship between the pollen air density and the vineyard yield resulted not statistically significant, but a trend to an increase of the yield with a high presence of vine pollen in the atmosphere was detected in our study.
Nevertheless, extreme high temperatures during flowering (>35 °C) have a detrimental effect on fruit set and final yield. High temperatures after budburst until fruit set leads to an advance of the phenology of berry set and have a negative effect on the number of flowers per inflorescence [44]. Many authors had demonstrated that high temperatures in a range of 35–40 °C around flowering are detrimental to fruit set and ovule fertility, which results in less berries per cluster [45,46]. Other studies pointed out that the negative effect of high temperature (around 35 °C) alters the soluble carbohydrate content in the pistil, which leads to the decrease of the pollen tube growth along the style and a reduction in fruit set [47]. The authors of [48] found a delay and a reduction of 50% in the rate of ripening, with a high incidence of berry shrivel and sunburn promoted by heat events with air temperatures of 40 °C. Consequently, heat events caused a significant reduction in berry quality. In our study area, daily maximum temperatures in July and August can reach 40 °C, being between 35 and 40 °C during some short periods. Important heat extreme temperatures events were detected in the second fortnight of July, which registered the maximum temperatures of the year (Figure 9) coinciding with the phenological stage of Development of fruits (BBCH-S7).
Figure 9. Number of days with daily maximum temperature >35 °C on each summer period (June–July–August), and during July, and Julian day of the fruit set phenological stage (S7) start and end date for each year.
The floral biology and the pollination process are also considered as fundamental factors for grapevine yield. Most of the commercial Vitis vinifera varieties used for wine and table grape production are plants with hermaphroditic flowers grouped in conical panicle-shaped inflorescences characterised by three levels of branching along the rachis and triplets of flowers [49]. The main pollination mechanism is the self-fertilisation [50], although cross-pollination also occurs with lower frequency, which improves seed set and fertilisation effectiveness [18]. This pollination trend for cultivated grapevine varieties was assessed for the Godello cv, since the detected airborne pollen
0
50
100
150
200
250
0
5
10
15
20
25
2008 2009 2010 2011 2012 2013 2014 2015 2016
Julia
n da
y
nº d
ays
Jun-Jul-Aug JulyS7 start S7 end
Figure 9. Number of days with daily maximum temperature >35 ◦C on each summer period(June–July–August), and during July, and Julian day of the fruit set phenological stage (S7) start andend date for each year.
The floral biology and the pollination process are also considered as fundamental factors forgrapevine yield. Most of the commercial Vitis vinifera varieties used for wine and table grape productionare plants with hermaphroditic flowers grouped in conical panicle-shaped inflorescences characterisedby three levels of branching along the rachis and triplets of flowers [49]. The main pollinationmechanism is the self-fertilisation [50], although cross-pollination also occurs with lower frequency,which improves seed set and fertilisation effectiveness [18]. This pollination trend for cultivatedgrapevine varieties was assessed for the Godello cv, since the detected airborne pollen concentrationsin the present study were markedly lower in comparison with the calculated pollen grains producedper vines.
As aforementioned in Section 3.2, the formation of inflorescences, tertiary branches, flower andpollen per anther, similarly fluctuated among the considered years, with the exception of the years2011, 2014 and 2017 (Figure 3). Nevertheless, the dissimilarities found in these years seem to soften thefinal pollen/vine production. This variable depends on the flower-pollen production balance. In theyears with a flower decrease, 2014 and 2017, a marked increase in pollen/anther production was alsoregistered, and as a result, the final pollen/vine increased. In 2011, the flower production increased anda marked descend in pollen/anther was also registered; consequently, the pollen/vine slightly decreased.This behaviour points out that vegetal pollen production is possibly auto-regulated as a function of thetotal flowers produced, in order to adjust the plant energy consumption. Furthermore, the generalabsence of significant correlations of the analysed flowering parameters with grape production couldindicate that flowers and pollen are produced in a large excess, being compensated through the fruitsetrate to keep a production adequate to the available conditions. In the case of Godello, previous studiesregarding reproductive variables found high fruitset values (of 91.2%) for this variety, following theAlfrocheiro variety (97.4%) and the Siria variety (99.2%). All of them are old wine grape varieties of theIberian Peninsula, and the common origin of Alfrocheiro and Godello denotes the important geneticcontribution on the regulation of reproductive performance variables, since they are a descent of theSavagnin variety, also with a very high fruitset rate (90.8%) [51]
Agronomy 2020, 10, 714 14 of 19
Previous studies analysing the morphological development of floral organs conducted in thesame Ribeiro Designation of Origin area for Godello cultivar, noted an average pollen production peranther of 3169 pollen/anther for the period 2004–2008 [5]. This measure was similar to the averagevalue found in this study for the period 2008–2017, of 3248 pollen/anther. The homogeneity on bothresults suggest that vines in this area are adapted to environmental conditions, showing a stable andregular pollen production over the different years despite the meteorological inter-annual variability.However, pollen production is affected by meteorological conditions, limiting the potential vegetaldevelopment capability. In addition to rainfall that washes pollen from the atmosphere, heat eventsduring flowering can lead to temperature stress in vines, affecting pollen viability [50,52] or ovulefertility [46], which alters fruitset rate and final vine yield.
Our statistical results reflected the influence of meteorological conditions and morphologicalvariables on the final grape production since the highest prediction ability was detected for the11–20 July maximum Temperature, the 11–20 April Rain and the Inflorescences/vine. The detectedhigh temperature events could explain the negative statistical influence of the 10–20 July maximumTemperature variable on grapevine yield found in the present study. High temperatures events duringfruit set can decelerate berry growth and block sugar accumulation, which can produce importantcrop losses due to the reduction of berry development and the delay of ripening, compromising berrycomposition [53]. In addition, they could have a later impact on sugar accumulation in the ripeningstage [54,55] due to heat events inhibitory effect on several sugar transporters and sucrose metabolicenzymes involved in sucrose loading to the berries [48]. Reductions in sugar accumulation in berriesinduced by high-temperature events have been related with a 35% reduction in photosynthesis over12 days after high temperature events exposure [53], revealing that not enough carbon was availablefor berries to continue ripening during the heat event and several days later. The photosynthesisreduction induced by high temperatures is possibly related to carboxylation limitations and ribulose1, 5-bisphosphate regeneration, since the activation state of the Rubisco enzyme is inhibited at hightemperatures [48,56,57].
Despite the importance of autumn and winter rainfall for soil water refiling, which determinesthe initial values of the Fraction of Transpirable Soil Water (FTSW) considered as an indicator of thewater status of the crop [58], abundant rainfall on different stages of grapevine development can havea detrimental effect on final yield. During the first spring grapevine phenological stages, rainfallcan favour the development of fungal diseases, such as grey mould or downy mildew caused byBotrytis cinerea and Plasmopara viticola, respectively, which has a high destructive potential, and lead toimportant crop losses and a severe reduction of yield. This is consistent with the negative statisticalinfluence of the 11–20 April Rain variable on the final grapevine yield found in the present study.A considerable correlation coefficient was registered between the accumulated rainfall of the secondten days of April and the concentrations of Botrytis cinerea spores in the 20 day pre-flowering period(R = 0.609; p > 0.078), which could be related to difficulties of an adequate fertilisation process. Manyauthors have related fungal disease levels at a given time with the airborne spore concentrations duringprevious periods, therefore airborne spore concentrations can be used as bio-indicators of pathogendevelopment [59,60]. Rainfall can induce grey mould spread depending on their intensity, since lightrainfall of approximately 2 mm may increase conidia dispersal because of the raindrops splash effectspreading the fungal infective structures to the leaves and other parts of the plants, increasing thismechanical dispersion with the raindrop size [61,62]. In spring, the fungal pathogens activate fromtheir overwintering forms with optimum temperature and humidity conditions, which are variabledepending on the pathogen. The optimum conditions for germination of Botrytis cinerea infectivepropagules by conidiophores formation and conidia development, which can be spread by rain orwind, are high relative humidity around 93% and temperatures from 20–25 ◦C [63,64]. Buds and youngshoots including rudimentary inflorescences can be infected in early spring and before bloom by greymould, leading to their desiccation and fall. Previous studies conducted in the same Ribeiro regionalso pointed out that high airborne Plasmopara viticola sporangia concentrations recorded during the
Agronomy 2020, 10, 714 15 of 19
phenological stage 5-BBCH (inflorescence emergence), corresponding to the end of the May period [65],reinforced the high infective potential during the pre-flowering period in the studied area hinderingthe fertilisation process.
The inflorescences per vine showed a positive influence on the final grape production. Previousstudies indicated that the major influential factors on the final grapevine yield are environment, cultivargenotype and management techniques, focusing on the bunch number per vine as a determinant factorof yield [66]. Bunch number per vine, measured in the present study as the number of inflorescencesper vine, explained the 58%–88% of seasonal variation in the [67] yield component analysis.
The obtained regression model showed a great adjust between the annual grape production(in kg/ha) and the forecast values, explaining the 98.9% of yield variability. In addition to this greatprediction ability, this model offers a considerable time period of two months prior to harvest since yieldforecast. Grapevine flowering in our study area usually takes place between May until mid-June, whichlets us know the inflorescences’ number at least two and a half months in advance to harvest. With thisinformation and meteorological data of 11–20 April rain and 11–20 July maximum temperature, it ispossible to predict grape production two months before, as harvest usually comes in about September.
5. Conclusions
A prediction model was developed for the Godello cultivar, one of the preferential autochthonouswhite cultivars in the Northwest Spain Ribeiro Designation of Origin vineyards, by means ofaerobiological, meteorological and flower production analysis.
The present study showed the detrimental effect of rain for fertilisation during the floweringperiod, with a marked decrease in the airborne pollen concentrations. Additionally, we statisticallycorroborated the negative effect of high temperatures on fruit set and ripening that other authorspreviously reported. The pollen concentrations in the atmosphere of the vineyard were not statisticallyrelated to the grape yield.
The obtained multiple regression model explained the 98.93% of the variability of the data.It provided a fitted forecast as shown by the lineal regression analysis between observed and expectedgrape productions. The variability of crop productivity associated to climate change impacts can betaken into account with this model due to the consideration of the main meteorological variables withthe highest influence on the final yield and its effect on the grapevine inflorescences production. This ispossible due to the use by winegrowers of the obtained model, which offers two months in advance ofthe harvest forecast.
The proposed model represents a useful tool to achieve an adjusted crop yield prediction somemonths in advance, affording possible fraud detection due to the introduction of foreign grape, theoptimisation of cultural and post-harvest tasks or the crop insurance hiring, which are essential aspectsfor the standardised quality of wines and products of the Ribeiro Designation of Origin area.
Author Contributions: Conceptualization, E.G.-F., M.F.-G. and F.J.R.-R; methodology, M.F.-G.; software, E.G.-F.and A.P.-R; formal analysis: E.G.-F., F.J.R.-R. and M.J.A.; investigation: E.G.-F. and A.P.-R.; writing—originaldraft Preparation: E.G.-F.; writing—review and editing, F.J.R.-R. and E.G.-F.; project administration: F.J.R.-R. andM.F.-G.; funding acquisition: F.J.R.-R. and M.J.A. All authors have read and agreed to the published version ofthe manuscript.
Funding: This research received no external funding.
Acknowledgments: The authors thank “Cooperativa Vitivinícola del Ribeiro S.C.G.” for its collaboration.This work was funded by Xunta de Galicia CITACA Strategic Partnership (Reference: ED431E 2018/07),the AGL2014-60412-R Economy and Competence Ministry of Spain Government project and the VITICAST20190020007473 project of the Agriculture, Fisheries and Food Ministry of Spain Government. González-FernándezE. was supported by the Ministry of Sciences, Innovation and Universities (FPU grant FPU15/03343). Piña-Rey A.was supported by Xunta de Galicia Pre-doctoral Period Support Program (ED481A-2017/xxx). Fernández-GonzálezM. was supported by FCT (SFRH/BPD/125686/2016) through the HCOP-Human Capital Operational Program,financed by “Fundo Social Europeu” and “Fundos Nacionais do MCTES.
Conflicts of Interest: The authors declare no conflict of interest.
Agronomy 2020, 10, 714 16 of 19
References
1. Galán, C.; Vázquez, L.; García-Mozo, H.; Domínguez, E. Forecasting olive (Olea europaea) crop yield based onpollen emission. Field Crop. Res. 2004, 86, 43–51. [CrossRef]
2. Oteros, J.; Orlandi, F.; García-Mozo, H.; Aguilera, F.; Dhiab, A.B.; Bonofiglio, T.; Abichou, M.; Ruiz-Valenzuela, L.;del Trigo, M.M.; Díaz de la Guardia, C.; et al. Better prediction of Mediterranean olive production usingpollen-based models. Agron. Sustain. Dev. 2014, 34, 685–694. [CrossRef]
3. Aguilera, F.; Ruiz-Valenzuela, L. A new aerobiological indicator to optimize the prediction of the olive cropyield in intensive farming areas of southern Spain. Agric. For. Meteorol. 2019, 271, 207–213. [CrossRef]
4. Candau, P.; González, F.J.; Morales, J.; Tomás, C. Polen y productividad. Agricultura-ProductosMediterráneos-Alimentación 1996, 60, 639–641.
5. Fernández-González, M.; Escuredo, O.; Rodríguez-Rajo, F.J.; Aira, M.J.; Jato, V. Prediction of grape productionby grapevine cultivar Godello in north-west Spain. J. Agric. Sci. 2011, 149, 725–736. [CrossRef]
6. Dalla Marta, A.; Grifoni, D.; Mancini, M.; Storchi, P.; Zipoli, G.; Orlandini, S. Analysis of the relationshipsbetween climate variability and grapevine phenology in the Nobile di Montepulciano wine production area.J. Agric. Sci. 2010, 148, 657–666. [CrossRef]
7. Buttrose, M.S. Fruitfulness in grapevines: Effects of light intensity and temperature. Bot. Gaz. 1969, 130,166–173. [CrossRef]
8. Bindi, M.; Fibbi, L.; Gozzini, B.; Orlandini, S.; Miglietta, F. Modelling the impact of future climate scenarioson yield and yield variability of grapevine. Clim. Res. 1996, 7, 213–224. [CrossRef]
9. Honorio, F.; García-Martín, A.; Moral, F.J.; Paniagua, L.L.; Rebollo, F.J. Spanish vineyard classificationaccording to bioclimatic indexes: Spanish vineyard bioclimatic classification. Aust. J. Grape Wine Res. 2018,24, 335–344. [CrossRef]
10. Petoumenou, D.G.; Biniari, K.; Xyrafis, E.; Mavronasios, D.; Daskalakis, I.; Palliotti, A. Effects of Natural Hailon the Growth, Physiological Characteristics, Yield, and Quality of Vitis vinifera L. cv. Thompson Seedlessunder Mediterranean Growing Conditions. Agronomy 2019, 9, 197. [CrossRef]
11. Olesen, J.E.; Trnka, M.; Kersebaum, K.C.; Skjelvag, A.O.; Seguin, B.; Peltonen-Sainio, P.; Rossi, F.; Kozyra, J.;Micale, F. Impacts and adaptation of European crop production systems to climate change. Eur. J. Agron.2011, 34, 96–112. [CrossRef]
12. Ortega, E.; Dicenta, F.; Egea, J. Rain effect on pollen-stigma adhesion and fertilization in almond. Sci. Hortic.2007, 112, 345–348. [CrossRef]
13. Seneviratne, S.I.; Nicholls, N.; Easterling, D.; Goodess, C.M.; Kanae, S.; Kossin, J.; Luo, Y.; Marengo, J.;McInnes, K.; Rahimi, M.; et al. Changes in climate extremes and their impacts on the natural physicalenvironment. In Managing the Risks of Extreme Events and Disasters to Advance Climate Change Adaptation;A Special Report of Working Groups I and II of the Intergovernmental Panel on Climate Change; Field, C.B.,Barros, V., Stocker, T.F., Qin, D., Dokken, D.J., Ebi, K.L., Mastrandrea, M.D., Mach, K.J., Plattner, G.-K.,Allen, S.K., et al., Eds.; Cambridge University Press: Cambridge, UK; New York, NY, USA, 2012; pp. 109–230.
14. Intergovernmental Panel on Climate Change IPCC, 2019. Summary for Policymakers. In Climate Change andLand; An IPCC Special Report on Climate Change, Desertification, Land Degradation, Sustainable LandManagement, Food Security, and Greenhouse Gas Fluxes in Terrestrial Ecosystems; Shukla, P.R., Skea, J.,Calvo Buendia, E., Masson-Delmotte, V., Pörtner, H.-O., Roberts, D.C., Zhai, P., Slade, R., Connors, S.,van Diemen, R., et al., Eds.; IPCC: Geneva, Switzerland, 2019; ISBN 978-92-9169-154-8.
15. Schultz, H.R. Climate change and viticulture: A European perspective on climatology, carbon dioxide andUV-B effects. Aust. J. Grape Wine Res. 2000, 6, 2–12. [CrossRef]
16. Leolini, L.; Moriondo, M.; Fila, G.; Costafreda-Aumedes, S.; Ferrise, R.; Bindi, M. Late spring frost impactson future grapevine distribution in Europe. Field Crop. Res. 2018, 222, 197–208. [CrossRef]
17. Morales-Castilla, I.; García de Cortázar-Atauri, I.; Cook, B.I.; Lacombe, T.; Parker, A.; van Leeuwen, C.;Nicholas, K.A.; Wolkovich, E.M. Diversity buffers winegrowing regions from climate change losses. Proc. Nalt.Acad. Sci. USA 2020, 117, 2864–2869. [CrossRef]
18. Vasconcelos, M.C.; Greven, M.; Winefield, C.S.; Trought, M.C.T.; Raw, V. The Flowering Process of Vitis vinifera:A Review. Am. J. Enol. Viticult. 2009, 60, 411–434.
19. Blanco-Ward, D.; Garcia, J.M.; Jones, G.V. Spatial climate variability and viticulture in the Miño River Valleyof Spain. Vitis 2007, 46, 63–70.
Agronomy 2020, 10, 714 17 of 19
20. Orriols, I.; Vázquez, I.; Losada, A. Variedades gallegas. Terruños 2006, 16, 11–18.21. Hirst, J.M. An automatic volumetric spore-trap. Ann. Appl. Biol. 1952, 36, 257–265. [CrossRef]22. Galán, C.; Cariñanos, P.; Alcázar, P.; Domínguez, E. Spanish Aerobiology Network (REA): Management and
Quality Manual; University of Córdoba Publication Service: Córdoba, Spain, 2007; p. 61.23. Abreu, I.; Costa, I.; Oliveira, M.; Cunha, R.; de Castro, M. Ultrastructure and germination of Vitis vinifera cv.
Loureiro pollen. Protoplasma 2006, 228, 131–135. [CrossRef]24. Harst, M.; Cobanov, B.-A.; Hausmann, L.; Eibach, R.; Töpfer, R. Evaluation of pollen dispersal and cross
pollination using transgenic grapevine plants. Environ. Biosaf. Res. 2009, 8, 87–99. [CrossRef]25. Jato, M.V.; Rodríguez-Rajo, F.J.; Aira, M.J.; Tedeschini, E.; Frenguelli, G. Differences in atmospheric trees
pollen seasons in winter, spring and summer in two European geographic areas, Spain and Italy. Aerobiologia2013, 29, 263–278. [CrossRef]
26. Andersen, T.B. A model to predict the beginning of the pollen season. Grana 1991, 30, 269–275. [CrossRef]27. Galán, C.; Ariatti, A.; Bonini, M.; Clot, B.; Crouzy, B.; Dahl, A.; Fernández-González, D.; Frenguelli, G.;
Gehrig, R.; Isard, S.; et al. Recommended terminology for aerobiological studies. Aerobiologia 2017, 33,293–295. [CrossRef]
28. Meier, U. Growth stages of mono and dicotyledonous plants. In BBCH Monograph, 2nd ed.; Federal BiologicalResearch Centre for Agriculture and Forestry: Bonn, Germany, 2001; p. 158.
29. Castiñeiras, P.; Vázquez-Ruiz, R.A.; Fernández-González, M.; Rodríguez-Rajo, F.J.; Aira, M.J. Productionand viability of Fraxinus pollen and its relationship with aerobiological data in the northwestern IberianPeninsula. Aerobiologia 2019, 35, 227–241. [CrossRef]
30. R Core Team. R: A Language and Environment for Statistical Computing; R Foundation for Statistical Computing:Vienna, Austria, 2017; Available online: https://www.R-project.org/ (accessed on 27 February 2020).
31. Wei, T.; Simko, V. R Package “Corrplot”: Visualization of a Correlation Matrix (Version 0.84). 2017. Availableonline: https://github.com/taiyun/corrplot (accessed on 27 February 2020).
32. Cappelli, G.; Pagani, V.; Zanzi, A.; Confalonieri, R.; Romani, M.; Fecciad, S.; Pagani, M.A.; Bregaglio, S.GLORIFY: A new forecasting system for rice grain quality in Northern Italy. Eur. J. Agron. 2018, 97, 70–80.[CrossRef]
33. Singh, J.; Knapp, H.V.; Demissie, M. Hydrologic modeling of the Iroquois River watershed using HSPF and SWAT;Illinois State Water Survey Contract Report 2004-08; Illinois Department of Natural Resources: Springfield,IL, USA; The Illinois State Geological Survey: Champaign, IL, USA, 2004.
34. Ritter, A.; Muñoz-Carpena, R.; Regalado, C.M. Capacidad de predicción de modelos aplicados a la ZNS:Herramienta informática para la adecuada evaluación de la bondad-de-ajuste con significación estadística.IV Elaboración de modelos descriptivos y predictivos de los procesos. In Estudios de la Zona no Saturadadel Suelo Vol. X—ZNS’11; Martínez-Fernández, J., Sánchez-Martín, N., Eds.; Actas de las X Jornadas deInvestigación de la Zona no Saturada del Suelo: Salamanca, España, 2011; ISBN 978-84-694-6642-1.
35. Candau, P.; González, F.J.; Morales, J.; Tomás, C. Forecasting olive (Olea europaea) crop production bymonitoring airborne pollen. Aerobiologia 1998, 14, 241–256.
36. Galán, C.; García-Mozo, H.; Vázquez, L.; Ruiz, L.; Díaz de la Guardia, C.; Domínguez-Vilches, E. ModellingOlive Crop Yield in Andalusia, Spain. Agron. J. 2008, 100, 98–104. [CrossRef]
37. Cunha, M.; Ribeiro, H.; Abreu, I. Pollen-based predictive modelling of wine production: Application to anarid region. Eur. J. Agron. 2016, 73, 42–54. [CrossRef]
38. General Assembly of the United Nations. Resolution Adopted by the General Assembly on 25 September 2015;70/1. Transforming Our World: The 2030 Agenda for Sustainable Development; General Assembly of theUnited Nations: New York, NY, USA, 2015.
39. Rodríguez-Rajo, F.J. El Polen Como Fuente de Contaminación Ambiental en la Ciudad de Vigo. Ph.D. Thesis,University of Vigo, Vigo, Spain, 2000.
40. Cebrino, J.; Galán, C.; Domínguez-Vilches, E. Aerobiological and phenological study of the main Poaceaespecies in Córdoba City (Spain) and the surrounding hills. Aerobiologia 2016, 32, 595–606. [CrossRef]
41. Vara, A. Carga Alergénica de la Familia Oleaceae en la Atmósfera de la Ciudad de Ourense y Factores queInfluyen Sobre Ella. PhD Thesis, University of Vigo, Ourense, Spain, 2017.
42. Lebon, G.; Duchêne, E.; Brun, O.; Clément, C. Phenology of flowering and starch accumulation in grape(Vitis vinifera L.) cuttings and vines. Ann. Bot. 2005, 95, 943–948. [CrossRef] [PubMed]
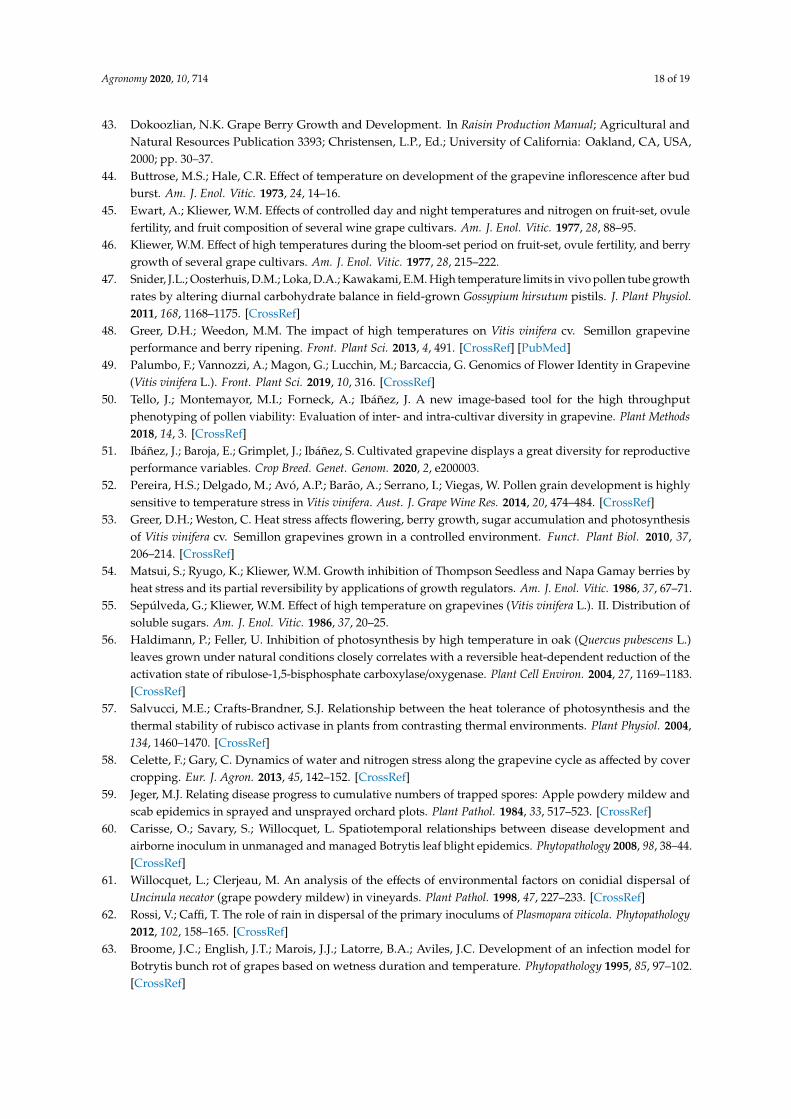
Agronomy 2020, 10, 714 18 of 19
43. Dokoozlian, N.K. Grape Berry Growth and Development. In Raisin Production Manual; Agricultural andNatural Resources Publication 3393; Christensen, L.P., Ed.; University of California: Oakland, CA, USA,2000; pp. 30–37.
44. Buttrose, M.S.; Hale, C.R. Effect of temperature on development of the grapevine inflorescence after budburst. Am. J. Enol. Vitic. 1973, 24, 14–16.
45. Ewart, A.; Kliewer, W.M. Effects of controlled day and night temperatures and nitrogen on fruit-set, ovulefertility, and fruit composition of several wine grape cultivars. Am. J. Enol. Vitic. 1977, 28, 88–95.
46. Kliewer, W.M. Effect of high temperatures during the bloom-set period on fruit-set, ovule fertility, and berrygrowth of several grape cultivars. Am. J. Enol. Vitic. 1977, 28, 215–222.
47. Snider, J.L.; Oosterhuis, D.M.; Loka, D.A.; Kawakami, E.M. High temperature limits in vivo pollen tube growthrates by altering diurnal carbohydrate balance in field-grown Gossypium hirsutum pistils. J. Plant Physiol.2011, 168, 1168–1175. [CrossRef]
48. Greer, D.H.; Weedon, M.M. The impact of high temperatures on Vitis vinifera cv. Semillon grapevineperformance and berry ripening. Front. Plant Sci. 2013, 4, 491. [CrossRef] [PubMed]
49. Palumbo, F.; Vannozzi, A.; Magon, G.; Lucchin, M.; Barcaccia, G. Genomics of Flower Identity in Grapevine(Vitis vinifera L.). Front. Plant Sci. 2019, 10, 316. [CrossRef]
50. Tello, J.; Montemayor, M.I.; Forneck, A.; Ibáñez, J. A new image-based tool for the high throughputphenotyping of pollen viability: Evaluation of inter- and intra-cultivar diversity in grapevine. Plant Methods2018, 14, 3. [CrossRef]
51. Ibáñez, J.; Baroja, E.; Grimplet, J.; Ibáñez, S. Cultivated grapevine displays a great diversity for reproductiveperformance variables. Crop Breed. Genet. Genom. 2020, 2, e200003.
52. Pereira, H.S.; Delgado, M.; Avó, A.P.; Barão, A.; Serrano, I.; Viegas, W. Pollen grain development is highlysensitive to temperature stress in Vitis vinifera. Aust. J. Grape Wine Res. 2014, 20, 474–484. [CrossRef]
53. Greer, D.H.; Weston, C. Heat stress affects flowering, berry growth, sugar accumulation and photosynthesisof Vitis vinifera cv. Semillon grapevines grown in a controlled environment. Funct. Plant Biol. 2010, 37,206–214. [CrossRef]
54. Matsui, S.; Ryugo, K.; Kliewer, W.M. Growth inhibition of Thompson Seedless and Napa Gamay berries byheat stress and its partial reversibility by applications of growth regulators. Am. J. Enol. Vitic. 1986, 37, 67–71.
55. Sepúlveda, G.; Kliewer, W.M. Effect of high temperature on grapevines (Vitis vinifera L.). II. Distribution ofsoluble sugars. Am. J. Enol. Vitic. 1986, 37, 20–25.
56. Haldimann, P.; Feller, U. Inhibition of photosynthesis by high temperature in oak (Quercus pubescens L.)leaves grown under natural conditions closely correlates with a reversible heat-dependent reduction of theactivation state of ribulose-1,5-bisphosphate carboxylase/oxygenase. Plant Cell Environ. 2004, 27, 1169–1183.[CrossRef]
57. Salvucci, M.E.; Crafts-Brandner, S.J. Relationship between the heat tolerance of photosynthesis and thethermal stability of rubisco activase in plants from contrasting thermal environments. Plant Physiol. 2004,134, 1460–1470. [CrossRef]
58. Celette, F.; Gary, C. Dynamics of water and nitrogen stress along the grapevine cycle as affected by covercropping. Eur. J. Agron. 2013, 45, 142–152. [CrossRef]
59. Jeger, M.J. Relating disease progress to cumulative numbers of trapped spores: Apple powdery mildew andscab epidemics in sprayed and unsprayed orchard plots. Plant Pathol. 1984, 33, 517–523. [CrossRef]
60. Carisse, O.; Savary, S.; Willocquet, L. Spatiotemporal relationships between disease development andairborne inoculum in unmanaged and managed Botrytis leaf blight epidemics. Phytopathology 2008, 98, 38–44.[CrossRef]
61. Willocquet, L.; Clerjeau, M. An analysis of the effects of environmental factors on conidial dispersal ofUncinula necator (grape powdery mildew) in vineyards. Plant Pathol. 1998, 47, 227–233. [CrossRef]
62. Rossi, V.; Caffi, T. The role of rain in dispersal of the primary inoculums of Plasmopara viticola. Phytopathology2012, 102, 158–165. [CrossRef]
63. Broome, J.C.; English, J.T.; Marois, J.J.; Latorre, B.A.; Aviles, J.C. Development of an infection model forBotrytis bunch rot of grapes based on wetness duration and temperature. Phytopathology 1995, 85, 97–102.[CrossRef]
Agronomy 2020, 10, 714 19 of 19
64. Thomas, C.S.; Marois, J.J.; English, J.T. The effects of wind speed, temperature and relative humidity ondevelopment of aerial mycelium and conidia of Botrytis cinerea on grape. Phytopathology 1988, 78, 260–265.[CrossRef]
65. Fernández-González, M.; Ramos-Valcárcel, D.; Aira, M.J.; Rodríguez-Rajo, F.J. Prediction of biologicalsensors appearance with ARIMA models as a tool for Integrated Pest Management protocols. Ann. Agric.Environ. Med. 2016, 23, 129–137. [CrossRef] [PubMed]
66. Carmona, M.J.; Chaïb, J.; Martínez-Zapater, J.M.; Thomas, M.R. A molecular genetic perspective ofreproductive development in grapevine. J. Exp. Bot. 2008, 59, 2579–2596. [CrossRef] [PubMed]
67. Clingeleffer, P.R. Management practices for Sunmuscat (Vitis vinifera L.): A new drying variety. Aust. J. GrapeWine Res. 2006, 12, 128–134. [CrossRef]
© 2020 by the authors. Licensee MDPI, Basel, Switzerland. This article is an open accessarticle distributed under the terms and conditions of the Creative Commons Attribution(CC BY) license (http://creativecommons.org/licenses/by/4.0/).