Ofx 260515 fy15_presentation
24
FY15 Full Year Result Chief Executive Officer – Neil Helm Chief Financial Officer – Mark Ledsham 26 May 2015 Full Year Result 26 May 2015 Annual Meeting 5 August 2015 Half Year Result 25 November 2014
-
Upload
absmartkarma -
Category
Business
-
view
409 -
download
0
Transcript of Ofx 260515 fy15_presentation
FY15 Full Year Result Chief Executive Officer – Neil Helm Chief Financial Officer – Mark Ledsham
26 May 2015
Full Year Result 26 May 2015
Annual Meeting 5 August 2015
Half Year Result 25 November 2014
Executive summary
2
• Net operating income increased by 24% on FY14 to $90.1m
• Pro forma EBTDA increased by 22% on FY14 to $34.5m
• EPS of 10.11c per share for FY15, up 18% on FY14 pro forma EPS
• Fully franked final dividend of 3.58c per share (70% dividend payout ratio)
• Full year dividend of 7.08c per share
• Strong underlying business growth reflected in operating metrics
• Continued investment in core operations and business development
• Strong balance sheet and cash flow conversion
Contents
1. Highlights - FY15 Full Year 2. Banking relationships 3. Industry Trends 4. Summary and Outlook
Performance – FY15 Full Year
FY15 Full Year - Key metrics
5
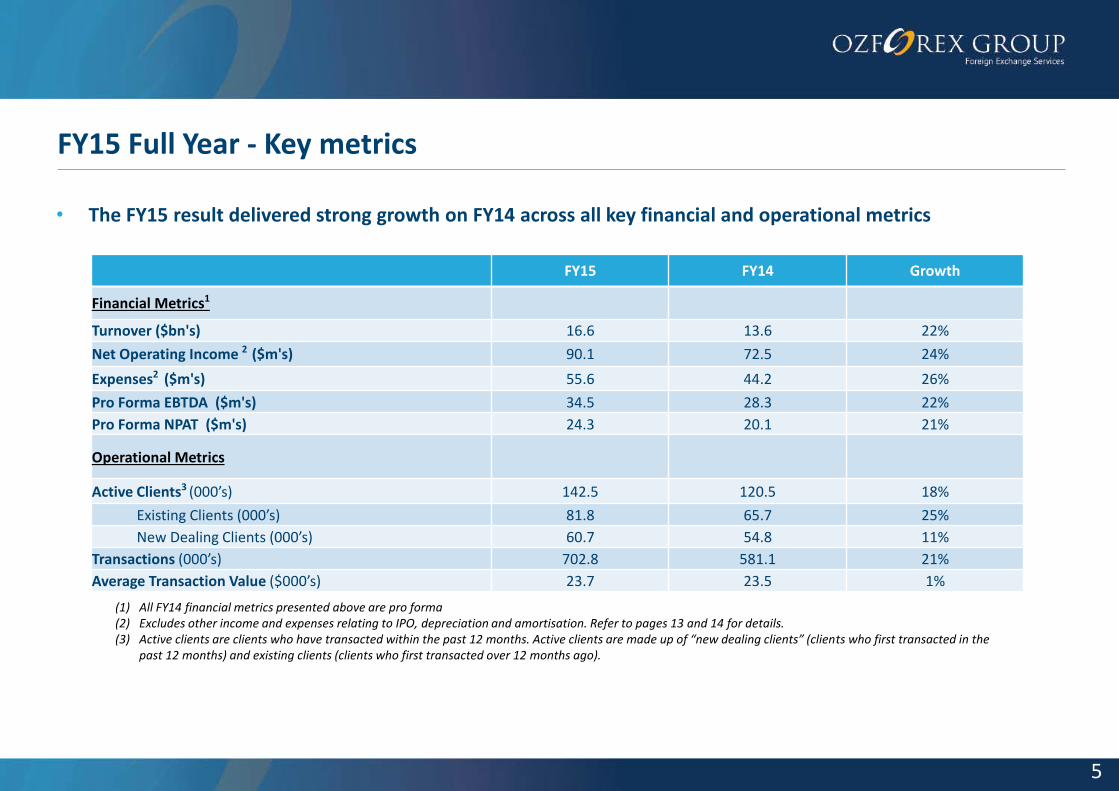
• The FY15 result delivered strong growth on FY14 across all key financial and operational metrics
(1) All FY14 financial metrics presented above are pro forma (2) Excludes other income and expenses relating to IPO, depreciation and amortisation. Refer to pages 13 and 14 for details. (3) Active clients are clients who have transacted within the past 12 months. Active clients are made up of “new dealing clients” (clients who first transacted in the
past 12 months) and existing clients (clients who first transacted over 12 months ago).
FY15 FY14 Growth
Financial Metrics1
Turnover ($bn's) 16.6 13.6 22%
Net Operating Income 2 ($m's) 90.1 72.5 24%
Expenses2 ($m's) 55.6 44.2 26%
Pro Forma EBTDA ($m's) 34.5 28.3 22%
Pro Forma NPAT ($m's) 24.3 20.1 21%
Operational Metrics
Active Clients3 (000’s) 142.5 120.5 18%
Existing Clients (000’s) 81.8 65.7 25%
New Dealing Clients (000’s) 60.7 54.8 11%
Transactions (000’s) 702.8 581.1 21%
Average Transaction Value ($000’s) 23.7 23.5 1%
FY15 Half Year - Key metrics
6
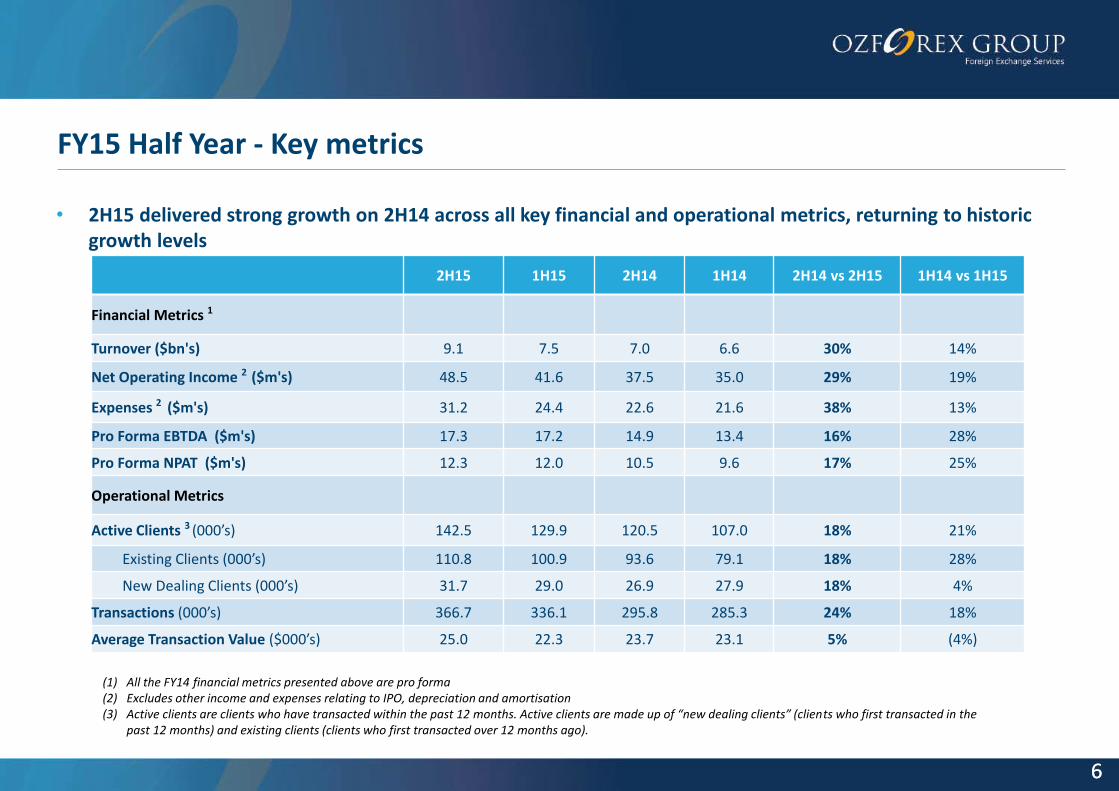
• 2H15 delivered strong growth on 2H14 across all key financial and operational metrics, returning to historic growth levels
6
(1) All the FY14 financial metrics presented above are pro forma (2) Excludes other income and expenses relating to IPO, depreciation and amortisation (3) Active clients are clients who have transacted within the past 12 months. Active clients are made up of “new dealing clients” (clients who first transacted in the
past 12 months) and existing clients (clients who first transacted over 12 months ago).
2H15 1H15 2H14 1H14 2H14 vs 2H15 1H14 vs 1H15
Financial Metrics 1
Turnover ($bn's) 9.1 7.5 7.0 6.6 30% 14%
Net Operating Income 2 ($m's) 48.5 41.6 37.5 35.0 29% 19%
Expenses 2 ($m's) 31.2 24.4 22.6 21.6 38% 13%
Pro Forma EBTDA ($m's) 17.3 17.2 14.9 13.4 16% 28%
Pro Forma NPAT ($m's) 12.3 12.0 10.5 9.6 17% 25%
Operational Metrics
Active Clients 3 (000’s) 142.5 129.9 120.5 107.0 18% 21%
Existing Clients (000’s) 110.8 100.9 93.6 79.1 18% 28%
New Dealing Clients (000’s) 31.7 29.0 26.9 27.9 18% 4%
Transactions (000’s) 366.7 336.1 295.8 285.3 24% 18%
Average Transaction Value ($000’s) 25.0 22.3 23.7 23.1 5% (4%)
FY15 Half Year – Client metrics
7
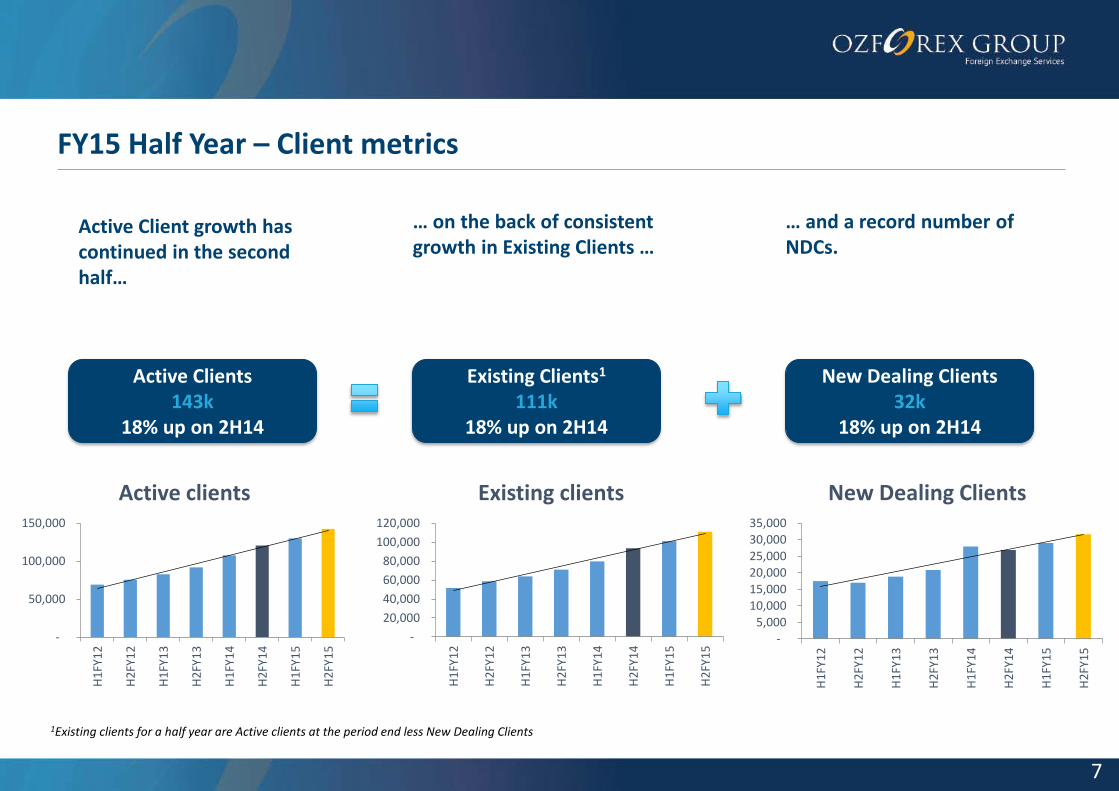
1Existing clients for a half year are Active clients at the period end less New Dealing Clients
Active Client growth has continued in the second half…
Active Clients 143k
18% up on 2H14
… on the back of consistent growth in Existing Clients …
… and a record number of NDCs.
Existing Clients1
111k 18% up on 2H14
New Dealing Clients 32k
18% up on 2H14
-
50,000
100,000
150,000
H1
FY1
2
H2
FY1
2
H1
FY1
3
H2
FY1
3
H1
FY1
4
H2
FY1
4
H1
FY1
5
H2
FY1
5
Active clients
-
20,000
40,000
60,000
80,000
100,000
120,000
H1
FY1
2
H2
FY1
2
H1
FY1
3
H2
FY1
3
H1
FY1
4
H2
FY1
4
H1
FY1
5
H2
FY1
5
Existing clients
- 5,000
10,000 15,000 20,000 25,000 30,000 35,000
H1
FY1
2
H2
FY1
2
H1
FY1
3
H2
FY1
3
H1
FY1
4
H2
FY1
4
H1
FY1
5
H2
FY1
5
New Dealing Clients
FY15 Half Year – Operational metrics
8
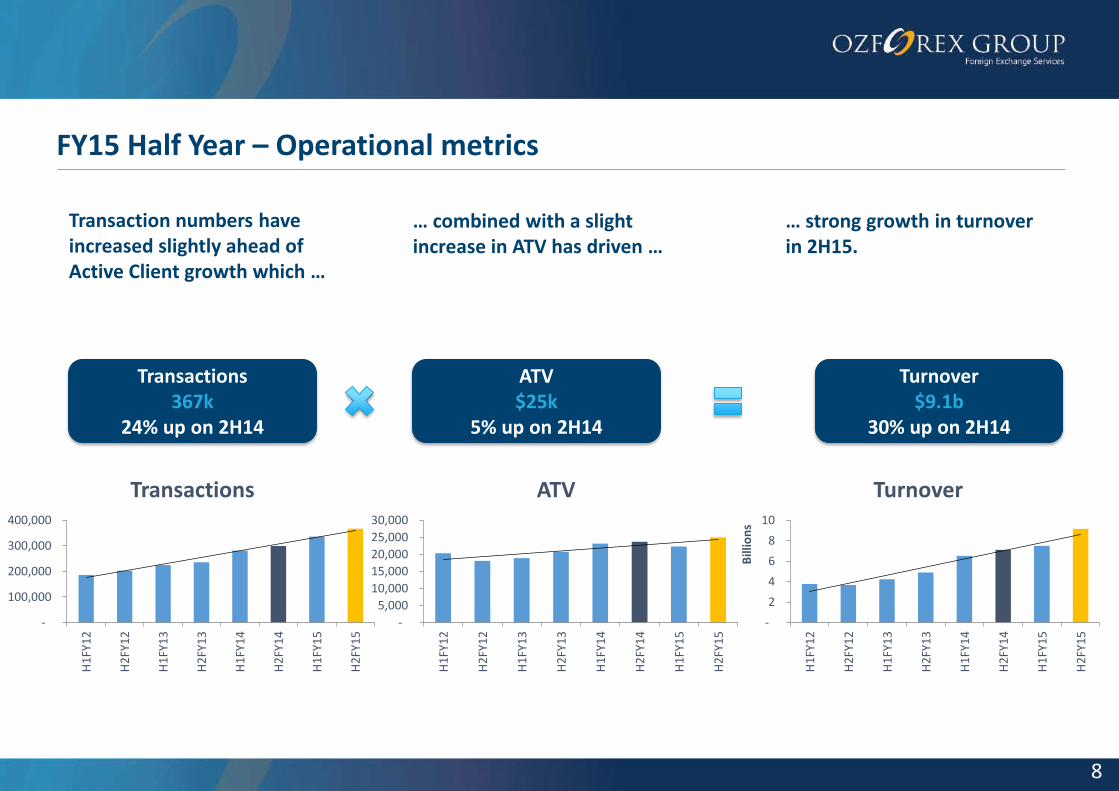
Transaction numbers have increased slightly ahead of Active Client growth which …
Transactions 367k
24% up on 2H14
… combined with a slight increase in ATV has driven …
… strong growth in turnover in 2H15.
ATV $25k
5% up on 2H14
Turnover $9.1b
30% up on 2H14
-
100,000
200,000
300,000
400,000
H1
FY1
2
H2
FY1
2
H1
FY1
3
H2
FY1
3
H1
FY1
4
H2
FY1
4
H1
FY1
5
H2
FY1
5
Transactions
-
5,000
10,000
15,000
20,000
25,000
30,000
H1
FY1
2
H2
FY1
2
H1
FY1
3
H2
FY1
3
H1
FY1
4
H2
FY1
4
H1
FY1
5
H2
FY1
5
ATV
-
2
4
6
8
10
H1
FY1
2
H2
FY1
2
H1
FY1
3
H2
FY1
3
H1
FY1
4
H2
FY1
4
H1
FY1
5
H2
FY1
5
Bill
ion
s
Turnover
FY15 Half Year – Financial metrics
9
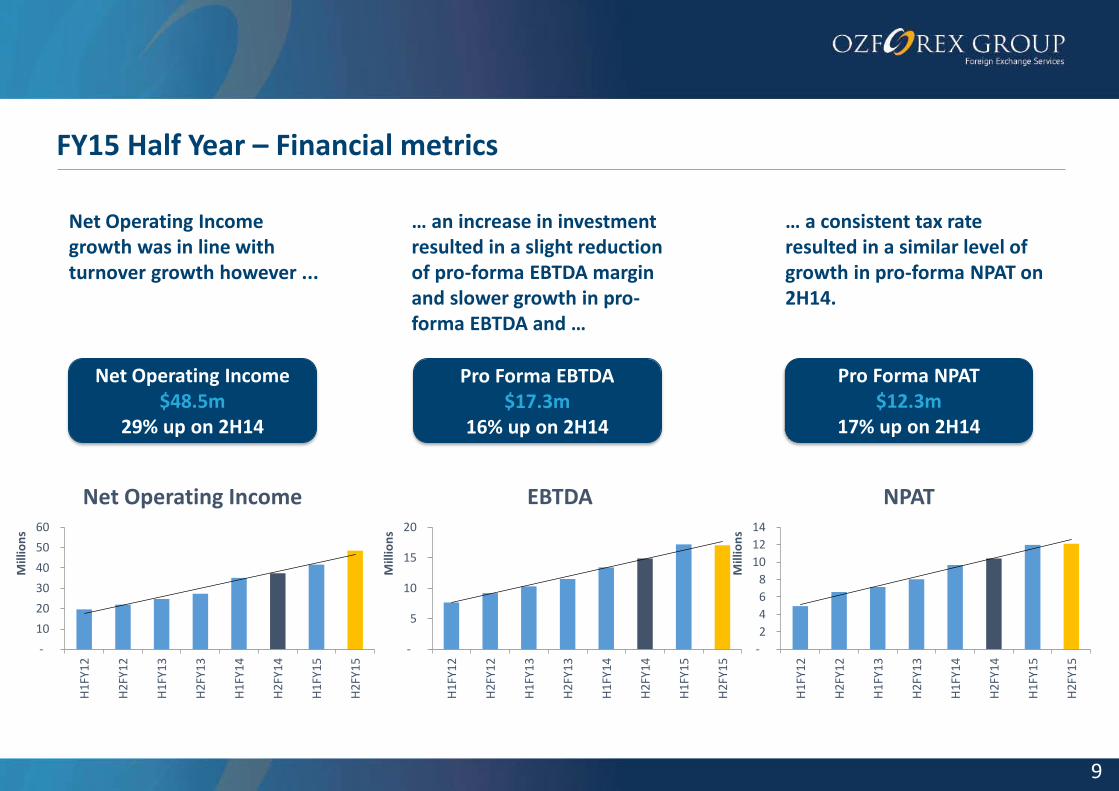
Net Operating Income growth was in line with turnover growth however ...
Net Operating Income $48.5m
29% up on 2H14
… an increase in investment resulted in a slight reduction of pro-forma EBTDA margin and slower growth in pro-forma EBTDA and …
… a consistent tax rate resulted in a similar level of growth in pro-forma NPAT on 2H14.
Pro Forma EBTDA $17.3m
16% up on 2H14
Pro Forma NPAT $12.3m
17% up on 2H14
-
10
20
30
40
50
60
H1
FY1
2
H2
FY1
2
H1
FY1
3
H2
FY1
3
H1
FY1
4
H2
FY1
4
H1
FY1
5
H2
FY1
5
Mill
ion
s
Net Operating Income
-
5
10
15
20
H1
FY1
2
H2
FY1
2
H1
FY1
3
H2
FY1
3
H1
FY1
4
H2
FY1
4
H1
FY1
5
H2
FY1
5
Mill
ion
s
EBTDA
-
2
4
6
8
10
12
14
H1
FY1
2
H2
FY1
2
H1
FY1
3
H2
FY1
3
H1
FY1
4
H2
FY1
4
H1
FY1
5
H2
FY1
5
Mill
ion
s
NPAT
FY15 Full Year - Growing base of long term customers
10
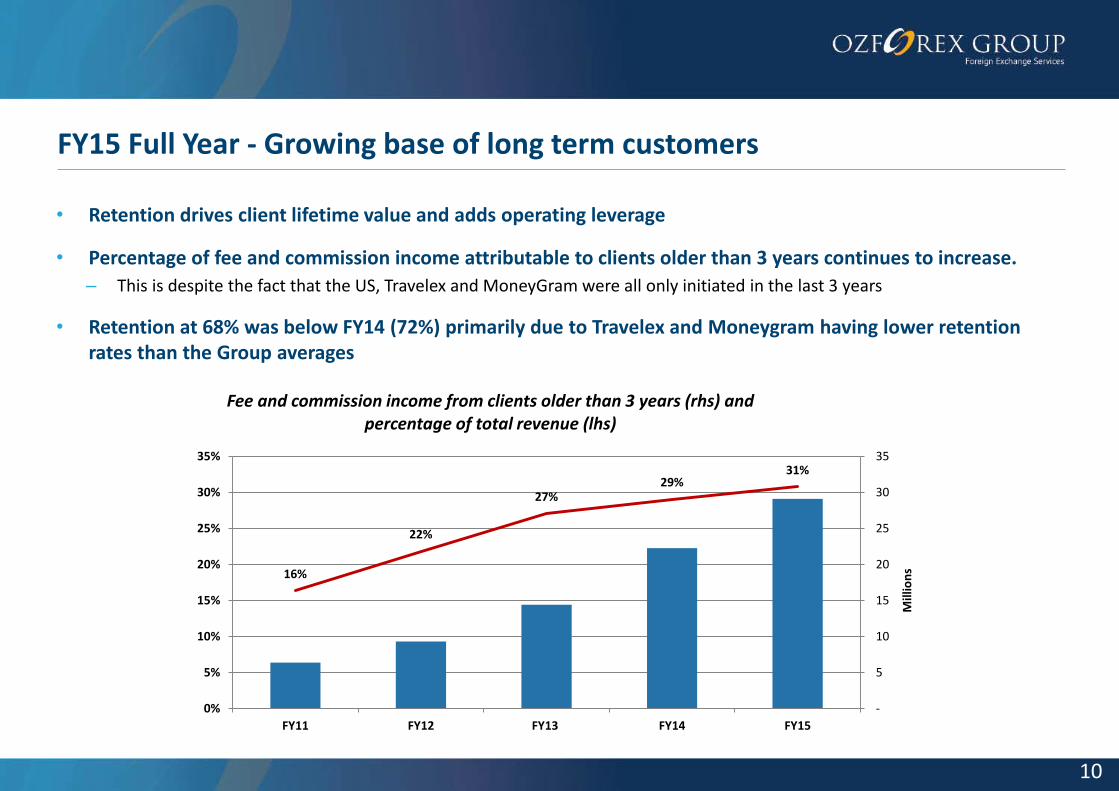
• Retention drives client lifetime value and adds operating leverage
• Percentage of fee and commission income attributable to clients older than 3 years continues to increase.
– This is despite the fact that the US, Travelex and MoneyGram were all only initiated in the last 3 years
• Retention at 68% was below FY14 (72%) primarily due to Travelex and Moneygram having lower retention rates than the Group averages
16%
22%
27% 29%
31%
-
5
10
15
20
25
30
35
0%
5%
10%
15%
20%
25%
30%
35%
FY11 FY12 FY13 FY14 FY15
Mill
ion
s
Fee and commission income from clients older than 3 years (rhs) and percentage of total revenue (lhs)
FY15 Full Year - Performance was strong across the Group
11
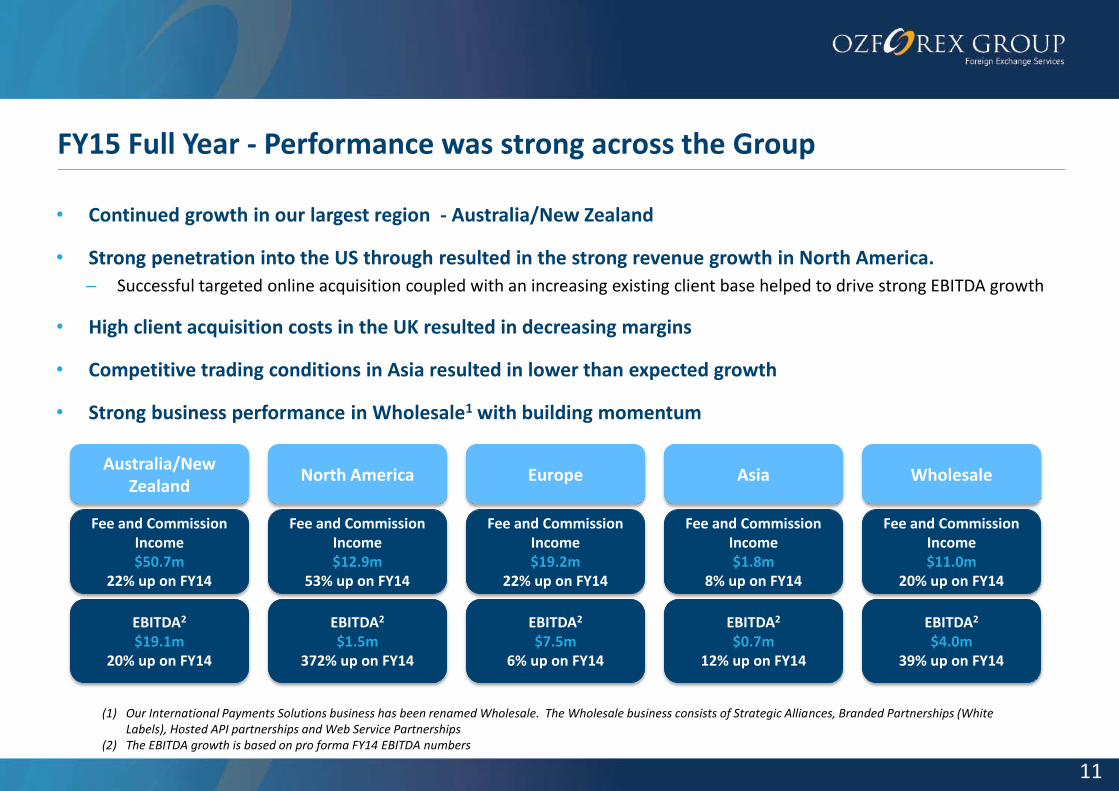
• Continued growth in our largest region - Australia/New Zealand
• Strong penetration into the US through resulted in the strong revenue growth in North America.
– Successful targeted online acquisition coupled with an increasing existing client base helped to drive strong EBITDA growth
• High client acquisition costs in the UK resulted in decreasing margins
• Competitive trading conditions in Asia resulted in lower than expected growth
• Strong business performance in Wholesale1 with building momentum
11
Fee and Commission Income $50.7m
22% up on FY14
EBITDA2
$19.1m 20% up on FY14
Fee and Commission Income $12.9m
53% up on FY14
EBITDA2 $1.5m
372% up on FY14
Fee and Commission Income $19.2m
22% up on FY14
EBITDA2 $7.5m
6% up on FY14
Fee and Commission Income $1.8m
8% up on FY14
EBITDA2 $0.7m
12% up on FY14
Australia/New Zealand
Europe Asia North America
Fee and Commission Income $11.0m
20% up on FY14
EBITDA2 $4.0m
39% up on FY14
Wholesale
(1) Our International Payments Solutions business has been renamed Wholesale. The Wholesale business consists of Strategic Alliances, Branded Partnerships (White Labels), Hosted API partnerships and Web Service Partnerships
(2) The EBITDA growth is based on pro forma FY14 EBITDA numbers
FY15 Full Year - Net operating income
12
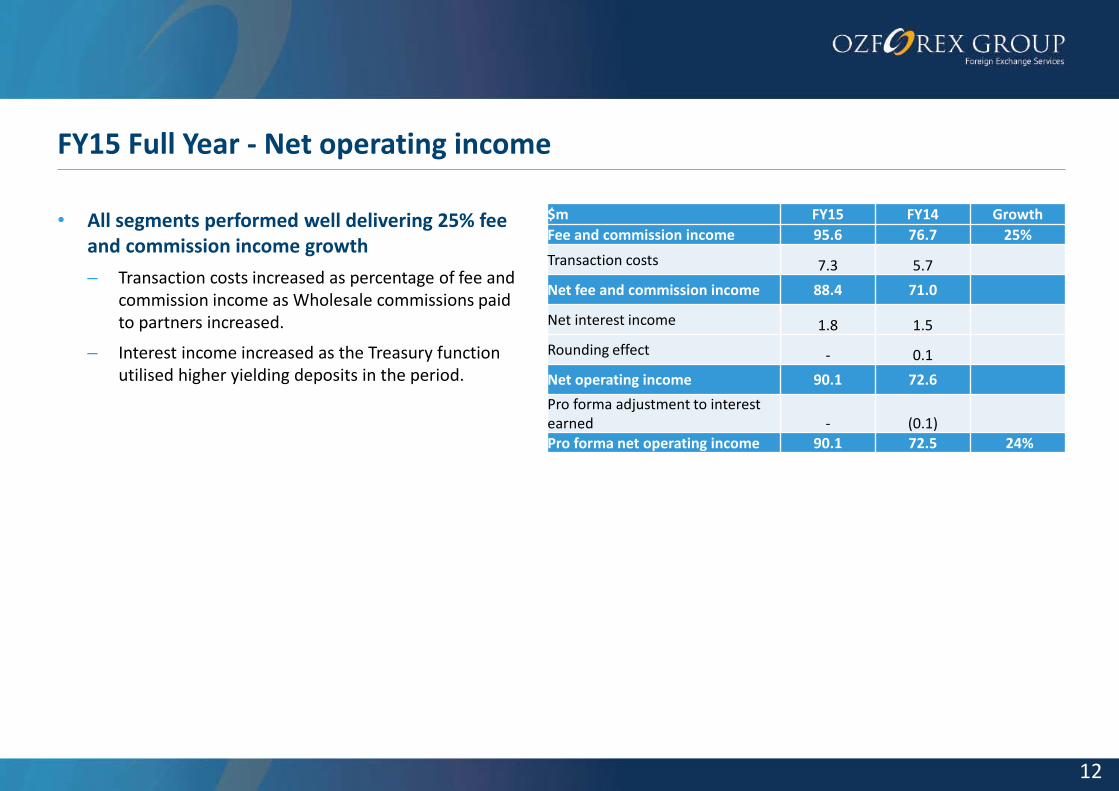
• All segments performed well delivering 25% fee and commission income growth
– Transaction costs increased as percentage of fee and commission income as Wholesale commissions paid to partners increased.
– Interest income increased as the Treasury function utilised higher yielding deposits in the period.
$m FY15 FY14 Growth
Fee and commission income 95.6 76.7 25%
Transaction costs 7.3 5.7 Net fee and commission income 88.4 71.0 Net interest income 1.8 1.5 Rounding effect - 0.1
Net operating income 90.1 72.6 Pro forma adjustment to interest earned - (0.1) Pro forma net operating income 90.1 72.5 24%
FY15 Full Year - Operating expenses
13
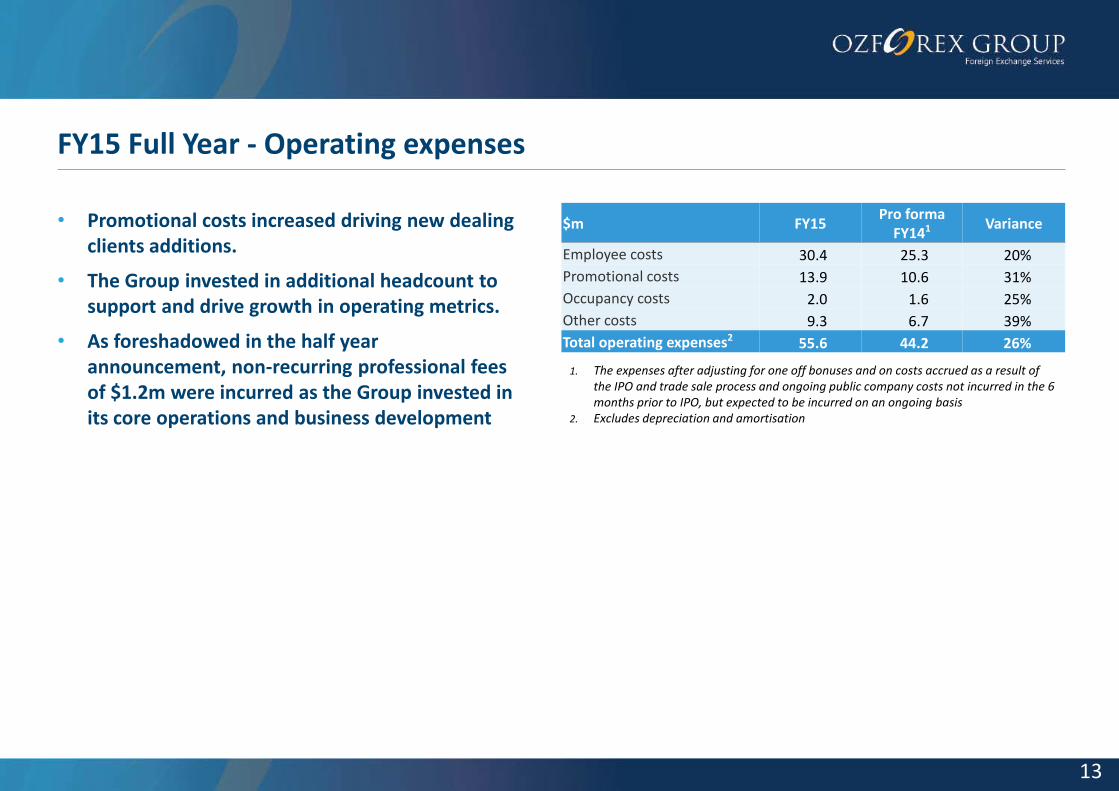
• Promotional costs increased driving new dealing clients additions.
• The Group invested in additional headcount to support and drive growth in operating metrics.
• As foreshadowed in the half year announcement, non-recurring professional fees of $1.2m were incurred as the Group invested in its core operations and business development
1. The expenses after adjusting for one off bonuses and on costs accrued as a result of the IPO and trade sale process and ongoing public company costs not incurred in the 6 months prior to IPO, but expected to be incurred on an ongoing basis
2. Excludes depreciation and amortisation
$m FY15 Pro forma
FY141 Variance
Employee costs 30.4 25.3 20%
Promotional costs 13.9 10.6 31%
Occupancy costs 2.0 1.6 25%
Other costs 9.3 6.7 39%
Total operating expenses2 55.6 44.2 26%
FY15 Full Year - Reconciliation of underlying earnings
14
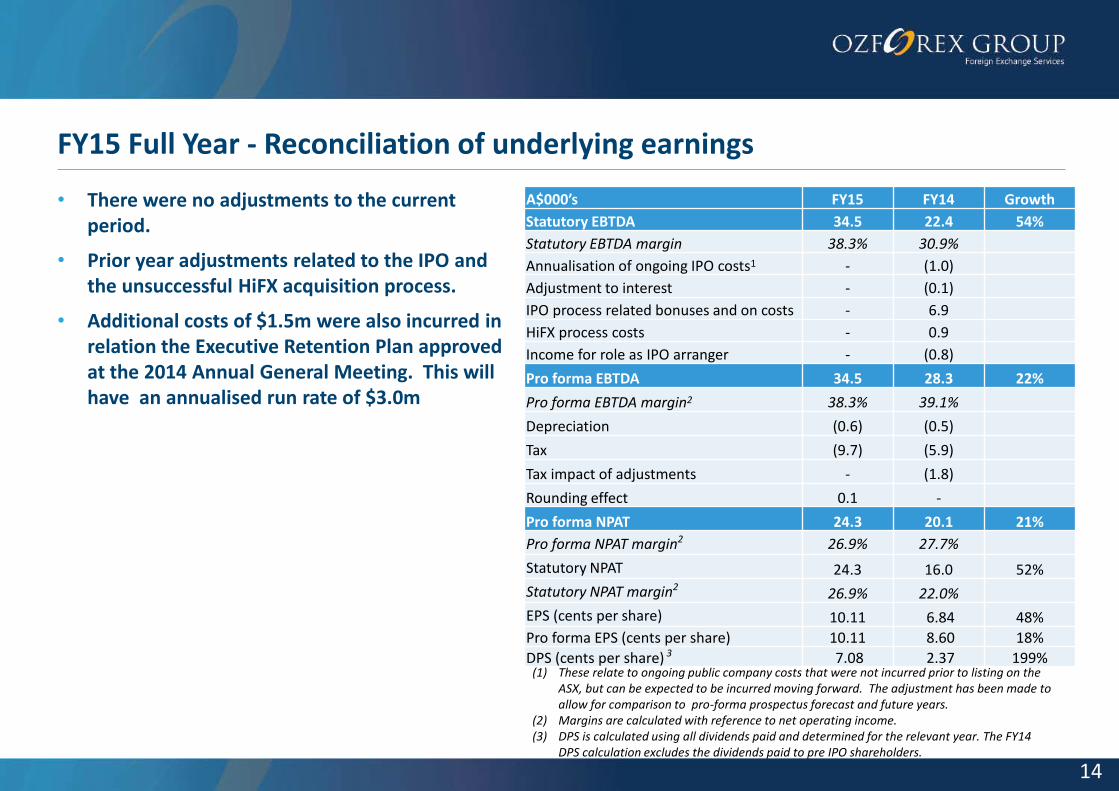
• There were no adjustments to the current period.
• Prior year adjustments related to the IPO and the unsuccessful HiFX acquisition process.
• Additional costs of $1.5m were also incurred in relation the Executive Retention Plan approved at the 2014 Annual General Meeting. This will have an annualised run rate of $3.0m
(1) These relate to ongoing public company costs that were not incurred prior to listing on the ASX, but can be expected to be incurred moving forward. The adjustment has been made to allow for comparison to pro-forma prospectus forecast and future years.
(2) Margins are calculated with reference to net operating income. (3) DPS is calculated using all dividends paid and determined for the relevant year. The FY14
DPS calculation excludes the dividends paid to pre IPO shareholders.
A$000’s FY15 FY14 Growth
Statutory EBTDA 34.5 22.4 54%
Statutory EBTDA margin 38.3% 30.9%
Annualisation of ongoing IPO costs1 - (1.0)
Adjustment to interest - (0.1)
IPO process related bonuses and on costs - 6.9
HiFX process costs - 0.9
Income for role as IPO arranger - (0.8)
Pro forma EBTDA 34.5 28.3 22%
Pro forma EBTDA margin2 38.3% 39.1%
Depreciation (0.6) (0.5)
Tax (9.7) (5.9)
Tax impact of adjustments - (1.8)
Rounding effect 0.1 -
Pro forma NPAT 24.3 20.1 21%
Pro forma NPAT margin2 26.9% 27.7%
Statutory NPAT 24.3 16.0 52%
Statutory NPAT margin2 26.9% 22.0%
EPS (cents per share) 10.11 6.84 48%
Pro forma EPS (cents per share) 10.11 8.60 18%
DPS (cents per share) 3 7.08 2.37 199%
FY15 Full Year - Balance sheet as at 31 March 2015 ($Am)
15
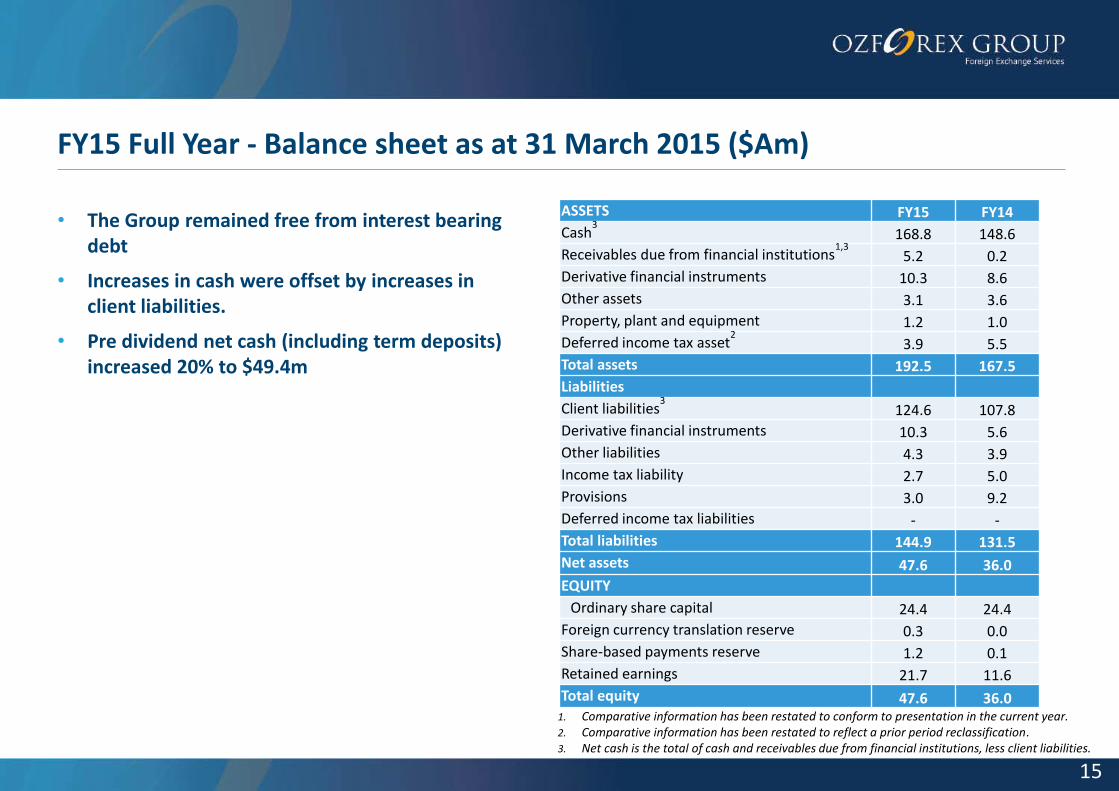
• The Group remained free from interest bearing debt
• Increases in cash were offset by increases in client liabilities.
• Pre dividend net cash (including term deposits) increased 20% to $49.4m
ASSETS FY15 FY14
Cash3
168.8 148.6
Receivables due from financial institutions1,3
5.2 0.2
Derivative financial instruments 10.3 8.6
Other assets 3.1 3.6
Property, plant and equipment 1.2 1.0
Deferred income tax asset2
3.9 5.5
Total assets 192.5 167.5
Liabilities
Client liabilities3 124.6 107.8
Derivative financial instruments 10.3 5.6
Other liabilities 4.3 3.9
Income tax liability 2.7 5.0
Provisions 3.0 9.2
Deferred income tax liabilities - -
Total liabilities 144.9 131.5
Net assets 47.6 36.0
EQUITY
Ordinary share capital 24.4 24.4
Foreign currency translation reserve 0.3 0.0
Share-based payments reserve 1.2 0.1
Retained earnings 21.7 11.6
Total equity 47.6 36.0
1. Comparative information has been restated to conform to presentation in the current year. 2. Comparative information has been restated to reflect a prior period reclassification. 3. Net cash is the total of cash and receivables due from financial institutions, less client liabilities.
FY15 Full Year - Strong cash flow generation
16
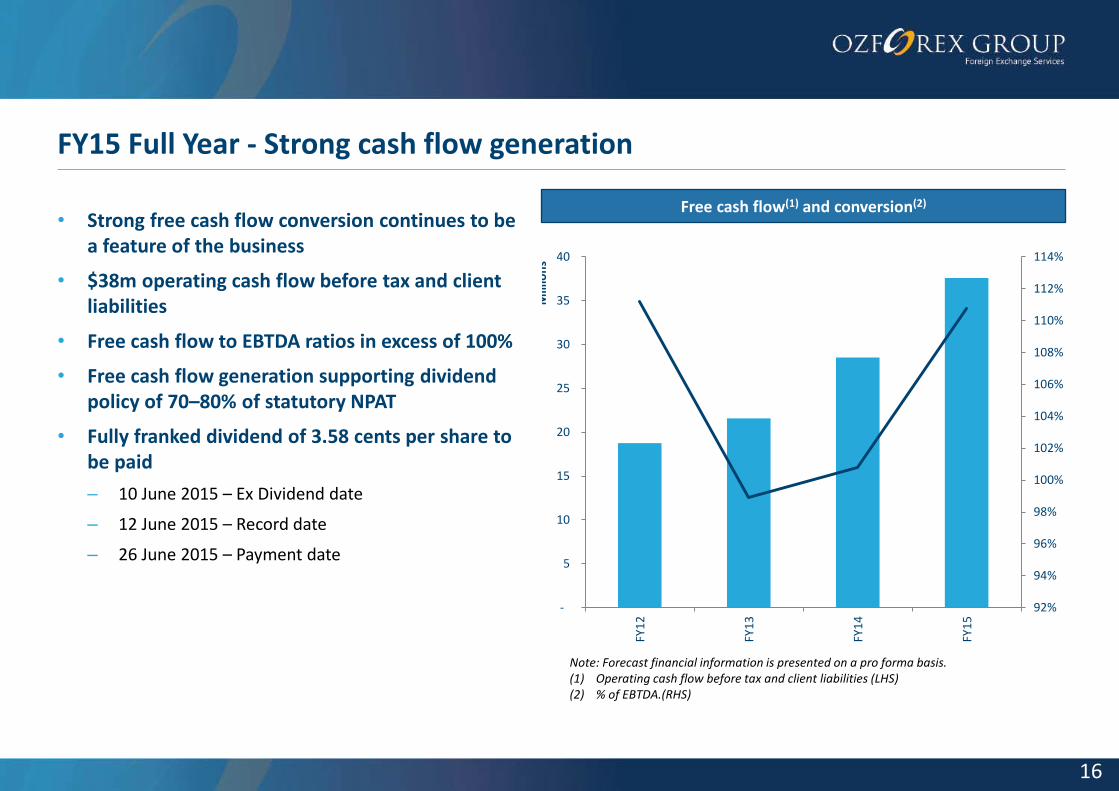
• Strong free cash flow conversion continues to be a feature of the business
• $38m operating cash flow before tax and client liabilities
• Free cash flow to EBTDA ratios in excess of 100%
• Free cash flow generation supporting dividend policy of 70–80% of statutory NPAT
• Fully franked dividend of 3.58 cents per share to be paid
– 10 June 2015 – Ex Dividend date
– 12 June 2015 – Record date
– 26 June 2015 – Payment date
Free cash flow(1) and conversion(2)
Note: Forecast financial information is presented on a pro forma basis. (1) Operating cash flow before tax and client liabilities (LHS) (2) % of EBTDA.(RHS)
92%
94%
96%
98%
100%
102%
104%
106%
108%
110%
112%
114%
-
5
10
15
20
25
30
35
40
FY1
2
FY1
3
FY1
4
FY1
5
Mill
ion
s

Explaining the banking relationships
Our banking relationships
• Our business model necessitates banking relationships that provide the following services:
– transactional banking (to make and receive payments, for and from our clients, in multiple currencies)
– wholesale foreign exchange (hedging and liquidity)
– deposits (overnight cash accounts, term deposits)
• A number of our global banking partners have dedicated teams specifically to services our industry
• We minimise our risk of reliance on any one bank by having multiple banking relationships.
– We consider our banking relationships to be a strategic asset of the business and our strategy of maintaining multiple banking relationships as point of difference over our competitors.
• We are seeing bank regulators in New Zealand, Australia, the US and in April this year the UK, issue statements in support of our industry
• While the Westpac decision was disappointing we have replaced all the services they provided with existing and new banking partners.

Industry Trends
The industry trends we are observing
20
• Banking Industry
– Banking services are increasingly moving online, though the speed of the transition to online varies by country to country
– Digital products and services are being embraced primarily on mobile devices
– Consumers expect an ‘all-channel’ experience from service providers
– Banks and non-Banks are accelerating their adoption and innovating of digital products and services
• Payments Industry
– Consumers are increasingly undertaking international transactions sometimes without even noticing
– Payments are increasingly real time
– Mobile is being used as a payment mechanism
– Online payment specialists are offering peer to peer products
– Crypto currencies have emerged as a small but growing currency alternative
– There are no new significant entrants to the industry in the past 12 months
– Active M&A activity and PE investment is expected to continue over the next 12 months
21
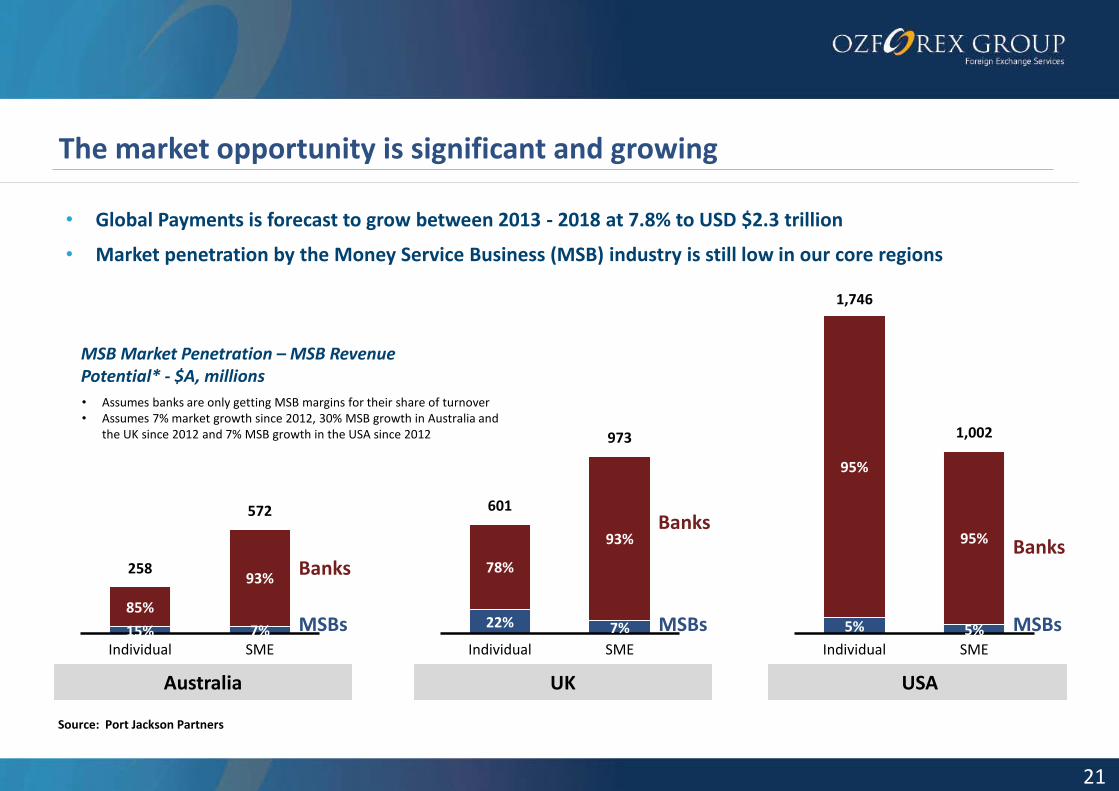
The market opportunity is significant and growing
258
572
15% 7%
85%
93%
Individual SME
Australia
MSBs
Banks
601
973
22% 7%
78%
93%
Individual SME
UK
MSBs
Banks
1,746
1,002
5% 5%
95%
95%
Individual SME
USA
MSBs
Banks
• Assumes banks are only getting MSB margins for their share of turnover • Assumes 7% market growth since 2012, 30% MSB growth in Australia and
the UK since 2012 and 7% MSB growth in the USA since 2012
• Global Payments is forecast to grow between 2013 - 2018 at 7.8% to USD $2.3 trillion
• Market penetration by the Money Service Business (MSB) industry is still low in our core regions
Source: Port Jackson Partners
MSB Market Penetration – MSB Revenue Potential* - $A, millions

Summary and Outlook

Summary and Outlook
• Net operating income increased by 24% on FY14 to $90.1m
• Pro forma EBTDA increased by 22% on FY14 to $34.5m
• EPS of 10.11c per share for FY15, up 18% on FY14 pro forma EPS
• Fully franked final dividend of 3.58c per share (70% dividend payout ratio)
• Full year dividend of 7.08c per share
• Strong underlying business growth reflected in operating metrics
• Continued investment in core operations and business development
• Strong balance sheet and cash flow conversion
• Our new CEO Richard Kimber will provide an update to shareholders on the Company’s strategic direction and outlook at the AGM on August 5th.
The material contained in this document is a presentation of general information about the ASX Group’s activities current as at the date of this presentation (26 May 2015). It is provided in summary and does not purport to be complete. You should not rely upon it as advice for investment purposes as it does not take into account your investment
objectives, financial position or needs. These factors should be considered, with or without professional advice, when deciding if an investment is appropriate. To the extent permitted by law, no responsibility for any loss arising in any way (including by way of negligence) from anyone acting or refraining from acting as a result of this
material is accepted by the ASX Group, including any of its related bodies corporate.