MSI - Presentation - Tunisia_PDF_III
85
MSI London Mobile Systems International Group Gaia - Basic Training Tunisia Tunisia - 10 th - 11 th April 2008 www.msiuk.com Adnan Salkic Confidential This report is confidential and intended solely for the use and information of the audience to whom it is addressed.
Transcript of MSI - Presentation - Tunisia_PDF_III
8/2/2019 MSI - Presentation - Tunisia_PDF_III
http://slidepdf.com/reader/full/msi-presentation-tunisiapdfiii 1/85
MSI LondonMobile Systems International
Group
Gaia - Basic Training
Tunisia
Tunisia - 10th - 11th April 2008
www.msiuk.com
Adnan Salkic
Confidential
This report is confidential and intended solely for the use and
information of the audience to whom it is addressed.

8/2/2019 MSI - Presentation - Tunisia_PDF_III
http://slidepdf.com/reader/full/msi-presentation-tunisiapdfiii 2/85
• Independent specialist provider of solutions.
• Established in London, United Kingdom in 1989.
• Provider of software applications
• Highly experienced wireless consultants
• Long term successful engagements with leading
telecommunication service providers and equipment
manufacturers.
• Engagements in Europe, Middle East, Africa, North
America, CALA and APAC.
MSI – Mobile Systems International

8/2/2019 MSI - Presentation - Tunisia_PDF_III
http://slidepdf.com/reader/full/msi-presentation-tunisiapdfiii 3/85
1989 1992 1999 2000 2001 2002 2006
Mobile Systems Int’
Founded
Metapath Founded
Mobile Systems &
Metapath merged
MSI acquired by Marconi
Marconi Wireless
Ericsson Acquired
Marconi
MSI Ltd
Consultancy
•Established in 1989
•In 1999 Merged with
•Metapath Software International
• Acquired by Marconi in 2000
•Ericsson Acquires Marconi in 2005
• And MSI Consultancy is formed
An independent specialist provider of solutions established in London, United Kingdom since 1989. Our solutio
encompass software applications and highly experienced wireless consultants to wireless communications
providers globally.
MSI – Mobile Systems International

8/2/2019 MSI - Presentation - Tunisia_PDF_III
http://slidepdf.com/reader/full/msi-presentation-tunisiapdfiii 4/85
• 17 years experience in the wireless communication
industry.
• More than 600 consultants deployed across the
world
• Global 'Centers of Excellence' for GSM, CDMA,
UMTS, LMDS, TETRA, WiMAX.
• Extensive Engineering expertise in license bids,network planning, network management and
performance optimization.
• In excess of 100,000 cell sites and Node-Bs have been designed and optimized by our experts globally;
• State of the art software applications:- Gaia network planning and optimization application;
- Focus Strategic decision support and performance management application; • Outstanding world wide customer support;
• Strategic alliances with a number of global companies and solution providers.
MSI – Background
8/2/2019 MSI - Presentation - Tunisia_PDF_III
http://slidepdf.com/reader/full/msi-presentation-tunisiapdfiii 5/85
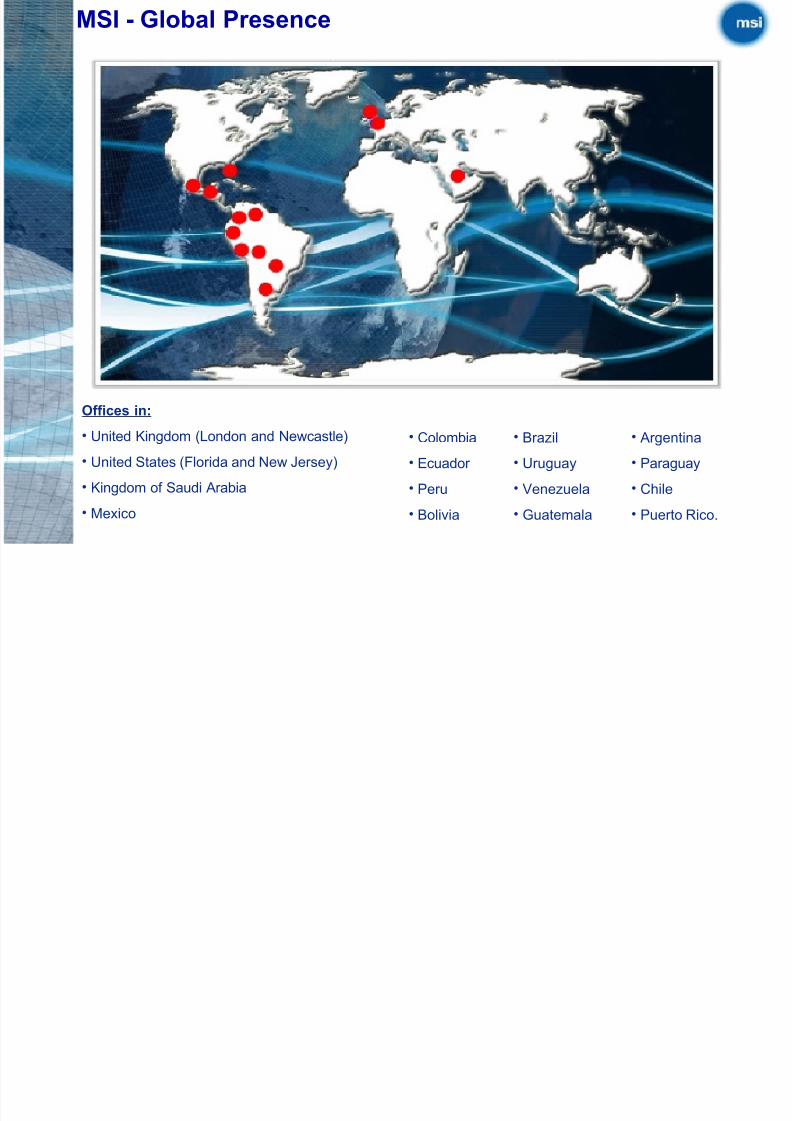
Mobile Services International Inc.
Offices in:• United Kingdom (London and Newcastle)
• United States (Florida and New Jersey)
• Kingdom of Saudi Arabia
• Mexico
• Colombia
• Ecuador
• Peru
• Bolivia
• Brazil
• Uruguay
• Venezuela
• Guatemala
• Argentina
• Paraguay
• Chile
• Puerto Rico.
MSI - Global Presence
8/2/2019 MSI - Presentation - Tunisia_PDF_III
http://slidepdf.com/reader/full/msi-presentation-tunisiapdfiii 6/85
• Saudi Telecom;
• NEC Europe;
• Etisalat Egypt;
•CERT Tunisia;
• MTC / ZAIN;
• NAWRAS OMAN
• Go Mobile Malta– (under trial);
References

8/2/2019 MSI - Presentation - Tunisia_PDF_III
http://slidepdf.com/reader/full/msi-presentation-tunisiapdfiii 7/85
MSI - Credentials
8/2/2019 MSI - Presentation - Tunisia_PDF_III
http://slidepdf.com/reader/full/msi-presentation-tunisiapdfiii 8/85
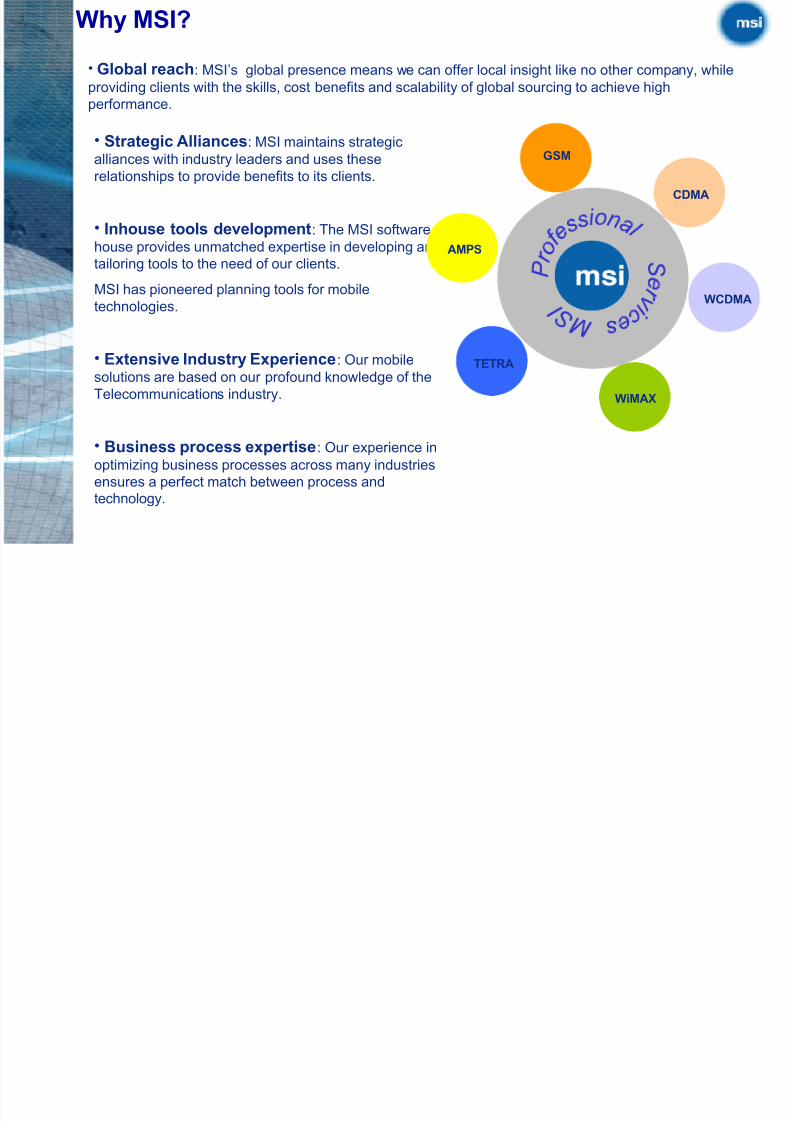
Why MSI?
• Strategic Alliances: MSI maintains strategicalliances with industry leaders and uses these
relationships to provide benefits to its clients.
• Inhouse tools development: The MSI software
house provides unmatched expertise in developing and
tailoring tools to the need of our clients.
MSI has pioneered planning tools for mobile
technologies.
• Extensive Industry Experience: Our mobile
solutions are based on our profound knowledge of the
Telecommunications industry.
• Business process expertise: Our experience in
optimizing business processes across many industries
ensures a perfect match between process andtechnology.
GSM
AMPS
CDMA
WCDMA
WiMAX
TETRA
• Global reach: MSI’s global presence means we can offer local insight like no other company, while
providing clients with the skills, cost benefits and scalability of global sourcing to achieve high
performance.

8/2/2019 MSI - Presentation - Tunisia_PDF_III
http://slidepdf.com/reader/full/msi-presentation-tunisiapdfiii 9/85
Network
Evolution
Network
DesignNetwork
Operations
Network
Performance
NETWORK SERVICE CYCLE
C U S T OME
RE X P E RI E N C E
• Network
Implementation
• Network
configuration
• Testing and
commissioning
• Performanceimprovements
• Benchmarking
• Optimisation
• Process reviews
• Establish KPIs
• Core Network
Performance
• RF NetworkPerformance
• Data/IP Network
Performance
• SS Network
Performance
• Transmission Network
Performance
• VAS Performance
• Technology
Selection
• OPEX/CAPEX
requirements
• Feature
Deployment
• Marketing
requirements
• Strategy for
coverage & services
• Core Network Design
• RF Network Design
• IP Network Design
• Transmission NetworkDesign
• VAS Infrastructure
Design
MSI - Solutions
MSI E ti
8/2/2019 MSI - Presentation - Tunisia_PDF_III
http://slidepdf.com/reader/full/msi-presentation-tunisiapdfiii 10/85
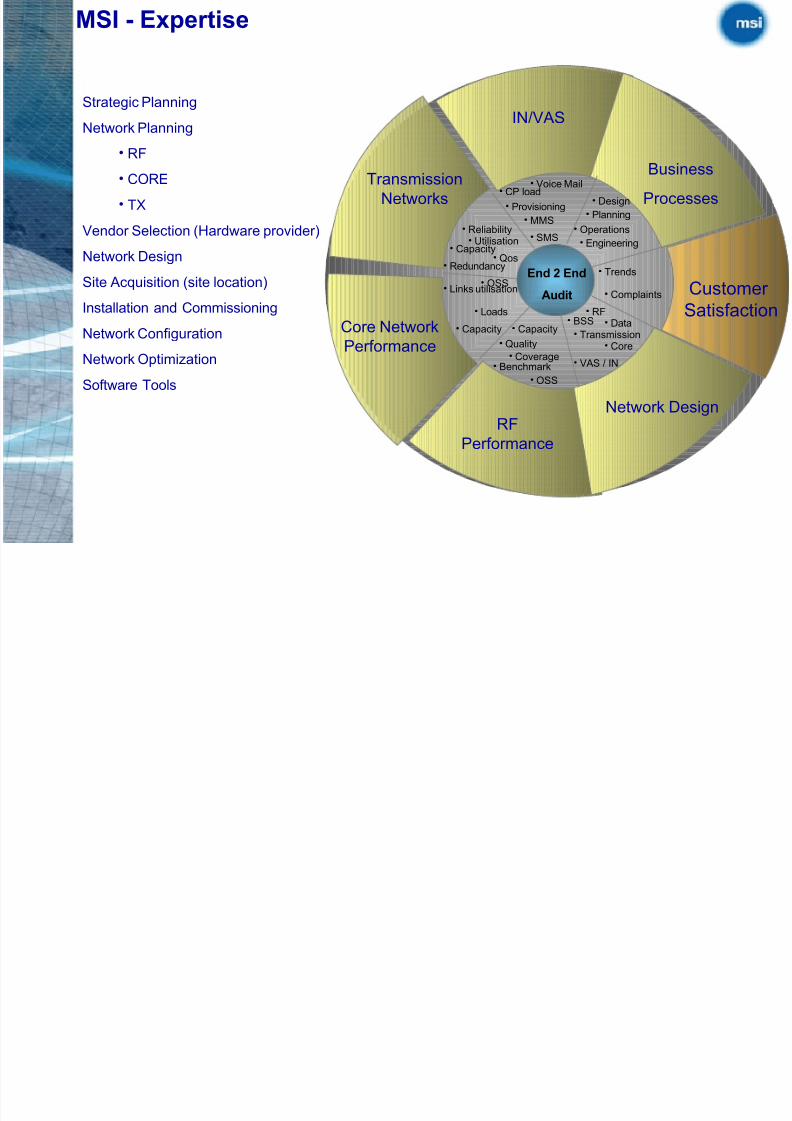
Network DesignRF
Performance
Core Network
Performance
Transmission
Networks
IN/VAS
Business
Processes
Customer
Satisfaction• BSS
• Core
• RF• Data
• Transmission
• VAS / IN• Benchmark
• Quality
• Capacity
• Coverage
• OSS
• OSS
• Loads
• Links utilisation
• Capacity
• Utilisation
• Reliability
• Redundancy
• Capacity• Qos
• CP load
• Provisioning
• MMS
• SMS• Operations
End 2 EndAudit
• Design
• Engineering
• Planning
• Trends
• Complaints
• Voice Mail
Strategic Planning
Network Planning
• RF
• CORE
• TX
Vendor Selection (Hardware provider)
Network Design
Site Acquisition (site location)
Installation and Commissioning
Network Configuration
Network Optimization
Software Tools
MSI - Expertise
MSI V l Add

8/2/2019 MSI - Presentation - Tunisia_PDF_III
http://slidepdf.com/reader/full/msi-presentation-tunisiapdfiii 11/85
O
p er a t or
M S I
C h al l en g e s
Customer Satisfaction
Operator
Success
Evolution
Network Quality
New ServicesRevenue
Profit
Rollout Services
Performance Services
Strategic Planning
BusinessProcesses
Technology Challenges
Training
Competition
Technical Issues
Logistics
Hardware / Software Capabilities
Resources
MSI – Value Add
MSI U d t di M k t N d
8/2/2019 MSI - Presentation - Tunisia_PDF_III
http://slidepdf.com/reader/full/msi-presentation-tunisiapdfiii 12/85
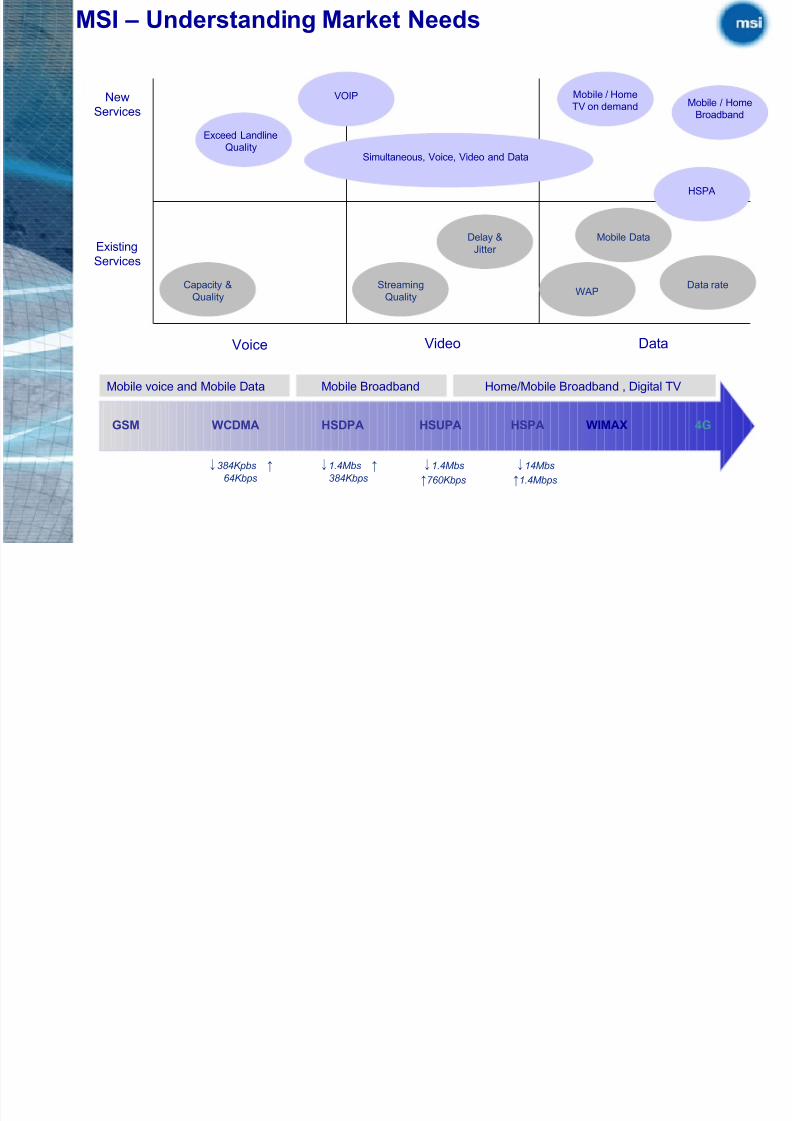
MSI – Understanding Market Needs
New
Services
Existing
Services
Capacity &
Quality
Voice Video Data
Exceed Landline
Quality
VOIP
Simultaneous, Voice, Video and Data
WAP
Mobile Data
HSPA
Mobile / Home
Broadband
Streaming
Quality
Mobile / Home
TV on demand
Delay &
Jitter
Data rate
GSM WCDMA HSDPA HSPA WIMAX 4G
Mobile voice and Mobile Data Mobile Broadband Home/Mobile Broadband , Digital TV
↓384Kpbs ↑ 64Kbps
↓1.4Mbs ↑ 384Kbps
↓14Mbs
↑1.4Mbps
HSUPA
↓1.4Mbs
↑760Kbps
MSI N R St Id tifi ti
8/2/2019 MSI - Presentation - Tunisia_PDF_III
http://slidepdf.com/reader/full/msi-presentation-tunisiapdfiii 13/85
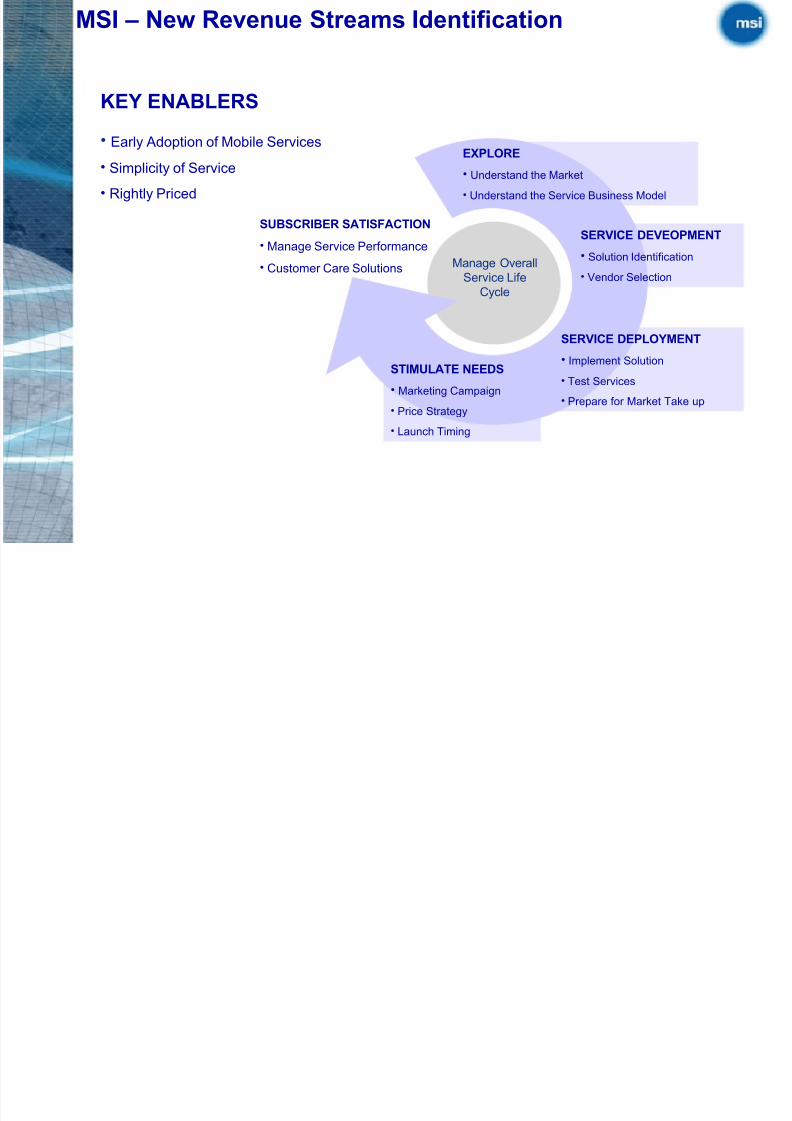
MSI – New Revenue Streams Identification
EXPLORE
• Understand the Market
• Understand the Service Business Model
SERVICE DEVEOPMENT
• Solution Identification
• Vendor Selection
SERVICE DEPLOYMENT
• Implement Solution
• Test Services
• Prepare for Market Take up
STIMULATE NEEDS
• Marketing Campaign
• Price Strategy
• Launch Timing
SUBSCRIBER SATISFACTION
• Manage Service Performance
• Customer Care Solutions Manage Overall
Service LifeCycle
KEY ENABLERS
• Early Adoption of Mobile Services
• Simplicity of Service
• Rightly Priced
S
8/2/2019 MSI - Presentation - Tunisia_PDF_III
http://slidepdf.com/reader/full/msi-presentation-tunisiapdfiii 14/85
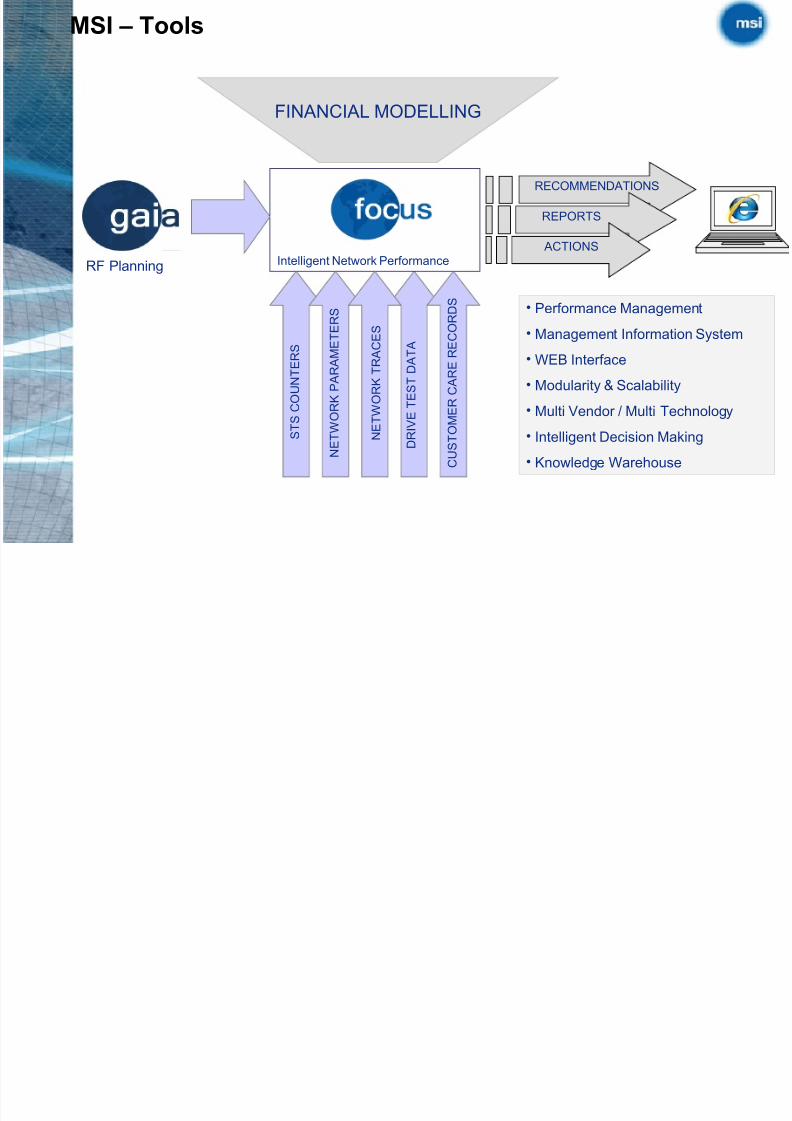
MSI – Tools
D R I V E
T E S T D A T A
RF Planning Intelligent Network Performance
REPORTS
RECOMMENDATIONS
ACTIONS
S T S
C O U N T E R S
N E T W O
R K P A R A M E T E R S
N E T W O R K T R A C E S
C U S T O M E R C A R E R E C O R D S
FINANCIAL MODELLING
• Performance Management
• Management Information System
• WEB Interface
• Modularity & Scalability
•Multi Vendor / Multi Technology
• Intelligent Decision Making
• Knowledge Warehouse
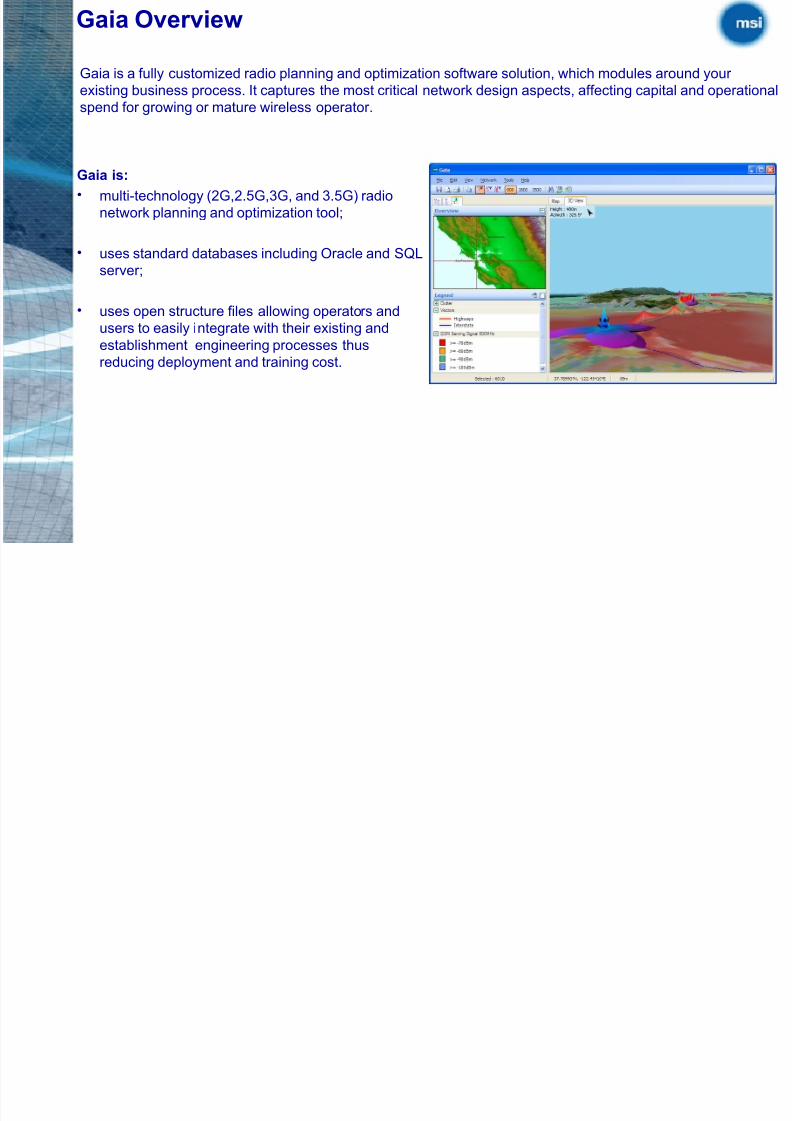
Gaia Overview
8/2/2019 MSI - Presentation - Tunisia_PDF_III
http://slidepdf.com/reader/full/msi-presentation-tunisiapdfiii 15/85
Gaia is:
• multi-technology (2G,2.5G,3G, and 3.5G) radio
network planning and optimization tool;
• uses standard databases including Oracle and SQL
server;
• uses open structure files allowing operators and
users to easily integrate with their existing and
establishment engineering processes thus
reducing deployment and training cost.
Gaia is a fully customized radio planning and optimization software solution, which modules around your
existing business process. It captures the most critical network design aspects, affecting capital and operationa
spend for growing or mature wireless operator.
Gaia Overview
Gaia Overview
8/2/2019 MSI - Presentation - Tunisia_PDF_III
http://slidepdf.com/reader/full/msi-presentation-tunisiapdfiii 16/85
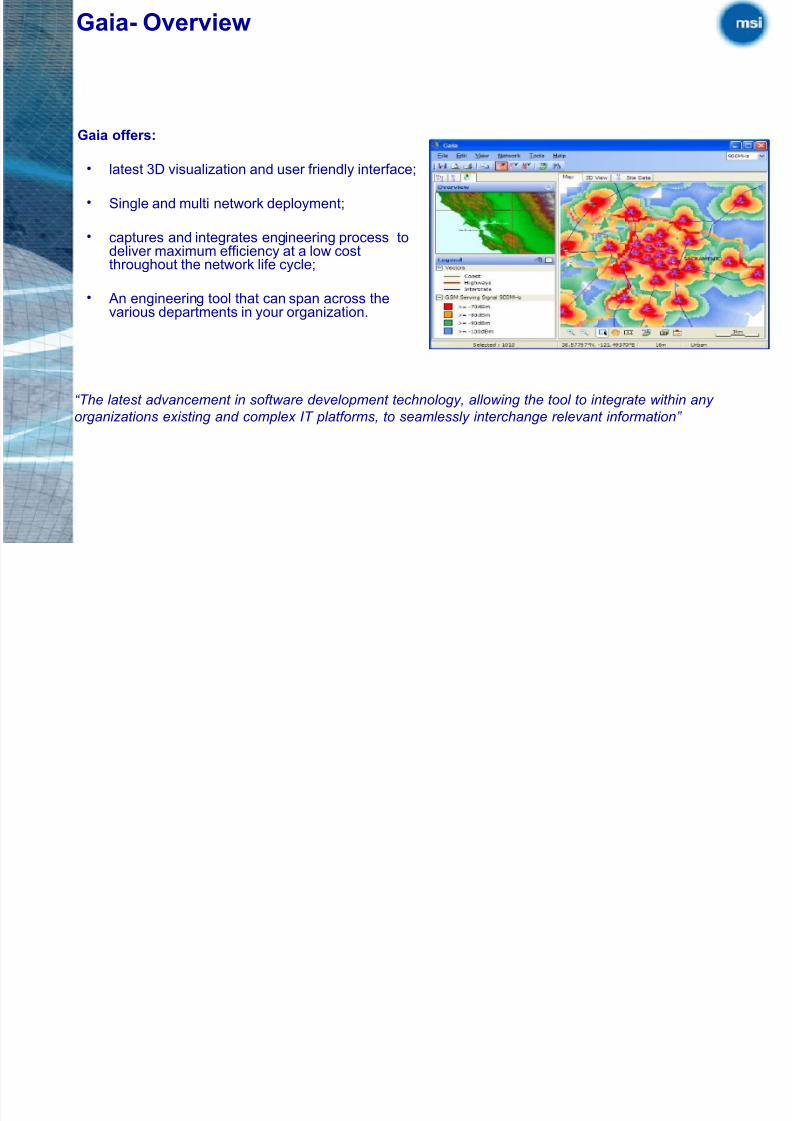
Gaia offers:
• latest 3D visualization and user friendly interface;
• Single and multi network deployment;
• captures and integrates engineering process todeliver maximum efficiency at a low costthroughout the network life cycle;
• An engineering tool that can span across thevarious departments in your organization.
Gaia- Overview
“The latest advancement in software development technology, allowing the tool to integrate within any
organizations existing and complex IT platforms, to seamlessly interchange relevant information”
Gaia- Overview
8/2/2019 MSI - Presentation - Tunisia_PDF_III
http://slidepdf.com/reader/full/msi-presentation-tunisiapdfiii 17/85
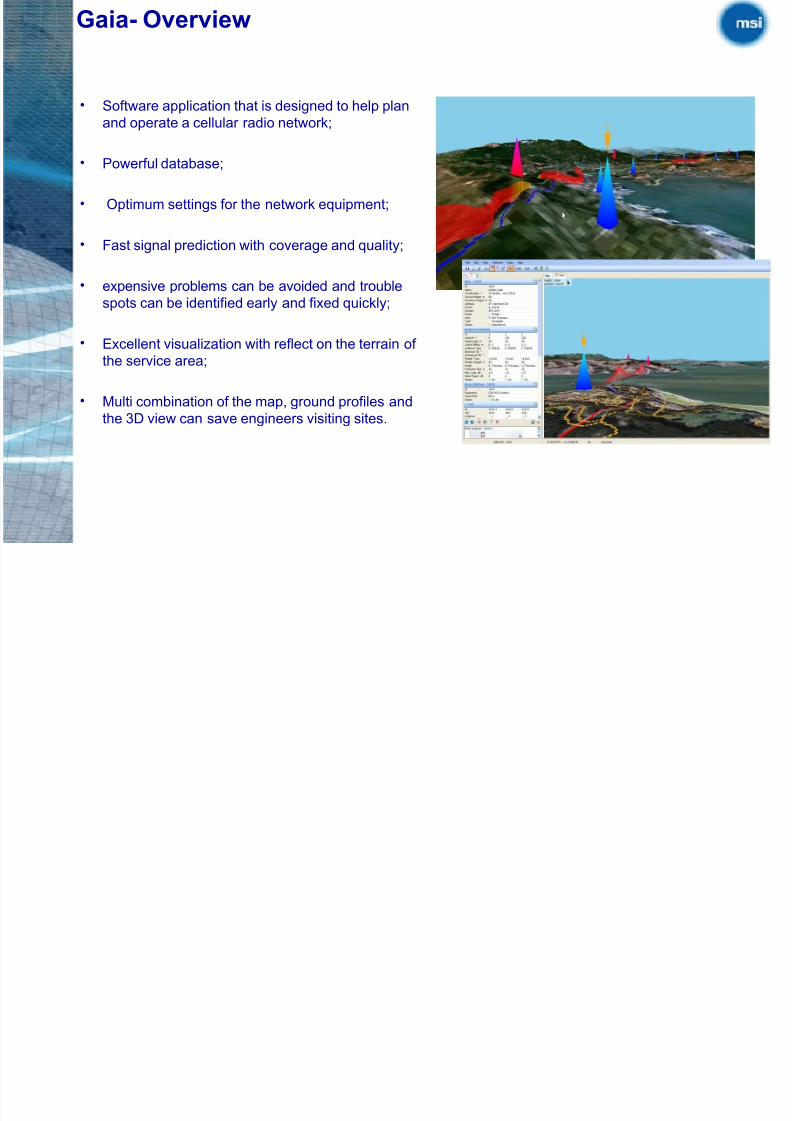
• Software application that is designed to help plan
and operate a cellular radio network;
• Powerful database;
• Optimum settings for the network equipment;
• Fast signal prediction with coverage and quality;
• expensive problems can be avoided and troublespots can be identified early and fixed quickly;
• Excellent visualization with reflect on the terrain of
the service area;
• Multi combination of the map, ground profiles and
the 3D view can save engineers visiting sites.
Gaia- Overview
Why Gaia?

8/2/2019 MSI - Presentation - Tunisia_PDF_III
http://slidepdf.com/reader/full/msi-presentation-tunisiapdfiii 18/85
• RF Design
• Multi Technology
• User Friendly Interface
• Web Enabled
• Full 2D and 3D representation of network
• Powerful GIS functionality• GSM coverage and interference layers
• Full UMTS and HSDPA analysis
Why Gaia?
Why Gaia?

8/2/2019 MSI - Presentation - Tunisia_PDF_III
http://slidepdf.com/reader/full/msi-presentation-tunisiapdfiii 19/85
• 3D visualization of antenna patterns;
• Automatic Scrambling Code Planning;
• Drive test survey presentation in 2D and 3D views;
• Compatibility with NASA Worldwide data;
• Easy of use, and intuitive user interface;
• Unique 3D view of the planning area;
• Build in web browser for integration with internet;
• Ability to Export-Import on Goggle Earth and MapInfo;
• Real time predictions capabilities.
2D - 3D
UMTS
2G-3G
GSM
HSDPA
WCDMA
RD
Design
Why Gaia?
8/2/2019 MSI - Presentation - Tunisia_PDF_III
http://slidepdf.com/reader/full/msi-presentation-tunisiapdfiii 20/85
8/2/2019 MSI - Presentation - Tunisia_PDF_III
http://slidepdf.com/reader/full/msi-presentation-tunisiapdfiii 21/85
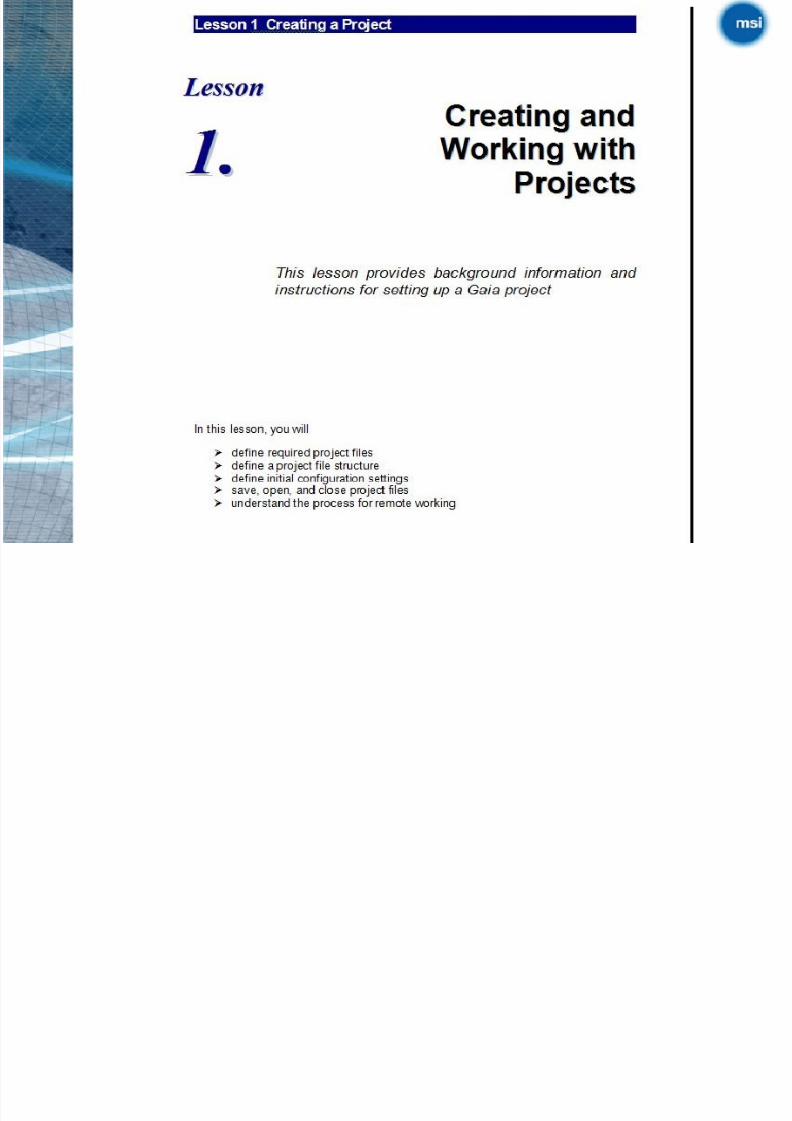
Lesson 1
8/2/2019 MSI - Presentation - Tunisia_PDF_III
http://slidepdf.com/reader/full/msi-presentation-tunisiapdfiii 22/85
Gaia training overview
During the basic training course, you will learn about the many description of Gaia. Your
instructor will guide you through RF engineering workflow so that you can practice using
Gaia to perform network-planning activities.
Course schedule
During this course, you will learn about and practice the procedures that you need in order to
use Gaia effectively in your daily work. In order to meet the needs of each class, the
schedule and the time spent on each topic may vary between courses. You will have a break
every couple of hours and a one-hour lunch break around noon each day.
Course format
Each lesson in this training manual contains the following types of information:
• Learning objectives—what you will be able to do after completing the lesson;
• Process flow—a high-level view of the steps required to complete a task;
• Background information—what you need to know about a Gaia feature before you begin a
related procedure;
• Procedure introductions—the what, when, and why for each procedure;• Step-by-step procedures—how to perform a task and to obtain the expected results.
Lesson 1
8/2/2019 MSI - Presentation - Tunisia_PDF_III
http://slidepdf.com/reader/full/msi-presentation-tunisiapdfiii 23/85
Gaia System Requirements
• Gaia requires the following minimum specification:
• Windows 2000 Professional, Windows XP
• Intel Pentium™ 4 Processor with a clock speed of 2GHz
• Hard disc space of 1Gb/ RAM 256Mb but 1024Mb (1 Gb) is recommended Menus
• The menu options provide access to commands for File, Edit, View, Network, Tools, Help.
As you work through the exercises in this course, you will learn how to use the menus.
Gaia basic terminology
• The following terms are commonly used throughout this course:
• Project - all Gaia data relating to the network
• Configuration - the information relating to the contents of the Project
• Network - all equipment contained within the project
• Site - location and logical container for multiple cells
• Cell - equipment on a site that serves a coverage area
• Grid - type of file that contains raster data
• Predictions – information relating to path loss due to propagation and propagation path.
• Model - information relating to the method used to determine the prediction
• Clutter - information about the environment such as land use
• Analysis layers - prediction files generated by the network analysis
• Survey data - drive test data including carrier wave and scanner data
• Table - flat file used to store data records such as site and cell
Lesson 1
8/2/2019 MSI - Presentation - Tunisia_PDF_III
http://slidepdf.com/reader/full/msi-presentation-tunisiapdfiii 24/85
Gaia Projects Introduction
The first step in using Gaia is to set up a project and configuration.
A Gaia project relates to all information required by Gaia for the network. This includes:
• Mapping• Site database
• Network files and configuration
• Equipment files
• Properties, such as color profiles, for the analysis layers that you will generate
• System settings, such as power units, height, and distance
At start-up, Gaia needs a minimum of a Mapping folder (containing Heights and Clutter data
inappropriate folders), a Network folder, and Equipment folder. Several other files and folders are
essential requirements for Gaia operation, but Gaia will generate default files in appropriate folders
if data does not already exist.
Once you have defined a project and run analyses, you can create new projects by copying folders
in new locations. In this way, you can make changes while retaining the original data. You can
create one project for one network, or you can create multiple projects for one network in order to
see the effects of changing the network configuration
Lesson 1

8/2/2019 MSI - Presentation - Tunisia_PDF_III
http://slidepdf.com/reader/full/msi-presentation-tunisiapdfiii 25/85
For example, you could create a project that includes only sites for a network that covers a
particular geographic area. Then you could create a second project that uses the same network
settings, equipment and models, but that covers a network that is geographically adjacent to the
first one.
• You must retain the file structure within the Mapping, Equipment and Network folders. If you move these folders you must change the file paths in the configuration file to reflect those changes.
Files and folder structure
The majority of the files are stored in three folders;
the Network folder , the Equipment folder , and the
Mapping folder . The location of these folders isdefined in the configuration file.
The configuration filename convention is
<filename>.config. The default filename for the Gaia
configuration file is Gaia.config.
The simplest way to start Gaia is from a shortcut on
the Windows desktop or Start menu. The path to the
configuration file can be specified in the Target field
in the properties of the shortcut, where the syntax
used is <Gaia Executable path> <Configuration file
path>.
Lesson 1
8/2/2019 MSI - Presentation - Tunisia_PDF_III
http://slidepdf.com/reader/full/msi-presentation-tunisiapdfiii 26/85
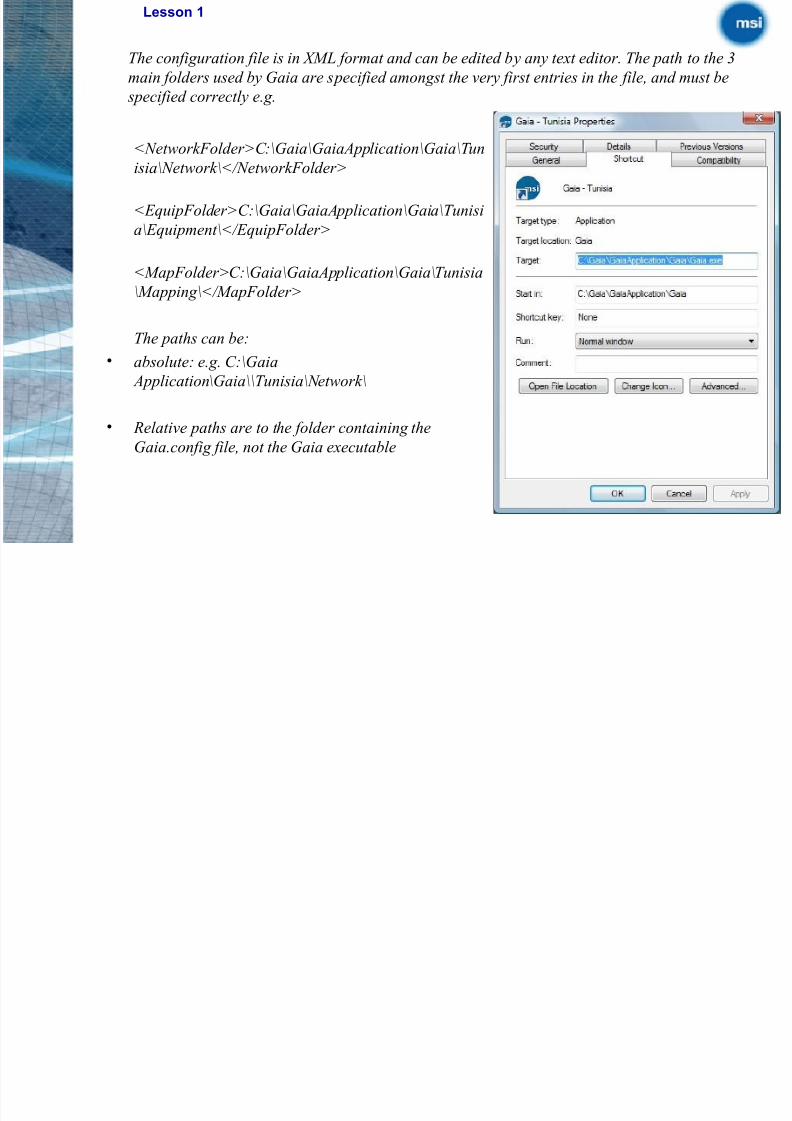
<NetworkFolder>C:\Gaia\GaiaApplication\Gaia\Tunisia\Network\</NetworkFolder>
<EquipFolder>C:\Gaia\GaiaApplication\Gaia\Tunisi
a\Equipment\</EquipFolder>
<MapFolder>C:\Gaia\GaiaApplication\Gaia\Tunisia
\Mapping\</MapFolder>
The paths can be:
• absolute: e.g. C:\Gaia
Application\Gaia\\Tunisia\Network\
• Relative paths are to the folder containing the
Gaia.config file, not the Gaia executable
The configuration file is in XML format and can be edited by any text editor. The path to the 3
main folders used by Gaia are specified amongst the very first entries in the file, and must be
specified correctly e.g.
Lesson 1

8/2/2019 MSI - Presentation - Tunisia_PDF_III
http://slidepdf.com/reader/full/msi-presentation-tunisiapdfiii 27/85
Network Folder
The Database tag defines how the data is stored: <Database>MS Access</Database>
Formats supported are:
Tag :
– MS Access – XML – Zipped XML
Mapping Folder
Including the size of the mapping data tiles, the extent limits of the overview map, the projection information, and the land usage index of the values in the clutter data.
The following table gives details of sub-folders contained within the Mapping folder:
3D Objects: – Height – Clutter – Vector – Text – Overview.bmp
Equipment folder
This folder contains all the files relating to the equipment used by the project:
Antenna/ Base Station/ Feeder/ Mobile/ ModelServices
Lesson 1
8/2/2019 MSI - Presentation - Tunisia_PDF_III
http://slidepdf.com/reader/full/msi-presentation-tunisiapdfiii 28/85
Workflow for creating a project
To set up a Gaia project, complete the following tasks.
• Step 1: Source appropriate Mapping data (with Heights, Clutter and mapping.config as a
minimum)
• Step 2: Create the Equipment and Network folders
• Step 3: Copy the gaia.config file from the folder containing the Gaia executable
• Step 4: Edit the copy of the gaia.config file to specify the following:
• Database type – Edit the database tag e.g. <Database>MS Access</Database>
• File paths for Network, Equipment and Mapping folders, e.g.
<NetworkFolder>C:\Gaia\GaiaApplication\Gaia\Tunisia\Network\</NetworkFolder>
<EquipFolder>C:\Gaia\GaiaApplication\Gaia\Tunisia\Equipment\</EquipFolder>
<MapFolder>C:\Gaia\GaiaApplication\Gaia\Tunisia\Mapping\</MapFolder>
• Step 5: Save the configuration file with a new name.
• Step 6: Create a desktop shortcut to the Gaia executable.
• Step 7: Specify the path to the configuration file in the desktop shortcut, and save the changes.
• Step 8: Start Gaia from the desktop shortcut.
• Step 9: Gaia should start without prompting for file paths.
• Step 10: To close the project Choose File ♦ Exit.
Lesson 1

8/2/2019 MSI - Presentation - Tunisia_PDF_III
http://slidepdf.com/reader/full/msi-presentation-tunisiapdfiii 29/85
Saving Projects
The project settings are separate from the project or network/site data, is saved as the project
configuration and is stored in the configuration file. This includes the map items currently
displayed in the map window, as well as project options settings, such as contour settings, network
settings, WCDMA settings etc.
The configuration is saved by selecting File ♦ Save Configuration.
The project data (network and sites information) is stored separately. Network, equipment,
antennas, models etc are stored in their respective files in the Equipment and Network folders.
The site information is stored in the site database.To save the site data select File ♦ Save Configuration.
8/2/2019 MSI - Presentation - Tunisia_PDF_III
http://slidepdf.com/reader/full/msi-presentation-tunisiapdfiii 30/85
Lesson 2

8/2/2019 MSI - Presentation - Tunisia_PDF_III
http://slidepdf.com/reader/full/msi-presentation-tunisiapdfiii 31/85
Gaia Project Display Settings and Options Introduction
The left panel contains information about the activesites, site data, and legend. The right panel containsthe map tab, 3D view tab, site data tab, and a number of snap tabs.
Map View
The color of the site/antenna is defined in the Optionswindow located under the Tools menu. Clicking on asite makes that site the selected site, thus displaying itin one of the Site Data tabs.
The status bar at the bottom of Gaia’s window willdisplay the current coordinates of the mouse pointer inthe map, and also the ground height at that point.
The map context menu contains the following functions – Copy – View Path Loss – Signal Strength – Neighbors – Co-Channel – Zoom
– Center On – Measure / Measure Profile – Show/Hide Profile – Snapshot – Visible Items
Lesson 2
8/2/2019 MSI - Presentation - Tunisia_PDF_III
http://slidepdf.com/reader/full/msi-presentation-tunisiapdfiii 32/85
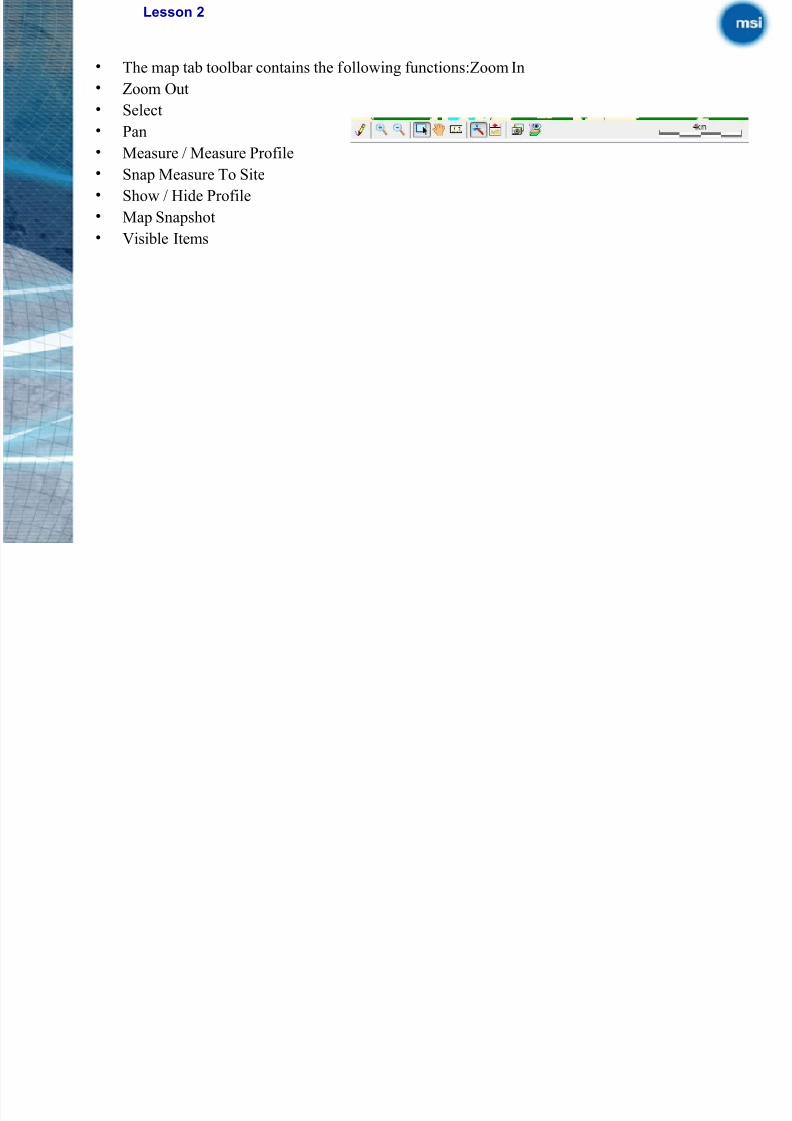
• The map tab toolbar contains the following functions:Zoom In
• Zoom Out
• Select
• Pan
• Measure / Measure Profile
• Snap Measure To Site
• Show / Hide Profile
• Map Snapshot
• Visible Items
Lesson 2
8/2/2019 MSI - Presentation - Tunisia_PDF_III
http://slidepdf.com/reader/full/msi-presentation-tunisiapdfiii 33/85
Map Profile
The Profile sub-panel of the map displays a cross-section of the terrain. The profile panel is displayeeither by clicking the Show Profile button on the map’s toolbar, or by choosing the option on themap’s context menu.
Drawing the profile is achieved by either:
i) Clicking on the Measure Profile icon on the map toolbar and then clicking on the startand end points.
ii) Selecting Measure Profile from the map’s context menu and then clicking on the startand end points.
While drawing the profile, the end point shows the distance and azimuth from the start point.
Lesson 2
8/2/2019 MSI - Presentation - Tunisia_PDF_III
http://slidepdf.com/reader/full/msi-presentation-tunisiapdfiii 34/85
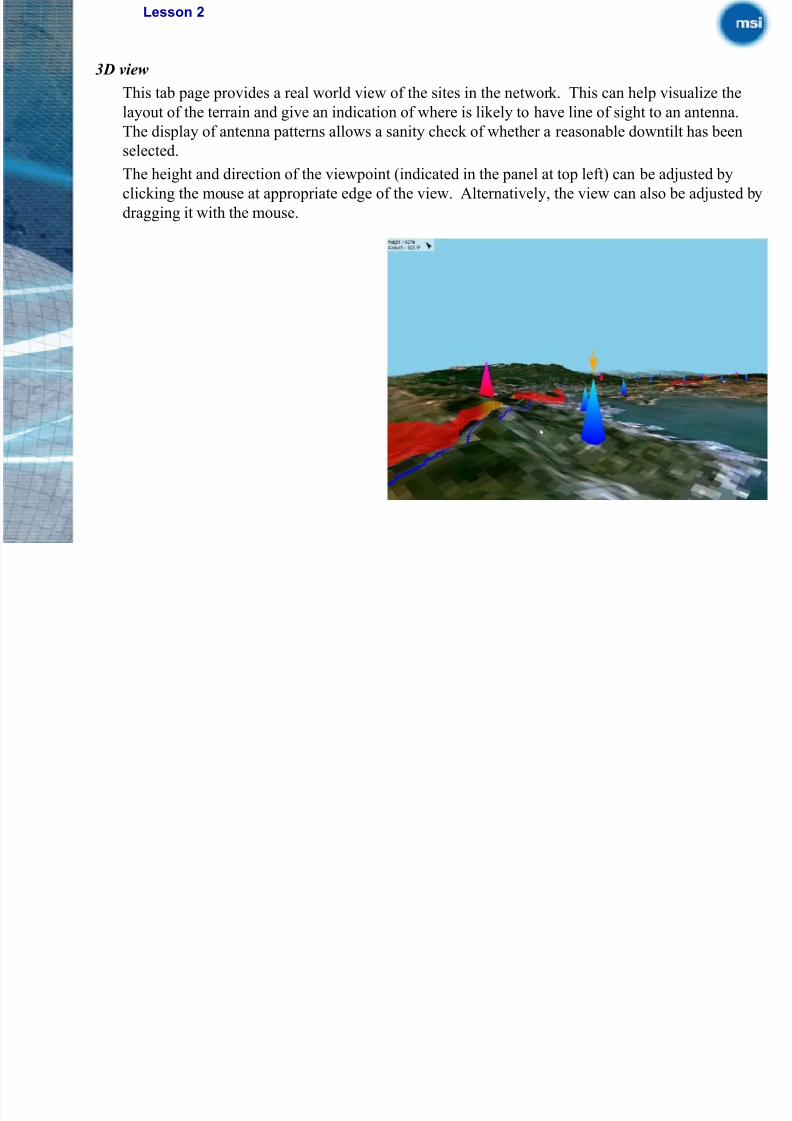
3D view
This tab page provides a real world view of the sites in the network. This can help visualize the
layout of the terrain and give an indication of where is likely to have line of sight to an antenna.
The display of antenna patterns allows a sanity check of whether a reasonable downtilt has been
selected.
The height and direction of the viewpoint (indicated in the panel at top left) can be adjusted by
clicking the mouse at appropriate edge of the view. Alternatively, the view can also be adjusted by
dragging it with the mouse.
Lesson 2
8/2/2019 MSI - Presentation - Tunisia_PDF_III
http://slidepdf.com/reader/full/msi-presentation-tunisiapdfiii 35/85
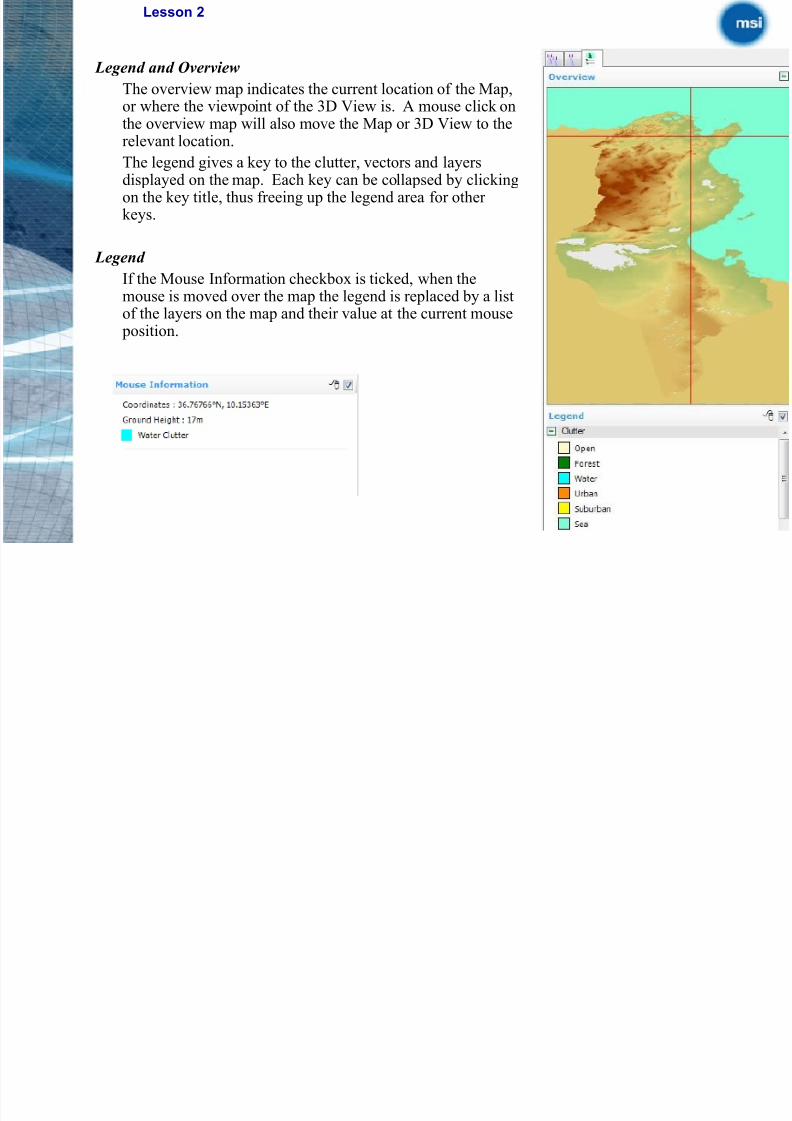
Legend and Overview
The overview map indicates the current location of the Map,or where the viewpoint of the 3D View is. A mouse click onthe overview map will also move the Map or 3D View to the
relevant location.The legend gives a key to the clutter, vectors and layersdisplayed on the map. Each key can be collapsed by clickingon the key title, thus freeing up the legend area for other keys.
Legend
If the Mouse Information checkbox is ticked, when themouse is moved over the map the legend is replaced by a listof the layers on the map and their value at the current mouse position.
Lesson 2

8/2/2019 MSI - Presentation - Tunisia_PDF_III
http://slidepdf.com/reader/full/msi-presentation-tunisiapdfiii 36/85
Options
The Options window allows the customization of several aspects of Gaia, including the colors and
size of items displayed on the Map and 3D View. The window is divided over 10 tab pages,
General, Contours, Profile, WCDMA, Frequency, Sites, Mapping, Text, Vectors and Clutter. The
settings defined in the options window can be stored for future sessions by selecting File, SaveConfiguration.
Lesson 3
8/2/2019 MSI - Presentation - Tunisia_PDF_III
http://slidepdf.com/reader/full/msi-presentation-tunisiapdfiii 37/85
Lesson 3

8/2/2019 MSI - Presentation - Tunisia_PDF_III
http://slidepdf.com/reader/full/msi-presentation-tunisiapdfiii 38/85
Workflow for placing sites
(Optional) Analyze Current Network Coverage.
It is usually useful to know what the network
coverage is without the new site.
Step 1: On the map, zoom to the area of interest and
then on the main menu select View♦ GSM
Serving Signal.
Step 2:Click OK and wait as the coverage is
calculated. The Gaia status bar will show the
cell being calculated.
Step 3: In the Map tab page select Visible Items from
the context menu, click on the layer and then
un-tick the box next to the layer.
Step 4Click OK and the coverage will have been
hidden from view.
Lesson 3
Create a new site
8/2/2019 MSI - Presentation - Tunisia_PDF_III
http://slidepdf.com/reader/full/msi-presentation-tunisiapdfiii 39/85
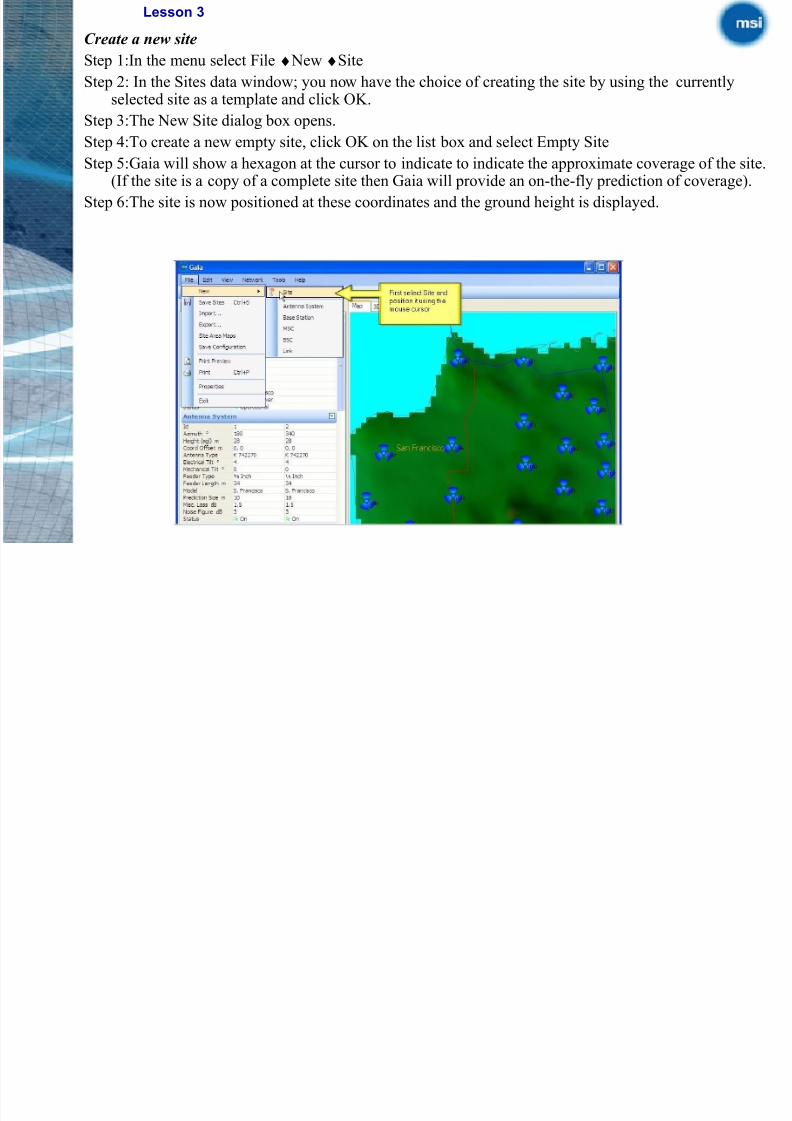
Step 1:In the menu select File ♦ New ♦Site
Step 2: In the Sites data window; you now have the choice of creating the site by using the currentlyselected site as a template and click OK.
Step 3:The New Site dialog box opens.
Step 4:To create a new empty site, click OK on the list box and select Empty Site
Step 5:Gaia will show a hexagon at the cursor to indicate to indicate the approximate coverage of the site.(If the site is a copy of a complete site then Gaia will provide an on-the-fly prediction of coverage).
Step 6:The site is now positioned at these coordinates and the ground height is displayed.
Lesson 3
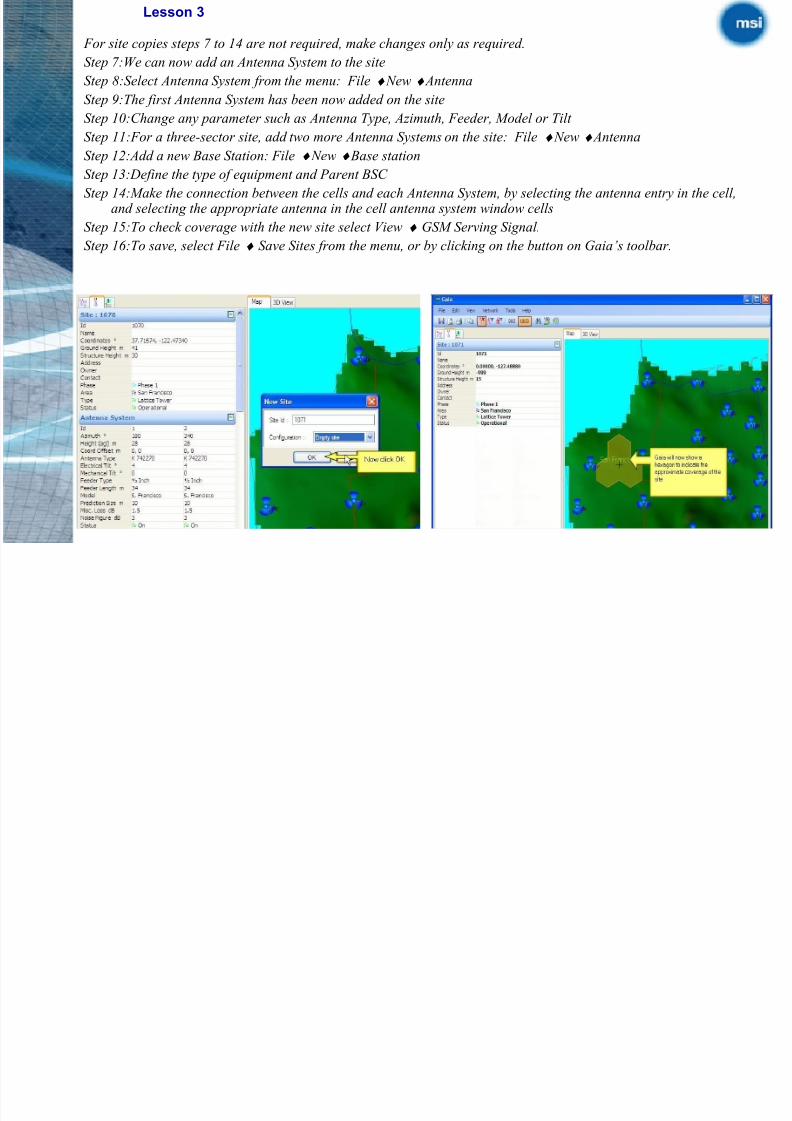
For site copies steps 7 to 14 are not required, make changes only as required.
8/2/2019 MSI - Presentation - Tunisia_PDF_III
http://slidepdf.com/reader/full/msi-presentation-tunisiapdfiii 40/85
Step 7:We can now add an Antenna System to the site
Step 8:Select Antenna System from the menu: File ♦ New ♦ Antenna
Step 9:The first Antenna System has been now added on the site
Step 10:Change any parameter such as Antenna Type, Azimuth, Feeder, Model or Tilt
Step 11:For a three-sector site, add two more Antenna Systems on the site: File ♦ New ♦ Antenna
Step 12:Add a new Base Station: File ♦ New ♦ Base station
Step 13:Define the type of equipment and Parent BSC
Step 14:Make the connection between the cells and each Antenna System, by selecting the antenna entry in the cell,and selecting the appropriate antenna in the cell antenna system window cells
Step 15:To check coverage with the new site select View ♦ GSM Serving Signal.
Step 16:To save, select File ♦ Save Sites from the menu, or by clicking on the button on Gaia’s toolbar.
Lesson 1
8/2/2019 MSI - Presentation - Tunisia_PDF_III
http://slidepdf.com/reader/full/msi-presentation-tunisiapdfiii 41/85
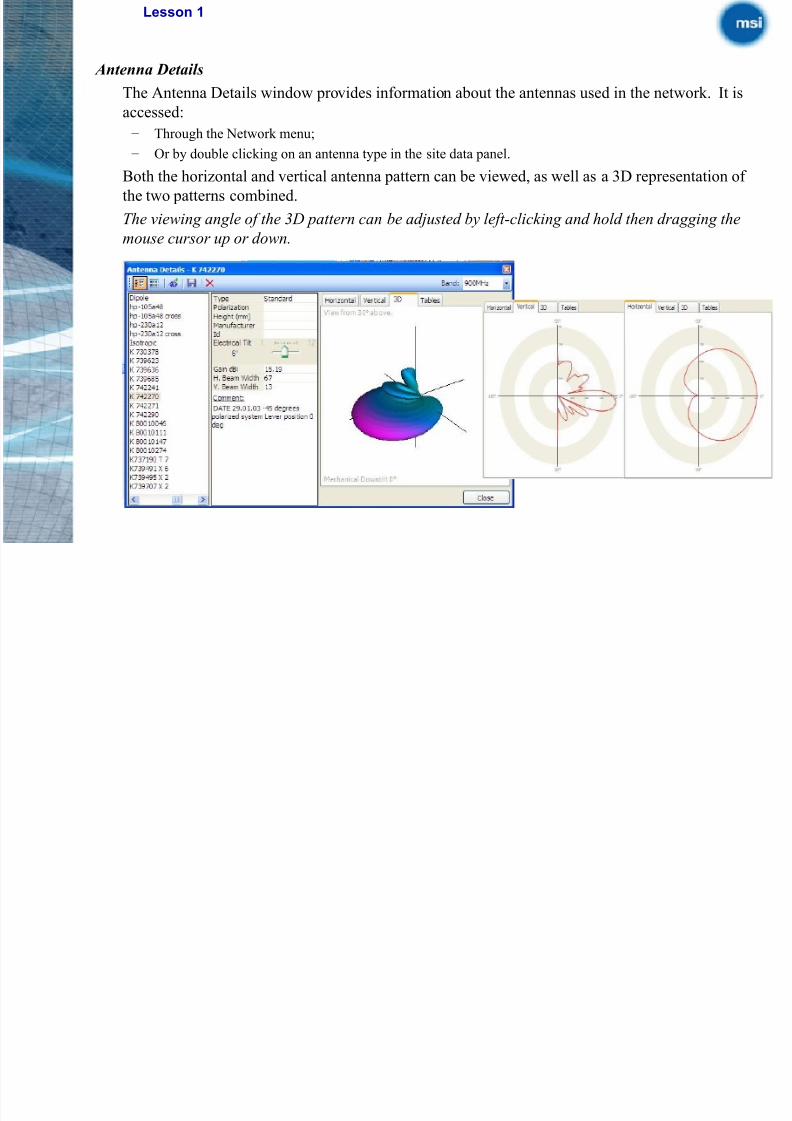
Antenna Details
The Antenna Details window provides information about the antennas used in the network. It is
accessed:
– Through the Network menu;
– Or by double clicking on an antenna type in the site data panel.
Both the horizontal and vertical antenna pattern can be viewed, as well as a 3D representation of
the two patterns combined.
The viewing angle of the 3D pattern can be adjusted by left-clicking and hold then dragging the
mouse cursor up or down.
Lesson 3
8/2/2019 MSI - Presentation - Tunisia_PDF_III
http://slidepdf.com/reader/full/msi-presentation-tunisiapdfiii 42/85
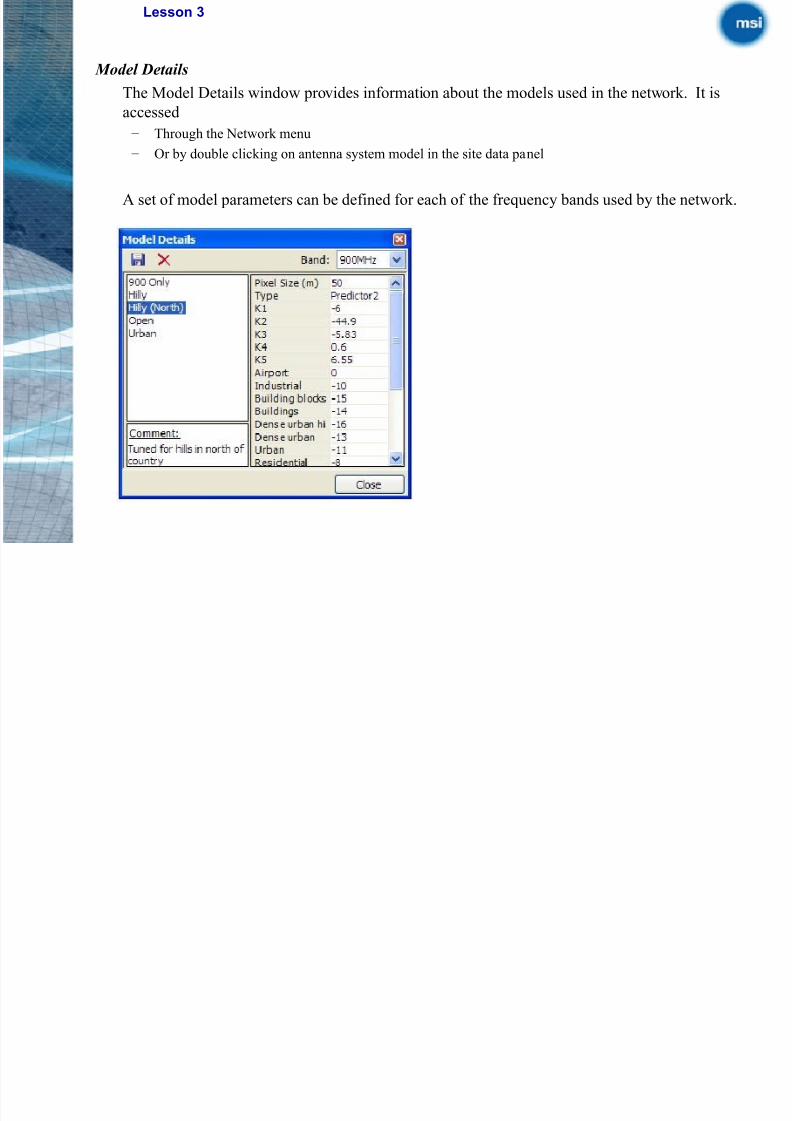
Model Details
The Model Details window provides information about the models used in the network. It is
accessed
– Through the Network menu
– Or by double clicking on antenna system model in the site data panel
A set of model parameters can be defined for each of the frequency bands used by the network.
Lesson 1
8/2/2019 MSI - Presentation - Tunisia_PDF_III
http://slidepdf.com/reader/full/msi-presentation-tunisiapdfiii 43/85
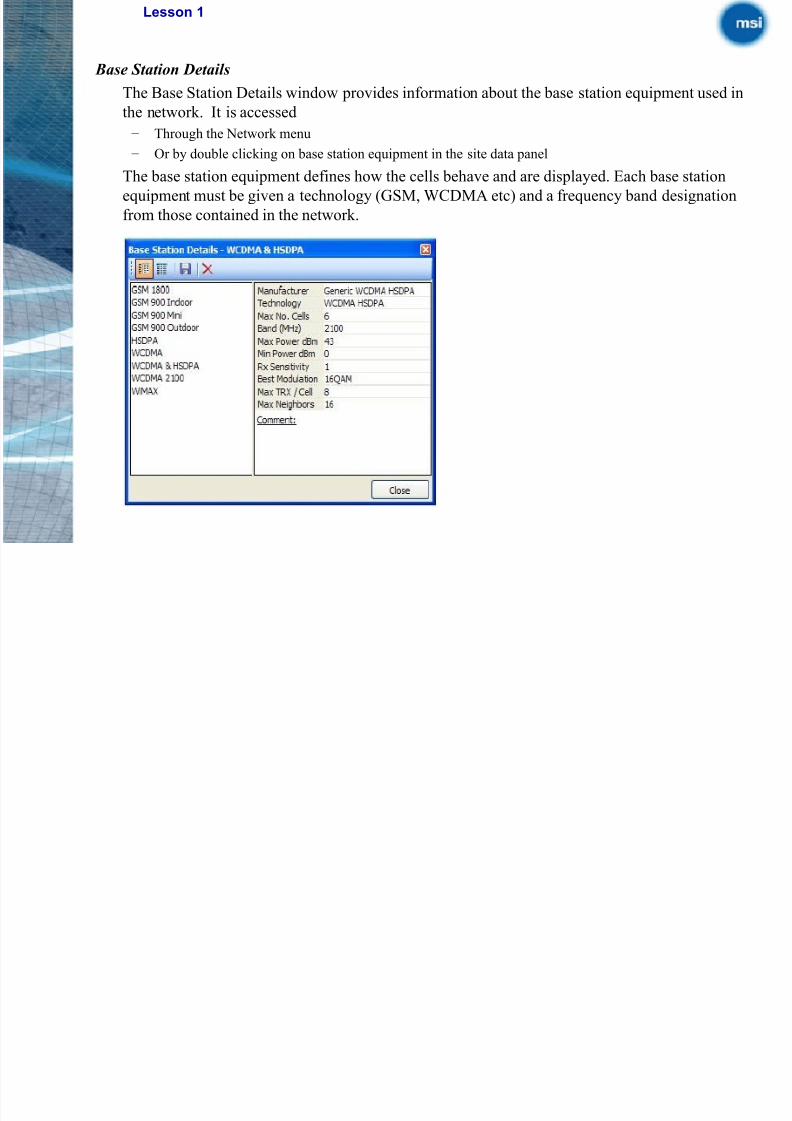
Base Station Details
The Base Station Details window provides information about the base station equipment used in
the network. It is accessed
– Through the Network menu
– Or by double clicking on base station equipment in the site data panel
The base station equipment defines how the cells behave and are displayed. Each base station
equipment must be given a technology (GSM, WCDMA etc) and a frequency band designation
from those contained in the network.
Lesson 4

8/2/2019 MSI - Presentation - Tunisia_PDF_III
http://slidepdf.com/reader/full/msi-presentation-tunisiapdfiii 44/85
Lesson 4
8/2/2019 MSI - Presentation - Tunisia_PDF_III
http://slidepdf.com/reader/full/msi-presentation-tunisiapdfiii 45/85
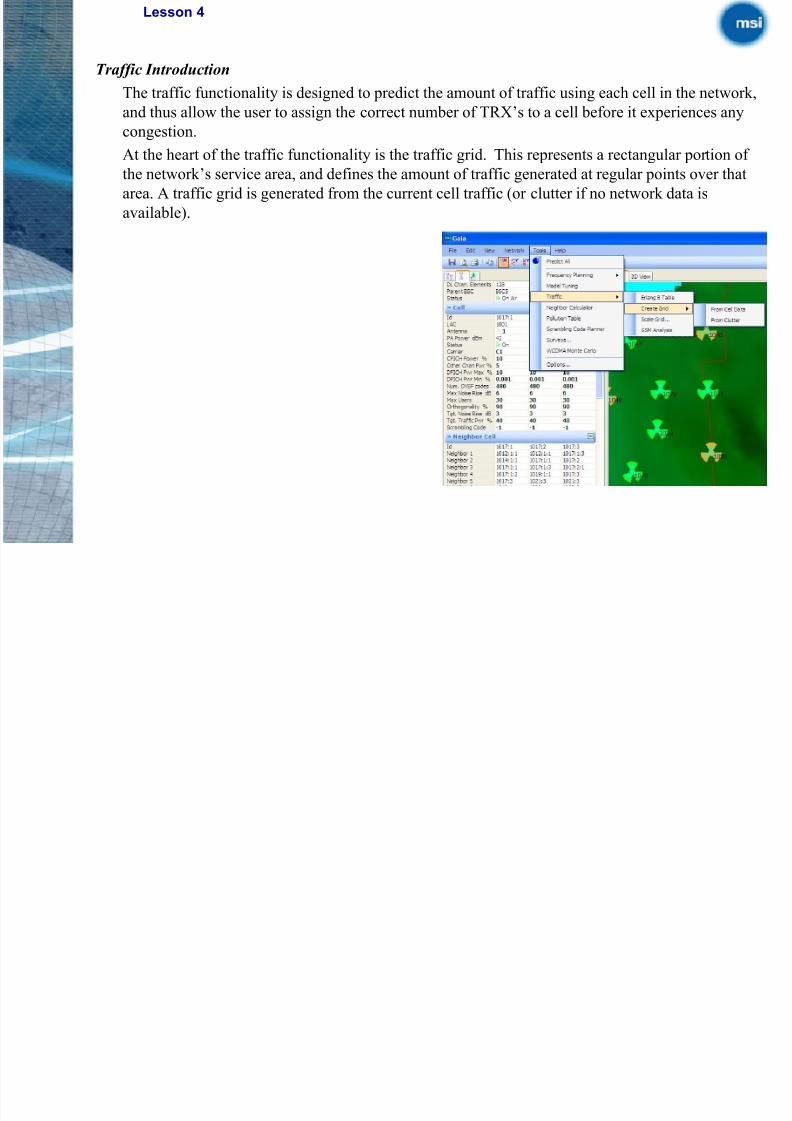
Traffic Introduction
The traffic functionality is designed to predict the amount of traffic using each cell in the network,
and thus allow the user to assign the correct number of TRX’s to a cell before it experiences any
congestion.
At the heart of the traffic functionality is the traffic grid. This represents a rectangular portion of the network’s service area, and defines the amount of traffic generated at regular points over that
area. A traffic grid is generated from the current cell traffic (or clutter if no network data is
available).
Lesson 4

8/2/2019 MSI - Presentation - Tunisia_PDF_III
http://slidepdf.com/reader/full/msi-presentation-tunisiapdfiii 46/85
In the GSM analysis it can be used to predict
the amount of traffic using each cell in the
network, and thus allow the user to assign the
correct number of TRX’s to a cell before it
experiences any congestion.In the WCDMA analysis it can be used to
determine the distribution of services across
the network, and hence the load on the various
parts of the network, the consequence of which
is the interference across the network and also
consequential demand on network resources.
Gaia’s traffic functionality can also be used asan input to pollution table creation, and
consequently influences the results of tools that
are using the pollution table as an input. For
example Automatic Frequency Planning,
Neighbour planning and Scrambling Code
Planning.
Lesson 4
8/2/2019 MSI - Presentation - Tunisia_PDF_III
http://slidepdf.com/reader/full/msi-presentation-tunisiapdfiii 47/85
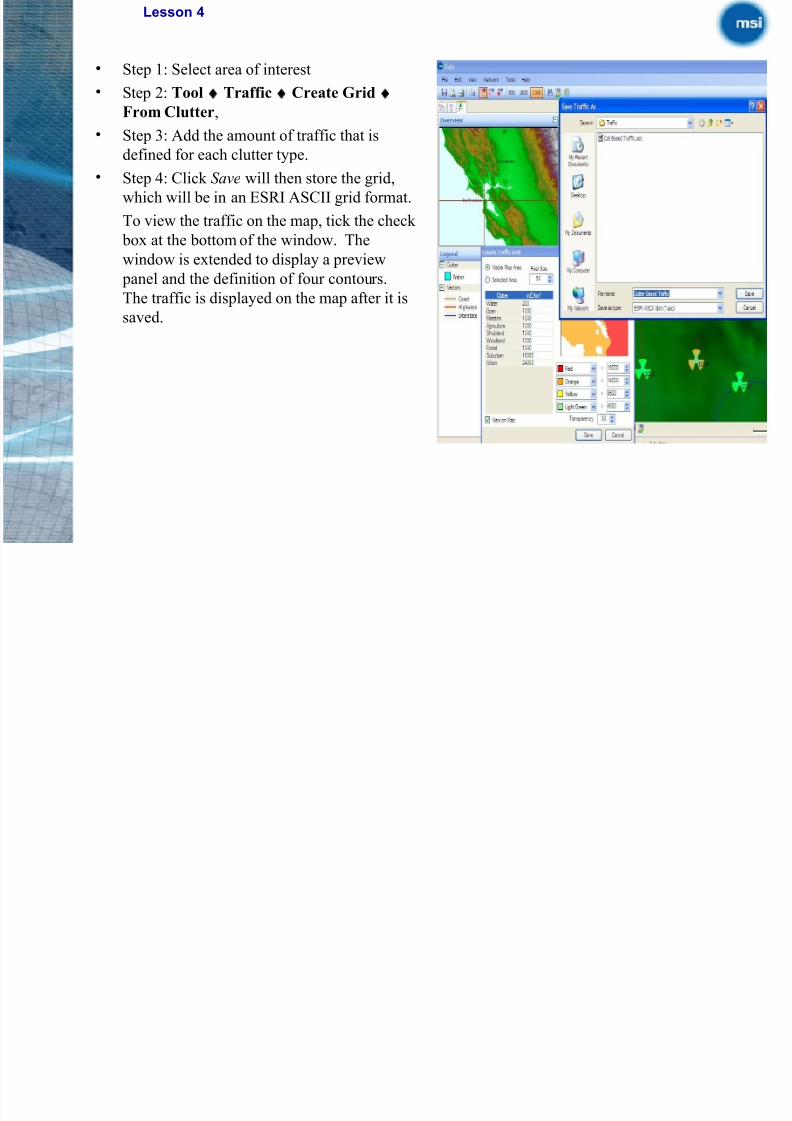
• Step 1: Select area of interest
• Step 2: Tool ♦ Traffic♦ Create Grid ♦
From Clutter,
• Step 3: Add the amount of traffic that is
defined for each clutter type.• Step 4: Click Save will then store the grid,
which will be in an ESRI ASCII grid format.
To view the traffic on the map, tick the check
box at the bottom of the window. The
window is extended to display a preview
panel and the definition of four contours.
The traffic is displayed on the map after it is
saved.
Lesson 4
8/2/2019 MSI - Presentation - Tunisia_PDF_III
http://slidepdf.com/reader/full/msi-presentation-tunisiapdfiii 48/85
Scale Grid
This increases the amount of traffic in each pixel of the traffic grid. Clutter is used to scale the grid,
thus allowing different growth rates in various areas of the network. If the network is in the design
stage, no cell traffic data is available. In this case creating a traffic grid from clutter can give a useful
estimate.
GSM Analysis
A GSM analysis calculates the amount of traffic in each cell and the number of TRX’s that are requireto serve that amount of traffic. After the analysis is performed, the site data can then be updated with
the new TRX requirements.
The traffic analysis tool calculates the amount of traffic in each cell and the number of TRX’s that are
required to serve that amount of traffic. The analysis is performed for the GSM cells only.
After choosing the appropriate traffic grid, it is displayed and the user can choose to calculate for the
cells in visible map area or just in the selected area.
After selecting OK, the cell areas are calculated and the amount of traffic they could potentially
capture. The results for each cell are then presented in a new window.
Lesson 1
Th bl i h i d di l h

8/2/2019 MSI - Presentation - Tunisia_PDF_III
http://slidepdf.com/reader/full/msi-presentation-tunisiapdfiii 49/85
The table in the window displays the:
• Cell id’s,
• Number of TRX’s currently on the cells
• Number of timeslots capable of carrying
traffic
• Resulting capacity of the cells
• Amount of traffic generated in the cell
• How many timeslots are required
• And resulting the number of TRX’s required
The two buttons “Remove TRX’s” and “Add
TRX’s” update the site data with the
calculated number of TRX’s. Care must be
taken here as the changes are made globally
for all appropriate cells in the table.
The Erlang Table button opens the Erlang B table window.
The Options button opens the Traffic Options window, where it is possible to specify
the required number Timeslots and TRXs for the analysis.
Lesson 5

8/2/2019 MSI - Presentation - Tunisia_PDF_III
http://slidepdf.com/reader/full/msi-presentation-tunisiapdfiii 50/85
Lesson 5
Neighbor lists are a f ndamental req irement for all net orks in order to pro ide mobiles ith
8/2/2019 MSI - Presentation - Tunisia_PDF_III
http://slidepdf.com/reader/full/msi-presentation-tunisiapdfiii 51/85
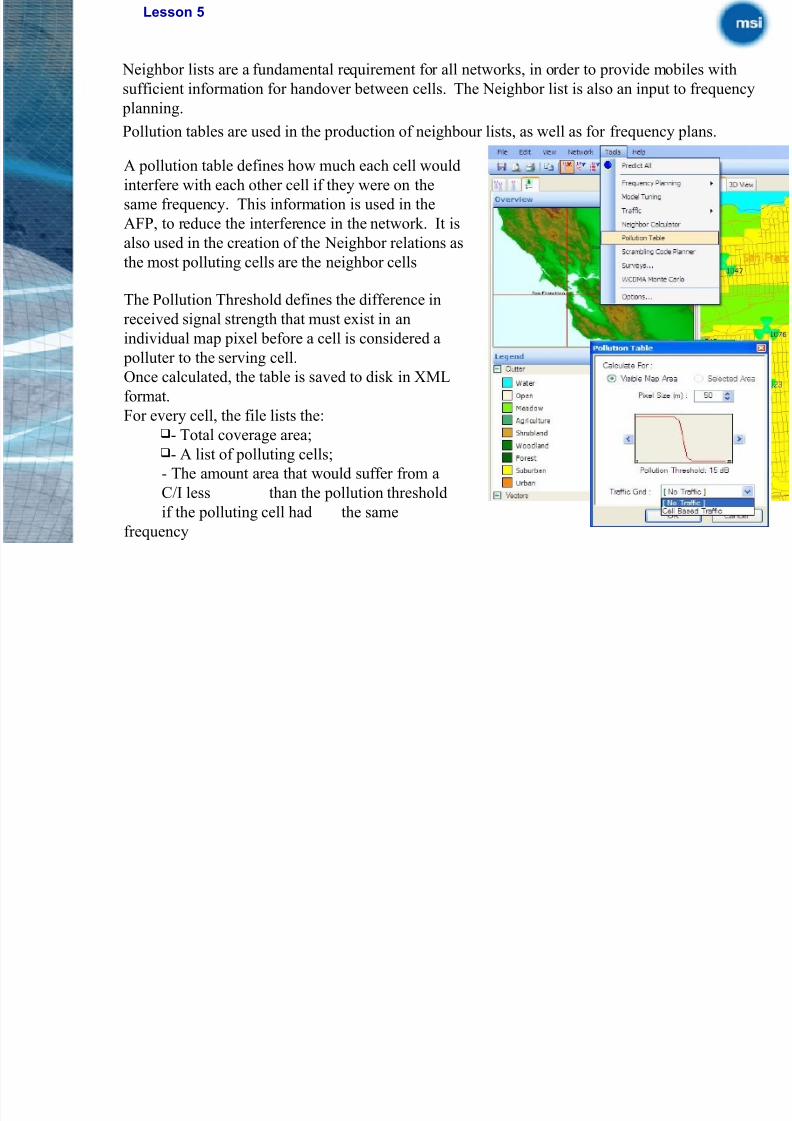
Neighbor lists are a fundamental requirement for all networks, in order to provide mobiles with
sufficient information for handover between cells. The Neighbor list is also an input to frequency
planning.
Pollution tables are used in the production of neighbour lists, as well as for frequency plans.
A pollution table defines how much each cell would
interfere with each other cell if they were on the
same frequency. This information is used in the
AFP, to reduce the interference in the network. It is
also used in the creation of the Neighbor relations as
the most polluting cells are the neighbor cells
The Pollution Threshold defines the difference in
received signal strength that must exist in an
individual map pixel before a cell is considered a
polluter to the serving cell.
Once calculated, the table is saved to disk in XML
format.
For every cell, the file lists the:
- Total coverage area;- A list of polluting cells;
- The amount area that would suffer from a
C/I less than the pollution threshold
if the polluting cell had the same
frequency
Lesson 5
8/2/2019 MSI - Presentation - Tunisia_PDF_III
http://slidepdf.com/reader/full/msi-presentation-tunisiapdfiii 52/85
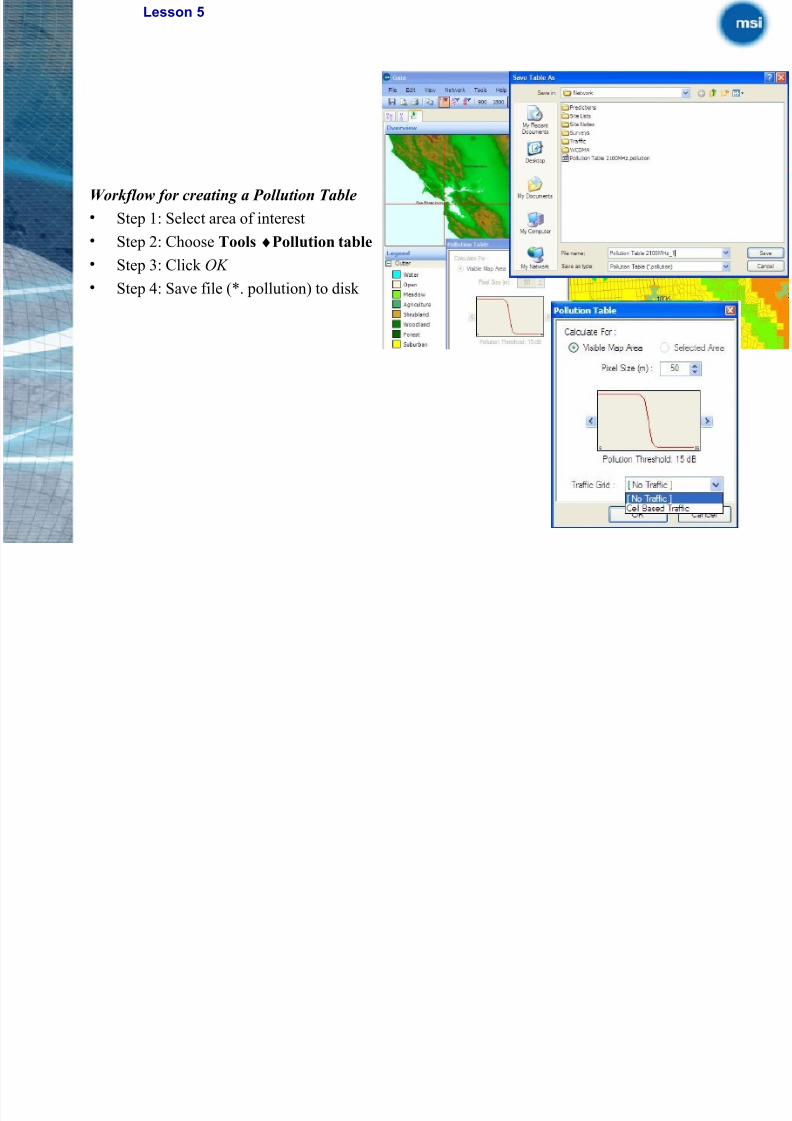
Workflow for creating a Pollution Table
• Step 1: Select area of interest
• Step 2: Choose Tools♦Pollution table
• Step 3: Click OK
• Step 4: Save file (*. pollution) to disk
Lesson 5
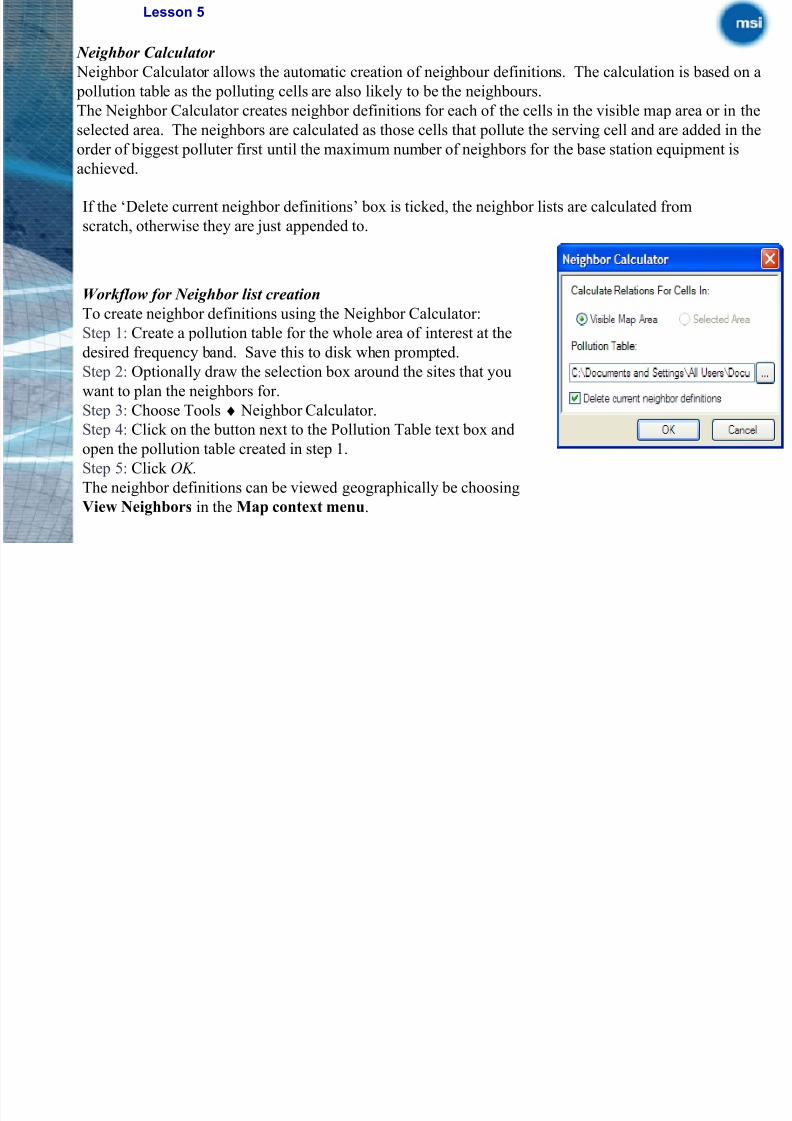
Neighbor Calculator
Neighbor Calculator allows the automatic creation of neighbour definitions The calculation is based on a
8/2/2019 MSI - Presentation - Tunisia_PDF_III
http://slidepdf.com/reader/full/msi-presentation-tunisiapdfiii 53/85
Neighbor Calculator allows the automatic creation of neighbour definitions. The calculation is based on a
pollution table as the polluting cells are also likely to be the neighbours.
The Neighbor Calculator creates neighbor definitions for each of the cells in the visible map area or in the
selected area. The neighbors are calculated as those cells that pollute the serving cell and are added in the
order of biggest polluter first until the maximum number of neighbors for the base station equipment isachieved.
Workflow for Neighbor list creationTo create neighbor definitions using the Neighbor Calculator:
Step 1: Create a pollution table for the whole area of interest at the
desired frequency band. Save this to disk when prompted.
Step 2: Optionally draw the selection box around the sites that you
want to plan the neighbors for.
Step 3: Choose Tools ♦ Neighbor Calculator.
Step 4: Click on the button next to the Pollution Table text box andopen the pollution table created in step 1.
Step 5: Click OK.
The neighbor definitions can be viewed geographically be choosing
View Neighbors in the Map context menu.
If the ‘Delete current neighbor definitions’ box is ticked, the neighbor lists are calculated from
scratch, otherwise they are just appended to.
Lesson 6
8/2/2019 MSI - Presentation - Tunisia_PDF_III
http://slidepdf.com/reader/full/msi-presentation-tunisiapdfiii 54/85
Lesson 6
W kfl t t f l i th AFP

8/2/2019 MSI - Presentation - Tunisia_PDF_III
http://slidepdf.com/reader/full/msi-presentation-tunisiapdfiii 55/85
Workflow to create a frequency plan using the AFP:
Step 1: Create a pollution table for the whole area of interest
at the desired frequency band.
Step 2: Save this to disk when prompted.
Step 3: Optionally draw the selection box around the sites that
you want to plan the frequencies for.
Step 4: Choose Tools ♦ Frequency Planning♦ Automatic.
Step 5: Open the pollution table created in step1.
Step 6: Click OK.Step 7: When planning is complete, examine the changes and
then click Yes to make these changes to Gaia’s site
data.
Step 8: Choose View♦Co-channel C/I in order to visualize
where the remaining interference is.
AFP results show:List of the transceivers (TRX’s)Violation table values
Co-channel interference valuesSelecting an alternative frequency updates the list of
TRX’s, recalculating the violations and interference
Lesson 7

8/2/2019 MSI - Presentation - Tunisia_PDF_III
http://slidepdf.com/reader/full/msi-presentation-tunisiapdfiii 56/85
Lesson 7

8/2/2019 MSI - Presentation - Tunisia_PDF_III
http://slidepdf.com/reader/full/msi-presentation-tunisiapdfiii 57/85
Lesson 7

8/2/2019 MSI - Presentation - Tunisia_PDF_III
http://slidepdf.com/reader/full/msi-presentation-tunisiapdfiii 58/85
Lesson 7

8/2/2019 MSI - Presentation - Tunisia_PDF_III
http://slidepdf.com/reader/full/msi-presentation-tunisiapdfiii 59/85
Lesson 7
8/2/2019 MSI - Presentation - Tunisia_PDF_III
http://slidepdf.com/reader/full/msi-presentation-tunisiapdfiii 60/85
Lesson 7
8/2/2019 MSI - Presentation - Tunisia_PDF_III
http://slidepdf.com/reader/full/msi-presentation-tunisiapdfiii 61/85
Lesson 7

8/2/2019 MSI - Presentation - Tunisia_PDF_III
http://slidepdf.com/reader/full/msi-presentation-tunisiapdfiii 62/85
Lesson 7

8/2/2019 MSI - Presentation - Tunisia_PDF_III
http://slidepdf.com/reader/full/msi-presentation-tunisiapdfiii 63/85
Lesson 7

8/2/2019 MSI - Presentation - Tunisia_PDF_III
http://slidepdf.com/reader/full/msi-presentation-tunisiapdfiii 64/85
Lesson 7
8/2/2019 MSI - Presentation - Tunisia_PDF_III
http://slidepdf.com/reader/full/msi-presentation-tunisiapdfiii 65/85
Distributed Computing
8/2/2019 MSI - Presentation - Tunisia_PDF_III
http://slidepdf.com/reader/full/msi-presentation-tunisiapdfiii 66/85
• Gaia uses all the latest development technology; – Lightweight
– Efficient
– Simple deployment
– Distributed computing not necessary.
• E.g. On a typical laptop a 30km prediction takes typically.
AEON Database
8/2/2019 MSI - Presentation - Tunisia_PDF_III
http://slidepdf.com/reader/full/msi-presentation-tunisiapdfiii 67/85
67
• Gaia uses a centralised database system allowing for:
– Shared use of all planning information
– Includes versioning
GIS

8/2/2019 MSI - Presentation - Tunisia_PDF_III
http://slidepdf.com/reader/full/msi-presentation-tunisiapdfiii 68/85
• Gaia’s primary functionality is with RadioPlanning, GIS manipulation is bestperformed in tools designed for the task;
• Gaia permits import and export of Sites in
MapInfo, compatible formats;
• All Gaia layers may be exported in MapInfocompatible formats.
• The Import format is XML, plus any other format depending on which plug-ins are loaded (e.g.
Import - Export
8/2/2019 MSI - Presentation - Tunisia_PDF_III
http://slidepdf.com/reader/full/msi-presentation-tunisiapdfiii 69/85
Planet 2.8, Excel, Access);
• The export format select user such as: XML, or depending on which plug-ins are loaded (e.g.
Planet, Excel XML, MapInfo, Google Earth, Worldwind).
File formats supported by Gaia:
XML built into the main Gaia executable file;
XML Schema (.XSD) - writes an XML Schema file which defines the XML file format;
Microsoft Access (.mdb) - writes the site database to a Microsoft Access file;
All Equipment (XML) Exports all the equipment data used in the project to an XML file format (Base
Station, Mobile Equipment, Antennas, Feeders, Services and Models).
Mi ft E l (XLS) S th l i d t
Import - Export

8/2/2019 MSI - Presentation - Tunisia_PDF_III
http://slidepdf.com/reader/full/msi-presentation-tunisiapdfiii 70/85
Microsoft Excel (XLS) - Saves the planning data
and each site component is written to a separate
.xls worksheet;
Frequency Plan (.FREQ) - XML format file also
enabling this data to be shared with 3rd party tools;
Google Earth (.KML) - Exports the site data to a
Google Earth KML file format;
MapInfo Sites A MapInfo Interchange Format
(MIF) file is exported containing point data for all of the sites in the network;
The associated MID enabling MapInfo to label thesites or color code them via a thematic map.
Measurement Data
8/2/2019 MSI - Presentation - Tunisia_PDF_III
http://slidepdf.com/reader/full/msi-presentation-tunisiapdfiii 71/85
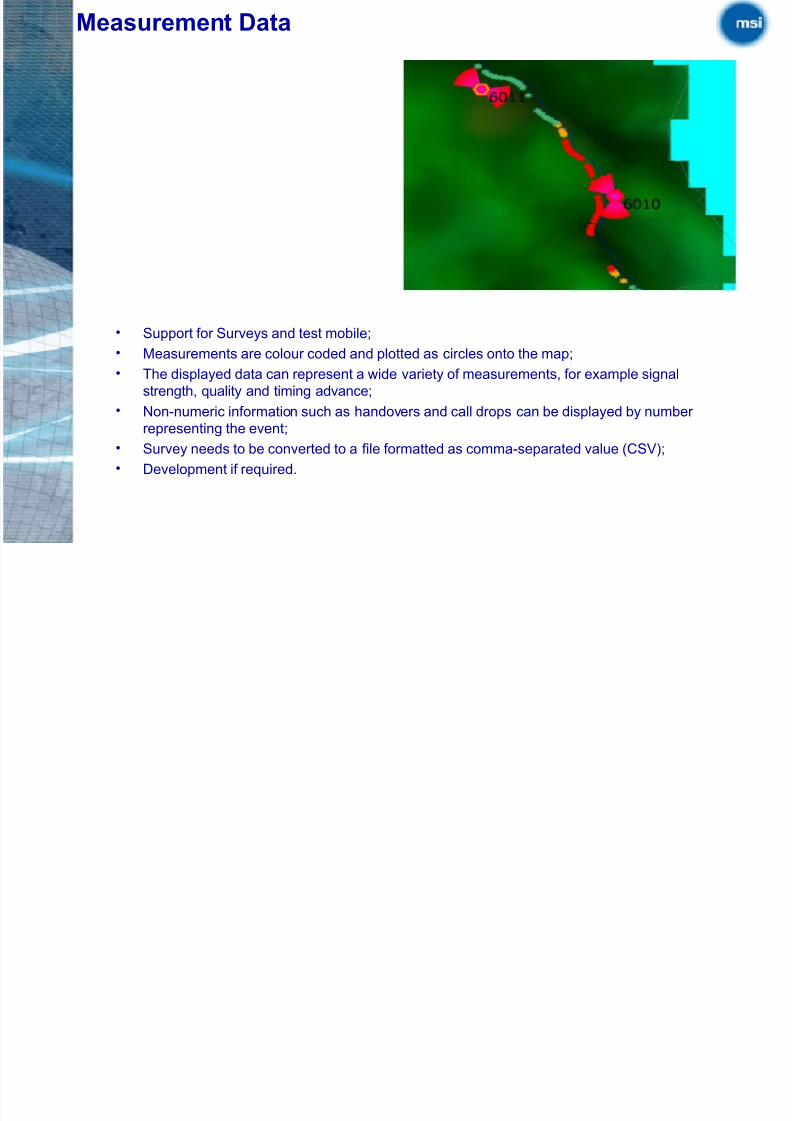
• Support for Surveys and test mobile;
• Measurements are colour coded and plotted as circles onto the map;
• The displayed data can represent a wide variety of measurements, for example signal
strength, quality and timing advance;
• Non-numeric information such as handovers and call drops can be displayed by number
representing the event;
• Survey needs to be converted to a file formatted as comma-separated value (CSV);
• Development if required.
Efficiency

8/2/2019 MSI - Presentation - Tunisia_PDF_III
http://slidepdf.com/reader/full/msi-presentation-tunisiapdfiii 72/85
• Typical prediction time – 30 km prediction;
• 100 site (300 sector) analysis – GSM & WCDMA ;
• 300 sector Pollution table;
• 300 sector Frequency plan;
• 300 sector neighbour generation.
Propagation Modelling
8/2/2019 MSI - Presentation - Tunisia_PDF_III
http://slidepdf.com/reader/full/msi-presentation-tunisiapdfiii 73/85
• Planet propagation model supported;
• APIs for support of alternative models including microcell models;
• Development if required.
Traffic Planning
8/2/2019 MSI - Presentation - Tunisia_PDF_III
http://slidepdf.com/reader/full/msi-presentation-tunisiapdfiii 74/85
• Support for traffic grids;
• Grids can be created from Clutter and from Cell Data;
• GSM traffic analysis: – Traffic capacity calculation – Hardware requirements determination.
• WCDMA : –
spread traffic from traffic grids – sector based traffic loads, – network loads.
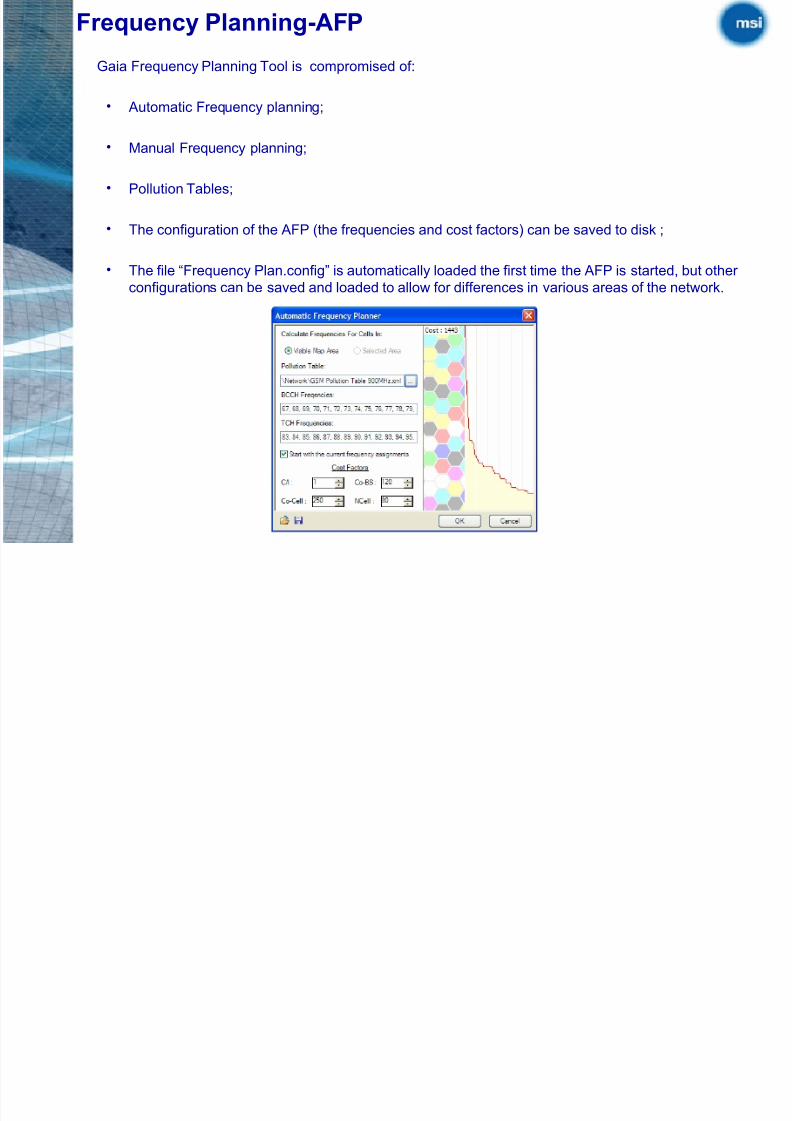
Gaia Frequency Planning Tool is compromised of:
Frequency Planning-AFP
8/2/2019 MSI - Presentation - Tunisia_PDF_III
http://slidepdf.com/reader/full/msi-presentation-tunisiapdfiii 75/85
• Automatic Frequency planning;
• Manual Frequency planning;
• Pollution Tables;
• The configuration of the AFP (the frequencies and cost factors) can be saved to disk ;
• The file “Frequency Plan.config” is automatically loaded the first time the AFP is started, but other
configurations can be saved and loaded to allow for differences in various areas of the network.
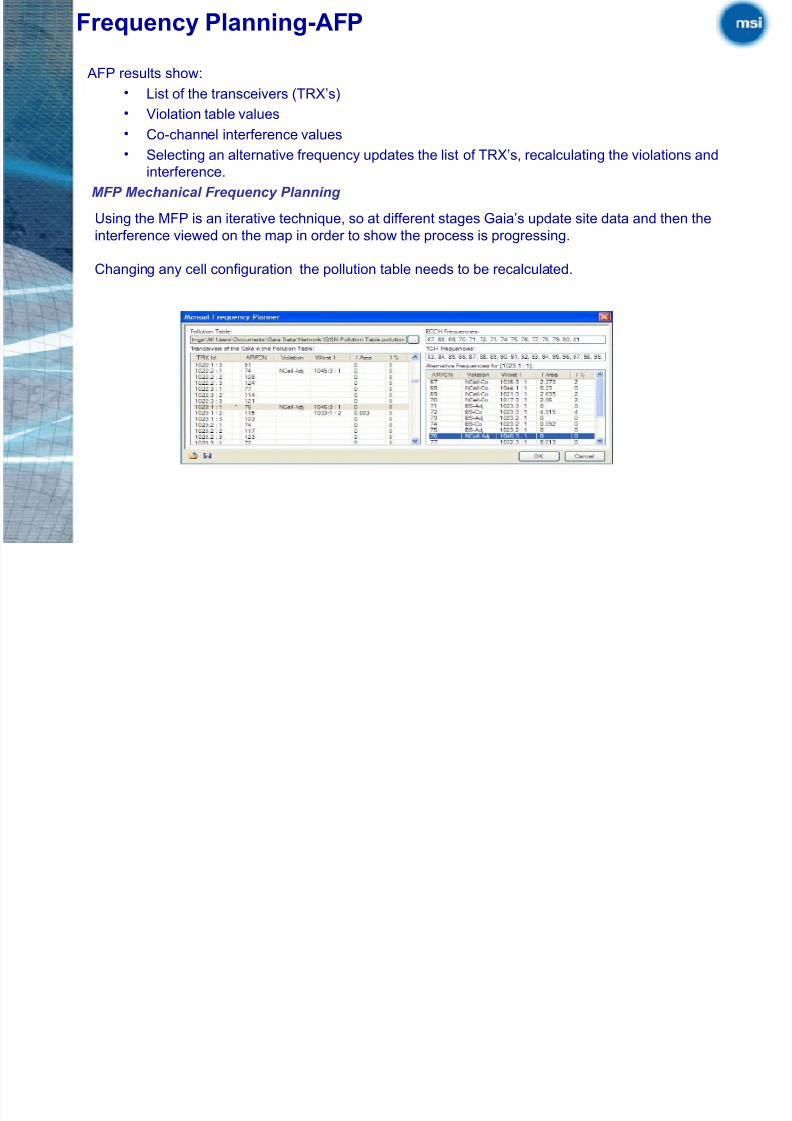
AFP results show:
• List of the transceivers (TRX’s)
Frequency Planning-AFP
8/2/2019 MSI - Presentation - Tunisia_PDF_III
http://slidepdf.com/reader/full/msi-presentation-tunisiapdfiii 76/85
• Violation table values
• Co-channel interference values
• Selecting an alternative frequency updates the list of TRX’s, recalculating the violations and
interference.
MFP Mechanical Frequency Planning
Using the MFP is an iterative technique, so at different stages Gaia’s update site data and then the
interference viewed on the map in order to show the process is progressing.
Changing any cell configuration the pollution table needs to be recalculated.
Neighbour Planning
8/2/2019 MSI - Presentation - Tunisia_PDF_III
http://slidepdf.com/reader/full/msi-presentation-tunisiapdfiii 77/85
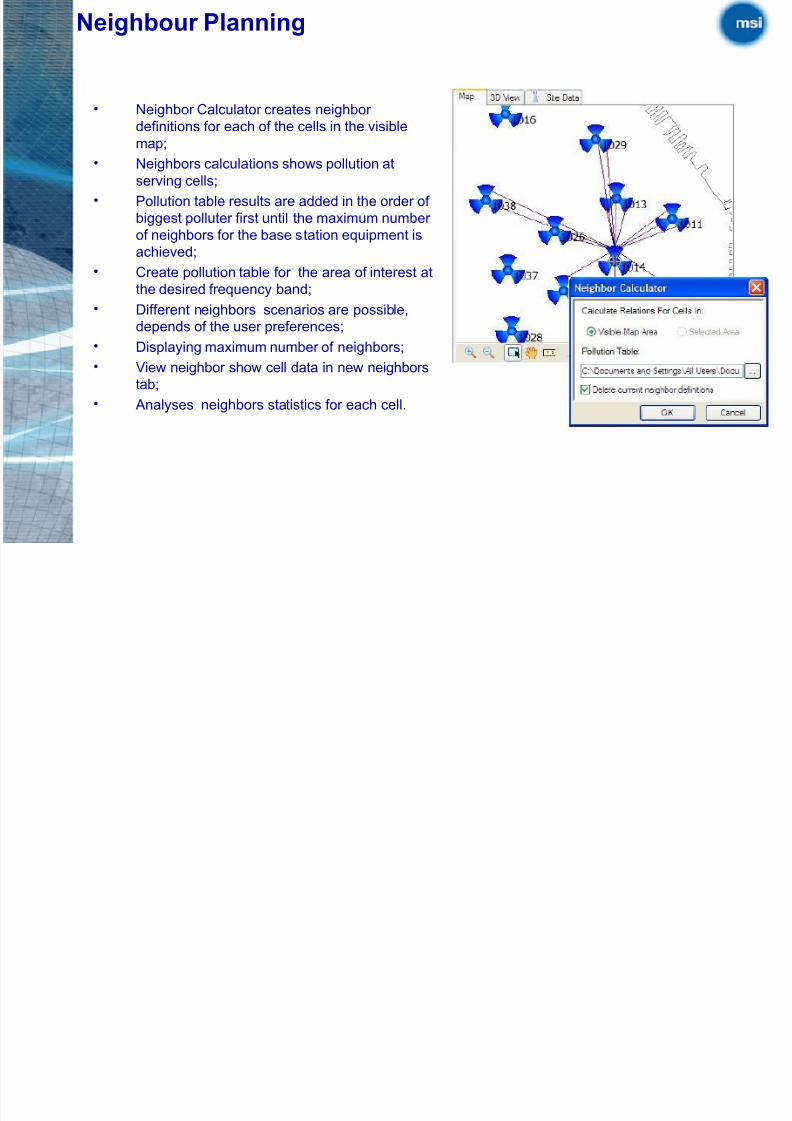
• Neighbor Calculator creates neighbor
definitions for each of the cells in the visible
map;
• Neighbors calculations shows pollution atserving cells;
• Pollution table results are added in the order of
biggest polluter first until the maximum number
of neighbors for the base station equipment is
achieved;
• Create pollution table for the area of interest at
the desired frequency band;
• Different neighbors scenarios are possible,depends of the user preferences;
• Displaying maximum number of neighbors;
• View neighbor show cell data in new neighbors
tab;
• Analyses neighbors statistics for each cell.
Neighbour Planning

8/2/2019 MSI - Presentation - Tunisia_PDF_III
http://slidepdf.com/reader/full/msi-presentation-tunisiapdfiii 78/85
Multi add of the neighbors:
5. Graphically Add Neighbor On Map;
6. Add Neighbor Cell Id;
3G simulator (R99 & HSPA) and analysis of results
8/2/2019 MSI - Presentation - Tunisia_PDF_III
http://slidepdf.com/reader/full/msi-presentation-tunisiapdfiii 79/85
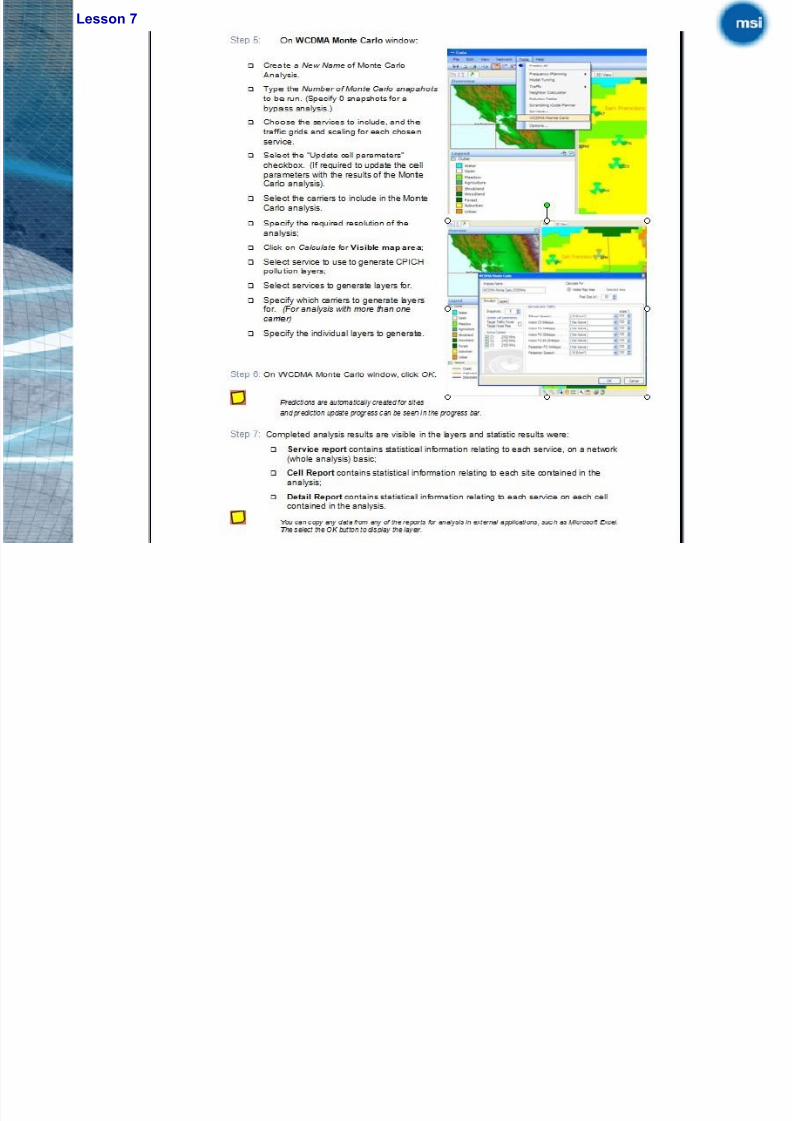
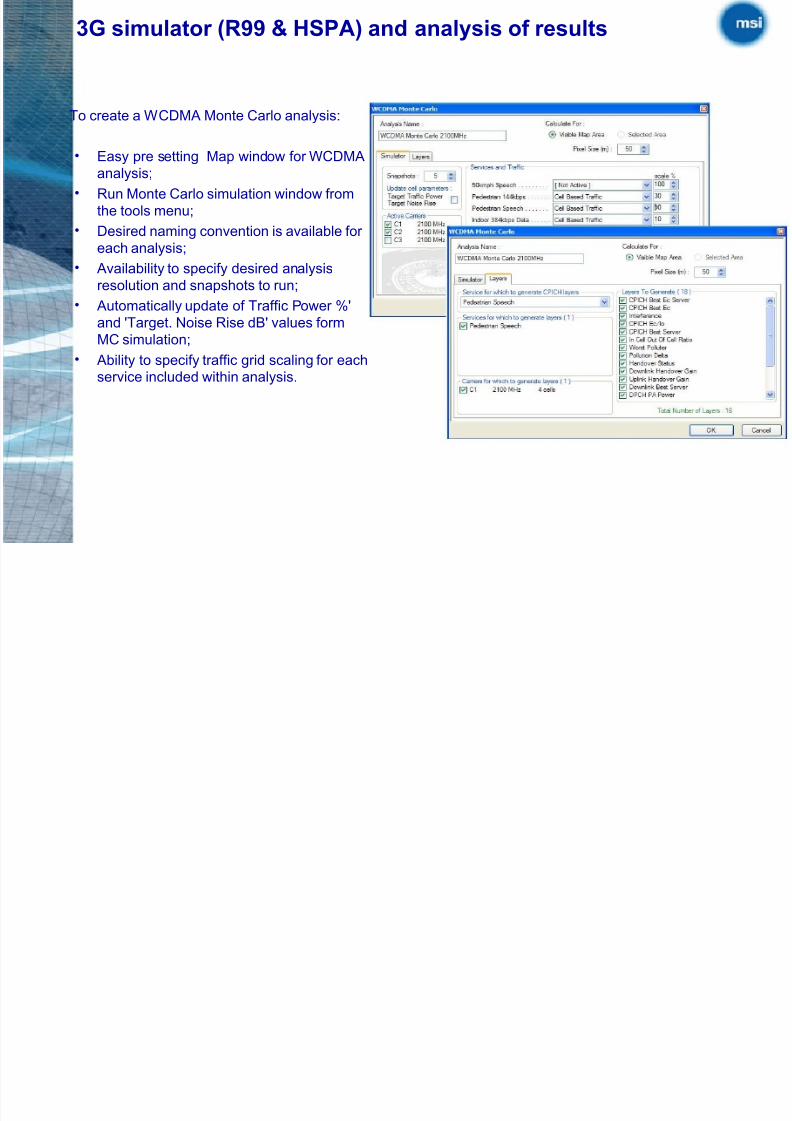
To create a WCDMA Monte Carlo analysis:
• Easy pre setting Map window for WCDMA
analysis;
• Run Monte Carlo simulation window from
the tools menu;
• Desired naming convention is available for
each analysis;
• Availability to specify desired analysis
resolution and snapshots to run;
• Automatically update of Traffic Power %'and 'Target. Noise Rise dB' values form
MC simulation;
• Ability to specify traffic grid scaling for eachservice included within analysis.
Generating analysis of different layers:
3G simulator (R99 & HSPA) and analysis of results

8/2/2019 MSI - Presentation - Tunisia_PDF_III
http://slidepdf.com/reader/full/msi-presentation-tunisiapdfiii 80/85
• Specific and desired services;
• Curriers;
• Downlink and Uplink layers for every combination of carrier, service and selected downlink or
uplink layer.
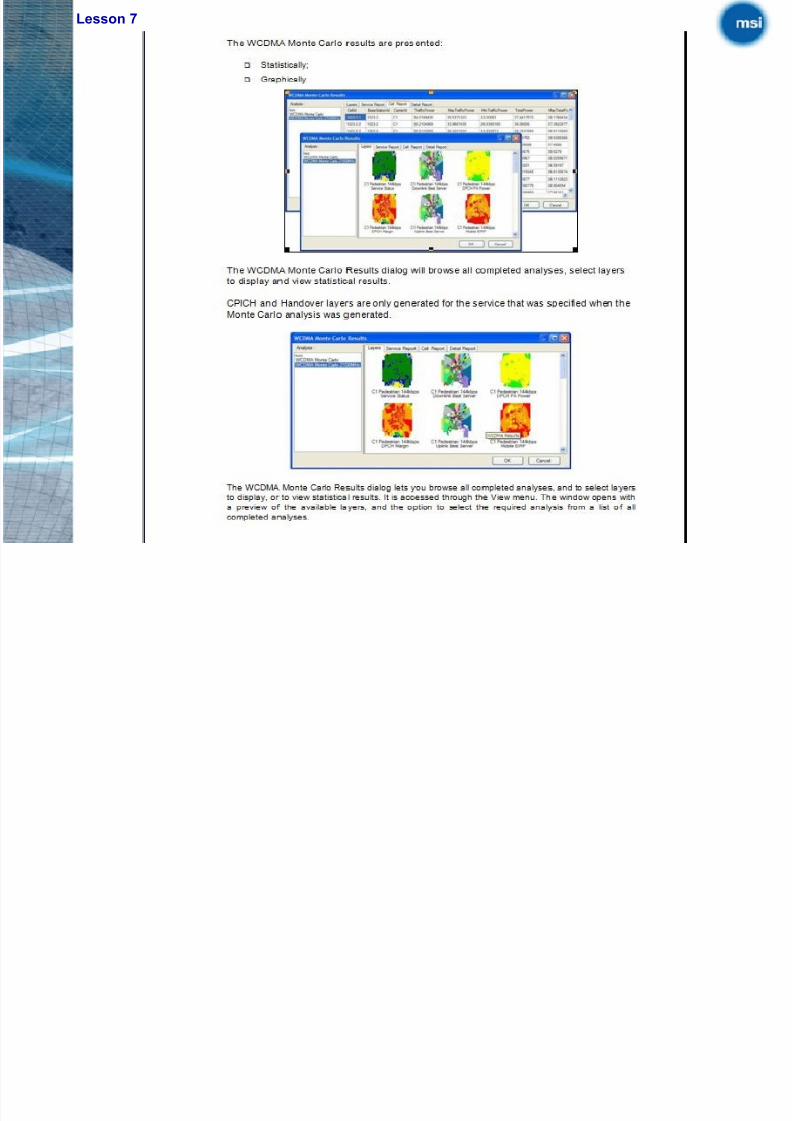
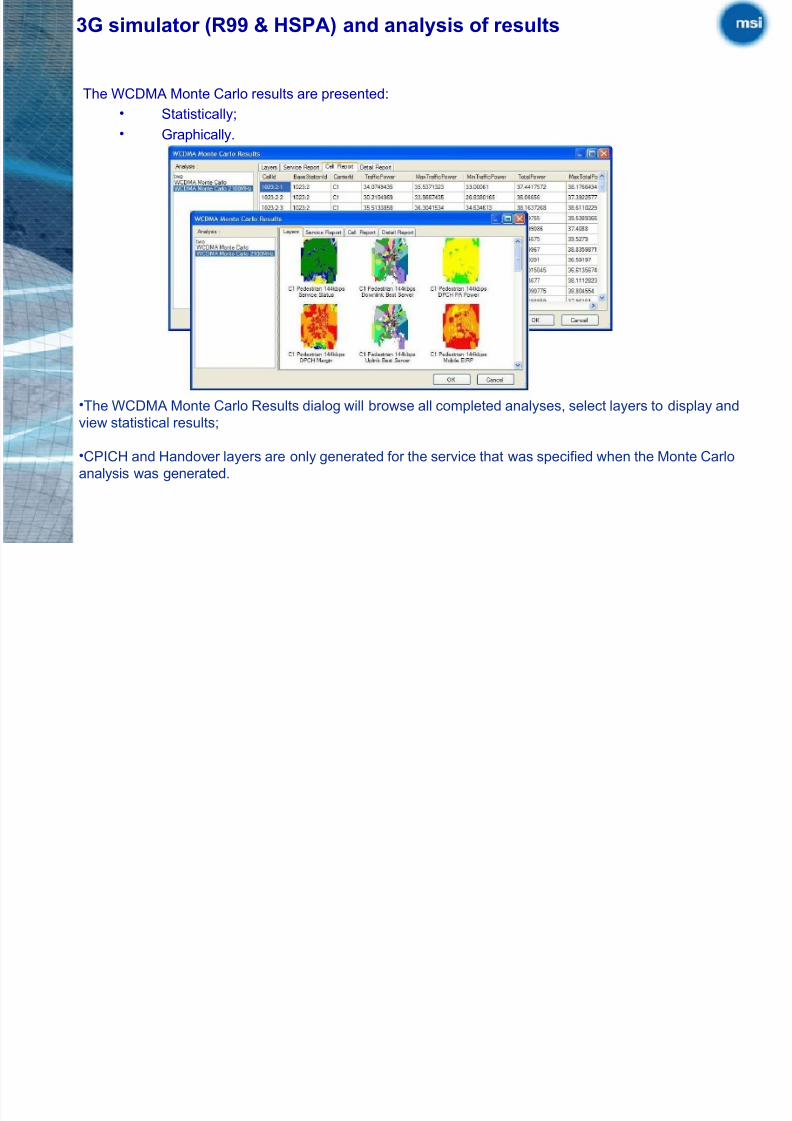
The WCDMA Monte Carlo results are presented:
S
3G simulator (R99 & HSPA) and analysis of results
8/2/2019 MSI - Presentation - Tunisia_PDF_III
http://slidepdf.com/reader/full/msi-presentation-tunisiapdfiii 81/85
• Statistically;
• Graphically.
•The WCDMA Monte Carlo Results dialog will browse all completed analyses, select layers to display and
view statistical results;
•CPICH and Handover layers are only generated for the service that was specified when the Monte Carlo
analysis was generated.
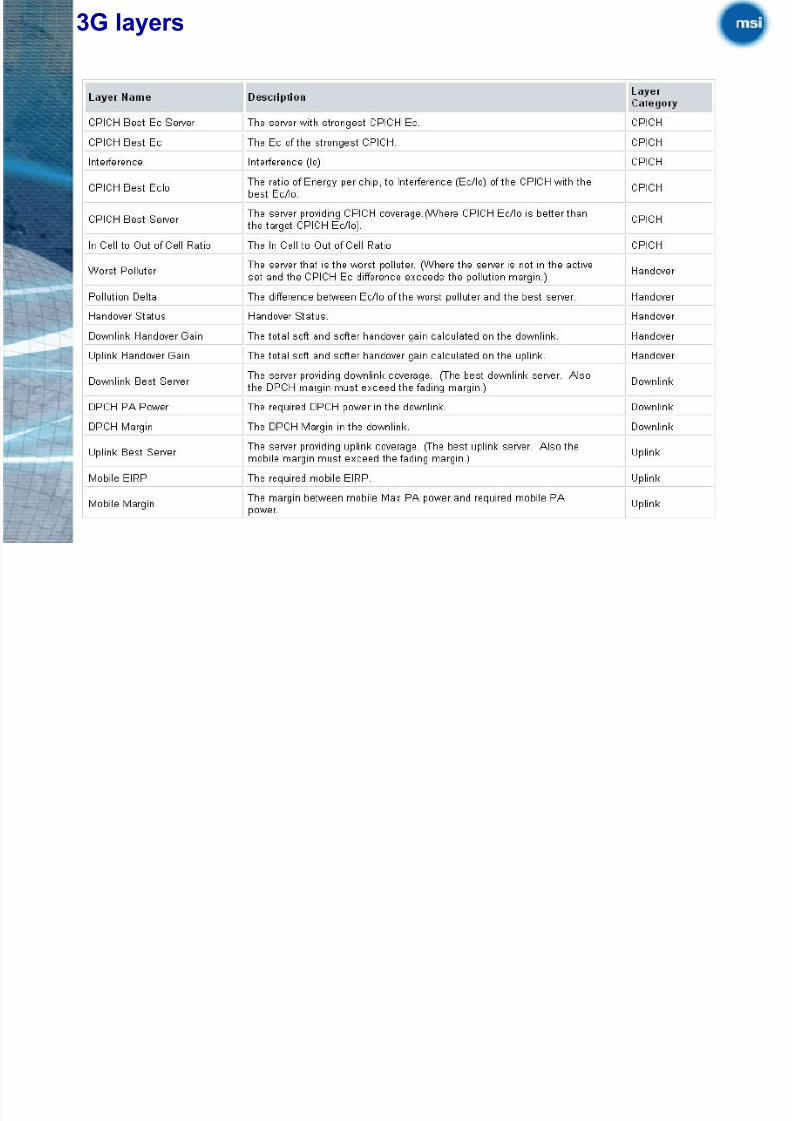
3G layers
8/2/2019 MSI - Presentation - Tunisia_PDF_III
http://slidepdf.com/reader/full/msi-presentation-tunisiapdfiii 82/85
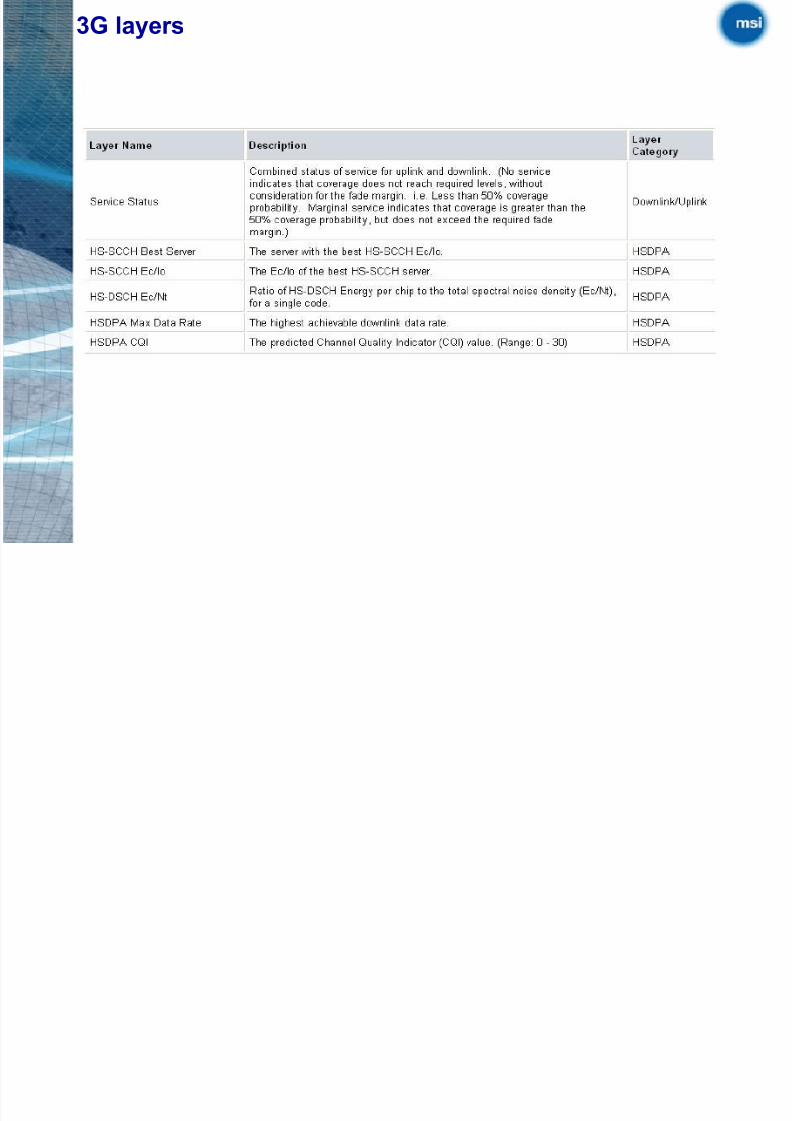
3G layers
8/2/2019 MSI - Presentation - Tunisia_PDF_III
http://slidepdf.com/reader/full/msi-presentation-tunisiapdfiii 83/85
Intersystem Planning

8/2/2019 MSI - Presentation - Tunisia_PDF_III
http://slidepdf.com/reader/full/msi-presentation-tunisiapdfiii 84/85
• Multiple technologies supported in same project and session;
• Inter RAB Neighbour planning is supported.
AFP/ACP integrated or interfaces
8/2/2019 MSI - Presentation - Tunisia_PDF_III
http://slidepdf.com/reader/full/msi-presentation-tunisiapdfiii 85/85
• Open APIs provide simple support for third party products;
• AFPs;
• ACPs;
• Propagation Models including microcell.