Fernando Cabrera Eduardo Manrique EOR: Promesa Incumplida o un Gran Futuro? Neuquén Nov. 5, 2010.
25
Fernando Cabrera Eduardo Manrique EOR: Promesa Incumplida o un Gran Futuro? Neuquén Nov. 5, 2010
-
Upload
martha-cameron -
Category
Documents
-
view
218 -
download
3
Transcript of Fernando Cabrera Eduardo Manrique EOR: Promesa Incumplida o un Gran Futuro? Neuquén Nov. 5, 2010.

Fernando CabreraEduardo Manrique
EOR: Promesa Incumplida o un Gran Futuro?
EOR: Promesa Incumplida o un Gran Futuro?
Neuquén
Nov. 5, 2010

Waiting for the EOR Boom:What Happen in the Mean TimeWaiting for the EOR Boom:What Happen in the Mean Time
• EOR potential has been predicted over the past three decades
• After crude oil price collapse in mid 80s, EOR activity slow down drastically
• Majors decided shut-down research centers and number of students enrolled in reservoir/petroleum engineering and in geoscience also dropped in Universities
• Since 2007 EOR activity start showing a growing trend having Canada, China and the U.S. as the countries with the largest EOR production
• CO2 EOR/storage started to get lot of attention due to new environmental regulations
• Lack of expertise and prepared work force is one of the key factors constraining EOR evaluation and implementation
• EOR offshore is still at early stages of evaluation (will require 1 to 2 decades if EOR becomes economically attractive)
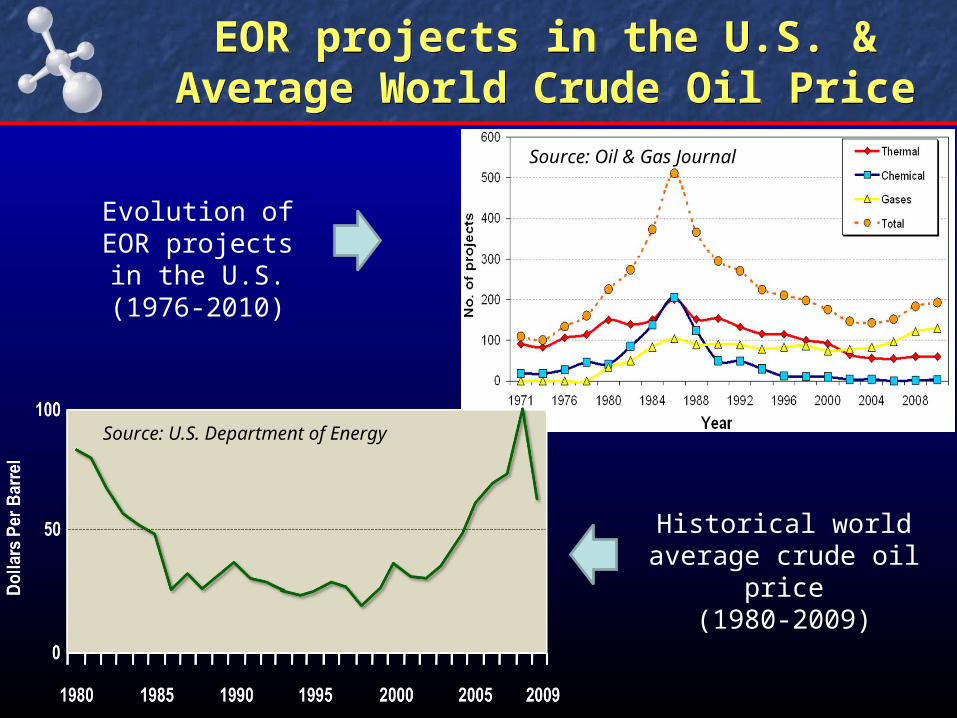
EOR projects in the U.S. & Average World Crude Oil Price
EOR projects in the U.S. & Average World Crude Oil Price
Source: Oil & Gas Journal
Evolution of EOR projects in the U.S.
(1976-2010)
Historical world average crude oil price(1980-2009)
Source: U.S. Department of Energy
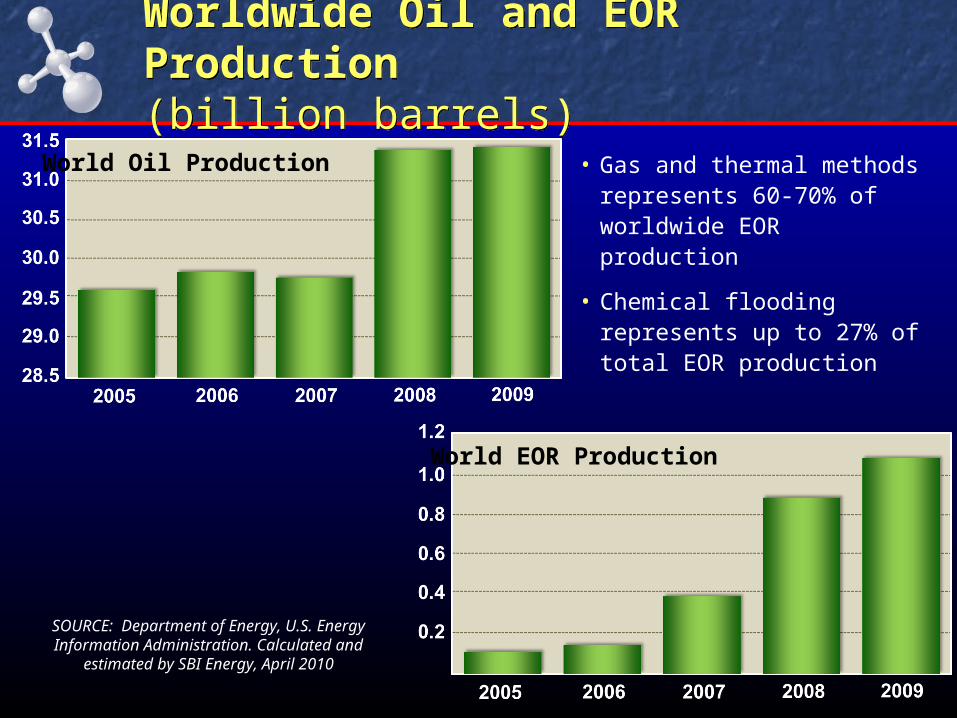
Worldwide Oil and EOR Production(billion barrels)Worldwide Oil and EOR Production(billion barrels)
SOURCE: Department of Energy, U.S. Energy Information Administration. Calculated
and estimated by SBI Energy, April 2010
World Oil Production
World EOR Production
• Gas and thermal methods represents 60-70% of worldwide EOR production
• Chemical flooding represents up to 27% of total EOR production
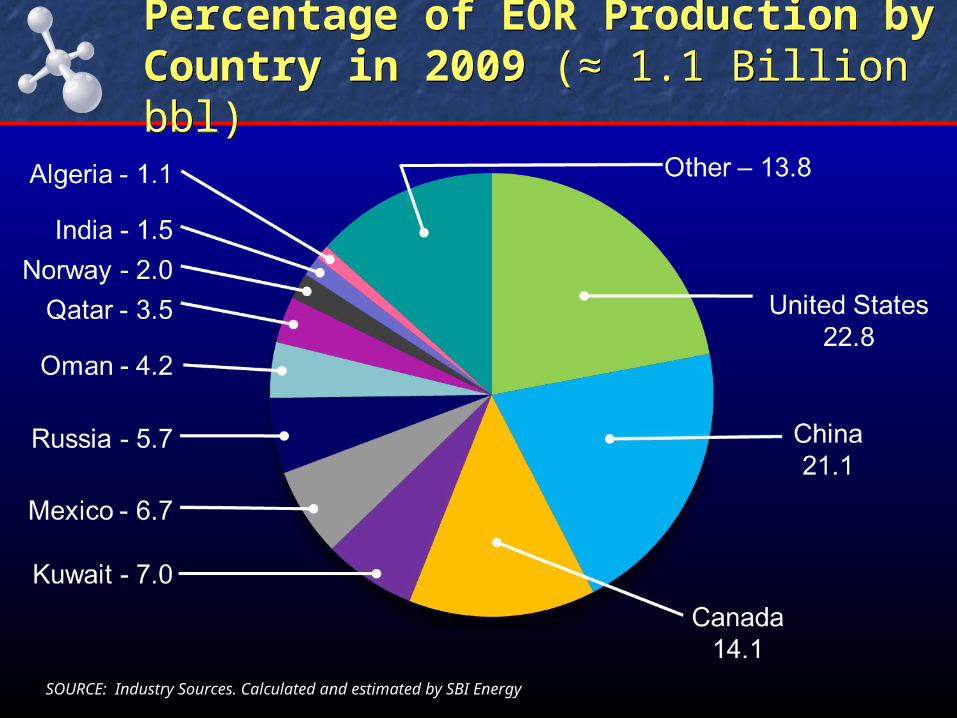
Percentage of EOR Production by Country in 2009 (≈ 1.1 Billion bbl)Percentage of EOR Production by Country in 2009 (≈ 1.1 Billion bbl)
SOURCE: Industry Sources. Calculated and estimated by SBI Energy
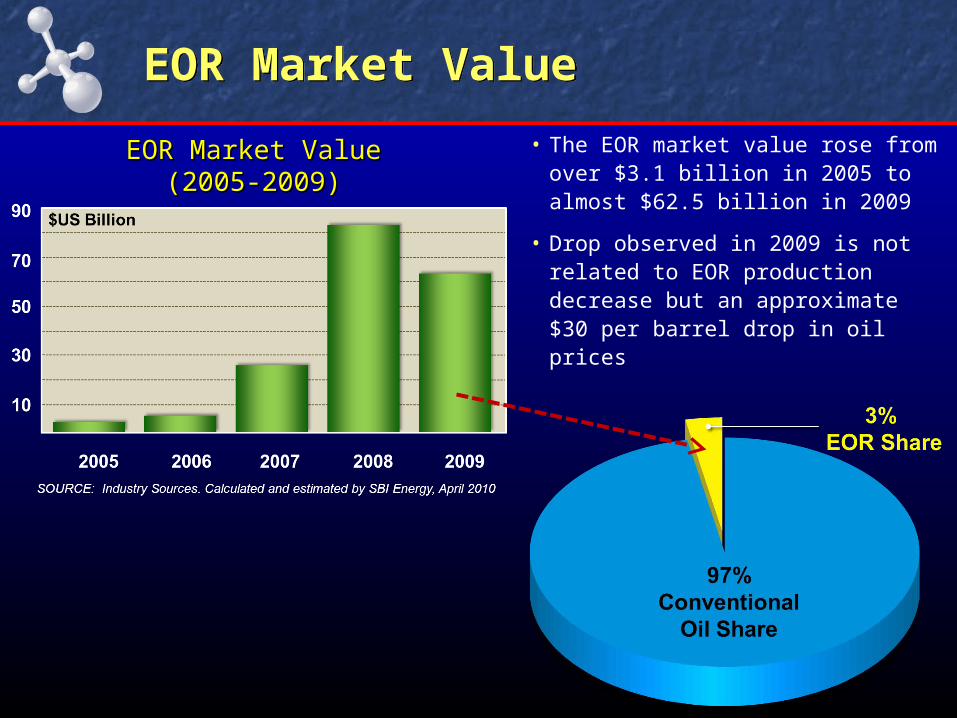
EOR Market ValueEOR Market Value
• The EOR market value rose from over $3.1 billion in 2005 to almost $62.5 billion in 2009
• Drop observed in 2009 is not related to EOR production decrease but an approximate $30 per barrel drop in oil prices
EOR Market ValueEOR Market Value(2005-2009)(2005-2009)

7
One of Multiple New EOR Predictions
One of Multiple New EOR Predictions

Projected EOR Potential:2009 - 2015Projected EOR Potential:2009 - 2015
• Market study in 1998 total EOR production was estimated in 1 Billion barrels by 2005 (Fredonia)
• Recent market study for EOR predicts a steady increase in world oil production based on energy demand and economic growth of China, India, Russia and the U.S. (SBI Energy 2010)
• World EOR production was forecasted in approx. 12 billion barrels by 2015
• EOR market value was projected to reach $US 1.3 Trillion by 2015
Projected Total Oil Production(Billion Barrels)
Projected EOR Oil Production(Billion Barrels)
SOURCE: Industry Sources. Calculated and estimated by SBI Energy

EOR Projected Market Growth Based on Oil Price Per BarrelEOR Projected Market Growth Based on Oil Price Per Barrel
SOURCE: Department of Energy, U.S. Energy Information Administration and industry sources. Calculated and estimated by SBI Energy.
Average Price $US/bbl
Low 55
Reference 92
High 115

Projected EOR Worldwide Market Share of Production by 2015 (≈ 12 Billion bbl)Projected EOR Worldwide Market Share of Production by 2015 (≈ 12 Billion bbl)
SOURCE: Industry Sources. Calculated and estimated by SBI Energy

11
Two EOR Cases:CO2 vs. HPAI
Two EOR Cases:CO2 vs. HPAI
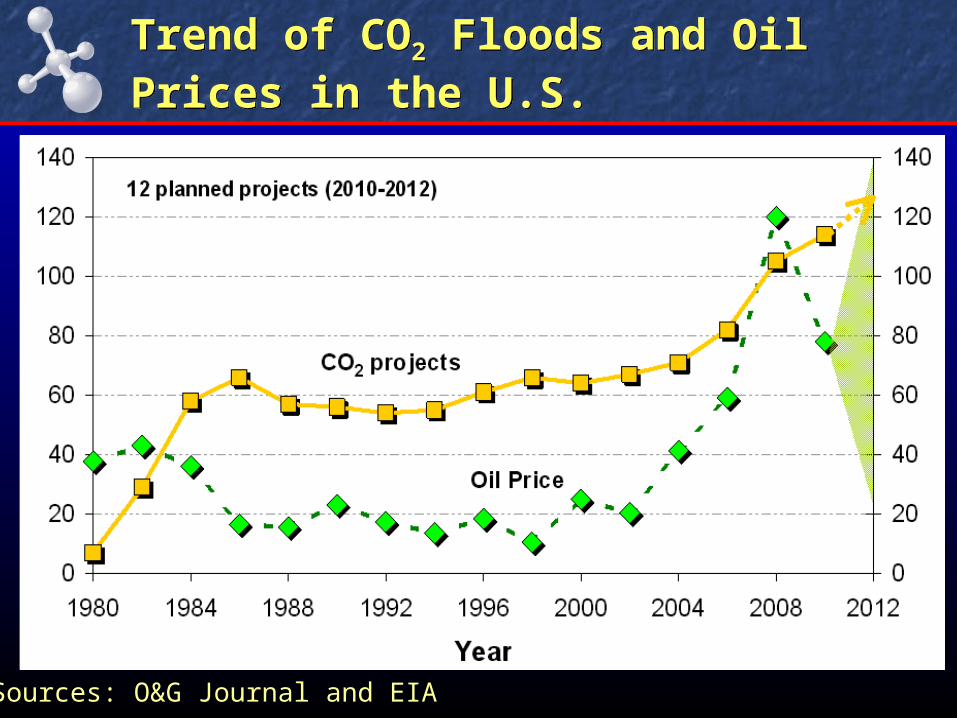
Trend of CO2 Floods and Oil Prices in the U.S.
Trend of CO2 Floods and Oil Prices in the U.S.
Sources: O&G Journal and EIA

North American CO2 Sources and EOR Areas (Most from Natural Sources!)
North American CO2 Sources and EOR Areas (Most from Natural Sources!)
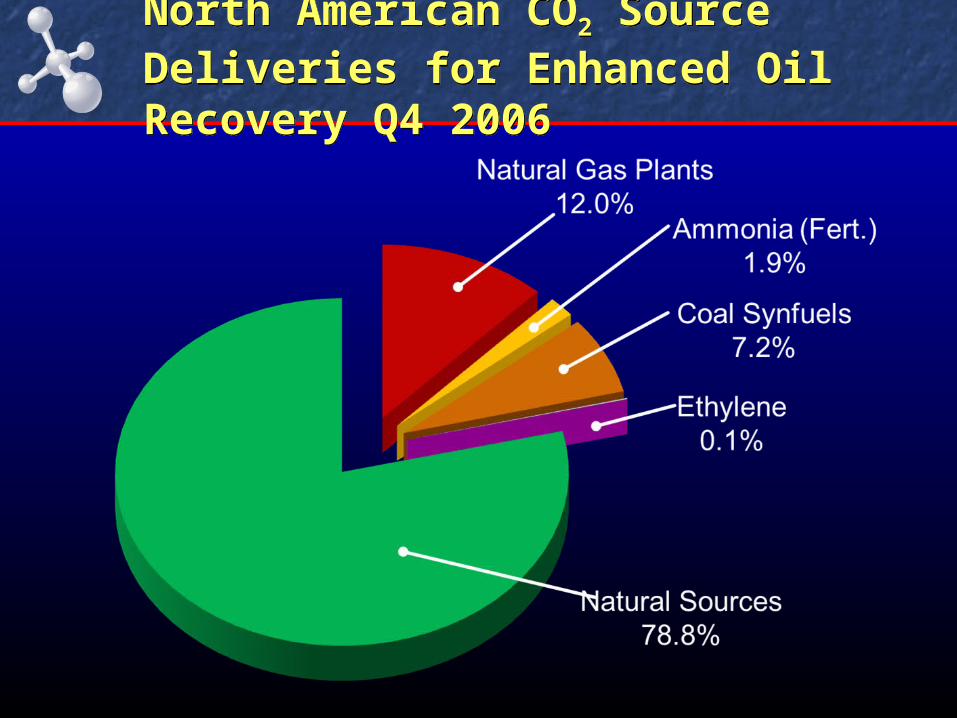
North American CO2 Source Deliveries for Enhanced Oil Recovery Q4 2006
North American CO2 Source Deliveries for Enhanced Oil Recovery Q4 2006

Average CO2 Capture Cost by SourceAverage CO2 Capture Cost by Source
Source: Industry Sources. Calculated and estimated by SBI Energy, April 2010

Example of CO2 Flood Costs and Incomes (EOR / Storage)
Example of CO2 Flood Costs and Incomes (EOR / Storage)
Costs
Potential incomes to offset CCS
costs$40/bbl - 02 Feb. 09 $74/bbl - 21 Aug. 09$86/bbl – 4 Nov. 10
€ 9.75/tCO2 - 02 Feb. 09€ 15.34/tCO2 - 21 Aug. 09€ 14.38/tCO2 – 4 Nov. 10
Include compression costs

Example of CO2 Purchase/Recycle in a Large CO2-EOR Project
Example of CO2 Purchase/Recycle in a Large CO2-EOR Project
0
20
40
60
80
100
120
140
160
180
1986 1987 1988 1989 1990 1991 1992 1993 1994 1995 1996
MM
CF
D
Gas Production
CO2 Purchase
Recycle Capacity
Courtesy of Ron Wackowski, 1997
CO2 purchase decreases with time in
EOR projects (Economics).
CO2 recycling limit storage potential of oil reservoirs (Economic limit of EOR projects). CO2 storage is
also limited by the reservoir storage capacity.
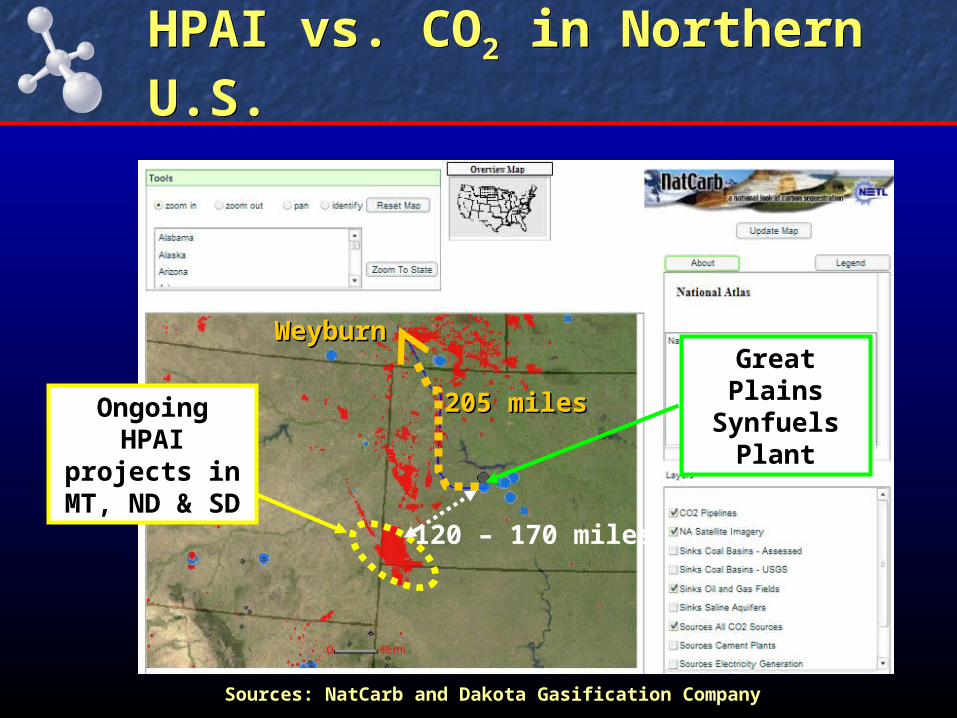
HPAI vs. CO2 in Northern U.S.HPAI vs. CO2 in Northern U.S.
Ongoing HPAI projects in MT,
ND & SD
120 – 170 miles
Sources: NatCarb and Dakota Gasification Company
Great Plains Synfuels
Plant
WeyburnWeyburn
205 miles205 miles
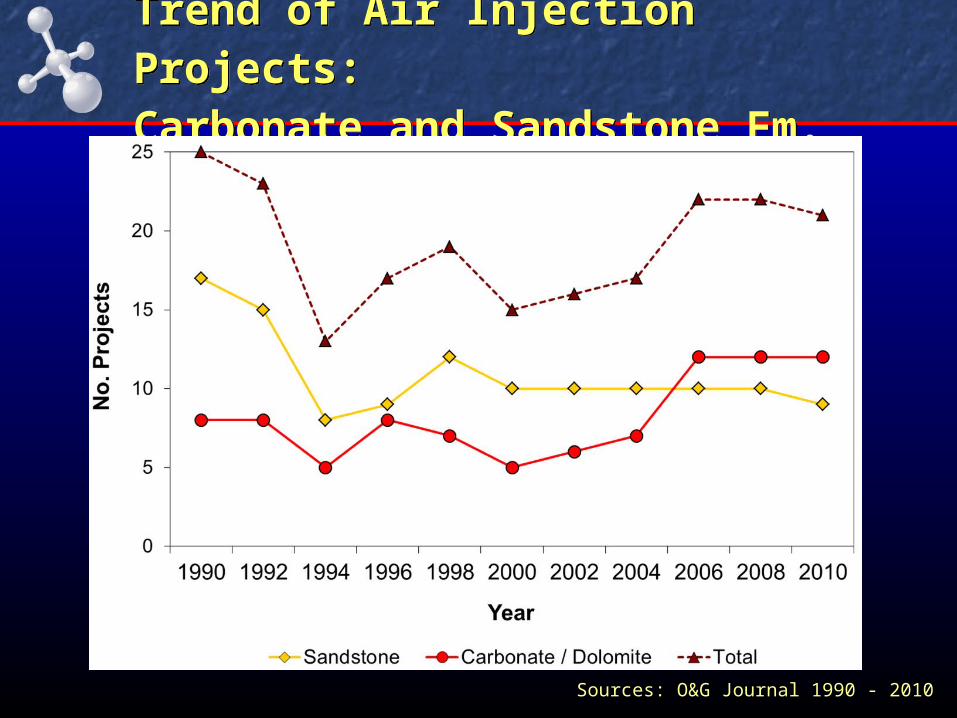
Trend of Air Injection Projects:Carbonate and Sandstone Fm.
Trend of Air Injection Projects:Carbonate and Sandstone Fm.
Sources: O&G Journal 1990 - 2010

Cedar Hills Project, North DakotaCedar Hills Project, North Dakota
Why High Pressure Air Injection (HPAI)?
• Low primary recovery ~ 8%• Fluid expansion and rock compaction are main
driving mechanisms• Low permeability ~ 3 md (Dolomitic Reservoir)• High Initial water saturation ~ 35%• Deep reservoir ~ 9,000 ft• High temperature ~ 225° F
• No access to cheap CO2
• Natural Gas for markets

HPAI Modeling: 100 sections API gravity ~30, sweet crude Carbonate Formation, 8500’ TVD 4 feet Upper, 5 feet Lower Primary recovery from rock & fluid expansion GOR ~ 350 SCF/STB
Cedar Hills Project, North DakotaCedar Hills Project, North Dakota

Field Development• Initial (1995 – 1998)
• Open-hole horizontal well completion• 640 acre well spacing – 84 producers• Primary Recovery
• Subsequent (2001 – 2004)• Infill drilling of injection wells• 320 acre well spacing – 84 producers; 66 injectors; 150 total• High Pressure Air Injection (HPAI)• Water injection along unit boundary
• Current Plan (2005 – 2009)• Three drilling rigs active• 28 horizontal extensions • 109 new horizontal infill wells• 160 acre well spacing development• Hybrid air and water injection
Cedar Hills Project, North DakotaCedar Hills Project, North Dakota
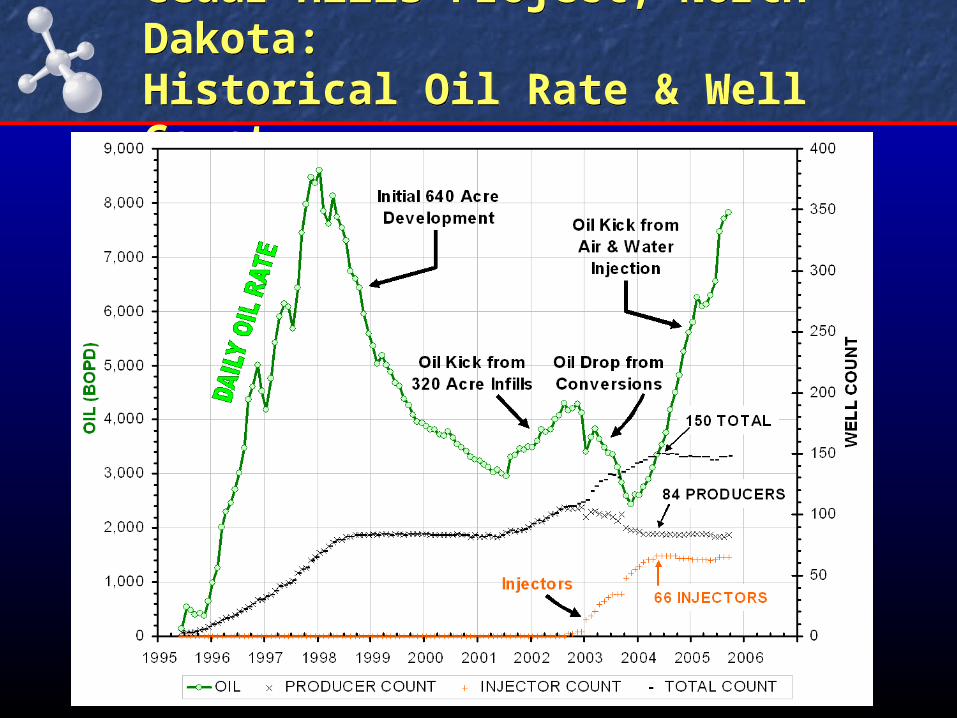
Cedar Hills Project, North Dakota:Historical Oil Rate & Well CountCedar Hills Project, North Dakota:Historical Oil Rate & Well Count
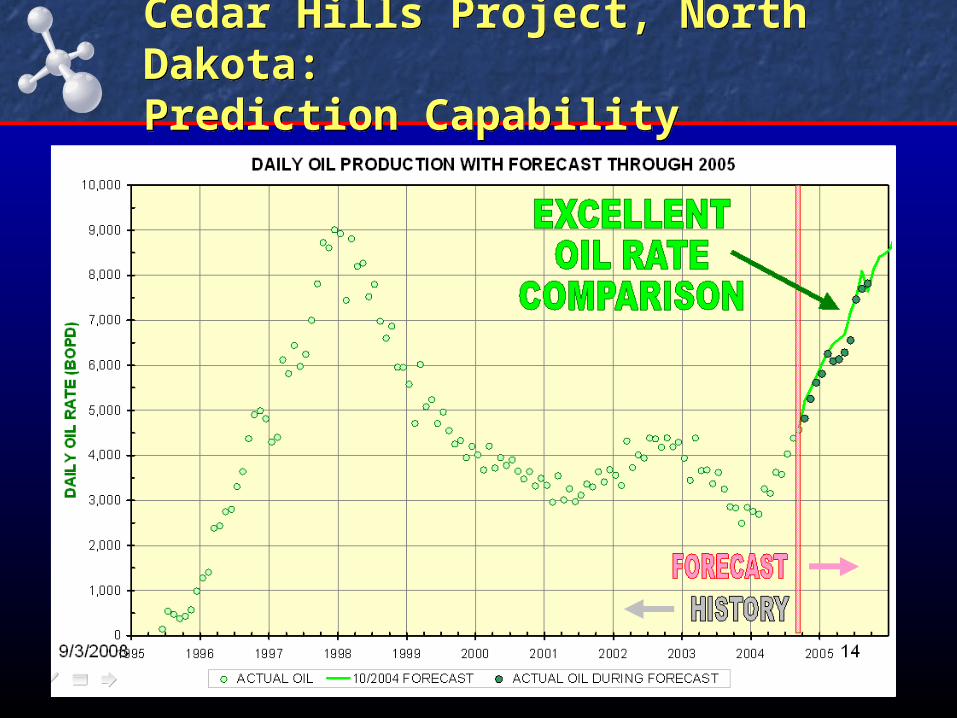
Cedar Hills Project, North Dakota:Prediction CapabilityCedar Hills Project, North Dakota:Prediction Capability
Challenges & OpportunitiesChallenges & Opportunities
• Chemical flooding seems to be the most feasible EOR method for Argentinean reservoirs. Combined with waterflooding optimization these strategies can be implemented in a reasonable period of time
• Develop an inventory of CO2 sources in Argentina and evaluate its distance to oil reservoirs candidates for this EOR method
- CO2 availability may arrive to late (depleted an watered out reservoirs) making difficult project economics
- CO2 volumes required in EOR projects are small compared to CO2 volumes emitted by power plants. The economics of CO2 - EOR are based on CO2 purchase / recycle strategies
• If EOR expansion is materialized , staffing and availability of large volume of chemicals, among others, may represent key challenges for large scale applications
• Is HPAI and other thermal methods viable in Argentina?