
Computational study of nuclear magnetic shielding constants
125
COMPUTATIONAL STUDY OF NUCLEAR MAGNETIC SHIELDING CONSTANTS Abril Carolina Castro Aguilera Per citar o enllaçar aquest document: Para citar o enlazar este documento: Use this url to cite or link to this publication: http://hdl.handle.net/10803/565597 ADVERTIMENT. L'accés als continguts d'aquesta tesi doctoral i la seva utilització ha de respectar els drets de la persona autora. Pot ser utilitzada per a consulta o estudi personal, així com en activitats o materials d'investigació i docència en els termes establerts a l'art. 32 del Text Refós de la Llei de Propietat Intel·lectual (RDL 1/1996). Per altres utilitzacions es requereix l'autorització prèvia i expressa de la persona autora. En qualsevol cas, en la utilització dels seus continguts caldrà indicar de forma clara el nom i cognoms de la persona autora i el títol de la tesi doctoral. No s'autoritza la seva reproducció o altres formes d'explotació efectuades amb finalitats de lucre ni la seva comunicació pública des d'un lloc aliè al servei TDX. Tampoc s'autoritza la presentació del seu contingut en una finestra o marc aliè a TDX (framing). Aquesta reserva de drets afecta tant als continguts de la tesi com als seus resums i índexs. ADVERTENCIA. El acceso a los contenidos de esta tesis doctoral y su utilización debe respetar los derechos de la persona autora. Puede ser utilizada para consulta o estudio personal, así como en actividades o materiales de investigación y docencia en los términos establecidos en el art. 32 del Texto Refundido de la Ley de Propiedad Intelectual (RDL 1/1996). Para otros usos se requiere la autorización previa y expresa de la persona autora. En cualquier caso, en la utilización de sus contenidos se deberá indicar de forma clara el nombre y apellidos de la persona autora y el título de la tesis doctoral. No se autoriza su reproducción u otras formas de explotación efectuadas con fines lucrativos ni su comunicación pública desde un sitio ajeno al servicio TDR. Tampoco se autoriza la presentación de su contenido en una ventana o marco ajeno a TDR (framing). Esta reserva de derechos afecta tanto al contenido de la tesis como a sus resúmenes e índices. WARNING. Access to the contents of this doctoral thesis and its use must respect the rights of the author. It can be used for reference or private study, as well as research and learning activities or materials in the terms established by the 32nd article of the Spanish Consolidated Copyright Act (RDL 1/1996). Express and previous authorization of the author is required for any other uses. In any case, when using its content, full name of the author and title of the thesis must be clearly indicated. Reproduction or other forms of for profit use or public communication from outside TDX service is not allowed. Presentation of its content in a window or frame external to TDX (framing) is not authorized either. These rights affect both the content of the thesis and its abstracts and indexes.
Transcript of Computational study of nuclear magnetic shielding constants
COMPUTATIONAL STUDY OF NUCLEAR MAGNETIC SHIELDING CONSTANTS
Abril Carolina Castro Aguilera
Per citar o enllaçar aquest document: Para citar o enlazar este documento: Use this url to cite or link to this publication: http://hdl.handle.net/10803/565597
ADVERTIMENT. L'accés als continguts d'aquesta tesi doctoral i la seva utilització ha de respectar els drets de la persona autora. Pot ser utilitzada per a consulta o estudi personal, així com en activitats o materials d'investigació i docència en els termes establerts a l'art. 32 del Text Refós de la Llei de Propietat Intel·lectual (RDL 1/1996). Per altres utilitzacions es requereix l'autorització prèvia i expressa de la persona autora. En qualsevol cas, en la utilització dels seus continguts caldrà indicar de forma clara el nom i cognoms de la persona autora i el títol de la tesi doctoral. No s'autoritza la seva reproducció o altres formes d'explotació efectuades amb finalitats de lucre ni la seva comunicació pública des d'un lloc aliè al servei TDX. Tampoc s'autoritza la presentació del seu contingut en una finestra o marc aliè a TDX (framing). Aquesta reserva de drets afecta tant als continguts de la tesi com als seus resums i índexs.
ADVERTENCIA. El acceso a los contenidos de esta tesis doctoral y su utilización debe respetar los derechos de la persona autora. Puede ser utilizada para consulta o estudio personal, así como en actividades o materiales de investigación y docencia en los términos establecidos en el art. 32 del Texto Refundido de la Ley de Propiedad Intelectual (RDL 1/1996). Para otros usos se requiere la autorización previa y expresa de la persona autora. En cualquier caso, en la utilización de sus contenidos se deberá indicar de forma clara el nombre y apellidos de la persona autora y el título de la tesis doctoral. No se autoriza su reproducción u otras formas de explotación efectuadas con fines lucrativos ni su comunicación pública desde un sitio ajeno al servicio TDR. Tampoco se autoriza la presentación de su contenido en una ventana o marco ajeno a TDR (framing). Esta reserva de derechos afecta tanto al contenido de la tesis como a sus resúmenes e índices.
WARNING. Access to the contents of this doctoral thesis and its use must respect the rights of the author. It can be used for reference or private study, as well as research and learning activities or materials in the terms established by the 32nd article of the Spanish Consolidated Copyright Act (RDL 1/1996). Express and previous authorization of the author is required for any other uses. In any case, when using its content, full name of the author and title of the thesis must be clearly indicated. Reproduction or other forms of for profit use or public communication from outside TDX service is not allowed. Presentation of its content in a window or frame external to TDX (framing) is not authorized either. These rights affect both the content of the thesis and its abstracts and indexes.

DOCTORAL THESIS
Computational Study of Nuclear Magnetic Resonance Shielding Constants
Abril Carolina Castro Aguilera 2017
Doctoral programme in Chemistry
Supervised by: Prof. Dr. Marcel Swart Tutor: Prof. Dr. Marcel Swart
Presented in partial fulfilment of the requirements for a doctoral degree from the University of Girona

Dr. Marcel Swart, ICREA Research Professor at Institut de Química Computacional i
Catàlisi (IQCC), Universitat de Girona,
DECLARE:
That the thesis entitled “Computational Study of Nuclear Magnetic Resonance
Shielding Constants”, presented by Abril Carolina Castro Aguilera to obtain the doctoral
degree, has been completed under my supervision and meets the requirements to opt for
an International Doctorate.
For all the intents and purposes, I hereby sign this document.
___________________________
Prof. Dr. Marcel Swart
Girona, September 28th, 2017


Dedicated to my love,
family, and friends.

List of Publications
The thesis is based in the following publications:
I. A. C. Castro, M. Swart, C. Fonseca Guerra, The influence of substituents and the environment on the NMR shielding constants of supramolecular complexes based on A-T and A-U base pairs, Phys. Chem. Chem. Phys., 2017, 19, 13496-13502. [cover: PCCP, 2017, 19, 14188.]
II. A. C. Castro, H. Fliegl, M. Cascella, T. Helgaker, M. Repisky, S. Komorovsky, M. A. Medrano, A. G. Quiroga, M. Swart, Four-component relativistic 31P-NMR calculations in trans-platinum(II) complexes: Importance of the solvent and dynamics in spectral simulations, to be submitted.
III. A. C. Castro, A. Romero, S. Osuna, K. N. Houk, M. Swart, Computational NMR Spectroscopy for Host-Guest Hemicarcerands, to be submitted.
IV. A. C. Castro, E. Osorio, J. L. Cabellos, E. Cerpa, E. Matito, M. Solà, M. Swart, G. Merino. Exploring the Potential Energy Surface of E2P4 clusters (E = Group 13 Elements): The quest of inverse carbon-free sandwiches, Chem. Eur. J., 2014, 20, 4583- 4590. [cover: Chem. Eur. J. 16/2014.]


Journal Covers
1. PCCP, 2017, 19, 14188.

2. Chem. Eur. J. 16/2014.
Other Publications
V. L. Liu, D. Moreno, E. Osorio, A. C. Castro, S. Pan, P. K. Chattaraj, T. Heine, G. Merino. Structure and bonding of IrB12−: Converting a rigid boron B12 platelet to a Wankel motor, RSC Adv., 2016, 6, 27177-27182.
VI. P. Chakraborty, J. Adhikar, S. Samanta, D. Escudero, A. C. Castro, M. Swart, S. Ghosh, A. Bauzá, A. Frontera, E. Zangrando, D. Das. Combined experimental and theoretical investigation of ligand and anion controlled complex formation with unprecedented structural features and photoluminescence properties of Zinc(II) complexes, Cryst. Growth Des., 2014, 14(8), 4111- 4123.

List of Figures
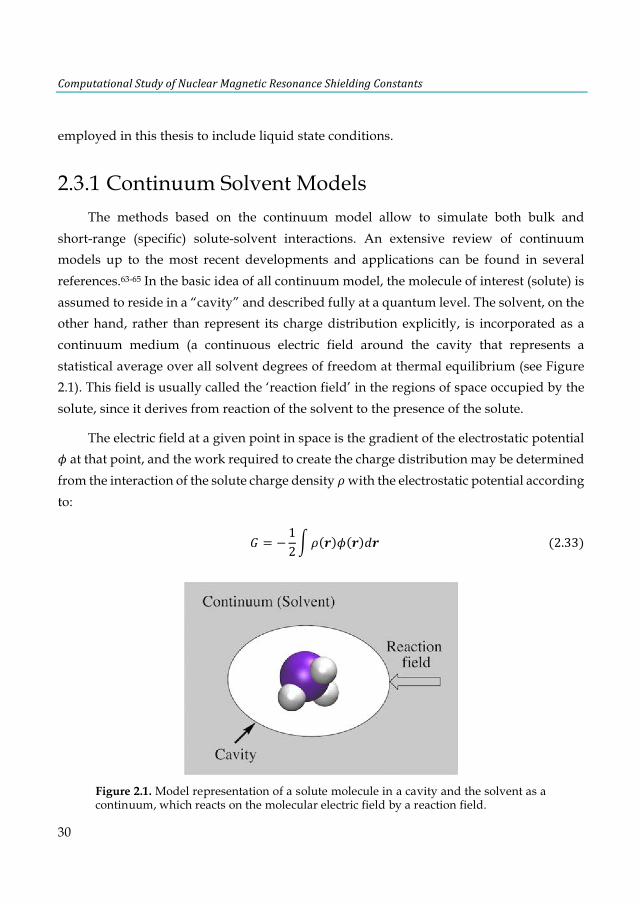
Figure 1.1. Two possible orientations of the magnetic moment of a spinning proton in an external magnetic field. .................................................................................................................................... 8 Figure 1.2. Nuclear Zeeman effects. a) A nucleus with I=1/2. b) A nucleus with I=1. The arrow beside each spin line indicates the orientation of the magnetic moment in a vertical magnetic field............................................................................................................................................................. 9 Figure 1.3. Effect of diamagnetic shielding. The dotted ellipses represent motion of electrons in their orbitals under the influence of B0. ........................................................................................... 11 Figure 1.4. Structure and 250-MHz 1H-NMR spectra of adenosine in DMSO-d6. (Reproduced with permission from R. S. Macomber, A Complete Introduction to Modern NMR Spectroscopy, John Wiley & Sons, 1998). ....................................................................................................................... 12 Figure 2.1. Model representation of a solute molecule in a cavity and the solvent as a continuum, which reacts on the molecular electric field by a reaction field. ..................................................... 30 Figure 4.1. Model structures of substituted AX8–TY6 and AX8–UY6 base pairs, where X8, Y6= NH–, NH2, NH3
+ (N series), O–, OH, OH2+ (O series), F, Cl or Br (halogen series). .............................. 40
Figure 4.2. Schematic representation of substituent effects on the hydrogen bonds in A-U. The proton transfer from U to A is labeled with a bold circle and occurs in (a) and (f). ...................... 45 Figure 4.3. Calculated correlation between the C2-adenine shielding values (ppm) of isolated adenine (AX8) bases and AX8-T base pairs. The proton transfer systems were not included in the plot, due to their particular behavior. ...................................................................................................... 53 Figure 4.4. Calculated dependence of the NMR C2-shielding values (ppm) as a function of the hydrogen-bond strength (kcal×mol-1). (a) C2-adenine shielding of AX8-T, (b) C2-adenine shielding of A-TY6, (c) C2-thymine shielding of AX8-T, and (d) C2-thymine shielding of A-TY6 base pairs. The proton transfer systems were not included in the plot, due to their particular behavior. ............... 55 Figure 4.5. Structures of adenine, thymine and A-T base pair interacting with a K+ cation and two water molecules. .............................................................................................................................. 56 Figure 4.6. Calculated dependence of the NMR C2-adenine shielding values (ppm) as a function of the hydrogen-bond strength (kcal×mol-1) of the natural A-T, and the [K+(N7)×××A-T], [A-T×××K+(O4)]

and [A-T×××K+(O2)] model structures. .............................................................................................. 57 Figure 5.1. Structure of the trans-[PtCl2(dma)PPh3] complex. ...................................................... 62 Figure 5.2. Progress of the solution of the complex in a) DMSO-d6:D2O/H2O monitoring by 31P-NMR at 30m (in blue), 2.5h (in red), and 24h (in green) and b) DMSO-d6 (200µl) and 300µl of D2O/H2O/acetone (23%/66%/11%). ................................................................................................ 66 Figure 5.3. Structures of selected trans-platinum(II) complexes optimized at the PBE-D/TZ2P level with COSMO. ................................................................................................................................... 67 Figure 5.4. Dynamically calculated 31P-NMR shielding (σ) constants of the PH3 and trans-[PtCl2(dma)PPh3] complex obtained with SO-ZORA (Gas-phase and aqueous solution) (a-b) and mDKS (c-d) relativistic corrections at the PBE (in blue) and KT2 (in orange) levels. ............ 72 Figure 5.5. AIMD snapshots of trans-[PtCl2(dma)PPh3] explicit 3 and 5 water molecules and plotting the most important non-covalent interaction regions (in blue/green) using the NCI program. Total number of atoms in parentheses. ............................................................................................ 73 Figure 5.6. Dynamically calculated 31P-NMR shielding constants σ (in ppm) of the trans-[PtCl2(dma)PPh3] with explicit water molecules obtained with SO-ZORA (a-b) and mDKS (c-
d) relativistic corrections at the PBE (in blue) and KT2 (in orange) levels. ................................... 74 Figure 5.7. Radial distribution function of the water a) oxygen and b) hydrogen atoms around Pt a for the solvated trans-[PtCl2(dma)PPh3] complex. The arrows describe the statistical presence of a weakly bound water along the axis perpendicular to the square-planar Pt complex. .................... 75 Figure 5.8. Comparison of the static and dynamic 31P-NMR chemical shifts of the parent trans-[PtCl2(dma)PPh3] complex calculated using SO-ZORA and mDKS relativistic corrections at the PBE and KT2 levels. The experimental value is indicated by a dashed line. ............................ 77 Figure 6.1. Structure of o-benzyne. ................................................................................................. 82 Figure 6.2. Hemicarcerands 1 and 2 with a guest G in its interior. ............................................... 83 Figure 6.3. Guest structures divided into classes A-F .................................................................... 86 Figure 6.4. Optimized structures of o-benzyne guest along a) long axis and b) equatorial axis of hemicarcerand 2. ............................................................................................................................. 95 Figure 7.1. Inverse sandwich structures of a) cationic [E-Cp-E’]+ (E and E’= B-Tl), b) neutral [E-C4H4-E] (E= Al-Tl) and c) global minimum E2C4H4 (E = Al-Tl) as proposed by Liu et al. ...... 99 Figure 7.2. Lowest-lying structures of the B2P4 cluster computed at the S12h/TZ2P level. Relative energies are given in kcal·mol-1. In parentheses are the B-B bond lengths in Å. All structures are local minima on its corresponding PES, except 1j, which is a transition state. ............................ 103 Figure 7.3. Structure of [(HOMO)+(HOMO-1)] and [(HOMO)-(HOMO-1) of the B2P4 (D2d)
cluster. ............................................................................................................................................ 103 Figure 7.4. Lowest-lying structures of the E2P4 (E= Al-Tl) clusters computed at the S12h/TZ2P level. Relative energies are given in kcal·mol-1. aThis structure does not converge. bIn parentheses are the number of imaginary frequencies. cThis structure converges to the 2b isomer. ............... 104 Figure 7.5. Chemical bonding pictures of E2P4 (E= B, Al, Ga, In and Tl) revealed by the AdNDP analysis. The AdNDP analysis was performed at PBE0/LANL2DZ level. .................................... 106 Figure 7.6. Qualitative correlation diagram for the D4h [E-P4-E] (E= B-Tl) complexes. ............ 108 Figure 7.7. Energetic reaction cycle involving the isomerization of the E2P4 clusters (E= B-Tl) between D4h and D2d structures. .................................................................................................... 109 Figure 7.8. Contributions to the isomerization energy for the E2P4 clusters (E= B-Tl) by using IEDA. ............................................................................................................................................. 110 Figure A1.1. Calculated correlation between the C2-thymine shielding values (ppm) of isolated thymine (TY6) bases and A-TY6 base pairs. The proton transfer systems were not included in the plot, due to its particular behavior. ....................................................................................................... 126 Figure A1.2. Calculated dependence of the NMR C2-shielding values (ppm) as a function of the hydrogen-bond strength (kcal×mol-1). a) C2-adenine shielding of AX8-U, b) C2-adenine shielding of A-UY6, c) C2-uracil shielding of AX8-U, and d) C2-uracil shielding of A-UY6 base pairs. The proton transfer systems were not included in the plot, due to its particular behavior. ............................. 127 Figure A2.1 a) 1H-NMR, b) HSQC [1H-13C] NMR and c) 31P-NMR spectra of the complex in DMSO d6 (200µl) and 300µl of D2O/H2O (90%/10%) after 30m. ............................................................ 128 Figure A3.1. Most stable structures of hemicarceplexes (1@G) optimized at the PBE-D/TZ2P level......................................................................................................................................................... 131 Figure A3.2. Structure of (1@o-benzyne) optimized at the PBE-D/TZ2P level. .......................... 134

List of Tables
Table 4.1. Hydrogen-bond lengths (Å) and bond energies ΔEBond (kcal×mol-1) for AX8-TY6 and AX8-UY6 base pairsa ........................................................................................................................................ 43 Table 4.2. EDA analysis (in kcal×mol-1) of the AX8-UY6 base pairs (N and O series)a ..................... 47 Table 4.3. EDA analysis (in kcal×mol-1) of the AX8-UY6 base pairs using interacting fragments that involves the H3-proton transfera ...................................................................................................... 48 Table 4.4. EDA analysis (in kcal×mol-1) of the AX8-UY6 base pairs (halogen series)a ...................... 49 Table 4.5. VDD atomic charges QA (a.u.) in the front atoms and the adenine/uracil C2 carbon atoms of the AX8-UY6 base pairs. ................................................................................................................. 50 Table 4.6. NMR C2-adenine shielding (σ) values (ppm) computed at the SAOP/TZ2P level for the isolated adenine (AX8) bases and AX8-T base pairsa ......................................................................... 52 Table 4.7. NMR C2-thymine shielding (σ) values (ppm) computed at the SAOP/TZ2P level for the isolated thymine (TY6) bases and A-TY6 base pairsa ......................................................................... 54 Table 4.8 NMR C2-adenine/thymine shielding (σ) values (ppm) computed at the SAOP/TZ2P level for adenine, thymine and A-T base pair interacting with a K+ cation and two water moleculesa .. 57 Table 5.1. Basis-set dependence of mDKS relativistic corrections to the 31P-NMR nuclear shielding constants and chemical shifts (in ppm) of the parent trans-[PtCl2(dma)PPh3] complex. ............... 68 Table 5.2. Basis-set dependence of ZORA relativistic corrections (SR and SO) to the 31P-NMR nuclear shielding constants and chemical shifts (in ppm) of the PH3 and trans-platinum(II) complexes using the PBE functional. ............................................................................................... 69 Table 5.3. Static 31P-NMR chemical shifts of the trans-platinum(II) complexes calculated with selected methods and using the PH3 correction (85% aqueous H3PO4), see Eq. 5.1. ..................... 71 Table 5.4. Static and dynamic 31P-NMR shielding constants (σ) of PH3 and the parent trans-[PtCl2(dma)PPh3] complex and 31P-NMR chemical shifts (δ) of the parent complex. .......... 76 Table 6.1. Calculated and experimental 1H-NMR chemical shifts (δ) of free and incarcerated guests and their spectra changes in the chemical shifts of guest protons caused by incarceration (Δδ). .. 87 Table 6.2. Modified results of the calculated and experimental 1H-NMR chemical shifts (δ) for selected class B guests. .................................................................................................................... 90
Table 6.3. Calculated and experimental 1H-NMR chemical shifts (δ) of free and incarcerated hosts 1@G (δ), and their chemical shift changes (Δδ) relative to free host 1. ......................................... 92 Table 6.4. Comparison between the calculated and experimental 1H and 13C-NMR chemical shifts in o-benzyne (ppm). .......................................................................................................................... 93 Table 7.1. Results of the EDA for the 2a (D4h) structure in [E-P4-E] (E= B-Tl) complexes. The interacting fragments are (E×××E)2+ and P4
2-. Energy values are in kcal·mol-1. ............................. 107 Table 7.2. Results of IEDA at the S12h/TZ2P level for the E2P4 (E = B, Al, Ga, In, Tl) clusters with E2
2+ and P42- fragments for the D4h ® D2d isomerization reaction. Energy values are in kcal·mol-1.
........................................................................................................................................................ 110 Table 7.3. The second, third and fifth columns collect the results of INB aromaticity index (values multiplied by 1000) for the E2P4 (E= Al, Ga, In, Tl) D4h and D2d clusters. Global values (E2P4) and the local values for the P4
2- unit (for comparison the free P42- value is 53) for the D4h conformer are
collected. The fourth column contains the delocalization index between P42- unit and the E2
2+ fragment. ........................................................................................................................................ 111 Table 7.4. 31P-NMR shielding values (ppm) computed at the KT2/ET-pVQZ level for the D4h and D2d isomers of the E2P4 clusters. .................................................................................................... 112 Table A1.1. VDD atomic charges in the front atoms and the adenine/thymine C2 carbon atoms of the AX8-TY6 base pairs. ................................................................................................................... 124 Table A1.2. VDD atomic charges in the front atoms and the adenine/uracil C2 carbon atoms of the AX8-UY6 base pairs. ......................................................................................................................... 125 Table A1.3. NMR C2-adenine shielding (σ) values (ppm) computed with SAOP/TZ2P level for the isolated adenine (AX8) bases and AX8-U base pairs.[a ................................................................ 125 Table A1.4. NMR C2-adenine shielding (σ) values (ppm) for the isolated adenine (AX8)[a] and the AX8//AX8-T[b] bases computed with SAOP/TZ2P level. ................................................................... 126 Table A2.1. Basis-set dependence of ZORA relativistic corrections (SR and SO) to the 31P-NMR nuclear shielding constants and chemical shifts (in ppm) of the phosphine and trans-platinum(II) complexes using the KT2 functional. ............................................................................................. 129

List of Abbreviations
AdNDP Adaptive natural partitioning analysis AIMD ab-initio Molecular Dynamic A-T Adenine-Thymine A-U Adenine-Uracil CCSDT Coupled Cluster CDFT Current Density Functional Theory DFT Density Functional Theory DIEs Deuterium isotope effects DMSO Dimethyl sulfoxide EDA Energy Decomposition Analysis GIAO Gauge-Including Atomic Orbitals G-U Guanine-Cytosine KS Kohn-Sham NCI Non-covalent Interaction plots NMR Nuclear Magnetic Resonance MD Molecular Dynamic mDKS Matrix Dirac-Kohn-Sham QM Quantum mechanical SO Spin-orbit coupling SR Scalar relativistic effect TF Thomas-Fermi TMS Tetramethylsilane VDD Voronoi deformation density ZORA Zeroth-order Regular Approximation

Acknowledgments
This thesis is the product of some four years of work, conducted mostly at the Institut de Química Computacional i Catàlisi (IQCC), at the Universitat de Girona. I owe my deep gratitude to my supervisor, Marcel Swart, not only for the scientific knowledge, but also for all the opportunities I was given to conduct my research. Also, I would like to thank my colleagues from the IQCC for their wonderful collaboration. You supported me greatly and were always willing to help me.
I would like to thank to all the collaborators of this work, specially to Trygve Helgaker, Heike Fliegl, Michele Cascella, and Célia Fonseca Guerra, for their valuable guidance during my research stays abroad. I also thank to the reviewers of this thesis, for their work and useful suggestions.
I thank for financial support to the following organizations: Ministry of Economy and Competitiveness of Spain (MICINN), National Council on Science and Technology of Mexico (CONACyT), and the CANIOC joint exchange programme, funded by the European Seventh Framework Programme through the Marie Curie Actions.
Special thanks to the Institut de Química Computacional i Catàlisi (IQCC), MareNostrum & RES, and Norwegian Supercomputing Program (NOTUR) for the computational resources.

Table of Contents
Summary ................................................................................................................. 1 Resum ..................................................................................................................... 2 Resumen .................................................................................................................. 3 Chapter 1. Introduction .......................................................................................... 5
1.1 Computational NMR spectroscopy ...................................................................... 7 1.1.1 Basic theory of NMR ...................................................................................... 7 1.1.2 A brief account of the chemical shift .............................................................. 9
1.1.2.1 Definition .............................................................................................................. 9 1.1.2.2 Theory of chemical shifts ................................................................................... 10
1.2 Computational aspects ........................................................................................ 12 1.2.1 Drawback of theoretical models .................................................................. 13 1.2.2 Additional medium effects ............................................................................ 14 1.2.3 Relativistic effects ........................................................................................ 15
Chapter 2. Methodology ...................................................................................... 17 2.1 Density functional theory ................................................................................... 19
2.1.1 The Hohenberg-Kohn Theorems .................................................................. 20 2.1.2 The Kohn-Sham formulation ........................................................................ 21 2.1.3 Relativistic DFT ........................................................................................... 23
2.1.3.1 The Dirac equation .............................................................................................. 23 2.1.3.2 The Breit-Pauli approximation ........................................................................... 24 2.1.3.3 The Zeroth Order Regular Approximation (ZORA) ........................................... 25 2.1.3.4 Four-component methods ................................................................................... 26
2.2 Calculation of NMR parameters ......................................................................... 27 2.2.1 Theoretical background ............................................................................... 27
2.3 Simulation techniques ......................................................................................... 29 2.3.1 Continuum Solvent Models .......................................................................... 30 2.3.2 Molecular dynamic simulations ................................................................... 31
Chapter 3. Objectives .......................................................................................... 35 Chapter 4. The influence of substituents and the environment on the NMR shielding constants of supramolecular complexes based on A-T and A-U base pairs............................................................................................................................... 37
4.1 State of the art ..................................................................................................... 39 4.2 Computational Methods ..................................................................................... 41
4.2.1 Energy decomposition analysis setup .......................................................... 41

4.3 Results and Discussion ....................................................................................... 42 4.3.1 Substituent effects on the model structures .................................................. 42 4.3.2 Origin of the Substituent Effects .................................................................. 46 4.3.3 NMR Chemical Shielding Constants ............................................................ 51
Chapter 5. Four-component relativistic 31P-NMR calculations in trans-platinum(II) complexes: Importance of the solvent and dynamics in spectral simulations ............................................................................................................ 59
5.1 State of the art ..................................................................................................... 61 5.2 Computational Details ........................................................................................ 62
5.2.1 Treatment of the Solvent Effects ................................................................... 64 5.3 Results and Discussion ....................................................................................... 65
5.3.1 Experimental NMR studies of the trans-[PtCl2(dma)PPh3] complex in solution .......................................................................................................................... 65
5.3.2 Static 31P-NMR chemical shift calculations ................................................. 66 5.3.3 Solvent effects in the 31P-NMR shielding constants ..................................... 71 5.3.4 Explicit treatment of the solvent ................................................................... 73 5.3.5 31P-NMR Chemical Shift Analysis ................................................................ 76
Chapter 6. Computational NMR Spectroscopy for host-guest Hemicarcerands . 79 6.1 State of the art ..................................................................................................... 81 6.2 Computational Details ........................................................................................ 83 6.3 Results and Discussion ....................................................................................... 84
6.3.1 Guest molecules inclusion within hosts ....................................................... 85 6.3.2 Chemical shifts of incarcerated hosts 1@G ................................................ 91 6.3.3 Encarceration of o-benzyne ......................................................................... 93
Chapter 7. Exploring the potential energy surface of E2P4 clusters (E= Group 13 elements): The quest for inverse carbon-free sandwiches .................................... 97
7.1 State of the art ..................................................................................................... 99 7.2 Computational Methods ................................................................................... 100 7.3 Results and Discussion ..................................................................................... 102
7.3.1 Structures ................................................................................................... 102 7.3.2 Adaptive natural density partitioning analysis .......................................... 105 7.3.3 Energy decomposition analysis .................................................................. 106 7.3.4 Isomerization energy decomposition analysis ........................................... 108 7.3.5 Global and local aromaticity ..................................................................... 110 7.3.6 31P-NMR shielding constants ..................................................................... 111
Chapter 8. General Conclusions ........................................................................ 113 References ........................................................................................................... 115 Appendices .......................................................................................................... 123
1
Summary
Nuclear Magnetic Resonance (NMR) spectroscopy is an indispensable structural tool in the modern analytical arsenal of chemists and structural biologists. Certainly, the synergy between computational and experimental methods in NMR spectroscopy is a powerful approach since it allows to combine the experimental precision with the predictive and explanatory power of theoretical methods, yielding new insight unachievable by the experimental or theoretical approaches alone. However, despite the advances attained in theoretical chemistry methods, the accuracy with which the NMR shift constants can be obtained depends on several factors and a protocol for these calculations is not always well established and understood.
The present thesis is a computational study of the NMR shift constants in a number of chemical systems of interest, using both static and dynamic approaches via Density Functional Theory, to predict, confirm the presence of transient species, and/or explain ambiguous signals in the NMR spectra. Special attention was put on cases where there are strong interactions between the solvent and the molecule studied. The most accurate calculations of this type involve the use of molecular dynamics simulations to provide typical solvent configurations in an atomistic and dynamic detail, and it can be combined with quantum mechanical calculations to determine the NMR chemical shifts in liquid state conditions.
In addition, this thesis addresses other methodological issues that influence the quality of the calculated NMR chemical shifts such as the level of theory, the explicit inclusion of solvent molecules, the choice of the reference molecule, as well as the relativistic effects for heavy element compounds.
2
Resum
L’espectroscòpia de Ressonància Magnètica Nuclear (RMN) és una eina indispensable en el modern arsenal de químics analítics i biòlegs estructurals. Indubtablement, una pràctica poderosa en espectroscòpia de RMN és l'ús de tots dos mètodes computacionals i experimentals, ja que permet combinar la precisió experimental amb el poder predictiu i explicatiu dels mètodes teòrics, aconseguint així una percepció que seria inabastable només per mètodes experimentals o teòrics . No obstant això, malgrat els avenços aconseguits en química teòrica, la precisió amb la qual es poden obtenir els desplaçaments químics de RMN depèn de diversos factors i no sempre es té ben establert i entès un protocol per al seu estudi.
La present tesi és un estudi computacional dels desplaçaments químics de RMN en un nombre de compostos químics d’interès, usant aproximacions estàtiques i dinàmiques mitjançant la teoria del funcional de la densitat, la qual ajudarà a predir, a confirmar i/o a complementar dades obtingudes experimentalment. S’ha donat especial atenció en casos on existeixen fortes interaccions substrat-solvent. Aquest tipus de càlculs tan precisos impliquen l’ús de metodologies més rigoroses, com la inclusió de simulacions de dinàmica molecular per a proveir en detall les típiques configuracions d’un solvent i que, en combinar-se amb càlculs de mecànica quàntica, permeten determinar els desplaçaments químics de RMN en condicions d’estat líquid.
Addicionalment, aquesta tesi aborda altres problemes metodològics que afecten la qualitat dels desplaçaments químics teòrics com el nivell de teoria, la inclusió explícita de molècules de solvent, l’elecció de la molècula de referència, així com els efectes relativistes en compostos que contenen àtoms pesats.
3
Resumen
La espectroscopia de Resonancia Magnética Nuclear (RMN) es una herramienta indispensable en el moderno arsenal de químicos analíticos y biólogos estructurales. Indudablemente, una práctica poderosa en espectroscopia de RMN es el uso de ambos métodos computacionales y experimentales, ya que permite combinar la precisión experimental con el poder predictivo y explicativo de los métodos teóricos, logrando así una percepción que sería inalcanzable solamente por métodos experimentales o teóricos. Sin embargo, a pesar de los avances logrados en química teórica, la precisión con la cual se pueden obtener los desplazamientos químicos de RMN depende de diversos factores y no siempre se tiene bien establecido y comprendido un protocolo para su estudio.
La presente tesis es un estudio computacional de los desplazamientos químicos de RMN en un número de compuestos químicos de interés, usando aproximaciones estáticas y dinámicas mediante la Teoría del Funcional de la Densidad lo cual ayudará a predecir, confirmar y/o complementar datos obtenidos experimentalmente. Se ha dado especial atención en casos donde existen fuertes interacciones substrato-disolvente. Este tipo de cálculos tan precisos implican el uso de metodologías más rigurosas, como la inclusión de simulaciones de dinámica molecular para proveer en detalle las típicas configuraciones de un disolvente y que, al combinarse con cálculos de mecánica cuántica, permiten determinar los desplazamientos químicos de RMN en condiciones de estado líquido.
Adicionalmente, esta tesis aborda otros problemas metodológicos que afectan la calidad de los desplazamientos químicos teóricos como el nivel de teoría, la inclusión explicita de moléculas de disolvente, la elección de la molécula de referencia, así como los efectos relativistas en compuestos que contienen átomos pesados.

ComputationalStudyofNuclearMagneticResonanceShieldingConstants
4

Chapter 1 Introduction
ComputationalStudyofNuclearMagneticResonanceShieldingConstants
6
SUMMARY
In this chapter, we introduce a brief description of the general theory behind the NMR spectroscopy and the fundamental quantum mechanical methods that are used to compute the NMR chemical shifts.
Chapter1.Introduction
7
1.1 Computational NMR Spectroscopy Nuclear Magnetic Resonance (NMR)1 is the study of molecular structure through
measurement of the interaction of an oscillating radio-frequency electromagnetic field with a collection of nuclei immersed in a strong external magnetic field. These nuclei are parts of atoms that, in turn, are assembled into molecules. An NMR spectrum, therefore, can provide detailed information about molecular structure and dynamics, information that would be difficult, if not impossible, to obtain by any other method.
It was in 1902 that physicist P. Zeeman shared a Nobel Prize for discovering that the nuclei of certain atoms behave strangely when subjected to a strong external magnetic field. And it was exactly 50 years later that physicists F. Bloch and E. Purcell shared a Nobel Prize for putting the so-called nuclear Zeeman effect to practical use by constructing the first crude NMR spectrometer. During the succeeding years, NMR has completely revolutionized the study of chemistry and biochemistry, not to mention having a significant impact on a host of other areas.
Nuclear magnetic resonance is probably the single most widely applied spectroscopic technique in modern chemical research for elucidation of molecular structure.
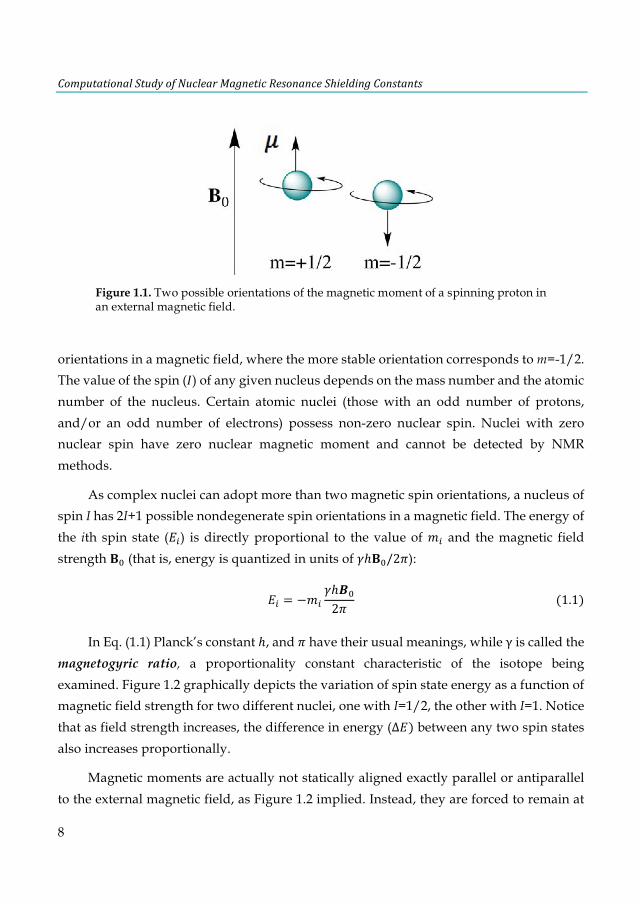
1.1.1 Basic theory of NMR The physics behind NMR signals is based on the observation that atomic nuclei have
a quantum mechanical property called nuclear spin. Because the nuclear proton is a charged particle (Z= 1), this spinning gives rise to a magnetic moment (!) represented by the boldface vector arrows in Figure 1.1. For a proton, the nuclear spin quantum number (m), can assume two possible orientations of the magnetic moment vector in an external magnetic field, “up” (in the same direction as the external field) or “down” (in the opposite direction to the external field). These two spin states are degenerate in the absence of an external magnetic field. However, when unpaired protons are immersed in an external field, the two states are no longer degenerate. We describe such a nucleus as having a nuclear spin (I) of ½.
Perhaps surprisingly, neutrons also exhibit a magnetic moment and a nuclear spin of I=1/2, even though they are uncharged. Therefore, they too can adopt two different
ComputationalStudyofNuclearMagneticResonanceShieldingConstants
8
orientations in a magnetic field, where the more stable orientation corresponds to m=-1/2. The value of the spin (") of any given nucleus depends on the mass number and the atomic number of the nucleus. Certain atomic nuclei (those with an odd number of protons, and/or an odd number of electrons) possess non-zero nuclear spin. Nuclei with zero nuclear spin have zero nuclear magnetic moment and cannot be detected by NMR methods.
As complex nuclei can adopt more than two magnetic spin orientations, a nucleus of spin I has 2I+1 possible nondegenerate spin orientations in a magnetic field. The energy of the ith spin state (#$) is directly proportional to the value of %$ and the magnetic field strength &' (that is, energy is quantized in units of (ℎ&'/2,):
#$ = −%$(ℎ/'
2, (1.1)
In Eq. (1.1) Planck’s constant ℎ, and , have their usual meanings, while γ is called the magnetogyric ratio, a proportionality constant characteristic of the isotope being examined. Figure 1.2 graphically depicts the variation of spin state energy as a function of magnetic field strength for two different nuclei, one with I=1/2, the other with I=1. Notice that as field strength increases, the difference in energy (∆#) between any two spin states also increases proportionally.
Magnetic moments are actually not statically aligned exactly parallel or antiparallel to the external magnetic field, as Figure 1.2 implied. Instead, they are forced to remain at
Figure 1.1. Two possible orientations of the magnetic moment of a spinning proton in an external magnetic field.

Chapter1.Introduction
9
a certain angle to &', and this causes them to “wobble” around the axis of the field at a fixed frequency. This periodic wobbling motion is called precession. Thus, the magnetic moment vector of a nucleus in a magnetic field precesses with a characteristic angular frequency called the Larmor frequency (7), which is a function solely of γ and &':
7 = (/'(1.2)
The angular Larmor frequency, can be transformed into linear frequency 8 by division by 2,:
89:;<;==$>? =72, =
(/'
2, (1.3)
1.1.2 A brief account of the chemical shift
1.1.2.1 Definition The fundamental quantity underpinning the phenomenon of the chemical shift of a
nucleus is its magnetic shielding tensor, A. The isotropic average, ABCD, is the shielding or deshielding of the nucleus in the substrate with respect to the bare nucleus in vacuo.
Figure 1.2. Nuclear Zeeman effects. a) A nucleus with I=1/2. b) A nucleus with I=1. The arrow beside each spin line indicates the orientation of the magnetic moment in a vertical magnetic field.
ComputationalStudyofNuclearMagneticResonanceShieldingConstants
10
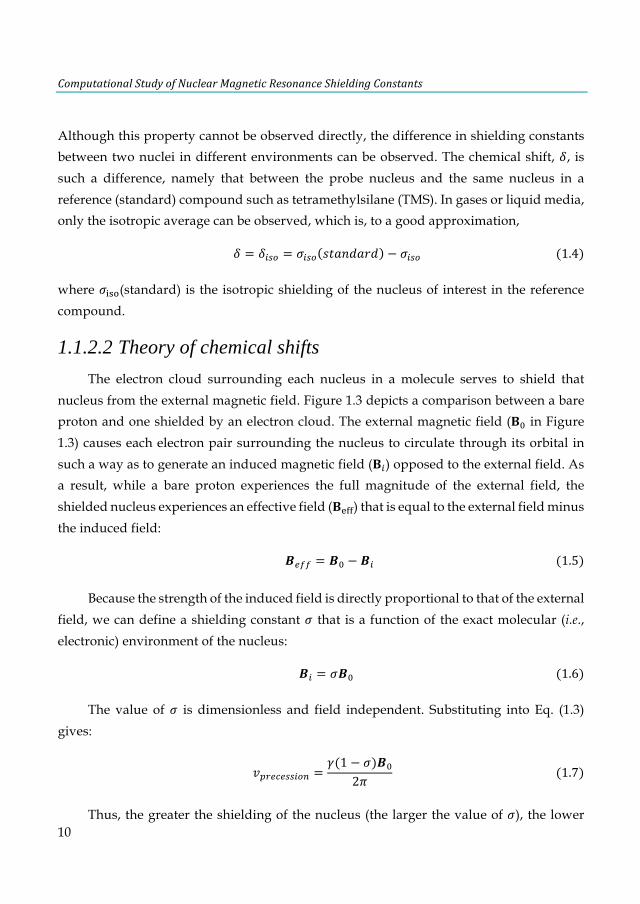
Although this property cannot be observed directly, the difference in shielding constants between two nuclei in different environments can be observed. The chemical shift, E, is such a difference, namely that between the probe nucleus and the same nucleus in a reference (standard) compound such as tetramethylsilane (TMS). In gases or liquid media, only the isotropic average can be observed, which is, to a good approximation,
E = E$=> = A$=> FGHIJHKJ − A$=>(1.4)
where ABCD(standard) is the isotropic shielding of the nucleus of interest in the reference compound.
1.1.2.2 Theory of chemical shifts The electron cloud surrounding each nucleus in a molecule serves to shield that
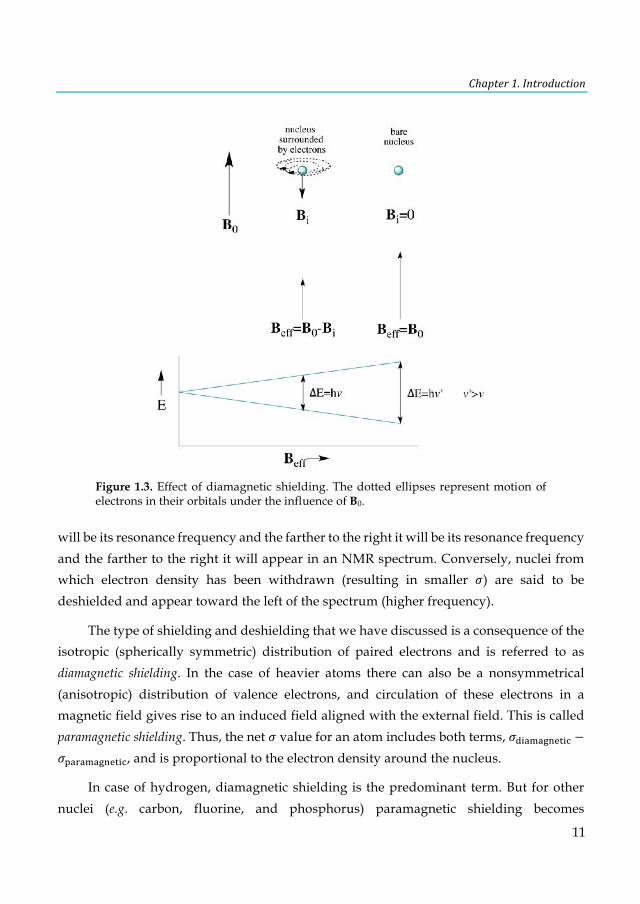
nucleus from the external magnetic field. Figure 1.3 depicts a comparison between a bare proton and one shielded by an electron cloud. The external magnetic field (&' in Figure 1.3) causes each electron pair surrounding the nucleus to circulate through its orbital in such a way as to generate an induced magnetic field (&$) opposed to the external field. As a result, while a bare proton experiences the full magnitude of the external field, the shielded nucleus experiences an effective field (&MNN) that is equal to the external field minus the induced field:
/;OO = /' − /$(1.5)
Because the strength of the induced field is directly proportional to that of the external field, we can define a shielding constant A that is a function of the exact molecular (i.e., electronic) environment of the nucleus:
/$ = A/'(1.6)
The value of A is dimensionless and field independent. Substituting into Eq. (1.3) gives:
89:;<;==$>? =((1 − A)/'
2, (1.7)
Thus, the greater the shielding of the nucleus (the larger the value of A), the lower
Chapter1.Introduction
11
will be its resonance frequency and the farther to the right it will be its resonance frequency and the farther to the right it will appear in an NMR spectrum. Conversely, nuclei from which electron density has been withdrawn (resulting in smaller A) are said to be deshielded and appear toward the left of the spectrum (higher frequency).
The type of shielding and deshielding that we have discussed is a consequence of the isotropic (spherically symmetric) distribution of paired electrons and is referred to as diamagnetic shielding. In the case of heavier atoms there can also be a nonsymmetrical (anisotropic) distribution of valence electrons, and circulation of these electrons in a magnetic field gives rise to an induced field aligned with the external field. This is called paramagnetic shielding. Thus, the net A value for an atom includes both terms, ASBTUTVWMXBY −AZT[TUTVWMXBY, and is proportional to the electron density around the nucleus.
In case of hydrogen, diamagnetic shielding is the predominant term. But for other nuclei (e.g. carbon, fluorine, and phosphorus) paramagnetic shielding becomes
Figure 1.3. Effect of diamagnetic shielding. The dotted ellipses represent motion of electrons in their orbitals under the influence of B0.
ComputationalStudyofNuclearMagneticResonanceShieldingConstants
12
increasingly important.
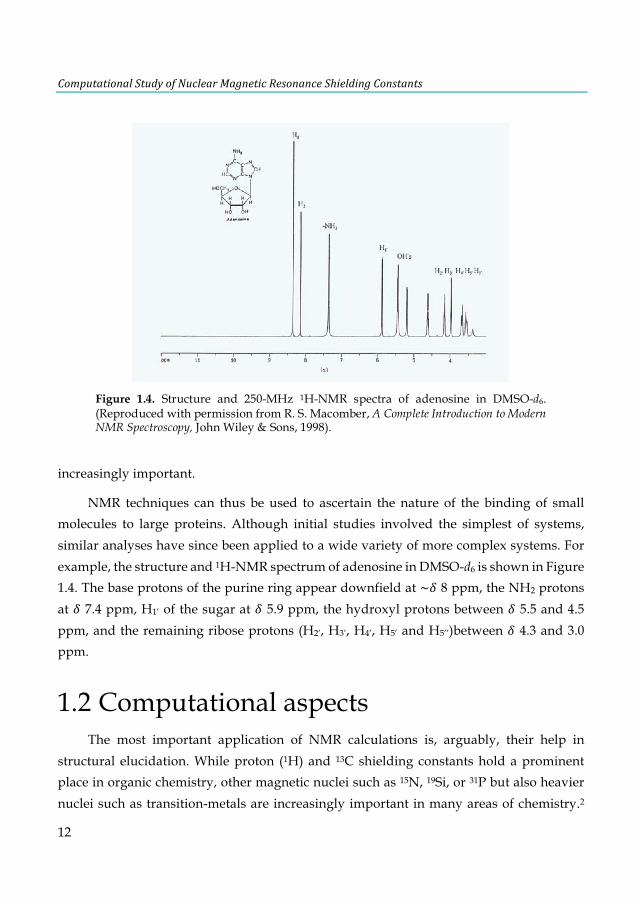
NMR techniques can thus be used to ascertain the nature of the binding of small molecules to large proteins. Although initial studies involved the simplest of systems, similar analyses have since been applied to a wide variety of more complex systems. For example, the structure and 1H-NMR spectrum of adenosine in DMSO-d6 is shown in Figure 1.4. The base protons of the purine ring appear downfield at ~E 8 ppm, the NH2 protons at E 7.4 ppm, H1’ of the sugar at E 5.9 ppm, the hydroxyl protons between E 5.5 and 4.5 ppm, and the remaining ribose protons (H2’, H3’, H4’, H5’ and H5’’)between E 4.3 and 3.0 ppm.
1.2 Computational aspects The most important application of NMR calculations is, arguably, their help in
structural elucidation. While proton (1H) and 13C shielding constants hold a prominent place in organic chemistry, other magnetic nuclei such as 15N, 19Si, or 31P but also heavier nuclei such as transition-metals are increasingly important in many areas of chemistry.2
Figure 1.4. Structure and 250-MHz 1H-NMR spectra of adenosine in DMSO-d6. (Reproduced with permission from R. S. Macomber, A Complete Introduction to Modern NMR Spectroscopy, John Wiley & Sons, 1998).
Chapter1.Introduction
13
Obviously, all these nuclei are equally amenable to computational investigations. However, some methodological questions are still left to be answered concerning the scopes and limitations of the quantum chemical methods.
Thus, in the following section we will give an overview of the level of confidence that can be expected for NMR shielding constants computed for the various relevant magnetic nuclei using different methodologies and implementations. It is important to mention that the computed magnetic properties are in general extremely sensitive to the geometry chosen. This applies in particular to chemical shifts calculations where even small changes in bond lengths or angles may lead to significant deviations in the chemical shifts. Hence, reliable chemical shifts can only be expected if these calculations are based on good geometries.
1.2.1 Drawback of theoretical models As mentioned before, advances have been made with theoretical chemistry methods
for finding accurate reproductions of experimentally observed NMR shift constants.3 These can nowadays be obtained using both high-level coupled cluster (CCSD(T))4 and density functional methods.5-10 However, the accuracy with which the shift constants can be obtained depends on several factors, and is not uniformly accurate for all nuclei. There have been numerous studies investigating the accuracy of density functionals for the calculation of NMR parameters typically through critical comparison of computed and experimental values for selected test sets of molecules. For instance, several studies in a wide range of molecules showed for 1H nuclei a high accuracy of less than 1 ppm difference between theory and experiment.5-7 In contrast, for 13C and 15N these accuracies are somewhat less (3-10 ppm), depending on the method and basis set used.11
Although there appears to be no agreement on a single best functional, hybrid functionals such as the popular B3LYP variant tend to performed somewhat better than their nonhybrid counterparts. On the other hand, Xu et al.12,13 investigated a number of density functional methods and found that the OPBE functional performs remarkably well. Likewise, Zhao and Truhlar10 found that the M06-L functional gives even smaller deviations than OPBE and is as good as the Keal-Tozer functionals (KT1 and KT2).6 These latter two functionals were specially designed to provide high-quality shielding constants
ComputationalStudyofNuclearMagneticResonanceShieldingConstants
14
for light main-group nuclei.
Moreover, special attention needs to be paid to the basis set employed. The basis set needs to be able to adequately describe the electron density close to the nuclei. Several schemes have been devised to modify existing basis sets for this purpose. These usually involve decontracting basis functions (to make the basis sets more flexible) and adding tight functions (to improve the description of the electron density near the nuclei).
1.2.2 Additional medium effects The overwhelming majority of NMR calculations is carried out for static structures,
i.e. actually vacuum conditions are modeled, when there are no collisions and interactions with other molecules. Thus, theoretically calculated NMR shift values must be compared with experimental values determined in the gas phase. This raises the question of how the data obtained in the gas phase will apply to solutions and if it is correct to compare chemical shifts calculated in gas phase with experimental NMR data obtained in solution.
Thus, for a better compatibility with experiments conducted at ambient temperature and solution, effects of thermal motion and solvation can be included in the computations. Classical thermal effects can be modeled computationally by performing molecular dynamics (MD) simulations and averaging the computed NMR parameters over a sufficient number of snapshots from the trajectories.14 Methods to evaluate quantum-mechanical zero-point corrections have also been devised.15 Such thermal effects on NMR parameters tend to be rather small for the lighter nuclei such as 1H and 13C and more noticeable for heavier nuclei such as transition metals.16
Additionally, the perturbation of NMR parameters due to the solvent effects can be modeled in computational with continuum models to simulate dielectric solvent effects.17 Many studies have used continuum models to calculate shielding constants,18-20 especially important are those of Ruud and coworkers.21 However, for polar protic solvents such as water, the specific hydrogen-bonding interactions are not captured by this approach, and specific solute-solvent interactions need to be included.
Chapter1.Introduction
15
1.2.3 Relativistic effects Electrons in heavy element compounds move so fast that relativistic effects become
important. Chemical and physical properties of atoms and molecules are predicted differently with a relativistic and non-relativistic theory. Only the former is adequate for heavy element systems. Thus, it is not surprising that the relativistic effects can have a particularly strong impact on calculated NMR parameters.22
Relativistic effects are usually separated into spin-orbit coupling (SO) interactions and scalar relativistic (SR) effects, where the SR are relativistic effects at the one-electron level and the SO are relativistic effects that affect the electron-electron interactions in many-electron systems. There are many fully and quasi-relativistic methods available for quantum chemical calculations. For instance, all-electron relativistic quantum chemical calculations can be carried out with a Hamiltonian that only includes SR terms or including both SR and SO. The latter approach is in principle more accurate.23 For example, a DFT-NMR code for molecules that includes both scalar and spin-orbit relativistic effects is based on the zero-order regular approximation (ZORA) two-component Hamiltonian.24-26 In recent years, relativistic Gauge-Including Atomic Orbitals (GIAO) NMR chemical shift calculations have been successfully applied to a variety of molecules containing transition metal atoms and have become a routine tool for understanding their chemistry.27
Despite the success of the GIAO method in general, the modelling of heavy nuclei chemical shifts with DFT has met with some difficulties. Autschbach and Le Guennic have studied platinum chemical shifts using DFT, with a focus on solvent effects. These authors found it difficult to determine accurate chemical shifts and further showed that, in many cases, calculations require consideration of explicit solvation shells in addition to an implicit solvation model to describe the bulk solvation effects. Moreover, Bühl and co-workers have applied MD simulations extensively to successfully determine the chemical shifts for metal complexes. Calculations of the metal chemical shifts for a number of Fe,28,29 Mn,30 V,31 and Co32 complexes showed sizable solvent effects.
In particular, the calculation of metal NMR parameters in solution requires elaborate computational models.23,33-36 However, this challenge also provides a great opportunity to obtain important new information about how solvation influences the structure of a metal complex and how such structural effects combined with the presence of solvent, in turn,

ComputationalStudyofNuclearMagneticResonanceShieldingConstants
16
influence the NMR parameters of the metal center.

Chapter 2 Methodology
ComputationalStudyofNuclearMagneticResonanceShieldingConstants
18
SUMMARY
In this chapter, we introduce the general strategies to compute magnetic properties via density functional theory (DFT). The first section briefly reviews the theoretical background concerning the DFT method applied in this research. In addition to presenting the general methodological aspects, the discussion will be extended in section 2.1.3 to relativistic corrections which represent a considerable challenge for any method and where DFT seems to be particularly successful and sometimes the only choice.
In section 2.2, is an overview of the technical issues associated with our aim objective in this thesis, that is the calculation of NMR chemical shifts. Here, basic aspects of the theoretical background to compute NMR are explained in detail.
Next, we will discuss considerations concerning the simulation techniques. An overview of the continuum solvent models and the molecular dynamic simulations is given in section 2.3. In this case, we provide a more qualitative introduction which aims to understand how the methods work and how well they perform in practical applications.
Chapter2.Methodology
19
2.1 Density functional theory The foundation for modern density functional theory, DFT, is based on the
Hohenberg and Kohn37 theorems which demonstrated that the energy of the system, as well as all other observables are determined completely by the electron density (]) of the system. No knowledge of the wave function is necessary, and thereby there is no need to solve the Schrödinger equation38
^(_`, . . . , _b)c(_`, . . . , _b) = #c(_`, . . . , _b)(2.1)
where c(d̀ , . . . , de) is the electronic wave function and ^(d̀ , . . . , de) is the electronic Hamiltonian describing the motion of N electrons in the field of M nuclei,
^ = −12
b
$f`
ghi −jkl$k
+1K$n
o
np$
b
$f`
o
kf`
b
$f`
(2.2)
where ∇$i is the Laplacian operator, l$k is the distance between Hth nucleus and r-th electron, K$n is the distance between r-th and s-th electron, jk is the atomic number of nucleus H. The first term in the Eq. (2.2) is the operator of the kinetic energy of the electrons, the second term represents the coulomb attraction between electrons and nuclei and the last term stands for the electron-electron repulsion.
An exact solution for the wave function requires, in principle, a computational effort that scales exponentially with the number of electrons in the system. In contrast, an alternative to wavefunction based methods, DFT has become widely used over the past 30 years.39 The equations of a perfect density functional should be solvable with an effort linear with the number of electrons. In practice, the development of the functionals is nowhere near this state of perfection. In certain cases the accuracy of DFT calculations is equal to those more computationally demanding quantum chemical calculations.40
The motivation for DFT is that the ground state properties of a system can be described by considering the ground state electron density. The density can be found from the electronic wavefunction c(d̀ , di, . . . , d?) by
] _` = t c∗ _`, _i, … , _? c _`, _i, . . . , _? J_i. . J_?(2.3)
ComputationalStudyofNuclearMagneticResonanceShieldingConstants
20
This has an obvious advantage over the wavefunction approach; for an N electron system, the wavefunction is a complex function of 3N variables (or 4N, if spin is included), while the charge density is a function of 3 (x, y, z) or 4 variables, respectively. The usefulness of DFT arises as the ground state properties of a system are determined by the ground state density, which is a unique function of the potential for a given number of electrons.
The first density functional actually appeared even before the Hartree-Fock method,41,42 the basis for modern wave function based models. The Thomas-Fermi (TF) model was published already 1927 in two independent works.43,44 Here, the energy was given by the kinetic energy of a uniform electron gas and the classical electrostatic interaction between the electrons and nuclei for an electron gas of a given energy. However, it soon became evident that the TF model had limited applicability due to the crude approximations that it contains, especially for the kinetic energy. During the years to come, improvements on the model were attempted, for example, by adding the exchange energy of the electrons from the work of Dirac.45 It was the work of Kohn, Hohenberg, and Sham37,46 that provided a route to useful calculations, which will be discussed in the following sections. Whereas the TF approach involves the electron density only, the Kohn-Sham (KS) approach reintroduced one-electron orbitals. These can be found from solving one-electron equations involving an orbital-dependent kinetic energy functional and a local effective potential.
2.1.1 The Hohenberg-Kohn Theorems Hohenberg and Kohn formulated DFT as an exact theory of many-body systems. DFT
is based in the two theorems:
Theorem 1. Every observable of a stationary quantum mechanical system (including energy), can be calculated, in principle exactly, from the ground-state density alone, i.e., every observable can be written as a functional of the ground-state density ]0.
Thus, the ground state energy of a system #0, is a unique functional of the ground state density. #0 = # ]0(d)
Chapter2.Methodology
21
Theorem 2: The functional for the ground state energy is minimized by the ground state electron density. The energy of the system is minimum when the exact density of the system ]0 is considered.
# ] ≥ # ]' (2.4)
Applying this, #0 can be found by minimizing #[]] with a variational method:
# ] = {|} + ~;�Ä _ ] _ J_(2.5)
where ~ÅÇG stands for the external potential which represents the electron-nuclei attraction:
~;�Ä =jk
Ék − _
o
kf`
(2.6)
jH is the charge of an H-th nucleus (atomic number), ÑH − d is the distance between a given electron and the nucleus H.
{^Ö is a universal function of electron density, which depends on the kinetic energy Ü[]], the classical Coulomb energyá ] , and on the non-classical electron-electron interaction energy #tà ] :
{|} ] = Ü ] + á ] + #bâ ] (2.7)
2.1.2 The Kohn-Sham formulation The Hohenberg-Kohn theorems show that is possible to use the ground state density
to calculate properties of the system. The Kohn-Sham equations provide a route of finding the ground state density. In the Kohn-Sham (KS) one-electron model,46 a system of independent non-interacting electrons in a common one-body potential, ~}ä, is shown to mimic the true many-electron system. Therefore, one can write the ground state wavefunction explicitly in terms of simple one-electron orbitals. The only complication is that the full wavefunction, cä, must still satisfy exchange anti-symmetry. This is achieved by placing one-electron wavefunction c$ in a Slater determinant,47 as follows:
ComputationalStudyofNuclearMagneticResonanceShieldingConstants
22
cä =1t!JÅG c$ å` cn åi ⋯cé(åb) (2.8)
In the KS formalism, they divided the total energy functional #[]] in four parts:
# ] = Ü= ] + ] _ ~;�Ä _ J_ + á ] + #êâ ] (2.9)
where Ü=[]] is the kinetic energy of non-interacting electrons. The interaction of the electrons with nuclei is represented by the second term of Eq. (2.9), where ~;�Ä is the external potential (see Eq. 2.6). á ] is the classical Coulomb energy and the #íà ] is the exchange-correlation energy which includes the non-classical electron-electron interaction energy and correction towards the kinetic energy corresponding to the fully interacting system Ü[]].
Representing the electron density by a set of occupied one-electron orbitals c$ gives:
] _ = c$∗(_)c$(_)><<.
$f`
(2.10)
Ü= ] = −12 c$∗ g$i c$
b
$
(2.11)
If the orbitals are required to be orthonormal, then a functional of the orbitals can be defined as:
ì c$ = # ] − î$n c$∗ _ cn _ J_n$
(2.12)
where î$n are Lagrange multipliers to ensure the orbitals are orthonormal. Minimization of Ω[c$] with respect to c$∗(d) gives the Kohn-Sham equations:
−12g$
i + ~;OO _ c$ _ = î$c$ _ (2.13)
where ~;OO(d) denotes the Kohn-Sham potential defined as:
Chapter2.Methodology
23
~;OO K = ~;�Ä _ + ~| + ~�< _ (2.14)
The second term in Eq. (2.14) is the Hartree potential:
~| =](_ñ)_ − _′ J_′(2.15)
And ~�<(d) is the functional derivative of the exchange-correlation energy #�<:
8�< _ =E#�<E](_)(2.16)
The exchange-correlation energy is clearly the crucial quantity of DFT. It is, after a Kohn-Sham calculation, the only quantity for which a reliable estimate is needed to obtain a good total energy. Kohn and Sham paved the way for a renaissance for DFT. The problem of the kinetic energy was largely solved. The new challenge was to find a solution for #�<. More than fifty years on, the problem remains unsolved.
2.1.3 Relativistic DFT Heavy element compounds are not only systems with many electrons (and therefore
expensive), they also require proper treatment of relativistic effects. The question whether the Hohenberg-Kohn and Kohn-Sham theorems could be used in a relativistic theory was answered by Rajagopal and Callaway, who provided the necessary generalization of these theorems.48 Relativistic DFT is actually Current Density Functional Theory (CDFT) since the close relation between electric and magnetic fields makes it necessary to consider also the dependence on the current, instead of just the density. We refer to some of the many excellent references focusing on the relativistic quantum chemistry for details.49,50 Below we will briefly discuss the elementary parts of the two- and four-component relativistic corrections used in this thesis.
2.1.3.1 The Dirac equation A conceptually direct way of performing a relativistic molecular computation is to
use directly the time-independent Dirac equation51:

ComputationalStudyofNuclearMagneticResonanceShieldingConstants
24
^òcò = #cò(2.17)
where ^ò is the Dirac Hamiltonian:
^ò = ôö ∙ ú + %ôiù + ûü†(2.18)
In equation 2.17, the eigenfunction, cò, is a four-component vector which contains two “large” components, which pass to the corresponding non-relativistic wave functions for ° and ¢ spin in the limit ô → ∞, and two “small” components which vanish in the nonrelativistic limit. The Hamiltonian given in (2.18) is a matrix operator in which • is a 3 x 3 unit vector whose elements correspond to the components of the momentum, and û is the nucleus-electron interaction term, which for point nuclei takes the form:
û = −j¶K¶$¶$
(2.19)
where j¶ is the charge associated with the Ath nucleus and K¶$ is the distance between the Ath nucleus and the ith electron. In the Dirac Hamiltonian (2.18), the components of ° may be written in terms of the Pauli spin matrices, σ, and ®† is the 4 x 4 unit matrix.
The Dirac equation is not often used in its original four-component form because such molecular computations are unfortunately quite expensive as compared to nonrelativistic ones, and the explicit inclusion of electron correlation is a formidable task. Implementation of Dirac theory requires a significant rewrite of existing code and this feature has prevented the method from entering ordinarily in quantum chemistry.
Many attempts have been made to transform the four-component equation (2.17) into two-component form, in order to keep interpretations simpler and to reduce the computational effort. In the next section, we will give an account of one of these methods.
2.1.3.2 The Breit-Pauli approximation Shifting the diagonal of the Dirac Hamiltonian by −2%ôi to align the relativistic and
nonrelativistic energy scales and writing the Dirac equation in two component form (with both lines representing two equations) gives the eigenvalue equation:
Chapter2.Methodology
25
û ôA ∙ ,ôA ∙ , −2%ôi + û
c© _cä _
= # c© _cä _
(2.20)
We simplify by assuming that we have no magnetic fields so that ™ = 0 and , = •, and derive a relation between c© and cä by writing the lower equation as:
cä _ = Ö(#, _)A ∙ ú2%ô c
© _ (2.21)
with Ö a local multiplicative operator that depends on the energy of the electron:
Ö(#, _) = 1 +# − û2%ôi
´`
(2.22)
By inserting Eq. (2.21) in the upper line of Eq. 2.20 we obtained a two-component equation for the large component wave function:
12% A ∙ ú Ö #, _ A ∙ ú + û c© _ = #c© _ (2.23)
This equation is known as the Unnormalized Elimination of the Small Component (UESC) equation. The UESC equation is exact, but not very practical since it is not an eigenvalue equation. It mainly serves as a starting point for approximations to the Dirac equation. Close to the nuclei, (# − û)/2%ôi cannot be regarded as a small expansion parameter. The other assumption is that û is small compared to 2%ôi. In molecules electrons will, however, also come close to the nuclei where û can be (much) larger than 2%ôi. In these small regions around the nuclei the chosen expansion of Ö is not valid and the resulting operators are invalid.
2.1.3.3 The Zeroth Order Regular Approximation (ZORA) With the cause of the problem identified it is clear what needs to be done: one should
find a series expansion that is valid for the whole region of space. The regular expansion became popular after its introduction in DFT by van Lenthe, Snijders and Baerends in 1993.24 The idea is to rewrite the inverse operator in Ö as:
ComputationalStudyofNuclearMagneticResonanceShieldingConstants
26
Ö = 1 +# − û2%ôi
´`
= 1 −û
2%ôi´`
1 +#
2%ôi − û
´`
(2.24)
where ¨i≠<Æ´Ø
is used as the expansion parameter. This parameter is small everywhere because # is constant and always smaller than 2%ôi − û (remember that û is negative so that the denominator is even larger than 2%ôi). In practice, it is common to include only the first term of the expansion which gives the Zeroth Order Regular Approximation (ZORA) Hamiltonian:
12% A ∙ ú 1 −
û2%ôi
´`
A ∙ ú + û c∞±≤¶ _ = #c∞±≤¶ _ (2.25)
And the scalar relativistic version of the ZORA equation can be written as:
12% ú ∙ 1 −
û2ôi
´`
ú + û cä<∞±≤¶ _ = #ä<∞±≤¶cä<∞±≤¶ _ (2.26)
2.1.3.4 Four-component methods An alternative approach is to retain the simplicity of the relativistic formalism and
solve the Dirac equation by expanding the large and the small components in a basis set of the form:
≥†< = ≥©0
∪ 0≥ä (2.27)
c†< = ൩?∂
µ
≥µ© + à∑ä?∏
∑
≥∑ä(2.28)
in which ≥π and ≥∫ are two-component functions. With this choice of basis the Dirac equation becomes a matrix equation:
ª©© ôº©ä
ôºä© ªää − 2%ôiΩääæ©æä
= Ω©©æ©Ωääæä
#(2.29)
that can be diagonalized to give the energies and expansion coefficients æπ and æ∫. Matrix
Chapter2.Methodology
27
elements of the Dirac and the Coulomb-Breit operator are easily computed by standard methods. The main disadvantage of the 4c-component scheme is that the size of matrices is at least twice as large as in nonrelativistic theory.
2.2 Calculation of NMR parameters The molecular properties responsible for the generation of NMR spectra were first
identified and analyzed in terms of perturbation theory by Ramsey.52 Since then, even though the improvements in the methodology techniques and computer technology have been very impressive over the last three decades, the theoretical prediction of NMR spectral properties significantly lagged experimental work. Nevertheless, great progress has been made over the last two decades, particularly with respect to DFT, and the calculation of chemical shifts is becoming much more routine than previously.
In a genuine NMR experiment, the electromagnetic frequency is fixed (radio wave lengths) and the sample is scanned by a variable magnetic field. At some particular field values the energy difference matches the electromagnetic frequency and the transition (Nuclear Magnetic Resonance) is observed.
The magnetic field that a particular nucleus feels differs from the external magnetic field applied, because the electronic structure in which the nucleus is immersed in, makes its own contribution. Also, the nuclear spins interact by creating their own magnetic fields. The effects which we are now dealing with are so small, that they are not important for most applications. This time, however, the situation changes: we are going to study very subtle interactions using the NMR technique which aims precisely at the energy levels that result from spin-spin and spin-magnetic field interactions. Even if these effects are very small, they can be observed.
2.2.1 Theoretical background In this section, we will discuss only some aspects of DFT methods that are related to
the calculation of NMR properties (see reviews53,54). In the presence of a magnetic field, the usual Hohenberg-Kohn theorems as outline in section 2.1.1 do not hold anymore and the corresponding exchange-correlation energy is a functional of both the electron density
ComputationalStudyofNuclearMagneticResonanceShieldingConstants
28
] d , as in ordinary DFT, and the current density ø d . Instead, the expressions determining the energy and the magnetic properties are obtained by introducing an exchange-correlation density functional that depends on the density ] and on the paramagnetic current density:
¿9 _ = −r ¡é∗ _ g¡é _ − ¡é _ g¡é∗ _é
(2.30)
Together with some assumptions for the dependence of the energy functional on ø9 d , these densities form the basis for the current-density functional theory (CDFT).55,56 Such approximations to the exchange-correlation energy functional are still in the early development phase and have not reached the maturity to be of any practical relevance. Therefore, this additional current dependency can be neglected:
#êâ ] _ , s(_) ≈ #êâ ] _ (2.31)
Fortunately, it seems that this is not a crude approximation and one does not need to worry too much about using functionals which are formally inadequate because they neglect the required dependence on s d .57
On the other hand, the magnetic external field and the intrinsic nuclear magnetic moments can be treated as perturbations. For this reason, the nuclear magnetic shielding tensor, √, is calculated as an energy derivative. This second-order molecular property can be expressed as the second derivative of the energy of the molecule, #, with respect to an external magnetic field, /, and the magnetic moment of a nucleus, ƒ, as in Eq. (2.32).
√ =≈i#≈/≈ƒ
/fƒf'(2.32)
The magnetic tensor √ is a non-symmetric 3 x 3 tensor, whose trace, √BCD = 1/3(√∆∆ +√«« + √»»), is the isotropic magnetic shielding of the nucleus. NMR-DFT calculations allow for the decomposition of the total magnetic shielding, and thus the chemical shift, into paramagnetic and diamagnetic terms, √BCD = √SBT + √ZT[T. The diamagnetic term of the shielding constant depends only on the unperturbed electron density in the ground state. In contrast, the paramagnetic term depends on both occupied-occupied and occupied-
Chapter2.Methodology
29
virtual couplings between molecular orbitals, induced by the external magnetic field. The paramagnetic term can be correlated to the ability of the external magnetic field to create a circulation of electrons through the molecules. The induced current density moves in a plane perpendicular to the external magnetic field, generating an induced magnetic field that adds to the external one, resulting in deshielding, or downfield shift.
The energy in Equation (2.32) can be computed using approximated methods, among those HF and DFT, or explicitly correlated wavefunction-based methods. In particular for DFT, the usual way to tackle Eq. (2.32) is by employing stationary perturbation theory. The integrals in question are complex because the magnetic field perturbs the kinetic energy term (it is the motion of the electrons that generates electronic magnetic moments). The nature of the perturbed kinetic energy operator is such that an origin must be specified defining a coordinate system for the calculation. This origin is called the ‘gauge origin’. The magnetic field is independent of the choice of the gauge origin. So too are the computed magnetic properties if the wave function used is exact. Regrettably, we are not often afforded the opportunity to work with exact wave functions. Thus, to reduce artifacts associated with the gauge origin, an approach must be specified. In this work, we have used the method that uses gauge-including atomic orbitals (GIAOs) as a basis set (London 1937). By a clever incorporation of the gauge origin into the basis functions themselves, all matrix elements involving the basis functions can be arranged to be independent of it. More details of the fundamental theory as well as on many technical aspects regarding the calculation of NMR parameters in the context of various quantum chemical techniques can be found in the literature.58
2.3 Simulation techniques Molecular simulation refers to methods aimed at generating a representative
sampling of a system at a finite temperature.59-62 Most reactions are both qualitatively and quantitatively different under gas and solution phase conditions, especially those involving ions or polar species. Simulations are therefore intimately related with describing solute-solvent interactions, but such effects can also be modelled with less rigorous methods. Likewise, molecular properties as NMR chemical shifts are also sensitive to the chemical environment. Thus, in this section we summarize two strategies
ComputationalStudyofNuclearMagneticResonanceShieldingConstants
30
employed in this thesis to include liquid state conditions.
2.3.1 Continuum Solvent Models The methods based on the continuum model allow to simulate both bulk and
short-range (specific) solute-solvent interactions. An extensive review of continuum models up to the most recent developments and applications can be found in several references.63-65 In the basic idea of all continuum model, the molecule of interest (solute) is assumed to reside in a “cavity” and described fully at a quantum level. The solvent, on the other hand, rather than represent its charge distribution explicitly, is incorporated as a continuum medium (a continuous electric field around the cavity that represents a statistical average over all solvent degrees of freedom at thermal equilibrium (see Figure 2.1). This field is usually called the ‘reaction field’ in the regions of space occupied by the solute, since it derives from reaction of the solvent to the presence of the solute.
The electric field at a given point in space is the gradient of the electrostatic potential ¡ at that point, and the work required to create the charge distribution may be determined from the interaction of the solute charge density ] with the electrostatic potential according to:
… = −12 ] _ ¡ _ J_(2.33)
Figure 2.1. Model representation of a solute molecule in a cavity and the solvent as a continuum, which reacts on the molecular electric field by a reaction field.
Chapter2.Methodology
31
The charge density ] of the solute may be expressed either as some continuous function of d or as discrete point charges, depending on the theoretical model used to represent the solute. The polarization energy, … , discussed above, is simply the difference in the work of charging the system in the gas phase and in solution. Thus, in order to compute the polarization free energy, all that is needed is the electrostatic potential in solution and in the gas phase (the latter may be regarded as a dielectric medium characterized by a dielectric constant of 1). The continuum methods are the most widely used schemes as they are readily implemented and give results relatively quickly and automatically, however, they are not generally very accurate.
2.3.2 Molecular dynamic simulations Molecular dynamic (MD) simulation is a well-established technique that give us a
clear picture of the microscopic structure of liquids providing typical fluid configurations in an atomistic and dynamic detail. Combined with quantum mechanical (QM) calculations, it can help to determine properly NMR parameters in liquid state conditions.14 In the following, a short description of this technique is given and an extensive review of molecular dynamics up to the most recent developments and applications can be found in several additional reading materials or text books.66-68
If we knew the potential energy û as a function of the position (É) of all the atoms (whatever force field has been used for the approximations), then all the forces the atoms undergo could be easily computed. If É = (í`, íi, … , íÀb)à denotes the coordinates of all the t atoms (í`, íi, íÀ are the x, y, z coordinates of atom 1, í†, íÕ, íŒ are the x, y, z of atom 2, etc.), then − œØ
œê– is the Ç component of the force atom 1 undergoes, − œØ
œêÆ is the —
component of the same force, etc. When a force field is used, all this can be easily computed even analytically. In molecular dynamics, we are interested in time G, the velocity of the atoms (in this way temperature will come into play), and the acceleration of the atoms.
The Newton equation tell us that, knowing the force acting on a body (e. g., an atom), we may compute the acceleration the body undergoes. We have to know the mass, but there is no problem with that. Hence the r-th component of the acceleration vector is equal to:
ComputationalStudyofNuclearMagneticResonanceShieldingConstants
32
“$ = −≈û≈í$
∙1”$(2.34)
for r = 1, 2, … , 3t (”$ = ”` for r = 1, 2, 3,”$ = ”i for r = 4, 5, 6, ÅGô.).
Now, let us assume that at G = 0 all the atoms have the initial coordinates É' and the initial velocities ‘'. Now we assume that the forces calculated act unchanged during a short period ∆G (often 1 femtosecond or 10´`Õ s). We know what should happen to a body (atom) if under influence of a constant force during time ∆G. Each atom undergoes a uniformly variable motion and the new position may be found in the vector:
É = É' + ‘'∆G + “ ∆ÄÆ
i(2.35)
and its new velocity in the vector:
‘ = ‘' + “∆G(2.36)
where the acceleration “ is a vector composed of the acceleration vectors of all the t atoms:
All on the right hand of Equations (2.35) and (2.36) is known. Therefore, the new positions and the new velocities are easy to calculate. Now, we may use the new positions and velocities as a start ones and repeat the whole procedure over and over. This makes it possible to go along the time axis in a step-like way in practice reaching even micro times (10´’ sec), which means billions of such steps. The procedure described above simply represents the numerical integration of 3t differential equations. If t = 2000 then the task is impressive. It is so straightforward, because we are dealing with numerical (not analytical) solutions.
“ = (“`, “i,… , “b)Ã
“` = ÷−≈û≈í`
, −≈û≈íi
, −≈û≈íÀ
◊ ∙1”`
(2.37)
“i = ÷−≈û≈í†
,−≈û≈íÕ
, −≈û≈íŒ
◊ ∙1”i
, ÅGô
Chapter2.Methodology
33
The computer simulation makes the system evolve from the initial state to the final one. The position É in 3t-dimensional space becomes a function of time and therefore É(G) represents the trajectory of the system in the configurational space. A similar statement affects to ‘(G). Knowing the trajectory means that we know the smallest details of the motion of all the atoms. Within the approximation used, we may ask about some mean values, like the mean value of the total energy, potential energy, kinetic energy, the distance between atoms, etc. All these quantities may be computed at any step of the procedure, then added up and divided by the number of steps giving the mean values we required. In this way we may obtained the theoretical prediction of the mean value of the computed chemical shielding and compare it to, say, the NMR result.

ComputationalStudyofNuclearMagneticResonanceShieldingConstants
34
Chapter 3 Objectives
The overall aim of this thesis is to computationally determine the NMR shift constants in a number of chemical systems of interest, using both static and dynamic approaches, which will complement experimental data. Given the sensitivity of NMR, this will confirm the presence of transient species and/or explain ambiguous signals in the NMR spectra. As NMR measurements are extremely sensitive to both indirect and direct effects, our objective is to gain a better understanding and learn about how methodological issues, such as the level of theory, basis set, relativistic effects, chemical environment, among others, may affect the quality of the calculated data.
Likewise, the objectives can be divided according to the studies presented in this thesis:
Chapter 4 “The influence of substituent and the environment on the NMR shielding constants of
supramolecular complexes based on A-T and A-U base pairs”
• Examine the effect of the substituents on the hydrogen-bond lengths, strength and bonding mechanism, and the NMR shielding constants of the C2-adenine and C2-thymine/uracil atoms in the base pairs.
Chapter 5 “Four-component relativistic 31P-NMR calculations in trans-platinum(II) complexes:
Importance of the solvent and dynamics in spectral simulations”
• Determine the 31P-NMR chemical shifts of the trans-[PtCl2(dma)(PPh3)]
ComputationalStudyofNuclearMagneticResonanceShieldingConstants
36
complex and species derived from its hydrolysis, in an attempt to understand its mechanism of action as anticancer platinum drug.
• Demonstrate, comparing with experimental spectra, the importance of relativistic effects, dynamics, and explicit solvation for the accurate modelling of the 31P chemical shifts.
Chapter 6 “Computational NMR Spectroscopy for Host-Guest Hemicarcerands”
• Study the structure and 1H-NMR chemical shifts of hemicarcerand 1 and its corresponding hemicarceplexes with o-benzyne and a variety of 27 guests from which experimental data are available for comparison.
• Describe the rotational mobility and the conformational preference for the guest molecules.
• Predict the 1H and 13C-NMR chemical shift constants of o-benzyne within hemicarcerand 2.
Chapter 7 “Exploring the potential energy surface of E2P4 clusters (E= Group 13 elements): The quest for inverse carbon-free sandwiches”
• Explore if it is possible to stabilize a carbon-free inverse sandwich E2P4 structures by selecting the appropriate Group 13 atoms.
• Analyze the bonding to provide an explanation about the structural preferences.
• Predict the 31P-NMR shielding constants in order to support future experimental analysis.
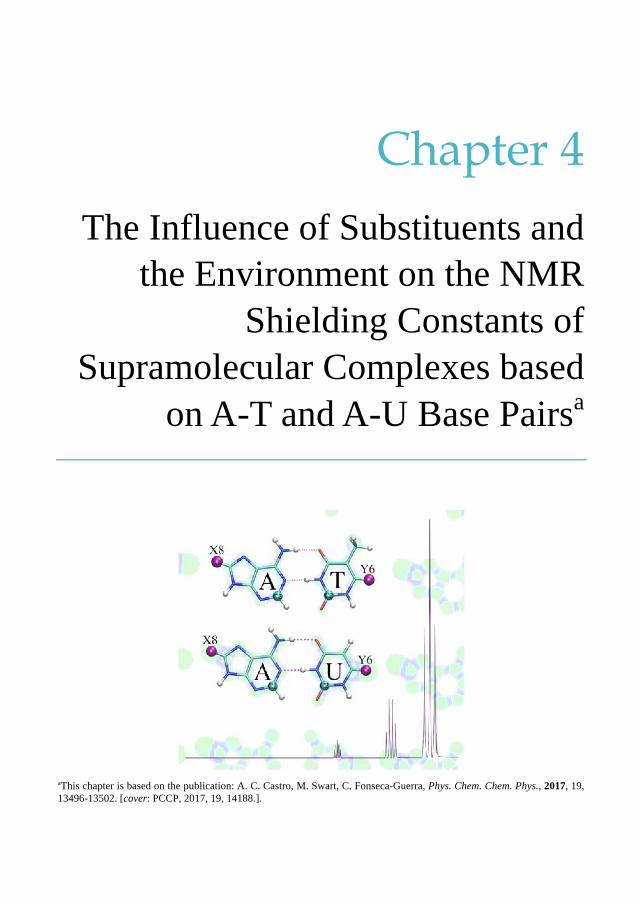
Chapter 4 The Influence of Substituents and
the Environment on the NMR Shielding Constants of
Supramolecular Complexes based on A-T and A-U Base Pairsa
aThis chapter is based on the publication: A. C. Castro, M. Swart, C. Fonseca-Guerra, Phys. Chem. Chem. Phys., 2017, 19, 13496-13502. [cover: PCCP, 2017, 19, 14188.].
ComputationalStudyofNuclearMagneticResonanceShieldingConstants
38
SUMMARY
In this chapter, we have theoretically analyzed supramolecular complexes based on the Watson-Crick A-T and A-U base pairs using dispersion corrected density functional theory (DFT). Hydrogen atoms H8 and/or H6 in the natural adenine and thymine/uracil bases were replaced, respectively, by substituents X8, Y6 = NH–, NH2, NH3+ (N series), O–, OH, OH2+ (O series), F, Cl or Br (halogen series). We examined the effect of the substituents on the hydrogen bond lengths, strength and bonding mechanism, and the NMR shielding constants of the C2-adenine and C2-thymine/uracil atoms in the base pairs. The general belief in the literature that there is a direct connection between changes in the hydrogen-bond strength and the C2-adenine shielding constant is conclusively rejected by our computations.

Chapter 4. NMR Shielding Constants of Supramolecular Complexes based on A-T and A-U Base Pairs
39
4.1 State of the art Hydrogen bonds are important in many fields of biological chemistry. They play, for
instance, a key role in the working of the genetic code.69-73 In particular, the stability of the Watson-Crick DNA (A-T) and RNA (A-U) base pairs has been studied and it has been found that the hydrogen bonds in A-U are stronger than those of A-T.74 In 2004, Acharya et al. found that the pKa values of the donors and acceptors of A-U pairs are more similar than those of A-T pairs, which was interpreted as evidence for stronger RNA hydrogen bonds than those of DNA.75 Furthermore, Vakonakis and LiWang reported the same assumption based on measurements of C2 chemical shifts and deuterium isotope effects in adenine.76,77
Calculations of NMR parameters have significantly contributed to understanding the molecular interactions of DNA and RNA bases.78,79 So far, 15N-NMR shielding tensors, as a function of the hydrogen-bond length, have been systematically investigated for the G-C base pair, concluding that the shielding values strongly depend on the distance between the bases.80 Furthermore, the shift tensors of carbon atoms in purine-based compounds were found to be sensitive to local structure changes like substitution on the purine ring, tautomerism, and intermolecular interactions.81 In our previous work,8 we analyzed with density functional theory (DFT) the geometries, counterpoise-corrected bond energies, and the NMR shielding parameters of the Watson-Crick A-T and A-U base pairs concluding that the introduction of a methyl substituent at the pyrimidine ring affects both NMR shielding constants (e.g., for adenine C2 atom) and hydrogen-bond strengths (e.g., A-T versus A-U). However, these are two independent and uncorrelated effects and the results of NMR experiments do not directly reflect the strength of the hydrogen bonds.8 This was confirmed by a subsequent study using DFT and hybrid DFT/MM calculations of deuterium isotope effects (DIEs) on nucleosides and nucleotides.82 More recently, Pérez et al. suggested by employing a variety of quantum-mechanical techniques that the differences between the stability of RNA and DNA are due to a variety of effects (e.g., intra- and intermolecular stacking and other subtle contributions related to their global conformation) rather than resulting from a significant difference in the hydrogen bonding of DNA and RNA base pairs.83
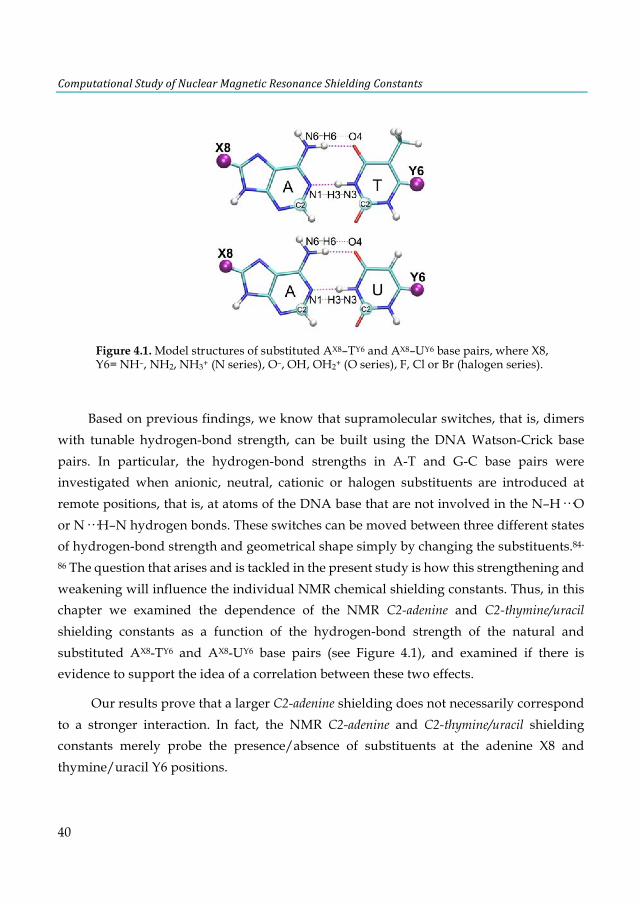
ComputationalStudyofNuclearMagneticResonanceShieldingConstants
40
Based on previous findings, we know that supramolecular switches, that is, dimers with tunable hydrogen-bond strength, can be built using the DNA Watson-Crick base pairs. In particular, the hydrogen-bond strengths in A-T and G-C base pairs were investigated when anionic, neutral, cationic or halogen substituents are introduced at remote positions, that is, at atoms of the DNA base that are not involved in the N–H···O or N···H–N hydrogen bonds. These switches can be moved between three different states of hydrogen-bond strength and geometrical shape simply by changing the substituents.84-
86 The question that arises and is tackled in the present study is how this strengthening and weakening will influence the individual NMR chemical shielding constants. Thus, in this chapter we examined the dependence of the NMR C2-adenine and C2-thymine/uracil shielding constants as a function of the hydrogen-bond strength of the natural and substituted AX8-TY6 and AX8-UY6 base pairs (see Figure 4.1), and examined if there is evidence to support the idea of a correlation between these two effects.
Our results prove that a larger C2-adenine shielding does not necessarily correspond to a stronger interaction. In fact, the NMR C2-adenine and C2-thymine/uracil shielding constants merely probe the presence/absence of substituents at the adenine X8 and thymine/uracil Y6 positions.
Figure 4.1. Model structures of substituted AX8–TY6 and AX8–UY6 base pairs, where X8, Y6= NH–, NH2, NH3+ (N series), O–, OH, OH2+ (O series), F, Cl or Br (halogen series).
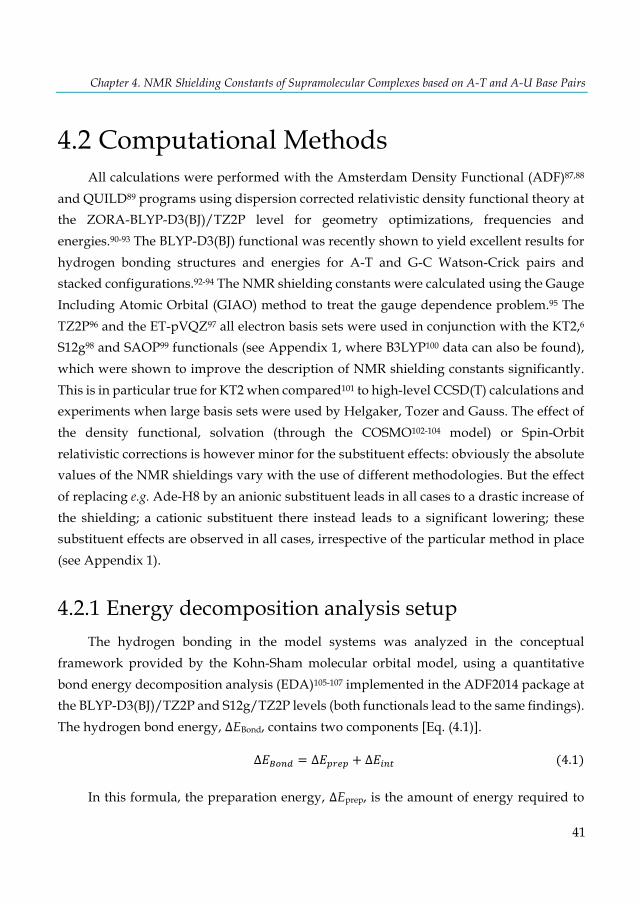
Chapter 4. NMR Shielding Constants of Supramolecular Complexes based on A-T and A-U Base Pairs
41
4.2 Computational Methods All calculations were performed with the Amsterdam Density Functional (ADF)87,88
and QUILD89 programs using dispersion corrected relativistic density functional theory at the ZORA-BLYP-D3(BJ)/TZ2P level for geometry optimizations, frequencies and energies.90-93 The BLYP-D3(BJ) functional was recently shown to yield excellent results for hydrogen bonding structures and energies for A-T and G-C Watson-Crick pairs and stacked configurations.92-94 The NMR shielding constants were calculated using the Gauge Including Atomic Orbital (GIAO) method to treat the gauge dependence problem.95 The TZ2P96 and the ET-pVQZ97 all electron basis sets were used in conjunction with the KT2,6 S12g98 and SAOP99 functionals (see Appendix 1, where B3LYP100 data can also be found), which were shown to improve the description of NMR shielding constants significantly. This is in particular true for KT2 when compared101 to high-level CCSD(T) calculations and experiments when large basis sets were used by Helgaker, Tozer and Gauss. The effect of the density functional, solvation (through the COSMO102-104 model) or Spin-Orbit relativistic corrections is however minor for the substituent effects: obviously the absolute values of the NMR shieldings vary with the use of different methodologies. But the effect of replacing e.g. Ade-H8 by an anionic substituent leads in all cases to a drastic increase of the shielding; a cationic substituent there instead leads to a significant lowering; these substituent effects are observed in all cases, irrespective of the particular method in place (see Appendix 1).
4.2.1 Energy decomposition analysis setup The hydrogen bonding in the model systems was analyzed in the conceptual
framework provided by the Kohn-Sham molecular orbital model, using a quantitative bond energy decomposition analysis (EDA)105-107 implemented in the ADF2014 package at the BLYP-D3(BJ)/TZ2P and S12g/TZ2P levels (both functionals lead to the same findings). The hydrogen bond energy, ∆EBond, contains two components [Eq. (4.1)].
∆#ÿ>?Ÿ = ∆#9:;9 + ∆#$?Ä(4.1)
In this formula, the preparation energy, ∆Eprep, is the amount of energy required to
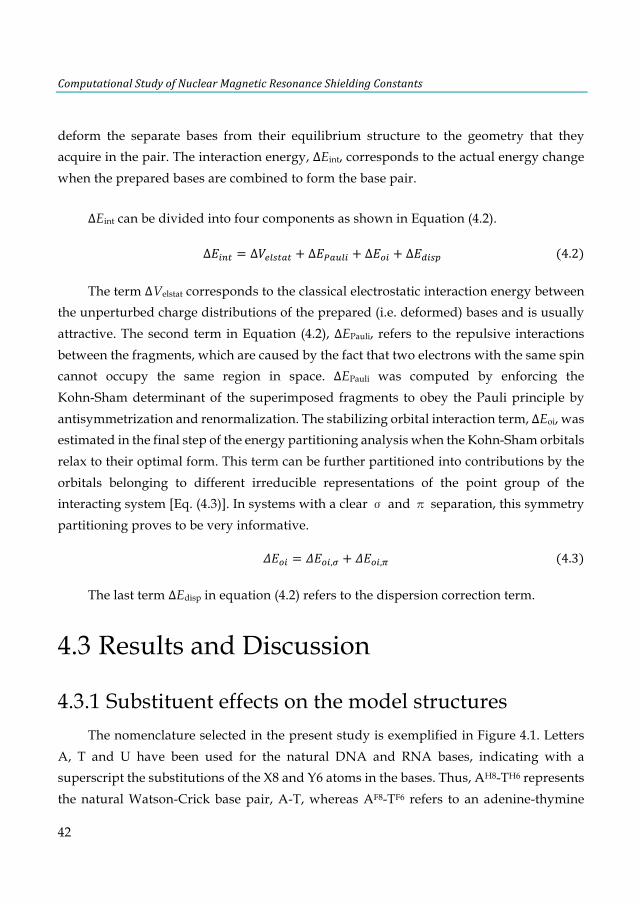
ComputationalStudyofNuclearMagneticResonanceShieldingConstants
42
deform the separate bases from their equilibrium structure to the geometry that they acquire in the pair. The interaction energy, ∆Eint, corresponds to the actual energy change when the prepared bases are combined to form the base pair.
∆Eint can be divided into four components as shown in Equation (4.2).
∆#$?Ä = ∆û;⁄=ÄkÄ + ∆# k¤⁄$ + ∆#>$ + ∆#Ÿ$=9(4.2)
The term ∆Velstat corresponds to the classical electrostatic interaction energy between the unperturbed charge distributions of the prepared (i.e. deformed) bases and is usually attractive. The second term in Equation (4.2), ∆EPauli, refers to the repulsive interactions between the fragments, which are caused by the fact that two electrons with the same spin cannot occupy the same region in space. ∆EPauli was computed by enforcing the Kohn-Sham determinant of the superimposed fragments to obey the Pauli principle by antisymmetrization and renormalization. The stabilizing orbital interaction term, ∆Eoi, was estimated in the final step of the energy partitioning analysis when the Kohn-Sham orbitals relax to their optimal form. This term can be further partitioned into contributions by the orbitals belonging to different irreducible representations of the point group of the interacting system [Eq. (4.3)]. In systems with a clear � and � separation, this symmetry partitioning proves to be very informative.
‹›>$ = ‹›>$,fi + ‹›>$,fl(4.3)
The last term ∆Edisp in equation (4.2) refers to the dispersion correction term.
4.3 Results and Discussion
4.3.1 Substituent effects on the model structures The nomenclature selected in the present study is exemplified in Figure 4.1. Letters
A, T and U have been used for the natural DNA and RNA bases, indicating with a superscript the substitutions of the X8 and Y6 atoms in the bases. Thus, AH8-TH6 represents the natural Watson-Crick base pair, A-T, whereas AF8-TF6 refers to an adenine-thymine
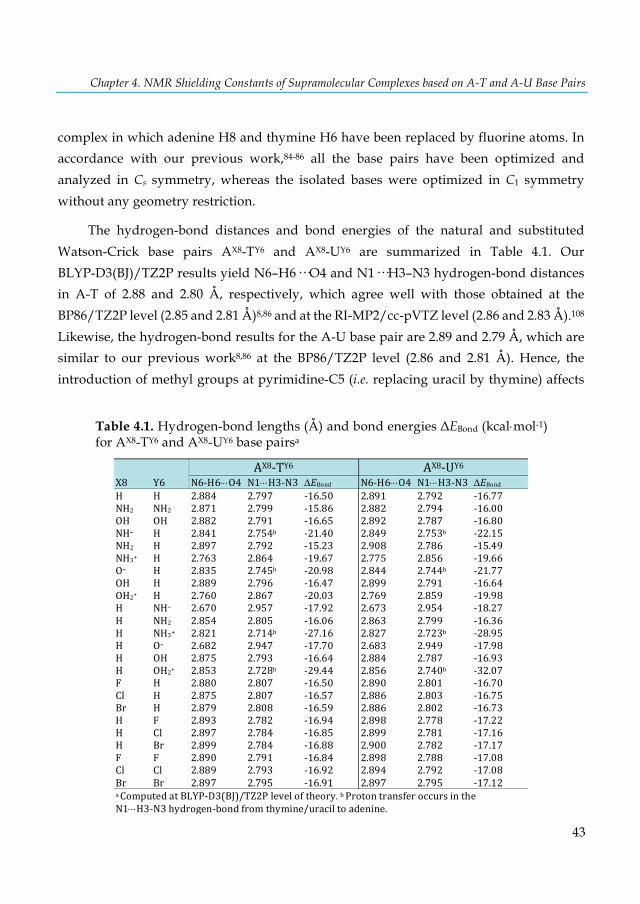
Chapter 4. NMR Shielding Constants of Supramolecular Complexes based on A-T and A-U Base Pairs
43
complex in which adenine H8 and thymine H6 have been replaced by fluorine atoms. In accordance with our previous work,84-86 all the base pairs have been optimized and analyzed in Cs symmetry, whereas the isolated bases were optimized in C1 symmetry without any geometry restriction.
The hydrogen-bond distances and bond energies of the natural and substituted Watson-Crick base pairs AX8-TY6 and AX8-UY6 are summarized in Table 4.1. Our BLYP-D3(BJ)/TZ2P results yield N6–H6···O4 and N1···H3–N3 hydrogen-bond distances in A-T of 2.88 and 2.80 Å, respectively, which agree well with those obtained at the BP86/TZ2P level (2.85 and 2.81 Å)8,86 and at the RI-MP2/cc-pVTZ level (2.86 and 2.83 Å).108 Likewise, the hydrogen-bond results for the A-U base pair are 2.89 and 2.79 Å, which are similar to our previous work8,86 at the BP86/TZ2P level (2.86 and 2.81 Å). Hence, the introduction of methyl groups at pyrimidine-C5 (i.e. replacing uracil by thymine) affects
Table 4.1. Hydrogen-bond lengths (Å) and bond energies ΔEBond (kcal×mol-1) for AX8-TY6 and AX8-UY6 base pairsa
AX8-TY6 AX8-UY6X8 Y6 N6-H6×××O4 N1×××H3-N3 DEBond N6-H6×××O4 N1×××H3-N3 DEBondH H 2.884 2.797 -16.50 2.891 2.792 -16.77NH2 NH2 2.871 2.799 -15.86 2.882 2.794 -16.00OH OH 2.882 2.791 -16.65 2.892 2.787 -16.80NH– H 2.841 2.754b -21.40 2.849 2.753b -22.15NH2 H 2.897 2.792 -15.23 2.908 2.786 -15.49NH3+ H 2.763 2.864 -19.67 2.775 2.856 -19.66O– H 2.835 2.745b -20.98 2.844 2.744b -21.77OH H 2.889 2.796 -16.47 2.899 2.791 -16.64OH2+ H 2.760 2.867 -20.03 2.769 2.859 -19.98H NH– 2.670 2.957 -17.92 2.673 2.954 -18.27H NH2 2.854 2.805 -16.06 2.863 2.799 -16.36H NH3+ 2.821 2.714b -27.16 2.827 2.723b -28.95H O– 2.682 2.947 -17.70 2.683 2.949 -17.98H OH 2.875 2.793 -16.64 2.884 2.787 -16.93H OH2+ 2.853 2.728b -29.44 2.856 2.740b -32.07F H 2.880 2.807 -16.50 2.890 2.801 -16.70Cl H 2.875 2.807 -16.57 2.886 2.803 -16.75Br H 2.879 2.808 -16.59 2.886 2.802 -16.73H F 2.893 2.782 -16.94 2.898 2.778 -17.22H Cl 2.897 2.784 -16.85 2.899 2.781 -17.16H Br 2.899 2.784 -16.88 2.900 2.782 -17.17F F 2.890 2.791 -16.84 2.898 2.788 -17.08Cl Cl 2.889 2.793 -16.92 2.894 2.792 -17.08Br Br 2.897 2.795 -16.91 2.897 2.795 -17.12aComputedatBLYP-D3(BJ)/TZ2Pleveloftheory.bProtontransferoccursintheN1×××H3-N3hydrogen-bondfromthymine/uraciltoadenine.
ComputationalStudyofNuclearMagneticResonanceShieldingConstants
44
hydrogen-bond distances by 0.01 Å or less as we found previously for the methylation at purine-N9, pyrimidine-N1.109,110 The N6–H6···O4 hydrogen-bond seems to be slightly shorter (stronger) for A-T than for A-U, whereas the reverse is true for the N1···H3–N3 bond. Furthermore, our results corroborate that the RNA (A-U) base pair is more strongly bound (by 0.27 kcal·mol-1 at the BLYP-D3(BJ)/TZ2P) than the DNA (A-T) base pair, as was reported before.8,109
At the BLYP-D3(BJ)/TZ2P level, the hydrogen-bond energy for A-T amounts to -16.5 kcal×mol-1, which is consistent with the complete-basis-set extrapolated CCSD(T) CBS value of -16.4 kcal×mol-1 obtained by Jurečka et al.111,112 The two approaches agree exceptionally well with a difference of only about 0.1 kcal×mol-1, and are fully consistent with the value obtained previously at the BLYP-D/TZ2P level (-16.7 kcal×mol-1).92 Furthermore, the results for the substituted AX8-TY6 model base pairs are in line with those previously studied theoretically at the BP86/TZ2P level.8,86 The base pairs involving N6–H6×××O4 and N1×××H3–N3 hydrogen-bond distances differ by less than 0.04 and 0.01 Å, respectively. For a complete description of the substituted Watson-Crick AX8-TY6 base pairs, see ref. 14 and 19.
Contrary to the substituted AX8-TY6 base pairs, the A-UMe6 base pair, to the best of our knowledge, is the only A-U model structure investigated in an earlier theoretical study.8 Thus, from here onwards we will focus on the analysis of the novel substituted AX8-UY6 base pairs. The effect of the substituents can be understood as deriving from their moderately electron-donating/withdrawing capacity. A neutral substituent (NH2, OH or halogen) at X8 and/or Y6 positions causes relatively small changes in N6–H6×××O4 hydrogen-bond distances and bond energies: the effects are 0.03 Å and 1.3 kcal×mol-1 or less, respectively, and the N1×××H3–N3 hydrogen-bond distances remain essentially unaffected (0.01 Å or less), as seen in Table 4.1. On the other hand, introducing a charged substituent at adenine X8 or uracil Y6 has more pronounced effects: the hydrogen bonds contract or expand by up to 0.22 Å and the Watson-Crick hydrogen bonds are stabilized by as much as 15.3 kcal×mol-1.
In the following, we examine in more detail the substituent effects and trends therein along X8, Y6 = NH–, NH2, and NH3+ (N series), but similar arguments emerge also along X8, Y6 = O–, OH, and OH2+ (O series). This corresponds to three different states of
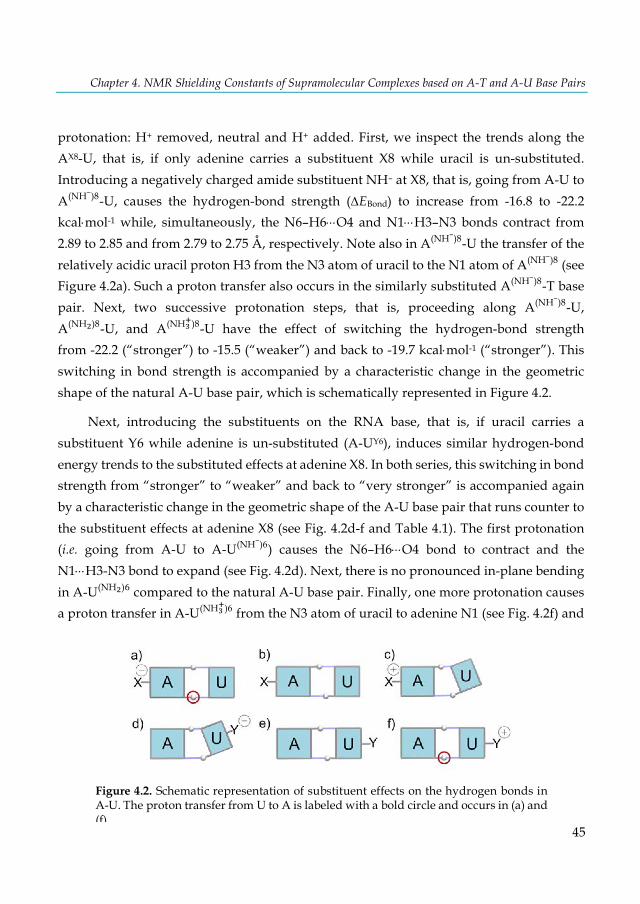
Chapter 4. NMR Shielding Constants of Supramolecular Complexes based on A-T and A-U Base Pairs
45
protonation: H+ removed, neutral and H+ added. First, we inspect the trends along the AX8-U, that is, if only adenine carries a substituent X8 while uracil is un-substituted. Introducing a negatively charged amide substituent NH– at X8, that is, going from A-U to A(NH–)8-U, causes the hydrogen-bond strength (DEBond) to increase from -16.8 to -22.2 kcal×mol-1 while, simultaneously, the N6–H6×××O4 and N1×××H3–N3 bonds contract from 2.89 to 2.85 and from 2.79 to 2.75 Å, respectively. Note also in A(NH–)8-U the transfer of the relatively acidic uracil proton H3 from the N3 atom of uracil to the N1 atom of A(NH–)8 (see Figure 4.2a). Such a proton transfer also occurs in the similarly substituted A(NH–)8-T base pair. Next, two successive protonation steps, that is, proceeding along A(NH–)8-U, A(NHÆ)8-U, and A(NH·
‚)8-U have the effect of switching the hydrogen-bond strength from -22.2 (“stronger”) to -15.5 (“weaker”) and back to -19.7 kcal×mol-1 (“stronger”). This switching in bond strength is accompanied by a characteristic change in the geometric shape of the natural A-U base pair, which is schematically represented in Figure 4.2.
Next, introducing the substituents on the RNA base, that is, if uracil carries a substituent Y6 while adenine is un-substituted (A-UY6), induces similar hydrogen-bond energy trends to the substituted effects at adenine X8. In both series, this switching in bond strength from “stronger” to “weaker” and back to “very stronger” is accompanied again by a characteristic change in the geometric shape of the A-U base pair that runs counter to the substituent effects at adenine X8 (see Fig. 4.2d-f and Table 4.1). The first protonation (i.e. going from A-U to A-U(NH–)6) causes the N6–H6×××O4 bond to contract and the N1×××H3-N3 bond to expand (see Fig. 4.2d). Next, there is no pronounced in-plane bending in A-U(NHÆ)6 compared to the natural A-U base pair. Finally, one more protonation causes a proton transfer in A-U(NH·
‚)6 from the N3 atom of uracil to adenine N1 (see Fig. 4.2f) and
Figure 4.2. Schematic representation of substituent effects on the hydrogen bonds in A-U. The proton transfer from U to A is labeled with a bold circle and occurs in (a) and (f).
ComputationalStudyofNuclearMagneticResonanceShieldingConstants
46
the hydrogen bonds are shortened relative to natural A-U. In fact, the latter case with a positively charged group at the Y6 position shows a similar behavior to the A-T(NH·
‚)6 base pair.
Additionally, we analyzed in more detail the relatively small changes in hydrogen-bond distances and energies when the A-U base pairs carry halogen substituents (F, Cl or Br). It can be seen that a halogen atom at adenine X8 position has little effect, whereas a halogen atom at uracil Y6 weakens the N6–H6×××O4 bond and strengthens the N1×××H3–N3 bond. The latter effect apparently dominates (and is the strongest in the case of Y6 = fluorine) as follows from the fact that the overall hydrogen-bond strength (ΔEBond) increases. Introducing a halogen atom at the adenine X8 position decreases the hydrogen-bond strength by less than 0.1 kcal×mol-1. For example, going from A-U to AF8-U causes a decrease of the ΔEBond from -16.77 to -16.70 kcal×mol-1. In contrast, a halogen atom at the uracil Y6 position increases the hydrogen-bond strength, e.g. going from A-U to A-UF6 leads to an energy value of -17.22 kcal×mol-1 (see Table 4.1).
4.3.2 Origin of the Substituent Effects The substituent effects of the AX8-UY6 base pairs described above can be supported by
the corresponding energy decomposition analysis (EDA) and Voronoi deformation density (VDD) analysis of the charge distribution. The hydrogen bonding in all our model systems receives an important stabilizing contribution from occupied-virtual interactions, which are almost in the same order of magnitude as the electrostatic interaction (see Table 4.2). This is also true in the substituted AX8-TY6 base pairs for which these analyses have already been reported in an earlier work.14 As expected, the behavior in AX8-UY6 is similar to that of AX8-TY6. The percentage contribution of the orbital interactions (∆Eoi) to all the bonding forces (i.e., ∆Eoi + ∆Velstat + ∆Edisp) between the Watson-Crick AX8-UY6 base pairs amounts to 36-40% and the remaining 60-64% is provided by the electrostatic attraction (∆Velstat). The partition of the orbital term into contributions from irreducible representations shows that the A bonding (∆#fi) is significant stronger than the , bonding (∆#fl), by 88% or more in all cases.
Additionally, in those systems in which proton transfer occurs from uracil to adenine, the covalent component is even larger, up to 68%. Note, however, that this is an artifact of

Chapter 4. NMR Shielding Constants of Supramolecular Complexes based on A-T and A-U Base Pairs
47
partitioning the complex into adenine and uracil while the H3-hydrogen atom gains much proton character because it is already far removed from uracil to which it was originally bound. Therefore, an additional analysis was performed for A(NH–)8-U and A(O–)8-U base pairs in terms of a neutral (N1-protonated X8-substituted) adenine and a negatively charged (N3-deprotonated) uracil fragmentation. Similarly, the A-U(NH·
‚)6 and A-U(OHÆ‚)6
base pairs were analyzed using a positively charged (N1-protonated) adenine and a neutral (N3-deprotonated Y6-substituted) uracil interacting fragments. In this more realistic context, the orbital interactions yield again the well-known percentages of 35-36% (see Table 4.3).
Table 4.2. EDA analysis (in kcal×mol-1) of the AX8-UY6 base pairs (N and O series)a
X8 H NH2 NH
–
NH2 NH
3
+ H H HY6 H NH
2 H H H NH
– NH2 NH
3
+DEprep 1.85 2.45 76.44 3.15 1.63 3.22 2.35 69.58DEint -18.62 -18.45 -98.59 -18.64 -21.29 -21.49 -18.71 -98.53DEPauli 40.38 40.75 171.73 40.61 38.70 45.72 40.73 151.40DVelstat -32.36 -32.43 -88.67 -32.35 -33.40 -35.40 -32.75 -78.16DEdisp -5.34 -5.34 -4.99 -5.36 -5.26 -4.93 -5.33 -5.15DEoi -21.29 -21.43 -176.65 -21.54 -21.34 -26.88 -21.35 -166.62DEσ -19.71 -19.89 -163.73 -19.96 -19.20 -23.75 -19.78 -151.14DEπ -1.58 -1.54 -12.92 -1.58 -2.14 -3.13 -1.57 -15.48%DVelstatb 54.9 54.8 32.8 54.6 55.6 52.7 55.1 31.2%DEdispb 9.0 9.0 1.8 9.0 8.8 7.3 9.0 2.1%DEoib 36.1 36.2 65.4 36.4 35.6 40.0 35.9 66.7DEBond -16.77 -16.00 -22.15c -15.49 -19.66 -18.27 -16.36 -28.95c
X8 H OH O
–
OH OH2
+ H H HY6 H OH H H H O
– OH OH2
+DEprep 1.85 2.01 74.95 1.94 1.57 2.96 1.93 73.49DEint -18.62 -18.81 -96.72 -18.58 -21.55 -20.94 -18.86 -105.56DEPauli 40.38 40.67 171.06 40.19 38.61 44.76 40.91 146.34DVelstat -32.36 -32.59 -88.33 -32.23 -33.41 -34.76 -32.76 -75.99DEdisp -5.34 -5.37 -5.02 -5.35 -5.25 -4.94 -5.37 -5.06DEoi -21.29 -21.52 -174.43 -21.19 -21.49 -26.00 -21.64 -170.86DEσ -19.71 -19.94 -161.70 -19.63 -19.28 -23.05 -20.05 -154.29DEπ -1.58 -1.57 -12.73 -1.56 -2.21 -2.95 -1.59 -16.57%DVelstatb 54.9 54.8 33.0 54.8 55.6 52.9 54.8 30.1%DEdispb 9.0 9.0 1.9 9.1 8.7 7.5 9.0 2.2%DEoib 36.1 36.2 65.1 36.1 35.7 39.6 36.2 67.7DEBond -16.77 -16.80 -21.77c -16.64 -19.98 -17.98 -16.93 -32.07ca Computed at BLYP-D3(BJ)/TZ2P with bases in C1 symmetry and base pairs in Cssymmetry.bThepercentagevaluesgivethecontributiontothetotalattractiveforces(i.e.DVelstat+DEoi+DEdisp). cProtontransferoccursin theN1×××H3-N3hydrogen-bondfromuraciltoadenine.
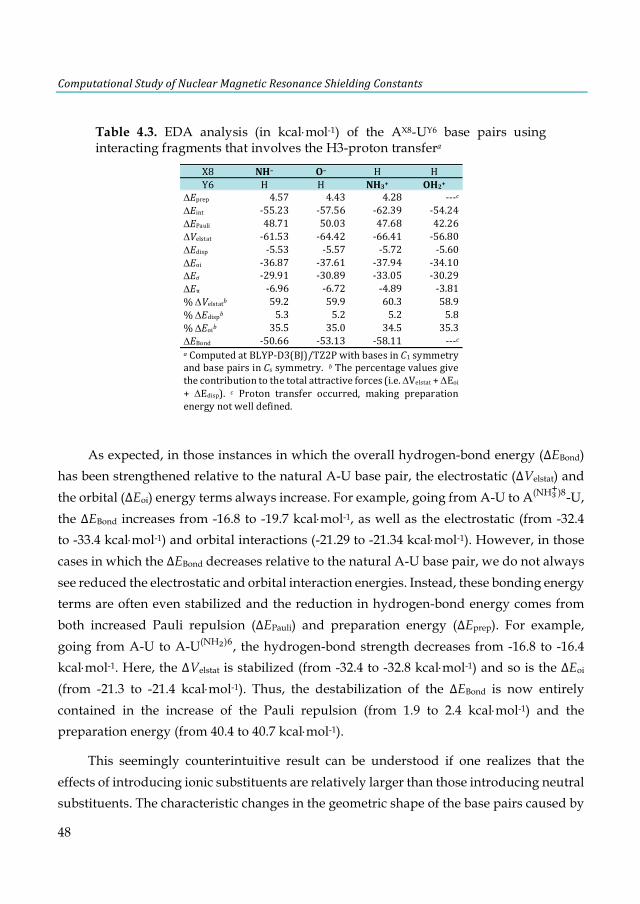
ComputationalStudyofNuclearMagneticResonanceShieldingConstants
48
As expected, in those instances in which the overall hydrogen-bond energy (∆EBond) has been strengthened relative to the natural A-U base pair, the electrostatic (∆Velstat) and the orbital (∆Eoi) energy terms always increase. For example, going from A-U to A(NH·
‚)8-U, the ∆EBond increases from -16.8 to -19.7 kcal×mol-1, as well as the electrostatic (from -32.4 to -33.4 kcal×mol-1) and orbital interactions (-21.29 to -21.34 kcal×mol-1). However, in those cases in which the ∆EBond decreases relative to the natural A-U base pair, we do not always see reduced the electrostatic and orbital interaction energies. Instead, these bonding energy terms are often even stabilized and the reduction in hydrogen-bond energy comes from both increased Pauli repulsion (∆EPauli) and preparation energy (∆Eprep). For example, going from A-U to A-U(NHÆ)6, the hydrogen-bond strength decreases from -16.8 to -16.4 kcal×mol-1. Here, the ∆Velstat is stabilized (from -32.4 to -32.8 kcal×mol-1) and so is the ∆Eoi (from -21.3 to -21.4 kcal×mol-1). Thus, the destabilization of the ∆EBond is now entirely contained in the increase of the Pauli repulsion (from 1.9 to 2.4 kcal×mol-1) and the preparation energy (from 40.4 to 40.7 kcal×mol-1).
This seemingly counterintuitive result can be understood if one realizes that the effects of introducing ionic substituents are relatively larger than those introducing neutral substituents. The characteristic changes in the geometric shape of the base pairs caused by
Table 4.3. EDA analysis (in kcal×mol-1) of the AX8-UY6 base pairs using interacting fragments that involves the H3-proton transfera
X8 NH
–
O
–
H HY6 H H NH
3
+
OH2
+
DEprep 4.57 4.43 4.28 ---cDEint -55.23 -57.56 -62.39 -54.24DEPauli 48.71 50.03 47.68 42.26DVelstat -61.53 -64.42 -66.41 -56.80DEdisp -5.53 -5.57 -5.72 -5.60DEoi -36.87 -37.61 -37.94 -34.10DEσ -29.91 -30.89 -33.05 -30.29DEπ -6.96 -6.72 -4.89 -3.81%DVelstatb 59.2 59.9 60.3 58.9%DEdispb 5.3 5.2 5.2 5.8%DEoib 35.5 35.0 34.5 35.3DEBond -50.66 -53.13 -58.11 ---caComputedatBLYP-D3(BJ)/TZ2PwithbasesinC1symmetryandbasepairsinCssymmetry.bThepercentagevaluesgivethecontributiontothetotalattractiveforces(i.e.DVelstat+DEoi+ DEdisp). c Proton transfer occurred, making preparationenergynotwelldefined.
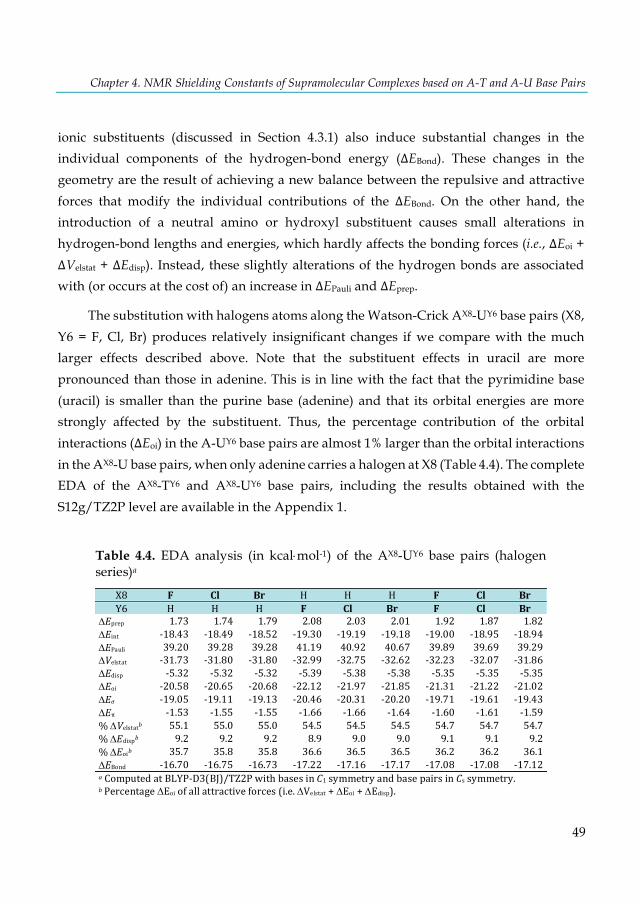
Chapter 4. NMR Shielding Constants of Supramolecular Complexes based on A-T and A-U Base Pairs
49
ionic substituents (discussed in Section 4.3.1) also induce substantial changes in the individual components of the hydrogen-bond energy (∆EBond). These changes in the geometry are the result of achieving a new balance between the repulsive and attractive forces that modify the individual contributions of the ∆EBond. On the other hand, the introduction of a neutral amino or hydroxyl substituent causes small alterations in hydrogen-bond lengths and energies, which hardly affects the bonding forces (i.e., ∆Eoi + ∆Velstat + ∆Edisp). Instead, these slightly alterations of the hydrogen bonds are associated with (or occurs at the cost of) an increase in ∆EPauli and ∆Eprep.
The substitution with halogens atoms along the Watson-Crick AX8-UY6 base pairs (X8, Y6 = F, Cl, Br) produces relatively insignificant changes if we compare with the much larger effects described above. Note that the substituent effects in uracil are more pronounced than those in adenine. This is in line with the fact that the pyrimidine base (uracil) is smaller than the purine base (adenine) and that its orbital energies are more strongly affected by the substituent. Thus, the percentage contribution of the orbital interactions (∆Eoi) in the A-UY6 base pairs are almost 1% larger than the orbital interactions in the AX8-U base pairs, when only adenine carries a halogen at X8 (Table 4.4). The complete EDA of the AX8-TY6 and AX8-UY6 base pairs, including the results obtained with the S12g/TZ2P level are available in the Appendix 1.
Table 4.4. EDA analysis (in kcal×mol-1) of the AX8-UY6 base pairs (halogen series)a
X8 F Cl Br H H H F Cl Br
Y6 H H H F Cl Br F Cl BrDEprep 1.73 1.74 1.79 2.08 2.03 2.01 1.92 1.87 1.82DEint -18.43 -18.49 -18.52 -19.30 -19.19 -19.18 -19.00 -18.95 -18.94DEPauli 39.20 39.28 39.28 41.19 40.92 40.67 39.89 39.69 39.29DVelstat -31.73 -31.80 -31.80 -32.99 -32.75 -32.62 -32.23 -32.07 -31.86DEdisp -5.32 -5.32 -5.32 -5.39 -5.38 -5.38 -5.35 -5.35 -5.35DEoi -20.58 -20.65 -20.68 -22.12 -21.97 -21.85 -21.31 -21.22 -21.02DEσ -19.05 -19.11 -19.13 -20.46 -20.31 -20.20 -19.71 -19.61 -19.43DEπ -1.53 -1.55 -1.55 -1.66 -1.66 -1.64 -1.60 -1.61 -1.59%DVelstatb 55.1 55.0 55.0 54.5 54.5 54.5 54.7 54.7 54.7%DEdispb 9.2 9.2 9.2 8.9 9.0 9.0 9.1 9.1 9.2%DEoib 35.7 35.8 35.8 36.6 36.5 36.5 36.2 36.2 36.1DEBond -16.70 -16.75 -16.73 -17.22 -17.16 -17.17 -17.08 -17.08 -17.12aComputedatBLYP-D3(BJ)/TZ2PwithbasesinC1symmetryandbasepairsinCssymmetry.bPercentageDEoiofallattractiveforces(i.e.DVelstat+DEoi+DEdisp).
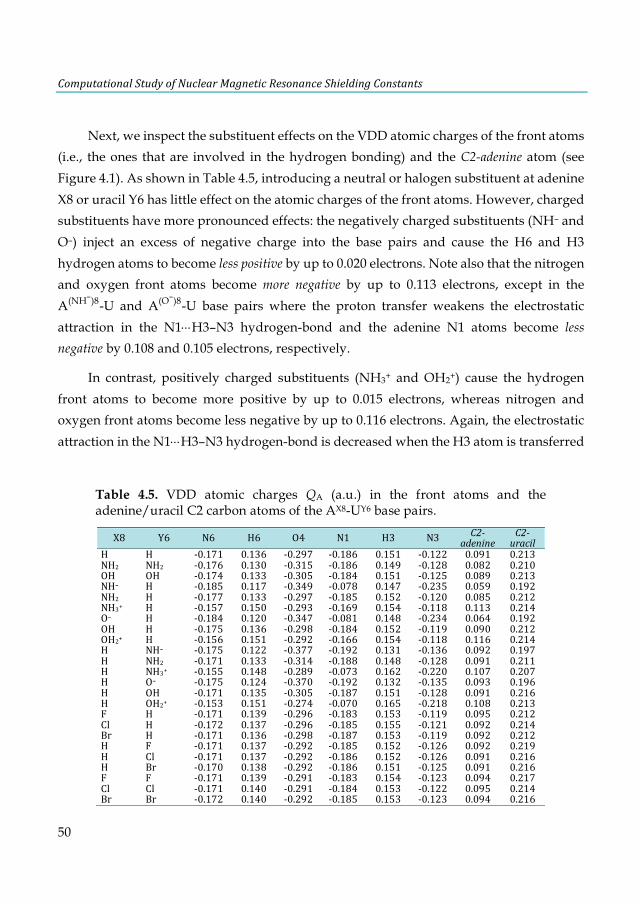
ComputationalStudyofNuclearMagneticResonanceShieldingConstants
50
Next, we inspect the substituent effects on the VDD atomic charges of the front atoms (i.e., the ones that are involved in the hydrogen bonding) and the C2-adenine atom (see Figure 4.1). As shown in Table 4.5, introducing a neutral or halogen substituent at adenine X8 or uracil Y6 has little effect on the atomic charges of the front atoms. However, charged substituents have more pronounced effects: the negatively charged substituents (NH– and O–) inject an excess of negative charge into the base pairs and cause the H6 and H3 hydrogen atoms to become less positive by up to 0.020 electrons. Note also that the nitrogen and oxygen front atoms become more negative by up to 0.113 electrons, except in the A(NH–)8-U and A(O–)8-U base pairs where the proton transfer weakens the electrostatic attraction in the N1×××H3–N3 hydrogen-bond and the adenine N1 atoms become less negative by 0.108 and 0.105 electrons, respectively.
In contrast, positively charged substituents (NH3+ and OH2+) cause the hydrogen front atoms to become more positive by up to 0.015 electrons, whereas nitrogen and oxygen front atoms become less negative by up to 0.116 electrons. Again, the electrostatic attraction in the N1×××H3–N3 hydrogen-bond is decreased when the H3 atom is transferred
Table 4.5. VDD atomic charges QA (a.u.) in the front atoms and the adenine/uracil C2 carbon atoms of the AX8-UY6 base pairs.
X8 Y6 N6 H6 O4 N1 H3 N3 C2-adenine
C2-uracil
H H -0.171 0.136 -0.297 -0.186 0.151 -0.122 0.091 0.213NH2 NH2 -0.176 0.130 -0.315 -0.186 0.149 -0.128 0.082 0.210OH OH -0.174 0.133 -0.305 -0.184 0.151 -0.125 0.089 0.213NH– H -0.185 0.117 -0.349 -0.078 0.147 -0.235 0.059 0.192NH2 H -0.177 0.133 -0.297 -0.185 0.152 -0.120 0.085 0.212NH3+ H -0.157 0.150 -0.293 -0.169 0.154 -0.118 0.113 0.214O– H -0.184 0.120 -0.347 -0.081 0.148 -0.234 0.064 0.192OH H -0.175 0.136 -0.298 -0.184 0.152 -0.119 0.090 0.212OH2+ H -0.156 0.151 -0.292 -0.166 0.154 -0.118 0.116 0.214H NH– -0.175 0.122 -0.377 -0.192 0.131 -0.136 0.092 0.197H NH2 -0.171 0.133 -0.314 -0.188 0.148 -0.128 0.091 0.211H NH3+ -0.155 0.148 -0.289 -0.073 0.162 -0.220 0.107 0.207H O– -0.175 0.124 -0.370 -0.192 0.132 -0.135 0.093 0.196H OH -0.171 0.135 -0.305 -0.187 0.151 -0.128 0.091 0.216H OH2+ -0.153 0.151 -0.274 -0.070 0.165 -0.218 0.108 0.213F H -0.171 0.139 -0.296 -0.183 0.153 -0.119 0.095 0.212Cl H -0.172 0.137 -0.296 -0.185 0.155 -0.121 0.092 0.214Br H -0.171 0.136 -0.298 -0.187 0.153 -0.119 0.092 0.212H F -0.171 0.137 -0.292 -0.185 0.152 -0.126 0.092 0.219H Cl -0.171 0.137 -0.292 -0.186 0.152 -0.126 0.091 0.216H Br -0.170 0.138 -0.292 -0.186 0.151 -0.125 0.091 0.216F F -0.171 0.139 -0.291 -0.183 0.154 -0.123 0.094 0.217Cl Cl -0.171 0.140 -0.291 -0.184 0.153 -0.122 0.095 0.214Br Br -0.172 0.140 -0.292 -0.185 0.153 -0.123 0.094 0.216
Chapter 4. NMR Shielding Constants of Supramolecular Complexes based on A-T and A-U Base Pairs
51
as a proton (A-U(NH·‚)6 and in A-U(OHÆ
‚)6 base pairs) and the uracil N3 atoms become more negative by up to 0.098 electrons. Halogen substituents cause relatively small effects on the VDD atomic charges. In line with the higher electronegativity of the halogen atoms, the hydrogen front atoms are slightly more positive by up to 0.004 electrons, whereas nitrogen and oxygen atoms are in most cases slightly less negative by up to 0.006 electrons.
For a better understanding, the atomic charges of C2-adenine/uracil atoms will be discussed in the next section and the complete VDD description of the AX8-TY6 and AX8-UY6 base pairs is available in the Appendix A1, Tables A1.1- A1.2. We therefore proceed to analyze the main results of our work, the NMR chemical shielding constants.
4.3.3 NMR Chemical Shielding Constants As mentioned before, the presence of a methyl group at the pyrimidine ring (e.g., A-T
versus A-U) has two effects: it decreases the hydrogen-bond strength, and it decreases the NMR shielding at the adenine C2 atom. However, a correlation between these two effects was arguable. Since we now have ample data for the influence of the hydrogen bond strength by varying the X8 and Y6 substituents, we have analyzed in detail if the NMR C2-adenine and C2-thymine/uracil shielding constants correlate with the hydrogen-bond strength.
Let us first focus our attention on the NMR C2-adenine shielding (σ) constants of the isolated adenine (AX8) bases (see Table 4.6). Neutral substituents (NH2 and OH) at X8 have little effect on the shielding values. However, the presence of charged substituents induces an interesting and significant variation. Introducing a negatively charged group at X8 increases the C2-adenine shielding (σ). If we examine the results obtained at the SAOP/TZ2P level, substituent NH– at X8 causes an increase of the shielding from 29.4 to 43.6 ppm. In contrast, a positively charged group at X8 decreases σ, e.g. substituent NH3+ induces a deshielding of -5.7 ppm (see Δσ (AX8), Table 4.6). These tendencies are easily understood in terms of the charge transfer between the C2-adenine atom and the electron-donating/withdrawing capacity of the substituents at the X8 position. If we inspect the VDD atomic charges of the adenine C2 atom, a negatively charged substituent causes C2 to become less positive by up to 0.032 electrons, whereas a positively charged substituent causes the C2 atom to become more positive by up to 0.025 electrons. In the
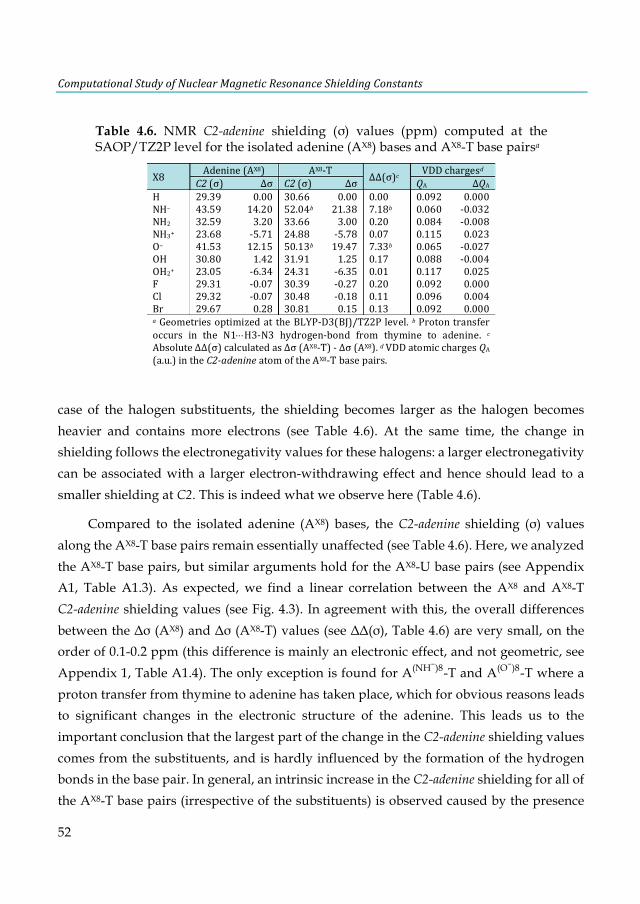
ComputationalStudyofNuclearMagneticResonanceShieldingConstants
52
case of the halogen substituents, the shielding becomes larger as the halogen becomes heavier and contains more electrons (see Table 4.6). At the same time, the change in shielding follows the electronegativity values for these halogens: a larger electronegativity can be associated with a larger electron-withdrawing effect and hence should lead to a smaller shielding at C2. This is indeed what we observe here (Table 4.6).
Compared to the isolated adenine (AX8) bases, the C2-adenine shielding (σ) values along the AX8-T base pairs remain essentially unaffected (see Table 4.6). Here, we analyzed the AX8-T base pairs, but similar arguments hold for the AX8-U base pairs (see Appendix A1, Table A1.3). As expected, we find a linear correlation between the AX8 and AX8-T C2-adenine shielding values (see Fig. 4.3). In agreement with this, the overall differences between the Δσ (AX8) and Δσ (AX8-T) values (see ΔΔ(σ), Table 4.6) are very small, on the order of 0.1-0.2 ppm (this difference is mainly an electronic effect, and not geometric, see Appendix 1, Table A1.4). The only exception is found for A(NH–)8-T and A(O–)8-T where a proton transfer from thymine to adenine has taken place, which for obvious reasons leads to significant changes in the electronic structure of the adenine. This leads us to the important conclusion that the largest part of the change in the C2-adenine shielding values comes from the substituents, and is hardly influenced by the formation of the hydrogen bonds in the base pair. In general, an intrinsic increase in the C2-adenine shielding for all of the AX8-T base pairs (irrespective of the substituents) is observed caused by the presence
Table 4.6. NMR C2-adenine shielding (σ) values (ppm) computed at the SAOP/TZ2P level for the isolated adenine (AX8) bases and AX8-T base pairsa
X8 Adenine(AX8) AX8-T ΔΔ(σ)c VDDchargesdC2(σ) Δσ C2(σ) Δσ QA ΔQA
H 29.39 0.00 30.66 0.00 0.00 0.092 0.000NH– 43.59 14.20 52.04b 21.38 7.18b 0.060 -0.032NH2 32.59 3.20 33.66 3.00 0.20 0.084 -0.008NH3+ 23.68 -5.71 24.88 -5.78 0.07 0.115 0.023O– 41.53 12.15 50.13b 19.47 7.33b 0.065 -0.027OH 30.80 1.42 31.91 1.25 0.17 0.088 -0.004OH2+ 23.05 -6.34 24.31 -6.35 0.01 0.117 0.025F 29.31 -0.07 30.39 -0.27 0.20 0.092 0.000Cl 29.32 -0.07 30.48 -0.18 0.11 0.096 0.004Br 29.67 0.28 30.81 0.15 0.13 0.092 0.000aGeometriesoptimizedat theBLYP-D3(BJ)/TZ2Plevel. bProtontransferoccurs in the N1×××H3-N3 hydrogen-bond from thymine to adenine. cAbsoluteΔΔ(σ)calculatedasΔσ(AX8-T)-Δσ(AX8).dVDDatomicchargesQA(a.u.)intheC2-adenineatomoftheAX8-Tbasepairs.
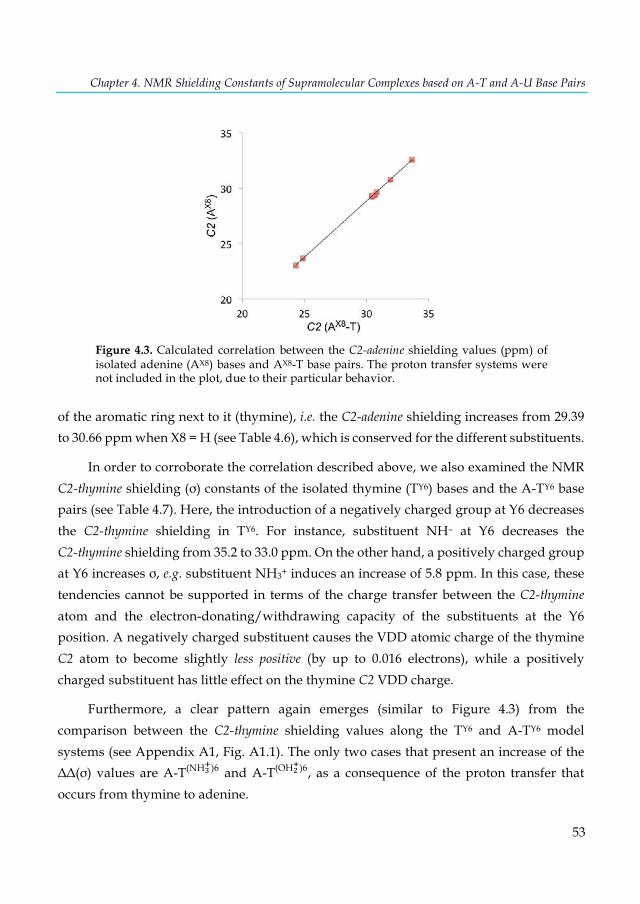
Chapter 4. NMR Shielding Constants of Supramolecular Complexes based on A-T and A-U Base Pairs
53
of the aromatic ring next to it (thymine), i.e. the C2-adenine shielding increases from 29.39 to 30.66 ppm when X8 = H (see Table 4.6), which is conserved for the different substituents.
In order to corroborate the correlation described above, we also examined the NMR C2-thymine shielding (σ) constants of the isolated thymine (TY6) bases and the A-TY6 base pairs (see Table 4.7). Here, the introduction of a negatively charged group at Y6 decreases the C2-thymine shielding in TY6. For instance, substituent NH– at Y6 decreases the C2-thymine shielding from 35.2 to 33.0 ppm. On the other hand, a positively charged group at Y6 increases σ, e.g. substituent NH3+ induces an increase of 5.8 ppm. In this case, these tendencies cannot be supported in terms of the charge transfer between the C2-thymine atom and the electron-donating/withdrawing capacity of the substituents at the Y6 position. A negatively charged substituent causes the VDD atomic charge of the thymine C2 atom to become slightly less positive (by up to 0.016 electrons), while a positively charged substituent has little effect on the thymine C2 VDD charge.
Furthermore, a clear pattern again emerges (similar to Figure 4.3) from the comparison between the C2-thymine shielding values along the TY6 and A-TY6 model systems (see Appendix A1, Fig. A1.1). The only two cases that present an increase of the ΔΔ(σ) values are A-T(NH·
‚)6 and A-T(OHÆ‚)6, as a consequence of the proton transfer that
occurs from thymine to adenine.
Figure 4.3. Calculated correlation between the C2-adenine shielding values (ppm) of isolated adenine (AX8) bases and AX8-T base pairs. The proton transfer systems were not included in the plot, due to their particular behavior.
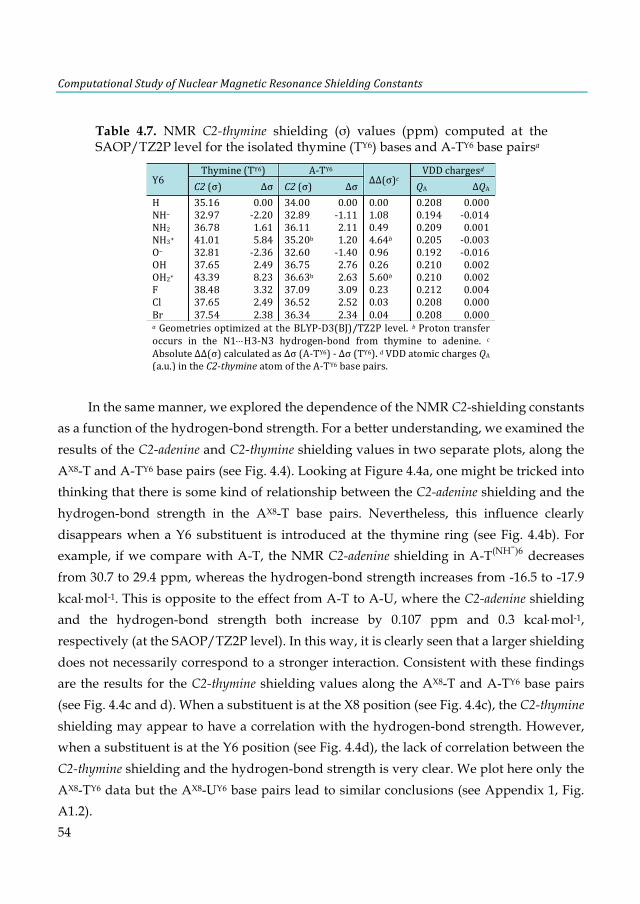
ComputationalStudyofNuclearMagneticResonanceShieldingConstants
54
In the same manner, we explored the dependence of the NMR C2-shielding constants as a function of the hydrogen-bond strength. For a better understanding, we examined the results of the C2-adenine and C2-thymine shielding values in two separate plots, along the AX8-T and A-TY6 base pairs (see Fig. 4.4). Looking at Figure 4.4a, one might be tricked into thinking that there is some kind of relationship between the C2-adenine shielding and the hydrogen-bond strength in the AX8-T base pairs. Nevertheless, this influence clearly disappears when a Y6 substituent is introduced at the thymine ring (see Fig. 4.4b). For example, if we compare with A-T, the NMR C2-adenine shielding in A-T(NH–)6 decreases from 30.7 to 29.4 ppm, whereas the hydrogen-bond strength increases from -16.5 to -17.9 kcal×mol-1. This is opposite to the effect from A-T to A-U, where the C2-adenine shielding and the hydrogen-bond strength both increase by 0.107 ppm and 0.3 kcal×mol-1, respectively (at the SAOP/TZ2P level). In this way, it is clearly seen that a larger shielding does not necessarily correspond to a stronger interaction. Consistent with these findings are the results for the C2-thymine shielding values along the AX8-T and A-TY6 base pairs (see Fig. 4.4c and d). When a substituent is at the X8 position (see Fig. 4.4c), the C2-thymine shielding may appear to have a correlation with the hydrogen-bond strength. However, when a substituent is at the Y6 position (see Fig. 4.4d), the lack of correlation between the C2-thymine shielding and the hydrogen-bond strength is very clear. We plot here only the AX8-TY6 data but the AX8-UY6 base pairs lead to similar conclusions (see Appendix 1, Fig. A1.2).
Table 4.7. NMR C2-thymine shielding (σ) values (ppm) computed at the SAOP/TZ2P level for the isolated thymine (TY6) bases and A-TY6 base pairsa
Y6Thymine(TY6) A-TY6
ΔΔ(σ)cVDDchargesd
C2(σ) Δσ C2(σ) Δσ QA ΔQAH 35.16 0.00 34.00 0.00 0.00 0.208 0.000NH– 32.97 -2.20 32.89 -1.11 1.08 0.194 -0.014NH2 36.78 1.61 36.11 2.11 0.49 0.209 0.001NH3+ 41.01 5.84 35.20b 1.20 4.64b 0.205 -0.003O– 32.81 -2.36 32.60 -1.40 0.96 0.192 -0.016OH 37.65 2.49 36.75 2.76 0.26 0.210 0.002OH2+ 43.39 8.23 36.63b 2.63 5.60b 0.210 0.002F 38.48 3.32 37.09 3.09 0.23 0.212 0.004Cl 37.65 2.49 36.52 2.52 0.03 0.208 0.000Br 37.54 2.38 36.34 2.34 0.04 0.208 0.000aGeometriesoptimizedattheBLYP-D3(BJ)/TZ2Plevel. bProton transferoccurs in the N1×××H3-N3 hydrogen-bond from thymine to adenine. cAbsoluteΔΔ(σ)calculatedasΔσ(A-TY6)-Δσ(TY6).dVDDatomicchargesQA(a.u.)intheC2-thymineatomoftheA-TY6basepairs.

Chapter 4. NMR Shielding Constants of Supramolecular Complexes based on A-T and A-U Base Pairs
55
Finally, we wanted to illustrate our study with a biological model that occurs in DNA and RNA. Thus, we explored the interaction of adenine, thymine and A-T structures with a monovalent K+ cation and two water molecules (see Fig. 4.5). We limit the optimizations to the planar Cs symmetry, where the K+ cation interacts with the N7 nitrogen atom of adenine or the O4/O2 oxygen atoms of thymine. These positions are known113 to be one of the actives sites for the interaction of metal ions with nucleic acids in various biological systems.
As expected, the K+×××2H2O acts as a positively charged substituent, similarly to adding NH3+/OH2+ substituents that led to a decrease of the C2-adenine shielding when introduced at the X8 position (see Table 4.6) and an increase of the C2-thymine shielding when added at the Y6 position (see Table 4.7). For K+×××2H2O, if we compare with the
Figure 4.4. Calculated dependence of the NMR C2-shielding values (ppm) as a function of the hydrogen-bond strength (kcal×mol-1). (a) C2-adenine shielding of AX8-T, (b) C2-adenine shielding of A-TY6, (c) C2-thymine shielding of AX8-T, and (d) C2-thymine shielding of A-TY6 base pairs. The proton transfer systems were not included in the plot, due to their particular behavior.
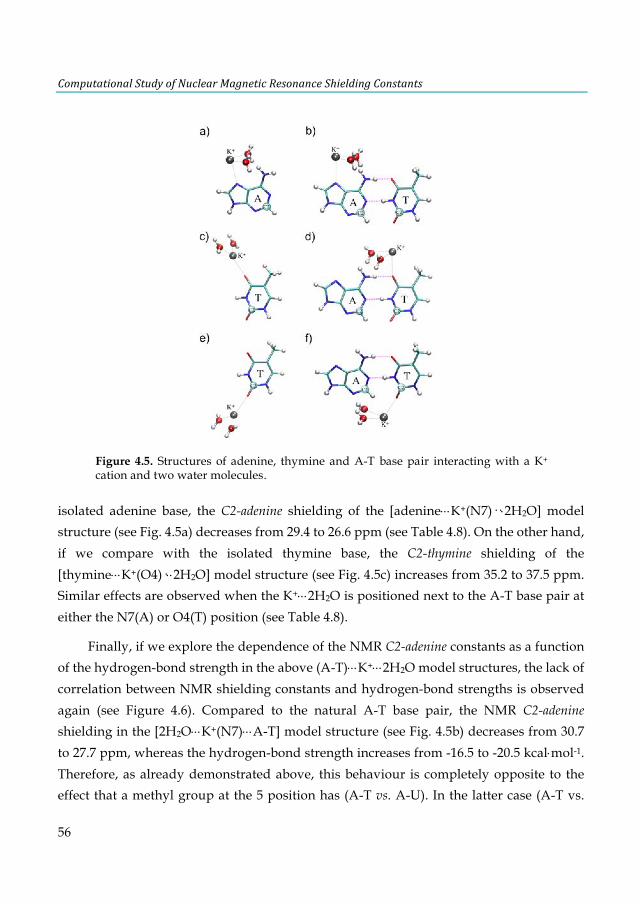
ComputationalStudyofNuclearMagneticResonanceShieldingConstants
56
isolated adenine base, the C2-adenine shielding of the [adenine×××K+(N7)··×2H2O] model structure (see Fig. 4.5a) decreases from 29.4 to 26.6 ppm (see Table 4.8). On the other hand, if we compare with the isolated thymine base, the C2-thymine shielding of the [thymine×××K+(O4)·××2H2O] model structure (see Fig. 4.5c) increases from 35.2 to 37.5 ppm. Similar effects are observed when the K+×××2H2O is positioned next to the A-T base pair at either the N7(A) or O4(T) position (see Table 4.8).
Finally, if we explore the dependence of the NMR C2-adenine constants as a function of the hydrogen-bond strength in the above (A-T)×××K+×××2H2O model structures, the lack of correlation between NMR shielding constants and hydrogen-bond strengths is observed again (see Figure 4.6). Compared to the natural A-T base pair, the NMR C2-adenine shielding in the [2H2O×××K+(N7)×××A-T] model structure (see Fig. 4.5b) decreases from 30.7 to 27.7 ppm, whereas the hydrogen-bond strength increases from -16.5 to -20.5 kcal×mol-1. Therefore, as already demonstrated above, this behaviour is completely opposite to the effect that a methyl group at the 5 position has (A-T vs. A-U). In the latter case (A-T vs.
Figure 4.5. Structures of adenine, thymine and A-T base pair interacting with a K+ cation and two water molecules.
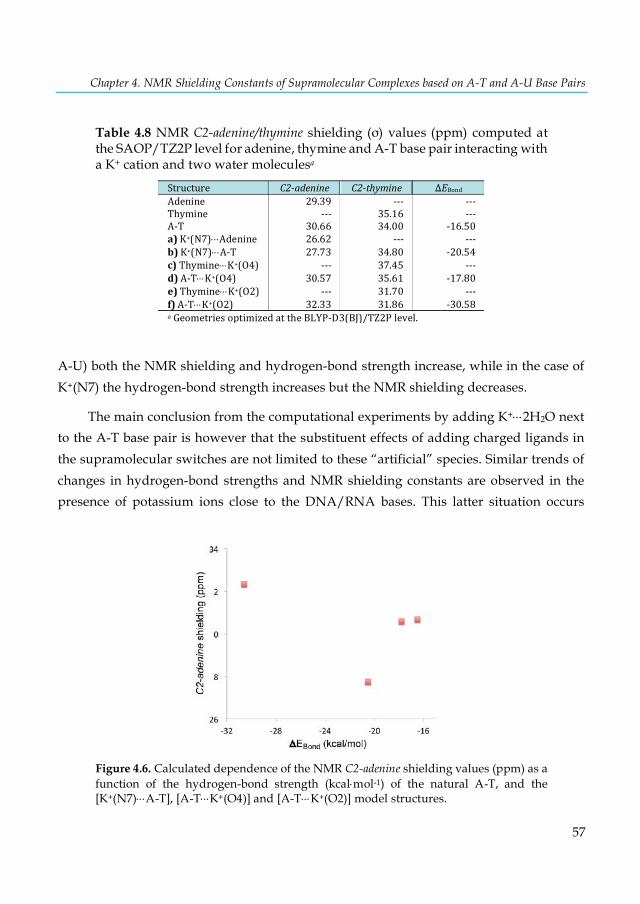
Chapter 4. NMR Shielding Constants of Supramolecular Complexes based on A-T and A-U Base Pairs
57
A-U) both the NMR shielding and hydrogen-bond strength increase, while in the case of K+(N7) the hydrogen-bond strength increases but the NMR shielding decreases.
The main conclusion from the computational experiments by adding K+×××2H2O next to the A-T base pair is however that the substituent effects of adding charged ligands in the supramolecular switches are not limited to these “artificial” species. Similar trends of changes in hydrogen-bond strengths and NMR shielding constants are observed in the presence of potassium ions close to the DNA/RNA bases. This latter situation occurs
Figure 4.6. Calculated dependence of the NMR C2-adenine shielding values (ppm) as a function of the hydrogen-bond strength (kcal×mol-1) of the natural A-T, and the [K+(N7)×××A-T], [A-T×××K+(O4)] and [A-T×××K+(O2)] model structures.
Table 4.8 NMR C2-adenine/thymine shielding (σ) values (ppm) computed at the SAOP/TZ2P level for adenine, thymine and A-T base pair interacting with a K+ cation and two water moleculesa
Structure C2-adenine C2-thymine ΔEBondAdenine 29.39 --- ---Thymine --- 35.16 ---A-T 30.66 34.00 -16.50a)K+(N7)×××Adenine 26.62 --- ---b)K+(N7)×××A-T 27.73 34.80 -20.54c)Thymine×××K+(O4) --- 37.45 ---d)A-T×××K+(O4) 30.57 35.61 -17.80e)Thymine×××K+(O2) --- 31.70 ---f)A-T×××K+(O2) 32.33 31.86 -30.58aGeometriesoptimizedattheBLYP-D3(BJ)/TZ2Plevel.

ComputationalStudyofNuclearMagneticResonanceShieldingConstants
58
naturally in biological systems, in the minor and major grooves, which will have significant effects on the hydrogen-bond strengths and NMR shielding constants of the corresponding base pairs.
In this chapter, we have analyzed in detail the effect of neutral and ionic substituents at the adenine X8 and thymine/uracil Y6 positions on the hydrogen-bond strength, NMR chemical shielding and charge distributions within the DNA/RNA base pairs A-T and A-U. Our study at the BLYP-D3(BJ)/TZ2P level for geometry and energy show that in most cases the RNA base pair is slightly more strongly bound than the DNA base pair. Introducing substituents at the adenine X8 and thymine/uracil Y6 positions can lead to significant changes in the hydrogen bonding: from a destabilization by 1.3 kcal×mol-1 to a strong stabilization by 15.6 kcal×mol-1, depending on the nature and position of the substituent. The NMR shielding constants are likewise affected substantially: the NMR C2-adenine shielding shows changes within a range of 8 ppm decrease up to 24 ppm increase. Most importantly, these NMR shielding values merely probe the presence/absence of (electron-donating/withdrawing) substituents at adenine X8 and thymine/uracil Y6 positions. The substituents affect both NMR shielding constants and hydrogen-bond strengths. However, these are two independent and uncorrelated effects.
We have also investigated a biologically relevant situation where a partially dehydrated potassium cation binds to the DNA base. Also, in this case, the influence of the potassium cation on the hydrogen-bond strength does not correlate with the NMR shielding. Not surprisingly, the presence of a cationic species close to the DNA/RNA bases has a profound effect on their electronic structure, thus leading to significant changes in the hydrogen-bond strength and NMR shielding constants. These changes are observed irrespective of whether the cations are covalently (supramolecular switches) or weakly bonded (potassium cations).
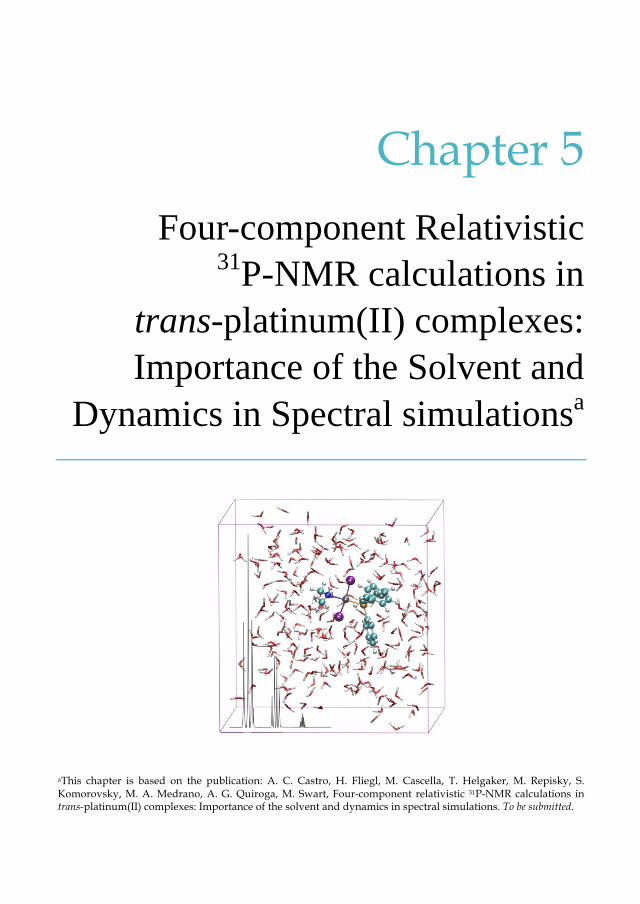
Chapter 5 Four-component Relativistic
31P-NMR calculations in trans-platinum(II) complexes: Importance of the Solvent and
Dynamics in Spectral simulationsa
aThis chapter is based on the publication: A. C. Castro, H. Fliegl, M. Cascella, T. Helgaker, M. Repisky, S. Komorovsky, M. A. Medrano, A. G. Quiroga, M. Swart, Four-component relativistic 31P-NMR calculations in trans-platinum(II) complexes: Importance of the solvent and dynamics in spectral simulations. To be submitted.
ComputationalStudyofNuclearMagneticResonanceShieldingConstants
60
SUMMARY
In this chapter, we have focused on the theoretical determination of the 31P-NMR chemical shifts of the trans-[PtCl2(dimethylamine)PPh3] complex and species derived from its hydrolysis, in an attempt to understand its mechanism of action as anticancer platinum drug.
The 31P-NMR chemical shifts were computed using ab-initio molecular dynamics simulations with DFT-NMR calculations on a large series of snapshots. Comparing with experimental spectra, we show the importance of relativistic effects, dynamics, and explicit solvation for the accurate modeling of the 31P-NMR chemical shifts.
EMBARGOED UNTIL PUBLICATION DATE
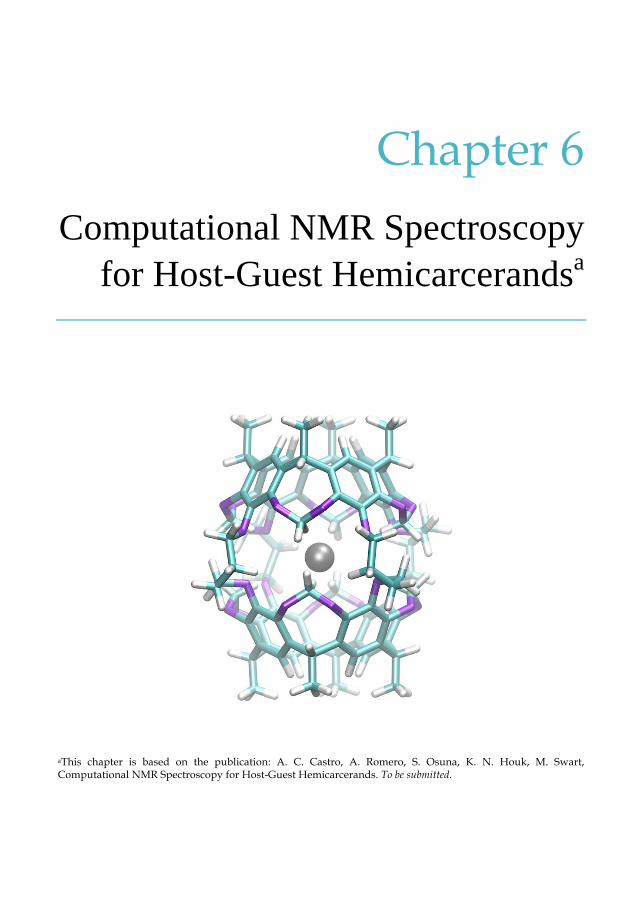
Chapter 6 Computational NMR Spectroscopy
for Host-Guest Hemicarcerandsa
aThis chapter is based on the publication: A. C. Castro, A. Romero, S. Osuna, K. N. Houk, M. Swart, Computational NMR Spectroscopy for Host-Guest Hemicarcerands. To be submitted.
ComputationalStudyofNuclearMagneticResonanceShieldingConstants
80
SUMMARY
In this chapter, the incarceration of o-benzyne and other 27 guest molecules within hemicarcerand 1, studied experimentally by Warmuth, and Cram and co-workers, respectively, has been studied via density functional theory (DFT). The possible incarceration of o-benzyne within a second hemicarcerand 2 as synthesized by Cram and co-workers has also been explored. Full structure optimization and determination of the 1H-NMR chemical shifts were performed. In addition, the rotational mobility and the conformational preference of the guest molecules inside the hemicarcerand structures were explored, providing intriguing correlations of the chemical shifts with structural parameters of the host-guest system. Our proton NMR chemical shifts at the KT2/ET-pVQZ level indicate in most of the cases a direct correlation between theoretical calculations and experimental measurements, and provide a new strategy to characterize these challenging host-guest complexes.
EMBARGOED UNTIL PUBLICATION DATE
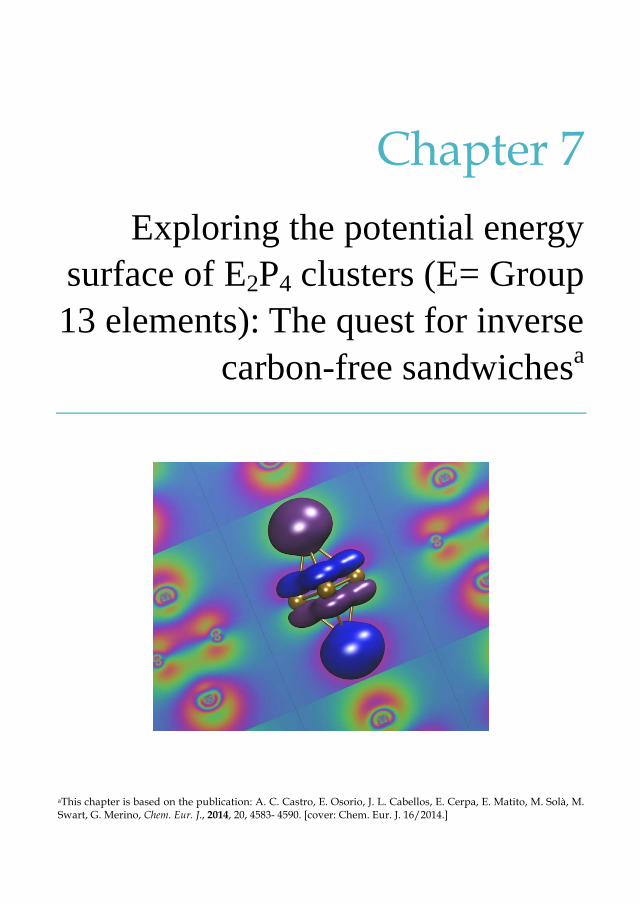
Chapter 7 Exploring the potential energy
surface of E2P4 clusters (E= Group 13 elements): The quest for inverse
carbon-free sandwichesa
aThis chapter is based on the publication: A. C. Castro, E. Osorio, J. L. Cabellos, E. Cerpa, E. Matito, M. Solà, M. Swart, G. Merino, Chem. Eur. J., 2014, 20, 4583- 4590. [cover: Chem. Eur. J. 16/2014.]
ComputationalStudyofNuclearMagneticResonanceShieldingConstants
98
SUMMARY
In this chapter, inverse carbon-free sandwich structures with formula E2P4 (E= Al, Ga, In, Tl) have been proposed as a promising new target in main-group chemistry. Our computational exploration of their corresponding potential-energy surfaces at the S12h/TZ2P level shows that indeed stable carbon-free inverse-sandwiches can be obtained if one chooses an appropriate Group 13 element for E. The boron analogue B2P4 does not form the D4h-symmetric inverse-sandwich structure, but instead prefers a D2d structure of two perpendicular BP2 units with the formation of a double B-B bond. For the other elements of Group 13, Al-Tl, the most favorable isomer is indeed the D4h inverse-sandwich structure. The preference for the D2d isomer for B2P4 and D4h for the heavier analogues has been rationalized in terms of an isomerization-energy decomposition analysis, and further corroborated by determination of aromaticity of these species. Additionally, the prediction of the 31P-NMR shielding constants was carried out for the most stable structures.
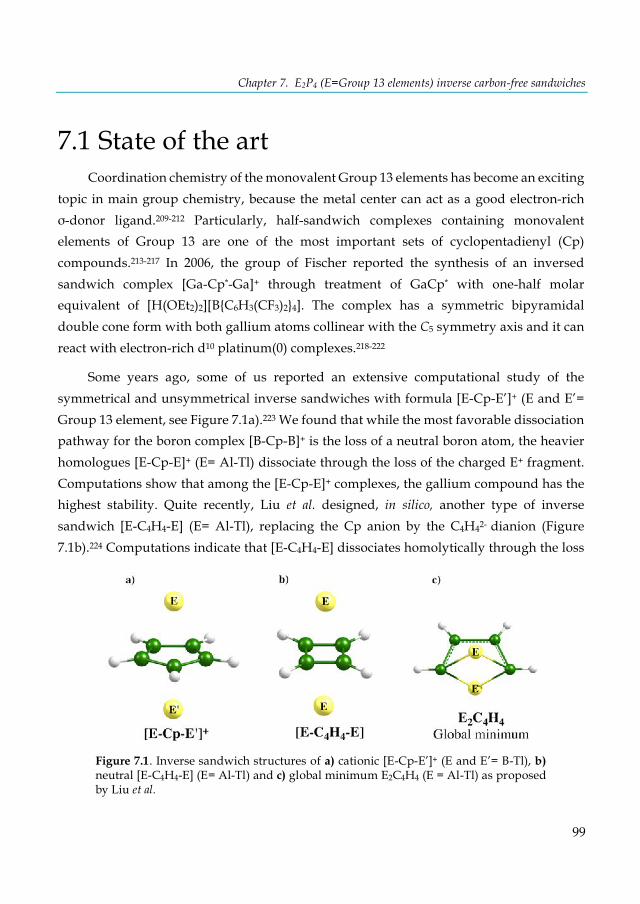
Chapter 7. E2P4 (E=Group 13 elements) inverse carbon-free sandwiches
99
7.1 State of the art Coordination chemistry of the monovalent Group 13 elements has become an exciting
topic in main group chemistry, because the metal center can act as a good electron-rich σ-donor ligand.209-212 Particularly, half-sandwich complexes containing monovalent elements of Group 13 are one of the most important sets of cyclopentadienyl (Cp) compounds.213-217 In 2006, the group of Fischer reported the synthesis of an inversed sandwich complex [Ga-Cp*-Ga]+ through treatment of GaCp* with one-half molar equivalent of [H(OEt2)2][B{C6H3(CF3)2}4]. The complex has a symmetric bipyramidal double cone form with both gallium atoms collinear with the C5 symmetry axis and it can react with electron-rich d10 platinum(0) complexes.218-222
Some years ago, some of us reported an extensive computational study of the symmetrical and unsymmetrical inverse sandwiches with formula [E-Cp-E’]+ (E and E’= Group 13 element, see Figure 7.1a).223 We found that while the most favorable dissociation pathway for the boron complex [B-Cp-B]+ is the loss of a neutral boron atom, the heavier homologues [E-Cp-E]+ (E= Al-Tl) dissociate through the loss of the charged E+ fragment. Computations show that among the [E-Cp-E]+ complexes, the gallium compound has the highest stability. Quite recently, Liu et al. designed, in silico, another type of inverse sandwich [E-C4H4-E] (E= Al-Tl), replacing the Cp anion by the C4H42- dianion (Figure 7.1b).224 Computations indicate that [E-C4H4-E] dissociates homolytically through the loss
Figure 7.1. Inverse sandwich structures of a) cationic [E-Cp-E’]+ (E and E’= B-Tl), b) neutral [E-C4H4-E] (E= Al-Tl) and c) global minimum E2C4H4 (E = Al-Tl) as proposed by Liu et al.
ComputationalStudyofNuclearMagneticResonanceShieldingConstants
100
of the neutral atom E with bond strengths following the trend Al > Ga > In > Tl. However, the inverse sandwich structure is only kinetically stable against isomerization, that is, the lowest-energy form is a bicyclic structure (see Figure 7.1c).
The question therefore arises if it is possible to stabilize these inverse sandwiches by using a carbon-free ligand. Baudler and Glinka suggested a diagonal relationship between carbon and phosphorus.225-228 This “carbon-like” aspect of phosphorus is evident in the analogies of hydrocarbons with polyphosphanes or polyphosphides. In this sense, it is not strange to see a connection between C4H42- and P42-. The cyclotetraphosphide P42- dianion and its derivatives have been subject to numerous experimental and theoretical studies.229 In 2003, Kraus et al. succeeded in isolating the compound Cs2P4×2NH3 that contains a square and perfectly planar 6π-aromatic P42- unit.229 Inspired by these findings, in this paper we have explored in detail the potential energy surfaces (PESs) of the E2P4 (E= Group 13 element) clusters using a modified Kick algorithm.230,231 We find that the stabilization of inverse sandwiches depends on the electronegativity and size of the Group 13 atoms. Our results show that while the most stable structure for B2P4 is the combination of two perpendicular BP2 triangles connected by a multiple B-B bond, the inverse D4h sandwich is the global minimum for E= Al, Ga, In, and Tl. Therefore, it is possible to stabilize a carbon-free inverse sandwich by selecting the appropriate Group 13 atoms. To understand the bonding in the E2P4 clusters, we performed an energy decomposition analysis (EDA)105,106,232,233 and an adaptive natural density partitioning (AdNDP) analysis.234 However, neither approach provides an explanation about the structural preferences. So, in order to understand why B2P4 chooses a D2d structure, an isomerization energy decomposition analysis (IEDA)235 was performed.
7.2 Computational Methods Our computational procedure utilized a modified Kick heuristic230,231 to explore in
detail the potential-energy surfaces (PESs) of the singlet and triplet states of the E2P4 clusters. The lowest-lying structures found within 20 kcal·mol-1 above the global minimum for the different Group 13 elements (at the PBE0/LANL2DZ level)132,236 were selected for re-optimization and frequency analysis with the Amsterdam Density Functional (ADF, version 2012.01)87,88 program using the S12h functional,98 which contains Grimme’s

Chapter 7. E2P4 (E=Group 13 elements) inverse carbon-free sandwiches
101
third-generation dispersion energy,90 in conjunction with uncontracted basis sets of Slater-type orbitals (STOs) of triple-ζ quality plus double polarization functions (TZ2P).96 The geometry optimizations and the vibrational frequency analysis of the optimized structures were carried out using the QUILD program98 that contains superior optimization routines based on adapted delocalized coordinates.237 For heavy atoms such as indium and thallium, scalar relativistic effects were considered using the zero-order regular approximation (ZORA).24,25,137-139
To gain more insight into the nature of the bonding in these clusters, an energy decomposition analysis (EDA)105,106,232,233 was performed as implemented in the ADF2012 package at the S12h/TZ2P level. In this study, the preparation energy, ∆#Z[MZ, is the energy needed to prepare the ionic fragments and consist of two principal terms. The first is the energy needed to deform the separate molecular fragments (in this case only for the P42- dianion) from their equilibrium structure to the geometry that they attain in the overall molecular system (∆#SMND[U), and the second (∆#Ï´Ï) is the (repulsive) interaction energy between the two E+ cations, which results from electrostatic repulsion between the positively charged E+ atoms, while making one fragment file that contains both (E···E)2+ atoms. Additional details of the EDA analysis can be consulted in Chapter 4, section 4.2.1.
The chemical bonding was also analyzed in terms of the adaptive natural density partitioning (AdNDP) method,234 recently developed and implemented by Zubarev and Boldyrev. The AdNDP approach leads to partitioning of the charge density into elements with the lowest possible number of atomic centers per electron pair: n-center-two-electron (nc-2e) bonds, including core electrons, lone-pairs, (2c-2e) bonds, and so on. If some part of the electron density cannot be localized in this way, it is represented by using completely delocalized objects, similar to canonical MOs, incorporating the idea of the completely delocalized bonding. AdNDP accepts only those bonding elements the occupation numbers (ON) of which exceed the specified threshold values, which are usually chosen to be close to 2.00|e|. However, the criterion for ONs can be adjusted for a particular case in the AdNDP procedure. When all the recovered (nc-2e) bonding elements are superimposed onto the molecular frame, the overall pattern always corresponds to the point group symmetry of the system. The AdNDP computations have been performed at the PBE0/LANL2DZ level.
ComputationalStudyofNuclearMagneticResonanceShieldingConstants
102
Aromaticity calculations using the INB multicenter index238 and electron delocalization analysis have been performed at the PBE0/def2-TZVP level. INB indices were computed by using a modified Becke-rho239 atomic partition240 and they were computed using APOST-3D241,242 and ESI-3D243,244 packages.
The prediction of the 31P-NMR shielding constants was carried out for the most stable isomers using the ADF program, version 2016.01, with the KT2 functional6 in conjunction with the even-temperate (ET) STO-type (ET-pVQZ)97 basis set. Scalar (SR) and spin-orbit (SO) relativistic effects were included at the two-component level using the ZORA approximation and all the shielding constants were calculated using the Gauge Including Atomic Orbital (GIAO) method245 to treat the gauge dependence problem.
7.3 Results and Discussion
7.3.1 Structures Figure 7.2 summarizes the different local minima found on the B2P4 PES. Our
computations reveal an ample diversity of structures within the range of 20 kcal·mol-1, with structure 1a being the most stable form. 1a can be described as two perpendicular BP2 triangles connected by a short B-B bond of 1.609 Å, which is similar to bond lengths characterized experimentally for B-B multiple bonds in some complexes.246 Indeed, the B=B double bond length in species [{(Et2O)Li}2{Mes2BB(Mes)Ph}]247 was found to be 1.636(11) Å, which is quite close to the bond length found for B2P4 and similar to other analogous structures containing B=B double bonds.248-250 The HOMOs are a degenerate pair of twisted , orbitals, indicating the presence of a multiple bond, which is weaker than that of the linear OC-BºB-CO complex, because the overlap is less effective (see Figure 7.3). The second low-lying isomer 1b is a C2v planar entity, which is in competition to 1a (it is only 0.5 kcal·mol-1 less stable than 1a). Note that all the B2P4 isomers found in the selected range retain the B-B bond with distances between triple (1.583 Å) and single bonds (1.839 Å). This suggests that in B2P4 clusters, the formation of the B-B bonds is a dominant factor in their stability. The inverse sandwich 1j is a transition state and is higher in energy than the global minimum by 109.6 kcal·mol-1. The triplet forms are not competitive; the most

Chapter 7. E2P4 (E=Group 13 elements) inverse carbon-free sandwiches
103
stable triplet is less stable than 1a by 63.7 kcal·mol-1.
The topology of the PES for the heavier analogues changes drastically (see Figure 7.4). For Al, Ga, In, and Tl, the lowest-lying isomer is a perfect D4h-symmetric inverse sandwich (2a). The P-P bond lengths (~2.155 Å) are only slightly longer than those found for the naked P42- dianion (2.142 Å),229 indicating that the presence of the Al+, Ga+, In+, or Tl+
Figure 7.3. Structure of [(HOMO)+(HOMO-1)] and [(HOMO)-(HOMO-1) of the B2P4 (D2d) cluster.
Figure 7.2. Lowest-lying structures of the B2P4 cluster computed at the S12h/TZ2P level. Relative energies are given in kcal·mol-1. In parentheses are the B-B bond lengths in Å. All structures are local minima on its corresponding PES, except 1j, which is a transition state.
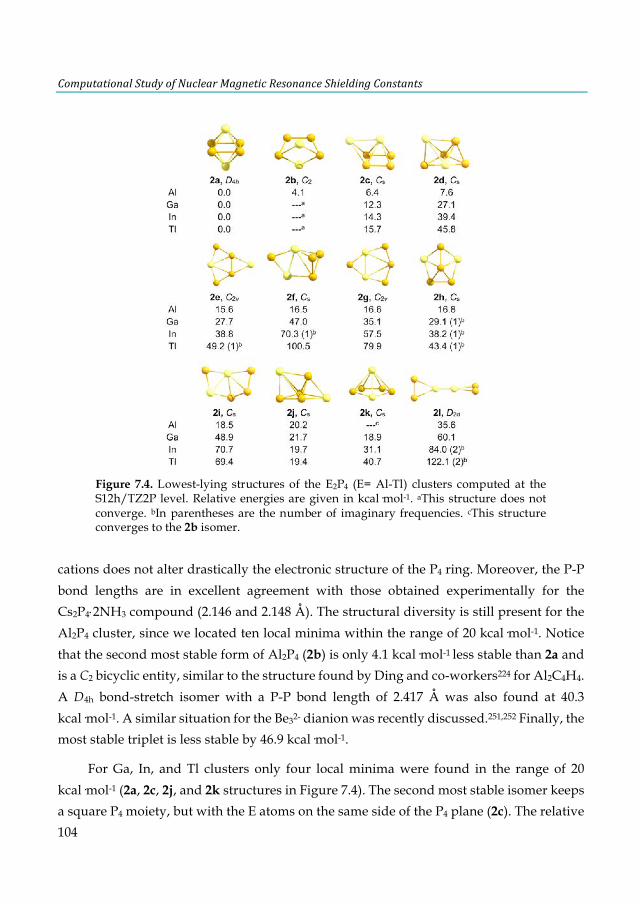
ComputationalStudyofNuclearMagneticResonanceShieldingConstants
104
cations does not alter drastically the electronic structure of the P4 ring. Moreover, the P-P bond lengths are in excellent agreement with those obtained experimentally for the Cs2P4×2NH3 compound (2.146 and 2.148 Å). The structural diversity is still present for the Al2P4 cluster, since we located ten local minima within the range of 20 kcal·mol-1. Notice that the second most stable form of Al2P4 (2b) is only 4.1 kcal·mol-1 less stable than 2a and is a C2 bicyclic entity, similar to the structure found by Ding and co-workers224 for Al2C4H4. A D4h bond-stretch isomer with a P-P bond length of 2.417 Å was also found at 40.3 kcal·mol-1. A similar situation for the Be32- dianion was recently discussed.251,252 Finally, the most stable triplet is less stable by 46.9 kcal·mol-1.
For Ga, In, and Tl clusters only four local minima were found in the range of 20 kcal·mol-1 (2a, 2c, 2j, and 2k structures in Figure 7.4). The second most stable isomer keeps a square P4 moiety, but with the E atoms on the same side of the P4 plane (2c). The relative
Figure 7.4. Lowest-lying structures of the E2P4 (E= Al-Tl) clusters computed at the S12h/TZ2P level. Relative energies are given in kcal·mol-1. aThis structure does not converge. bIn parentheses are the number of imaginary frequencies. cThis structure converges to the 2b isomer.
Chapter 7. E2P4 (E=Group 13 elements) inverse carbon-free sandwiches
105
energy between 2c and the global minimum increases down Group 13 from 6.4 (E= Al) to 15.7 kcal·mol-1 (E= Tl). In 2k, an E atom is inserted into the P42- fragment in order to form an almost flat pentagon, which interacts with the other E atom by means of its , system. Finally 2j, which is less stable than 2a by approximately 20 kcal·mol-1, contains a P4 butterfly rhombus. Note that the D2d arrangement (the most stable for E= B) is only a non-competitive local minima for Al and Ga and a stationary point of order two for In and Tl. The most stable triplet forms are less stable than 3a by 67.8 (Ga), 70.3 (In), and 70.5 kcal·mol-1 (Tl).
P4, called white phosphorus, exists as tetrahedral molecule and is one of the allotropes of phosphorus. Let us consider the formation of the title complexes by means of the hypothetical reaction Ei + P†(ÜŸ) → EiP†. While B2 is a triplet, the rest of the diatomic E2 (E= Al-Tl) molecules are singlets. The energies for the reaction Ei + P† → EiP† obtained at the S12h/TZ2P level (including the ZPE correction) are -159.6 (B), -72.7 (Al), -68.3 (Ga), -58.5 (In), and -54.5 kcal·mol-1 (Tl). So, clearly, the formation of the title complexes by means of the suggested reaction is thermodynamically favorable.
7.3.2 Adaptive natural density partitioning analysis According to the AdNDP analysis (see Figure 7.5), in all the D4h E2P4 clusters (E=
Al-Tl), the bonding framework consists of four (2c-2e) P-P bonds with the occupation number of 1.99|e| (except for the boron cluster, in which the occupation number is 1.88|e|) and three delocalized (6c-2e) , bonds, closely resembling benzene , MOs. Additionally, six lone pairs, four of them located on the P atoms and the other two on the E atoms, indicate that the E atoms can act as donor Lewis bases. Only small differences on the occupation number is noted between the boron and the rest of the Group 13 clusters. One would expect that the D4h form of E2P4, even for boron, should be one of the most stable structures. Aromaticity of the planar P42- fragment is a strong argument in favor of this assumption. However, aromaticity, in some cases, is not enough to preserve the symmetry of a molecule. The question that still remains is why boron prefers a different structure than the inverse sandwiches, even though for the inverse sandwich structures the strongest interaction energy is obtained in fact for boron (see Table 7.1).
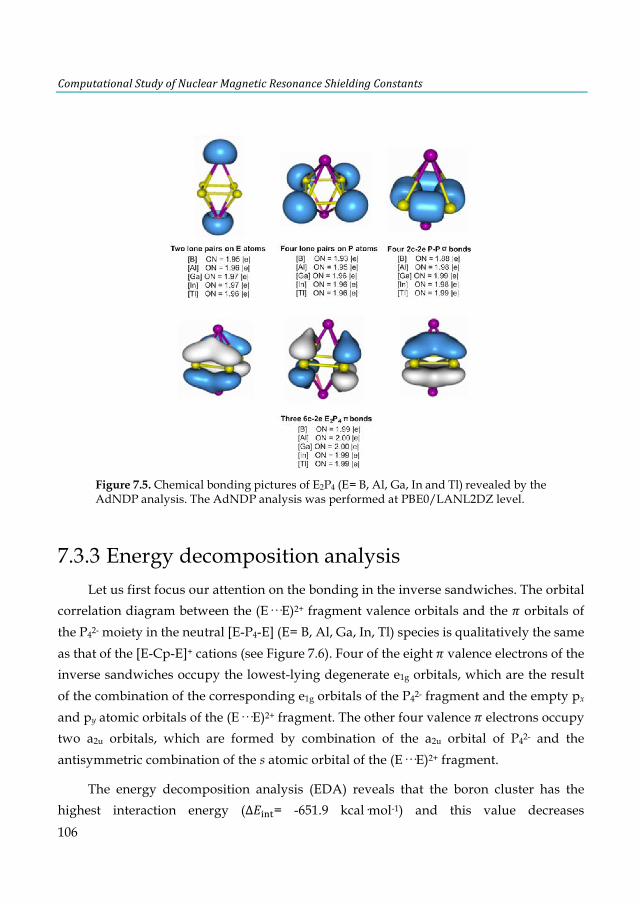
ComputationalStudyofNuclearMagneticResonanceShieldingConstants
106
7.3.3 Energy decomposition analysis Let us first focus our attention on the bonding in the inverse sandwiches. The orbital
correlation diagram between the (E···E)2+ fragment valence orbitals and the , orbitals of the P42- moiety in the neutral [E-P4-E] (E= B, Al, Ga, In, Tl) species is qualitatively the same as that of the [E-Cp-E]+ cations (see Figure 7.6). Four of the eight , valence electrons of the inverse sandwiches occupy the lowest-lying degenerate e1g orbitals, which are the result of the combination of the corresponding e1g orbitals of the P42- fragment and the empty px and py atomic orbitals of the (E···E)2+ fragment. The other four valence , electrons occupy two a2u orbitals, which are formed by combination of the a2u orbital of P42- and the antisymmetric combination of the s atomic orbital of the (E···E)2+ fragment.
The energy decomposition analysis (EDA) reveals that the boron cluster has the highest interaction energy (∆#BWX= -651.9 kcal·mol-1) and this value decreases
Figure 7.5. Chemical bonding pictures of E2P4 (E= B, Al, Ga, In and Tl) revealed by the AdNDP analysis. The AdNDP analysis was performed at PBE0/LANL2DZ level.
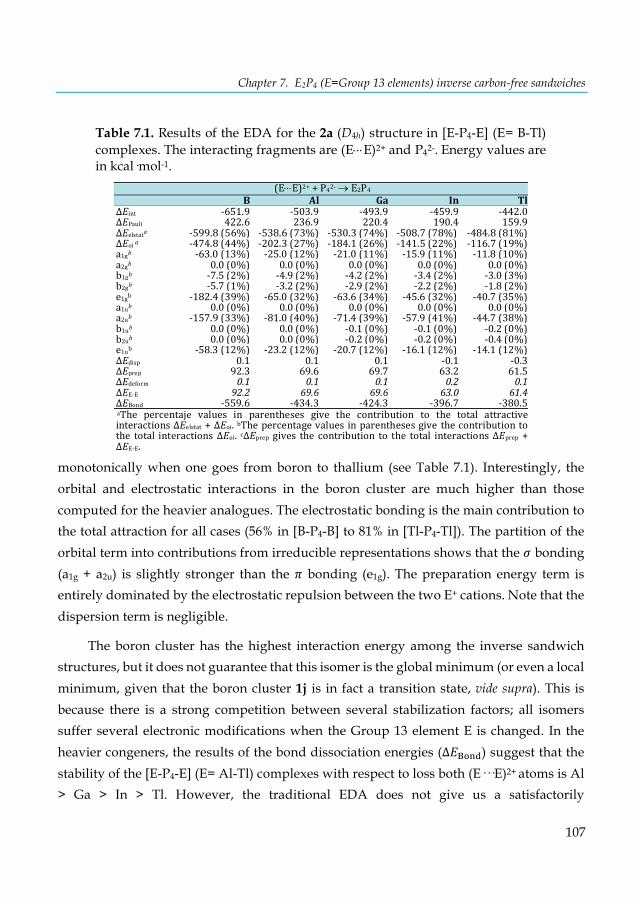
Chapter 7. E2P4 (E=Group 13 elements) inverse carbon-free sandwiches
107
monotonically when one goes from boron to thallium (see Table 7.1). Interestingly, the orbital and electrostatic interactions in the boron cluster are much higher than those computed for the heavier analogues. The electrostatic bonding is the main contribution to the total attraction for all cases (56% in [B-P4-B] to 81% in [Tl-P4-Tl]). The partition of the orbital term into contributions from irreducible representations shows that the A bonding (a1g + a2u) is slightly stronger than the , bonding (e1g). The preparation energy term is entirely dominated by the electrostatic repulsion between the two E+ cations. Note that the dispersion term is negligible.
The boron cluster has the highest interaction energy among the inverse sandwich structures, but it does not guarantee that this isomer is the global minimum (or even a local minimum, given that the boron cluster 1j is in fact a transition state, vide supra). This is because there is a strong competition between several stabilization factors; all isomers suffer several electronic modifications when the Group 13 element E is changed. In the heavier congeners, the results of the bond dissociation energies (∆#ÓDWS) suggest that the stability of the [E-P4-E] (E= Al-Tl) complexes with respect to loss both (E···E)2+ atoms is Al > Ga > In > Tl. However, the traditional EDA does not give us a satisfactorily
Table 7.1. Results of the EDA for the 2a (D4h) structure in [E-P4-E] (E= B-Tl) complexes. The interacting fragments are (E×××E)2+ and P42-. Energy values are in kcal·mol-1.
(E×××E)2++P42-®E2P4 B Al Ga In Tl
ΔEint -651.9 -503.9 -493.9 -459.9 -442.0ΔEPauli 422.6 236.9 220.4 190.4 159.9ΔEelstata -599.8(56%) -538.6(73%) -530.3(74%) -508.7(78%) -484.8(81%)ΔEoia -474.8(44%) -202.3(27%) -184.1(26%) -141.5(22%) -116.7(19%)a1gb -63.0(13%) -25.0(12%) -21.0(11%) -15.9(11%) -11.8(10%)a2gb 0.0(0%) 0.0(0%) 0.0(0%) 0.0(0%) 0.0(0%)b1gb -7.5(2%) -4.9(2%) -4.2(2%) -3.4(2%) -3.0(3%)b2gb -5.7(1%) -3.2(2%) -2.9(2%) -2.2(2%) -1.8(2%)e1gb -182.4(39%) -65.0(32%) -63.6(34%) -45.6(32%) -40.7(35%)a1ub 0.0(0%) 0.0(0%) 0.0(0%) 0.0(0%) 0.0(0%)a2ub -157.9(33%) -81.0(40%) -71.4(39%) -57.9(41%) -44.7(38%)b1ub 0.0(0%) 0.0(0%) -0.1(0%) -0.1(0%) -0.2(0%)b2ub 0.0(0%) 0.0(0%) -0.2(0%) -0.2(0%) -0.4(0%)e1ub -58.3(12%) -23.2(12%) -20.7(12%) -16.1(12%) -14.1(12%)ΔEdisp 0.1 0.1 0.1 -0.1 -0.3ΔEprep 92.3 69.6 69.7 63.2 61.5ΔEdeform 0.1 0.1 0.1 0.2 0.1ΔEE-E 92.2 69.6 69.6 63.0 61.4ΔEBond -559.6 -434.3 -424.3 -396.7 -380.5aThe percentaje values in parentheses give the contribution to the total attractiveinteractionsΔEelstat+ΔEoi.bThepercentagevalues inparenthesesgive thecontributiontothe total interactionsΔEoi. cΔEprepgives thecontribution to the total interactionsΔEprep +ΔEE-E.
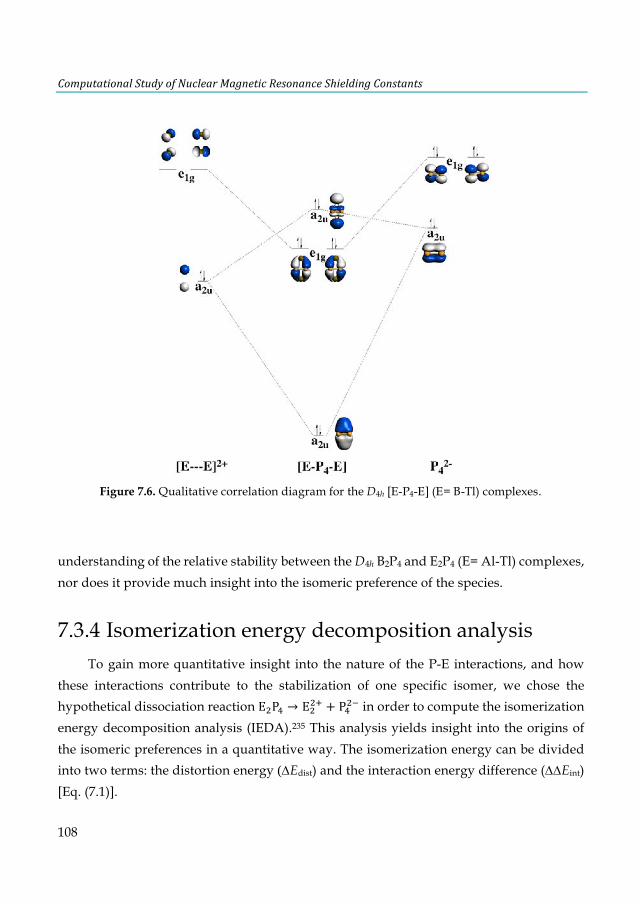
ComputationalStudyofNuclearMagneticResonanceShieldingConstants
108
understanding of the relative stability between the D4h B2P4 and E2P4 (E= Al-Tl) complexes, nor does it provide much insight into the isomeric preference of the species.
7.3.4 Isomerization energy decomposition analysis To gain more quantitative insight into the nature of the P-E interactions, and how
these interactions contribute to the stabilization of one specific isomer, we chose the hypothetical dissociation reaction EiP† → EiiÔ + P†i´ in order to compute the isomerization energy decomposition analysis (IEDA).235 This analysis yields insight into the origins of the isomeric preferences in a quantitative way. The isomerization energy can be divided into two terms: the distortion energy (DEdist) and the interaction energy difference (DDEint) [Eq. (7.1)].
Figure 7.6. Qualitative correlation diagram for the D4h [E-P4-E] (E= B-Tl) complexes.
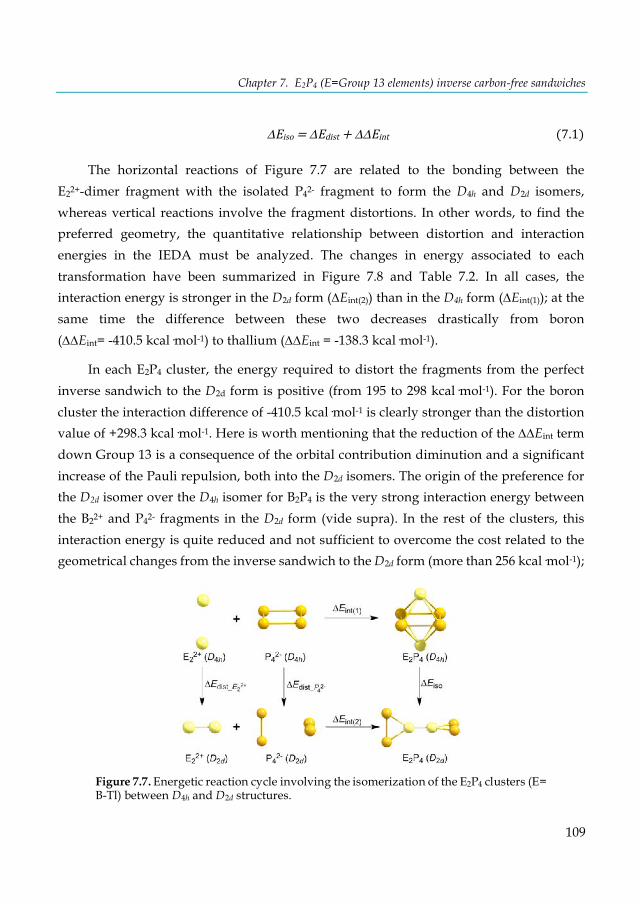
Chapter 7. E2P4 (E=Group 13 elements) inverse carbon-free sandwiches
109
DEiso=DEdist+DDEint(7.1)
The horizontal reactions of Figure 7.7 are related to the bonding between the E22+-dimer fragment with the isolated P42- fragment to form the D4h and D2d isomers, whereas vertical reactions involve the fragment distortions. In other words, to find the preferred geometry, the quantitative relationship between distortion and interaction energies in the IEDA must be analyzed. The changes in energy associated to each transformation have been summarized in Figure 7.8 and Table 7.2. In all cases, the interaction energy is stronger in the D2d form (DEint(2)) than in the D4h form (DEint(1)); at the same time the difference between these two decreases drastically from boron (DDEint= -410.5 kcal·mol-1) to thallium (DDEint = -138.3 kcal·mol-1).
In each E2P4 cluster, the energy required to distort the fragments from the perfect inverse sandwich to the D2d form is positive (from 195 to 298 kcal·mol-1). For the boron cluster the interaction difference of -410.5 kcal·mol-1 is clearly stronger than the distortion value of +298.3 kcal·mol-1. Here is worth mentioning that the reduction of the DDEint term down Group 13 is a consequence of the orbital contribution diminution and a significant increase of the Pauli repulsion, both into the D2d isomers. The origin of the preference for the D2d isomer over the D4h isomer for B2P4 is the very strong interaction energy between the B22+ and P42- fragments in the D2d form (vide supra). In the rest of the clusters, this interaction energy is quite reduced and not sufficient to overcome the cost related to the geometrical changes from the inverse sandwich to the D2d form (more than 256 kcal·mol-1);
Figure 7.7. Energetic reaction cycle involving the isomerization of the E2P4 clusters (E= B-Tl) between D4h and D2d structures.
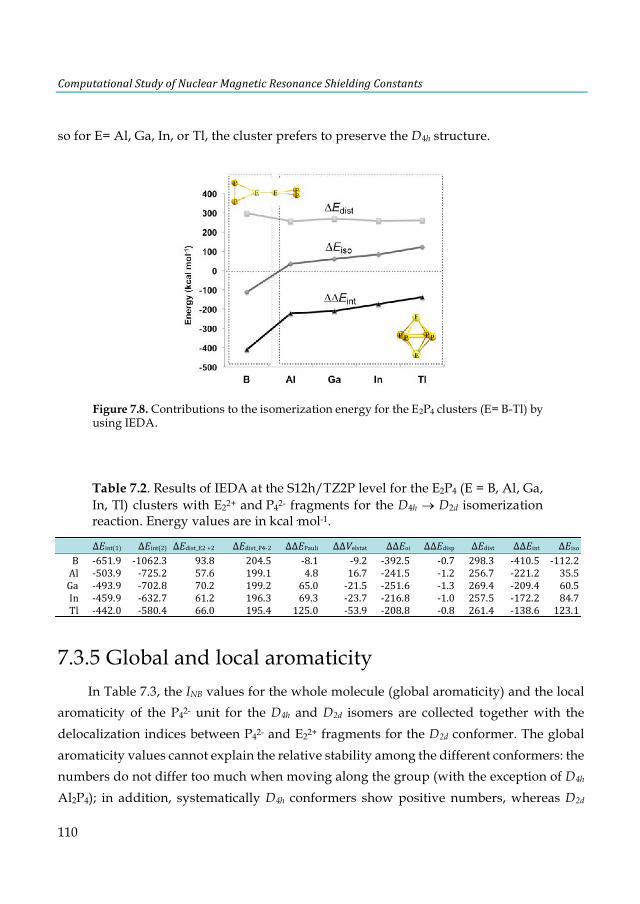
ComputationalStudyofNuclearMagneticResonanceShieldingConstants
110
so for E= Al, Ga, In, or Tl, the cluster prefers to preserve the D4h structure.
7.3.5 Global and local aromaticity In Table 7.3, the INB values for the whole molecule (global aromaticity) and the local
aromaticity of the P42- unit for the D4h and D2d isomers are collected together with the delocalization indices between P42- and E22+ fragments for the D2d conformer. The global aromaticity values cannot explain the relative stability among the different conformers: the numbers do not differ too much when moving along the group (with the exception of D4h Al2P4); in addition, systematically D4h conformers show positive numbers, whereas D2d
Figure 7.8. Contributions to the isomerization energy for the E2P4 clusters (E= B-Tl) by using IEDA.
Table 7.2. Results of IEDA at the S12h/TZ2P level for the E2P4 (E = B, Al, Ga, In, Tl) clusters with E22+ and P42- fragments for the D4h ® D2d isomerization reaction. Energy values are in kcal·mol-1.
ΔEint(1) ΔEint(2) ΔEdist_E2+2 ΔEdist_P4-2 ΔΔEPauli ΔΔVelstat ΔΔEoi ΔΔEdisp ΔEdist ΔΔEint ΔEisoB -651.9 -1062.3 93.8 204.5 -8.1 -9.2 -392.5 -0.7 298.3 -410.5 -112.2Al -503.9 -725.2 57.6 199.1 4.8 16.7 -241.5 -1.2 256.7 -221.2 35.5Ga -493.9 -702.8 70.2 199.2 65.0 -21.5 -251.6 -1.3 269.4 -209.4 60.5In -459.9 -632.7 61.2 196.3 69.3 -23.7 -216.8 -1.0 257.5 -172.2 84.7Tl -442.0 -580.4 66.0 195.4 125.0 -53.9 -208.8 -0.8 261.4 -138.6 123.1
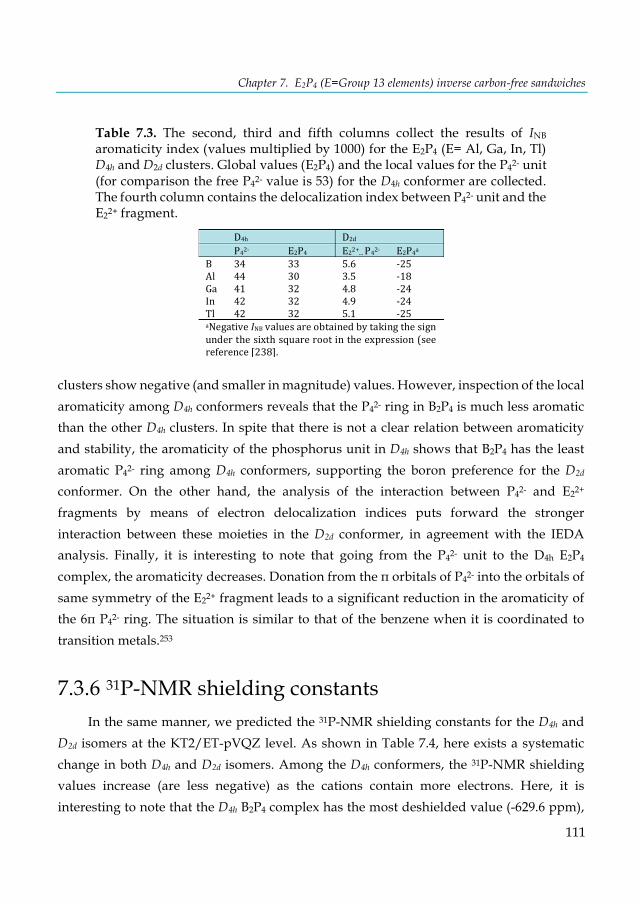
Chapter 7. E2P4 (E=Group 13 elements) inverse carbon-free sandwiches
111
clusters show negative (and smaller in magnitude) values. However, inspection of the local aromaticity among D4h conformers reveals that the P42- ring in B2P4 is much less aromatic than the other D4h clusters. In spite that there is not a clear relation between aromaticity and stability, the aromaticity of the phosphorus unit in D4h shows that B2P4 has the least aromatic P42- ring among D4h conformers, supporting the boron preference for the D2d conformer. On the other hand, the analysis of the interaction between P42- and E22+ fragments by means of electron delocalization indices puts forward the stronger interaction between these moieties in the D2d conformer, in agreement with the IEDA analysis. Finally, it is interesting to note that going from the P42- unit to the D4h E2P4 complex, the aromaticity decreases. Donation from the π orbitals of P42- into the orbitals of same symmetry of the E22+ fragment leads to a significant reduction in the aromaticity of the 6π P42- ring. The situation is similar to that of the benzene when it is coordinated to transition metals.253
7.3.6 31P-NMR shielding constants In the same manner, we predicted the 31P-NMR shielding constants for the D4h and
D2d isomers at the KT2/ET-pVQZ level. As shown in Table 7.4, here exists a systematic change in both D4h and D2d isomers. Among the D4h conformers, the 31P-NMR shielding values increase (are less negative) as the cations contain more electrons. Here, it is interesting to note that the D4h B2P4 complex has the most deshielded value (-629.6 ppm),
Table 7.3. The second, third and fifth columns collect the results of INB aromaticity index (values multiplied by 1000) for the E2P4 (E= Al, Ga, In, Tl) D4h and D2d clusters. Global values (E2P4) and the local values for the P42- unit (for comparison the free P42- value is 53) for the D4h conformer are collected. The fourth column contains the delocalization index between P42- unit and the E22+ fragment.
D4h D2d P42- E2P4 E22+...P42- E2P4aB 34 33 5.6 -25Al 44 30 3.5 -18Ga 41 32 4.8 -24In 42 32 4.9 -24Tl 42 32 5.1 -25aNegativeINBvaluesareobtainedbytakingthesignunderthesixthsquarerootintheexpression(seereference[238].

ComputationalStudyofNuclearMagneticResonanceShieldingConstants
112
supporting the aromaticity study that shows that the B2P4 has the least aromatic P42- ring. In contrast, the D2d isomers follow the opposite trend and the 31P shielding values decrease from boron to thallium. Therefore, the 31P-NMR shielding constants are sensitive to changes in the modifying cations and these results can be useful in future experimental studies to identify the presence of these clusters and their geometrical structure.
In this chapter, we have computationally explored the possibility of formation of inverse carbon-free sandwiches for clusters of type E2P4, with Group 13 elements B-Tl. This proposition is based on consideration of the aromaticity of the square-planar P42- unit, which should favor the formation of the cluster with a proper choice of the E+ cations. Our studies, including an energy decomposition analysis, indicate that the interaction energy between the E22+ and P42- fragments is largest for E= B, and substantially reduced for E= Al-Tl. Nevertheless, the boron cluster is the only one for which the D4h symmetric inverse sandwich is not the most favored isomer. Instead, it prefers to form a D2d-symmetric structure of two perpendicular BP2 units, which includes a multiple B-B bond. For the other elements (Al-Tl), the inverse sandwich isomer is indeed the most favored one, and becomes even more so when decreasing down the periodic table.
The peculiar behavior of boron cluster was understood by performing an isomerization energy decomposition analysis, which showed that the preference for the perpendicular D2d isomer results directly from the interaction energy. For the boron cluster, the change in interaction energy when going from the D4h to the D2d isomer is more than sufficient to overcome the energetic cost that this change in geometry brings with it; for the other elements, the increase in interaction energy is insufficient and hence the D4h isomer remains preferred. Moreover, the aromaticity analysis of these species and the delocalization between the fragments corroborate these trends. Additionally, the 31P-NMR shielding constants have been predicted for the E2P4 cluster, in both D4h and D2d conformations, in order to support future experimental analysis.
Table 7.4. 31P-NMR shielding values (ppm) computed at the KT2/ET-pVQZ level for the D4h and D2d isomers of the E2P4 clusters.
D4h D
2d
B -629.6 -385.6Al -161.6 -857.8Ga -134.1 -863.8In -69.4 -1060.6Tl -45.4 -1269.3

Chapter 8 General Conclusions
Even though NMR spectroscopy is already extremely useful as analytical tool, it can benefit substantially from quantum-chemical calculations. The theoretical analysis of NMR properties, and in particular the calculation of chemical shift constants, can help to predict, confirm or establish the observed signals and provide a basis for spectral assignments and structure elucidation.
As this thesis has attempted to illustrate, a direct correlation between experimental and computed NMR data may be achieve if the modeling of the electronic structure is accurately described. However, the quality of the computed NMR chemical shifts depends on several factors and no simple protocol can be established for such studies. Several methodological issues such as the level of theory, basis set, effects of the environment, choice of the reference molecule, and relativistic effects are of crucial importance and the main factors that influence the quality of calculated data.
The challenging systems proposed in this thesis allowed us to gain a better understanding by accurately taking into consideration different strategies and procedures for the calculation of the NMR chemical shifts. Thus, depending on the target compounds, the main conclusions can be divided in four sections:
1) The first study of supramolecular complexes based on A-T and A-U base pairs showed us how the prediction of 13C-NMR shielding constants can be very useful for examining the influence of substituents and chemical environment on NMR shielding constants. Experimental evidence that support the idea of a correlation between the Watson-Crick hydrogen-bond strength and the NMR shielding of C2-adenine has been refuted, proving that such an approach may yield the right
ComputationalStudyofNuclearMagneticResonanceShieldingConstants
114
answer for the wrong reason.
2) From the second study of trans-platinum(II) complexes, where there are strong interactions between the solvent and the platinum complex, the use of ab-initio dynamic simulations is fundamental for the calculation of 31P-NMR chemical shifts. Moreover, as the complexes contain heavy elements, a relativistic treatment was required and both scalar and spin-orbit relativistic effects need to be considered. In this case, the currently offered standard quantum chemical methods are not sufficient and a much higher accuracy of the computations is required.
3) Regarding the Host-Guest Hemicarcerands studied in Chapter 6, the 1H-NMR chemical shifts calculations provided a direct correlation between theoretical and experimental measurements. Particularly for these large systems, DFT approaches are probably the only means available to obtain reasonably accurate results.
4) The novel E2P4 clusters (E= Group 13 elements), with a stable D4h symmetric inverse-sandwich structure, have been proposed as a promising new target in main-group chemistry. The preference for the D2d isomer for B2P4 and D4h for the heavier analogues has been rationalized in terms of an isomerization- energy decomposition analysis and determination of aromaticity. As an additional tool for structural elucidation of these novel clusters, the 31P-NMR shielding constants were predicted for the most stable structures.
As shown in this thesis, it seems that with some care the NMR chemical shifts can be accurately computed in most types of environment. However, some questions are still left to be answered concerning the scopes and limitations of the methodologies, in particular for practical applications where there should be some compromise between the cost and the quality.
References
(1) M. Lewitt, Spin dynamics- Basics of nuclear magnetic resonance, Wiley: Chichester, England, 2001. (2) M. Bühl, T. van Mourik, Wiley Interdisciplinary Reviews: Computational Molecular Science, 2011, 1, 634. (3) M. Kaupp, M. Bühl, V. G. Malkin, eds., Calculation of NMR and EPR Parameters. Theory and Applications,
Weinheim: Wiley-VCH, 2004. (4) A. A. Auer, J. Gauss, J. F. Stanton, J. Chem. Phys., 2003, 118, 10407. (5) M. J. Allen, T. W. Keal, D. J. Tozer, Chem. Phys. Lett., 2003, 380, 70. (6) T. W. Keal, D. J. Tozer, J. Chem. Phys., 2003, 119, 3015. (7) J. Poater, E. v. Lenthe, E. J. Baerends, J. Chem. Phys., 2003, 118, 8584. (8) M. Swart, C. Fonseca Guerra, F. M. Bickelhaupt, J. Am. Chem. Soc., 2004, 126, 16718. (9) G. Magyarfalvi, P. Pulay, J. Chem. Phys., 2003, 119, 1350. (10) Y. Zhao, D. G. Truhlar, J. Phys. Chem. A, 2008, 112, 6794. (11) L. Armangué, M. Solà, M. Swart, J. Phys. Chem. A, 2011, 115, 1250. (12) Y. Zhang, A. Wu, X. Xu, Y. Yan, Chem. Phys. Lett., 2006, 421, 383. (13) A. Wu, Y. Zhang, X. Xu, Y. Yan, J. Comput. Chem., 2007, 28, 2431. (14) D. J. Searles, H. Huber, Molecular Dynamics and NMR Parameter Calculations, M. Kaupp, M. Bühl, V. G.
Malkin, eds. Calculation of NMR Parameters. Weinheim: Wiley-VCH, 2004, chapter 11, 175-189. (15) T. A. Ruden, K. Ruud, Ro-vibrational corrections to NMR parameters, In: M. Kaupp, M. Bühl, V. G. Malkin,
eds. Calculation of NMR parameters. Weinheim: Wiley-VCH, chapter 10, 1753-173, 2004. (16) S. Grigoleit, M. Bühl, Chem. Eur. J., 2004, 10, 5541. (17) I. Ciofini, Use of continuum solvent models in magnetic resonance parameter calculation, In: M. Kaupp, M. Bühl,
V. G. Malkin, eds. Calculation of NMR parameters. Weinheim: Wiley-VCH, chapter 12, 191-208, 2004. (18) M. Jaszuński, K. V. Mikkelsen, A. Rizzo, M. Witanowski, J. Phys. Chem. A, 2000, 104, 1466. (19) M. N. Manalo, A. C. de Dios, R. Cammi, J. Phys. Chem. A, 2000, 104, 9600. (20) B. Mennucci, J. M. Martínez, J. Tomasi, J. Phys. Chem. A, 2001, 105, 7287. (21) J. Kongsted, K. Ruud, Chem. Phys. Lett., 2008, 451, 226. (22) J. Autschbach In Encyclopedia of Analytical Chemistry; John Wiley & Sons, Ltd: 2006. (23) J. Autschbach, S. Zheng, Annu. Rep. NMR Spectrosc., 2009, 67, 1. (24) E. van Lenthe, E. J. Baerends, J. G. Snijders, J. Chem. Phys., 1993, 99, 4597. (25) E. van Lenthe, J. G. Snijders, E. J. Baerends, J. Chem. Phys., 1996, 105, 6505. (26) S. K. Wolff, T. Ziegler, E. van Lenthe, E. J. Baerends, J. Chem. Phys., 1999, 110, 7689. (27) J. Autschbach, T. Ziegler, Relativistic Computation of NMR Shieldings and Spin-Spin Coupling Constants, In
Encyclopedia of Nuclear Magnetic Resonance, Vol. 9, D. M. Grant, R. K. Harris, Eds., John Wiley & Sons: Chichester, U. K., 2002.
(28) M. Bühl, F. T. Mauschick, F. Terstegen, B. Wrackmeyer, Angew. Chem. Int. Ed., 2002, 41, 2312. (29) M. Buhl, F. T. Mauschick, Phys. Chem. Chem. Phys., 2002, 4, 5508. (30) M. Bühl, J. Phys. Chem. A, 2002, 106, 10505.
ComputationalStudyofNuclearMagneticResonanceShieldingConstants
116
(31) M. Bühl, R. Schurhammer, P. Imhof, J. Am. Chem. Soc., 2004, 126, 3310. (32) M. Bühl, S. Grigoleit, H. Kabrede, F. T. Mauschick, Chem. Eur. J., 2006, 12, 477. (33) M. Sterzel, J. Autschbach, Inorg. Chem., 2006, 45, 3316. (34) M. Bühl, Annu. Rep. NMR Spectrosc., 2008, 64, 77. (35) J. Autschbach, Calculation of heavy-nucleus chemical shifts: Relativistic all-electron methods, In: M. Kaupp, M.
Bühl, V. G. Malkin, eds. Calculation of NMR parameters. Weinheim: Wiley-VCH, chapter 14, 227-247, 2004.
(36) M. Bühl, NMR of transition metal compounds, In: M. Kaupp, M. Bühl, V. G. Malkin, eds. Calculation of NMR parameters. Weinheim: Wiley-VCH, 421-431, 2004.
(37) P. Hohenberg, W. Kohn, Phys. Rev., 1964, 136, B864. (38) A. Szabo, N. S. Ostlund, Modern Quantum Chemistry, MacMillian, New York, 1982. (39) R. G. Parr, W. Yang, Density Functional Theory of Atoms and Molecules, Oxford University Press, New York,
1989. (40) W. Koch, M. C. Holthausen, A Chemist's Guide to Density Functional Theory, Wiley-VCH, Weinheim, 2000. (41) D. R. Hartree, Math. Proc. Cambr. Phil. Soc., 2008, 24, 89. (42) V. Fock, Z. Phys., 1930, 61, 126. (43) L. H. Thomas, Math. Proc. Cambr. Phil. Soc., 2008, 23, 542. (44) E. Fermi, Rend. Accad. Lincei, 1927, 6, 602. (45) P. A. M. Dirac, Math. Proc. Cambr. Phil. Soc., 2008, 26, 376. (46) W. Kohn, L. J. Sham, Phys. Rev., 1965, 140, A1133. (47) J. C. Slater, Phys. Rev., 1951, 81, 385. (48) A. K. Rajagopal, K. Callaway, Phys. Rev., 1973, B 7, 1912. (49) K. G. Dyall, K. Faegri, Introduction to Relativistic Quantum Chemistry, Oxford University Press, 2007. (50) M. Reiher, A. Wolf, Relativistic Quantum Chemistry, Wiley, Weinheim, 2008. (51) P. A. M. Dirac, Proc. Roy. Soc. (London), 1928, A 117, 610. (52) N. F. Ramsey, Phys. Rev., 1950, 78, 695. (53) V. G. Malkin, O. L. Malkina, L. A. Eriksson, D. R. Salahub, Modern Density Functional Theory, Theoretical
and Computational Chemistry, J. M. Seminario, P. Politzer, eds., Elsevier Science: New York, Vol. 2, p. 273, 1995.
(54) G. Vignale, M. Rasolt, D. J. W. Geldart, Adv. Quantum Chem., 1990, 21, 235. (55) C. van Wüllen, J. Chem. Phys., 1995, 102, 2806. (56) A. M. Lee, N. C. Handy, S. M. Colwell, The Journal of Chemical Physics, 1995, 103, 10095. (57) A. M. Lee, N. C. Handy, S. M. Colwell, J. Chem. Phys., 1995, 103, 10095. (58) T. Helgaker, M. Jaszuński, K. Ruud, Chem. Rev., 1999, 99, 293. (59) J. M. Haile, Molecular Dynamics Simulations, Wiley, 1991. (60) M. P. Allan, D. J. Tildesley, Computer Simulations of Liquids, Clarendon Press, Oxford, 1987. (61) F. Jensen, Introduction to Computational Chemistry- 2nd ed., John Wiley & Sons Ltd, England, 2007. (62) D. Frenkel, B. Smith, Understanding Molecular Simulations, 2nd edition, Academic Press, 2002. (63) C. J. Cramer, D. G. Truhlar, Solvent Effects and Chemical Reactivity, O. Tapia, J. Beltran eds., Kluwer,
Dordrecht, 1996. (64) J. L. Rivail, D. Rinaldi, Computational Chemistry, Review of Current Trends, J. Leszczynki ed., World
Scientific, New York, p. 139, 1995. (65) C. J. Cramer, Essentials of Computational Chemistry- Theories and Models, John Wiley & Sons, Ltd, England,
References
117
2004. (66) L. Piela, Ideas of Quantum Chemistry, Elsevier Science, 2006. (67) A. R. Leach, Molecular Modelling. Principles and Applications, Longman, 1996. (68) M. P. Allen, D. J. Tildesley, Computer Simulations of Liquids, Oxford Science Publications, Clarendon Press,
Oxford, 1987. (69) G. A. Jeffrey, W. Saenger, Hydrogen Bonding in Biological Structures, Springer-Verlag: Berlin, New York,
Heidelberg, 1991. (70) G. A. Jeffrey, An Introduction to Hydrogen bonding, Oxford University Press: New York, Oxford, Chapter
10, 1997. (71) W. Saenger, Principles of Nucleic Acid Structure, Springer- Verlag: New York, Berlin, Heidelberg, Tokio,
1984. (72) J. D. Watson, F. H. C. Crick, Nature, 1953, 171, 737. (73) R. Franklin, R. G. Gosling, Nature, 1953, 171, 740. (74) J. Poater, M. Swart, C. Fonseca Guerra, F. M. Bickelhaupt, Comp. Theor. Chem., 2012, 998, 57. (75) P. Acharya, P. Cheruku, S. Chatterjee, S. Acharya, J. Chattopadhyaya, J. Am. Chem. Soc., 2004, 126, 2862. (76) I. Vakonakis, A. C. LiWang, J. Am. Chem. Soc., 2004, 126, 5688. (77) Y.-I. Kim, M. N. Manalo, L. M. Peréz, A. LiWang, J. Biomol. NMR, 2006, 34, 229. (78) R. Marek, V. Sklenar, Annu. Rep. NMR Spectrosc., 2005, 54, 201. (79) M. Dracinsky, R. Pohl, Annu. Rep. NMR Spectrosc., 2014, 82, 59. (80) J. Czernek, R. Fiala, V. Sklenar, J. Magn. Reson., 2000, 145, 142. (81) K. Malinakova, L. Novosadova, M. Lahtinen, E. Kolehmainen, J. Brus, R. Marek, J. Phys. Chem. A, 2010,
114, 1985. (82) P. Vidossich, S. Piana, A. Miani, P. Carloni, J. Am. Chem. Soc., 2006, 128, 7215. (83) A. Pérez, J. Sponer, P. Jurecka, P. Hobza, F. J. Luque, M. Orozco, Chem. Eur. J., 2005, 11, 5062. (84) C. Fonseca Guerra, T. van der Wijst, F. M. Bickelhaupt, Struct. Chem., 2005, 16, 211. (85) C. Fonseca Guerra, T. van der Wijst, F. M. Bickelhaupt, Chem. Eur. J., 2006, 12, 3032. (86) C. Fonseca Guerra, T. van der Wijst, F. M. Bickelhaupt, ChemPhysChem, 2006, 7, 1971. (87) G. te Velde, F. M. Bickelhaupt, E. J. Baerends, C. Fonseca Guerra, S. J. A. van Gisbergen, J. G. Snijders, T.
Ziegler, J. Comput. Chem., 2001, 22, 931. (88) E. J. Baerends, et. al, SCM, Theoretical Chemistry, Vrije Universiteit, Amsterdam, The Netherlands, (see
http://www.scm.com/ for more information). (89) M. Swart, F. M. Bickelhaupt, J. Comput. Chem., 2008, 29, 724. (90) S. Grimme, J. Antony, S. Ehrlich, H. Krieg, J. Chem. Phys., 2010, 132, 154104. (91) S. Grimme, S. Ehrlich, L. Goerigk, J. Comput. Chem., 2011, 32, 1456. (92) C. Fonseca Guerra, T. van der Wijst, J. Poater, M. Swart, F. M. Bickelhaupt, Theor. Chem. Acc., 2010, 125,
245. (93) T. van der Wijst, C. Fonseca Guerra, M. Swart, F. M. Bickelhaupt, B. Lippert, Angew. Chem. Int. Ed., 2009,
48, 3285. (94) J. Poater, M. Swart, C. Fonseca Guerra, F. M. Bickelhaupt, Chem. Commun., 2011, 47, 7326. (95) R. Ditchfield, Mol. Phys., 1974, 27, 789. (96) E. Van Lenthe, E. J. Baerends, J. Comput. Chem., 2003, 24, 1142. (97) D. P. Chong, E. Van Lenthe, S. Van Gisbergen, E. J. Baerends, J. Comput. Chem., 2004, 25, 1030. (98) M. Swart, Chem. Phys. Lett., 2013, 580, 166.
ComputationalStudyofNuclearMagneticResonanceShieldingConstants
118
(99) P. R. T. Schipper, O. V. Gritsenko, S. J. A. van Gisbergen, E. J. Baerends, J. Chem. Phys., 2000, 112, 1344. (100) P. J. Stephens, F. J. Devlin, C. F. Chabalowski, M. J. Frisch, J. Phys. Chem., 1994, 45, 11623. (101) A. M. Teale, O. B. Lutnaes, T. Helgaker, D. J. Tozer, J. Gauss, J. Chem. Phys., 2013, 138, 024111. (102) A. Klamt, G. Schüürmann, J. Chem. Soc., Perkin Trans. 2, 1993, 799. (103) C. C. Pye, T. Ziegler, Theor. Chem. Acc., 1999, 101, 396. (104) M. Swart, E. Rösler, F. M. Bickelhaupt, Eur. J. Inorg. Chem., 2007, 3646. (105) K. Morokuma, Acc. Chem. Res., 1977, 10, 294. (106) T. Ziegler, A. Rauk, Theor. Chim. Acta, 1977, 46, 1. (107) F. M. Bickelhaupt, E. J. Baerends, Kohn-Sham Density Functional Theory: Predicting and Understanding
Chemistry, Reviews in Computational Chemistry, Wiley-VCH: New York, Vol. 15, pp. 1-86, 2000. (108) J. Šponer, P. Jurečka, P. Hobza, J. Am. Chem. Soc., 2004, 126, 10142. (109) C. Fonseca Guerra, F. M. Bickelhaupt, J. G. Snijders, E. J. Baerends, J. Am. Chem. Soc., 2000, 122, 4117. (110) C. Fonseca Guerra, F. M. Bickelhaupt, Angew. Chem. Int. Ed., 1999, 38, 2942. (111) P. Jurečka, P. Hobza, J. Am. Chem. Soc., 2003, 125, 15608. (112) P. Jurecka, J. Sponer, J. Cerny, P. Hobza, Phys. Chem. Chem. Phys., 2006, 8, 1985. (113) E. H. S. Anwander, M. M. Probst, B. M. Rode, Biopolymers, 1990, 29, 757. (114) T. W. Hambley, Coord. Chem. Rev., 1997, 166, 181. (115) E. R. Jamieson, S. J. Lippard, Chem. Rev., 1999, 99, 2467. (116) J. Reedijk, Chem. Commun., 1996, 801. (117) D. Lebwohl, R. Canetta, European Journal of Cancer, 1998, 34, 1522. (118) P. J. O'Dwyer, J. P. Stevenson, Clinical status of cisplatin, carboplatin, and other platinum-based antitumor
drugs, Cisplatin: Chemistry and Biochemistry of a Leading Anticancer Drug, 1999, pp. 29-69. (119) R. B. Martin, Cisplatin: Chemistry and Biochemistry of a Leading Anticancer Drug, Lippert, B., Wiley-VCH,
Zürich, 1999, p. 183. (120) S. J. Berners-Price, T. A. Frenkiel, U. Frey, J. D. Ranford, P. J. Sadler, J. Chem. Soc., Chem. Commun., 1992,
789. (121) L. Cubo, D. S. Thomas, J. Zhang, A. G. Quiroga, C. Navarro-Ranninger, S. J. Berners-Price, Inorg. Chim.
Acta, 2009, 362, 1022. (122) S. J. Berners-Price, L. Ronconi, P. J. Sadler, Prog. Nucl. Magn. Reson. Spectrosc., 2006, 49, 65. (123) A. G. Quiroga, J. Inorg. Biochem., 2012, 114, 106. (124) L. Cubo, A. G. Quiroga, J. Zhang, D. S. Thomas, A. Carnero, C. Navarro-Ranninger, S. J. Berners-Price,
Dalton Trans., 2009, 3457. (125) Francisco J. Ramos-Lima, Adoración G. Quiroga, José M. Pérez, M. Font-Bardía, X. Solans, C. Navarro-
Ranninger, Eur. J. Inorg. Chem., 2003, 2003, 1591. (126) J. G. Verkade, L. D. Quin, Methods in Stereochemical Analysis Volumes in the Series: Phosphorus 31 NMR
Spectroscopy in Stereochemical Analysis, VCH Publishers, Deerfield Beach, Florida, 1987. (127) C. J. Jameson In Encyclopedia of Analytical Chemistry; John Wiley & Sons, Ltd: 2006. (128) L. A. Truflandier, K. Sutter, J. Autschbach, Inorg. Chem., 2011, 50, 1723. (129) J. Autschbach, T. Ziegler, J. Am. Chem. Soc., 2001, 123, 3341. (130) J. Autschbach, T. Ziegler, J. Am. Chem. Soc., 2001, 123, 5320. (131) B. Le Guennic, K. Matsumoto, J. Autschbach, Magn. Reson. Chem., 2004, 42, S99. (132) J. P. Perdew, K. Burke, M. Ernzerhof, Phys. Rev. Lett., 1996, 77, 3865. (133) S. Grimme, J. Comput. Chem., 2006, 27, 1787.
References
119
(134) A. Klamt, G. Schuurmann, J. Chem. Soc., Perkin Trans. 2, 1993, 799. (135) A. Klamt, J. Phys. Chem., 1996, 100, 3349. (136) C. C. Pye, T. Ziegler, Theor. Chem. Acc., 1999, 101, 396. (137) E. van Lenthe, A. Ehlers, E.-J. Baerends, J. Chem. Phys., 1999, 110, 8943. (138) E. van Lenthe, E. J. Baerends, J. G. Snijders, J. Chem. Phys., 1994, 101, 9783. (139) E. van Lenthe, R. van Leeuwen, E. J. Baerends, J. G. Snijders, Int. J. Quantum Chem, 1996, 57, 281. (140) ReSpect, Relativistic Spectroscopy DFT program, Repisky M.; Komorovský, S.; Malkin, V. G.; Malkina,
O. L. ; Kaupp, M.; Ruud, K., with contributions from Bast, R.; Ekström, U.; Kadek, M.; Knecht, S.; Konecny, L.; Malkin, E.; Malkin-Ondik, I. (see http://rel-qchem.sav.sk for more information/).
(141) A. M. Teale, O. B. Lutnæs, T. Helgaker, D. J. Tozer, J. Gauss, J. Chem. Phys., 2013, 138, 024111. (142) S. Reimann, U. Ekström, S. Stopkowicz, A. M. Teale, A. Borgoo, T. Helgaker, Phys. Chem. Chem. Phys.,
2015, 17, 18834. (143) K. G. Dyall, Theor. Chem. Acc., 1998, 99, 366. (144) K. G. Dyall, Theor. Chem. Acc., 2006, 115, 441. (145) K. G. Dyall, Theor. Chem. Acc., 2012, 131, 1. (146) P. Lantto, K. Jackowski, W. Makulski, M. Olejniczak, M. Jaszuński, J. Phys. Chem. A, 2011, 115, 10617. (147) C. J. Jameson, A. De Dios, A. Keith Jameson, Chem. Phys. Lett., 1990, 167, 575. (148) C. van Wullen, Phys. Chem. Chem. Phys., 2000, 2, 2137. (149) CP2K Developers Group, URL. http://www.cp2k.org/ (accessed Sep 2, 2016). (150) J. Wang, R. M. Wolf, J. W. Caldwell, P. A. Kollman, D. A. Case, J. Comput. Chem., 2004, 25, 1157. (151) J. Wang, W. Wang, P. A. Kollman, D. A. Case, J. Mol. Graphics Modell., 2006, 25, 247. (152) W. L. Jorgensen, J. Chandrasekhar, J. D. Madura, R. W. Impey, M. L. Klein, J. Chem. Phys., 1983, 79, 926. (153) C. I. Bayly, P. Cieplak, W. Cornell, P. A. Kollman, J. Phys. Chem., 1993, 97, 10269. (154) A. K. Rappe, C. J. Casewit, K. S. Colwell, W. A. Goddard, W. M. Skiff, J. Am. Chem. Soc., 1992, 114, 10024. (155) N. Godbout, D. R. Salahub, J. Andzelm, E. Wimmer, Can. J. Chem., 1992, 70, 560. (156) S. Goedecker, M. Teter, J. Hutter, Phys. Rev. B, 1996, 54, 1703. (157) L. A. Truflandier, J. Autschbach, J. Am. Chem. Soc., 2010, 132, 3472. (158) J. Autschbach, B. Le Guennic, Chem. Eur. J., 2004, 10, 2581. (159) E. R. Johnson, S. Keinan, P. Mori-Sánchez, J. Contreras-García, A. J. Cohen, W. Yang, J. Am. Chem. Soc.,
2010, 132, 6498. (160) J. Contreras-García, E. R. Johnson, S. Keinan, R. Chaudret, J.-P. Piquemal, D. N. Beratan, W. Yang, J. Chem.
Theory Comput., 2011, 7, 625. (161) F. J. Ramos-Lima, A. G. Quiroga, B. García-Serrelde, F. Blanco, A. Carnero, C. Navarro-Ranninger, J. Med.
Chem., 2007, 50, 2194. (162) J. Vicha, J. Novotny, M. Straka, M. Repisky, K. Ruud, S. Komorovsky, R. Marek, Phys. Chem. Chem. Phys.,
2015, 17, 24944. (163) P. Hrobárik, V. Hrobáriková, F. Meier, M. Repiský, S. Komorovský, M. Kaupp, J. Phys. Chem. A, 2011, 115,
5654. (164) J. Vícha, R. Marek, M. Straka, Inorg. Chem., 2016, 55, 1770. (165) J. Autschbach, Theor. Chem. Acc., 2004, 112, 52. (166) E. C. Beret, R. R. Pappalardo, N. L. Doltsinis, D. Marx, E. Sánchez Marcos, ChemPhysChem, 2008, 9, 237. (167) E. C. Beret, J. M. Martínez, R. R. Pappalardo, E. S. Marcos, N. L. Doltsinis, D. Marx, J. Chem. Theory
Comput., 2008, 4, 2108.
ComputationalStudyofNuclearMagneticResonanceShieldingConstants
120
(168) D. J. Cram, S. Karbach, Y. H. Kim, L. Baczynskyj, G. W. Kallemeyn, J. Am. Chem. Soc., 1985, 107, 2575. (169) D. J. Cram, Nature, 1992, 356, 29. (170) K. N. Houk, K. Nakamura, C. Sheu, A. E. Keating, Science, 1996, 273, 627. (171) R. Warmuth, J. Yoon, Acc. Chem. Res., 2001, 34, 95. (172) J. Kang, J. Rebek, Nature, 1997, 385, 50. (173) Y. Liu, R. Warmuth, Org. Lett., 2007, 9, 2883. (174) K. Nakamura, K. N. Houk, J. Am. Chem. Soc., 1995, 117, 1853. (175) F. Liu, R. C. Helgeson, K. N. Houk, Acc. Chem. Res., 2014, 47, 2168. (176) H. Wang, F. Liu, R. C. Helgeson, K. N. Houk, Angew. Chem. Int. Ed., 2013, 52, 655. (177) D. J. Cram, M. E. Tanner, C. B. Knobler, J. Am. Chem. Soc., 1991, 113, 7717. (178) M. L. C. Quan, D. J. Cram, J. Am. Chem. Soc., 1991, 113, 2754. (179) C. von dem Bussche-Hunnefeld, D. Buhring, C. B. Knobler, D. J. Cram, J. Chem. Soc., Chem. Commun.,
1995, 1085. (180) D. J. Cram, M. E. Tanner, R. Thomas, Angew. Chem. Int. Ed. Engl., 1991, 30, 1024. (181) C. N. Eid, C. B. Knobler, D. A. Gronbeck, D. J. Cram, J. Am. Chem. Soc., 1994, 116, 8506. (182) J. Kang, J. Rebek, Nature, 1996, 382, 239. (183) D. D. Sternbach, D. M. Rossana, J. Am. Chem. Soc., 1982, 104, 5853. (184) N. K. Sangwan, H.-J. Schneider, J. Chem. Soc., Perkin Trans. 2, 1989, 1223. (185) E. L. Piatnitski, K. D. Deshayes, Angew. Chem. Int. Ed., 1998, 37, 970. (186) R. Warmuth, Angew. Chem. Int. Ed. Engl., 1997, 36, 1347. (187) H. Jiao, P. v. R. Schleyer, R. Warmuth, K. N. Houk, B. R. Beno, Angew. Chem. Int. Ed. Engl., 1997, 36, 2761. (188) T. Helgaker, O. B. Lutnaes, M. Jaszuński, J. Chem. Theory Comput., 2007, 3, 86. (189) L. s. Armangue ́, M. Sola ̀, M. Swart, J. Phys. Chem. A, 2011, 115, 1250. (190) S. Osuna, A. Rodriguez-Fortea, J. M. Poblet, M. Sola, M. Swart, Chem. Commun., 2012, 48, 2486. (191) C. Sheu, K. N. Houk, J. Am. Chem. Soc., 1996, 118, 8056. (192) R. Warmuth, J.-L. Kerdelhué, S. Sánchez Carrera, K. J. Langenwalter, N. Brown, Angew. Chem. Int. Ed.,
2002, 41, 96. (193) X. Wang, Z. Yang, J. Wang, J. Zhang, W. Cao, Journal of Molecular Structure: THEOCHEM, 2006, 766, 169. (194) B. R. Beno, C. Sheu, K. N. Houk, R. Warmuth, D. J. Cram, Chem. Commun., 1998, 301. (195) R. C. Helgeson, K. Paek, C. B. Knobler, E. F. Maverick, D. J. Cram, J. Am. Chem. Soc., 1996, 118, 5590. (196) K. Nakamura, C. Sheu, A. E. Keating, K. N. Houk, J. C. Sherman, R. G. Chapman, W. L. Jorgensen, J. Am.
Chem. Soc., 1997, 119, 4321. (197) M. J. Liddell, D. Margetic, A. S. Mitchell, R. N. Warrener, J. Comput. Chem., 2004, 25, 542. (198) T. A. Robbins, C. B. Knobler, D. R. Bellew, D. J. Cram, J. Am. Chem. Soc., 1994, 116, 111. (199) D. J. Cram, M. T. Blanda, K. Paek, C. B. Knobler, J. Am. Chem. Soc., 1992, 114, 7765. (200) E. v. Lenthe, E. J. Baerends, J. G. Snijders, J. Chem. Phys., 1993, 99, 4597. (201) E. van Lenthe, A. Ehlers, E.-J. Baerends, J. Chem. Phys., 1999, 110, 8943. (202) R. A. Kendall, T. H. D. Jr., R. J. Harrison, J. Chem. Phys., 1992, 96, 6796. (203) T. H. Dunning Jr, J. Chem. Phys., 1989, 90, 1007. (204) M. E. Harding, T. Metzroth, J. Gauss, J. Chem. Theory Comput., 2008, 4, 64. (205) CFOUR, J. F. Stanton, J. Gauss, M. E. Harding, P. G. Szalay, Austin, TX, USA; Mainz, Germany, 2010. (206) A. Klamt, J. Phys. Chem., 1996, 100, 3349. (207) A. M. Orendt, J. C. Facelli, J. G. Radziszewski, W. J. Horton, D. M. Grant, J. Michl, J. Am. Chem. Soc., 1996,
References
121
118, 846. (208) E. Kraka, D. Cremer, Chem. Phys. Lett., 1993, 216, 333. (209) P. Jutzi, N. Burford, Chem. Rev., 1999, 99, 969. (210) P. H. M. Budzelaar, J. J. Engelberts, J. H. van Lenthe, Organomet., 2003, 22, 1562. (211) P. Jutzi, G. Reumann, J. Chem. Soc., Dalton Trans., 2000, 2237. (212) J. A. J. Pardoe, A. J. Downs, Chem. Rev., 2007, 107, 2. (213) C. L. B. Macdonald, A. H. Cowley, J. Am. Chem. Soc., 1999, 121, 12113. (214) O. T. Beachley, R. Blom, M. R. Churchill, K. Faegri, J. C. Fettinger, J. C. Pazik, L. Victoriano,
Organometallics, 1989, 8, 346. (215) J. Gauss, U. Schneider, R. Ahlrichs, C. Dohmeier, H. Schnoeckel, J. Am. Chem. Soc., 1993, 115, 2402. (216) A. Haaland, K.-G. Martinsen, S. A. Shlykov, H. V. Volden, C. Dohmeier, H. Schnoeckel, Organomet., 1995,
14, 3116. (217) A. Haaland, K.-G. Martinsen, H. V. Volden, W. Kaim, E. Waldhör, W. Uhl, U. Schütz, Organomet., 1996,
15, 1146. (218) Wei, M. Winter, R. A. Fischer, C. Yu, K. Wichmann, G. Frenking, Chem. Commun., 2000, 2495. (219) B. Buchin, C. Gemel, T. Cadenbach, I. Fernández, G. Frenking, R. A. Fischer, Angew. Chem., 2006, 118,
5331. (220) R. A. Fischer, D. Weiß, M. Winter, I. Müller, H. D. Kaesz, N. Fröhlich, G. Frenking, J. Organomet. Chem.,
2004, 689, 4611. (221) D. Weiss, T. Steinke, M. Winter, R. A. Fischer, N. Fröhlich, J. Uddin, G. Frenking, Organomet., 2000, 19,
4583. (222) D. Weiß, M. Winter, K. Merz, A. Knüfer, R. A. Fischer, N. Fröhlich, G. Frenking, Polyhedron, 2002, 21, 535. (223) I. Fernández, E. Cerpa, G. Merino, G. Frenking, Organomet., 2008, 27, 1106. (224) N.-N. Liu, J. Xu, Y.-H. Ding, Int. J. Quantum Chem, 2013, 113, 1018. (225) M. Baudler, K. Glinka, Chem. Rev., 1993, 93, 1623. (226) M. Baudler, K. Glinka, Chem. Rev., 1994, 94, 1273. (227) M. Baudler, Angew. Chem. Int. Ed., 1987, 26, 419. (228) G. Van Zandwijk, R. A. J. Janssen, H. M. Buck, J. Am. Chem. Soc., 1990, 112, 4155. (229) F. Kraus, J. C. Aschenbrenner, N. Korber, Angew. Chem. Int. Ed., 2003, 42, 4030. (230) Bilatu 1.0, J. Cabellos, F. Ortís-Chi, A. Ramírez, G. Merino, Cinvestav, Mérida, 2013. (231) M. Saunders, J. Comput. Chem., 2004, 25, 621. (232) T. Ziegler, A. Rauk, E. Baerends, Theor. Chim. Acta, 1977, 43, 261. (233) M. v. Hopffgarten, G. Frenking, Wiley Interdisciplinary Reviews: Computational Molecular Science, 2012, 2,
43. (234) D. Y. Zubarev, A. I. Boldyrev, Phys. Chem. Chem. Phys., 2008, 10, 5207. (235) M. Contreras, E. Osorio, F. Ferraro, G. Puga, K. J. Donald, J. G. Harrison, G. Merino, W. Tiznado, Chem.
Eur. J., 2013, 19, 2305. (236) C. Adamo, V. Barone, J. Chem. Phys., 1999, 110, 6158. (237) M. Swart, F. Matthias Bickelhaupt, Int. J. Quantum Chem, 2006, 106, 2536. (238) J. Cioslowski, E. Matito, M. Solà, J. Phys. Chem. A, 2007, 111, 6521. (239) E. Matito, M. Sola, P. Salvador, M. Duran, Faraday Discuss., 2007, 135, 325. (240) P. Salvador, E. Ramos-Cordoba, J. Chem. Phys., 2013, 139, 071103. (241) APOST-3D, P. Salvador, E. Ramos-Cordoba, Institute of Computational Chemistry and Catalysis,
ComputationalStudyofNuclearMagneticResonanceShieldingConstants
122
University of Girona, Catalonia, Spain, 2011. (242) I. Mayer, P. Salvador, Chem. Phys. Lett., 2004, 383, 368. (243) ESI-3D: Electron Sharing Indices Program for 3D Molecular Space Partitioning, E. Matito, Institute of
Computational Chemistry and Catalisis, University of Girona, Catalonia, Spain, 2006. (244) E. Matito, M. Duran, M. Solà, J. Chem. Phys., 2004, 122, 014109. (245) R. Ditchfield, Mol. Phys., 1974, 27, 789. (246) M. Zhou, N. Tsumori, Z. Li, K. Fan, L. Andrews, Q. Xu, J. Am. Chem. Soc., 2002, 124, 12936. (247) A. Moezzi, M. M. Olmstead, P. P. Power, J. Am. Chem. Soc., 1992, 114, 2715. (248) W. J. Grigsby, P. Power, Chem. Eur. J., 1997, 3, 368. (249) W. J. Grigsby, P. P. Power, Chem. Commun., 1996, 2235. (250) H. Nöth, J. Knizek, W. Ponikwar, Eur. J. Inorg. Chem., 1999, 1999, 1931. (251) S. Giri, D. R. Roy, S. Duley, A. Chakraborty, R. Parthasarathi, M. Elango, R. Vijayaraj, V. Subramanian,
R. Islas, G. Merino, P. K. Chattaraj, J. Comput. Chem., 2010, 31, 1815. (252) J. O. C. Jiménez-Halla, E. Matito, L. Blancafort, J. Robles, M. Solà, J. Comput. Chem., 2009, 30, 2764. (253) F. Feixas, J. O. C. Jiménez-Halla, E. Matito, J. Poter, M. Solà, Pol. J. Chem., 2007, 81, 783.

Appendices
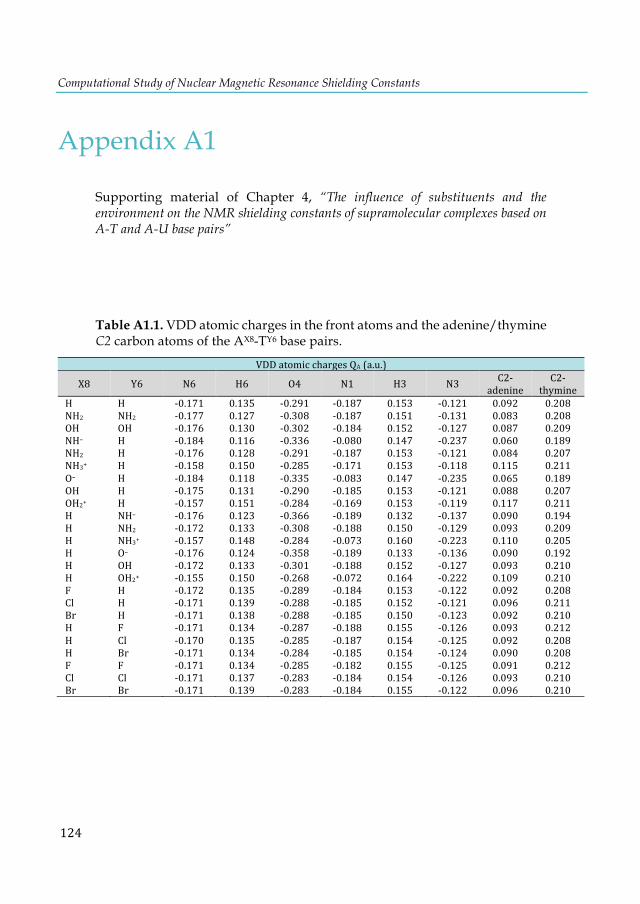
Computational Study of Nuclear Magnetic Resonance Shielding Constants
124
Appendix A1
Supporting material of Chapter 4, “The influence of substituents and the environment on the NMR shielding constants of supramolecular complexes based on A-T and A-U base pairs”
Table A1.1. VDD atomic charges in the front atoms and the adenine/thymine C2 carbon atoms of the AX8-TY6 base pairs.
VDDatomicchargesQA(a.u.)
X8 Y6 N6 H6 O4 N1 H3 N3 C2-adenine
C2-thymine
H H -0.171 0.135 -0.291 -0.187 0.153 -0.121 0.092 0.208NH2 NH2 -0.177 0.127 -0.308 -0.187 0.151 -0.131 0.083 0.208OH OH -0.176 0.130 -0.302 -0.184 0.152 -0.127 0.087 0.209NH– H -0.184 0.116 -0.336 -0.080 0.147 -0.237 0.060 0.189NH2 H -0.176 0.128 -0.291 -0.187 0.153 -0.121 0.084 0.207NH3+ H -0.158 0.150 -0.285 -0.171 0.153 -0.118 0.115 0.211O– H -0.184 0.118 -0.335 -0.083 0.147 -0.235 0.065 0.189OH H -0.175 0.131 -0.290 -0.185 0.153 -0.121 0.088 0.207OH2+ H -0.157 0.151 -0.284 -0.169 0.153 -0.119 0.117 0.211H NH– -0.176 0.123 -0.366 -0.189 0.132 -0.137 0.090 0.194H NH2 -0.172 0.133 -0.308 -0.188 0.150 -0.129 0.093 0.209H NH3+ -0.157 0.148 -0.284 -0.073 0.160 -0.223 0.110 0.205H O– -0.176 0.124 -0.358 -0.189 0.133 -0.136 0.090 0.192H OH -0.172 0.133 -0.301 -0.188 0.152 -0.127 0.093 0.210H OH2+ -0.155 0.150 -0.268 -0.072 0.164 -0.222 0.109 0.210F H -0.172 0.135 -0.289 -0.184 0.153 -0.122 0.092 0.208Cl H -0.171 0.139 -0.288 -0.185 0.152 -0.121 0.096 0.211Br H -0.171 0.138 -0.288 -0.185 0.150 -0.123 0.092 0.210H F -0.171 0.134 -0.287 -0.188 0.155 -0.126 0.093 0.212H Cl -0.170 0.135 -0.285 -0.187 0.154 -0.125 0.092 0.208H Br -0.171 0.134 -0.284 -0.185 0.154 -0.124 0.090 0.208F F -0.171 0.134 -0.285 -0.182 0.155 -0.125 0.091 0.212Cl Cl -0.171 0.137 -0.283 -0.184 0.154 -0.126 0.093 0.210Br Br -0.171 0.139 -0.283 -0.184 0.155 -0.122 0.096 0.210
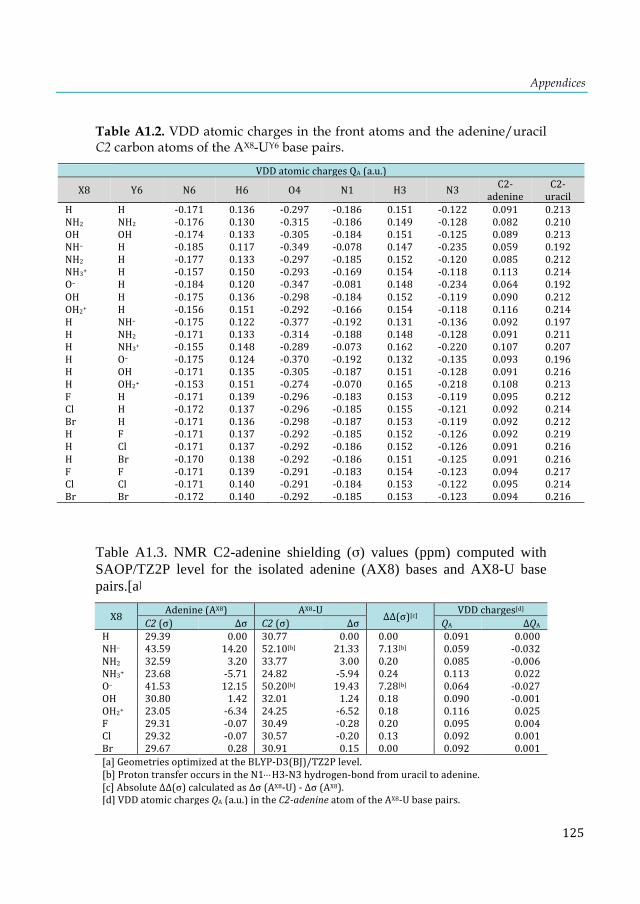
Appendices
125
Table A1.2. VDD atomic charges in the front atoms and the adenine/uracil C2 carbon atoms of the AX8-UY6 base pairs.
VDDatomicchargesQA(a.u.)
X8 Y6 N6 H6 O4 N1 H3 N3 C2-adenine
C2-uracil
H H -0.171 0.136 -0.297 -0.186 0.151 -0.122 0.091 0.213NH2 NH2 -0.176 0.130 -0.315 -0.186 0.149 -0.128 0.082 0.210OH OH -0.174 0.133 -0.305 -0.184 0.151 -0.125 0.089 0.213NH– H -0.185 0.117 -0.349 -0.078 0.147 -0.235 0.059 0.192NH2 H -0.177 0.133 -0.297 -0.185 0.152 -0.120 0.085 0.212NH3+ H -0.157 0.150 -0.293 -0.169 0.154 -0.118 0.113 0.214O– H -0.184 0.120 -0.347 -0.081 0.148 -0.234 0.064 0.192OH H -0.175 0.136 -0.298 -0.184 0.152 -0.119 0.090 0.212OH2+ H -0.156 0.151 -0.292 -0.166 0.154 -0.118 0.116 0.214H NH– -0.175 0.122 -0.377 -0.192 0.131 -0.136 0.092 0.197H NH2 -0.171 0.133 -0.314 -0.188 0.148 -0.128 0.091 0.211H NH3+ -0.155 0.148 -0.289 -0.073 0.162 -0.220 0.107 0.207H O– -0.175 0.124 -0.370 -0.192 0.132 -0.135 0.093 0.196H OH -0.171 0.135 -0.305 -0.187 0.151 -0.128 0.091 0.216H OH2+ -0.153 0.151 -0.274 -0.070 0.165 -0.218 0.108 0.213F H -0.171 0.139 -0.296 -0.183 0.153 -0.119 0.095 0.212Cl H -0.172 0.137 -0.296 -0.185 0.155 -0.121 0.092 0.214Br H -0.171 0.136 -0.298 -0.187 0.153 -0.119 0.092 0.212H F -0.171 0.137 -0.292 -0.185 0.152 -0.126 0.092 0.219H Cl -0.171 0.137 -0.292 -0.186 0.152 -0.126 0.091 0.216H Br -0.170 0.138 -0.292 -0.186 0.151 -0.125 0.091 0.216F F -0.171 0.139 -0.291 -0.183 0.154 -0.123 0.094 0.217Cl Cl -0.171 0.140 -0.291 -0.184 0.153 -0.122 0.095 0.214Br Br -0.172 0.140 -0.292 -0.185 0.153 -0.123 0.094 0.216
Table A1.3. NMR C2-adenine shielding (σ) values (ppm) computed with SAOP/TZ2P level for the isolated adenine (AX8) bases and AX8-U base pairs.[a]
X8 Adenine(AX8) AX8-U ΔΔ(σ)[c] VDDcharges[d]C2(σ) Δσ C2(σ) Δσ QA ΔQA
H 29.39 0.00 30.77 0.00 0.00 0.091 0.000NH– 43.59 14.20 52.10[b] 21.33 7.13[b] 0.059 -0.032NH2 32.59 3.20 33.77 3.00 0.20 0.085 -0.006NH3+ 23.68 -5.71 24.82 -5.94 0.24 0.113 0.022O– 41.53 12.15 50.20[b] 19.43 7.28[b] 0.064 -0.027OH 30.80 1.42 32.01 1.24 0.18 0.090 -0.001OH2+ 23.05 -6.34 24.25 -6.52 0.18 0.116 0.025F 29.31 -0.07 30.49 -0.28 0.20 0.095 0.004Cl 29.32 -0.07 30.57 -0.20 0.13 0.092 0.001Br 29.67 0.28 30.91 0.15 0.00 0.092 0.001[a]GeometriesoptimizedattheBLYP-D3(BJ)/TZ2Plevel.[b]ProtontransferoccursintheN1×××H3-N3hydrogen-bondfromuraciltoadenine.[c]AbsoluteΔΔ(σ)calculatedasΔσ(AX8-U)-Δσ(AX8).[d]VDDatomicchargesQA(a.u.)intheC2-adenineatomoftheAX8-Ubasepairs.
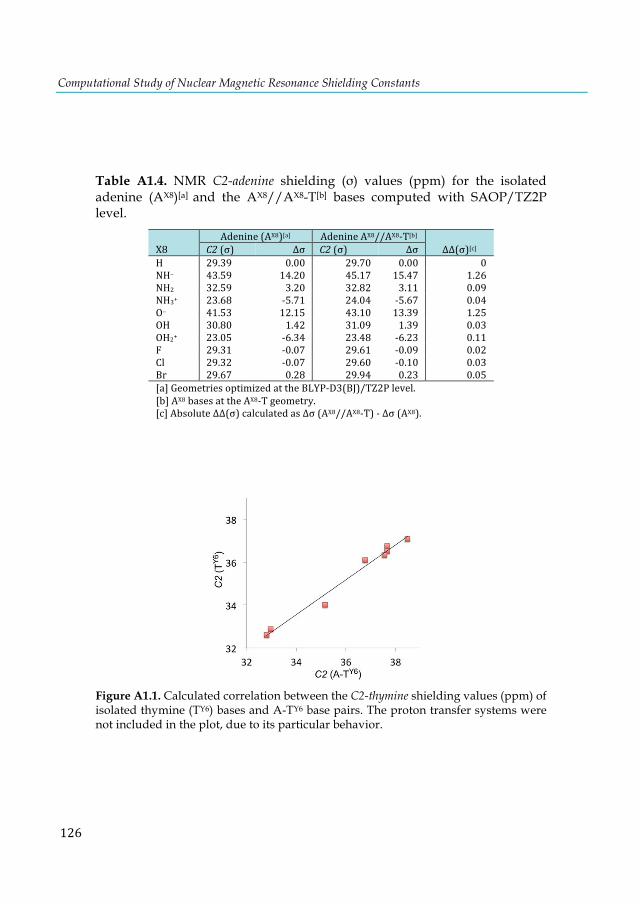
Computational Study of Nuclear Magnetic Resonance Shielding Constants
126
Table A1.4. NMR C2-adenine shielding (σ) values (ppm) for the isolated adenine (AX8)[a] and the AX8//AX8-T[b] bases computed with SAOP/TZ2P level.
X8Adenine(AX8)[a] AdenineAX8//AX8-T[b]
ΔΔ(σ)[c]C2(σ) Δσ C2(σ) ΔσH 29.39 0.00 29.70 0.00 0NH– 43.59 14.20 45.17 15.47 1.26NH2 32.59 3.20 32.82 3.11 0.09NH3+ 23.68 -5.71 24.04 -5.67 0.04O– 41.53 12.15 43.10 13.39 1.25OH 30.80 1.42 31.09 1.39 0.03OH2+ 23.05 -6.34 23.48 -6.23 0.11F 29.31 -0.07 29.61 -0.09 0.02Cl 29.32 -0.07 29.60 -0.10 0.03Br 29.67 0.28 29.94 0.23 0.05[a]GeometriesoptimizedattheBLYP-D3(BJ)/TZ2Plevel.[b]AX8basesattheAX8-Tgeometry.[c]AbsoluteΔΔ(σ)calculatedasΔσ(AX8//AX8-T)-Δσ(AX8).
Figure A1.1. Calculated correlation between the C2-thymine shielding values (ppm) of isolated thymine (TY6) bases and A-TY6 base pairs. The proton transfer systems were not included in the plot, due to its particular behavior.
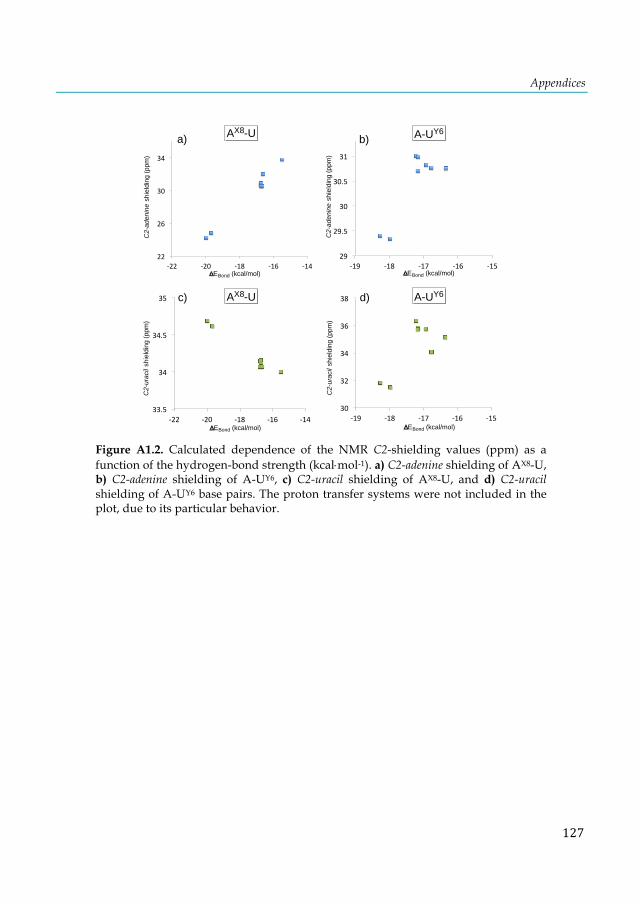
Appendices
127
Figure A1.2. Calculated dependence of the NMR C2-shielding values (ppm) as a function of the hydrogen-bond strength (kcal×mol-1). a) C2-adenine shielding of AX8-U, b) C2-adenine shielding of A-UY6, c) C2-uracil shielding of AX8-U, and d) C2-uracil shielding of A-UY6 base pairs. The proton transfer systems were not included in the plot, due to its particular behavior.
30#
32#
34#
36#
38#
(19# (18# (17# (16# (15#33.5$
34$
34.5$
35$
&22$ &20$ &18$ &16$ &14$
29#
29.5#
30#
30.5#
31#
)19# )18# )17# )16# )15#22"
26"
30"
34"
'22" '20" '18" '16" '14"EBond (kcal/mol)
C2-
aden
ine
shie
ldin
g (p
pm)
C2-
aden
ine
shie
ldin
g (p
pm)
C2-
urac
il sh
ield
ing
(ppm
)
C2-
urac
il sh
ield
ing
(ppm
)
AX8-U
AX8-U
A-UY6
A-UY6
a) b)
c) d)
EBond (kcal/mol)
EBond (kcal/mol)
EBond (kcal/mol)
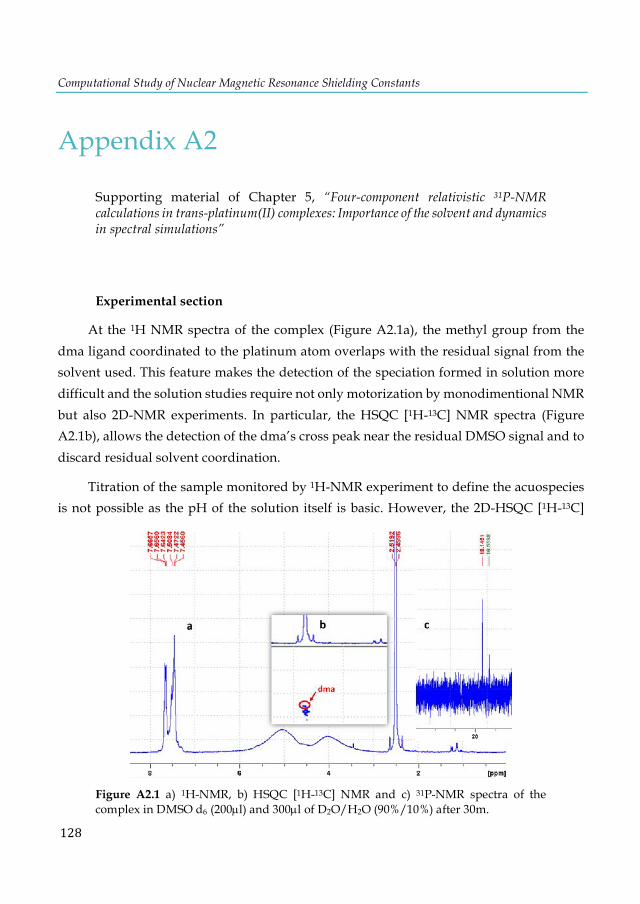
Computational Study of Nuclear Magnetic Resonance Shielding Constants
128
Appendix A2
Supporting material of Chapter 5, “Four-component relativistic 31P-NMR calculations in trans-platinum(II) complexes: Importance of the solvent and dynamics in spectral simulations”
Experimental section
At the 1H NMR spectra of the complex (Figure A2.1a), the methyl group from the dma ligand coordinated to the platinum atom overlaps with the residual signal from the solvent used. This feature makes the detection of the speciation formed in solution more difficult and the solution studies require not only motorization by monodimentional NMR but also 2D-NMR experiments. In particular, the HSQC [1H-13C] NMR spectra (Figure A2.1b), allows the detection of the dma’s cross peak near the residual DMSO signal and to discard residual solvent coordination.
Titration of the sample monitored by 1H-NMR experiment to define the acuospecies is not possible as the pH of the solution itself is basic. However, the 2D-HSQC [1H-13C]
Figure A2.1 a) 1H-NMR, b) HSQC [1H-13C] NMR and c) 31P-NMR spectra of the complex in DMSO d6 (200µl) and 300µl of D2O/H2O (90%/10%) after 30m.
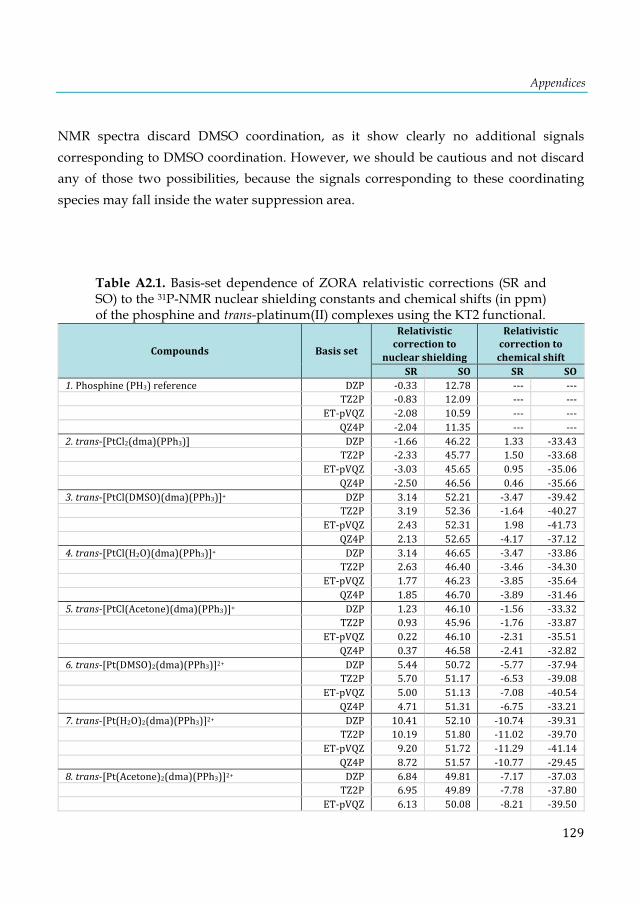
Appendices
129
NMR spectra discard DMSO coordination, as it show clearly no additional signals corresponding to DMSO coordination. However, we should be cautious and not discard any of those two possibilities, because the signals corresponding to these coordinating species may fall inside the water suppression area.
Table A2.1. Basis-set dependence of ZORA relativistic corrections (SR and SO) to the 31P-NMR nuclear shielding constants and chemical shifts (in ppm) of the phosphine and trans-platinum(II) complexes using the KT2 functional.
Compounds Basisset
Relativistic
correctionto
nuclearshielding
Relativistic
correctionto
chemicalshift
SR SO SR SO
1.Phosphine(PH3)reference DZP -0.33 12.78 --- --- TZ2P -0.83 12.09 --- --- ET-pVQZ -2.08 10.59 --- --- QZ4P -2.04 11.35 --- ---2.trans-[PtCl2(dma)(PPh3)] DZP -1.66 46.22 1.33 -33.43 TZ2P -2.33 45.77 1.50 -33.68 ET-pVQZ -3.03 45.65 0.95 -35.06 QZ4P -2.50 46.56 0.46 -35.663.trans-[PtCl(DMSO)(dma)(PPh3)]+ DZP 3.14 52.21 -3.47 -39.42 TZ2P 3.19 52.36 -1.64 -40.27 ET-pVQZ 2.43 52.31 1.98 -41.73 QZ4P 2.13 52.65 -4.17 -37.124.trans-[PtCl(H2O)(dma)(PPh3)]+ DZP 3.14 46.65 -3.47 -33.86 TZ2P 2.63 46.40 -3.46 -34.30 ET-pVQZ 1.77 46.23 -3.85 -35.64 QZ4P 1.85 46.70 -3.89 -31.465.trans-[PtCl(Acetone)(dma)(PPh3)]+ DZP 1.23 46.10 -1.56 -33.32 TZ2P 0.93 45.96 -1.76 -33.87 ET-pVQZ 0.22 46.10 -2.31 -35.51 QZ4P 0.37 46.58 -2.41 -32.826.trans-[Pt(DMSO)2(dma)(PPh3)]2+ DZP 5.44 50.72 -5.77 -37.94 TZ2P 5.70 51.17 -6.53 -39.08 ET-pVQZ 5.00 51.13 -7.08 -40.54 QZ4P 4.71 51.31 -6.75 -33.217.trans-[Pt(H2O)2(dma)(PPh3)]2+ DZP 10.41 52.10 -10.74 -39.31 TZ2P 10.19 51.80 -11.02 -39.70 ET-pVQZ 9.20 51.72 -11.29 -41.14 QZ4P 8.72 51.57 -10.77 -29.458.trans-[Pt(Acetone)2(dma)(PPh3)]2+ DZP 6.84 49.81 -7.17 -37.03 TZ2P 6.95 49.89 -7.78 -37.80 ET-pVQZ 6.13 50.08 -8.21 -39.50
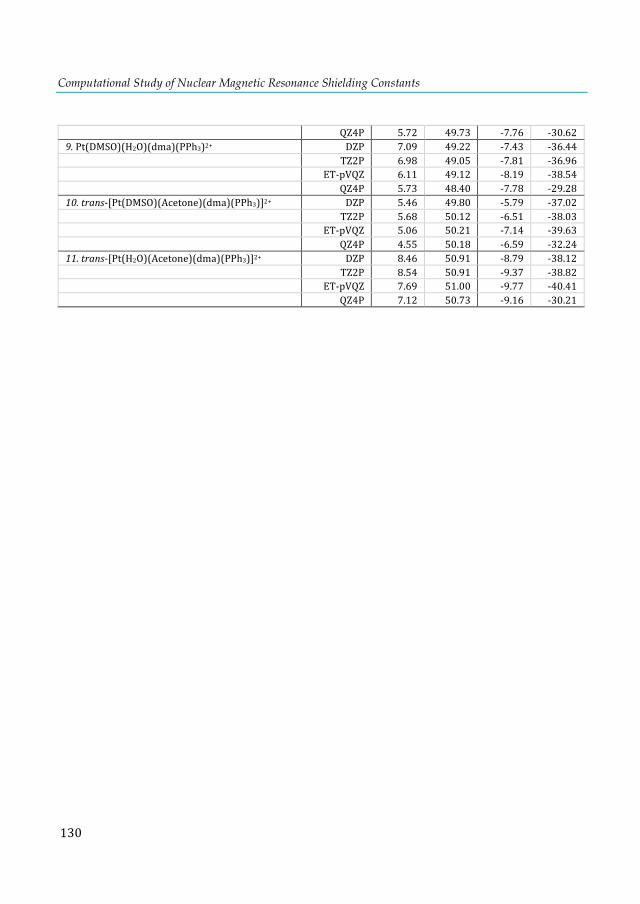
Computational Study of Nuclear Magnetic Resonance Shielding Constants
130
QZ4P 5.72 49.73 -7.76 -30.629.Pt(DMSO)(H2O)(dma)(PPh3)2+ DZP 7.09 49.22 -7.43 -36.44 TZ2P 6.98 49.05 -7.81 -36.96 ET-pVQZ 6.11 49.12 -8.19 -38.54 QZ4P 5.73 48.40 -7.78 -29.2810.trans-[Pt(DMSO)(Acetone)(dma)(PPh3)]2+ DZP 5.46 49.80 -5.79 -37.02 TZ2P 5.68 50.12 -6.51 -38.03 ET-pVQZ 5.06 50.21 -7.14 -39.63 QZ4P 4.55 50.18 -6.59 -32.2411.trans-[Pt(H2O)(Acetone)(dma)(PPh3)]2+ DZP 8.46 50.91 -8.79 -38.12 TZ2P 8.54 50.91 -9.37 -38.82 ET-pVQZ 7.69 51.00 -9.77 -40.41 QZ4P 7.12 50.73 -9.16 -30.21
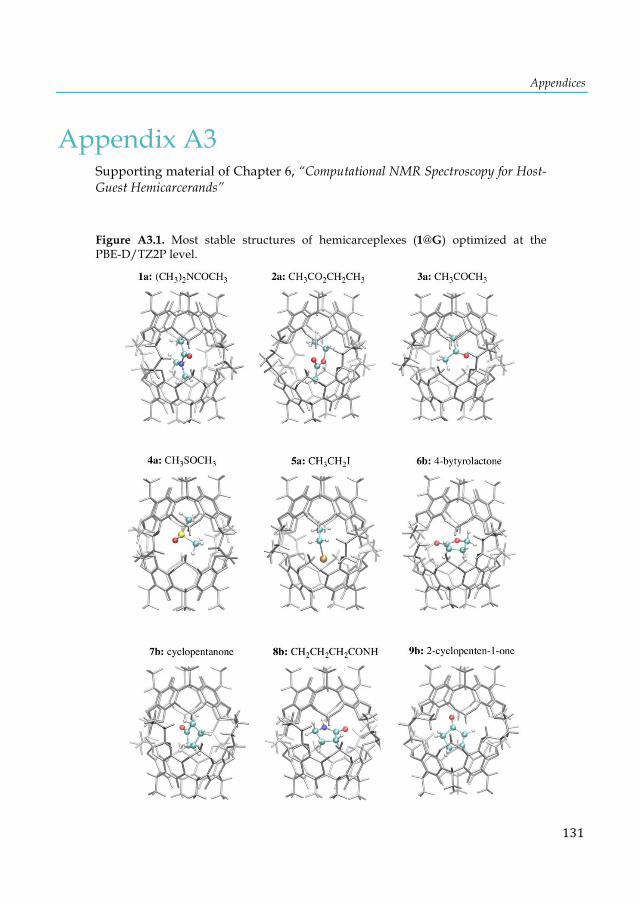
Appendices
131
Appendix A3 Supporting material of Chapter 6, “Computational NMR Spectroscopy for Host-Guest Hemicarcerands”
Figure A3.1. Most stable structures of hemicarceplexes (1@G) optimized at the PBE-D/TZ2P level.
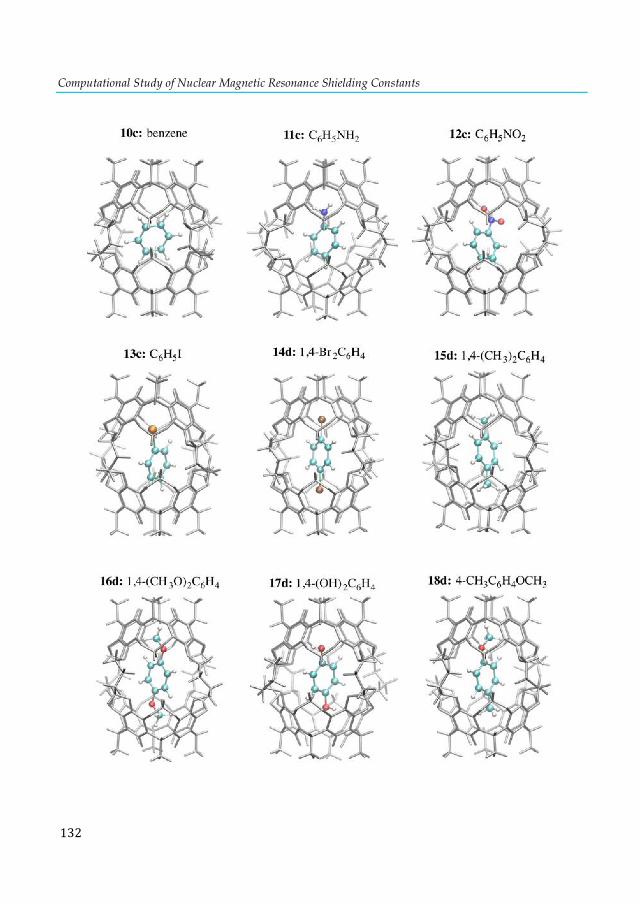
Computational Study of Nuclear Magnetic Resonance Shielding Constants
132
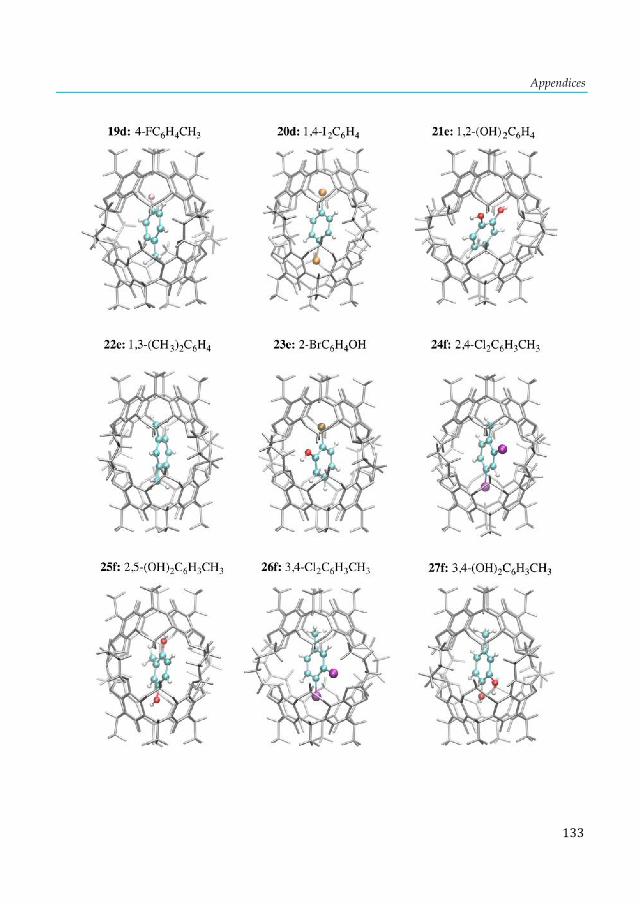
Appendices
133
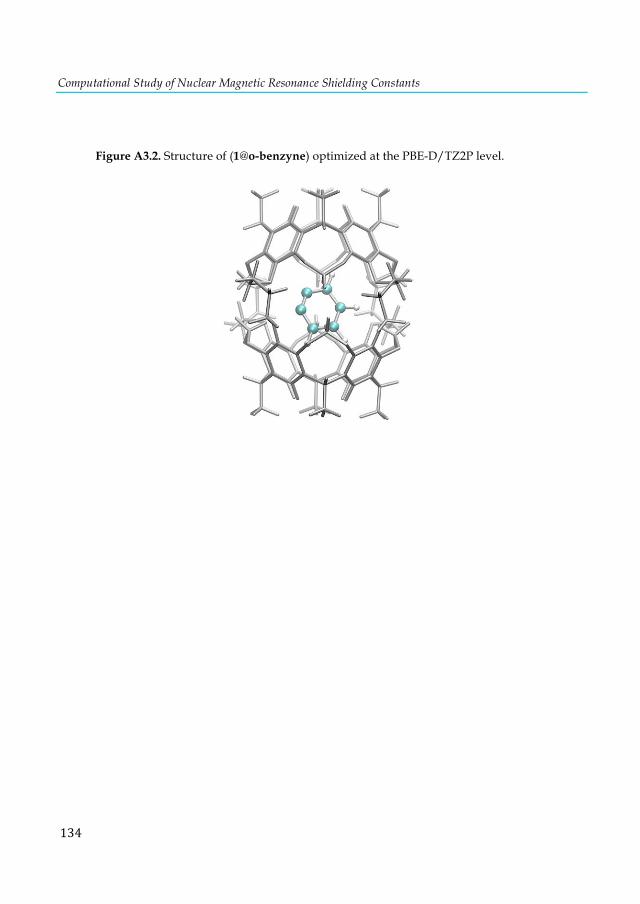
Computational Study of Nuclear Magnetic Resonance Shielding Constants
134
Figure A3.2. Structure of (1@o-benzyne) optimized at the PBE-D/TZ2P level.