Pabellón (cartílago). Tejido conectivoTejido epitelial Tejido muscularTejido nervioso.

Repositorio de la Universidad de Zaragoza – Zaguan http://zaguan.unizar.es
Tesis Doctoral
CÉLULAS MADRE MESENQUIMALES EQUINAS: OBTENCIÓN Y ANÁLISIS DE SUS
PROPIEDADES IN VITRO
Autor
Ranera Beltrán, Beatriz
Director/es
Rodellar Penella, Clementina Martín Burriel, Inmaculada
FACULTAD DE VETERINARIA Departamento de Anatomía, Embriología y Genética Animal
2012

MEMORIA PARA OPTAR AL GRADO DE
DOCTORA POR LA UNIVERSIDAD DE
ZARAGOZA:
CÉLULAS MADRE
MESENQUIMALES EQUINAS:
OBTENCIÓN Y ANÁLISIS DE SUS
PROPIEDADES IN VITRO.
Beatriz Ranera Beltrán Laboratorio de Genética Bioquímica
(LAGENBIO)
Departamento Anatomía, Embriología y Genética Animal.
Facultad de Veterinaria

ÍNDICE
1. RESUMEN ................................................................................................................ 1
2. INTRODUCCIÓN Y OBJETIVOS .......................................................................... 5
2.1. INTRODUCCIÓN ............................................................................................. 5
3. REVISIÓN BIBLIOGRÁFICA ................................................................................ 9
3.1. CÉLULAS MADRE .......................................................................................... 9
3.1.1. CÉLULAS MADRE EMBRIONARIAS. ..................................................... 10
3.1.2. CÉLULAS MADRE GERMINALES ........................................................... 10
3.1.3. CÉLULAS MADRE FETALES ................................................................... 10
3.1.4. CÉLULAS MADRE ADULTAS .................................................................. 11
3.2. CÉLULAS MADRE MESENQUIMALES ..................................................... 13
3.2.1. CÉLULAS MADRE MESENQUIMALES DERIVADAS DE MÉDULA
ÓSEA ...................................................................................................................... 13
3.2.2. CÉLULAS MADRE MESENQUIMALES DERIVADAS DE TEJIDO
ADIPOSO................................................................................................................ 14
3.2.3. CÉLULAS MADRE MESENQUIMALES DERIVADAS DE OTROS
TEJIDOS ................................................................................................................. 15
3.3. TERAPIA CELULAR ..................................................................................... 15
3.3.1. TERAPIA CELULAR EN ANIMALES MODELO Y ENSAYOS
CLÍNICOS. ............................................................................................................. 17
3.3.1.1. TRATAMIENTO EN LESIONES ÓSEAS ........................................... 17
3.3.1.2. TERAPIA EN LESIONES CARTILAGINOSAS ................................. 18
3.3.1.3. TRATAMIENTO DE LESIONES TENDINOSAS ............................... 18
3.3.1.4. TRATAMIENTO DE LESIONES CARDÍACAS ................................. 20
3.3.1.5. TERAPIA INMUNOMODULADORA ................................................. 21
3.3.2. TERAPIA CELULAR EN CABALLOS ...................................................... 21
3.3.2.1. TRATAMIENTO DE LESIONES DE CARTÍLAGO ........................... 23
3.3.2.2. TRATAMIENTO DE LESIONES TENDINOSAS ............................... 24
3.4. CARACTERIZACIÓN DE LAS CÉLULAS MADRE MESENQUIMALES 27
3.4.1. POTENCIAL DE AUTORRENOVACIÓN Y PROLIFERACIÓN ............. 27
3.4.2. FENOTIPO DE MARCADORES DE SUPERFICIE ................................... 28
3.4.3. POTENCIALES DE DIFERENCIACIÓN ................................................... 30
3.4.3.1. DIFERENCIACIÓN ADIPOGÉNICA .................................................. 31

3.4.3.2. DIFERENCIACIÓN OSTEOGÉNICA .................................................. 32
3.4.3.3. DIFERENCIACIÓN CONDROGÉNICA .............................................. 33
3.4.3.4. DIFERENCIACIÓN A LINAJES DE OTRAS CAPAS
EMBRIONARIAS ............................................................................................... 35
3.4.4. PROPIEDADES INMUNOLÓGICAS ......................................................... 36
3.5. CÉLULAS MADRE MESENQUIMALES EQUINAS .................................. 37
3.5.1. POTENCIAL DE AUTORRENOVACIÓN Y PROLIFERACIÓN ............ 37
3.5.2. FENOTIPO DE MARCADORES DE SUPERFICIE ................................... 38
3.5.3. POTENCIAL DE DIFERENCIACIÓN ........................................................ 39
3.5.3.3. DIFERENCIACIÓN CONDROGÉNICA .............................................. 40
3.6. CULTIVO DE LAS MSCs. ................................................................................. 41
3.6.1 FACTORES QUE AFECTAN AL CULTIVO .............................................. 41
3.6.1.1. SUERO FETAL BOVINO ..................................................................... 41
3.6.1.2. OXÍGENO .............................................................................................. 42
3.6.1.2.1. Efecto del oxígeno en la proliferación celular ................................. 44
3.6.1.2.2. El oxígeno no modifica el fenotipo de marcadores de superficie ... 44
3.6.1.2.3. Influencia del oxígeno en el potencial de diferenciación................. 45
4. MATERIAL Y MÉTODOS ................................................................................... 46
4.1 ANIMALES ...................................................................................................... 46
4.2. CULTIVO DE MSCs ........................................................................................ 46
4.2.1. OBTENCIÓN DE MUESTRAS Y AISLAMIENTO DE MSCs.................. 47
4.2.2. EXPANSIÓN Y CRIOPRESERVACIÓN ................................................... 47
4.2.3. ENSAYOS DE PROLIFERACIÓN ............................................................. 48
4.2.4. ENSAYOS DE DIFERENCIACIÓN............................................................ 48
4.2.4.1. CONDICIONES DE DIFERENCIACIÓN ............................................ 48
4.2.4.2. TINCIONES ESPECÍFICAS ................................................................. 49
4.2.4.3. CUANTIFICACIÓN .............................................................................. 50
4.3. CITOMETRÍA DE FLUJO ............................................................................. 50
4.3.1 VIABILIDAD CELULAR ............................................................................. 51
4.3.2. INMUNOFENOTIPO ................................................................................... 51
4.3.3. CICLO CELULAR ....................................................................................... 51
4.4. EXTRACCIÓN DE RNA Y SÍNTESIS DE DNA COMPLEMENTARIO
(cDNA) ....................................................................................................................... 52
4.5. REACCIÓN EN CADENA DE LA POLIMERASA (PCR) ............................... 52
4.5.1 PCR CONVENCIONAL ............................................................................... 53
4.5.2. PCR CUANTITATIVA ................................................................................ 53
4.6. SECUENCIACIÓN AUTOMÁTICA .............................................................. 54
4.7. HERRAMIENTAS BIOINFORMÁTICAS ..................................................... 54
5. RESULTADOS Y DISCUSIÓN ............................................................................. 56
5.1. MANUSCRITO I .............................................................................................. 59
5.2. MANUSCRITO II ............................................................................................ 65
5.3. MANUSCRITO III ........................................................................................... 76
5.4. MANUSCRITO IV ........................................................................................... 85
5.5. MANUSCRITO V .......................................................................................... 101
5.6. MANUSCRITO VI ......................................................................................... 129
6. CONCLUSIONES ................................................................................................. 141
7. BIBLIOGRAFÍA ................................................................................................... 143

RESUMEN| 1
1. RESUMEN
Las células madre mesenquimales (MSCs) presentan una capacidad de
autorrenovación y diferenciación a linajes derivados del mesodermo que las hacen
idóneas para su aplicación en el tratamiento de lesiones del aparato locomotor en la
especie equina. Las lesiones más comunes que sufren los caballos de carreras afectan a
tejidos como el tendón o cartílago, que presentan una capacidad muy limitada de
reparación. Las MSCs pueden contribuir a la formación de un tejido con propiedades
similares a las del tejido sano y evitar así el riesgo de recaídas.
Para poder aplicar con garantías las MSCs a la clínica equina es fundamental el
conocimiento de sus características. Por ello, en el presente trabajo de Tesis Doctoral se
han estudiado las características de las MSCs equinas derivadas de médula ósea (BM-
MSCs) y tejido adiposo (AT-MSCs) tanto en condiciones estándar de cultivo (20% O2)
como en condiciones denominadas de hipoxia (5% O2), más similares a la
concentración de oxígeno fisiológica que rodea a las células in vivo.
Antes de caracterizar las MSCs se realizó un ensayo para valorar la influencia
del tiempo que transcurre entre la toma de muestras y el aislamiento de las células sobre
su capacidad de autorrenovación. El retraso sufrido en el aislamiento de las células
supuso una pérdida de MSCs, ya que el número de colonias obtenidas fue
significativamente mayor cuando el aislamiento se llevó a cabo inmediatamente después
a la obtención del tejido que 24 horas después.
A continuación se estudió la capacidad de proliferación de las MSCs y su
potencial de diferenciación hacia linajes osteogénico y adipogénico. Los resultados
mostraron que las AT-MSCs dieron lugar a mayor número de células en cultivo que las
BM-MSCs. Ambos tipos celulares se diferenciaron hacia osteoblasto, presentando un
limitado potencial adipogénico. Posteriormente se determinó el fenotipo de las BM-
MSCs y AT-MSCs respecto a la expresión de ciertos marcadores de superficie por
citometría de flujo y PCR cuantitativa en tiempo real. Las MSCs equinas mostraron un

RESUMEN| 2
perfil de expresión similar al de la especie humana, observándose diferencias en la
expresión de ciertos marcadores entre BM-MSCs y AT-MSCs.
Por otra parte, el cultivo en condiciones de hipoxia no modificó la capacidad de
expansión, fenotipo o potenciales osteogénico y adipogénico de las BM-MSCs. Sin
embargo, la condrogénesis se vio potenciada por esta condición. El estudio de la
evolución del ciclo celular y la viabilidad de las MSCs de ambos orígenes en las dos
condiciones de oxígeno mostró que los cultivos en normoxia presentaron mayor número
de células, debido a una mayor actividad en la división celular en las BM-MSCs y a una
mayor viabilidad de los cultivos de las AT-MSCs. Además, las MSCs mostraron una
tendencia a una mayor expresión de marcadores de pluripotencia en hipoxia, lo que
indicaría que estas células se encontrarían en un estado menos diferenciado.
Las diferencias en las características de las MSCs in vitro podrían estar
relacionadas con variaciones en su capacidad terapéutica in vivo. Por ello y como parte
de un estudio pre-clínico de tratamiento de lesiones tendinosas en caballos, se analizó el
fenotipo y potencial de diferenciación osteogénico, adipogénico y condrogénico de las
BM-MSCs y AT-MSCs utilizadas en dicho estudio. Los resultados confirmaron los
obtenidos anteriormente para el fenotipo y potencial osteogénico. Además, ambos tipos
celulares mostraron similar capacidad de diferenciación adipogénica. Sin embargo, en
nuestras condiciones experimentales, aunque las BM-MSCs se diferenciaron claramente
hacia condrocito, las AT-MSCs mostraron un limitado potencial de diferenciación hacia
ese linaje.
SUMMARY
Mesenchymal stem cells (MSCs) display abilities of self-renewing and
differentiation towards mesoderm derived lineages which make them suitable for the
application on the treatment of locomotor system injuries in the equine species. Most
common types of injuries that racehorses suffer affect tissues such as tendon or
cartilage, which have limited capacity for tissue repair. MSCs might contribute to the
restoration of a tissue with similar properties to the healthy tissue and to reduce the risk
of re-injury.

RESUMEN| 3
In order to apply the MSC-based treatments safely to the equine clinical field it
is essential to understand their basic characteristics. Therefore, in the present Ph.D.
project the characteristics of equine MSCs derived from bone marrow (BM-MSCs) and
adipose tissue (AT-MSCs) have been studied, in standard culture conditions (20% O2)
and in conditions designated as hypoxia (5% O2), which more resemble the
physiological oxygen tension that surrounds the cells in vivo.
Before characterisation of the MSCs, an assay was performed to evaluate the
influence of the time between the sample harvesting and the cell isolation on the self-
renewing ability. It was shown that if a delay occurred before the cell isolation this lead
to a loss of MSCs.The number of colonies obtained was significantly higher when the
isolation was carried out straight after the harvesting than if it was done 24 hours later.
Subsequently, MSC proliferation as well as osteogenic and adipogenic
differentiation potentials were studied. The results indicated that AT-MSCs yield higher
number of cells in culture than BM-MSCs. Both cell types differentiated efficiently into
osteoblast but displayed a limited adipogenic potential. Subsequently, the phenotype of
BM-MSCs and AT-MSCs with respect to expression of certain cell surface markers was
determined by flow cytometry and quantitative real time PCR. Equine MSCs showed an
expression profile comparable to those of humans. However, differences in the
expression of some markers between BM-MSCs and AT-MSCs were observed.
Hypoxic culture conditions did not modify the expansion ability, phenotype, or
osteogenic and adipogenic potentials of BM-MSCs. However, chondrogenesis was
enhanced by low oxygen levels. The study of cell cycle progression and viability of
MSCs in the two oxygen conditions showed that normoxic cultures displayed higher
number of cells. This was because of higher cell division activity in the BM-MSCs and
higher viability in AT-MSC cultures in normoxia. Moreover, a tendency towards a
higher expression of pluripotency markers was observed in hypoxic MSCs, which may
suggest that these cells would remain in a more undifferentiated state.

RESUMEN| 4
The in vitro differences observed in the characteristics of the MSCs might bear a
relevance to their in vivo therapeutic capacity. Consequently, the phenotype, as well as
osteogenic, adipogenic and chondrogenic differentiation potentials of BM-MSCs and
AT-MSCs were analysed as a part of a pre-clinical trial to treat tendon injuries in
horses. The results confirmed the previous ones obtained for the phenotype and
osteogenic potential. In addition, both cell types showed a similar adipogenic
differentiation ability. However, in our experimental conditions, even though the BM-
MSCs were obviously able to differentiate into chondrocytes, the AT-MSCs showed a
limited potential of differentiation towards this lineage.

INTRODUCCIÓN Y OBJETIVOS| 5
2. INTRODUCCIÓN Y OBJETIVOS
2.1. INTRODUCCIÓN
El impacto económico que las actividades relacionadas con el caballo tiene en
los países desarrollados no se puede comparar con el de ninguna otra especie. La
industria relacionada con el caballo mueve aproximadamente 100 billones de dólares en
Estados Unidos, 5.000 millones de euros en Reino Unido y 900 millones en España [1,
2].
El potente aparato locomotor de estos animales es fundamental para el desarrollo
de competiciones deportivas. La aparición de lesiones que afecten a tejidos de este
sistema va a tener como resultado que el caballo no pueda llevar a cabo de forma
normal su actividad o que incluso esté comprometida su permanencia en ella obligando
a su prematura retirada [3].
El principal problema que presentan los tejidos como el tendón es su limitada
capacidad de regeneración. La cicatriz que se forma tras una lesión presenta una
arquitectura de fibras que no se corresponde con la del tendón nativo, consecuencia del
proceso de fibrosis que tiene lugar [4]. Las características del tendón cicatrizado, tanto
biomecánicas (de elasticidad y fuerza) como moleculares (proteínas que conforman la
matriz extracelular de los tendones), son inferiores a las del tendón normal, provocando
que el caballo no vuelva a alcanzar su nivel de actividad anterior a la lesión y
aumentando también el riesgo de recaída [5].
Finalmente, el caballo además de ser paciente es un animal modelo para el
estudio de lesiones en tendones y ligamentos en la especie humana debido a que la
naturaleza de las lesiones en los tendones flexores en caballo es similar a las del tendón
de Aquiles en atletas humanos [6]. Además también es considerado como animal
modelo para el estudio de problemas en cartílago articular debido a que la composición
molecular y el grosor del tejido es similar al de la especie humana [6]. Finalmente, el
caballo es el modelo animal más próximo al humano ya que el caballo puede ser
INTRODUCCIÓN Y OBJETIVOS| 6
sometido a un proceso de rehabilitación tras la aplicación de la terapia al igual que en
humanos, seguimiento que es imposible de aplicar en animales modelo de otras
especies.
Por estas razones es necesaria la búsqueda de un tratamiento que regenere los
tejidos afectados por lesiones para devolverles las propiedades y la funcionalidad
normales. El tratamiento mediante terapia celular es una alternativa a los tratamientos
convencionales de estos defectos. La terapia celular basada en la utilización de células
madre tiene como objetivo restaurar las propiedades de los tejidos lesionados. Aunque
existen diferentes tipos de células madre, las células madre adultas no plantean
problemas éticos y además pueden obtenerse de los mismos individuos que requieren el
tratamiento, eliminando así el problema del rechazo en los trasplantes [7]. Las células
madre mesenquimales (MSCs) son un tipo de células madre adultas que presentan la
característica de diferenciarse a todos los tejidos que derivan de la capa embrionaria del
mesodermo, la misma capa de las que proceden los tejidos que conforman el sistema
músculo esquelético, por lo tanto estas células se perfilan como las mejores candidatas a
utilizarse en la terapia para el tratamiento de lesiones de este sistema [8].
Aunque en la actualidad existen tratamientos basados en la utilización de MSCs
en la especie equina [9], los mecanismos por los que las células llevan a cabo la
regeneración no están del todo claros. El estudio de las características moleculares de
las MSCs es fundamental para conocer la forma de aplicación más eficiente en la
clínica. El estudio in vitro de las MSCs engloba la búsqueda de las fuentes de tejidos
que proporcionen MSCs y la caracterización a nivel molecular de las mismas.
Dentro del análisis de sus características, es esencial conocer su capacidad de
proliferación con el objetivo de poder obtener un número elevado de células para su uso
en terapia. También es necesario establecer el fenotipo que presentan estas células para
los diferentes marcadores de superficie para poder seleccionarlas de entre una población
heterogénea de células. Finalmente se requiere verificar si poseen capacidad de
diferenciación hacia los tipos celulares de tejidos derivados del mesodermo porque esta
característica podría ser fundamental para su función en la regeneración de tejidos
dañados.
INTRODUCCIÓN Y OBJETIVOS| 7
Así mismo, es necesario establecer cuales son las condiciones de cultivo más
adecuadas durante la expansión para potenciar las propiedades beneficiosas de estas
células antes de su uso en terapia celular. El oxígeno es un parámetro determinante para
procesos biológicos y moleculares [10]. Las MSCs cuando se encuentran en sus nichos
en el interior de los organismos están rodeadas por un ambiente de oxígeno
considerablemente más bajo que el porcentaje de oxígeno atmosférico que se utiliza en
los incubadores habitualmente [11]. Al someter a las células a un entorno diferente al
fisiológico sus características podrían resultar alteradas.
En el trabajo presentado para optar al grado de Doctora hemos analizado las
propiedades de las MSCs equinas derivadas de médula ósea y tejido adiposo en cultivos
in vitro. Inicialmente, se determinó el momento óptimo de aislamiento de las MSCs de
los tejidos de origen. A continuación, estas células se caracterizaron, analizando su
capacidad de proliferación, el fenotipo que presentan con respecto a la expresión de
marcadores de superficie celular, su potencial de diferenciación hacia los linajes
osteogénico, adipogénico y condrogénico y la expresión de marcadores de
pluripotencialidad. Además, también se determinó la variación de estas características al
utilizar una condición de oxígeno más parecida a la fisiológica durante la expansión de
las mismas (5% O2) comparándolas con MSCs expuestas a 20% de O2. Finalmente, esta
investigación se aplicó a un estudio clínico con el objetivo de determinar si las
variaciones observadas in vitro se ven reflejadas en la capacidad terapéutica de estas
células in vivo. Para ello se caracterizaron in vitro las BM-MSCs y AT-MSCs utilizadas
en un estudio pre-clínico de tratamiento de lesiones tendinosas inducidas
artificialmente.

INTRODUCCIÓN Y OBJETIVOS| 8
2.2. OBJETIVOS
El objetivo general planteado en la presente memoria de Tesis Doctoral es
conocer las características in vitro de las células madre mesenquimales equinas
utilizadas habitualmente en terapia celular de lesiones del aparato locomotor. Para la
consecución de este objetivo general se han propuesto los siguientes objetivos
específicos:
1. Determinar el momento óptimo de aislamiento de MSCs a partir
de los tejidos de origen.
2. Estudiar los potenciales de proliferación y diferenciación hacia
linajes ostegénico, adipogénico y condrogénico de las MSC derivadas de médula
ósea y tejido adiposo.
3. Analizar el fenotipo de estas células respecto a la expresión de
marcadores de superficie y marcadores de pluripotencialidad.
4. Evaluar el efecto de la expansión en distintas atmósferas de
oxígeno sobre las características in vitro de las MSCs equinas.
REVISIÓN BIBLIOGRÁFICA| 9
3. REVISIÓN BIBLIOGRÁFICA
3.1. CÉLULAS MADRE
Se define como célula madre a aquella célula no diferenciada que es capaz de
autorrenovarse y de diferenciarse en otros tipos celulares.
Las células madre presentan dos tipos de divisiones: la simétrica y la asimétrica.
La característica de autorrenovación viene dada a través de la división simétrica, las
células madre se dividen para dar dos células hijas que conservan las mismas
propiedades de célula madre. Mientras que la división asimétrica da lugar a células
progenitoras en un estado más diferenciado que la célula madre inicial, proporcionando
la capacidad de diferenciación de las células madre.
Las células madre se pueden clasificar en función de su potencial de
diferenciación en:
Totipotenciales: muestran la capacidad de dar lugar a tejidos
embrionarios (como placenta o cordón umbilical) y de cualquiera de las tres capas
embrionarias.
Pluripotenciales: tienen la habilidad de diferenciarse en cualquier célula
de las tres capas embrionarias.
Multipotenciales: su capacidad de diferenciación se ve restringida a sólo
uno de los linajes.
Somáticas: sólo serán capaces de diferenciarse al tipo celular del tejido
donde residen para mantener la homeostasis del mismo.
Otra forma de clasificar a las células madre es teniendo en cuenta el origen del
que proceden:
Células madre embrionarias: están presentes en las primeras etapas de
desarrollo del embrión, en el estado de blastocisto. Son células pluripotenciales.
Células madre germinales: se aíslan de los esbozos gonadales de los
embriones y son células pluripotenciales.

REVISIÓN BIBLIOGRÁFICA| 10
Células madre fetales: están en los tejidos y órganos fetales y tienen
características similares a sus homólogas en tejidos adultos. Su capacidad de
diferenciación no está del todo clara.
Células madre adultas: están en los tejidos y órganos de los individuos
adultos. Son células multipotenciales.
3.1.1. CÉLULAS MADRE EMBRIONARIAS.
Las células madre embrionarias son consideradas pluripotentes ya que presentan
la capacidad de diferenciarse a tejidos de las tres capas embrionarias [12]. Tienen
también la capacidad de proliferar continuamente gracias a un perfil transcripcional
único que las mantiene en un estado indiferenciado [13]. Los marcadores genéticos
específicos de las células madre embrionarias son SSEA-3, SSEA-4, OCT-4, SOX-2 y
NANOG, a los que se les denomina marcadores de pluripotencia, estos factores de
transcripción van a regular la supresión de los genes que promueven la diferenciación
[14]. Las células madre embrionarias además presentan la característica de pasar
desapercibidas por el sistema inmune debido la etapa tan temprana del desarrollo del
desarrollo en la que se encuentran [15].
3.1.2. CÉLULAS MADRE GERMINALES
Las células madre germinales se localizan en la cresta gonadal de los fetos. Este
lugar es un esbozo de las gónadas y es donde tiene lugar la diferenciación de la línea
germinal hacia óvulos y espermatozoides. Estas células son pluripotenciales y tienen
una capacidad de diferenciación similar a las embrionarias ya que son capaces de
diferenciarse a células de las tres capas embrionarias, pero su aislamiento resulta más
difícil [16].
3.1.3. CÉLULAS MADRE FETALES
Las células madre fetales se encuentran formando parte de los tejidos que
forman los órganos fetales. Su potencial de diferenciación es similar al de las células
REVISIÓN BIBLIOGRÁFICA| 11
madre adultas, aunque parecen mostrar mayor capacidad de expansión y diferenciación
que éstas al encontrarse en un estado más primitivo [17].
3.1.4. CÉLULAS MADRE ADULTAS
Las células madre adultas van a ser capaces de diferenciarse in vivo en células de
los tejidos en los que residen. Estas células se puede encontrar en la mayoría de los
órganos [18-20], pero sin duda, el tejido considerado como la mayor fuente de células
madre adultas es la médula ósea [21].
Las células madre adultas se encuentran dentro de tejidos en espacios
denominados nichos. Son capaces de autorrenovarse y mantener la homeostasis celular
en el tejido a través de procesos de diferenciación. Por medio del reemplazamiento de
las células muertas por células recién diferenciadas los tejidos se encuentran siempre en
constante renovación.
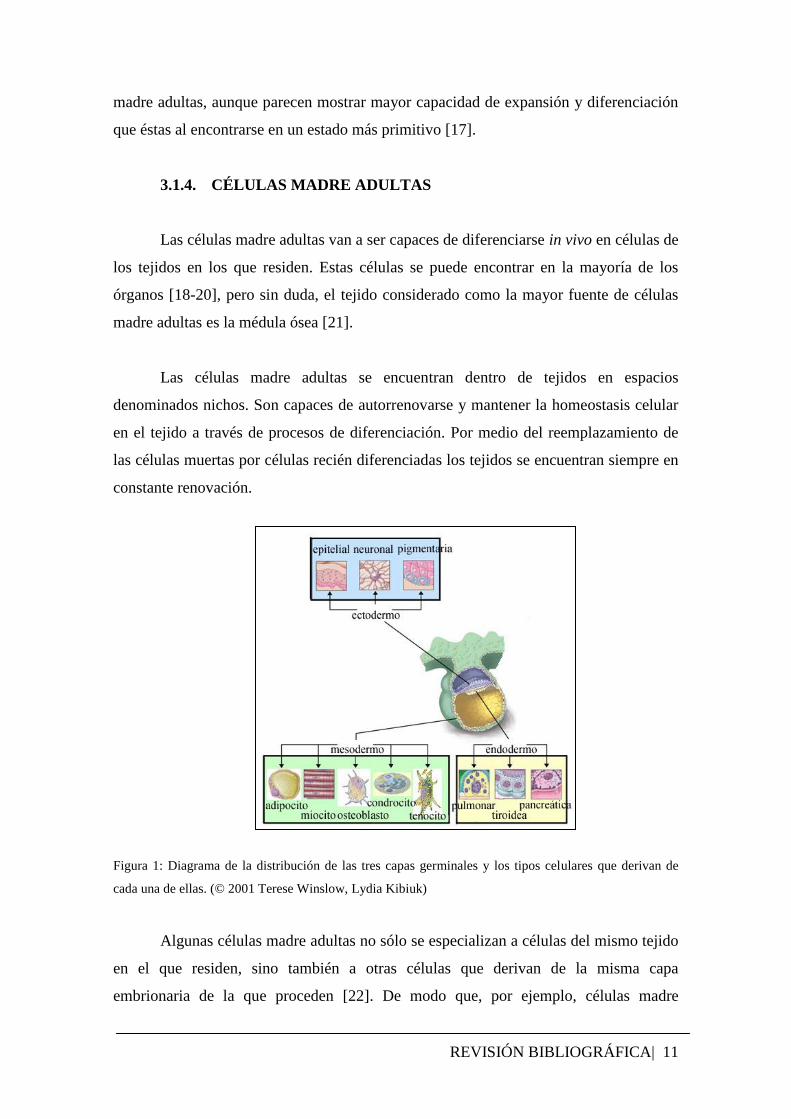
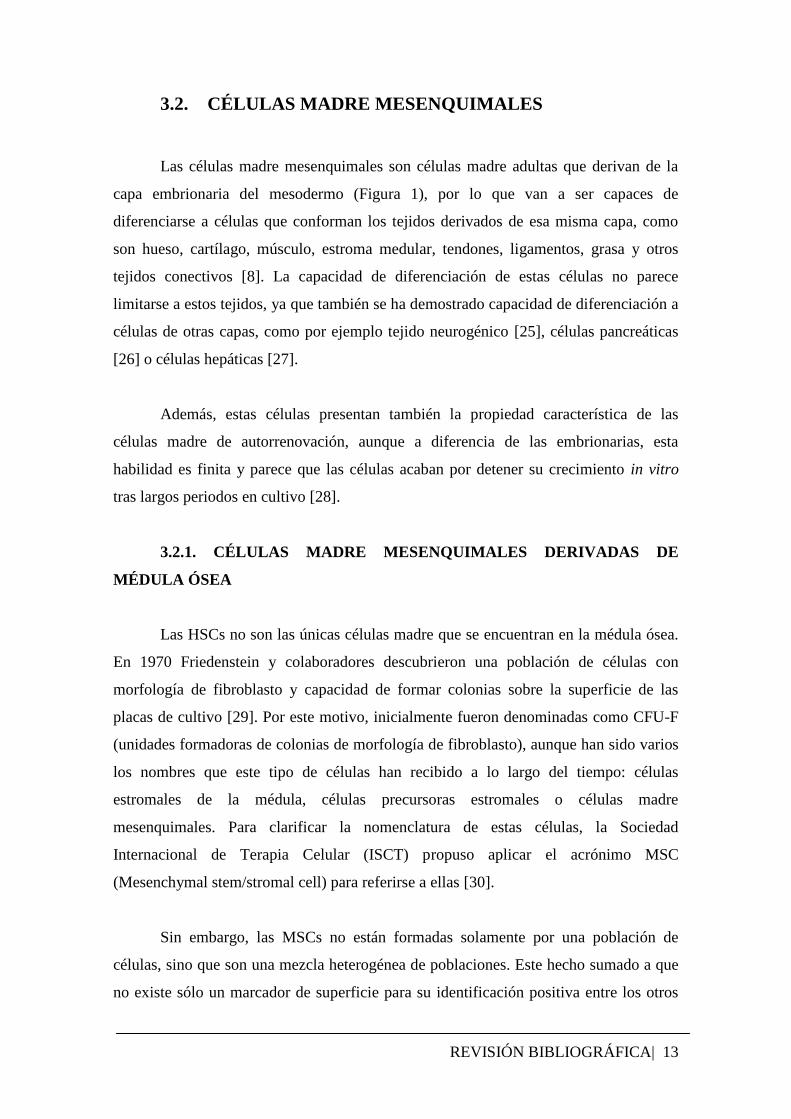
Figura 1: Diagrama de la distribución de las tres capas germinales y los tipos celulares que derivan de
cada una de ellas. (© 2001 Terese Winslow, Lydia Kibiuk)
Algunas células madre adultas no sólo se especializan a células del mismo tejido
en el que residen, sino también a otras células que derivan de la misma capa
embrionaria de la que proceden [22]. De modo que, por ejemplo, células madre

REVISIÓN BIBLIOGRÁFICA| 12
procedentes de la capa ectodérmica van a ser capaces de especializarse a células
epiteliales, o células procedentes del endodermo podrán dar lugar a células pancreáticas
(Figura 1).
En algunos casos, parece que la plasticidad que presentan las células madre
adultas no se detiene en la diferenciación a células de su misma capa embrionaria, ya
que, por ejemplo, células derivadas de la capa mesodérmica han demostrado ser capaces
de diferenciarse a células del endodermo, como los hepatocitos [23].
En mamíferos, la principal fuente de células madre adultas es la médula ósea.
Este tejido está compuesto por una red tridimensional de estroma y muchos tipos
celulares distintos (Figura 2). En la médula ósea se encuentran las células madre
hematopoyéticas (Hematopoietic Stem Cells, HSCs), que son las responsables de la
generación de todas las células sanguíneas y del sistema inmunitario. Desde el
descubrimiento de las propiedades regenerativas de las HSCs hace 50 años [24], se han
caracterizado y utilizado en trasplantes para el tratamiento de diversas patologías como
leucemias, linfomas, anemias aplásicas, inmunodeficiencias primarias y enfermedades
hereditarias que afectan a células hematopoyéticas.
Figura 2. Estructura de la médula ósea y de la diferenciación celular de las HSCs. (© 2001 Terese
Winslow, Lydia Kibiuk)
REVISIÓN BIBLIOGRÁFICA| 13
3.2. CÉLULAS MADRE MESENQUIMALES
Las células madre mesenquimales son células madre adultas que derivan de la
capa embrionaria del mesodermo (Figura 1), por lo que van a ser capaces de
diferenciarse a células que conforman los tejidos derivados de esa misma capa, como
son hueso, cartílago, músculo, estroma medular, tendones, ligamentos, grasa y otros
tejidos conectivos [8]. La capacidad de diferenciación de estas células no parece
limitarse a estos tejidos, ya que también se ha demostrado capacidad de diferenciación a
células de otras capas, como por ejemplo tejido neurogénico [25], células pancreáticas
[26] o células hepáticas [27].
Además, estas células presentan también la propiedad característica de las
células madre de autorrenovación, aunque a diferencia de las embrionarias, esta
habilidad es finita y parece que las células acaban por detener su crecimiento in vitro
tras largos periodos en cultivo [28].
3.2.1. CÉLULAS MADRE MESENQUIMALES DERIVADAS DE
MÉDULA ÓSEA
Las HSCs no son las únicas células madre que se encuentran en la médula ósea.
En 1970 Friedenstein y colaboradores descubrieron una población de células con
morfología de fibroblasto y capacidad de formar colonias sobre la superficie de las
placas de cultivo [29]. Por este motivo, inicialmente fueron denominadas como CFU-F
(unidades formadoras de colonias de morfología de fibroblasto), aunque han sido varios
los nombres que este tipo de células han recibido a lo largo del tiempo: células
estromales de la médula, células precursoras estromales o células madre
mesenquimales. Para clarificar la nomenclatura de estas células, la Sociedad
Internacional de Terapia Celular (ISCT) propuso aplicar el acrónimo MSC
(Mesenchymal stem/stromal cell) para referirse a ellas [30].
Sin embargo, las MSCs no están formadas solamente por una población de
células, sino que son una mezcla heterogénea de poblaciones. Este hecho sumado a que
no existe sólo un marcador de superficie para su identificación positiva entre los otros

REVISIÓN BIBLIOGRÁFICA| 14
tipos celulares de la médula ósea lleva a que sea difícil definir las MSCs. Por ello, la
ISCT definió en 2006 [31] una serie de estándares que las células aisladas de médula
ósea humanas deben cumplir para puedan ser denominadas como MSCs:
1. Capacidad de adherencia al plástico del material de cultivo
2. Expresión de ciertos marcadores de superficie: más de un 95% de las
células en cultivo deben mostrar en su superficie las moléculas CD105 (endoglina),
CD73 (SH2 y SH3) y CD90 (Thy-1); y menos de un 2% de las mismas deben ser
positivas en la detección de CD45 (antígeno común de leucocitos), CD34 (marcador de
células precursoras de células hematopoyéticas), CD14 ó CD11b y CD79α ó CD19 ó
HLA-DR.
3. Multipotencialidad de diferenciación a osteoblasto, adipocito y
condrocito.
Los estudios realizados sobre el análisis de estas características y otras más se
desarrollan más ampliamente en el Apartado 5.
La proporción de MSCs en la médula ósea es baja respecto del total de células
nucleadas [32], y disminuye a medida de que avanza la edad del individuo. En el caso
de humanos la proporción de células varía desde 1/10.000 (MSCs/células de médula
ósea) en los recién nacidos hasta 1/2.000.000 en personas de la tercera edad [8]. Esta
disminución en la proporción de MSCs sería una de las causas de la lentitud a la hora de
reparar tejidos dañados en las personas de avanzada edad, como por ejemplo roturas de
huesos. El origen del control de la proporción de MSCs y su disminución con el tiempo
en la médula ósea se desconoce.
3.2.2. CÉLULAS MADRE MESENQUIMALES DERIVADAS DE TEJIDO
ADIPOSO.
Durante mucho tiempo, la médula ósea fue la principal fuente de obtención de
células madre mesenquimales (BM-MSC). Sin embargo, estudios realizados durante la
pasada década revelaron el tejido adiposo como fuente alternativa de células madre
mesenquimales (AT-MSC) [33].
El tejido adiposo está constituido por adipocitos, preadipocitos, fibroblastos,
células endoteliales e inmunes [34]. Además, la cantidad de células obtenidas puede ser

REVISIÓN BIBLIOGRÁFICA| 15
mayor debido a la posibilidad de trabajar con mayor cantidad de tejido de partida [35] y
a que parece que las AT-MSCs muestran mayor tasa de proliferación que las MSCs que
residen en la médula ósea [14]. Además, al igual que las BM-MSCs, la proporción de
estas células en el tejido adiposo también parece disminuir con la edad del individuo
[36].
Las AT-MSCs, de la misma manera que sus equivalentes de médula ósea, se
pueden establecer en cultivos in vitro y también son capaces de diferenciarse hacia los
linajes osteogénico, adipogénico y condrogénico [37], así como a tejidos procedentes de
otras capas germinales como tejido neurogénico [38].
3.2.3. CÉLULAS MADRE MESENQUIMALES DERIVADAS DE
OTROS TEJIDOS
La médula ósea y el tejido adiposo son los principales tejidos de donde se
obtienen MSCs, pero no son los únicos, durante los últimos años han sido descritos el
aislamiento y caracterización de células mesenquimales de otros tejidos adultos como
sangre periférica [39], pulmón [40], músculo [41], líquido sinovial [42] y pulpa dental
[43]. Además de en estos tejidos, también se han aislado MSCs de tejidos no adultos
como sangre del cordón umbilical [44], tejido del cordón umbilical [45], líquido
amniótico y placenta [46].
3.3. TERAPIA CELULAR
La terapia celular se define como el trasplante de células vivas a un organismo
con el propósito de reparar un tejido o funciones perdidas. Las células que son utilizadas
en este tipo de terapia son empleadas como agentes terapéuticos para la reparación de
grupos de células o de tejidos que han sufrido algún daño y se plantean como alternativa
de terapia para aquellos procesos que no poseen tratamientos en la actualidad o los que
existen no son efectivos.
En los últimos años las células madre están siendo objeto de estudio para su
utilización en terapia celular. Las células madre embrionarias se han considerado como

REVISIÓN BIBLIOGRÁFICA| 16
las más interesantes para su utilización por su capacidad de diferenciarse a todos los
tejidos adultos. Sin embargo su utilización se encuentra limitada por los problemas de
carácter ético y moral que conlleva el trabajar con ellas, además de por el riesgo de
formación de teratomas al inyectar estas células como terapia [47]. Por ello, las células
madre adultas suponen una alternativa al uso de las embrionarias. Además presentan la
ventaja de que se pueden obtener del mismo individuo al que se va a tratar.
Alternativamente a las células madre adultas, las células madre derivadas de tejidos no
adultos suponen también una fuente de células importante para su utilización de forma
alogénica, debido a que se encuentran en un estado más primitivo que las adultas y no
plantean serios problemas éticos.
Las MSCs han demostrado ser una gran herramienta en la terapia celular debido
a su potencial de diferenciación y a su capacidad de autorrenovación. La plasticidad que
presentan estas células a la hora de diferenciarse las hace idóneas para reparar y
regenerar tejidos dañados, siendo sobretodo la habilidad de diferenciación a tipos
celulares de tejidos conectivos la que hace que las MSCs sean las candidatas ideales
como fuente de células para la terapia celular de enfermedades relacionadas con el
sistema musculoesquelético. La autorrenovación permite la obtención de las grandes
cantidades de células que son necesarias para la aplicación en terapia. Además las
MSCs también presentan la propiedad de pasar desapercibidas para el sistema
inmunológico, ya que el huésped no genera ninguna respuesta frente a ellas, lo cual
permite el trasplante de estas células de forma tanto autóloga y como alogénica, es
decir, entre pacientes o incluso entre especies diferentes de los que proceden las células
(xenotrasplante) [48]. Además debido a propiedades inmunológicas de las MSCs
presentan, éstas están siendo utilizadas en ensayos clínicos para el tratamiento de
enfermedades autoinmunes como la enfermedad de injerto contra huésped (GVHD)
[49] o la enfermedad de Crohn [8].
Desde que se aislaron por primera vez las MSCs, se ha estudiado cómo estas
células son capaces de reparar los tejidos de forma natural. A pesar del éxito de la
utilización de las MSCs como agente terapéutico en animales modelos para el
tratamiento de lesiones de tejidos, el nivel de inserción de las MSCs y la capacidad de
diferenciarse in vivo en el tejido dañado es reducido [50]. Parece que la habilidad de
regeneración de las MSCs a través de la inserción-diferenciación en el tejido es

REVISIÓN BIBLIOGRÁFICA| 17
secundaria, por lo que el principal sistema por el cual las células llevarían a cabo el
proceso de regeneración sería alterando el microambiente del tejido través de la
secreción de factores solubles. El mecanismo que gobernaría en la regeneración no está
del todo claro, pero parece ser que las MSCs trasplantadas secretarían factores
bioactivos que inhibirían la cicatrización y la apoptosis del tejido y estimularían la
angiogénesis y la mitosis de las células madre o progenitoras intrínsecas del tejido
dañado para regenerarlo. Esta actividad de secreción de factores por parte de las MSCs
se denominaría actividad trófica [8].
3.3.1. TERAPIA CELULAR EN ANIMALES MODELO Y ENSAYOS
CLÍNICOS.
Hasta el momento y debido a que la capa de origen embrionario de la que
proceden las MSCs es el mesodermo, las mayores aplicaciones para tratamientos
clínicos de estas células radican en su utilización para la regeneración de tejidos que
derivan también de esa misma capa, como hueso, cartílago, músculo o tendón. Sin
embargo, las MSCs han demostrado también su eficacia en numerosas estratégicas
terapeúticas en el tratamiento de diversos desórdenes, no solamente relacionados con
tejidos del sistema musculoesquelético.
A continuación se detallan algunos ejemplos de patologías en los que se ha
aplicado terapia celular utilizando diversas fuentes de células, tratando en mayor
profundidad aquellos realizados con MSCs.
3.3.1.1. TRATAMIENTO EN LESIONES ÓSEAS
Uno de las terapias con MSCs más importantes realizados hasta hoy es el uso de
este tipo de células como terapia en la osteogénesis imperfecta. Ésta es una enfermedad
congénita caracterizada por la malformación de los huesos y otros tejidos causada por la
mutación del gen del colágeno tipo I, como consecuencia de ello los enfermos que
padecen esta enfermedad sufren frecuentes fracturas de huesos. Los primeros estudios
de tratamiento con MSCs realizados en un modelo murino mostraron tras de la infusión
de las células se observó una recuperación funcional del hueso y el cartílago [51]. Este
tipo de terapia se ha llevado acabó con éxito en la especie humana. La aplicación de
REVISIÓN BIBLIOGRÁFICA| 18
MSCs alogénicas sobre niños con esta enfermedad, produjo nueva formación de hueso,
un aumento de la mineralización y una disminución en la frecuencia de las fracturas
solamente tres meses después del tratamiento [52].
3.3.1.2. TERAPIA EN LESIONES CARTILAGINOSAS
El cartílago tiene una capacidad limitada de reparación intrínseca, pequeños
daños se pueden reparar espontáneamente a través de la producción de cartílago hialino,
pero los defectos grandes se reparan por medio de la formación de tejido fibroso o
fibrocartílago cuyas propiedades bioquímicas y biomecánicas son diferentes al hialino.
Como consecuencia de esta sustitución de tejido, el cartílago presenta una degeneración
que puede derivar en osteoartritis [53].
Los tratamientos habituales para lesiones en el cartílago de las articulaciones
están basados en: métodos quirúrgicos para promover la estimulación de células de la
médula ósea y potenciar la secreción de citoquinas en el tejido [54], autotrasplantes de
injertos de cartílago sano del propio paciente (mosaicoplastia) [55] o la implantación de
condrocitos autólogos (ACI) [56]. Sin embargo estas técnicas o son invasivas como en
la estimulación y en el ACI o requieren cantidades de cartílago sano escaso en el
individuo como en la mosaicoplastia. Además el cartílago resultante de estos
tratamientos tampoco llega a alcanzar las características del cartílago nativo [57].
La terapia celular basada en la utilización de las MSCs es menos invasiva, ya se
realiza mediante inyección intraarticular [58]. Los resultados en animales modelos
como la cabra son positivos, en ellos se observa una regeneración del menisco y una
disminución de la degeneración del cartílago [59]. Sin embargo, en los ensayos clínicos
realizados en pacientes de osteoartritis los resultados obtenidos no muestran mejora
clínica significativa, aunque los síntomas de los pacientes parecen disminuir [60].
3.3.1.3. TRATAMIENTO DE LESIONES TENDINOSAS
Las tendinopatías son habituales en el campo ortopédico, más de 30 millones de
lesiones de este tipo se registran cada año en la especie humana [61] como consecuencia
de traumatismos, procesos inflamatorios, lesiones crónicas provocadas por el estrés de
la repetición mecánica o de la excesiva tensión. Los tendones están formados

REVISIÓN BIBLIOGRÁFICA| 19
fundamentalmente por fibras de colágeno alineadas (95% colágeno tipo I, 5% colágeno
tipo III y IV), y a pesar de encontrarse irrigados por vasos sanguíneos, esta
vascularización puede ser insuficiente en algunas zonas de los mismos [62]. Como
consecuencia de esto los tendones presentan también una limitada capacidad de
regeneración propia [63]. La cicatriz que se genera en la reparación tiene propiedades
biomecánicas inferiores a las del tendón nativo, debido a una incorrecta alineación de
las fibras de colágeno cuando se reestructura la matriz extracelular que conforma el
tendón [64].
Los tratamientos que se han estado llevando a cabo para curar este tipo de
lesiones se han basado en autotrasplantes, alotrasplantes, xenotrasplantes de partes de
tendón sano y prótesis, pero todos estos métodos han fallado a la hora de devolver la
funcionalidad y las propiedades mecánicas adecuada al tendón a largo plazo [65].
Las terapias actuales que se está llevando a cabo están obteniendo resultados
positivos en modelos animales. El objetivo de estos estudios es que el tendón recobre la
fuerza y elasticidad que poseía antes de que apareciera la lesión. La utilización de
factores de diferenciación y factores de crecimiento tales como IGF, con actividad
mitogénica para reparar el tejido, han mejorado la capacidad de curación de tendones en
conejos por medio de un aumento en la proliferación de tenocitos en el tendón, y de la
síntesis de COL1A1 y proteoglicanos [66]. En tendones de Aquiles de rata lesionados
de forma artificial han incrementado la fuerza de tracción biomecánica del tendón
semanas después de la administración [67].
Otro de los tratamientos más extendidos es el uso de plasma rico en plaquetas
(PRP) porque posee una concentración elevada de factores de crecimiento, es fácil y es
barato de obtener. Además de los factores de crecimiento, también contiene fibrina,
fibronectina y vitronectina, importantes para la adhesión celular y la migración epitelial
[68]. Tras de la administración de PRP se observa un incremento de células
infiltrándose en el sitio del tendón a reparar [69]. El PRP también proporciona un
aumento en la resistencia y la elasticidad del tendón [70]. Sin embargo en la especie
humana, la administración de PRP en el tendón de Aquiles ha dado lugar a resultados
dispares. En algunos casos no se observó cambio alguno ni en la actividad ni en el dolor

REVISIÓN BIBLIOGRÁFICA| 20
ni en la curación final del tendón [71], y en otros la recuperación de la movilidad fue
rápida y no hubo complicaciones de ningún tipo tras la lesión [72].
El tratamiento de tendinopatías con MSCs ha dado resultados prometedores en el
conejo, ya que se ha observado aumento de la calidad histológica y de la fuerza
biomecánica del tendón lesionado y tratado [73]. Las MSCs autólogas son capaces de
recuperar un 20% de las funciones nativas del tendón aunque de forma dependiente de
la dosis [74]. Además, también se ha observado una mejora del 37% en la biomecánica
y la arquitectura del tejido en tendones de Aquiles [75]. Si las MSCs se cultivan in vitro
con factores como el BMP-12, implicado en la tenogénesis, la capacidad de regenerar el
tendón se ve incrementada por medio del aumento del número de células con fenotipo
de tenocito, la elongación y el alineamiento de las fibras, y una mayor deposición de
componentes de la matriz extracelular [76].
3.3.1.4. TRATAMIENTO DE LESIONES CARDÍACAS
El músculo cardíaco es un tejido con una pobre capacidad de regeneración tras
haber sufrido isquemia. Este fenómeno produce la muerte de cardiomiocitos tras sufrir
un infarto lo que puede terminar derivando en un fallo cardíaco. Debido a esto existe un
elevado interés en encontrar células capaces de restaurar el tejido sano del miocardio y
con ello mejorar la función del corazón. Se ha estudiado la posibilidad de utilizar varios
tipos celulares para el tratamiento de defectos en el corazón, como el trasplante autólogo
de células musculares satélite [77] o el de mioblastos [78]. Sin embargo las células
ideales para aplicar al tratamiento serían aquellas en un estadío menor de diferenciación
para que pudieran dar lugar a una diferenciación cardiomiogénica completa. Las MSCs
derivadas de médula ósea podrían ser estas candidatas ya que han demostrado la
habilidad de diferenciarse hacia linaje miogénico in vivo [79]. Estudios realizados en
ratón revelan la capacidad de las MSCs para introducirse en el tejido dañado y adquirir
el fenotipo de cardiomiocito [80]. En ensayos realizados en humano la infusión de
MSCs autólogas ha mejorado la función contráctil del corazón 3 meses después del
tratamiento [81], aunque parece que estas mejoras se deben más a la actividad trófica de
las células que a su diferenciación [82], ya que muy pocas células parecen capaces de
integrarse en el tejido [80].
REVISIÓN BIBLIOGRÁFICA| 21
3.3.1.5. TERAPIA INMUNOMODULADORA
La enfermedad de injerto contra huésped (GVHD) es una de las complicaciones
más frecuentes asociadas al trasplante alogénico de médula ósea. En esta patología las
células del injerto atacan a las células del huésped como resultado de la activación de
las células T del injerto. Con los tratamientos inmunosupresores convencionales no
siempre se puede controlar esta respuesta, por lo que hay que encontrar medios
adicionales para disminuir la reactividad de las células T, como la eliminación de la
población de células T del injerto a trasplantar [83] o únicamente de las alorreactivas
[84]. Rrecientemente, el descubrimiento de las propiedades inmunosupresoras de las
MSCs in vivo e in vitro [85], acompañadas de la falta de inmunogeneicidad que
presentan estas células [86], ha hecho que se empiecen a utilizar en ensayos clínicos
para el tratamiento de esta enfermedad. Cuando se realiza el trasplante de médula ósea
en los pacientes se co-trasplantan también MSCs procedentes del mismo donante para
que controlen la actividad de las células T y así evitar la aparición GVHD [87].
Existen más ejemplos de enfermedades relacionadas con el sistema inmune en el
que se están aplicando terapias basadas en MSCs. Uno de ellos es el lupus eritematoso
sistémico, en que se han llevado a cabo trasplantes de MSCs alogénicas en ratones
modelos, obteniendo una inhibición in vivo de la proliferación y función de linfocitos B
y T [88]. Otro patología sería la enfermedad de Crohn, en la que la piel dañada por la
aparición de fístulas se podría regnerar por medio de terapia celular [89].
3.3.2. TERAPIA CELULAR EN CABALLOS
El caballo es un animal que se utiliza como modelo para la investigación en
terapia celular, especialmente para aquellos tratamientos orientados hacia la
regeneración de lesiones de los tejidos musculoesqueléticos. Este animal es considerado
como modelo para el estudio de defectos en las articulaciones debido a que el grosor del
cartílago articular y la composición molecular es similar al del cartílago humano [90].
También es considerado como animal modelo para el estudio de lesiones que se
producen en tendones y ligamentos [91], la naturaleza de estas lesiones son similares a
las que se producen en atletas humanos, siendo los problemas del tendón de Aquiles los
REVISIÓN BIBLIOGRÁFICA| 22
de mayor similitud con los de los tendones que comúnmente se lesionan en los caballos
[92]. Otra de las razones para considerar el caballo como modelo animal es que el
caballo puede ser sometido a periodos de rehabilitación posteriores a la terapia,
procedimiento realizado en humanos después de que se les sea aplicada la terapia.
Sin embargo, el caballo no sólo sirve como animal modelo para el tratamiento de
enfermedades relacionadas con humanos, sino que debido a su importancia económica
constituye también un paciente para la terapia celular. En Estados Unidos la industria
relacionada con el caballo mueve 102 billones de dólares (80.397 millones de €) al año
y en Reino Unido 5.030 millones de € [2]. En España, en el año 2001, el mundo del
caballo movió 900 millones de € a través de carreras, competiciones deportivas como
doma clásica, exhibiciones o actividades de ocio y sector ganadero [1]. Por todo ello, las
lesiones musculoesqueléticas en estos animales pueden provocar una grave pérdida
económica.
Las lesiones articulares son la causa de un 60% del total de las cojeras en caballo
[93], mientras que las lesiones que afectan al tendón son el mayor riesgo de baja de los
caballos de competición [5]. La terapia celular aplicada al campo de las lesiones del
aparato locomotor de caballos es esperanzadora. Durante la pasada década, varios
ensayos con células madre han dado resultados positivos en el tratamiento de este tipo
de lesiones en caballos. Como consecuencia de ello han surgido compañías comerciales
con origen en grupos de investigación universitarios dedicadas al tratamiento de estas
lesiones en caballos atletas [94] por medio de la utilización de MSCs expandidas in
vitro.
La Figura 3 muestra un esquema del proceso completo del tratamiento que
recibe un caballo cuando es tratado con terapia celular de MSCs. En primer lugar se
toma una muestra de los tejidos que contienen MSCs del caballo lesionado,
generalmente de médula ósea o tejido adiposo. Después, las MSCs se aíslan de los
tejidos, se expanden durante varios pases en un medio de cultivo adecuado, se
reimplantan en la lesión del animal por ecografía y finalmente, el animal sigue un
programa de ejercicios de recuperación en el que la intensidad se incrementa
gradualmente con los meses.

REVISIÓN BIBLIOGRÁFICA| 23
Figura 3. Esquema del tratamiento con MSCs a caballos con lesiones relacionadas con el sistema
locomotor. Adaptado de VetCell MS-EQ™.
3.3.2.1. TRATAMIENTO DE LESIONES DE CARTÍLAGO
La etiología de las lesiones en el cartílago articular en caballo incluye el
padecimiento de enfermedades (como la osteoartritis) y los traumatismos. La
consecuencia en ambos casos es la aparición de cojera en el animal y por tanto un pobre
desarrollo de su actividad, que puede terminar obligando al animal a retirarse de la
competición [95]. Los tratamientos agresivos como la microfractura, consistente en la
perforación del hueso subcondral para atraer a células y factores de crecimiento hasta la
lesión, no han dado buenos resultados [96]. Por el contrario, la utilización de la terapia
celular para el tratamiento de articulaciones con condrocitos sanos [97] o condrocitos
acompañados del IGF-I [98] estimula la producción de matriz extracelular y preserva el
fenotipo de los condrocitos en el tejido.
Sin embargo, la terapia celular basada en el implante de condrocitos autólogos
presenta limitaciones, como la obtención de las células y el número limitado de pases
que pueden estar estas células en cultivo antes de desdiferenciarse. La utilización de
MSCs se plantea como la terapia celular con grandes posibilidad de éxito en caballos.
Hasta el momento se han utilizado MSCs procedentes de distintas fuentes. Wilke y
colaboradores, realizaron inyecciones intraarticulares de BM-MSCs junto con fibrina en
lesiones inducidas obteniendo una mejora de las características de la articulación a corto

REVISIÓN BIBLIOGRÁFICA| 24
plazo con la inyección con células respecto a los controles de fibrina sola. Sin embargo,
esta diferencia desparecía a largo plazo, posiblemente debido a la muerte de las MSCs
inyectadas [99]. Frisbie y colaboradores también indujeron de forma artificial lesiones
en las articulaciones de caballos e inyectaron BM-MSCs y fracción del estroma vascular
del tejido adiposo (SVF), observando una mayor magnitud en la restauración de las
propiedades del tejido por parte de las BM-MSCs [94]. La seguridad de la terapia con
MSCs en el tratamiento de estas patologías también ha sido objeto de estudio en la
especie equina. Carrade y colaboradores para comprobar la respuesta inmune de
articulaciones sanas tras el tratamiento con MSCs autólogas y alogénicas derivadas de
placenta. Aunque detectaron inflamación tras la inyección de ambos tipos celulares, el
estudio citológico y clínico no detectó ningún tipo de infección ni rechazo [100].
3.3.2.2. TRATAMIENTO DE LESIONES TENDINOSAS
Los tendones son los tejidos que unen los músculos y los huesos y que
estabilizan las articulaciones. En el caballo, cuyas extremidades delanteras son más
alargadas, los tendones adquieren grandes dimensiones, como ocurre en el caso del
tendón flexor digital superficial (SDFT) y del tendón flexor digital profundo (DDFT)
(Figura 4). Estos tendones están localizados en los extremos de las patas y están
expuestos a un peso muy elevado. Cuando el caballo galopa absorben y liberan gran
cantidad de energía elástica para llevar a cabo el movimiento, llevando al límite el
esfuerzo que realiza el tendón [101]. Como consecuencia de la tensión a la que se ve
sometido el tendón cuando el animal está realizando esta actividad, pueden aparecer
sobrecargas en el tejido o tendinitis, alterando la función de elasticidad que es crítica
para la resistencia y velocidad del caballo [5]. El tendón más afectado por este
fenómeno en caballos es el SDFT.
A nivel molecular, antes de que se produzca la lesión existe una fase previa de
degeneración del tendón durante la cual se debilita, de forma que la práctica habitual del
ejercicio empuja al tendón a trabajar más allá de su límite provocando el daño [102].
La curación espontánea es lenta y se lleva a cabo por medio de un proceso de
fibrosis [103], el tejido lesionando se va rellenando de fibras de colágeno tipo III en
lugar de colágeno tipo I dando lugar a un tejido menos entrecruzado y por lo tanto

REVISIÓN BIBLIOGRÁFICA| 25
menos fuerte [4]. Como consecuencia de esto el tejido nuevo se genera en forma de
cicatriz, con una arquitectura de fibras diferente a la normal del tendón, haciendo que,
aunque el tendón esté ya curado, sea funcionalmente deficiente. Esto se traduce en que
el caballo no pueda realizar el nivel de actividad previo a la lesión, aumentando el
riesgo de recaída [104].
Figura 4. Anatomía de los ligamentos y tendones de la extremidad distal del caballo.
El objetivo de la regeneración in vivo de los tendones en équidos es el de
recuperar la funcionalidad del tejido a través de la restauración de las propiedades
mecánicas y biológicas que tenía previamente a la lesión. Por tanto el objetivo que se
plantean las estrategias regenerativas para el tratamiento de estas lesiones es el de
utilizar células y factores que ayuden a la regeneración de la matriz extracelular que
conformará el tejido para que lo hagan de la forma más aproximada posible a la matriz
que poseía inicialmente el tendón. Smith y colaboradores, en 2003, fueron los primeros
en utilizar BM-MSCs resuspendidas en sobrenadante de médula ósea autólogo en el

REVISIÓN BIBLIOGRÁFICA| 26
tratamiento de lesiones tendinosas centrales espontáneas en el SDFT, tras el tratamiento
no se observaron reacciones adversas ni formación de tumores [105]. La eficacia de este
tratamiento quedó demostrada en un el seguimiento realizado tras la administración de
las células, que mostró que el 98,2% de caballos de carreras con lesiones en el SDFT
volvieron a competir con un bajo índice de recaída en la lesión (27,4%) [9]. En ensayos
clínicos controlados, las BM-MSCs se han convertido en las células más utilizadas para
investigar el uso de la terapia celular en lesiones en el SDFT. Estas células han sido
administradas en suspensión con distintos factores como fibrinógeno [106], suero
autólogo [107], BM-MSCs modificadas genéticamente que sobreexpresan la IGF-I
[108], factor de crecimiento capaz de estimular la curación del tendón por sí solo [66].
Los resultados obtenidos en estos ensayos muestran una mejora ecográfica en la
alineación de las fibras en el tendón respecto a los controles y cambios significativos en
la histología de los tejidos tratados, sin embargo no se observan diferencias
significativas en la expresión de genes relacionados con el metabolismo del tendón
[108].
También se ha aplicado terapia celular con células procedentes de otros
orígenes, Nixon y colaboradores administraron SVF derivadas de tejido adiposo en un
modelo de lesión inducida con colagenasa. Aunque observaron pocos cambios
ecográficos y de expresión de marcadores genéticos entre tendones control y tratados, la
histología reveló diferencias significativas [109]. Watts y colaboradores en cambio
optaron por la administración de células fetales embrionarias equinas en el mismo
modelo de lesión, obteniendo también una mejora en la alineación de las fibras en los
tendones de los animales tratados pero, al igual que en casos anteriores, sin
correspondencia en la expresión de genes marcadores [110].
Por tanto, aunque los resultados que se van obteniendo presentan ventajas
respecto a los tratamientos tradicionales para las lesiones del aparato locomotor, todavía
quedan incógnitas sin resolver, entre otras la dosis óptima de MSCs a administrar, el
número de administraciones, el medio de suspensión para hacerlo y el momento preciso
para llevarlo a cabo. La mayoría de los trabajos se centran en el efecto de las BM-
MSCs, y no exploran otras fuentes alternativas de células para investigar su potencial
regenerativo.

REVISIÓN BIBLIOGRÁFICA| 27
3.4. CARACTERIZACIÓN DE LAS CÉLULAS MADRE
MESENQUIMALES
A pesar de que el tratamiento con MSCs ya es una realidad, todavía no se
conocen en profundidad las propiedades que presentan estas células y las diferencias
que presentan cuando son obtenidas de diferentes fuentes. Por ello, antes de ser
utilizadas de forma masiva en el tratamiento de pacientes es necesario el desarrollo de
estudios básicos para su caracterización y el desarrollo de metodologías adecuadas para
su expansión y cultivo.
3.4.1. POTENCIAL DE AUTORRENOVACIÓN Y PROLIFERACIÓN
La autorrenovación es la habilidad de las células para generar idénticas copias de
ellas mismas durante mucho tiempo y sin perder su estado no diferenciado. Debido a la
heterogeneicidad de poblaciones que presentan las MSCs, los resultados de los estudios
sobre la capacidad de proliferación han sido muy variables, aunque todos ellos
demuestran que las MSCs son capaces de mantenerse largos periodos de tiempo en
cultivo in vitro sin diferenciarse. En la especie humana se ha descrito que las BM-MSC
pueden doblarse aproximadamente 38 veces en cultivo, lo que correspondería con unos
15 pases [111]. Aunque la tasa de proliferación de las AT-MSCs es mayor en la misma
especie [112], el tiempo que llegan a permanecer en cultivo es parecido, ya que se han
conseguido expandir también hasta el pase 15 [113].
De forma habitual las MSCs se cultivan in vitro utilizando medios de cultivo,
como por ejemplo Dulbecos’s modified Eagle’s médium (DMEM) suplemententados
con suero fetal bovino como sustrato para el crecimiento. Pero si a los cultivos de
MSCs, derivadas tanto de médula ósea como de tejido adiposo, se les añaden factores
de crecimiento que potencien la división mitótica, como el factor de crecimiento de
fibroblasto 2 (FGF-2), el potencial de crecimiento de las MSCs aumenta y las células
puede llegar a superar los 70 doblajes en las derivadas de médula [114] y hasta 150 en
las derivadas de tejido adiposo [115].
REVISIÓN BIBLIOGRÁFICA| 28
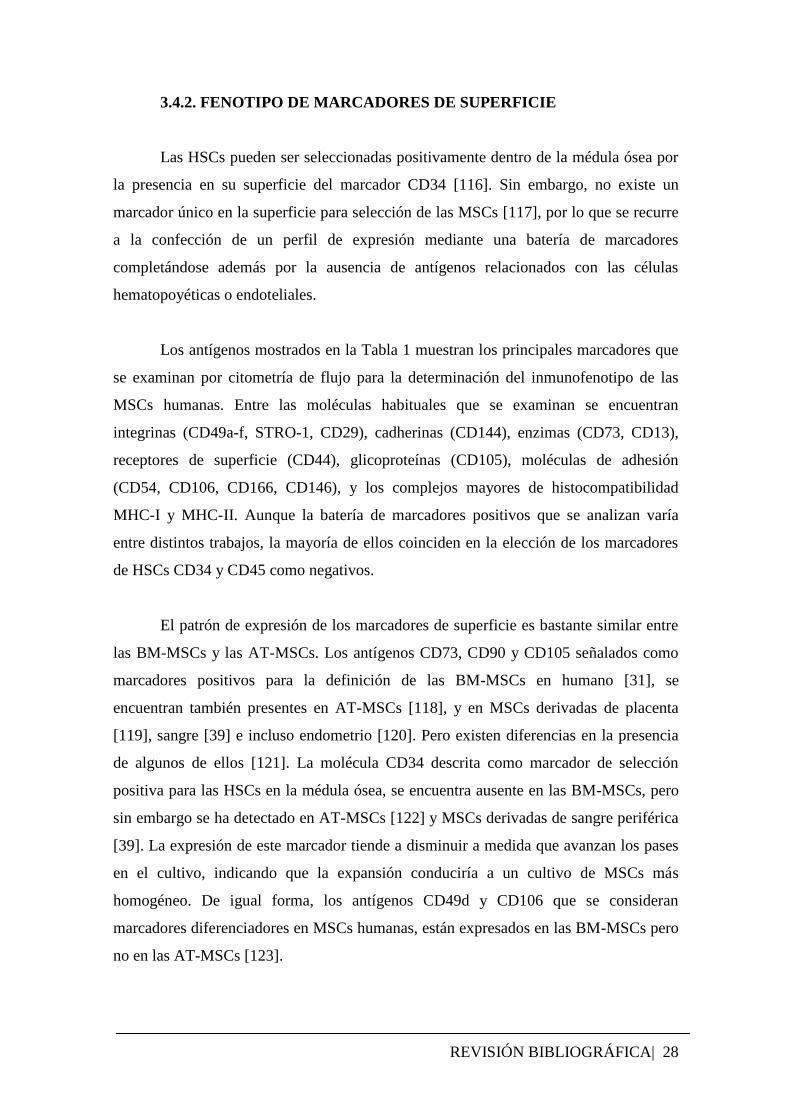
3.4.2. FENOTIPO DE MARCADORES DE SUPERFICIE
Las HSCs pueden ser seleccionadas positivamente dentro de la médula ósea por
la presencia en su superficie del marcador CD34 [116]. Sin embargo, no existe un
marcador único en la superficie para selección de las MSCs [117], por lo que se recurre
a la confección de un perfil de expresión mediante una batería de marcadores
completándose además por la ausencia de antígenos relacionados con las células
hematopoyéticas o endoteliales.
Los antígenos mostrados en la Tabla 1 muestran los principales marcadores que
se examinan por citometría de flujo para la determinación del inmunofenotipo de las
MSCs humanas. Entre las moléculas habituales que se examinan se encuentran
integrinas (CD49a-f, STRO-1, CD29), cadherinas (CD144), enzimas (CD73, CD13),
receptores de superficie (CD44), glicoproteínas (CD105), moléculas de adhesión
(CD54, CD106, CD166, CD146), y los complejos mayores de histocompatibilidad
MHC-I y MHC-II. Aunque la batería de marcadores positivos que se analizan varía
entre distintos trabajos, la mayoría de ellos coinciden en la elección de los marcadores
de HSCs CD34 y CD45 como negativos.
El patrón de expresión de los marcadores de superficie es bastante similar entre
las BM-MSCs y las AT-MSCs. Los antígenos CD73, CD90 y CD105 señalados como
marcadores positivos para la definición de las BM-MSCs en humano [31], se
encuentran también presentes en AT-MSCs [118], y en MSCs derivadas de placenta
[119], sangre [39] e incluso endometrio [120]. Pero existen diferencias en la presencia
de algunos de ellos [121]. La molécula CD34 descrita como marcador de selección
positiva para las HSCs en la médula ósea, se encuentra ausente en las BM-MSCs, pero
sin embargo se ha detectado en AT-MSCs [122] y MSCs derivadas de sangre periférica
[39]. La expresión de este marcador tiende a disminuir a medida que avanzan los pases
en el cultivo, indicando que la expansión conduciría a un cultivo de MSCs más
homogéneo. De igual forma, los antígenos CD49d y CD106 que se consideran
marcadores diferenciadores en MSCs humanas, están expresados en las BM-MSCs pero
no en las AT-MSCs [123].
REVISIÓN BIBLIOGRÁFICA| 29
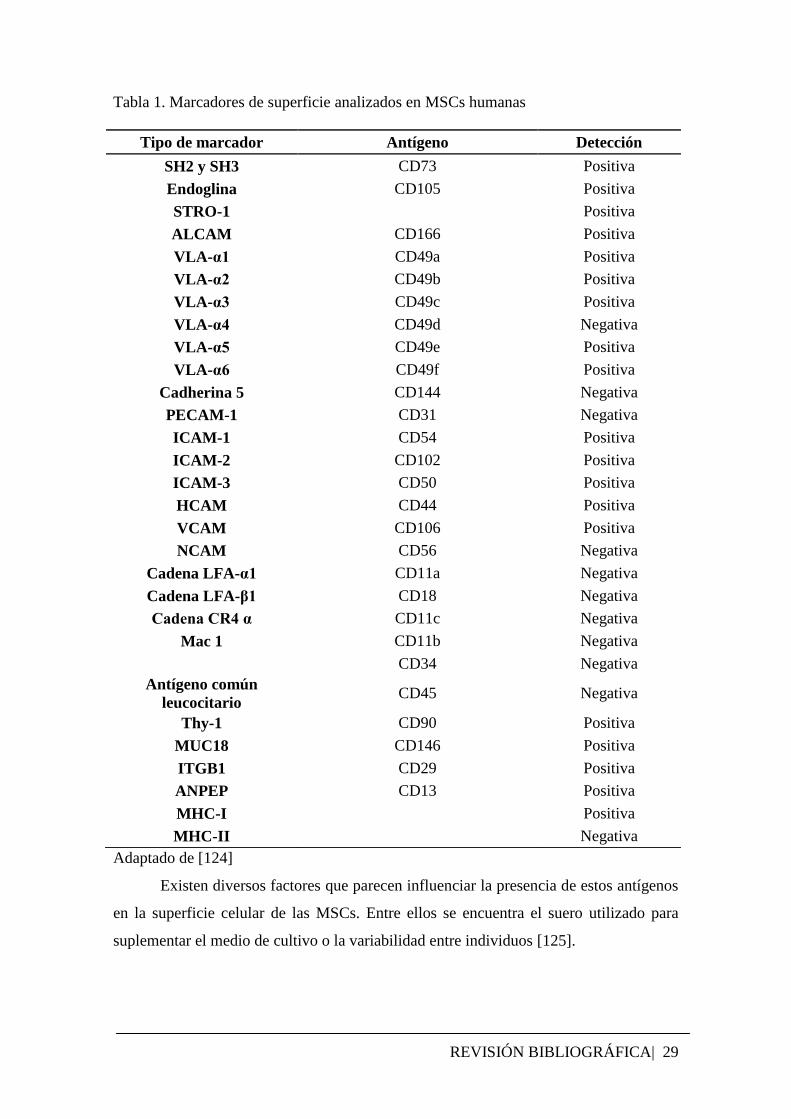
Tabla 1. Marcadores de superficie analizados en MSCs humanas
Adaptado de [124]
Existen diversos factores que parecen influenciar la presencia de estos antígenos
en la superficie celular de las MSCs. Entre ellos se encuentra el suero utilizado para
suplementar el medio de cultivo o la variabilidad entre individuos [125].
Tipo de marcador Antígeno Detección
SH2 y SH3 CD73 Positiva
Endoglina CD105 Positiva
STRO-1 Positiva
ALCAM CD166 Positiva
VLA-α1 CD49a Positiva
VLA-α2 CD49b Positiva
VLA-α3 CD49c Positiva
VLA-α4 CD49d Negativa
VLA-α5 CD49e Positiva
VLA-α6 CD49f Positiva
Cadherina 5 CD144 Negativa
PECAM-1 CD31 Negativa
ICAM-1 CD54 Positiva
ICAM-2 CD102 Positiva
ICAM-3 CD50 Positiva
HCAM CD44 Positiva
VCAM CD106 Positiva
NCAM CD56 Negativa
Cadena LFA-α1 CD11a Negativa
Cadena LFA-β1 CD18 Negativa
Cadena CR4 α CD11c Negativa
Mac 1 CD11b Negativa
CD34 Negativa
Antígeno común
leucocitario CD45 Negativa
Thy-1 CD90 Positiva
MUC18 CD146 Positiva
ITGB1 CD29 Positiva
ANPEP CD13 Positiva
MHC-I Positiva
MHC-II Negativa

REVISIÓN BIBLIOGRÁFICA| 30
La caracterización de los marcadores de superficie a través de citometría de flujo
supone un reto para las MSCs derivadas de animales, ya que los anticuerpos
comerciales están diseñados para reaccionar contra antígenos humanos y murinos,
mostrando, en general, una baja reactividad frente a las moléculas de otras especies
animales [126].
3.4.3. POTENCIALES DE DIFERENCIACIÓN
Las MSCs al derivar de la capa embrionaria del mesodermo presentan la
capacidad de diferenciarse a células especializadas de tejidos que también derivan de
ella. Tanto in vivo como in vitro se ha demostrado la capacidad de diferenciación de las
MSCs a hueso [111], cartílago [127], tendón [128], músculo [129], tejido adiposo [130]
y estroma de la médula ósea [21] (Figura 5).
Figura 5: Esquema de los diferentes linajes que resultan de la diferenciación de las BM-MSCs.
La heterogenicidad de poblaciones de las MSCs también se ve reflejada en la
capacidad de diferenciación a los diferentes linajes. Estudios realizados en la especie
humana han demostrado que un tercio de los clones iniciales que se adhieren a la placa
de cultivo después del aislamiento de las células muestran capacidad de diferenciar
hacia los tres linajes (osteogénico, condrogénico y adipogénico) [131]. Sin embargo,

REVISIÓN BIBLIOGRÁFICA| 31
alrededor de aproximadamente un 80% de los clones presentan la bipotencialidad de
diferenciarse hacia condrocito y osteoblasto [132].
A medida que el cultivo de MSCs va avanzando en el número de pases, los
potenciales de multidiferenciación in vitro se pierden, siendo comúnmente las
capacidades de diferenciación hacia linajes adipogénicos y condrogénicos las que
desaparecen, quedando la osteogénesis como único linaje al que las MSCs son capaces
de diferenciarse [132].
3.4.3.1. DIFERENCIACIÓN ADIPOGÉNICA
El compromiso y diferenciación de las MSCs hacia adipocito requiere la
expresión y acción secuencial en la célula de varios factores reguladores. La activación
conjunta de los factores de transcripción PPAR (receptor gamma activado por
proliferador de peroxisoma) y C/EBPα (proteína ligante a CCAAT) es la
desencadenante del inicio de la diferenciación. Estas dos proteínas se unen a secuencias
específicas de DNA para activar la expresión de genes diana, que van a crear y
mantener el fenotipo de adipocito y van a inducir el arresto del ciclo celular. Los genes
que codifican para estas moléculas se regulan positivamente durante las primeras etapas
de la adipogénesis y por ello se consideran de expresión temprana [133].
PPAR y C/EBPα también regulan la expresión de genes relacionados con el
metabolismo de lípidos. Estos marcadores adipogénicos van a ayudar en el seguimiento
de las diferentes etapas de la diferenciación adipogénica y entre ellos vamos a encontrar
marcadores de expresión temprana, intermedia y tardía. Por ejemplo, la LPL
(lipoprotein lipasa), la enzima que cataliza la hidrólisis de los triglicéridos para
controlar la acumulación de lípidos, se considera marcador temprano [134]. También se
activa la expresión de genes que codifican para proteínas que no están relacionadas con
el metabolismo de lípidos, como es el caso de la proteína aP2 (proteína de unión
específica a ácidos grasos) que está involucrada en el transporte intracelular de ácidos
grasos, y va a ser considerado un marcador intermedio de adipogénesis [135]. Los genes
que codifican para la los factores de secreción adipsina y la leptina por parte de los
adipocitos maduros, y la ACBP (proteína de unión acil-coenzima A) relacionada con el
metabolismo de la acil-CoA, se consideran marcadores tardíos de adipogénesis [136].

REVISIÓN BIBLIOGRÁFICA| 32
La inducción de las MSCs en cultivo hacia el linaje adipogénico se consigue a
través de la utilización de sustancias agonistas como suplemento en el medio de cultivo.
Estas moléculas van a activar distintas vías metabólicas. Por ejemplo, la dexametasona
estimula la adipogénesis vía receptor de glucocorticoides, el 3-isobutyl-1-methylxantine
(IBMX) promueve la diferenciación vía de la proteín-quinasa dependiente de cAMP y la
potencia la adipogénesis a través de la unión al receptor IGF-1 que activa diferentes
señales de transducción para la formación de grasa [137].
El seguimiento de la diferenciación adipogénica de las MSCs se puede realizar a
través del análisis de la presencia de los diferentes marcadores comentados
anteriormente a nivel proteico o a nivel de tránscritos. Además, existen tintes con
afinidad específica hacia los ácidos grasos (como rojo oleoso O ó rojo nilo) que
proporcionan tinciones específicas que permiten visualizar la formación de gotas
lipídicas en el interior de las células diferenciadas.
3.4.3.2. DIFERENCIACIÓN OSTEOGÉNICA
En el caso de la diferenciación osteogénica los factores que se van a expresar
para que las MSCs se especialicen hacia osteoblastos (las células funcionales que
conforman el hueso) son los reguladores transcripcionales RUNX2 (factor de
transcripción 2 relativo a runt) y Osterix [138]. Estos marcadores tempranos de la
diferenciación osteogénica van a activar la expresión de genes relacionados con la
formación de la matriz extracelular que es el principal proceso que se produce durante la
osteogénesis.
Aunque no está del todo claro el proceso por el cual las MSCs se diferencian
hacia osteoblasto, se conocen los genes que se regulan positivamente durante el proceso
de mineralización de la matriz extracelular. La proteína estructural de la matriz
extracelular es el COL1A1 (colágeno tipo I) y su presencia en la matriz extracelular
aumenta a medida que la diferenciación progresa [139]. La ALP (fosfatasa alcalina) se
considera un marcador intermedio y está relacionada con la hidrólisis de la glucosa-6-
fosfato para liberar el fosfato. El calcio presente en el medio se une al fosfato
precipitando y dando lugar nódulos de hidroxiapatita. Otras moléculas involucradas en
el proceso de mineralización de la matriz extracelular son la OC o BGLAP

REVISIÓN BIBLIOGRÁFICA| 33
(osteocalcina) y la BMP-2 (proteína morfogénica ósea 2) [140]. Además, hay otras
proteínas que tienen función de adhesión como la SPARC (osteonectina), considerada
como marcador temprano, que está involucrada en la unión de los cristales de mineral
formados con el colágeno. Por su parte la BSP (proteína siálica del hueso) y la OP o
SPP1 (osteopontina) tiene la función de unir las células diferenciadas con la matriz
extracelular a través de las integrinas [141].
La inducción de la diferenciación hacia linaje osteogénico de MSCs en cultivo
se consigue a través de la exposición de las células a la dexametasona, que se une a los
factores de transcripción relacionados con la ostegénesis, al ácido ascórbico que
desempeña su función en el metabolismo del colágeno [142] y al β-glicerofosfato, que
promueve la mineralización de la matriz extracelular aportando fosfato modulando la
actividad metabólica [143].
Para analizar la diferenciación in vitro hacia osteoblasto comúnmente se llevan a
cabo tinciones específicas (Von Kossa, rojo de alizarina) que muestran afinidad por el
calcio depositado en la matriz extracelular por las células diferenciadas. Pero este
método resulta insuficiente a la hora de cuantificar la diferenciación [144], por ello se
analiza también la expresión de los genes sobreexpresados durante la osteogénesis
descritos anteriormente o se determina la actividad de la fosfatasa alcalina.
3.4.3.3. DIFERENCIACIÓN CONDROGÉNICA
La diferenciación condrogénica de las MSCs conlleva la rápida biosíntesis de
glicosaminoglicanos y la generación de una matriz extracelular, todo ello acompañado
con una alteración de la morfología celular. El factor de transcripción desencadenante
de estos procesos es SOX9, que va a regular la expresión del resto de genes
relacionados con la condrogénesis.
Tras la inducción condrogénica, la expresión del marcador temprano SOX9
[145] va acompañada de una condensación de las células y un aumento en la expresión
y secreción de componentes cartilaginosos a la matriz extracelular similares a los
componentes que conforman el cartílago hialino in vivo. La proteína de mayor presencia
en este tipo de tejido es el COL2A1 [146] (colágeno tipo II), sin embargo se considera

REVISIÓN BIBLIOGRÁFICA| 34
como marcador tardío de diferenciación ya que se expresa más tarde que otros
componentes de la matriz. El COL2A1 aumenta progresivamente junto con la proteína
de adhesión condroadherina [147]. En la matriz extracelular van a estar presentes
diversos proteoglicanos como el agrecano, con función estructural para resistir la
compresión, y cuya expresión aparece desde los primeros días de la diferenciación y
también va en aumento paulatinamente [147]. Acompañando al agrecano, se encuentran
otros proteoglicanos como es el caso de la fibromodulina, la decorina o el biglicano, que
se encargan de unir las fibras de colágeno de la matriz. Estas glicoproteínas se expresan
de una manera más rápida y en fases del cultivo más avanzadas. Otra proteína que se
encuentra asociando las fibras de colágeno y los agrecanos es la COMP (proteína
oligomérica de la matriz del cartílago), cuya expresión se detecta desde los primeros
días de la diferenciación [148]. El colágeno tipo X comienza a expresarse más tarde que
el resto de colágenos y está asociadoa a condrocitos hipertróficos [149], ya que suele
aparecer durante las últimas etapas de formación de hueso in vivo a partir del cartílago
in vivo.
A diferencia de las inducciones adipogénica y osteogénica que se llevan a cabo
en células cultivadas en monocapa, la diferenciación condrogénica, habitualmente, se
desarrolla en tres dimensiones. El objetivo de realizar la diferenciación en este sistema
de micromasas, es el de generar un ambiente de hipoxia, ya que el cartílago está
pobremente vascularizado y por lo tanto contiene niveles muy bajos de oxígeno [150].
La presencia de miembros de la familia TGF-β (factor de crecimiento transformante) es
determinante para promover la condrogénesis en las MSCs [147], siendo las isoformas 2
y 3 las que causan mayor efecto, induciendo de una forma más rápida la acumulación de
proteoglicanos y COL2A1. La familia de las BMP (proteínas morfogénicas de hueso)
son capaces de potenciar el efecto que generan los TGF- β, siendo más efectivo el
efecto de la isoforma 2 que de la 6 [151].
Al igual que en la diferenciación a los otros linajes, existen distintas formas de
analizar y cuantificar la diferenciación condrogénica. Mientras que tinciones como azul
alcian, azul de tolouidina y safranina O tiñen los glicosaminoglicanos (GAG) de la
matriz extracelular, que se pueden cuantificar también a través de la reacción con
DMMB (azul de dimetilmetileno) [152]. Se pueden determinar por inmunohistoquímica
las moléculas COL2A1 y otras glicoproteínas de la matriz extracelular. También el

REVISIÓN BIBLIOGRÁFICA| 35
análisis del aumento de expresión de proteínas durante la condrogénesis descritas
anteriormente, indica el grado de diferenciación que las MSCs han alcanzado.
3.4.3.4. DIFERENCIACIÓN A LINAJES DE OTRAS CAPAS
EMBRIONARIAS
En los últimos años se están explorando cada vez más la posibilidad de que las
MSCs no sólo se diferencien a los linajes que proceden de la misma capa embrionaria
de las que ellas derivan, sino que presentan el potencial de diferenciación para dar lugar
a células presentes en tejidos que derivan de las capas embrionarias endodérmica y
ectodérmica, en un proceso denominado transdiferenciación [153].
Una de las diferenciaciones de las MSCs sobre la que más se investiga es la
diferenciación hacia tipos celulares neurales (derivados del ectodermo) debido a la
aplicación que podrían tener para el tratamiento de enfermedades neurodegenerativas.
Los protocolos de diferenciación que se aplican para conseguir este objetivo varían
desde la inducción química utilizando suplementos adecuados [154], transfección
génica de moléculas participes en la neurogénesis [155] o directamente el cultivo de
MSCs con células neurales [156]. El perfil de expresión génica de las MSCs en
respuesta a la inducción hacia célula neural muestra un aumento de genes neurogénicos
relativos a la transmisión sináptica como la calcio/calmodulina dependiente de serin-
protein quinasa (CaMKII) y la sintaxina 1 (STX1). Además se observa también
aumento de expresión de genes asociados a precursores neuronales como el supresor de
señales de citoquina 2 (SOCS2) y el factor de crecimiento neuronal 1 (NGF) [157].
También ha sido descrita la capacidad de las MSCs de diferenciarse hacia
linajes celulares derivados del endodermo, como es el caso de diferenciaciones hacia
células pancreáticas [26] o hepatocitos [27] . A través de manipulación genética de
MSCs se ha conseguido crear células productoras de insulina lo que puede suponer un
gran avance para la terapia de reemplazamiento en el tratamiento de la diabetes [158].
La transdiferenciación de las MSCs hacia células similares a hepatocitos genera una
amplia expectativa en el campo de los trasplantes debido a la escasez de órganos
disponibles [159].

REVISIÓN BIBLIOGRÁFICA| 36
3.4.4. PROPIEDADES INMUNOLÓGICAS
Otra de las características de las MSCs que se están estudiando en la actualidad
es la relación de estas células con el sistema inmune. Las MSCs muestran un efecto
inmunomodulatorio sobre células del sistema inmunitario a través de la interacción con
linfocitos B y T, células NK, células dendríticas, macrófagos y neutrófilos [160]. La
Figura 6 muestra un esquema de como las MSCs realizan estos efectos
inmunosupresores a través de la inhibición de la proliferación de las células T, y de la
producción de TNF-α y INF- y aumentando los niveles de IL-10, ya sea por medio de
la secreción de moléculas o por medio del contacto célula-célula [161].
Figura 6. Esquema de los mecanismos de inmunoregulación de las MSCs sobre diferentes células del
sistema inmunológico. Figura original de [161].
Además las MSCs se considera que son “inmunoprivilegiadas”, al no expresar
en su superficie el complejo mayor de histocompatibilidad de clase II (MHC-II) [100],
molécula implicada en el rechazo de trasplantes. Como resultado de la ausencia del
MHC-II el tratamiento in vivo con MSCs no parece provocar respuestas inflamatorias ni
rechazos, aunque aún se están llevando a cabo muchas investigaciones al respecto.

REVISIÓN BIBLIOGRÁFICA| 37
3.5. CÉLULAS MADRE MESENQUIMALES EQUINAS
La terapia celular, como se ha comentado en el Apartado 3.2., es de suma
importancia para el tratamiento de lesiones en caballos que de otra manera tienen un
mal pronóstico de recuperación. Pero de igual importancia es determinar la naturaleza y
el fenotipo de las células que se están utilizando en la terapia, es fundamental conocer
sus características moleculares para comprender cómo actúan durante los procesos de
reparación y de esa forma potenciarlas para conseguir resultados clínicos favorables.
Al inicio de este trabajo de Tesis Doctoral los estudios desarrollados sobre la
caracterización de las células madre mesenquimales equinas eran escasos. Pero en los
últimos años debido al creciente interés por su utilización en terapia celular para el
tratamiento de lesiones, el número de publicaciones orientadas hacia el análisis de las
propiedades in vitro de las MSCs equinas ha aumentando aportando información sobre
sus características.
Las MSCs equinas, de igual forma que las humanas, pueden obtenerse de
diferentes tejidos, siendo los principales la médula ósea [162] y el tejido adiposo [163].
Pero también han despertado interés las MSCs procedentes de sangre periférica [164],
cordón umbilical [165], sangre del cordón umbilical [166], de encías y ligamento
periodontal [167]. En todos estos casos la selección de las células se ha realizado por
medio de la capacidad de adherencia al plástico que poseen estas células. Una vez en
cultivo la morfología que adquieren las MSCs equinas es la típica de forma de huso
extendiendo procesos y mostrando un crecimiento en monocapa [168].
3.5.1. POTENCIAL DE AUTORRENOVACIÓN Y PROLIFERACIÓN
Las MSCs equinas son capaces de formar colonias cuando se siembran a
densidades bajas confirmando así su capacidad de autorrenovación [169]. Tienen una
capacidad de expansión similar a las MSCs humanas, pudiéndose doblar más de 30
veces, incrementando este número si el cultivo se suplementa con FGF-2 [170]. Entre
las MSCs obtenidas de diferentes orígenes en el caballo, las derivadas de tejido adiposo
son las que presentan mayor potencial de proliferación [170], mientras que las derivadas

REVISIÓN BIBLIOGRÁFICA| 38
de sangre periférica son las de menor, ya que su capacidad de expansión se limita a 5 ó
6 pases, y además mostrando una elevada sensibilidad a la tripsinización [164].
3.5.2. FENOTIPO DE MARCADORES DE SUPERFICIE
Los criterios de mínimos propuestos por la ISCT son válidos para la definición
de las MSCs humanas, sin embargo, hasta la fecha no existen criterios universales para
la caracterización de las MSCs de todas las especies. El principal problema que presenta
la caracterización del fenotipo de las MSCs equinas es el de la falta de anticuerpos
comerciales que muestren reactividad con los epítopos de las moléculas de superficie de
la especie equina [171]. Durante el desarrollo de este trabajo de Tesis Doctoral, se han
descrito anticuerpos contra antígenos que la ISCT propone como marcadores de MSCs
en la especie humana que presentaban reactividad con las moléculas equinas, como por
ejemplo CD105 [172] y CD90 [173, 174]. Otras moléculas que también se analizan
como antígenos presentes en las MSCs humanas de forma habitual en la determinación
del inmunofenotipo, también muestran reactividad con las equinas, como es el caso de
CD44 [173] y CD29 [175]. La Tabla 2 muestra los marcadores de superficie para los
cuales se ha estudiado reactividad con anticuerpos comerciales.
Cómo técnica alternativa a la citometría de flujo, la PCR cuantitativa permite
determinar la expresión de los genes correspondientes a los marcadores de superficie
cuando no se encuentran anticuerpos comerciales disponibles [126]. Por medio de esta
técnica se han confirmado resultados obtenidos por la citometría de flujo para las
moléculas CD90, CD105 y CD45 [172], y hallado la expresión de otras como CD73
para la que la citometría daba un resultado negativo [172, 174]. Por este motivo hay que
tomar con precaución los resultados negativos que se puedan obtener por medio de
citometría de flujo, ya que falta de especificidad de los anticuerpos comerciales por los
epítopos equinos puede conducir a falsos negativos.
Tabla 2. Marcadores de superficie analizados por citometría de flujo en MSCs equinas.
Tipo de marcador Antígeno Detección Referencia
SH2 y SH3 CD73 Negativa [175, 176]

REVISIÓN BIBLIOGRÁFICA| 39
3.5.3. POTENCIAL DE DIFERENCIACIÓN
Las MSCs equinas pueden ser inducidas hacia linajes osteogénico, adipogénico
y condrogénico, requisito de la ISCT para definir las MSCs humanas, aunque el
potencial de diferenciación de las MSCs equinas varía en función del origen del cual
proceden las células.
3.5.3.1. DIFERENCIACIÓN ADIPOGÉNICA
La inducción in vitro hacia este linaje es la más difícil de conseguir en el caso de
las MSCs equinas, los protocolos estandarizados para la diferenciación de MSCs
humanas (con IBMX, indometacina, insulina y dexametasona) no son eficaces para
generar la diferenciación a adipocito [126]. La utilización de suero de conejo como
potenciador de la adipogénesis parece ser clave para alcanzar la diferenciación debido a
su alto contenido en ácidos grasos [179]. Aunque la inducción se ha conseguido en las
MSCs procedentes de todos los tejidos, para algunos orígenes como la sangre periférica
o las encías, y en algunos de los trabajos publicados [169, 174] sólo se ha logrado la
diferenciación en una etapa temprana del proceso, en la cual se puede apreciar un
cambio morfológico acompañado por la formación de pequeñas gotas lipídicas en el
interior de las células pero sin llegar a fusionarse entre ellas para generar otras más
grandes [164, 167].
Endoglina CD105 Positiva [165, 167, 172]
STRO-1 Positiva [174]
HCAM CD44 Positiva [173-177]
Cadena LFA-α1 CD11a Negativa [172]
Antígeno común
leucocitario CD45 Negativa [172, 177]
Thy-1 CD90 Positiva [167, 172-178]
ITGB1 CD29 Positiva [175, 176]
ANPEP CD13 Positiva [173, 177]
MHC-I Positiva [176]
MHC-II Negativa [176]
CD14 Negativa [176]
CD164 Negativa [177]

REVISIÓN BIBLIOGRÁFICA| 40
La valoración del potencial de diferenciación se lleva a cabo de igual forma que
lo señalado anteriormente para las MSCs humanas, por medio de la tinción de los ácidos
grasos almacenados en el interior de las células con rojo oleoso O. Además también se
observa el aumento en la expresión de los genes relacionados con la adipogénesis
PPAR y LPL [172].
3.5.3.2. DIFERENCIACIÓN OSTEOGÉNICA
La diferenciación hacia osteoblasto ocurre de forma más rápida a la descrita en
otras especies [162]. Las células se empaquetan en múltiples capas dando lugar a
nódulos, lo cual está asociado a una mayor formación de matriz extracelular. Los
factores que se utilizan para conseguir la inducción son los mismos que los utilizados en
la especie humana: dexametasona, β-glicerofosfato y ácido ascórbico. Las células
procedentes de médula ósea parecen ser las que poseen mayor capacidad osteogénica
[180, 181], aunque las derivadas de tejido adiposo también muestran una habilidad de
diferenciación notable [181, 182] si bien algo más lenta [178]. Las MSCs procedentes
de sangre periférica, cordón umbilical y sangre de cordón umbilical también son
capaces de diferenciarse hacia linaje osteogénico aunque su potencial es menor que el
de los dos casos anteriores [180, 181].
La monitorización de la diferenciación se realiza por las tinciones habituales de
la matriz extracelular con rojo de alizarina o von Kossa, y para la cuantificación se han
estudiado varios genes relacionados con la osteogénesis, como la osteopontina, el
colágeno tipo I [172] o la osteonectina [170].
3.5.3.3. DIFERENCIACIÓN CONDROGÉNICA
La diferenciación condrogénica requiere unos tiempos similares a los
descubiertos para la especie humana y se realiza con el mismo sistema de pellets. El
inductor principal de la condrogénesis es también el mismo, el TGF-β. Tanto la
isoforma TGF-β1 como la TGF-β3 son capaces de inducir la condrogénesis en MSCs
procedentes de médula ósea y tejido adiposo [175, 178]. El potencial condrogénico
parece ser mayor en las BM-MSCs que en las AT-MSCs [183], aunque las MSCs
derivadas de cordón umbilical muestran en otro estudio mayor potencial que las

REVISIÓN BIBLIOGRÁFICA| 41
derivadas de médula [184]. Las MSCs procedentes de sangre periférica presentan una
capacidad limitada a la hora de llevar a cabo esta diferenciación [164, 180].
Las tinciones que se utilizan son Safranina O, azul de alcian y azul de tolouidina
también son las habituales para determinar la diferenciación condrogénica de los pellets
de las MSCs equinas. La cuantificación del potencial se puede determinar a través de
inmunohistoquímica de las moléculas nombradas con anterioridad del colágeno tipo II y
otras glicoproteínas de la matriz extracelular [185], la cuantificación de los GAG
generados [183], o por medio del análisis de la expresión de genes relativos a la
condrogénesis [172].
3.6. CULTIVO DE LAS MSCs.
Para que las MSCs puedan ser utilizadas en terapia celular generalmente se
tienen que obtener un número elevado de estas células. Sin embargo el número de
MSCs que se aíslan de los tejidos de origen es bajo, por lo que es necesaria la expansión
de estas células en cultivo in vitro de las MSCs. Como se menciona el apartado 4.1. en
el cultivo de las MSCs se utiliza habitualmente medios de cultivos, estos medios están
formados de un medio comercial base que aporta el pH y los aminoácidos necesarios
para el crecimiento, una mezcla de antibióticos que suelen ser penicilina/estreptomicina
y suero fetal bovino.
3.6.1 FACTORES QUE AFECTAN AL CULTIVO
El crecimiento de las MSCs en cultivo in vitro es altamente artificial, el entorno
nuevo que rodea a las células es muy distinto al que están acostumbradas in vivo. El
crecimiento en una superficie bidimensional conduce a las células a adoptar morfologías
distintas a las que normalmente se encuentran [153]. Por ello, el mayor reto en el cultivo
de las MSCs es el desarrollo de sistemas de cultivo que sean óptimos para la expansión
efectiva y menos altere las propiedades de estas células.
En los siguientes apartados se detallan la influencia que pueden diversos
factores sobre el cultivo de las MSCs.
REVISIÓN BIBLIOGRÁFICA| 42
3.6.1.1. SUERO FETAL BOVINO
. Las MSCs in vitro se ven expuestas a medios de cultivo que intentan aportar lo
necesario para su crecimiento, pero que distan de la composición adecuada y aporte
continuo de nutrientes y factores que poseen cuando están en sus nichos. Para intentar
paliar este hecho, los medios de crecimiento están suplementados, habitualmente, con
suero fetal bovino (FBS), rico en factores de crecimiento, nutrientes, hormonas y
vitaminas. De forma habitual los medios de crecimiento de las MSCs se suplementan
añadiendo un 10% de FBS [186], aunque mayores concentraciones de FBS pueden
potenciar un aumento en el crecimiento de las MSCs [187]. Sin embargo, existe una
elevada variabilidad entre los diferentes lotes comerciales. Estas diferencias pueden
alterar el patrón de crecimiento de las células y los perfiles de expresión de moléculas
de adhesión [188] entre lote y lote, y con respecto a las células en su estado nativo.
Además, existe el riesgo añadido de transmisión de enfermedades infecciosas a través
del FBS [189].
3.6.1.2. OXÍGENO
Otro factor que suele ser diferente en los cultivos de MSCs respecto al que se
encuentra en los organismos es el oxígeno. Esta molécula está implicada en importantes
fenómenos fisiológicos y patológicos como el desarrollo embrionario [190], la
formación de tumores [191] o la reparación de tejidos [192]. El oxígeno también forma
parte de procesos celulares como los de apoptosis, metabolismo, diferenciación y
migración [11], todos ellos coordinados a través de la estabilización del factor de
hipoxia inducible 1 α (HIF1α) [193]. El oxígeno también es capaz de inducir cambios
en respuestas transcripcionales, modificaciones post-traduccionales y en el tráfico
intracelular de proteínas [11].

REVISIÓN BIBLIOGRÁFICA| 43
Habitualmente, los incubadores que se emplean para el crecimiento de las
células utilizan el aire atmosférico como fuente de oxígeno, por lo que las células se
encuentran creciendo en su interior a un porcentaje de oxígeno de entorno al 20%. Sin
embargo, el ambiente que rodea a las MSCs cuando están en sus nichos es bastante más
bajo, encontrándose entre 1 y 7% en la médula ósea [194] y entre 2 y 8% en el tejido
adiposo [195] (Figura 7).
Figura 7. Esquema del porcentaje de oxígeno en diferentes nichos de células madre en la especie humana.
Adaptado de [10]
Los trabajos realizados sobre cómo afecta la hipoxia (nivel bajo de oxígeno en
cultivo in vitro) a las diferentes características de las MSCs están llenos de controversia,
ya que existe una elevada heterogeneidad a la hora de llevarlos a cabo. Dentro de los
parámetros que varían entre experimentos se encuentra el porcentaje de oxígeno a los
que las células son expuestas que se mueve en el rango entre 1% y el 8% [196, 197] o el
pase en el que se encuentran las MSCs, que varía entre los primeros pases [198] y el
pase 8 [199]. Además, los trabajos se han desarrollado en diferentes especies como la
murina [197], la humana [200] o la canina [201] y, por lo tanto, las MSCs presentar
diferente sensibilidad hacia el oxígeno. Todo ello hace que los resultados que se han
obtenido hasta el momento en el estudio del efecto de la hipoxia sobre las MSCs no
sean homogéneos y en algunos casos contradictorios.

REVISIÓN BIBLIOGRÁFICA| 44
La mayoría de los estudios sobre la caracterización de las MSCs que se detallan
a continuación han sido llevados en las especies humana y murina. Sin embargo, hasta
ahora, en todos los trabajos desarrollados para la caracterización de las MSCs equinas
ninguno de ellos se ha orientado hacia la determinación del efecto de la hipoxia sobre
estas características.
3.6.1.2.1. Efecto del oxígeno en la proliferación celular
Los mecanismos moleculares por los cuales el porcentaje de oxígeno puede
regular la proliferación celular no se conocen con exactitud. Sin embargo, HIF 1α
parece estar relacionado con la expresión de los inhibidores de quinasas ciclina-
dependientes p21 y p27 envueltas en la regulación del ciclo celular [202, 203] y
también con la de expresión de factores anti-apoptóticos tales como Bcl-2 y survivina
[204]. La proliferación se ve afectada por cambios en la presión de oxígeno, aunque no
hay un acuerdo general sobre si está potenciada o inhibida. Es lógico pensar que las
MSCs cultivadas en hipoxia al encontrarse en un entorno más parecido al fisiológico
presenten mayor capacidad de proliferación, y así es como se demuestra en estudios
realizados con MSCs humanas en los que se observan: un aumento en el potencial de
proliferación de las MSCs en un pase determinado [196], un aumento en el tamaño y
número de colonias que se forman (CFU-F) [205] y en la aparición más tardía de la
senescencia [206] en comparación con MSCs expuestas a 20% O2. Sin embargo, existen
estudios que contradicen los resultados anteriores tanto en la especie humana [200]
como para otras especies domésticas como el perro [201].
3.6.1.2.2. El oxígeno no modifica el fenotipo de marcadores de superficie
El fenotipo determinado que muestran las MSCs cultivadas con un 20% O2 se
mantiene independientemente de que las células estén expuestas a bajas presiones de
oxígeno. Las MSCs cultivadas en condiciones de hipoxia siguen cumpliendo los
criterios de expresión de marcadores propuestas por la ISCT [31], y también mantienen
la expresión de los demás marcadores que habitualmente se estudian para establecer el
fenotipo [207].
REVISIÓN BIBLIOGRÁFICA| 45
3.6.1.2.3. Influencia del oxígeno en el potencial de diferenciación
Al igual que en el caso de la proliferación, no existe un acuerdo general sobre el
efecto de la hipoxia sobre los potenciales de diferenciación de las MSCs.
Las MSCs parecen conservar su potencial de diferenciación hacia osteoblasto en
ambientes bajos en oxígeno [198], aunque en condiciones de oxígeno demasiado bajas
(en torno al 1% de O2) esta capacidad tiende a inhibirse. La capacidad osteogénica
puede ser nuevamente restaurada a concentraciones más elevadas de oxígeno (3%)
[200]. Este resultado estaría respaldado por el hecho de que para la diferenciación hacia
osteoblasto in vivo en el hueso vascular se requiere presiones de oxígeno elevadas [208].
La diferenciación hacia linaje adipogénico muestra también resultados dispares
cuando las MSCs se cultivan a concentraciones bajas de oxígeno. Mientras que algunos
autores remarcan el entorno favorable que una tensión baja de oxígeno proporciona para
potenciar la adipogénesis [209, 210], otros no detectan ningún cambio remarcable en la
capacidad de diferenciación de las MSCs [196, 211].
En cambio, el oxígeno parece desempeñar un papel más importante en la
condrogénesis que en las dos anteriores diferenciaciones. La formación del cartílago
durante el desarrollo embrionario tiene lugar en condiciones de hipoxia [212] y el
cartílago adulto es un tejido no vascularizado que presenta una presión de oxígeno
cercana al 1% de O2 [213], por lo que un ambiente de hipoxia favorecería la
diferenciación de las MSCs hacia un fenotipo condrogénico. Así lo demuestran los
estudios que describen una potenciación de la condrogénesis cuando las MSCs se
cultivan en condiciones de hipoxia [214, 215].

MATERIAL Y MÉTODOS | 46
4. MATERIAL Y MÉTODOS
A continuación se procederá a enumerar las técnicas y materiales utilizados
durante el desarrollo del trabajo de Tesis Doctoral. Se hará una pequeña descripción de
cada uno de ellos a la vez que se indicará con qué objetivo concreto y en qué
manuscritos han sido utilizados.
4.1 ANIMALES
Los animales utilizados para la obtención de las MSCs que se utilizaron para la
realización de la presente memoria fueron distintos según los trabajos.
En los manuscritos I, II y III los caballos eran pacientes del Hospital Clínico
Veterinario de la Universidad de Zaragoza con diferentes tipos de lesiones de tendón y
ligamento. Las edades de los caballos variaron entre los 4 y los 17 años, y había
variedad tanto en el sexo como en la raza. Las muestras de médula ósea y tejido adiposo
fueron obtenidas bajo consentimiento del dueño y de acuerdo a la normativa sobre el
bienestar animal.
En los manuscritos IV, V y VI los caballos de los que se obtuvieron las muestras
biológicas pertenecían a un proyecto del Ministerio de Educación y Ciencia concedido a
nuestro grupo de investigación. Se trataban de machos castrados y con un rango de edad
entre 4 y 7 años.
Todos los estudios fueron aprobados por el Comisión Ética Asesora para la
Experimentación Animal de la Universidad de Zaragoza PI36/07
4.2. CULTIVO DE MSCs
Para el desarrollo de este trabajo de Tesis Doctoral se llevaron a cabo técnicas de
cultivo de MSCs. El manejo de las células se realizó en condiciones de esterilidad

MATERIAL Y MÉTODOS | 47
haciendo uso de una cabina de flujo laminar. A continuación se explican brevemente las
etapas que fueron necesarias para el cultivo celular.
4.2.1. OBTENCIÓN DE MUESTRAS Y AISLAMIENTO DE MSCs
Las muestras biológicas a partir de las que se han aislado las MSCs y la
metodología utilizada para el procesado de las mismas fueron:
Aspirados de médula ósea del esternón: se obtuvieron con una aguja 4
11G Jameshi con heparina. Las células mononucleares de los aspirados se aislaron por
gradiente de centrifugación con Lymphoprep (Atom). Las células fueron lavadas con
PBS y sembradas a una densidad de 2.000.000 de células mononucleadas/cm2.
Tejido adiposo subcutáneo del área supragluteal cercana a la cola del
caballo: la SVF se aisló por digestión con colagenasa tipo I (Sigma-Aldrich), las células
se lavaron con PBS y se sembraron a una densidad de 100.000 células mononucleadas/
cm2.
Las células de ambos orígenes se mantuvieron en medio de crecimiento,
compuesto por DMEM bajo en glucosa (Sigma-Aldrich) suplementado con 1% de L-
glutamina (Sigma-Aldrich), 1% de penicilina/estreptomicina (Sigma-Aldrich) y 10% de
FBS (Gibco). Después de la extracción, a las 24, 48 y 72 horas, las células se lavaron
con PBS y el medio se cambió para eliminar las células no adherentes. Las condiciones
en las que se mantuvieron las MSCs fueron a 37ºC, 5% de CO2 y 20% de O2 para todos
los trabajos, y además a 37ºC, 5% de CO2 y 5% de O2 para los manuscritos IV y V.
4.2.2. EXPANSIÓN Y CRIOPRESERVACIÓN
Para la realización de experimentos que componen esta memoria fue necesario
trabajar con un número elevado de células, objetivo que se consiguió a través de la
expansión de MSCs a lo largo de varios pases. A continuación se resume la metodología
utilizada para ello.
Las MSCs de ambos orígenes se cultivaron realizando cambios de medio cada 3
días hasta alcanzar aproximadamente el 80% de confluencia. Posteriormente, las células
se despegaron de la superficie de la placa de cultivo por tratamiento con un 0,25% de

MATERIAL Y MÉTODOS | 48
tripsina/EDTA (Sigma-Aldrich) y se contaron con un hemocitómetro o un contador de
partículas Z2 Coulter. En este punto, una fracción de células fue re-sembrada a una
densidad de 5.000 MSC/cm2, que constituyó un nuevo pase, y el resto de las células
fueron criopreservadas para la realización de la caracterización que aparece en los
manuscritos II, III y VI. El medio de congelación en el que las células fueron
resuspendidas estaba formado por un 90% de FBS y 10% de DMSO. Esta metodología
se repitió hasta el pase 3 para cada uno de los animales.
4.2.3. ENSAYOS DE PROLIFERACIÓN
La proliferación celular se determinó de dos formas distintas a lo largo de la
presente memoria.
En el manuscrito II las células se sembraron en placas de 96 pocillos y durante
un pase entero se determinó el número de células viables para construir una curva de
proliferación mediante el ensayo MTT (Sigma-Aldrich) siguiendo las especificaciones
del fabricante.
En el manuscrito V las células fueron sembradas en placas de 6 pocillos por
triplicado y durante un pase entero fueron contadas en un contador de partículas Z2
Coulter para elaborar una curva de proliferación.
4.2.4. ENSAYOS DE DIFERENCIACIÓN
La inducción de las MSCs hacia linajes mesodérmicos es fundamental para su
caracterización, a continuación se indican las condiciones, tinciones espécificas y
cuantificaciones que se llevaron a cabo para valorar las diferenciaciones durante la
realización de esta memoria.
4.2.4.1. CONDICIONES DE DIFERENCIACIÓN
Las condiciones de cultivo para los ensayos de diferenciación llevados a cabo en
los manuscritos II, III, IV y VI fueron las siguientes:
MATERIAL Y MÉTODOS | 49
Diferenciación osteogénica: las células se sembraron a una densidad de
20.000 células/cm2 durante 7-9 días. El medio de inducción estaba formado por medio
de crecimiento suplementado con 10 nM de dexametasona, 10 mM de β-glicerofosfato y
100 μM de ascorbato-2-fosfato.
Diferenciación adipogénica: las células se sembraron a una densidad de
5.000 células/cm2 durante 14 días. El medio de diferenciación estaba compuesto por
medio de crecimiento suplementado con 1 μM de dexametasona, 500 μM de IBMX, 200
μM de indometacina y 15% de suero de conejo.
Diferenciación condrogénica: aproximadamente 500.000 MSCs se
dispusieron en forma de pellet mediante centrifugación en tubos cónicos de
polipropileno durante 21 días. El medio condrogénico estaba compuesto por DMEM
rico en glucosa (Gibco) suplementado con 10% de FBS, 10 ng TGF-β3 (R&D Systems),
ITS+ premix (BD), 40 μg/mL prolina (Sigma-Aldrich), 50 μg/mL de ascorbato-2-
fosfato y 0.1 μM dexametasona.
4.2.4.2. TINCIONES ESPECÍFICAS
Para valorar la diferenciación de las MSCs se llevaron a cabo las siguientes
tinciones específicas para cada una de las diferenciaciones:
Tinción osteogénica: las células se fijaron con etanol frío durante 1 hora,
se lavaron con agua destilada y se incubaron durante 10 minutos con rojo de alizarina al
2% y pH 4,6. Posteriormente el exceso de tinción se eliminó con lavados de agua
destilada.
Tinción adipogénica: las células se fijaron con formalina al 10% (Sigma-
Aldrich) durante 15 minutos, después se lavaron con PBS y se tiñeron durante 30
minutos a 37 ºC con rojo oleoso al 0,3% en isopropanol. Finalmente, el exceso de
tinción se eliminó lavando con agua destilada.
Tinción condrogénica: los pellets diferenciados se fijaron con formalina
al 10%, se embebieron en bloques de parafina y fueron cortados en secciones de 5 μm
de grosor. A lo largo del estudio se fueron poniendo a punto diversas tinciones para
valorar la diferenciación condrogénica. Los cortes se tiñeron con azul alcián y safranina
O y también se realizó inmunohistoquímica de la proteína S-100 con el anticuerpo

MATERIAL Y MÉTODOS | 50
policlonal de conejo IR504 (DAKO). Además se valoró la histología de los pellets con
la tinción clásica hematoxilina y eosina.
4.2.4.3. CUANTIFICACIÓN
Las diferenciaciones hacia los distintos linajes fueron cuantificadas por diversas
técnicas:
Diferenciación osteogénica: se cuantificó la actividad de la ALP.
Después de lisar las células con tampón RIPA, el lisado celular fue incubado con el
sustrato p-NPP. La aparición del producto amarillo p-NP como consecuencia de la
transformación de p-NPP por la enzima, fue medida en un espectofotómetro a 405 nm.
Los resultados se normalizaron con la cantidad total de proteína del lisado calculado por
BCA. Este ensayo se llevó a cabo para cuantificar la osteogénesis en los manuscritos II,
IV y VI.
Diferenciación adipogénica: el rojo oleoso que tiñe los lípidos formados
en las células en diferenciación fue extraído con isopropanol y medido a 510 nm. Los
resultados fueron normalizados con la cantidad total de proteína obtenida mediante
tinción con Ponceau.
Diferenciación condrogénica: se cuantificaron los sGAG generados en la
matriz extracelular. La cantidad de sGAG se determinó por reacción con la solución
DMMB y midiendo la absorbancia a 530 nm en un espectofotómetro Biotek Synergy
HT. Las cantidades de sGAG se normalizaron con el contenido en DNA de las muestras
obtenido mediante el ensayo del Hoechst 33258.
4.3. CITOMETRÍA DE FLUJO
La citometría de flujo se basa en la detección por medio de fluorescencia de
células marcadas, bien con anticuerpos conjugados con fluoróforos o bien con
fluoróforos unidos a partes de la célula como el núcleo o la membrana celular. La señal
emitida por las células excitadas a una determinada longitud de onda es recogida por un
detector que genera un histograma con los datos. Durante el desarrollo de esta memoria
el citómetro de flujo empleado fue el FACSARIA (BD Biosciences) perteneciente al
MATERIAL Y MÉTODOS | 51
Servicio de Separación del Instituto Aragonés de Ciencias de la Salud se y utilizaron
diversos fluoróforos con diferentes objetivos que pasamos a detallar a continuación.
4.3.1 VIABILIDAD CELULAR
La viabilidad de los cultivos celulares se determinó identificando la proporción
de células, viables, apoptóticas y necróticas en los cultivos. La incubación de las células
con Annexina V (AnV) permitió identificar las células apoptóticas ya que la molécula
tiene afinidad por la fosfatidilserina translocada a la superficie de la membrana celular
en células apoptóticas. Estas células se diferenciaron de las necróticas mediante tinción
con ioduro de propidio (PI), esta molécula es capaz de unirse al DNA cuando las
membranas de las células están alteradas como consecuencia de la necrosis. De esta
forma, las células en un estado de apoptosis temprana eran positivas para AnV y
negativas para PI, las células no viables eran positivas para PI y AnV, mientras que las
viables eran negativas para las dos moléculas. La metodología utilizada se llevó a cabo
siguiendo las instrucciones del fabricante. Esta técnica fue utilizada en los manuscritos
II y V.
4.3.2. INMUNOFENOTIPO
La presencia de los marcadores de superficie de MSCs se determinó incubando
las células con anticuerpos monoclonales de ratón anti-humano de diversas casas
comerciales siguiendo las instrucciones especificadas para cada uno de los casos. Se
utilizaron controles de isotipo como negativos y tinción de células muertas con
SYTOX™ (Molecular Probes) antes de analizar los marcadores en el citómetro de flujo.
Esta técnica fue utilizada para establecer el inmunofenotipo en los manuscritos III y V.
4.3.3. CICLO CELULAR
La progresión del ciclo celular de las MSCs en cultivo fue determinada mediante
tinción del DNA utilizando PI de las células fijadas previamente con etanol frío al 70%.
Los datos recogidos por el citómetro mostraron la proporción de células en las diversas

MATERIAL Y MÉTODOS | 52
fases del ciclo celular (G0/G1, S ó G2/M) siendo la cantidad de fluorescencia recogida
proporcional a la cantidad de DNA en cada una de ellas.
4.4. EXTRACCIÓN DE RNA Y SÍNTESIS DE DNA
COMPLEMENTARIO (cDNA)
La extracción de RNA y la síntesis de DNA complementario se realizaron en
todos los trabajos como paso previo al análisis de expresión de los distintos marcadores.
La metodología para la extracción y síntesis cDNA varió según la cantidad de células de
partida.
Para cultivos con más de 500.000 células, las células fueron tratadas con
tripsina, lavadas con PBS, transferidas a tubos eppendorf, centrifugadas y congeladas a -
80 ºC. La extracción de RNA se llevó a cabo con el kit comercial RNA spin mini (GE
Healthcare) y la posible contaminación con DNA genómico se eliminó mediante el
tratamiento con DNAse turbo (Ambion) de acuerdo con las instrucciones de los
fabricantes. La síntesis de cDNA se llevó a cabo con hexámeros aleatorios utilizando el
kit SuperScript First-Strand Sintesis System (Invitrogen) siguiendo las recomendaciones
del fabricante.
Para cultivos con menos de 500.000 células, las células fueron lavadas
con PBS y congeladas directamente en las placas de cultivo a -80 ºC. La extracción de
RNA y síntesis de cDNA se realizaron utilizando el kit comercial Cell to cDNA II
(Ambion) de acuerdo con las instrucciones del fabricante.
4.5. REACCIÓN EN CADENA DE LA POLIMERASA (PCR)
La PCR es una técnica utilizada habitualmente a lo largo de todo el desarrollo de
la memoria que se presenta. Además de la técnica convencional, también se utilizó la
PCR cuantitativa.
MATERIAL Y MÉTODOS | 53
4.5.1 PCR CONVENCIONAL
La técnica consiste en la amplificación específica de un fragmento de DNA o
cDNA mediante una serie de repeticiones de ciclos de tiempo y temperatura.
Está técnica se empleó para la validación de los cebadores diseñados durante del
desarrollo de todos los trabajos expuestos en esta tesis.
4.5.2. PCR CUANTITATIVA
Esta metodología se utilizó en la práctica totalidad de los manuscritos y,
permitió estudiar y comparar la expresión de marcadores de diferenciación entre células
diferenciadas y no diferenciadas, así como determinar y comparar la expresión de los
marcadores de superficie celular y pluripotencialidad entre células procedentes de
distintos orígenes y cultivadas en distintas condiciones de oxígeno.
La técnica se fundamenta en el uso de fluoróforos que emiten distinta cantidad
de fluorescencia en función del número de copias del fragmento amplificado. El
número de copias del fragmento se corresponde en un determinado ciclo, ciclo umbral
(threshold cycle, Ct), con la cantidad de molde en la muestra original. Cuando se
cuantifica la expresión de un gen se utilizan genes normalizadores (housekeeping genes)
para disminuir el error entre muestras generado por pasos previos a la cuantificación,
como diferencias en la síntesis de cDNA o errores de pipeteo. Además, si el número de
muestras a analizar no puede ser cuantificado en una sola reacción, las muestras pueden
ser amplificadas en reacciones distintas y normalizar los resultados utilizando muestras
intercalibradoras en cada reacción (internal run calibrators) que eliminarían las
variaciones aparecidas entre las distintas reacciones.
Para el desarrollo de los manuscritos que se exponen en esta memoria el
fluoróforo utilizado fuela molécula intercalante de DNA SYBRGreen, cuya detección es
directamente proporcional a la cantidad de producto de PCR en la reacción.

MATERIAL Y MÉTODOS | 54
4.6. SECUENCIACIÓN AUTOMÁTICA
La secuenciación de fragmentos se ha utilizado en el desarrollo del trabajo de
Tesis Doctoral para la comprobación de los productos de PCR de los genes del estudio
para los que se diseñaron los cebadores. A continuación se describe brevemente los
pasos que se siguieron para las secuenciaciones de las muestras.
Los productos de PCR fueron purificados con ExoSAP-IT (USB) para eliminar
nucleótidos, cebadores y otros componentes residuales. Posteriormente los productos
purificados fueron secuenciados en reacciones separadas para cada uno de los cebadores
utilizando el Big Dye Terminador Cycle Sequencing Kit v.3.1. Finalmente, las
secuencias fueron purificadas con el kit X-Terminator y sometidas a electroforesis
capilar en el sistema de secuenciación automática ABI PRISM 310 (Applied
Biosystems). Todos los kits se utilizaron siguiendo las recomendaciones del proveedor.
4.7. HERRAMIENTAS BIOINFORMÁTICAS
En el desarrollo de este trabajo se han utilizado diversos programas y bases de
datos para la búsqueda de secuencias génicas específicas de caballo, diseño de
cebadores para su uso en PCR, análisis de las amplificaciones y, en general, para
realizar el tratamiento estadístico comparativo entre distintos tipos celulares o distintas
condiciones.
A continuación aparecen los distintos programas utilizados en la elaboración de
esta tesis.
Búsqueda y recuperación de datos en sistemas integrados de búsqueda y
bases de datos: ENTREZ (http://www.ncbi.nlm.nih.gov/).
Alineamiento y búsqueda de secuencias: BLAST
(http://www.ncbi.nlm.nih.gov/BLAST/).
Diseño de cebadores: Primer Express Software (Applied Biosystems).
Visualización de secuencias y alineamiento: BioEdit
(http://www.mbio.ncsu.edu/BioEdit/bioedit.html).
Análisis de secuencias y productos amplificados de RT-qPCR:
StepOne™ software (Applied Biosystems).

MATERIAL Y MÉTODOS | 55
Análisis estadístico: Paquete estadístico SPSS 15.0, 18.0 y 19.0 para
Windows.

RESULTADOS Y DISCUSIÓN | 56
5. RESULTADOS Y DISCUSIÓN
Como consecuencia del trabajo desarrollado en la realización de la Tesis
Doctoral que se presenta se han generado varios manuscritos que están publicados, en
fase de revisión o a la espera de ser valorados. Además de estos manuscritos se ha
incluido un trabajo que forma parte de un estudio pre-clínico.
En primer lugar, buscamos el momento óptimo de aislamiento de las BM-MSCs
de la médula ósea para obtener el mayor número de colonias posibles al comienzo de la
expansión de las células (Manuscrito I). Para ello analizamos el efecto que ejerce el
retraso de 24 horas entre toma de muestras y procesado de las mismas en la obtención
de colonias.
Una vez que determinamos que el aislamiento de células inmediatamente tras la
extracción proporcionaba más colonias de partida, procedimos a la caracterización de
las MSCs derivadas de médula ósea y tejido adiposo. Estos tejidos fueron elegidos por
ser los más habituales para la obtención de MSCs en individuos adultos de la especie
humana. Las propiedades de las MSCs que analizamos inicialmente fueron la capacidad
de proliferación y la viabilidad de las células de ambos orígenes in vitro, además de los
potenciales de diferenciación que mostraban hacia los distintos linajes mesodérmicos
(Manuscrito II). Las células derivadas de ambos tejidos se establecieron y proliferaron
en los cultivos con una similar viabilidad. Las MSC equinas mostraron un buen
potencial de diferenciación a osteoblasto y condrocito utilizando condiciones descritas
en la bibliografía para otras especies. Sin embargo, fue necesario testar hasta 16 medios
de diferenciación distintos para alcanzar la diferenciación adipogénica.
Establecidas las condiciones óptimas de cultivo y diferenciación pasamos a
analizar el fenotipo para antígenos de superficie celular de las BM-MSCs y AT-MSCs
(Manuscrito III). Inicialmente intentamos determinar el inmunofenotipo por medio de
citometría de flujo, pero tras la evaluación de 5 anticuerpos comerciales frente a los
marcadores de MSCs más utilizados en la especie humana encontramos que sólo 2 de
ellos mostraron reactividad contra los epítopos de las MSCs equinas. Por tanto, para
completar el análisis del fenotipo de estas células utilizamos la RT-qPCR, y de esta
RESULTADOS Y DISCUSIÓN | 57
manera obtuvimos el perfil de expresión génico de los marcadores de MSCs en las
células equinas y establecimos diferencias en la expresión de ciertos marcadores.
Estos estudios de caracterización los llevamos a cabo mediante el cultivo de
células en condiciones estándar, es decir, a 37 ºC, 5% CO2 y 20% O2. Sin embargo, nos
interesamos por conocer el efecto del oxígeno sobre las características analizadas
utilizando unas condiciones de cultivo más similares a las fisiológicas, es decir, en
condiciones de hipoxia (5% O2). Analizamos la capacidad de expansión de las BM-
MSCs bajo las dos atmósferas de oxígeno y los potenciales de diferenciación hacia
osteoblasto, adipocito y condrocito con las condiciones establecidas en el manuscrito II
(Manuscrito IV). Además, determinamos de qué modo el oxígeno afectaba al cultivo
de las AT-MSCs y BM-MSCs analizando la viabilidad y la progresión del ciclo celular
y estudiamos si el fenotipo y la expresión de marcadores de pluripotencia de las MSCs
equinas resultaban alterados por la distinta condición de oxígeno (Manuscrito V).
Por último, aplicando las técnicas de cultivo y moleculares puestas a punto a lo
largo de los anteriores manuscritos, llevamos a cabo la caracterización de BM-MSCs y
AT-MSCs utilizadas en un estudio pre-clínico para el tratamiento de lesiones tendinosas
inducidas (Manuscrito VI). Analizamos y comparamos entre los dos tipos celulares el
fenotipo de los marcadores de superficie y la habilidad para diferenciarse hacia linajes
osteogénico, adipogénico y condrogénico. Los resultados obtenidos de la
caracterización de estas MSCs se engloban dentro del estudio pre-clínico que está
siendo realizado en colaboración con el Hospital Clínico Veterinario de la Universidad
de Zaragoza y que tiene como objetivo establecer una correlación entre ellos y otros
datos funcionales, ecográficos, moleculares, histológicos y ultraestructurales que se
están analizando.
A continuación se enumeran los manuscritos a los que se ha hecho mención:
I. Ranera B, Remacha AR, Álvarez-Arguedas S, Romero A, Zaragoza P,
Martín-Burriel I, Vázquez FJ and Rodellar C. Effect of time on equine bone
marrow derived mesenchymal stem cells isolation. Veterinary Record (Enviado)
RESULTADOS Y DISCUSIÓN | 58
II. Ranera B, Ordovás L, Lyahyai J, Bernal ML, Fernandes F, Remacha AR,
Romero A, Vázquez FJ, Osta R, Cons C, Varona L, Zaragoza P, Martín-Burriel I and
Rodellar C. Comparative study of equine bone marrow and adipose tissue-
derived mesenchymal stromal cells. Equine Veterinary Journal 2012 Jan;44(1):33-
42.
III. Ranera B, Lyahyai J, Romero A, Vázquez FJ, Remacha AR, Bernal ML,
Zaragoza P, Rodellar and Martín-Burriel I. Immunophenotype and gene
expression profiles of cell surface markers of mesenchymal stem cells derived
from equine bone marrow and adipose tissue. Veterinary Immunology and
Immunopathology 2011 Nov 15;144(1-2):147-54.
IV. Ranera B, Remacha AR, Álvarez-Arguedas S, Castiella T, Vázquez FJ,
Romero A, Zaragoza P, Martín-Burriel I, Rodellar C. Expansion under hypoxic
conditions enhances the chondrogenic potential of equine bone marrow-derived
mesenchymal stem cells. The Veterinary Journal (En revisión).
V. Ranera B, Remacha AR, Álvarez-Arguedas S, Romero A, Vázquez FJ,
Zaragoza P, Martín-Burriel I, Rodellar C. Effect of hipoxia on equine
mesenchymal stem cells derived from bone marrow and adipose tissue. BMC
Veterinary Research (Enviado).
VI. Characterization of the equine MSCs used in a preclinical trial to
evaluate the capacity of MSCs for healing induced tendón injuries.

MANUSCRITO I
RESULTADOS Y DISCUSIÓN | 59
5.1. MANUSCRITO I
Effect of time on equine bone marrow derived mesenchymal stem cells isolation.
Beatriz Ranera, Ana Rosa Remacha, Samuel Álvarez-Arguedas, Antonio Romero,
Pilar Zaragoza, Inmaculada Martín-Burriel, Francisco José Vázquez, Clementina
Rodellar.

MANUSCRITO I
RESULTADOS Y DISCUSIÓN | 60
Superficial digital-flexor tendon (SDFT) from racehorses usually suffers over-
strain injuries consequence of overuse during the performance and the effect of aging
(Williams and others 2001). Tendon healing takes place through a process of fibrosis
(Diegelmann and Evans 2004) that results in a tendon scar with inferior biochemical
and mechanical properties (Leadbetter 1992). Consequently, returning to the same
performance level previous to the injury is committed, the risk of the re-injury
increases (Crevier-Denoix and others 1997) and leads in some occasions to the
premature retirement of racehorses.
Conventional treatments for this kind of injury have failed in restoring the SDFT
functionality (Dyson 2004). However cell therapy based on the application of BM-
MSCs has shown efficacy in the treatment of spontaneous tendinitis in racehorses
(Godwin and others 2011). These promising results have encouraged the setting up of
commercial companies which are based on the use of expanded BM-MSC to deal with
equine locomotor injuries.
Bone marrow from the injured horse is collected by the veterinarian and sent in
containers at 4 ºC to the laboratory. Within 48 hours of aspiration, samples are usually
received in the laboratories where BM-MSCs will be isolated and expanded. Once there
are enough BM-MSCs, they are recovered and transported back to the veterinarian for
implantation in the horse injury (Smith 2008).
To our knowledge there are not previous reports about how the delay in BM-
MSCs isolation due to the shipping of bone marrow can affect the samples. The aim of
the present work was to determinate the effect of the time on the ability to form BM-
MSC CFUs (colony forming units) when the isolation is performed straight from the
harvesting and 24 hours later.
Bone marrow was obtained from the sternebrae of 5 castrated male horses aged
4 to 7 years. All procedures were carried out under Project Licence PI36/07 approved
by the Ethic Committee for Animal Experiments from the University of Zaragoza. The
care and use of animals was performed in accordance with the Spanish Policy for
Animal Protection RD1201/05, which meets the European Union Directive 86/609 on
the protection of animals used for experimental and other scientific purposes.
MANUSCRITO I
RESULTADOS Y DISCUSIÓN | 61
A total volume of 20 mL of bone marrow was collected from the horses and
subsequently split in two fractions of 10 mL. BM-MSCs were straight isolated from one
of the fractions, which were denominated as “0 hours” (0h) cultures, and the remaining
fraction was placed in a polystyrene box with two ice block mimicking the manner of
delivery, and were denominated as “24 hours” (24h) cultures. BM-MSCs from both
fractions were isolated as previously described (Ranera and others 2011a; Ranera and
others 2011b) and set in T75 flask with growth media, consisting of low glucose
DMEM supplemented with 10% FBS, 1% Glutamine and 1% Streptomycin/Penicillin.
Before setting in culture, a 50µL aliquot of the mononuclear cells was counted in a
haemocytometer. Mononuclear cells were washed twice with PBS after 24, 48 and 72 h
of incubation at 37 ºC at 5% CO2. Afterwards, the media was changed twice a week.
After 10 days of culture, a CFU assay was performed. The cells were fixed with
10% paraformaldehyde and stained with 10% Giemsa in phosphate buffer. Pictures
from the flasks were taken using a Canon G11 camera and the colonies were counted
using cell counter tool from Image J software. Differences in mononuclear cells and
number of colonies between 0h and 24h cultures were evaluated with the Student’s t test
using the SPSS Statistic 19 software.
The average of mononuclear cells obtained after the straight isolations was
12.5·106 ± 7.02·10
6 (mean ± standard deviation), while the count of the mononuclear
cells obtained 24 hours after the aspiration was 5.81·106 ± 3.75·10
6. Therefore, the
viability of the mononuclear cells dropped a 46.48% in the samples treated 24 hours
after collection from the animal and maintained in shipping conditions. The percentage
of loss is greater than the 9% decrease reported for expanded BM-MSCs during a period
of 72h when they are sent back to the veterinarian for re-implantation in the injury
(Godwin and others 2011).
In both cultures first colonies appeared approximately 4 days after isolation and
the cells displayed the typical spindle shaped morphology (Vidal and others 2006).
After 10 days, the cultures were stopped and the CFU assay was performed. A
significantly higher number of colonies was detected in 0h (383.60 ± 149.32) than in
24h (156.2 ± 81.32) cultures (FIG. 1), which means a 59.28% less CFU. The differences
in the formation of CFU between the two cultures were evident macroscopically (FIG.

MANUSCRITO I
RESULTADOS Y DISCUSIÓN | 62
2). Therefore, the lapse of time between the collection of bone marrow and the isolation
of BM-MSCs might be crucial in the quantity of colonies formed, and consequently in
the final number of BM-MSCs at the end of the time of culture.
As the purpose of the application of BM-MSCs in cell therapy is treating
spontaneous injuries in horses; obtaining the greater amount of cells as soon as possible
is imperious. The presence of the animal away from the laboratory where the BM-MSC
isolation takes place makes necessary the transport of the bone marrow by delivery
system. As a result, a lapse of time appears between these two stages, affecting the
viability of the mononuclear cells and the ability to form colonies as we show in this
report. Our data suggest that sample transport at 4 ºC might not be the most accurate,
although low temperatures slows down the metabolism as it is proved in the shipping of
other cell types (Parks 1997). To obtain a higher number of cells and compensate the
loss of viability during the transport, the isolation of BM-MSCs might be made from a
larger volume of bone marrow. For instance, 60 mL seem to be sufficient to yield a
considerable number of cells (Toupadakis and others 2011). Further studies are
necessaries to establish which conditions would be the best to increase the viability of
mononuclear cells and obtain higher number of CFU. While these conditions are
achieved, the study of the MSC characteristics, as differentiation potentials, of MSCs
isolated at different times would be interesting.
Acknowledgements
This work was performed as part of the AGL2008-02428/GAN
(MICINN/FEDER) project and was partially financed by the Gobierno de Aragón
(Grupo de Excelencia LAGENBIO) and InstitutoAragonés de Ciencias de la Salud
(I+CS). B. Ranera was supported by a doctoral grant from DGA.

MANUSCRITO I
RESULTADOS Y DISCUSIÓN | 63
FIGURE LEGENDS
FIG. 1. Mean ± standard deviation of the number of colony forming units (CFU) of
BM-MSCs after 10 days of culture. The bar on the left represents the colonies counted
of BM-MSCs from straight isolated cultures and the bar on the right from 24 hours
delayed cultures.
FIG. 2. Representative CFU assays after 10 days. a) Stained colonies of straight isolated
cultures in a T75 flask. b) Stained colonies of 24 hours delayed cultures in a T75 flask.

MANUSCRITO I
RESULTADOS Y DISCUSIÓN | 64
REFERENCES
CREVIER-DENOIX, N., COLLOBERT, C., POURCELOT, P., DENOIX, J. M.,
SANAA, M., GEIGER, D., BERNARD, N., RIBOT, X., BORTOLUSSI, C. &
BOUSSEAU, B. (1997) Mechanical properties of pathological equine superficial digital
flexor tendons. Equine Vet J Suppl, 23-26
DIEGELMANN, R. F. & EVANS, M. C. (2004) Wound healing: an overview of acute,
fibrotic and delayed healing. Front Biosci 9, 283-289
DYSON, S. J. (2004) Medical management of superficial digital flexor tendonitis: a
comparative study in 219 horses (1992-2000). Equine Vet J 36, 415-419
GODWIN, E. E., YOUNG, N. J., DUDHIA, J., BEAMISH, I. C. & SMITH, R. K.
(2011) Implantation of bone marrow-derived mesenchymal stem cells demonstrates
improved outcome in horses with overstrain injury of the superficial digital flexor
tendon. Equine Vet J 44, 25-32
LEADBETTER, W. B. (1992) Cell-matrix response in tendon injury. Clin Sports Med
11, 533-578
PARKS, J. E. (1997) Hypothermia and mammalian gametes. San Diego, Accademic
Press
RANERA, B., LYAHYAI, J., ROMERO, A., VAZQUEZ, F. J., REMACHA, A. R.,
BERNAL, M. L., ZARAGOZA, P., RODELLAR, C. & MARTIN-BURRIEL, I.
(2011a) Immunophenotype and gene expression profiles of cell surface markers of
mesenchymal stem cells derived from equine bone marrow and adipose tissue. Vet
Immunol Immunopathol 144, 147-154
RANERA, B., ORDOVAS, L., LYAHYAI, J., BERNAL, M. L., FERNANDES, F.,
REMACHA, A. R., ROMERO, A., VAZQUEZ, F. J., OSTA, R., CONS, C.,
VARONA, L., ZARAGOZA, P., MARTIN-BURRIEL, I. & RODELLAR, C. (2011b)
Comparative study of equine bone marrow and adipose tissue-derived mesenchymal
stromal cells. Equine Vet J 44, 33-42
SMITH, R. K. (2008) Mesenchymal stem cell therapy for equine tendinopathy. Disabil
Rehabil 30, 1752-1758
TOUPADAKIS, C. A., WONG, A., GENETOS, D. C., CHEUNG, W. K.,
BORJESSON, D. L., FERRARO, G. L., GALUPPO, L. D., LEACH, J. K., OWENS, S.
D. & YELLOWLEY, C. E. (2011) Comparison of the osteogenic potential of equine
mesenchymal stem cells from bone marrow, adipose tissue, umbilical cord blood, and
umbilical cord tissue. Am J Vet Res 71, 1237-1245
VIDAL, M. A., KILROY, G. E., JOHNSON, J. R., LOPEZ, M. J., MOORE, R. M. &
GIMBLE, J. M. (2006) Cell growth characteristics and differentiation frequency of
adherent equine bone marrow-derived mesenchymal stromal cells: adipogenic and
osteogenic capacity. Vet Surg 35, 601-610
WILLIAMS, R. B., HARKINS, L. S., HAMMOND, C. J. & WOOD, J. L. (2001)
Racehorse injuries, clinical problems and fatalities recorded on British racecourses from
flat racing and National Hunt racing during 1996, 1997 and 1998. Equine Vet J 33, 478-
486
MANUSCRITO II
RESULTADOS Y DISCUSIÓN | 65
5.2. MANUSCRITO II
Comparative study of equine bone marrow and adipose tissue-derived
mesenchymal stromal cells.
Beatriz Ranera, Laura Ordovás, Jaber Lyahyai, María Luisa Bernal, Fernando
Fernandes, Ana Rosa Remacha, Antonio Romero, Francisco José Vázquez, Rosario
Osta, Carmen Cons, Luis Varona, Pilar Zaragoza, Inmaculada Martín-Burriel,
Clementina Rodellar.

MANUSCRITO II
RESULTADOS Y DISCUSIÓN | 66

MANUSCRITO II
RESULTADOS Y DISCUSIÓN | 67
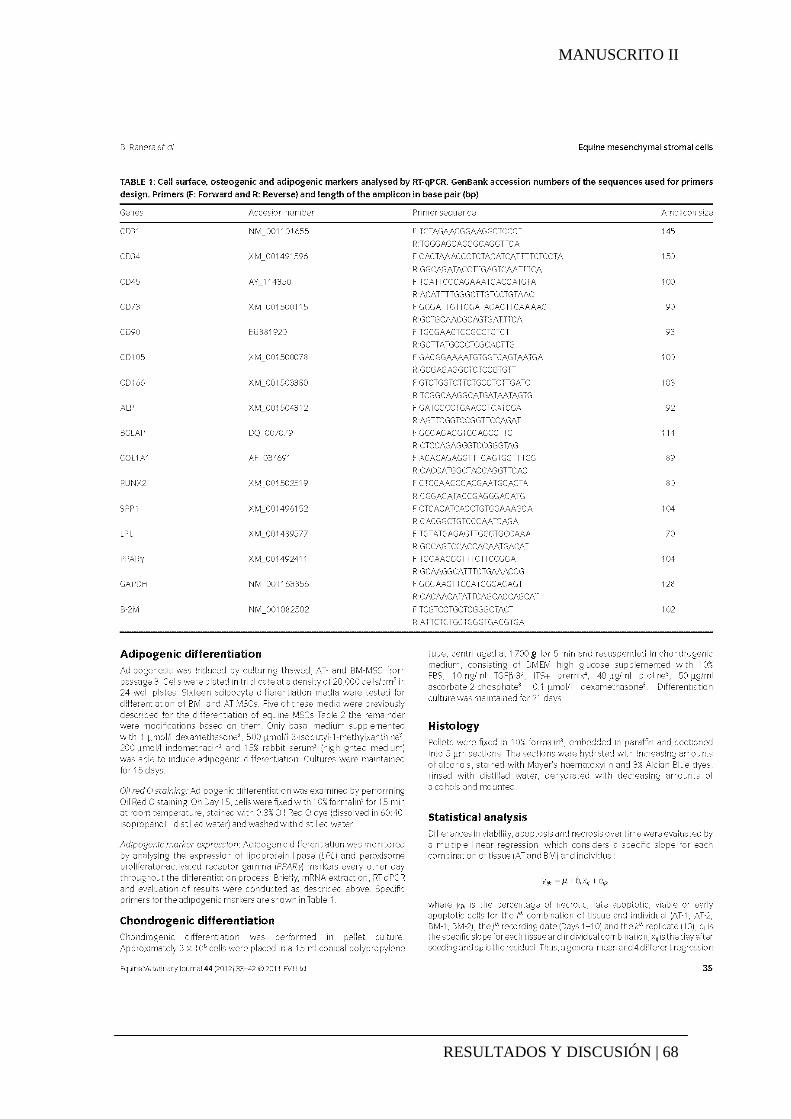
MANUSCRITO II
RESULTADOS Y DISCUSIÓN | 68

MANUSCRITO II
RESULTADOS Y DISCUSIÓN | 69
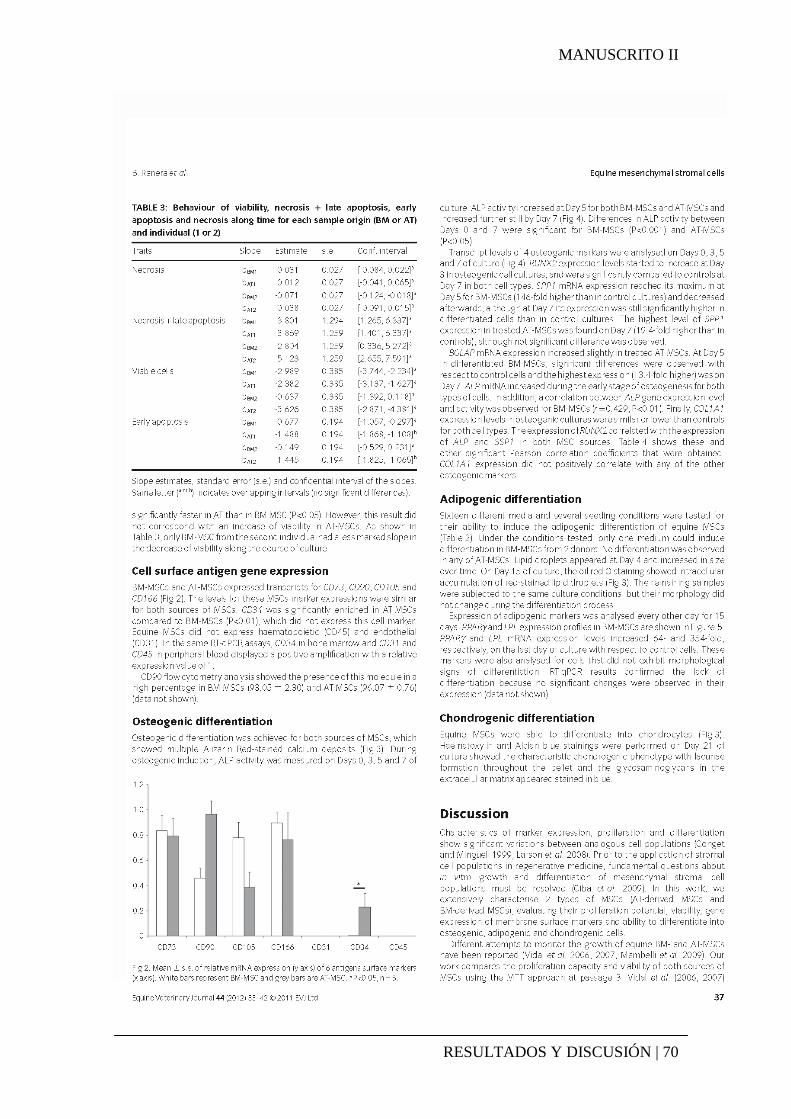
MANUSCRITO II
RESULTADOS Y DISCUSIÓN | 70

MANUSCRITO II
RESULTADOS Y DISCUSIÓN | 71

MANUSCRITO II
RESULTADOS Y DISCUSIÓN | 72

MANUSCRITO II
RESULTADOS Y DISCUSIÓN | 73

MANUSCRITO II
RESULTADOS Y DISCUSIÓN | 74
MANUSCRITO II
RESULTADOS Y DISCUSIÓN | 75

MANUSCRITO III
RESULTADOS Y DISCUSIÓN | 76
5.3. MANUSCRITO III
Immunophenotype and gene expression profiles of cell surface markers of
mesenchymal stem cells derived from equine bone marrow and adipose tissue.
Beatriz Ranera, Jaber Lyahyai, Antonio Romero, Francisco José Vázquez, Ana Rosa
Remacha, María Luisa Bernal, Pilar Zaragoza, Clementina Rodellar, Inmaculada
Martín-Burriel.

MANUSCRITO III
RESULTADOS Y DISCUSIÓN | 77
MANUSCRITO III
RESULTADOS Y DISCUSIÓN | 78

MANUSCRITO III
RESULTADOS Y DISCUSIÓN | 79

MANUSCRITO III
RESULTADOS Y DISCUSIÓN | 80

MANUSCRITO III
RESULTADOS Y DISCUSIÓN | 81

MANUSCRITO III
RESULTADOS Y DISCUSIÓN | 82

MANUSCRITO III
RESULTADOS Y DISCUSIÓN | 83

MANUSCRITO III
RESULTADOS Y DISCUSIÓN | 84

MANUSCRITO IV
RESULTADOS Y DISCUSIÓN | 85
5.4. MANUSCRITO IV
Expansion under hypoxic conditions enhances the chondrogenic potential of
equine bone marrow-derived mesenchymal stem cells.
Beatriz Ranera, Ana Rosa Remacha, Samuel Álvarez-Arguedas, Tomás Castiella,
Francisco José Vázquez, Antonio Romero, Pilar Zaragoza, Inmaculada Martín-Burriel,
Clementina Rodellar.

MANUSCRITO IV
RESULTADOS Y DISCUSIÓN | 86
Abstract
Bone marrow-derived mesenchymal stem cells (BM-MSCs) are widely used in
regenerative medicine in horses. Most of the molecular characterisations of BM-MSCs
have been made at 20% O2, higher oxygen level than surrounds the cells inside the bone
marrow. The present work compares the lifespan and the tri-lineage potential of equine
BM-MSCs expanded in normoxia (20% O2) and hypoxia (5% O2). No significant
differences were found in long-term cultures, in osteogenesis and in adipogenesis
between normoxic and hypoxic expanded BM-MSCs. An up-regulation of the
chondrogenesis-related genes (COL2A1, AGN, LUM, BGL and COMP) and an increase
of the extracellular sGAG content (sulphated glycosaminoglycans) were found in cells
that were expanded under hypoxia. These results suggest that the expansion of BM-
MSCs in hypoxic conditions enhances chondrogenesis in equine BM-MSCs.
Keywords: Equine; MSCs; Bone marrow; Hypoxia; Chondrogenesis.

MANUSCRITO IV
RESULTADOS Y DISCUSIÓN | 87
Physiological oxygen concentrations surrounding cells are much lower than the
oxygen concentrations used in culture. Traditional incubators are supplied by room air
that has an oxygen content of approximately 20% (referred to as “normoxia” according
to the conventional terminology). This is in contrast with the oxygen tension inside the
MSC niches bone marrow (BM) which ranges between 1% and 7%, (Mohyeldin et al.,
2010).
Hypoxia is important during the formation of cartilage during foetal
development. In vitro MSC chondrogenesis is controversial; in some studies it is
enhanced (Zscharnack et al., 2009) and in other studies the opposite effect is described
(D'Ippolito et al., 2006).
The use of MSCs as a therapeutic tool in the treatment of musculoskeletal
defects in horses has increased during the last few years (Frisbie and Smith, 2010).
Most in vitro studies of equine MSCs conducted recently (Ranera et al., 2011b) have
been carried out in traditional incubators in an attempt to know as much as possible of
MSC characteristics for use them in cell therapy. However, how low oxygen tension
affects the expansion of equine MSCs is still unknown.
The aim of this work was to analyse the effect of oxygen tension on the
proliferation and differentiation potentials of equine MSCs derived from bone marrow
(BM-MSCs), comparing cells expanded under hypoxic and normoxic conditions.
Bone marrow aspirates were obtained from a total of 5 castrated male horses. All
procedures were carried out under Project Licence PI36/07 approved by the Ethic
Committee for Animal Experiments from the University of Zaragoza. The care and use
of animals was performed in accordance with the Spanish Policy for Animal Protection
RD1201/05, which meets the European Union Directive 86/609 on the protection of
animals used for experimental and other scientific purposes.
Samples were collected and MSC were isolated as previous described (Ranera et
al., 2011a; Ranera et al., 2011b). Cultures were maintained at 37ºC in either normoxic
(20% O2) or hypoxic conditions (5% O2) in growth media. Growth potential of equine
BM-MSCs was determined for ten passages (Supplementary material). Equine BM-

MANUSCRITO IV
RESULTADOS Y DISCUSIÓN | 88
MSCs were also expanded until passage two for both oxygen conditions. Then, the cells
were cryopreserved for further analysis.
Osteogenic and adipogenic differentiation analyses were performed
(Supplementary material). For chondrogenic differentiation, BM-MSCs were thawed
and 500,000 BM-MSCs were pelleted and exposed to chondrogenic induction media
(Ranera et al., 2011a; Ranera et al., 2011b) for 21 days at 20% O2. After the induction
period, the micromasses were sectioned and examined by alcian blue and safranin O
staining. Immunohistochemistry for S-100 protein was performed using the polyclonal
rabbit antibody IR504 (DAKO). On days 0, 7, 14 and 21 sulphated glycosaminoglycans
(sGAG) and gene expression of chondrogenesis-related and HIF-1α genes
quantifications were assessed. The RNA spin mini (GE Healthcare) and the Superscript
kit (Invitrogen) were used for total RNA isolation and reverse transcription, following
manufacturer’s instructions. Table 1 shows the names of the genes analysed by real-
time quantitative PCR (RT-qPCR). The levels of gene expression were determined as
previously described (Ranera et al., 2011a; Ranera et al., 2012). Statistics were assessed
using PSAW Statistics 18 software. Differences in quantitative analyses between BM-
MSCs expanded in normoxic and hypoxic conditions were evaluated with the Student’s
t test, ANOVA test was carried out to analyse the effect of time along the course of
differentiations. Statistical significance was defined as P <0.05.
Lifespan, osteogenic and adipogenic potentials of BM-MSCs were not affected
by hypoxia. No significant differences were detected between normoxic and hypoxia
cells in these assays (Supplementary material).
In contrast, chondrogenesis seemed to be enhanced by hypoxia. Fig. 1 shows the
fold change of the chondrogenic quantifications with respect to the undifferentiated
cells from day 0. The production of sGAG by hypoxic BM-MSCs during differentiation
was greater than that of normoxic BM-MSCs (Fig. 1a). This increase was significant on
the last day of culture with respect to day 0. The fold change of expression of COL2A1
and ACAN on day 21 with respect to day 0 of differentiation was higher in BM-MSCs
expanded under normoxic condition (Fig. 1b-c), although significant differences
between the expression levels on these days were only detected in hypoxic BM-MSCs.
This contradiction was due to the expression of these genes was three times more up-

MANUSCRITO IV
RESULTADOS Y DISCUSIÓN | 89
regulated on day 0 in BM-MSCs expanded under low oxygen condition (Supplementary
Table 1). This fact might be the result of an enhancement of SOX9 in hypoxic cultures
(Robins et al., 2005) which is a trigger of the chondrogenic genes COL2A1 and AGN
(Barry et al., 2001).
The mRNA expression levels of the LUM, BGN and COMP genes were higher
in MSCs from cultures expanded at 5% O2 than those that were expanded at 20% O2
over the course of differentiation. But only significant differences were detected
between pellets from hypoxic and normoxic BM-MSCs on day 14 for LUM and on day
21 for COMP. Significant expression differences of these markers were observed for
hypoxic expanded BM-MSCs on day 21 relative to days 0 and 7 for LUM and relative
to days 0, 7 and 14 for COMP, suggesting that the differentiation of equine BM-MSCs
into chondrocytes is favoured in a low-oxygen environment. These results agree with
other reports in bovine, human and murine species (Markway et al., 2010; Robins et al.,
2005; Zscharnack et al., 2009) which describe an enhancement of chondrogenesis in
MSCs exposed to hypoxia.
The gene expression of HIF-1α increased gradually during chondrogenesis in
BM-MSCs expanded in hypoxia, significant expression differences were observed on
day 21 relative to days 0, 7 and 21 (Fig. 1g). The up-regulation of HIF-1α in normoxic
BM-MSCs was not as marked as in hypoxic BM-MSCs over the chondrogenic
induction. In addition, the difference on the HIF-1α expression was significantly higher
in hypoxic cells than in normoxic cells on day 21 (Supplementary Table 1). The up-
regulation of chondrogenic-related genes and HIF-1α during chondrogenic induction in
hypoxic BM-MSCs might indicate HIF-1α is an essential factor to achieve
chondrogenesis in MSCs. Taken together these results, HIF-1α would play a role in
extracellular matrix formation regulating up-stream the expression of the chondrogenic-
related genes. This result agrees with cartilage formation models that point out HIF-1α
as a key factor in cartilage development and differentiation (Schipani, 2005).
Chondrogenesis was confirmed by the glucosaminoglycan-specific stainings
with alcian blue and safranin O (Figure 2a-b and 2c-d) that showed a greater
accumulation of these molecules in the extracellular matrix in BM-MSCs expanded
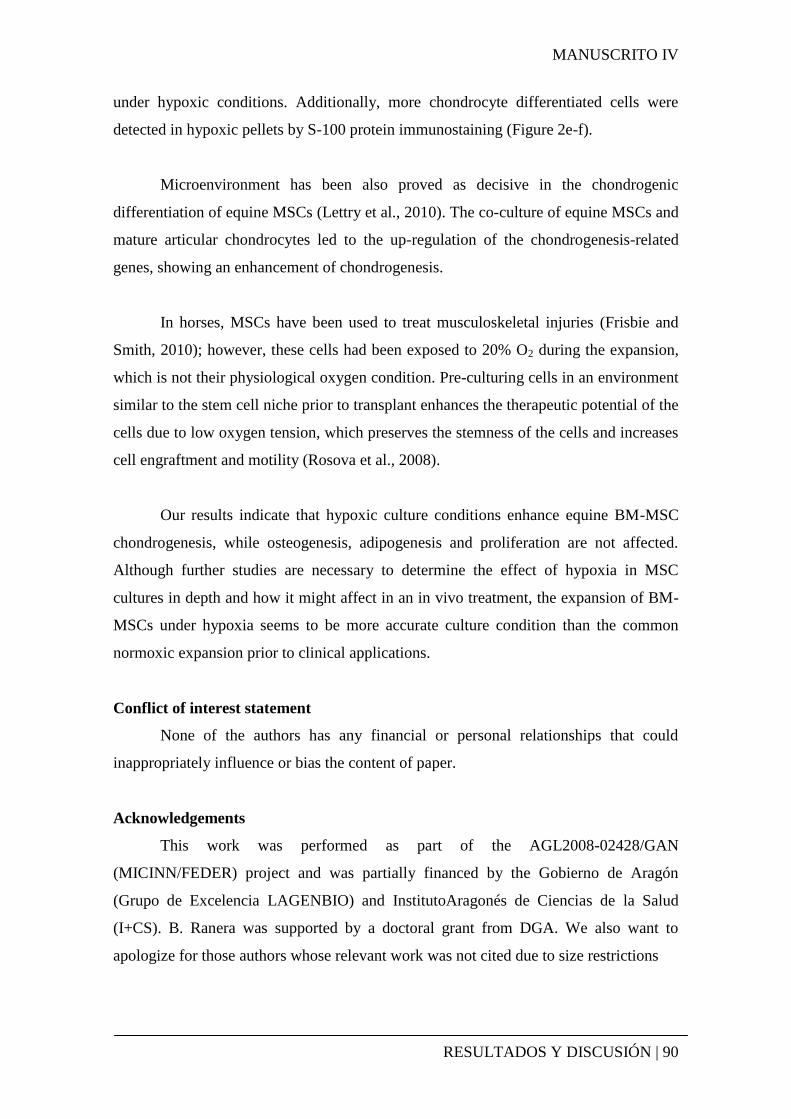
MANUSCRITO IV
RESULTADOS Y DISCUSIÓN | 90
under hypoxic conditions. Additionally, more chondrocyte differentiated cells were
detected in hypoxic pellets by S-100 protein immunostaining (Figure 2e-f).
Microenvironment has been also proved as decisive in the chondrogenic
differentiation of equine MSCs (Lettry et al., 2010). The co-culture of equine MSCs and
mature articular chondrocytes led to the up-regulation of the chondrogenesis-related
genes, showing an enhancement of chondrogenesis.
In horses, MSCs have been used to treat musculoskeletal injuries (Frisbie and
Smith, 2010); however, these cells had been exposed to 20% O2 during the expansion,
which is not their physiological oxygen condition. Pre-culturing cells in an environment
similar to the stem cell niche prior to transplant enhances the therapeutic potential of the
cells due to low oxygen tension, which preserves the stemness of the cells and increases
cell engraftment and motility (Rosova et al., 2008).
Our results indicate that hypoxic culture conditions enhance equine BM-MSC
chondrogenesis, while osteogenesis, adipogenesis and proliferation are not affected.
Although further studies are necessary to determine the effect of hypoxia in MSC
cultures in depth and how it might affect in an in vivo treatment, the expansion of BM-
MSCs under hypoxia seems to be more accurate culture condition than the common
normoxic expansion prior to clinical applications.
Conflict of interest statement
None of the authors has any financial or personal relationships that could
inappropriately influence or bias the content of paper.
Acknowledgements
This work was performed as part of the AGL2008-02428/GAN
(MICINN/FEDER) project and was partially financed by the Gobierno de Aragón
(Grupo de Excelencia LAGENBIO) and InstitutoAragonés de Ciencias de la Salud
(I+CS). B. Ranera was supported by a doctoral grant from DGA. We also want to
apologize for those authors whose relevant work was not cited due to size restrictions

MANUSCRITO IV
RESULTADOS Y DISCUSIÓN | 91
References
Barry, F., Boynton, R.E., Liu, B., Murphy, J.M., 2001. Chondrogenic differentiation of
mesenchymal stem cells from bone marrow: differentiation-dependent gene expression
of matrix components. Exp Cell Res 268, 189-200.
D'Ippolito, G., Diabira, S., Howard, G.A., Roos, B.A., Schiller, P.C., 2006. Low oxygen
tension inhibits osteogenic differentiation and enhances stemness of human MIAMI
cells. Bone 39, 513-522.
Frisbie, D.D., Smith, R.K., 2010. Clinical update on the use of mesenchymal stem cells
in equine orthopaedics. Equine Vet J 42, 86-89.
Lettry, V., Hosoya, K., Takagi, S., Okumura, M., 2010. Coculture of equine
mesenchymal stem cells and mature equine articular chondrocytes results in improved
chondrogenic differentiation of the stem cells. Jpn J Vet Res 58, 5-15.
Markway, B.D., Tan, G.K., Brooke, G., Hudson, J.E., Cooper-White, J.J., Doran, M.R.,
2010. Enhanced chondrogenic differentiation of human bone marrow-derived
mesenchymal stem cells in low oxygen environment micropellet cultures. Cell
Transplant 19, 29-42.
Mohyeldin, A., Garzon-Muvdi, T., Quinones-Hinojosa, A., 2010. Oxygen in stem cell
biology: a critical component of the stem cell niche. Cell Stem Cell 7, 150-161.
Ranera, B., Lyahyai, J., Romero, A., Vazquez, F.J., Remacha, A.R., Bernal, M.L.,
Zaragoza, P., Rodellar, C., Martin-Burriel, I., 2011a. Immunophenotype and gene
expression profiles of cell surface markers of mesenchymal stem cells derived from
equine bone marrow and adipose tissue. Vet Immunol Immunopathol.
Ranera, B., Ordovas, L., Lyahyai, J., Bernal, M.L., Fernandes, F., Remacha, A.R.,
Romero, A., Vazquez, F.J., Osta, R., Cons, C., Varona, L., Zaragoza, P., Martin-Burriel,
I., Rodellar, C., 2011b. Comparative study of equine bone marrow and adipose tissue-
derived mesenchymal stromal cells. Equine Vet J.
Ranera, B., Ordovas, L., Lyahyai, J., Bernal, M.L., Fernandes, F., Remacha, A.R.,
Romero, A., Vazquez, F.J., Osta, R., Cons, C., Varona, L., Zaragoza, P., Martin-Burriel,
I., Rodellar, C., 2012. Comparative study of equine bone marrow and adipose tissue-
derived mesenchymal stromal cells. Equine Vet J.
Robins, J.C., Akeno, N., Mukherjee, A., Dalal, R.R., Aronow, B.J., Koopman, P.,
Clemens, T.L., 2005. Hypoxia induces chondrocyte-specific gene expression in
mesenchymal cells in association with transcriptional activation of Sox9. Bone 37, 313-
322.
Rosova, I., Dao, M., Capoccia, B., Link, D., Nolta, J.A., 2008. Hypoxic preconditioning
results in increased motility and improved therapeutic potential of human mesenchymal
stem cells. Stem Cells 26, 2173-2182.
Schipani, E., 2005. Hypoxia and HIF-1 alpha in chondrogenesis. Semin Cell Dev Biol
16, 539-546.
Zscharnack, M., Poesel, C., Galle, J., Bader, A., 2009. Low oxygen expansion improves
subsequent chondrogenesis of ovine bone-marrow-derived mesenchymal stem cells in
collagen type I hydrogel. Cells Tissues Organs 190, 81-93.

MANUSCRITO IV
RESULTADOS Y DISCUSIÓN | 92
SUPPLEMENTARY MATERIAL
Material and methods
Growth potential.
After the first treatment with trypsin, BM-MSCs cultured in each oxygen
condition were seeded in triplicate in 6-well plates at a density of 5,000 cells/cm2. This
was considered passage one. The cells were maintained in culture for ten passages
(approximately one hundred days) and were trypsinised at 90% confluence. At every
passage, the BM-MSCs were counted in a haemocytometer Z2 Coulter particle count
and size analyser, and reseeded at the initial density. The cells were fed every 3 days.
Population doubling was calculated every passage according to the formula:
PD = ln (Nf/Ni) / ln2,
Where Nf is the final number of cells; Ni is the initial number of cells; and PD is the
population doubling number.
Osteogenic differentiation.
Osteogenic differentiation was set as previous described. The differentiation
induction was maintained for 9 days at 20% O2 for cells expanded in both conditions.
After that period, calcium deposits formed were stained by alizarin red 2%.
To quantify the osteogenic potential of BM-MSCs, the activity of alkaline
phosphatase (ALP) was evaluated on days 0, 3, 6 and 9 as it was previous described .
Adipogenic differentiation.
Adipogenic differentiation was set as in previous works . Induction was
maintained for 14 days at 20% O2 for cells expanded in both conditions. To determine
the adipogenic differentiation, lipid droplets formed inside the cells were stained using
oil red O 0.3% staining.
To quantify the accumulation of lipids, the oil red O was extracted from
differentiated BM-MSCs with isopropanol after every staining, and the absorbance was
measured at 510 nm. Then, proteins from fixed cells were stained with Ponceau S dye

MANUSCRITO IV
RESULTADOS Y DISCUSIÓN | 93
(Fluka) for 10 minutes to normalise oil red O measures. Ponceau was extracted from
cells using PBS, and the absorbance was measured at 515 nm.
Results
Cell growth.
The cells were passaged ten times, which corresponds with nearly 100 days of
culture. During that period, no significant difference was observed in the cell doubling
between the BM-MSCs exposed to 5% or 20% O2 (Supplementary Fig. 1). Both cell
types showed a similar lifespan. At approximately day 80 of culture, the cells started to
slow down the proliferation, reaching the plateau of the growth curve. The proliferative
ability was similar at passage ten; normoxic and hypoxic cells displayed a cumulative
population doubling of 31.28 ± 6.28 and 31.68 ± 5.10, respectively.
Osteogenic potential.
To examine the effect of low oxygen tension in osteogenic differentiation of
MSCs, alkaline phosphatase activity (ALP Activity) and mRNA expression of runt-
related transcription factor 2 (RUNX2) and alkaline phosphatase (ALP) were quantified
on days 0, 3, 6 and 9 in the BM-MSCs cultured in induction and control media.
Supplementary Fig. 2a-c shows the fold change of the osteogenic quantifications of both
experimental groups relative to their respective controls.
The ALP activity was significantly higher in all time points relative to day 0 for
both conditions (P<0.05). Significant differences (P<0.05) were found between
normoxic BM-MSCs and their controls on days 3, 6, and 9 (P<0.01), whereas with
hypoxic BM-MSCs, differences were only detected on day 9 (P<0.05).
The mRNA expression of ALP increased during the induction period for both
conditions, being statistically significant (P<0.05) for cells expanded under normoxic
conditions due to the differences found between the ALP expression on day 9 and the
other three time points analysed. The expression of RUNX2 in the cells expanded under
both conditions was significantly different during the time of differentiation (P<0.05)
because of the differences found between the last day of culture and day 0. The ALP
expression levels in normoxic and hypoxic cells were significantly higher in induced
cells on days 6 (P<0.05 and P<0.01, respectively) and 9 (P<0.01 and P<0.05,

MANUSCRITO IV
RESULTADOS Y DISCUSIÓN | 94
respectively) than in the respective controls. Significant differences in the expression of
RUNX2 were also found in differentiated cells compared to non-induced cells on days 6
and 9 in normoxic BM-MSCs and on day 9 (P<0.05) in hypoxic BM-MSCs. The cells
from the two experimental conditions did not display significant differences either in
ALP activity or in the mRNA expression of the genes analysed.
In addition to the modifications of gene expression of osteogenesis-related
genes, alizarin red staining confirmed the ability of the normoxic and hypoxic BM-
MSCs to differentiate into osteogenic lineages (Supplementary Fig. 2d-e).
Adipogenic differentiation.
To assess adipogenic differentiation in the cells expanded in 20% O2 and 5% O2,
oil red O staining and quantification of mRNA expression levels of lipoprotein lipase
(LPL) and peroxisome proliferator-activated receptor γ (PPARγ) were carried out.
(Supplementary Fig.3a-c) show the fold change of these quantifications of differentiated
cells relative to control cells for both experimental groups. The amount of intracellular
lipids increased during the induction period until day 9 in both cell types. Significant
differences were found in oil red O quantification in hypoxic and normoxic MSCs in
respect to their controls on days 5 and 9 (P<0.05) and day 9 (P<0.01), respectively.
This increase was also significant at day 9 in hypoxic BM-MSCs with respect to day 0
(P<0.05). The foldchange of LPL and PPARγ mRNA expression in adipogenic cultures
with respect to controls was statistically significant in normoxic expanded BM-MSCs
on day 14 (P<0.01 and P<0.001, respectively). Hypoxic BM-MSCs did not display
significant differences from controls, although the levels of expression of LPL and
PPARγ were higher over the course of induction, except for the last day of culture.
Significant differences were not found between cells expanded in the two oxygen
conditions for any quantification.
Oil red O stained the lipid droplets formed during the induction, supporting the
quantification data obtained (Supplementary Fig. 3d-e).

MANUSCRITO IV
RESULTADOS Y DISCUSIÓN | 95
TABLES
Table 1
Chondrogenesis-related genes analysed by RT-qPCR. GenBank accession numbers of
the sequences used for primers design. Primers (F: forward and R: reverse) and size of
the amplicon (bp).
a previously described in (Ranera et al. 2011a, Ranera et al. 2011b).
Genes Accesion number Primer sequence Amplicon size
COL2A1 AF034691 F: CAGACGGGTGAACCTGGTAT
130 R: TCTCCACGAGCACCTCTTTT
ACAN AF019756 F: CTACGACGCCATCTGCTACA
96 R: ACCGTCTGGATGGTGATGTC
BGN AF035934 F: AAGGCCTCCAGCATCTCTATG
107 R: GGAGATGTAGAGCTTCTGCAGC
LUM AB292110 F: CTTGTCCATAGTGCATCTGCTTTAAG
100 R: GAAAGTAAACGCACCTGGATTCA
COMP AF325902 F: GGCGACGCGCAAATAGA
111 R: GCCATTGAAGGCCGTGTAA
GAPDH a NM_001163856
F:GGCAAGTTCCATGGCACAGT 128
R:CACAACATATTCAGCACCAGCAT
Β-2M a
NM_001082502 F:TCGTCCTGCTCGGGCTACT
102 R:ATTCTCTGCTGGGTGACGTGA

MANUSCRITO IV
RESULTADOS Y DISCUSIÓN | 96
Supplementary Table 1
Fold change of sGAG content and mRNA expression of chondrogenic markers of BM-
MSCs expanded under hypoxic condition with respect to BM-MSCs expanded under
normoxic condition over the course of chondrogenic induction.
Day 0 Day 7 Day 14 Day 21
sGAG 0.88697751 1.40130049 1.91805101 3.04567293
COL2A1 3.26061676 7.57473234 1.09065902 1.86996292
ACAN 3.45142561 2.16313025 19.6669121 2.41817827
LUM 0.97115285 0.78220806 5.52281672 2.33184727
BGN 0.41454571 1.09046634 4.19227171 1.20176531
COMP 0.96775935 2.16313025 19.6669121 2.41817827
HIF-1α 1.76238176 1.59523717 3.40116404 8.51620515

MANUSCRITO IV
RESULTADOS Y DISCUSIÓN | 97
Figures legends
Fig. 1. Mean ± s.e of normalised data with undifferentiated cells (day 0) of BM-MSCs
(n=4). White bars represent cells expanded at 20% O2, and grey bars represent cells
expanded at 5% O2. a) sGAG formed over the course the induction in the extracellular
matrix of the pellets. b-f) mRNA expression of chondrogenesis-related genes at days 0,
7, 14 and 21 of differentiation. g) mRNA expression of HIF-1α at days 0, 7, 14 and 21
of differentiation. * P < 0.05; # P < 0.05, ## P < 0.01 between normoxic and hypoxic
BM-MSCs.

MANUSCRITO IV
RESULTADOS Y DISCUSIÓN | 98
Fig. 2. Representative staining for chondrogenic differentiation in normoxic BM-MSCs
(on the left) and hypoxic BM-MSCs (on the right). a) and b) extracellular
glucosaminoglycans stained by alcian blue staining of sections on day 21 of
chondrogenesis (magnification 5x). c) and d) extracellular glucosaminoglycans stained
by safranin O staining of chondrogenic sections on day 21 (magnification 5x). e) and f)
Immunohistochemistry of S-100 protein on differentiated chondrocytes on day 21.
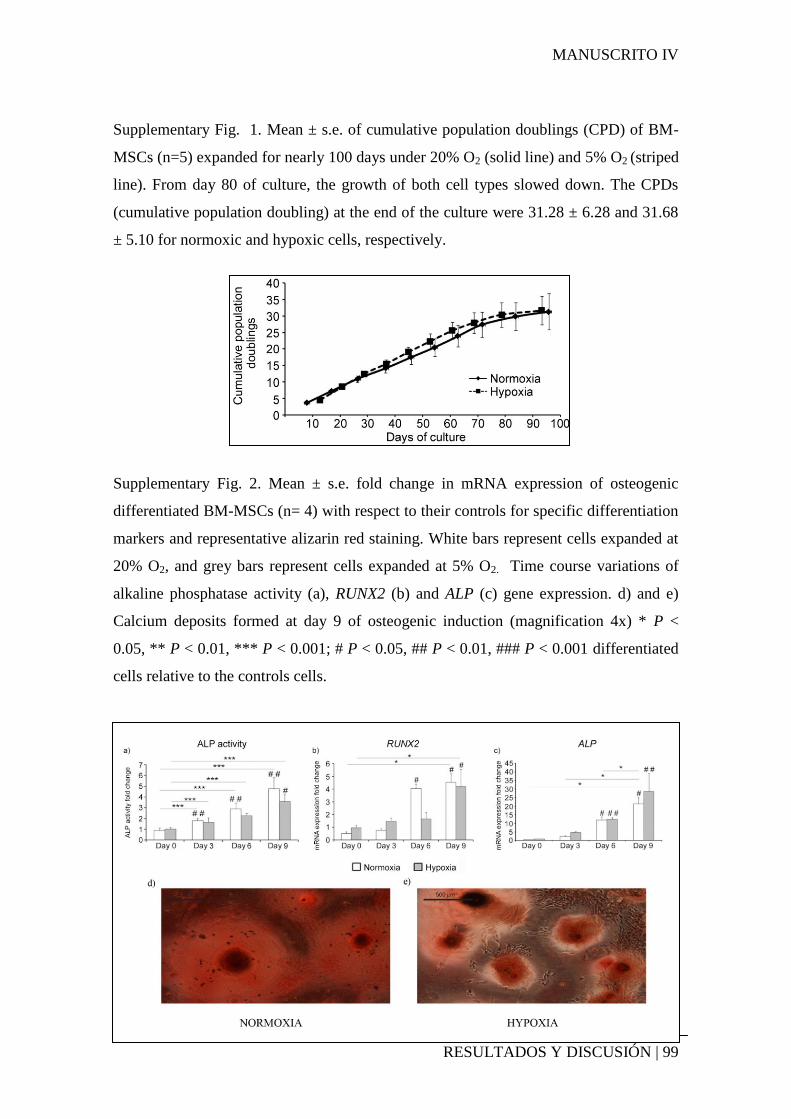
MANUSCRITO IV
RESULTADOS Y DISCUSIÓN | 99
Supplementary Fig. 1. Mean ± s.e. of cumulative population doublings (CPD) of BM-
MSCs (n=5) expanded for nearly 100 days under 20% O2 (solid line) and 5% O2 (striped
line). From day 80 of culture, the growth of both cell types slowed down. The CPDs
(cumulative population doubling) at the end of the culture were 31.28 ± 6.28 and 31.68
± 5.10 for normoxic and hypoxic cells, respectively.
Supplementary Fig. 2. Mean ± s.e. fold change in mRNA expression of osteogenic
differentiated BM-MSCs (n= 4) with respect to their controls for specific differentiation
markers and representative alizarin red staining. White bars represent cells expanded at
20% O2, and grey bars represent cells expanded at 5% O2. Time course variations of
alkaline phosphatase activity (a), RUNX2 (b) and ALP (c) gene expression. d) and e)
Calcium deposits formed at day 9 of osteogenic induction (magnification 4x) * P <
0.05, ** P < 0.01, *** P < 0.001; # P < 0.05, ## P < 0.01, ### P < 0.001 differentiated
cells relative to the controls cells.

MANUSCRITO IV
RESULTADOS Y DISCUSIÓN | 100
Supplementary Fig. 3. Mean ± s.e. fold change in mRNA expression of adipogenic
differentiated BM-MSCs (n= 4) with respect to their controls for specific differentiation
markers and representative oil red O staining. White bars represent cells expanded at
20% O2, and grey bars represent cells expanded at 5% O2. Time course variations of oil
red O accumulation (a), PPAR (b) and LPL (c) gene expression. d) and e) Lipid droplet
accumulation inside the cells at day 9 of adipogenic differentiation (magnification 20x).
* P < 0.05; # P < 0.05, ## P < 0.01, ### P < 0.001 differentiated cells relative to the
controls cells.

MANUSCRITO V
RESULTADOS Y DISCUSIÓN | 101
5.5. MANUSCRITO V
Effect of hypoxia on equine mesenchymal stem cells derived from bone
marrow and adipose tissue.
Beatriz Ranera, Ana Rosa Remacha, Samuel Álvarez-Arguedas, Antonio Romero,
Francisco José Vázquez, Pilar Zaragoza, Inmaculada Martín-Burriel, Clementina
Rodellar.

MANUSCRITO V
RESULTADOS Y DISCUSIÓN | 102
Abstract
Background. Mesenchymal stem cells (MSCs) derived from bone marrow (BM-MSCs)
and adipose tissue (AT-MSCs) are being applied to equine cell therapy. The
physiological environment in which MSCs reside is hypoxic and does not resemble the
oxygen level typically used in in vitro culture (20% O2). This work compares the
growth kinetics, viability, cell cycle, phenotype and expression of pluripotency markers
in both equine BM-MSCs and AT-MSCs at 5% and 20% O2.
Results. At the conclusion of culture, fewer BM-MSCs were obtained in hypoxia than
in normoxiaas a result of significantly reduced cell division. Hypoxic AT-MSCs
proliferated less than normoxic AT-MSCs because ofa significantly higher presence of
non-viable cells during culture. Flow cytometry analysis revealed that the
immunophenotypeof both MSCs was maintained in both oxygen conditions. Gene
expression analysis using RT-qPCRshowed that statistically significant differences were
only found for CD49d in BM-MSCs and CD44 in AT-MSCs. Similar gene expression
patterns were observed at both 5% and 20% O2 for the remaining surface markers.
Equine MSCs expressed the embryonic markers NANOG, OCT4 and SOX2 in both
oxygen conditions. Additionally, hypoxic cells tended to display higher expression,
which might indicate that hypoxia retains equine MSCs in an undifferentiated state.
Conclusions.Hypoxia attenuates the proliferative capacity of equine MSCs, but does
not affect the phenotype and seems to keep them more undifferentiated than normoxic
MSCs.
Keywords: hypoxia, horse, AT-MSC, BM-MSC, characterisation.

MANUSCRITO V
RESULTADOS Y DISCUSIÓN | 103
Background
In recent years, mesenchymal stem cells (MSCs) have become increasingly
utilised in regenerative medicine and tissue engineering applications because of their
properties for self-renewal, differentiation and immunoregulation [1].
To study these properties, MSCs must be isolated from their physiological
niches and cultured ex vivo. The micro-environment that cells experience in laboratory
culture is very different from their native settings; therefore, it is possible that the true in
vivo properties of these cells might be modified by artificial culture. One environmental
property that is commonly altered by the change of environment is the percentage of
oxygen. Traditional incubators are supplied with atmospheric air that contains 20%
oxygen (defined as “normoxia”), which is a not physiologically accurate for any kind of
cell. Two common MSC sources are bone marrow and adipose tissue, in which the
oxygen tension ranges from 1%-7% [2] and 2%-8% [3], respectively.
All nucleated cells are able to sense and respond to the availability of O2 [4]. Rat
MSCs modify the expression of molecules involved in cell proliferation and survival
when they are exposed to low oxygen tensions that approximate physiological
conditions [5]. Hypoxia inducible factor 1α (HIF-1α) regulates the expression of many
cell cycle molecules, including p21, anti-apoptotic factors, such as Bcl-2 [6], and pro-
apoptotic proteins, such as p53 [7]. Consequently, rat MSCs exhibit different
proliferation rates when cell expansion under hypoxia and normoxia are compared;
however, some controversy exists regarding whether low oxygen tension enhances [8]
or suppresses proliferation [9]. Finally, oxygen plays an important role in the
differentiation [10] and maintenance of stemness in MSCs [11].
Due to the inability of tendons and articulations to heal properly, MSC-based
therapies have been utilised in horses to treat orthopaedic disorders resulting from
sporting endeavours [12, 13]. Oxygen levels in cartilage are among the lowest
throughout the body [14], and hypoxia appears to be essential for tendon repair [15]. In
addition, hypoxic preconditioning improves the therapeutic potential of human MSCs
[16]. Taken together, these facts suggest that horse MSCs cultured in hypoxia might
MANUSCRITO V
RESULTADOS Y DISCUSIÓN | 104
constitute a more relevant model for the treatment of injuries in low-oxygen tissues than
those currently utilised, which are usually cultured in 20% O2.
To improve the methodology for equine stem cell therapy, it is necessary to
examine the characteristics and to compare the behaviour of MSCs in normoxic and
hypoxic conditions. Specifically, this study contrasts the proliferation kinetics, viability,
cell cycle progression, phenotype and stemness of MSCs derived from bone marrow
(BM-MSCs) and adipose tissue (AT-MSCs) cultured in 5% and 20% O2.
Results
Proliferation kinetics
The growth kinetics of BM- and AT-MSCs expanded in normoxia and hypoxia
were monitored for 7 days.
Cells derived from bone marrow showed a similar lag phase (Figure 1a) from
day 1 to 3 in both hypoxic and normoxic conditions. The logarithmic phase began on
day 3 for BM-MSCs under both oxygen conditions, but lasted until day 5 in hypoxia
and day 6 in normoxia. On day 5, hypoxic BM-MSCs reached a plateau in their growth
curve, while normoxic BM-MSCs continued in the log phase for one additional day. On
day 6, the proliferation of normoxic BM-MSCs slowed. Consequently, a higher final
number of BM-MSCs were present in 20% O2 culture.
Similar lag phase behaviour was observed in AT-MSCs exposed to both oxygen
atmospheres (Figure 1b); however, unlike BM-MSCs, this growth continued until day 4.
After day 4, normoxic and hypoxic AT-MSCs began the logarithmic phase;
nevertheless, normoxic AT-MSCs grew faster than hypoxic AT-MSCs, yielding
significant differences in cell number on day 5. AT-MSCs exposed to 5% O2 reached a
plateau on day 6, while AT-MSCs in 20% O2 culture continued in the log phase until the
conclusion of the culture period, resulting in a significantly higher number of normoxic
AT-MSCs on day 7.

MANUSCRITO V
RESULTADOS Y DISCUSIÓN | 105
Cell cycle
To examine potential cell cycle differences resulting from differing oxygen
conditions, cellular DNA content was evaluated in both oxygen cultures for the same
time periods used in the proliferation study.
Cell cycle data obtained for BM-MSC cultures showed that normoxic cells were
more active than hypoxic cells between day 2 and the conclusion of the assay. Cultures
that were exposed to 5% O2 had higher proportions of cells in G0/G1 phase; these
differences were statistically significant on days 2, 3 and 4 (Table 1a). In support of this
finding, a significantly lower percentage of hypoxic BM-MSCs were observed in S
phase on days 2 and 4 and in G2/M phases on day 2. However, when hypoxic and
normoxic AT-MSCs were compared, any significant differences were observed over the
course of the culture period (Table 1b).
In comparing normoxic cultures of MSCs from both bone marrow and adipose
tissue on days 2 and 3, BM-MSCs displayed a significantly higher percentage of cells in
G0/G1 and reduced frequency of cells in S phase compared with AT-MSCs. The
proportions of cells in each phase of the cell cycle were comparable throughout the
remaining time course (Table 1c).
In contrast to normoxic MSCs, hypoxic cells displayed greater differences in cell
cycle progression, as shown in Table 1d. On the first day of culture, there were
significantly higher percentages of AT-MSCs in G0/G1 phase and of BM-MSCs in S
phase. However, in the days following, up until day 5, this behaviour was inverted:
significantly more BM-MSC were in G0/G1, whereas AT-MSCs were more active in
cell division and more abundant in S phase on days 2, 4 and 5 and in G2/M phase on
days 2 and 3.
Cell viability
Oxygen tension can influence the viability of cell cultures. Possible changes in
apoptosis and viability were monitored during the 7-day culture using Annexin V
MANUSCRITO V
RESULTADOS Y DISCUSIÓN | 106
(AnV) to detect the levels of phosphatidylserine in the outer membrane and propidium
iodide (PI) to evaluate the integrity of cellular membranes.
With regard to viability, BM-MSCs showed similar proportions of apoptotic
(AnV+ PI
-) and non-viable cells (PI
+) during throughout the full 7 days of culture for
cells expanded in either oxygen tension (Table 2a). Conversely, AT-MSCs exposed to
both oxygen conditions contained the lowest percentage of viable cells on the first day
of culture.
Viability increased thereafter and eventually reached the levels observed in BM-
MSCs at day 5. Statistically significant differences in viability between hypoxic and
normoxic AT-MSCs were detected on days 1, 2, 3 and 5 (Table 2b). These differences
were due to a high frequency of PI+ cells in hypoxic conditions, as the proportion of
AnV+ PI
- cells was similar for both conditions and never higher than 10% of the total
population. Hypoxic AT-MSCs displayed a significantly higher abundance of PI+ cells
than normoxic AT-MSCs on days 3, 4, 5 and 7.
When normoxic MSCs cultures from bone marrow and adipose tissue were
compared (Table 2c), the proportions of viable BM-MSCs on days 1, 2 and 3 were
significantly higher than those of AT-MSCs. However, this trend reversed on day 4, and
on day 5, the proportion of viable cells was significantly higher in AT-MSCs than in
BM-MSCs. The differences in viability between both cell types observed at early stages
of culture resulted from a significantly higher proportion of PI+ AT-MSCs on days 1
and 2; in contrast, a significantly higher percentages of apoptotic cells were detected in
BM-MSCs relative to AT-MSC cultures on days 4, 5 and 6.
In comparing expanded BM-MSCs and AT-MSCs in 5% O2 culture, the
behaviour displayed by normoxic equivalents was maintained for the first few days of
culture (i.e., significantly higher percentages of PI+ and lower percentages of AnV
-PI
-
cells were detected in AT-MSC cultures). However, unlike normoxic cells, these results
were consistent throughout the entire culture period and were significantly different
between days 1 and 5. In addition, the proportion of AnV+PI
- was similar for both cell
types, which contrasts with the results of comparisons between normoxic MSCs (Table
2d).

MANUSCRITO V
RESULTADOS Y DISCUSIÓN | 107
Immunophenotype and gene expression patterns of surface markers
The immunophenotype for the surface markers CD29 and CD90 was analysed
using flow cytometry, which revealed that the cells displayed the same expression
patterns independently of the MSC source or oxygen content (Table 3). In all cases, the
percentage of positive cells was greater than 93%.
In addition to flow cytometry, real time quantitative PCR (RT-qPCR) was
performed to assess the expression of CD29 and CD90, as well as 8 additional surface
antigens (Figure 2). Few significant differences in gene expression were found between
cells from the same origin that were expanded in different oxygen conditions. The
expression of the CD49d gene was significantly higher in normoxic BM-MSCs than in
their hypoxic counterparts. In AT-MSCs, CD44 expression was significantly higher in
normoxia.
Further differences in gene expression were observed when cultures from
different sources exposed to the same oxygen tension were compared. In general, there
was a trend of higher gene expression for all surface markers analysed in AT-MSCs,
with the exception of CD49d in normoxic conditions and CD106 in both hypoxia and
normoxia. Normoxic AT-MSCs cells displayed significantly higher expression of
CD44, CD90 and CD105 than normoxic BM-MSCs. Hypoxic AT-MSCs also showed
significantly higher expression of CD44, CD29, CD34, CD90 and CD146 than hypoxic
BM-MSCs. Similar gene expression patterns of the surface antigens CD73 and CD166
were detected in the four conditions (two types of cells grown under two oxygen
treatments). Although the level of CD106 mRNA was very low in hypoxic AT-MSCs,
any significant differences existed between the two tissue sources and oxygen
conditions.
Pluripotency markers
The expression of pluripotency markers was measured in both normoxic and
hypoxic cells using RT-qPCR.
Transcripts of the embryonic stem cell makers OCT4, NANOG and SOX2 were
detected in BM-MSCs and AT-MSCs expanded in both oxygen conditions (Figure 3a,

MANUSCRITO V
RESULTADOS Y DISCUSIÓN | 108
3b and 3c). The mRNA levels were consistently higher in MSCs derived from adipose
tissue, with statistically significant differences for the OCT4 gene in hypoxic BM-MSCs
and AT-MSCs, and for the NANOG gene in normoxic BM-MSCs and AT-MSCs.
MSCs exposed to 5% O2 expressed higher levels of the three genes than MSCs
exposed to 20% O2.
Discussion
In the equine veterinary field, orthopaedic injuries are a major cause of
retirement of athletic horses [17]. As a result, it is not surprising that equine
regenerative medicine is primarily focused on the treatment of musculoskeletal defects.
The present cell therapy studies were carried out with MSCs [12, 13, 18] and non-adult
stem cells [19-21]. To better understand the mechanisms of action of MSCs in vivo, a
large number of studies to characterise equine MSCs have been reported over the last
five years [22-26]. However, because the overall objective of regenerative treatments is
the use of MSCs in live horses, it is important to determine all of the properties of
MSCs in an oxygen environment that closely emulates the original physiological niche
from which the cells derive. To our knowledge, this constitutes the first study to
perform an analysis of the influence of oxygen tension on proliferation, viability,
stemness and marker expression in equine MSCs.
The effects of hypoxia on MSC proliferation have been studied specifically in
humans and mice. Enhancements in cell growth following exposure to hypoxia have
been described [10, 11, 27]. However, there is no unanimous consent that this is the
case, as Feher et al. (2010) reported no difference in the growth of normoxic and
hypoxic cells, and Volker et al. (2010) reported similar numbers of cells for both
oxygen conditions at the conclusion of the culture period. In addition, Holzwarth et al.
(2010), Zeng et al. (2011) and Wang et al. (2005) reported that low oxygen tension
inhibited the proliferation of MSCs. Similar results have been reported to occur in dogs,
in which MSCs derived from bone marrow and adipose tissue exposed to atmospheric
O2 showed more proliferative capacity than those expanded from passage 1 to passage 3
under hypoxic conditions (1% or 5% O2) [28]. In agreement with these findings, our
results describing the proliferation of equine cells as a function of oxygen tension

MANUSCRITO V
RESULTADOS Y DISCUSIÓN | 109
showed that the growth of AT-MSCs was significantly higher at atmospheric oxygen
tension, while BM-MSCs underwent also more proliferation in 20% O2.
Differences in cell growth between cultures expanded under different oxygen
conditions could result from cell cycle changes or alterations of cell viability. Human
MSC populations derived from umbilical cord and bone marrow accumulate cells in
G0/G1 phase under low oxygen tension [9, 29]. Similar to these experiments, we found
that hypoxic BM-MSCs displayed a higher percentage of cells in G0/G1 phases than
normoxic BM-MSCs throughout the entire culture period. Moreover, the significantly
higher proportion of normoxic BM-MSCs involved in the active stages of cell division
(S or G2/M) during the median days of culture led to a higher number of cells at the
conclusion of the culture period. Cellular arrest in G0/G1 phase in hypoxic BM-MSCs
might be caused by up-regulation of cyclin-dependent kinase inhibitors that control the
cell cycle checkpoint [30-32]
In contrast to BM-MSCs, differences observed in the proliferation of different
AT-MSC cultures were not due to cell cycle variations, but to variations in cell
viability. Rat MSCs undergo a reduction in cell viability when permanently exposed to
hypoxia [33]. Similar results were obtained in our work in that the proportions of viable
AT-MSCs in hypoxic cultures were always lower than those in normoxic cultures.
Reduced viability in hypoxic conditions reflects insufficient adaptation of AT-MSCs at
5% O2, as higher percentages of non-viable cells were found in hypoxic conditions
relative to populations at 20% O2. No detectable changes in apoptosis have been
previously described for hypoxic MSCs [34, 35]; our data describing the proportion of
AnV+PI
- cells corroborates these reports because statistically insignificant differences
existed between both MSC types at different oxygen tensions.
In our experiments, equine BM-MSCs and AT-MSCs exhibited different
proliferative capacities under each oxygen condition; these differences resulted from
changes in the cell cycle profiles for BM-MSCs (Table 1a) and in the viability of AT-
MSCs (Table 2b).
Moreover, AT-MSCs under either oxygen tension adapted more poorly to the
culture environment following trypsinisation than cells derived from bone marrow, as

MANUSCRITO V
RESULTADOS Y DISCUSIÓN | 110
shown by a significantly higher proportion of PI+ AT-MSCs at days 1 and 2 for both 5%
and 20% O2. This is reflected in the increased lag phase displayed by AT-MSCs.
However, AT-MSCs also showed a significantly increased proportion of cells
undergoing cell division during the first days of culture, which indicates that viable cells
in culture have higher proliferative capacities than BM-MSCs. The increase in cell
division of viable AT-MSCs might compensate for cell death in the population because
the final number of cells obtained at the end of the experiment was higher in AT-MSC
cultures than in BM-MSC cultures. This result indicates a higher proliferative ability for
AT-MSCs than BM-MSCs, which is in agreement with previous reports using horses
[26] and other species [28]. In a previous study, we described the more rapid decrease
of apoptosis in AT-MSCs compared with BM-MSCs in cultures at 20% O2 using a
limited number of animals (n=2) [26]. The current study confirms this finding because
the only detectable significant differences in apoptotic cell death existed between
normoxic BM-MSCs and AT-MSCs.
Flow cytometric immunophenotype analysis of horse MSCs revealed that the
surface antigen CD90 was detectable in all MSC types [36-39]. In addition, cross-
reactivity with human antibodies has been demonstrated for the CD29 antigen in a
previous report from our group and also in other studies [40, 41]. Because in other
species hypoxia does not alter the immunophenotype of MSCs with regard to CD29
[29] and CD90 [9, 27, 42], we attempted to characterise this phenotype in equine MSCs
and to analyse the presence of these molecules in both BM-MSCs and AT-MSCs in
hypoxia and normoxia. According to the literature, MSCs displayed the same
immunophenotype for CD29 and CD90 independently of the cell source and oxygen
tension.
The lack of immunoreactivity of commercial antibodies with equine MSC
antigens remains a challenge in determining the immunophenotype of these cells by
flow cytometry. As a supplement to this technique, RT-qPCR has been used to establish
the expression profiles of various markers in equine MSCs [37, 40]. Similar gene
expression patterns were demonstrated in AT-MSCs when they were compared to BM-
MSCs in their respective oxygen conditions. AT-MSCs at both oxygen tensions
expressed higher levels of CD29, CD44, CD90, CD146 and CD34 transcripts respect to
BM-MSCs; in contrast, only normoxic AT-MSCs expressed less CD49d compared to

MANUSCRITO V
RESULTADOS Y DISCUSIÓN | 111
normoxic BM-MSCs. These results are in agreement with our previous report [41]. The
differences in CD105 expression, with respect to our previous work, might be due to
individual differences because different animals were used in the present study.
Hypoxia seemed to significantly modify mRNA levels of CD49d in BM-MSCs and
CD44 in AT-MSCs, which is in agreement with other studies that have described
different expression profiles for CD49d [18] and CD44 [43] in hypoxia. The remaining
surface markers analysed in this study showed no difference in gene expression as a
function of oxygen tension.
The expression of specific markers characteristic of embryonic stem cells have
been described before for equine BM-MSCs [44] and AT-MSCs [38]. However, to our
knowledge, this is the first work that compares the gene expression of the pluripotency
markers OCT4, NANOG and SOX2 in equine AT-MSCs and BM-MSCs that were
exposed to different oxygen concentrations. In our experimental conditions, equine
MSCs expressed all three pluripotency markers. In general, higher expression of each
marker was detected in AT-MSCs and was statistically significant for OCT4 in hypoxia
and for NANOG in normoxia. The consistently higher expression of all genes in hypoxia
might reflect the enhanced stemness of hypoxic equine MSCs [45]. These results
corroborate other studies that have described up-regulation of pluripotency-associated
markers of hypoxic MSCs [11, 46, 47], which might suggest that low oxygen tension
helps maintain the undifferentiated stem cell phenotype.
Conclusions
Oxygen plays a deterministic role in equine MSC cultures. It is able to modify
their proliferative capacity via cell cycle modification in BM-MSCs and alterations in
cell viability in AT-MSCs. Moreover, the immunophenotype of both MSC types is not
altered by hypoxia. However, hypoxia appears to be an important factor in the
maintenance or acquisition of stemness in equine MSCs.

MANUSCRITO V
RESULTADOS Y DISCUSIÓN | 112
Material and methods
Animals
Biological samples were obtained from a total of 12 castrated male horses aged 4
to 7 years. All procedures were carried out under Project Licence PI36/07, which was
approved by the Ethic Committee for Animal Experiments from the University of
Zaragoza. The care and use of animals were performed in accordance with the Spanish
Policy for Animal Protection RD1201/05, which meets the European Union Directive
86/609 on the protection of animals for experimental and other scientific purposes.
MSC isolation, culture and expansion
Samples were collected as previously described [26, 41]. Briefly, bone marrow
aspirates were harvested from the sternum of six horses. The mononuclear fractions
were enriched with MSCs, which were isolated in a centrifugation gradient using
Lymphoprep (Atom, Barcelona, Spain). Isolated MSCs were rinsed twice with PBS and
plated at a concentration of 106 cells/cm
2 in growth medium, which consisted of DMEM
Low Glucose (Sigma-Aldrich, St. Louis, Missouri, USA) supplemented with foetal
bovine serum, L-glutamine (Sigma-Aldrich, St. Louis, Missouri, USA) and
penicillin/streptomycin (Sigma-Aldrich, St. Louis, Missouri, USA).
Subcutaneous adipose tissues were collected from the dorsal gluteal muscle
below the tail from six horses. The stromal vascular fractions (SVFs) were isolated by
digestion with 0.01% collagenase (Type I, Sigma-Aldrich, St. Louis, Missouri, USA)
for 30 min at 37°C with continuous shaking. The cells were rinsed twice with PBS and
plated in growth medium at a concentration of 105 cells/cm
2.
Both MSC types were expanded for 4 weeks at 37ºC in either normoxic (5%
CO2 and 20% O2) or hypoxic (5% CO2 and 5% O2) conditions. Cell growth kinetics,
immunophenotype, viability and cell cycle analyses were carried out using newly
passaged cells fresh cells. Aliquots of 106
cells were preserved at -150ºC at the final
passage, as described above, for further gene expression studies.

MANUSCRITO V
RESULTADOS Y DISCUSIÓN | 113
Cell growth kinetics
Cells from bone marrow and adipose tissue were seeded in 6-well plates in
triplicate at a density of 5,000 cells/cm2. BM-MSCs (n=6) and AT-MSCs (n=6) were
exposed to 20% O2 or 5% O2 atmospheres for 7 days. Every day, the cells were
collected using 0.25% trypsin/EDTA, and an aliquot of 50 µL of each culture was
counted in a haemocytometer Z2 Coulter particle count and size analyser to obtain
growth curves.
Analysis of cellular DNA content
Half of the MSCs harvested from the proliferation assay were fixed in 70% ice-
cold ethanol and treated with 0.02 mg/mL RNAse and EDTA. DNA was stained with
0.1 mg/mL propidium iodide (Sigma-Aldrich, St. Louis, Missouri, USA). Cells were
incubated in the dark for 30 min, and samples were analysed on a FACSARRAY (BD
Biosciences, East Rutherford, New Jersey, USA) cytometer using the MODIFIT 3.0
software.
Viability assay
The remaining fraction of MSCs harvested in the proliferation assay was used to
determine MSC viability. Apoptosis was measured by the detection of
phosphatidylserine on the outer leaflet of the plasma membrane with the fluorescent dye
Annexin V-FITC (Immunostep, Salamanca, Spain) in accordance with the
manufacturer’s instructions. Briefly, cells were rinsed with ice-cold PBS and then
resuspended in 200 µL of binding buffer. Subsequently, 10 µL of Annexin V stock
solution was added to cells and incubated for 30 min at 4ºC. Non-viable cells were
identified by incubation with 5 µL of propidium iodide, a dye that penetrates into the
cell nucleus when the plasma and nuclear cell membranes are damaged. PI-stained cells
were immediately analysed in a FACSARIA cytometer (BD Biosciences, East
Rutherford, New Jersey, USA) using FACSDIVA 5.0.1 software.

MANUSCRITO V
RESULTADOS Y DISCUSIÓN | 114
Immunophenotyping
To determine the immunophenotype of BM-MSCs and AT-MSCs after hypoxic
and normoxic culture, the expression of the MSC surface markers CD29 (Integrin β1)
and CD90 (Thy-1) was assessed by flow cytometry as previously described [41] using
mouse anti-human monoclonal antibodies CD29-FITC (Caltag Laboratories, Little
Balmer, Buckingham, UK) and CD90-PE (BD Pharmingen, San Diego, California,
USA.). Negative control staining was performed using a FITC-conjugated mouse IgG1
isotype and a PE-conjugated mouse isotype. The immunophenotype was determined
with the cytometer and software described in section 5.5.
Gene expression analysis
The expression of 10 genes encoding cell surface molecules, including CD29
and CD90, was determined by real-time quantitative PCR. Additional antigens
examined were CD34, CD44 (H-CAM), CD49d (α4 integrin), CD73 (ecto-5’-nuclease),
CD105 (endoglin), CD106 (VCAM 1), CD146 (MCAM) and CD166 (ALCAM). The
gene expression levels of the pluripotency markers OCT4, SOX2 and NANOG were also
analysed using the same technique.
Total RNA was extracted using the RNA spin mini (GE Healthcare Lifesciences,
Little Chalfont, UK) and DNAse turbo (Ambion, Foster City, California, USA.) kits;
subsequently, the Superscript kit (Invitrogen, Carlsbad, CA, USA ) was used for reverse
transcription of 1.5 µg of total RNA into complementary DNA. All kits were used in
accordance with the manufacturer’s instructions.
Table 3 shows the names of the analysed genes, GenBank accession numbers for
equine mRNA sequences, forward and reverse primer sequences and amplicon sizes.
Amplifications were performed in triplicate using the Fast SYBR Green Master Mix
reagent (Applied Biosystems, Foster City, California, USA) and the StepOne™ Real
Time System (Applied Biosystems, Foster City, California, USA). The levels of gene
expression were determined using the comparative Ct method. A normalisation factor
was calculated as the geometric mean of the quantity of two housekeeping genes
(GAPDH and B2M) and used to normalise the expression of each gene.
MANUSCRITO V
RESULTADOS Y DISCUSIÓN | 115
Statistical analyses
The software SPSS 19.0 (Armonk, Nueva York, USA) was used to perform
statistical analyses. Data obtained from flow cytometry and RT-qPCR were analysed for
normality with the Shapiro-Wilk test. Differences in gene expression and reactivity
levels in BM- and AT-MSCs expanded under hypoxia and normoxia conditions were
determined using unpaired non-parametric Mann–Whitney tests. Differences in
proliferation, viability and cell cycle were evaluated with Student’s t-test. For both tests,
P < 0.05 was considered statistically significant.
Abbreviations
Mesenchymal stem cell: MSC
Bone marrow-derived mesenchymal stem cell: BM-MSC
Adipose tissue-derived mesenchymal stem cell: AT-MSC
Annexin V: AnV
Propidium iodide: PI
Apoptotic cells: AnV+PI
-
Non-viable cells: PI+
Viable cells: AnV-PI
-
Real time quantitative PCR: RT-qPCR
Competing interests
The authors declare that they have no competing interests.
Authors’ contributions
BR carried out the expansion of the cells, proliferation assays, gene expression
analyses, statistical analysis and drafted the manuscript. ARR participated in the
expansion of the cells and proliferation assays. SAA participated in the gene expression
analyses. AR performed the sample collections from the horses. FJV participated in the
sample collections from the horses. PZ helped to draft the manuscript. IMB conceived

MANUSCRITO V
RESULTADOS Y DISCUSIÓN | 116
the study, participated in its design and helped to draft the manuscript. CR conceived
the study, participated in its design and helped to draft the manuscript. All authors read
and approved the final manuscript.
Acknowledgements
We thank Javier Godino from the Cell Separation Service of the Instituto
Aragonés de Ciencias de la Salud (I+CS) for his technical assistance with the
immunophenotyping experiments, cell cycle determination and viability assays. This
work was performed as part of the AGL2008- 02428/GAN (MICINN/FEDER) and
PAMER Pipamer 09/019 projects and was partially financed by the Gobierno de
Aragón (Grupo de Excelencia LAGENBIO) and Instituto Aragonés de Ciencias de la
Salud (I+CS). B. Ranera was supported by a doctoral grant from the DGA.
References
1. Koch TG, Berg LC, Betts DH: Current and future regenerative medicine -
principles, concepts, and therapeutic use of stem cell therapy and tissue
engineering in equine medicine. Can Vet J 2009, 50(2):155-165.
2. Harrison JS, Rameshwar P, Chang V, Bandari P: Oxygen saturation in the
bone marrow of healthy volunteers. Blood 2002, 99(1):394.
3. Pasarica M, Sereda OR, Redman LM, Albarado DC, Hymel DT, Roan LE, Rood
JC, Burk DH, Smith SR: Reduced adipose tissue oxygenation in human
obesity: evidence for rarefaction, macrophage chemotaxis, and
inflammation without an angiogenic response. Diabetes 2009, 58(3):718-725.
4. Semenza GL: HIF-1, O(2), and the 3 PHDs: how animal cells signal hypoxia
to the nucleus. Cell 2001, 107(1):1-3.
5. Ohnishi S, Yasuda T, Kitamura S, Nagaya N: Effect of hypoxia on gene
expression of bone marrow-derived mesenchymal stem cells and
mononuclear cells. Stem Cells 2007, 25(5):1166-1177.
6. Chacko SM, Ahmed S, Selvendiran K, Kuppusamy ML, Khan M, Kuppusamy
P: Hypoxic preconditioning induces the expression of prosurvival and
proangiogenic markers in mesenchymal stem cells. Am J Physiol Cell Physiol
2010, 299(6):C1562-1570.
7. Zhu W, Chen J, Cong X, Hu S, Chen X: Hypoxia and serum deprivation-
induced apoptosis in mesenchymal stem cells. Stem Cells 2006, 24(2):416-
425.
8. Ren H, Cao Y, Zhao Q, Li J, Zhou C, Liao L, Jia M, Cai H, Han ZC, Yang R et
al: Proliferation and differentiation of bone marrow stromal cells under
hypoxic conditions. Biochem Biophys Res Commun 2006, 347(1):12-21.
9. Holzwarth C, Vaegler M, Gieseke F, Pfister SM, Handgretinger R, Kerst G,
Muller I: Low physiologic oxygen tensions reduce proliferation and

MANUSCRITO V
RESULTADOS Y DISCUSIÓN | 117
differentiation of human multipotent mesenchymal stromal cells. BMC Cell
Biol 2010, 11:11.
10. Lennon DP, Edmison JM, Caplan AI: Cultivation of rat marrow-derived
mesenchymal stem cells in reduced oxygen tension: effects on in vitro and in
vivo osteochondrogenesis. J Cell Physiol 2001, 187(3):345-355.
11. D'Ippolito G, Diabira S, Howard GA, Roos BA, Schiller PC: Low oxygen
tension inhibits osteogenic differentiation and enhances stemness of human
MIAMI cells. Bone 2006, 39(3):513-522.
12. Godwin EE, Young NJ, Dudhia J, Beamish IC, Smith RK: Implantation of
bone marrow-derived mesenchymal stem cells demonstrates improved
outcome in horses with overstrain injury of the superficial digital flexor
tendon. Equine Vet J 2011.
13. Frisbie DD, Kisiday JD, Kawcak CE, Werpy NM, McIlwraith CW: Evaluation
of adipose-derived stromal vascular fraction or bone marrow-derived
mesenchymal stem cells for treatment of osteoarthritis. J Orthop Res 2009,
27(12):1675-1680.
14. Grimshaw MJ, Mason RM: Bovine articular chondrocyte function in vitro
depends upon oxygen tension. Osteoarthritis Cartilage 2000, 8(5):386-392.
15. Zhao J, Zhang P, Qin L, Pan XH: Hypoxia is essential for bone-tendon
junction healing: the molecular biological evidence. Int Orthop 2010,
35(6):925-928.
16. Rosova I, Dao M, Capoccia B, Link D, Nolta JA: Hypoxic preconditioning
results in increased motility and improved therapeutic potential of human
mesenchymal stem cells. Stem Cells 2008, 26(8):2173-2182.
17. Berg L, Koch T, Heerkens T, Bessonov K, Thomsen P, Betts D: Chondrogenic
potential of mesenchymal stromal cells derived from equine bone marrow
and umbilical cord blood. Vet Comp Orthop Traumatol 2009, 22(5):363-370.
18. Schnabel LV, Lynch ME, van der Meulen MC, Yeager AE, Kornatowski MA,
Nixon AJ: Mesenchymal stem cells and insulin-like growth factor-I gene-
enhanced mesenchymal stem cells improve structural aspects of healing in
equine flexor digitorum superficialis tendons. J Orthop Res 2009,
27(10):1392-1398.
19. Carrade DD, Owens SD, Galuppo LD, Vidal MA, Ferraro GL, Librach F,
Buerchler S, Friedman MS, Walker NJ, Borjesson DL: Clinicopathologic
findings following intra-articular injection of autologous and allogeneic
placentally derived equine mesenchymal stem cells in horses. Cytotherapy
2010, 13(4):419-430.
20. Guest DJ, Smith MR, Allen WR: Equine embryonic stem-like cells and
mesenchymal stromal cells have different survival rates and migration
patterns following their injection into damaged superficial digital flexor
tendon. Equine Vet J 2010, 42(7):636-642.
21. Watts AE, Yeager AE, Kopyov OV, Nixon AJ: Fetal derived embryonic-like
stem cells improve healing in a large animal flexor tendonitis model. Stem
Cell Res Ther 2011, 2(1):4.
22. Vidal MA, Kilroy GE, Johnson JR, Lopez MJ, Moore RM, Gimble JM: Cell
growth characteristics and differentiation frequency of adherent equine
bone marrow-derived mesenchymal stromal cells: adipogenic and
osteogenic capacity. Vet Surg 2006, 35(7):601-610.

MANUSCRITO V
RESULTADOS Y DISCUSIÓN | 118
23. Arnhold SJ, Goletz I, Klein H, Stumpf G, Beluche LA, Rohde C, Addicks K,
Litzke LF: Isolation and characterization of bone marrow-derived equine
mesenchymal stem cells. Am J Vet Res 2007, 68(10):1095-1105.
24. Mambelli LI, Santos EJ, Frazao PJ, Chaparro MB, Kerkis A, Zoppa AL, Kerkis
I: Characterization of equine adipose tissue-derived progenitor cells before
and after cryopreservation. Tissue Eng Part C Methods 2009, 15(1):87-94.
25. Toupadakis CA, Wong A, Genetos DC, Cheung WK, Borjesson DL, Ferraro
GL, Galuppo LD, Leach JK, Owens SD, Yellowley CE: Comparison of the
osteogenic potential of equine mesenchymal stem cells from bone marrow,
adipose tissue, umbilical cord blood, and umbilical cord tissue. Am J Vet Res
2010, 71(10):1237-1245.
26. Ranera B, Ordovas L, Lyahyai J, Bernal ML, Fernandes F, Remacha AR,
Romero A, Vazquez FJ, Osta R, Cons C et al: Comparative study of equine
bone marrow and adipose tissue-derived mesenchymal stromal cells. Equine
Vet J 2012.
27. Dos Santos F, Andrade PZ, Boura JS, Abecasis MM, da Silva CL, Cabral JM:
Ex vivo expansion of human mesenchymal stem cells: a more effective cell
proliferation kinetics and metabolism under hypoxia. J Cell Physiol 2010,
223(1):27-35.
28. Chung DJ, Hayashi K, Toupadakis CA, Wong A, Yellowley CE: Osteogenic
proliferation and differentiation of canine bone marrow and adipose tissue
derived mesenchymal stromal cells and the influence of hypoxia. Res Vet Sci
2010.
29. Zeng HL, Zhong Q, Qin YL, Bu QQ, Han XA, Jia HT, Liu HW: Hypoxia-
mimetic agents inhibit proliferation and alter the morphology of human
umbilical cord-derived mesenchymal stem cells. BMC Cell Biol 2011, 12:32.
30. Gardner LB, Li Q, Park MS, Flanagan WM, Semenza GL, Dang CV: Hypoxia
inhibits G1/S transition through regulation of p27 expression. J Biol Chem
2001, 276(11):7919-7926.
31. Iida T, Mine S, Fujimoto H, Suzuki K, Minami Y, Tanaka Y: Hypoxia-
inducible factor-1alpha induces cell cycle arrest of endothelial cells. Genes
Cells 2002, 7(2):143-149.
32. Koshiji M, Kageyama Y, Pete EA, Horikawa I, Barrett JC, Huang LE: HIF-
1alpha induces cell cycle arrest by functionally counteracting Myc. EMBO J
2004, 23(9):1949-1956.
33. Peterson KM, Aly A, Lerman A, Lerman LO, Rodriguez-Porcel M: Improved
survival of mesenchymal stromal cell after hypoxia preconditioning: role of
oxidative stress. Life Sci 2010, 88(1-2):65-73.
34. Volkmer E, Kallukalam BC, Maertz J, Otto S, Drosse I, Polzer H, Bocker W,
Stengele M, Docheva D, Mutschler W et al: Hypoxic preconditioning of
human mesenchymal stem cells overcomes hypoxia-induced inhibition of
osteogenic differentiation. Tissue Eng Part A 2010, 16(1):153-164.
35. Lavrentieva A, Majore I, Kasper C, Hass R: Effects of hypoxic culture
conditions on umbilical cord-derived human mesenchymal stem cells. Cell
Commun Signal 2010, 8:18.
36. Pascucci L, Curina G, Mercati F, Marini C, Dall'aglio C, Paternesi B, Ceccarelli
P: Flow cytometric characterization of culture expanded multipotent
mesenchymal stromal cells (MSCs) from horse adipose tissue: Towards the
definition of minimal stemness criteria. Vet Immunol Immunopathol 2011.

MANUSCRITO V
RESULTADOS Y DISCUSIÓN | 119
37. Braun J, Hack A, Weis-Klemm M, Conrad S, Treml S, Kohler K, Walliser U,
Skutella T, Aicher WK: Evaluation of the osteogenic and chondrogenic
differentiation capacities of equine adipose tissue-derived mesenchymal
stem cells. Am J Vet Res 2010, 71(10):1228-1236.
38. Raabe O, Shell K, Wurtz A, Reich CM, Wenisch S, Arnhold S: Further
insights into the characterization of equine adipose tissue-derived
mesenchymal stem cells. Vet Res Commun 2011, 35(6):355-365.
39. de Mattos Carvalho A, Alves AL, Golim MA, Moroz A, Hussni CA, de Oliveira
PG, Deffune E: Isolation and immunophenotypic characterization of
mesenchymal stem cells derived from equine species adipose tissue. Vet
Immunol Immunopathol 2009, 132(2-4):303-306.
40. Radcliffe CH, Flaminio MJ, Fortier LA: Temporal analysis of equine bone
marrow aspirate during establishment of putative mesenchymal progenitor
cell populations. Stem Cells Dev 2010, 19(2):269-282.
41. Ranera B, Lyahyai J, Romero A, Vazquez FJ, Remacha AR, Bernal ML,
Zaragoza P, Rodellar C, Martin-Burriel I: Immunophenotype and gene
expression profiles of cell surface markers of mesenchymal stem cells
derived from equine bone marrow and adipose tissue. Vet Immunol
Immunopathol 2011.
42. Nekanti U, Dastidar S, Venugopal P, Totey S, Ta M: Increased proliferation
and analysis of differential gene expression in human Wharton's jelly-
derived mesenchymal stromal cells under hypoxia. Int J Biol Sci 2010,
6(5):499-512.
43. Deguchi JO, Yamazaki H, Aikawa E, Aikawa M: Chronic hypoxia activates
the Akt and beta-catenin pathways in human macrophages. Arterioscler
Thromb Vasc Biol 2009, 29(10):1664-1670.
44. Violini S, Ramelli P, Pisani LF, Gorni C, Mariani P: Horse bone marrow
mesenchymal stem cells express embryo stem cell markers and show the
ability for tenogenic differentiation by in vitro exposure to BMP-12. BMC
Cell Biol 2009, 10:29.
45. Ezashi T, Das P, Roberts RM: Low O2 tensions and the prevention of
differentiation of hES cells. Proc Natl Acad Sci U S A 2005, 102(13):4783-
4788.
46. Fehrer C, Brunauer R, Laschober G, Unterluggauer H, Reitinger S, Kloss F,
Gully C, Gassner R, Lepperdinger G: Reduced oxygen tension attenuates
differentiation capacity of human mesenchymal stem cells and prolongs
their lifespan. Aging Cell 2007, 6(6):745-757.
47. Grayson WL, Zhao F, Izadpanah R, Bunnell B, Ma T: Effects of hypoxia on
human mesenchymal stem cell expansion and plasticity in 3D constructs. J
Cell Physiol 2006, 207(2):331-339.

MANUSCRITO V
RESULTADOS Y DISCUSIÓN | 120
Figure legends
Figure 1.Growth kinetic curves of equine MSCs at different oxygen
concentrations.
Growth kinetics of BM-MSCs (n = 6) (A) and AT-MSCs (n = 6) (B). The Y axis
represents the number of cells, and the X axis represents the number of days in culture.
Data are represented as the means ± standard deviation. Black lines correspond to MSCs
exposed to 20% O2, and grey lines to MSCs exposed to 5% O2. (*P < 0.05)
Figure 2.Gene expression of CD29, CD34, CD44, CD49d, CD73, CD90, CD105,
CD106, CD146 and CD166 cell surface markers of equine MSCs.
Relative mRNA expression levels are expressed as the mean ± standard error. White
bars correspond to normoxic BM-MSCs (n = 6), light grey bars with hypoxic BM-
MSCs (n=6), dark grey bars with normoxic AT-MSCs (n = 6) and black bars with
hypoxic AT-MSCs (n = 6). (*P < 0.05)

MANUSCRITO V
RESULTADOS Y DISCUSIÓN | 121
Figure 3.Gene expression of the pluripotency markers in equine MSCs.
Relative mRNA expression levels are expressed as the mean ± standard error for OCT4
(A), NANOG (B) and SOX2 (C) . White bars correspond to MSCs cultured under
normoxia (n = 6), and grey bars correspond to MSCs cultured under hypoxia (n = 6). *P
< 0.05

MANUSCRITO V
RESULTADOS Y DISCUSIÓN | 122
Table legends
Table 1.Analysis of cell cycle in BM-MSCs (n = 6) and AT-MSCs (n = 6) cultured
under hypoxic or normoxic conditions.
The G0/G1,S and G2/M cell cycle phases were analysed for 7 days. Cell cycle data are
represented as the mean ± standard deviation. The “a” and “b” superscripted bold data
are significantly different. (A) Compares normoxic and hypoxic conditions of BM-
MSCs; (B) compares normoxic and hypoxic conditions of AT-MSCs; (C) compares
BM-MSCs and AT-MSCs in normoxic conditions; and (D) compares BM-MSCs and
AT-MSCs in hypoxic conditions.

MANUSCRITO V
RESULTADOS Y DISCUSIÓN | 123
BM
-MS
C
A
T-M
SC
No
rmo
xia
Hyp
oxia
No
rmo
xia
H
ypo
xia
No
rmo
xia
H
ypo
xia
BM
-MS
C
AT
-MS
C
B
M-M
SC
A
T-M
SC
Day 1
G0/G
1
81
.88 ±
15
.37
7
8.6
4 ±
10
.64
84
.33 ±
9.4
8
89
.04 ±
5.9
8
8
1.8
8 ±
15
.37
8
4.3
3 ±
9.4
8
7
8.6
4 ±
10
.64
a
89
.04 ±
5.9
8b
S
12
.51 ±
10
.53
1
4.5
1 ±
7.3
9
9
.86
± 7
.17
4
.99
± 3
.12
12
.51 ±
10
.53
9
.86
± 7
.17
14
.51 ±
7.3
9a
4.9
9 ±
3.1
2b
G2/M
5
.61
± 5
.30
6
.85
± 4
.70
5.8
0 ±
2.4
2
5.7
4 ±
3.1
0
5
.61
± 5
.30
5
.80
± 2
.42
6.8
5 ±
4.7
0
5.7
4 ±
3.1
0
Day 2
G0/G
1
49
.32 ±
4.4
6a
62
.64 ±
5.5
2b
3
9.8
6 ±
3.2
6
41
.33 ±
6.2
3
4
9.3
2 ±
4.4
6a
39
.86 ±
3.2
6b
6
2.6
4 ±
5.5
a 4
1.3
3 ±
6.2
3b
S
33
.93 ±
6.0
5a
24
.51 ±
5.2
9b
3
9.0
7 ±
1.5
0
35
.54 ±
7.6
6
3
3.9
3 ±
6.0
5a
39
.07 ±
1.5
0b
2
4.5
1 ±
5.2
9a
35
.54 ±
7.6
6b
G2/M
1
7.8
9 ±
6.9
9a
12
.85 ±
3
.67
b
2
1.0
7 ±
3
.52
2
3.1
3 ±
2
,20
17
.89 ±
6.9
9
21
.07 ±
3
.52
12
.85 ±
3
.67
a 2
3.1
3 ±
2
,20
b
Day 3
G0/G
1
56
.00 ±
5.8
5a
65
.96 ±
5.8
3b
4
5.3
7 ±
3.8
5
51
.57 ±
5.8
6
5
6.0
0 ±
5.8
5a
45
.37 ±
3.8
5b
6
5.9
6 ±
5.8
3a
51
.57 ±
5.8
6b
S
31
.36 ±
8.2
4
22
.53 ±
5
.18
3
8.3
6 ±
4
.49
3
1.4
2 ±
9
.07
31
.36 ±
8.2
4a
38
.36 ±
4
.49
b
2
2.5
3 ±
5
.18
3
1.4
2 ±
9
.07
G2/M
1
2.9
4 ±
4.4
6
11
.50 ±
3
.31
1
4.6
0 ±
1.0
4
17
.01 ±
6
.58
12
.94 ±
4.4
6
14
.60 ±
1.0
4
1
1.5
0 ±
3
.31
a 1
7.0
1 ±
6
.58
b
Day 4
G0/G
1
56
.30 ±
5.6
5a
74
.13 ±
7.1
1b
5
4.6
7 ±
2.6
4
52
.74 ±
6.5
1
5
6.3
0 ±
5.6
5
54
.67 ±
2.6
4
7
4.1
3 ±
7.1
1a
52
.74 ±
6.5
1b
S
30
.59 ±
10
.05
a
15
.90 ±
6
.12
b
3
0.2
4 ±
1
.30
2
6.4
0 ±
3
.42
30
.59 ±
10
.05
3
0.2
4 ±
1
.30
15
.90 ±
6
.12
a 2
6.4
0 ±
3
.42
b
G2/M
1
3.0
0 ±
5.0
0
9.9
7 ±
4
.26
14
.91 ±
2
.34
2
0.1
9 ±
8
.15
13
.00 ±
5.0
0
14
.91 ±
2
.34
9.9
7 ±
4
.26
2
0.1
9 ±
8
.15
Day 5
G0/G
1
69
.77 ±
11
.77
7
9.7
7 ±
7.2
2
6
5.8
3 ±
5.7
6
62
.63 ±
9.2
5
6
9.7
7 ±
11
.77
6
5.8
3 ±
5.7
6
7
9.7
7 ±
7.2
2a
62
.63 ±
9.2
5b
S
20
.16 ±
13
.11
1
1.1
8 ±
4
.44
2
2.1
8 ±
3
.15
2
3.8
5 ±
5
.48
20
.16 ±
13
.11
2
2.1
8 ±
3
.15
11
.18 ±
4
.44
a 2
3.8
5 ±
5
.48
b
G2/M
1
0.0
7 ±
2.3
3
9.0
6 ±
5
.04
11
.99 ±
2
.75
1
3.5
5 ±
4
.23
10
.07 ±
2.3
3
11
.99 ±
2
.75
9.0
6 ±
5
.04
1
3.5
5 ±
4
.23
Day 6
G0/G
1
75
.51 ±
15
.79
8
3.0
7 ±
6.3
1
7
8.3
6 ±
1.8
9
71
.49 ±
11
.70
75
.51 ±
15
.79
7
8.3
6 ±
1.8
9
8
3.0
7 ±
6.3
1
71
.49 ±
11
.70
S
16
.08 ±
15
.59
8
.42
±
3.0
2
1
3.1
6 ±
1
.80
1
8.4
3 ±
9
.18
16
.08 ±
15
.59
1
3.1
6 ±
1
.80
8.4
2 ±
3
.02
1
8.4
3 ±
9
.18
G2/M
8
.36
± 1
.67
8
.35
±
5.5
2
8
.49
±
1.0
1
10
.35 ±
2.5
3
8
.36
± 1
.67
8
.49
±
1.0
1
8
.35
±
5.5
2
10
.35 ±
2.5
3
Day 7
G0/G
1
81
.71 ±
6.8
3
84
.50 ±
8.3
3
8
5.7
8 ±
1.5
6
77
.16 ±
12
.67
81
.71 ±
6.8
3
85
.78 ±
1.5
6
8
4.5
0 ±
8.3
3
77
.16 ±
12
.67
S
15
.65 ±
16
.21
7
.78
±
4.0
3
6
.73
±
1.3
2
14
.06 ±
9
.66
15
.65 ±
16
.21
6
.73
±
1.3
2
7
.78
±
4.0
3
14
.06 ±
9
.66
G2/M
2
.64
± 2
.01
7
.77
±
4.9
2
7
.50
±
1.2
6
8.7
8 ±
3
.20
2.6
4 ±
2.0
1
7.5
0 ±
1
.26
7.7
7 ±
4
.92
8.7
8 ±
3
.20
1
a)
b
) c)
d
)
a)
b)
c)
d
)
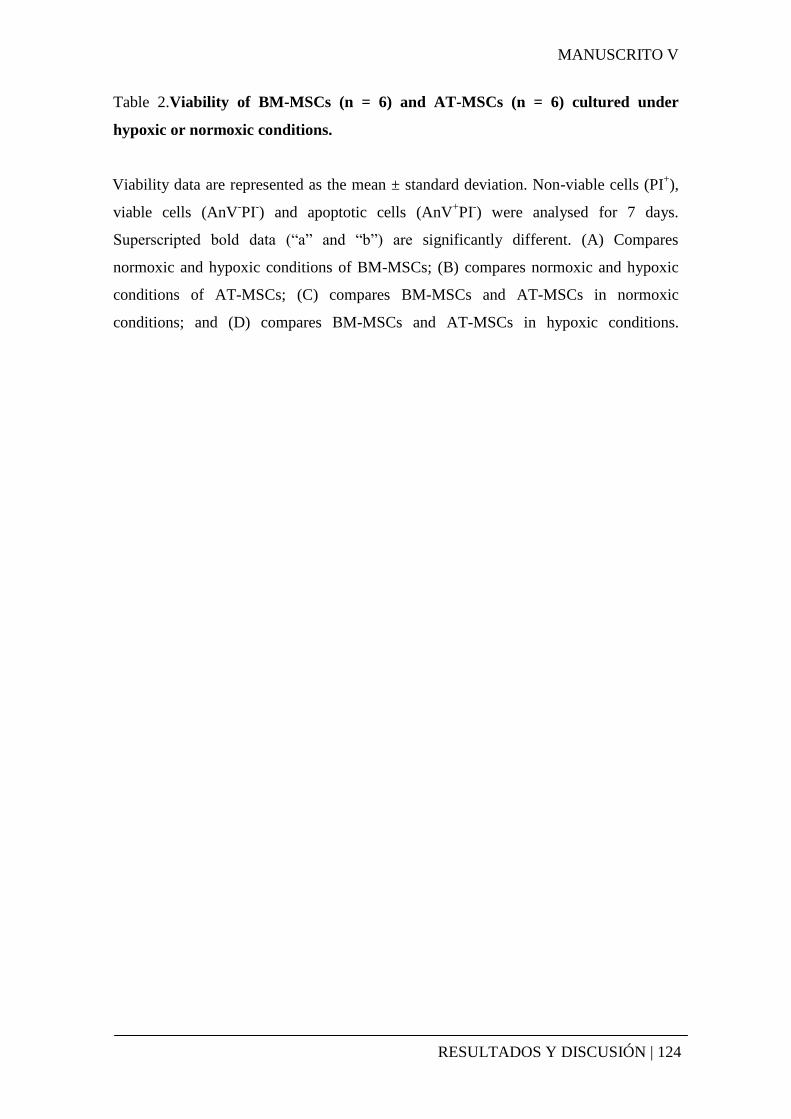
MANUSCRITO V
RESULTADOS Y DISCUSIÓN | 124
Table 2.Viability of BM-MSCs (n = 6) and AT-MSCs (n = 6) cultured under
hypoxic or normoxic conditions.
Viability data are represented as the mean ± standard deviation. Non-viable cells (PI+),
viable cells (AnV-PI
-) and apoptotic cells (AnV
+PI
-) were analysed for 7 days.
Superscripted bold data (“a” and “b”) are significantly different. (A) Compares
normoxic and hypoxic conditions of BM-MSCs; (B) compares normoxic and hypoxic
conditions of AT-MSCs; (C) compares BM-MSCs and AT-MSCs in normoxic
conditions; and (D) compares BM-MSCs and AT-MSCs in hypoxic conditions.

MANUSCRITO V
RESULTADOS Y DISCUSIÓN | 125
BM
-MS
C
A
T-M
SC
Nor
mox
ia
H
ypox
ia
Nor
mox
ia
Hyp
oxia
Nor
mox
ia
Hyp
oxia
BM
-MS
C
AT
-MS
C
B
M-M
SC
A
T-M
SC
Day 1
PI+
13
.64
± 2
,03
12.0
6 ±
3.8
9
46.6
4 ±
26.
38
72.2
4 ±
17.
20
13
.64
± 2
,03a
46.6
4 ±
26.
38b
12
.06
± 3
.89a
72.2
4 ±
17.
20b
AnV
- PI-
81.9
2 ±
2.7
4 81
.39
± 8
.51
47
.86
± 2
3.61
a 21
.79
± 1
2.35
b
81
.92
± 2
.74a
47.8
6 ±
23.
61b
81
.39
± 8
.51a
21.7
9 ±
12.
35b
AnV
+P
I- 4.
44 ±
1.2
7 6.
52 ±
4.9
4
5.60
± 2
.69
6.05
± 6
.04
4.
44 ±
1.2
7 5.
60 ±
2.6
9
6.52
± 4
.94
6.05
± 6
.04
Day 2
PI+
15
,02
± 3
.05
13,9
7 ±
6.3
7
28.0
1 ±
11.
11
52.8
5 ±
25.
16
15
,02
± 3
.05a
28.0
1 ±
11.
11b
13
,97
± 6
.37a
52.8
5 ±
25.
16b
AnV
- PI-
81.9
1 ±
3.6
7 81
.72
± 7
.00
65
.45
± 1
2.05
a 39
.31
± 2
2.23
b
81
.91
± 3
.67a
65.4
5 ±
12.
05b
81
.72
± 7
.00a
39.3
1 ±
22.
23b
AnV
+P
I- 3.
07 ±
0.9
4 4.
53 ±
1.5
2
6.54
± 2
.53
9.31
± 5
.23
3.
07 ±
0.9
4a 6.
54 ±
2.5
3b
4.
53 ±
1.5
2
9.31
± 5
.23
Day 3
PI+
15
.44
± 7
.98
14.0
7 ±
5.0
8
21,2
9 ±
3.9
4a 45
.97
± 1
9.78
b
15
.44
± 7
.98
21,2
9 ±
3.9
4
14.0
7 ±
5.0
8a 45
.97
± 1
9.78
b
AnV
- PI-
77.8
4 ±
3.9
6 75
.04
± 1
1.65
74.2
8 ±
3.1
3a 46
.24
± 1
8.6b
77.8
4 ±
3.9
6a 74
.28
± 3
.13b
75.0
4 ±
11.
65a
46.2
4 ±
18.
61b
AnV
+P
I- 6.
71 ±
2.1
6 10
.86
± 7
.19
4.
43 ±
1.6
2 7.
83 ±
5.2
3
6.71
± 2
.16
4.43
± 1
.62
10
.86
± 7
.19
7.
83 ±
5.2
3
Day 4
PI+
14
.43
± 6
.25
14.6
0 ±
7.4
1
14.6
4 ±
3.6
0a 25
.39
± 1
1.67
b
14
.43
± 6
.25
14.6
4 ±
3.6
0
14.6
0 ±
7.4
1a 25
.39
± 1
1.67
b
AnV
- PI-
76.8
2 ±
5.8
9 77
.11
± 7
.49
80
.98
± 2
.88
68.3
1 ±
11.
32
76
.82
± 5
.89
80.9
8 ±
2.8
8
77.1
1 ±
7.4
9
68.3
1 ±
11.
32
AnV
+P
I- 8.
74 ±
4.0
6 8.
31 ±
3.1
5
4.41
± 2
.40
6.30
± 5
.49
8.
74 ±
4.0
6a 4.
41 ±
2.4
0b
8.
31 ±
3.1
5
6.30
± 5
.49
Day 5
PI+
8.
7 ±
3.27
7.
34 ±
2.6
1
8.29
± 1
.80a
17.8
2 ±
7.7
2b
8.
7 ±
3.27
8.
29 ±
1.8
0
7.34
± 2
.61a
17.8
2 ±
7.7
2b
AnV
- PI-
83.0
3 ±
4.9
1 82
.28
± 8
.29
89
.64
± 1
.54a
77.3
7 ±
6.6
7b
83
.03
± 4
.91a
89.6
4 ±
1.5
4b
82
.28
± 8
.29a
77.3
7 ±
6.6
7b
AnV
+P
I- 8.
28 ±
3.4
9 10
.37
± 7
.60
2.
06 ±
0.7
3 4.
81 ±
4.2
2
8.28
± 3
.49a
2.06
± 0
.73b
10.3
7 ±
7.6
0
4.81
± 4
.22
Day 6
PI+
8.
04 ±
4.3
7 10
.27
± 1
.59
8.
64 ±
1.5
1 14
.14
± 8
,83
8.
04 ±
4.3
7 8.
64 ±
1.5
1
10.2
7 ±
1.5
9
14.1
4 ±
8,8
3
AnV
- PI-
84.7
9 ±
7.3
7 77
.76
± 9
.44
89
.18
± 1
.32
81.4
3 ±
10.
06
84
.79
± 7
.37
89.1
8 ±
1.3
2
77.7
6 ±
9.4
4 81
.43
± 1
0.06
AnV
+P
I- 7.
16 ±
3.4
6 11
.98
± 7
.96
2.
14 ±
0.6
6 4.
42 ±
2.7
1
7.16
± 3
.46a
2.14
± 0
.66b
11.9
8 ±
7.9
6 4.
42 ±
2.7
1
Day 7
PI+
9.
77 ±
5,2
7 10
.95
± 4
.29
8.
05 ±
4.2
8a 15
.69
± 8
.96b
9.77
± 5
,27
8.05
± 4
.28
10
.95
± 4
.29
15.6
9 ±
8.9
6
AnV
- PI-
83.2
9 ±
6.9
1 80
.45
± 5
.98
85
.67
± 7
.91
78.0
5 ±
7.7
7
83.2
9 ±
6.9
1 85
.67
± 7
.91
80
.45
± 5
.98
78.0
5 ±
7.7
7
AnV
+P
I- 6.
92 ±
3.4
0 8.
65 ±
7.2
6
6.14
± 4
.32
6.96
± 1
.16
6.
92 ±
3.4
0 6.
14 ±
4.3
2
8.65
± 7
.26
6.96
± 1
.16
1
a)
b)
c
)
d)

MANUSCRITO V
RESULTADOS Y DISCUSIÓN | 126
Table 3. Immunophenotype of BM-MSCs and AT-MSCs cultured under normoxic
and hypoxic conditions.
CD29 CD90
BM-MSC Normoxia 99.73 ± 0.03 97.40 ± 0.66
BM-MSC Hypoxia 99.41 ± 0.26 98.06 ± 0.60
AT-MSC Normoxia 97.93 ± 0.83 96.52 ± 1.01
AT-MSC Hypoxia 98.75 ± 1.33 93.65 ± 3.92
Data are expressed as the mean ± standard deviation of percentages of MSCs positive
for CD29 and CD90 expression. The expression data were obtained using flow
cytometry.
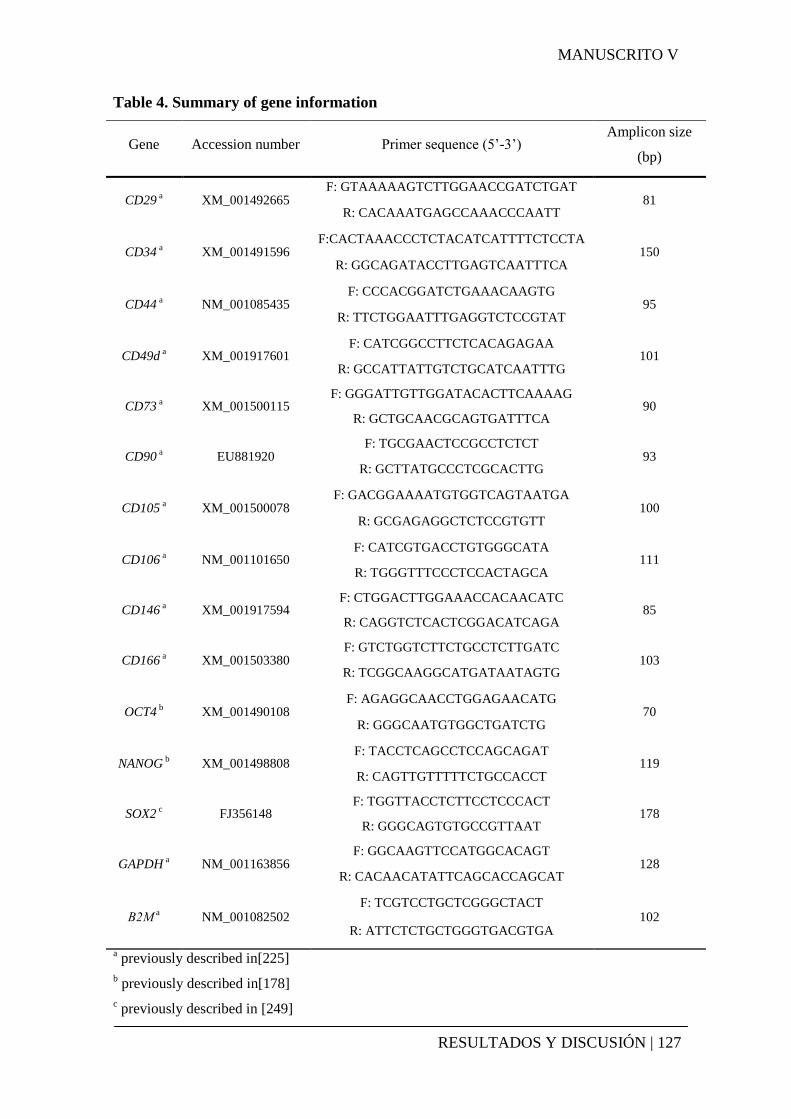
MANUSCRITO V
RESULTADOS Y DISCUSIÓN | 127
Table 4. Summary of gene information
Gene Accession number Primer sequence (5’-3’) Amplicon size
(bp)
CD29 a
XM_001492665 F: GTAAAAAGTCTTGGAACCGATCTGAT
81 R: CACAAATGAGCCAAACCCAATT
CD34 a XM_001491596
F:CACTAAACCCTCTACATCATTTTCTCCTA 150
R: GGCAGATACCTTGAGTCAATTTCA
CD44 a NM_001085435
F: CCCACGGATCTGAAACAAGTG 95
R: TTCTGGAATTTGAGGTCTCCGTAT
CD49d a XM_001917601
F: CATCGGCCTTCTCACAGAGAA 101
R: GCCATTATTGTCTGCATCAATTTG
CD73 a XM_001500115
F: GGGATTGTTGGATACACTTCAAAAG 90
R: GCTGCAACGCAGTGATTTCA
CD90 a EU881920
F: TGCGAACTCCGCCTCTCT 93
R: GCTTATGCCCTCGCACTTG
CD105 a XM_001500078
F: GACGGAAAATGTGGTCAGTAATGA 100
R: GCGAGAGGCTCTCCGTGTT
CD106 a NM_001101650
F: CATCGTGACCTGTGGGCATA 111
R: TGGGTTTCCCTCCACTAGCA
CD146 a XM_001917594
F: CTGGACTTGGAAACCACAACATC 85
R: CAGGTCTCACTCGGACATCAGA
CD166 a XM_001503380
F: GTCTGGTCTTCTGCCTCTTGATC 103
R: TCGGCAAGGCATGATAATAGTG
OCT4 b XM_001490108
F: AGAGGCAACCTGGAGAACATG 70
R: GGGCAATGTGGCTGATCTG
NANOG b
XM_001498808 F: TACCTCAGCCTCCAGCAGAT
119 R: CAGTTGTTTTTCTGCCACCT
SOX2 c FJ356148
F: TGGTTACCTCTTCCTCCCACT 178
R: GGGCAGTGTGCCGTTAAT
GAPDH a NM_001163856
F: GGCAAGTTCCATGGCACAGT 128
R: CACAACATATTCAGCACCAGCAT
Β2M a NM_001082502
F: TCGTCCTGCTCGGGCTACT 102
R: ATTCTCTGCTGGGTGACGTGA
a previously described in[225]
b previously described in[178]
c previously described in [249]

MANUSCRITO V
RESULTADOS Y DISCUSIÓN | 128
Genes analysed, GenBank accession numbers, primer sequences for reverse
transcriptase RT-PCR (F: forward and R: reverse) and amplicon sizes in base pairs (bp).

MANUSCRITO VI
RESULTADOS Y DISCUSIÓN | 129
5.6. MANUSCRITO VI
Characterisation of the equine MSCs used in a preclinical trial to evaluate the
capacity of MSCs for healing induced tendón injuries.

MANUSCRITO VI
RESULTADOS Y DISCUSIÓN | 130
INTRODUCTION
Cell therapy in the orthopaedic field in horses is becoming an important
treatment of injuries related to the musculoskeletal system. During the last decade
several authors have reported the use of mesenchymal stem cells (MSCs) to treat defects
in tendons and joints[94, 105]. Unlike traditional treatments, the results obtained from
cell therapy studies have shown a favourable evolution of the healing of injuries after
the treatment and a reduction of re-injury risk[9].
MSCs are an interesting tool for cell therapy due to their self-renewing ability
and their capacity to differentiate into cellular lineages from connective tissues.
Therefore,it is essential to know the molecular characteristics of the MSCs to
understand how the cells are able to repair the tissues, and then, try to enhance their
properties to achieve better clinical results.
Equine MSCs have been isolated from peripheral blood [164], umbilical cord
blood [166], gingiva and periodontal ligament [167]. However, bone marrow and
adipose tissue derived MSC are the two main cell types use for cell therapy in horses
[108, 109], and also the best characterized in vitro [169, 172]. Equine bone marrow
MSCs (BM-MSCs) and adipose tissue MSCs (AT-MSCs) satisfy the minimal criteria of
definition suggested by the ISTC [31].Both cell types express on their surface the
antigens CD29, CD90, CD44 and CD105 [165, 167, 172, 175, 176] and, despite the lack
of specific antibodies against equine epitopes, the gene expression of CD13, CD49d,
CD73, CD106, CD146 and CD166 has been confirmed [220]. Tri-lineage differentiation
towards osteoblast, adipocyte and chondrocyte has been also demonstrated in equine
BM-MSCs and AT-MSCs [162, 172].
The aim of this work was to characterize and compare the differentiation
potentials of equine BM-MSCs and AT-MSCs used in an experimental design of a pre-
clinical study to treat induced injuries in the superficial digital flexor tendon.
MANUSCRITO VI
RESULTADOS Y DISCUSIÓN | 131
MATERIAL AND METHODS
Animals
Biological samples were obtained from a total of 12 castrated male horses aged 4
to 7 years. All procedures were carried out under Project Licence PI36/07, which was
approved by the Ethic Committee for Animal Experimentation from the University of
Zaragoza. The care and use of animals were performed in accordance with the Spanish
Policy for Animal Protection RD1201/05, which meets the European Union Directive
86/609 on the protection of animals for experimental and other scientific purposes.
MSC isolation, culture and expansion
Samples were collected as previously described [225]. Briefly, bone marrow
aspirates were harvested from the sternum of six horses. The mononuclear fractions
were enriched with MSCs, which were isolated in a centrifugation gradient using
Lymphoprep (Atom, Barcelona, Spain). Isolated MSCs were rinsed twice with PBS and
plated at a density of 106 cells/cm
2 in growth medium, which consisted of DMEM Low
Glucose (Sigma-Aldrich, St. Louis, Missouri, USA) supplemented with 10% foetal
bovine serum, 1% L-glutamine (Sigma-Aldrich, St. Louis, Missouri, USA) and 1%
penicillin/streptomycin (Sigma-Aldrich, St. Louis, Missouri, USA).
Subcutaneous adipose tissues were collected from the dorsal gluteal muscle
below the tail from six horses. The stromal vascular fractions (SVFs) were isolated by
digestion with 0.01% collagenase (Type I, Sigma-Aldrich, St. Louis, Missouri, USA)
for 30 min at 37°C with continuous shaking. The cells were rinsed twice with PBS and
plated in growth medium at a density of 105cells/cm
2.
Both BM-MSCs and AT-MSCs were expanded at 5.000 cells/cm2in growth
medium at 20% O2and 5% CO2.The medium was changed every 3 days until cells
reached approximately 80% confluence. Subsequently, cells were treated with 0.25%
trypsin-EDTA and counted. At passage three the cells were detached, one part of the
cells were injected into the SDFT injury on the horse and the other part were used on
the cell surface phenotyping and differentiation assays.

MANUSCRITO VI
RESULTADOS Y DISCUSIÓN | 132
Cell surface markers
The mesenchymal stem cells markers CD29 (Integrin β1) and CD90 (Thy-1)
were analysed in BM-MSCs and AT-MSCs by flow cytometry as we previously
described [220]. The gene expression of CD29, CD90 and eight more cell surface
antigens was studied by real-time quantitative PCR (RT-qPCR). Additional molecules
examined were CD34, CD44 (H-CAM), CD49d (α4 integrin), CD73 (ecto-5’-nuclease),
CD105 (endoglin), CD106 (VCAM 1), CD146 (MCAM) and CD166 (ALCAM) [220].
Osteogenic differentiation
BM-MSCs and AT-MSCs were plated at 20.000 cells/cm2and cultured during 9
days in differentiation medium containing growth medium supplemented with 10nM
dexamethasone, 10 mM β-glycerophosphate and 100 mMascorbate-2-phosphate (all
from Sigma-Aldrich). On days 0, 3, 6 and 9 the activity of alkaline was measured as
previously described[251],and also the gene expression of the osteogenic markers runt-
related transcription factor 2 (RUNX2), alkaline phosphatase (ALP) and osteopontin
(SPP1)was analyzedby RT-qPCR following our previously described protocols [251].
Osteogenic differentiation was also monitored by alizarin red staining of the calcium
deposits on the same days.
Adipogenic differentiation
Both cell types were seeded at 5,000 cells/cm2and cultured for 14 days in adipogenic
inductive media consisted of growth medium supplemented with1μM dexamethasone,
500 μM IBMX, 200 μM indomethacin and 15% rabbit serum (all from Sigma-Aldrich).
The adipogenesis was studied on days 0, 5, 9 and 14 analysing the gene expression of
the adipogenic markers lipoprotein lipase (LPL) and peroxisome proliferator-activated
receptor gamma (PPARγ) by RT-qPCR and staining the lipid droplets with oil red O as
previously reported [251].
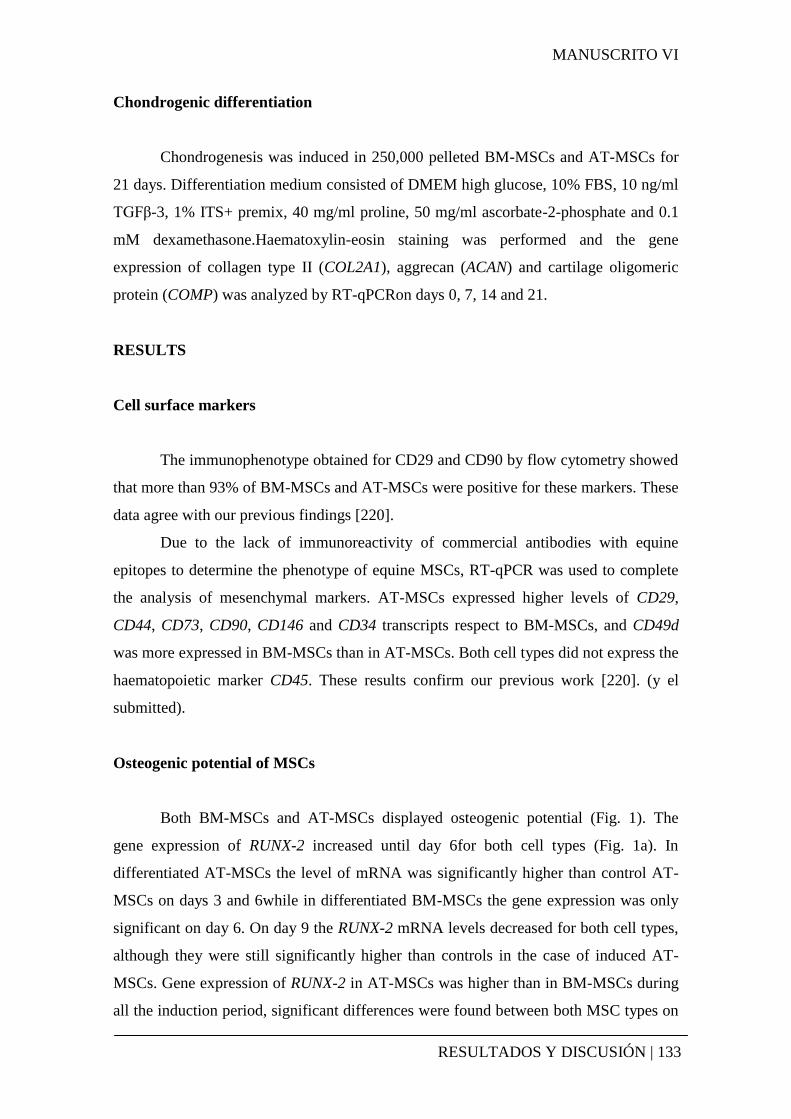
MANUSCRITO VI
RESULTADOS Y DISCUSIÓN | 133
Chondrogenic differentiation
Chondrogenesis was induced in 250,000 pelleted BM-MSCs and AT-MSCs for
21 days. Differentiation medium consisted of DMEM high glucose, 10% FBS, 10 ng/ml
TGFβ-3, 1% ITS+ premix, 40 mg/ml proline, 50 mg/ml ascorbate-2-phosphate and 0.1
mM dexamethasone.Haematoxylin-eosin staining was performed and the gene
expression of collagen type II (COL2A1), aggrecan (ACAN) and cartilage oligomeric
protein (COMP) was analyzed by RT-qPCRon days 0, 7, 14 and 21.
RESULTS
Cell surface markers
The immunophenotype obtained for CD29 and CD90 by flow cytometry showed
that more than 93% of BM-MSCs and AT-MSCs were positive for these markers. These
data agree with our previous findings [220].
Due to the lack of immunoreactivity of commercial antibodies with equine
epitopes to determine the phenotype of equine MSCs, RT-qPCR was used to complete
the analysis of mesenchymal markers. AT-MSCs expressed higher levels of CD29,
CD44, CD73, CD90, CD146 and CD34 transcripts respect to BM-MSCs, and CD49d
was more expressed in BM-MSCs than in AT-MSCs. Both cell types did not express the
haematopoietic marker CD45. These results confirm our previous work [220]. (y el
submitted).
Osteogenic potential of MSCs
Both BM-MSCs and AT-MSCs displayed osteogenic potential (Fig. 1). The
gene expression of RUNX-2 increased until day 6for both cell types (Fig. 1a). In
differentiated AT-MSCs the level of mRNA was significantly higher than control AT-
MSCs on days 3 and 6while in differentiated BM-MSCs the gene expression was only
significant on day 6. On day 9 the RUNX-2 mRNA levels decreased for both cell types,
although they were still significantly higher than controls in the case of induced AT-
MSCs. Gene expression of RUNX-2 in AT-MSCs was higher than in BM-MSCs during
all the induction period, significant differences were found between both MSC types on

MANUSCRITO VI
RESULTADOS Y DISCUSIÓN | 134
day 3.Although the mRNA levels of RUNX-2 were similar in both cell types at day 6
and a marked down-regulation of this gene was observed in BM-MSCs on day 9. The
kinetic of RUNX-2 gene expression confirms the results obtained in previous work of
our group for both cell types [251].
The gene expression of SPP1 increased during the induction period for both cell
types (Fig. 1b). However, the mRNA levels in BM-MSCs were significantly higher than
in AT-MSCs from day 3. The SPP1 up-regulation in BM-MSCs and AT-MSCs in this
study agree with the findings made before [251].
The ALP gene expression and activity were higher in AT-MSCs than in BM-
MSCs (Fig. 1c-d). The transcript level increased significantly on days 3 and 6 in BM-
MSCs, and on days 6 and 9 in AT-MSCs. The up-regulation of ALP in BM-MSCs was
accompanied with a gradual increase of the ALP activity. The statistically significant
differences detected in ALP gene expression between BM-MSCs and AT-MSCs on day
3 would be reflected on the significantly higher ALP activity in AT-MSCs than in BM-
MSCs at the same day. All these results confirm our previous findings [251].
Theo osteogenic differentiation showed by the quantification analyses of the
gene expression of osteogenic markers was corroborated by the alizarin red staining
performed. Osteogenic nodule formation was evident from day 3 in some BM-MSCs,
and it was found in all the cases from day 6. At day 9, the BM-MSC induced cultures
were completely covered by nodules and calcium deposits indicating that the
differentiation was fully accomplished (Fig 1e-h). In AT-MSC induced cultures the
appearance of nodules occurred later than in BM-MSCs, and although the osteogenic
differentiation was evident at day 9, the calcium deposits appeared in a lesser extent
(Fig. 1i-l).
Taken together these results, we have demonstrated that the equine BM-MSCs
and AT-MSCs used for the treatment of tendon lesions display osteogenic potential.
However, the monitoring of osteogenic marker expression showed that BM-MSCs are
able to differentiate faster than AT-MSCs. The early marker RUNX2 was down-
regulated before in BM-MSCs than in AT-MSCs, while the gene expression of the late
marker SPP1 was always higher in BM-MSCs. The staining results and the SPP1 gene
MANUSCRITO VI
RESULTADOS Y DISCUSIÓN | 135
expressionsuggest that BM-MSCs exhibit higher osteogenic potential, which would be
in agreement with other authors [180, 181].
Adipogenic potential
Adipogenic induction in vitro is difficult to achieve in equine MSCs [126].In our
previous report we tested sixteen different adipogenic inductive media to differentiate
BM-MSCs into adipocytes [251] and, finally, the addition of rabbit serum seemed to
favour the adipogenesis in equine MSCs. In the present work, adipogenic differentiation
was achieved for both BM-MSCs and AT-MSCs (Fig. 2). Gene expression of
PPAR increased progressively until day 9 in BM-MSCs, but the gene expression was
only significantly higher than control cells on day 14 (Fig. 2a). On the contrary, induced
AT-MSC cultures showed a significant up-regulation of PPAR on days 5 and 9,
although its expression was decreasing during the inductive culture period. On days 5
and 9 the PPAR gene expression was significantly higher in AT-MSCs than in BM-
MSCs. LPL gene expression (Fig.2b) showed a similar kinetic to PPAR , an up-
regulation was detected on days 5 and 9 in BM-MSCs, and then the gene expression
diminished. In AT-MSCs cultures, the highest mRNA level of LPL was found on day 5,
and it was significantly higher in comparison to the mRNA level in BM-MSCs,
afterwards the gene expression decreased until the end of the time of culture.
The adipogenic compatible changes revealed by RT-qPCR were confirmed by
staining. Oil red O staining (Fig. 2c-j) showed that the most MSCs in culture underwent
morphological changes and abundant formation of small lipid droplets inside of the
cells on day 5. However, during the time course of the adipogenic induction the cells
with lipid droplets inside gradually decreased and more death cells were detected in
culture.
These results agree with other authors who demonstrated the use of rabbit serum
as culture supplement is able to induce adipogenesis in BM-MSCs [162] and in AT-
MSC [172]. In equine MSCs, terminal adipogenesis is difficult to achieve, because after
an initial period of induction the cells detach without completing the
differentiation[172]. The molecular analysis by RT-qPCR of the adipogenic markers

MANUSCRITO VI
RESULTADOS Y DISCUSIÓN | 136
might indicate AT-MSCs display more adipogenic potential than BM-MSCs. The
current adipogenic marker gene expression profiles differs with our previous work
[251]. The differences might be owing to the fact that in the present work we have
analysed a more representative number of samples (n=6), whereas in our previous report
the gene expression kinetics was determined only with one sample.
Chondrogenic potential
Adequate chondrogenic differentiation was only detected in BM-MSCs in our
experimental conditions (Fig. 3). The gene expression of COL2A1, ACAN and COMP
was gradually up-regulated during the induction period in BM-MSCs (Fig 3a-c). In
contrast, weak amplifications of these markers were detected in AT-MSCs, finding
significant differences with respect to BM-MSCs for the gene expression of COL2A1 on
days 7, 14 and 21, and for ACAN and COMP on days 14 and 21.
The differences in the chondrogenic potential of both cell types observed with
the gene expression analysis were confirmed by the histological analysis.
Haematoxylin-eosin staining showed the formation of hyaline extracellular matrix in
BM-MSCs, the cells underwent morphological changes with the appearance of lacunae
formation throughout the pellet sections (Fig. 3d-g). In contrast, AT-MSCs did not seem
to change their morphology, it was not either observed extracellular matrix formation
and picnotic nuclei were detected, which would indicate cellular necrosis (Fig. 3h-k).
Although the chondrogenic differentiation in equine AT-MSCs have been
already demonstrated [172], other works have found higher chondrogenic differentiation
potential in equine BM-MSCs than in AT-MSCs [183]. Our results are in agreement
with these reports, since AT-MSCs were not able to differentiate into chondrocytes and
generate a typical chondrogenic extracellular matrix, showing that AT-MSCs have
limited chondrogenic potential in our experimental conditions.
In summary, equine MSCs used for the treatment of induced tendon lesions meet
the minimum criteria to be considered mesenchymal stem cells. The cells displayed the
mesenchymal stem cell surface markers and did not express the haematopoieticmarker
CD45. However, equine MSCs showed different differentiation potential depending on

MANUSCRITO VI
RESULTADOS Y DISCUSIÓN | 137
the source of isolation. Both cell types were able to differentiate into osteoblast,
although BM-MSCs achieve it faster than AT-MSCs. Adipogenic differentiation ability
was more evident during the first days of induction for both cell types, but AT-MSCs
seemed to display greater adipogenic potential than BM-MSCs at molecular level. In
contrast, chondrogenic differentiation was only accomplished in BM-MSCs, showing
poor chondrogenic potential of AT-MSCs. Further analyses are necessaries to determine
if the differences found in the MSC characteristics between these cell types in vitro
might be reflected in their therapeutic effects in vivo.

MANUSCRITO VI
RESULTADOS Y DISCUSIÓN | 138
FIGURES
Figure 1.Time course ofosteogenic differentiation of equine BM-MSCs and AT-
MSCs. Mean ± standard error (s.e.) inmRNA expression levels of differentiated cells
respect to control cultures is shown for RUNX2 (a), SPP1 (b) and ALP (c). Mean
activity fold change of ALP ± s.e.(d). Black horizontal lines represent gene expression
or ALP activity in control cultures (values set to 1). White bars represent BM-MSCs
and grey bars AT-MSCs. Representative alizarin red staining of BM-MSCs during the
induction period (e-h). Representative alizarin red staining of AT-MSCs during the
induction period(i-l).Statistically significant differences between differentiated cells
relative to the controls cells (* p< 0.05, ** p< 0.01, *** p< 0.001) and between BM-
MSCs and AT-MSCs(# p< 0.05, ## p< 0.01).

MANUSCRITO VI
RESULTADOS Y DISCUSIÓN | 139
Figure 2.Time course of adipogenic differentiation of equine BM-MSCs and AT-
MSCs. The mean ± s.e.of the mRNA expression levels of differentiated cells with
respect to controls is shown for PPAR (a) and LPL (b). Black horizontal line represents
expression levels for control cultures (values set to 1). White bars represent BM-MSCs
and grey bars AT-MSCs. Representative oil red O staining of BM-MSCs (c-f) and AT-
MSCs (g-j) during the induction period. Statistically significant differences
betweendifferentiated and controls cells (* p< 0.05) and between BM-MSCs and AT-
MSCs (# p< 0.05).

MANUSCRITO VI
RESULTADOS Y DISCUSIÓN | 140
Figure 3. Time course of chondrogenic differentiation of equine BM-MSCs and
AT-MSCs.
Mean ± standard error (s.e.) of the mRNA expression levels of differentiated cells with
respect to controls is shown for COL2A1 (a), ACAN (b) andCOMP (c). White bars
represent BM-MSCs and grey bars AT-MSCs. Representative Haematoxylin and eosin
staining of BM-MSCs (d-g) and AT-MSCs (h-k) during the induction period.
Statistically significant differences between BM-MSCs and AT-MSCs (# p< 0.05).
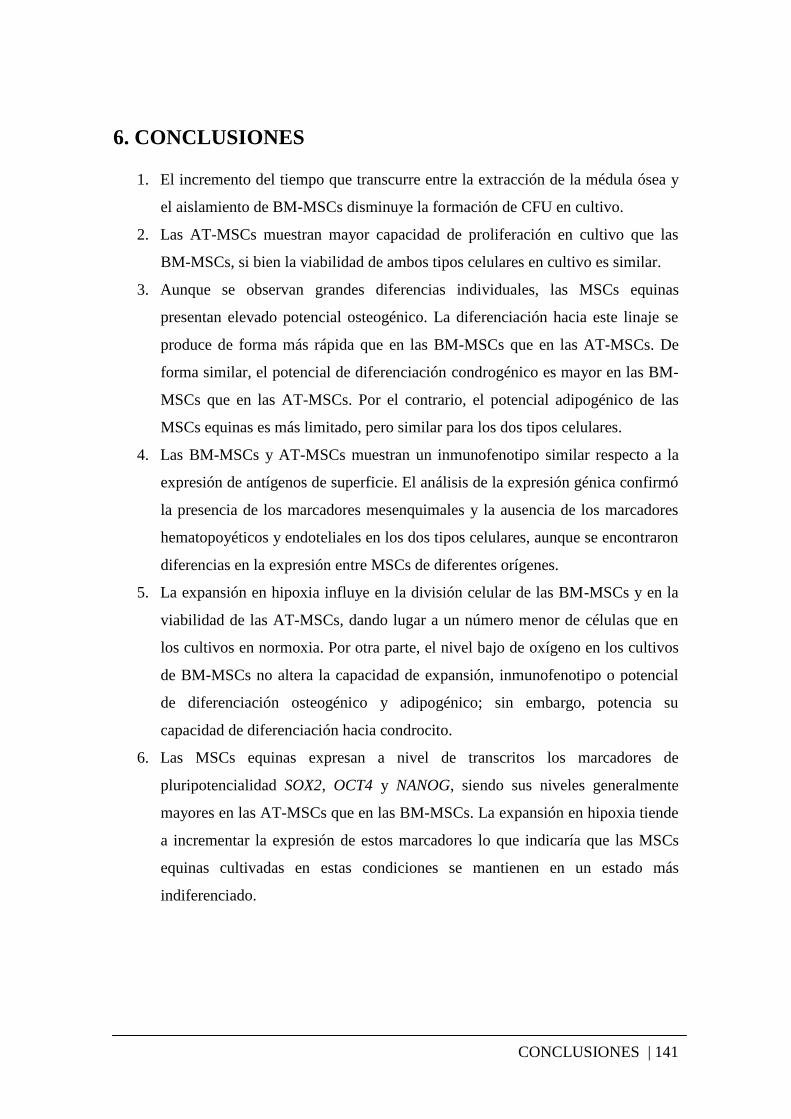
CONCLUSIONES | 141
6. CONCLUSIONES
1. El incremento del tiempo que transcurre entre la extracción de la médula ósea y
el aislamiento de BM-MSCs disminuye la formación de CFU en cultivo.
2. Las AT-MSCs muestran mayor capacidad de proliferación en cultivo que las
BM-MSCs, si bien la viabilidad de ambos tipos celulares en cultivo es similar.
3. Aunque se observan grandes diferencias individuales, las MSCs equinas
presentan elevado potencial osteogénico. La diferenciación hacia este linaje se
produce de forma más rápida que en las BM-MSCs que en las AT-MSCs. De
forma similar, el potencial de diferenciación condrogénico es mayor en las BM-
MSCs que en las AT-MSCs. Por el contrario, el potencial adipogénico de las
MSCs equinas es más limitado, pero similar para los dos tipos celulares.
4. Las BM-MSCs y AT-MSCs muestran un inmunofenotipo similar respecto a la
expresión de antígenos de superficie. El análisis de la expresión génica confirmó
la presencia de los marcadores mesenquimales y la ausencia de los marcadores
hematopoyéticos y endoteliales en los dos tipos celulares, aunque se encontraron
diferencias en la expresión entre MSCs de diferentes orígenes.
5. La expansión en hipoxia influye en la división celular de las BM-MSCs y en la
viabilidad de las AT-MSCs, dando lugar a un número menor de células que en
los cultivos en normoxia. Por otra parte, el nivel bajo de oxígeno en los cultivos
de BM-MSCs no altera la capacidad de expansión, inmunofenotipo o potencial
de diferenciación osteogénico y adipogénico; sin embargo, potencia su
capacidad de diferenciación hacia condrocito.
6. Las MSCs equinas expresan a nivel de transcritos los marcadores de
pluripotencialidad SOX2, OCT4 y NANOG, siendo sus niveles generalmente
mayores en las AT-MSCs que en las BM-MSCs. La expansión en hipoxia tiende
a incrementar la expresión de estos marcadores lo que indicaría que las MSCs
equinas cultivadas en estas condiciones se mantienen en un estado más
indiferenciado.

CONCLUSIONES | 142
CONCLUSIONS
1. The increased time between the bone marrow harvesting and the BM-MSC
isolation decreases the number of CFU in the culture.
2. The AT-MSCs display higher proliferative ability than BM-MSCs in culture,
although the viability of both cell types similar.
3. Even though large individual differences may be observed, the equine MSCs in
general have high osteogenic potential. The differentiation towards this lineage
is faster for BM-MSCs than for AT-MSCs. Similarly, chondrogenic potential is
more pronounced in BM-MSCs than in AT-MSCs. In contrast, adipogenic
potential of equine MSCs is more limited but similar for both cell types studied.
4. BM-MSCs and AT-MSCs display similar immunophenotype with respect to the
expression of cell surface antigens. The gene expression analysis confirmed the
presence of the mesenchymal markers and the absence of the hematopoietic and
the endothelial markers in both cell types. However, relative differences in gene
expression were found between the MSCs derived from different sources.
5. The cell expansion under hypoxic conditions influences on cell division in BM-
MSCs and in the viability of AT-MSCs, yielding to a lower number of cells in
hypoxic cultures. On the other hand, the low oxygen level in BM-MSCs cultures
does not alter the expansion ability, immunophenotype or osteogenic and
adipogenic potentials; however, hypoxia enhances the ability to differentiate into
chondrocyte.
6. Equine MSCs express the pluripotency marker transcripts of SOX2, OCT4 and
NANOG, their levels being generally higher in AT-MSCs than in BM-MSCs.
The expansion in hypoxia tends to increase the expression of these markers,
which may indicate that equine MSCs cultured in these conditions are
maintained in a more undifferentiated state.
BIBLIOGRAFÍA | 143
7. BIBLIOGRAFÍA
1. TRAGSEGA, S.A.y.S.G., Estudio y caracterización del sector equino en
España. 2003.
2. www.horsecouncil.org. National Economic Impact of the U.S. Horse Industry.
2005.
3. Frisbie, D.D. and R.K. Smith, Clinical update on the use of mesenchymal stem
cells in equine orthopaedics. Equine Vet J, 2010. 42(1): p. 86-9.
4. Smith, R.K., Mesenchymal stem cell therapy for equine tendinopathy. Disabil
Rehabil, 2008. 30(20-22): p. 1752-8.
5. Richardson, L.E., et al., Stem cells in veterinary medicine--attempts at
regenerating equine tendon after injury. Trends Biotechnol, 2007. 25(9): p. 409-
16.
6. Williams, I.F., A. Heaton, and K.G. McCullagh, Cell morphology and collagen
types in equine tendon scar. Res Vet Sci, 1980. 28(3): p. 302-10.
7. Koch, T.G., L.C. Berg, and D.H. Betts, Concepts for the clinical use of stem
cells in equine medicine. Can Vet J, 2008. 49(10): p. 1009-17.
8. Lo, B. and L. Parham, Ethical issues in stem cell research. Endocr Rev, 2009.
30(3): p. 204-13.
9. Caplan, A.I., Adult mesenchymal stem cells for tissue engineering versus
regenerative medicine. J Cell Physiol, 2007. 213(2): p. 341-7.
10. Godwin, E.E., et al., Implantation of bone marrow-derived mesenchymal stem
cells demonstrates improved outcome in horses with overstrain injury of the
superficial digital flexor tendon. Equine Vet J, 2011. 44(1): p. 25-32.
11. Mohyeldin, A., T. Garzon-Muvdi, and A. Quinones-Hinojosa, Oxygen in stem
cell biology: a critical component of the stem cell niche. Cell Stem Cell, 2010.
7(2): p. 150-61.
12. Csete, M., Oxygen in the cultivation of stem cells. Ann N Y Acad Sci, 2005.
1049: p. 1-8.
13. Evans, M.J. and M.H. Kaufman, Establishment in culture of pluripotential cells
from mouse embryos. Nature, 1981. 292(5819): p. 154-6.
14. Chen, L. and G.Q. Daley, Molecular basis of pluripotency. Hum Mol Genet,
2008. 17(R1): p. R23-7.
15. Verfaillie, C.M., Adult stem cells: assessing the case for pluripotency. Trends
Cell Biol, 2002. 12(11): p. 502-8.
16. Dattena, M., et al., Sheep embryonic stem-like cells transplanted in full-thickness
cartilage defects. J Tissue Eng Regen Med, 2009. 3(3): p. 175-87.
17. Shamblott, M.J., et al., Derivation of pluripotent stem cells from cultured human
primordial germ cells. Proc Natl Acad Sci U S A, 1998. 95(23): p. 13726-31.
18. Bongso, A.L., E.H., ed. Stem cells: their definition, classification and sources.
Stem Cells: From Benchtop to Bedside. Vol. 5. 2005, World Scientific.
19. Cattaneo, E. and R. McKay, Proliferation and differentiation of neuronal stem
cells regulated by nerve growth factor. Nature, 1990. 347(6295): p. 762-5.
20. Bergmann, O., et al., Evidence for cardiomyocyte renewal in humans. Science,
2009. 324(5923): p. 98-102.

BIBLIOGRAFÍA | 144
21. Toma, J.G., et al., Isolation of multipotent adult stem cells from the dermis of
mammalian skin. Nat Cell Biol, 2001. 3(9): p. 778-84.
22. Prockop, D.J., Marrow stromal cells as stem cells for nonhematopoietic tissues.
Science, 1997. 276(5309): p. 71-4.
23. Weissman, I.L., D.J. Anderson, and F. Gage, Stem and progenitor cells: origins,
phenotypes, lineage commitments, and transdifferentiations. Annu Rev Cell Dev
Biol, 2001. 17: p. 387-403.
24. Lagasse, E., et al., Purified hematopoietic stem cells can differentiate into
hepatocytes in vivo. Nat Med, 2000. 6(11): p. 1229-34.
25. Till, J.E. and C.E. Mc, A direct measurement of the radiation sensitivity of
normal mouse bone marrow cells. Radiat Res, 1961. 14: p. 213-22.
26. Bronzi, D., et al., Neural markers expression in rat bone marrow mesenchymal
stem cell cultures treated with neurosteroids. Neurochem Res. 35(12): p. 2154-
60.
27. Karnieli, O., et al., Generation of insulin-producing cells from human bone
marrow mesenchymal stem cells by genetic manipulation. Stem Cells, 2007.
25(11): p. 2837-44.
28. Ishikawa, T., et al., Stem cells for hepatic regeneration: the role of adipose
tissue derived mesenchymal stem cells. Curr Stem Cell Res Ther, 2011. 5(2): p.
182-9.
29. Ksiazek, K., A comprehensive review on mesenchymal stem cell growth and
senescence. Rejuvenation Res, 2009. 12(2): p. 105-16.
30. Friedenstein, A.J., R.K. Chailakhjan, and K.S. Lalykina, The development of
fibroblast colonies in monolayer cultures of guinea-pig bone marrow and spleen
cells. Cell Tissue Kinet, 1970. 3(4): p. 393-403.
31. Horwitz, E.M., et al., Clarification of the nomenclature for MSC: The
International Society for Cellular Therapy position statement. Cytotherapy,
2005. 7(5): p. 393-5.
32. Dominici, M., et al., Minimal criteria for defining multipotent mesenchymal
stromal cells. The International Society for Cellular Therapy position statement.
Cytotherapy, 2006. 8(4): p. 315-7.
33. Mafi, R., et al., Sources of adult mesenchymal stem cells applicable for
musculoskeletal applications - a systematic review of the literature. Open
Orthop J, 2011. 5 Suppl 2: p. 242-8.
34. Zuk, P.A., et al., Multilineage cells from human adipose tissue: implications for
cell-based therapies. Tissue Eng, 2001. 7(2): p. 211-28.
35. Caspar-Bauguil, S., et al., Adipose tissues as an ancestral immune organ: site-
specific change in obesity. FEBS Lett, 2005. 579(17): p. 3487-92.
36. Schaffler, A. and C. Buchler, Concise review: adipose tissue-derived stromal
cells--basic and clinical implications for novel cell-based therapies. Stem Cells,
2007. 25(4): p. 818-27.
37. Sharpless, N.E. and R.A. DePinho, How stem cells age and why this makes us
grow old. Nat Rev Mol Cell Biol, 2007. 8(9): p. 703-13.
38. Liu, T.M., et al., Identification of common pathways mediating differentiation of
bone marrow- and adipose tissue-derived human mesenchymal stem cells into
three mesenchymal lineages. Stem Cells, 2007. 25(3): p. 750-60.
39. Bunnell, B.A., et al., Differentiation of adipose stem cells. Methods Mol Biol,
2008. 456: p. 155-71.
40. Zvaifler, N.J., et al., Mesenchymal precursor cells in the blood of normal
individuals. Arthritis Res, 2000. 2(6): p. 477-88.

BIBLIOGRAFÍA | 145
41. Lama, V.N., et al., Evidence for tissue-resident mesenchymal stem cells in
human adult lung from studies of transplanted allografts. J Clin Invest, 2007.
117(4): p. 989-96.
42. Adachi, N., et al., Muscle derived, cell based ex vivo gene therapy for treatment
of full thickness articular cartilage defects. J Rheumatol, 2002. 29(9): p. 1920-
30.
43. Sekiya, I., et al., [Articular cartilage regeneration with synovial mesenchymal
stem cells]. Clin Calcium, 2011. 21(6): p. 879-89.
44. Estrela, C., et al., Mesenchymal stem cells in the dental tissues: perspectives for
tissue regeneration. Braz Dent J. 22(2): p. 91-8.
45. Robinson, S.N., et al., Mesenchymal stem cells in ex vivo cord blood expansion.
Best Pract Res Clin Haematol. 24(1): p. 83-92.
46. Mitchell, K.E., et al., Matrix cells from Wharton's jelly form neurons and glia.
Stem Cells, 2003. 21(1): p. 50-60.
47. Klein, J.D. and D.O. Fauza, Amniotic and placental mesenchymal stem cell
isolation and culture. Methods Mol Biol. 698: p. 75-88.
48. Knoepfler, P.S., Deconstructing stem cell tumorigenicity: a roadmap to safe
regenerative medicine. Stem Cells, 2009. 27(5): p. 1050-6.
49. Grinnemo, K.H., et al., Xenoreactivity and engraftment of human mesenchymal
stem cells transplanted into infarcted rat myocardium. J Thorac Cardiovasc
Surg, 2004. 127(5): p. 1293-300.
50. Krampera, M., et al., Mesenchymal stem cells: from biology to clinical use.
Blood Transfus, 2007. 5(3): p. 120-9.
51. Phinney, D.G. and D.J. Prockop, Concise review: mesenchymal stem/multipotent
stromal cells: the state of transdifferentiation and modes of tissue repair--
current views. Stem Cells, 2007. 25(11): p. 2896-902.
52. Pereira, R.F., et al., Cultured adherent cells from marrow can serve as long-
lasting precursor cells for bone, cartilage, and lung in irradiated mice. Proc
Natl Acad Sci U S A, 1995. 92(11): p. 4857-61.
53. Horwitz, E.M., et al., Transplantability and therapeutic effects of bone marrow-
derived mesenchymal cells in children with osteogenesis imperfecta. Nat Med,
1999. 5(3): p. 309-13.
54. Shelbourne, K.D., S. Jari, and T. Gray, Outcome of untreated traumatic
articular cartilage defects of the knee: a natural history study. J Bone Joint Surg
Am, 2003. 85-A Suppl 2: p. 8-16.
55. Lotz, M., Cytokines in cartilage injury and repair. Clin Orthop Relat Res,
2001(391 Suppl): p. S108-15.
56. Hangody, L., et al., Mosaicplasty for the treatment of articular defects of the
knee and ankle. Clin Orthop Relat Res, 2001(391 Suppl): p. S328-36.
57. Brittberg, M., et al., Treatment of deep cartilage defects in the knee with
autologous chondrocyte transplantation. N Engl J Med, 1994. 331(14): p. 889-
95.
58. Tins, B.J., et al., Autologous chondrocyte implantation in knee joint: MR
imaging and histologic features at 1-year follow-up. Radiology, 2005. 234(2): p.
501-8.
59. Mizuno, K., et al., Exogenous synovial stem cells adhere to defect of meniscus
and differentiate into cartilage cells. J Med Dent Sci, 2008. 55(1): p. 101-11.
60. Murphy, J.M., K.W. Kavalkovitch, and D. Fink, Regeneration of meniscal tissue
and protection of articulat cartilage by injection of mesenchymal stem cells.
Osteoarthritis Cartilage, 2000. 8(Supp. B S25).

BIBLIOGRAFÍA | 146
61. Koga, H., et al., Mesenchymal stem cell-based therapy for cartilage repair: a
review. Knee Surg Sports Traumatol Arthrosc, 2009. 17(11): p. 1289-97.
62. Maffulli, N., J. Wong, and L.C. Almekinders, Types and epidemiology of
tendinopathy. Clin Sports Med, 2003. 22(4): p. 675-92.
63. Brockis, J.G., The blood supply of the flexor and extensor tendons of the fingers
in man. J Bone Joint Surg Br, 1953. 35-B(1): p. 131-8.
64. Kannus, P., Structure of the tendon connective tissue. Scand J Med Sci Sports,
2000. 10(6): p. 312-20.
65. Favata, M., et al., Regenerative properties of fetal sheep tendon are not
adversely affected by transplantation into an adult environment. J Orthop Res,
2006. 24(11): p. 2124-32.
66. Goh, J.C., et al., Tissue-engineering approach to the repair and regeneration of
tendons and ligaments. Tissue Eng, 2003. 9 Suppl 1: p. S31-44.
67. Dahlgren, L.A., et al., Insulin-like growth factor-I improves cellular and
molecular aspects of healing in a collagenase-induced model of flexor tendinitis.
J Orthop Res, 2002. 20(5): p. 910-9.
68. Dines, J.S., et al., The effect of growth differentiation factor-5-coated sutures on
tendon repair in a rat model. J Shoulder Elbow Surg, 2007. 16(5 Suppl): p.
S215-21.
69. Eppley, B.L., J.E. Woodell, and J. Higgins, Platelet quantification and growth
factor analysis from platelet-rich plasma: implications for wound healing. Plast
Reconstr Surg, 2004. 114(6): p. 1502-8.
70. Kajikawa, Y., et al., Platelet-rich plasma enhances the initial mobilization of
circulation-derived cells for tendon healing. J Cell Physiol, 2008. 215(3): p.
837-45.
71. Bosch, G., et al., The effect of platelet-rich plasma on the neovascularization of
surgically created equine superficial digital flexor tendon lesions. Scand J Med
Sci Sports, 2010. 21(4): p. 554-61.
72. de Vos, R.J., et al., Platelet-rich plasma injection for chronic Achilles
tendinopathy: a randomized controlled trial. JAMA. 303(2): p. 144-9.
73. Sanchez, M., et al., Comparison of surgically repaired Achilles tendon tears
using platelet-rich fibrin matrices. Am J Sports Med, 2007. 35(2): p. 245-51.
74. Chong, A.K., et al., Bone marrow-derived mesenchymal stem cells influence
early tendon-healing in a rabbit achilles tendon model. J Bone Joint Surg Am,
2007. 89(1): p. 74-81.
75. Awad, H.A., et al., Repair of patellar tendon injuries using a cell-collagen
composite. J Orthop Res, 2003. 21(3): p. 420-31.
76. Young, R.G., et al., Use of mesenchymal stem cells in a collagen matrix for
Achilles tendon repair. J Orthop Res, 1998. 16(4): p. 406-13.
77. Lee, J.Y., et al., BMP-12 treatment of adult mesenchymal stem cells in vitro
augments tendon-like tissue formation and defect repair in vivo. PLoS One,
2011. 6(3): p. e17531.
78. Kessler, P.D. and B.J. Byrne, Myoblast cell grafting into heart muscle: cellular
biology and potential applications. Annu Rev Physiol, 1999. 61: p. 219-42.
79. Menasche, P., et al., Myoblast transplantation for heart failure. Lancet, 2001.
357(9252): p. 279-80.
80. Saito, T., et al., Myogenic Expression of Mesenchymal Stem Cells within
Myotubes of mdx Mice in Vitro and in Vivo. Tissue Eng, 1995. 1(4): p. 327-43.

BIBLIOGRAFÍA | 147
81. Toma, C., et al., Human mesenchymal stem cells differentiate to a
cardiomyocyte phenotype in the adult murine heart. Circulation, 2002. 105(1):
p. 93-8.
82. Chen, S.L., et al., Effect on left ventricular function of intracoronary
transplantation of autologous bone marrow mesenchymal stem cell in patients
with acute myocardial infarction. Am J Cardiol, 2004. 94(1): p. 92-5.
83. Miyahara, Y., et al., Monolayered mesenchymal stem cells repair scarred
myocardium after myocardial infarction. Nat Med, 2006. 12(4): p. 459-65.
84. Horowitz, M.M., et al., Graft-versus-leukemia reactions after bone marrow
transplantation. Blood, 1990. 75(3): p. 555-62.
85. Dickinson, A. and A. Cant, Haemopoietic stem-cell transplantation: improving
immune reconstitution, avoiding graft-versus-host disease. Lancet, 2002.
360(9327): p. 98-9.
86. Maitra, B., et al., Human mesenchymal stem cells support unrelated donor
hematopoietic stem cells and suppress T-cell activation. Bone Marrow
Transplant, 2004. 33(6): p. 597-604.
87. Le Blanc, K., Immunomodulatory effects of fetal and adult mesenchymal stem
cells. Cytotherapy, 2003. 5(6): p. 485-9.
88. Le Blanc, K., et al., Treatment of severe acute graft-versus-host disease with
third party haploidentical mesenchymal stem cells. Lancet, 2004. 363(9419): p.
1439-41.
89. Deng, W., et al., Effects of allogeneic bone marrow-derived mesenchymal stem
cells on T and B lymphocytes from BXSB mice. DNA Cell Biol, 2005. 24(7): p.
458-63.
90. Weil, B.R., et al., The immunomodulatory properties of mesenchymal stem cells:
implications for surgical disease. J Surg Res, 2011. 167(1): p. 78-86.
91. Frisbie, D.D., M.W. Cross, and C.W. McIlwraith, A comparative study of
articular cartilage thickness in the stifle of animal species used in human pre-
clinical studies compared to articular cartilage thickness in the human knee. Vet
Comp Orthop Traumatol, 2006. 19(3): p. 142-6.
92. Fiester, A., H. Scholer, and A. Caplan, Stem cell therapies: time to talk to the
animals. Cloning Stem Cells, 2004. 6(1): p. 3-4.
93. Frisbie, D.D., Future directions in treatment of joint disease in horses. Vet Clin
North Am Equine Pract, 2005. 21(3): p. 713-24, viii.
94. Frisbie, D.D., et al., Evaluation of adipose-derived stromal vascular fraction or
bone marrow-derived mesenchymal stem cells for treatment of osteoarthritis. J
Orthop Res, 2009. 27(12): p. 1675-80.
95. Pool, R.R. and D.M. Meagher, Pathologic findings and pathogenesis of
racetrack injuries. Vet Clin North Am Equine Pract, 1990. 6(1): p. 1-30.
96. Frisbie, D.D., et al., Arthroscopic subchondral bone plate microfracture
technique augments healing of large chondral defects in the radial carpal bone
and medial femoral condyle of horses. Vet Surg, 1999. 28(4): p. 242-55.
97. Barnewitz, D., et al., Treatment of articular cartilage defects in horses with
polymer-based cartilage tissue engineering grafts. Biomaterials, 2006. 27(14):
p. 2882-9.
98. Nixon, A.J., et al., Enhanced repair of extensive articular defects by insulin-like
growth factor-I-laden fibrin composites. J Orthop Res, 1999. 17(4): p. 475-87.
99. Wilke, M.M., D.V. Nydam, and A.J. Nixon, Enhanced early chondrogenesis in
articular defects following arthroscopic mesenchymal stem cell implantation in
an equine model. J Orthop Res, 2007. 25(7): p. 913-25.

BIBLIOGRAFÍA | 148
100. Carrade, D.D., et al., Clinicopathologic findings following intra-articular
injection of autologous and allogeneic placentally derived equine mesenchymal
stem cells in horses. Cytotherapy, 2010. 13(4): p. 419-30.
101. Wilson, A.M., et al., Horses damp the spring in their step. Nature, 2001.
414(6866): p. 895-9.
102. Smith, R.K., et al., The influence of ageing and exercise on tendon growth and
degeneration--hypotheses for the initiation and prevention of strain-induced
tendinopathies. Comp Biochem Physiol A Mol Integr Physiol, 2002. 133(4): p.
1039-50.
103. Dahlgren, L.A., H.O. Mohammed, and A.J. Nixon, Temporal expression of
growth factors and matrix molecules in healing tendon lesions. J Orthop Res,
2005. 23(1): p. 84-92.
104. Crevier-Denoix, N., et al., Mechanical properties of pathological equine
superficial digital flexor tendons. Equine Vet J Suppl, 1997(23): p. 23-6.
105. Smith, R.K., et al., Isolation and implantation of autologous equine
mesenchymal stem cells from bone marrow into the superficial digital flexor
tendon as a potential novel treatment. Equine Vet J, 2003. 35(1): p. 99-102.
106. Crovace, A., et al., Cell therapy for tendon repair in horses: an experimental
study. Vet Res Commun, 2007. 31 Suppl 1: p. 281-3.
107. Pacini, S., et al., Suspension of bone marrow-derived undifferentiated
mesenchymal stromal cells for repair of superficial digital flexor tendon in race
horses. Tissue Eng, 2007. 13(12): p. 2949-55.
108. Schnabel, L.V., et al., Mesenchymal stem cells and insulin-like growth factor-I
gene-enhanced mesenchymal stem cells improve structural aspects of healing in
equine flexor digitorum superficialis tendons. J Orthop Res, 2009. 27(10): p.
1392-8.
109. Nixon, A.J., et al., Effect of adipose-derived nucleated cell fractions on tendon
repair in horses with collagenase-induced tendinitis. Am J Vet Res, 2008. 69(7):
p. 928-37.
110. Watts, A.E., et al., Fetal derived embryonic-like stem cells improve healing in a
large animal flexor tendonitis model. Stem Cell Res Ther. 2(1): p. 4.
111. Bruder, S.P., N. Jaiswal, and S.E. Haynesworth, Growth kinetics, self-renewal,
and the osteogenic potential of purified human mesenchymal stem cells during
extensive subcultivation and following cryopreservation. J Cell Biochem, 1997.
64(2): p. 278-94.
112. Schaffler, A., et al., Potential of adipocytokines in predicting peripancreatic
necrosis and severity in acute pancreatitis: pilot study. J Gastroenterol Hepatol,
2007. 22(3): p. 326-34.
113. Oedayrajsingh-Varma, M.J., et al., Adipose tissue-derived mesenchymal stem
cell yield and growth characteristics are affected by the tissue-harvesting
procedure. Cytotherapy, 2006. 8(2): p. 166-77.
114. Bianchi, G., et al., Ex vivo enrichment of mesenchymal cell progenitors by
fibroblast growth factor 2. Exp Cell Res, 2003. 287(1): p. 98-105.
115. Zaragosi, L.E., G. Ailhaud, and C. Dani, Autocrine fibroblast growth factor 2
signaling is critical for self-renewal of human multipotent adipose-derived stem
cells. Stem Cells, 2006. 24(11): p. 2412-9.
116. Tuan, R.S., G. Boland, and R. Tuli, Adult mesenchymal stem cells and cell-
based tissue engineering. Arthritis Res Ther, 2003. 5(1): p. 32-45.

BIBLIOGRAFÍA | 149
117. Baksh, D., L. Song, and R.S. Tuan, Adult mesenchymal stem cells:
characterization, differentiation, and application in cell and gene therapy. J Cell
Mol Med, 2004. 8(3): p. 301-16.
118. Gronthos, S., et al., Molecular and cellular characterisation of highly purified
stromal stem cells derived from human bone marrow. J Cell Sci, 2003. 116(Pt
9): p. 1827-35.
119. Igura, K., et al., Isolation and characterization of mesenchymal progenitor cells
from chorionic villi of human placenta. Cytotherapy, 2004. 6(6): p. 543-53.
120. Kyurkchiev, S., A. Shterev, and R. Dimitrov, Assessment of presence and
characteristics of multipotent stromal cells in human endometrium and decidua.
Reprod Biomed Online. 20(3): p. 305-13.
121. Puissant, B., et al., Immunomodulatory effect of human adipose tissue-derived
adult stem cells: comparison with bone marrow mesenchymal stem cells. Br J
Haematol, 2005. 129(1): p. 118-29.
122. Noel, D., et al., Cell specific differences between human adipose-derived and
mesenchymal-stromal cells despite similar differentiation potentials. Exp Cell
Res, 2008. 314(7): p. 1575-84.
123. Kern, S., et al., Comparative analysis of mesenchymal stem cells from bone
marrow, umbilical cord blood, or adipose tissue. Stem Cells, 2006. 24(5): p.
1294-301.
124. Deans, R.J. and A.B. Moseley, Mesenchymal stem cells: biology and potential
clinical uses. Exp Hematol, 2000. 28(8): p. 875-84.
125. Torensma, R., et al., Ceramic hydroxyapatite coating on titanium implants
drives selective bone marrow stromal cell adhesion. Clin Oral Implants Res,
2003. 14(5): p. 569-77.
126. De Schauwer, C., et al., Markers of stemness in equine mesenchymal stem cells:
a plea for uniformity. Theriogenology, 2010. 75(8): p. 1431-43.
127. Kadiyala, S., et al., Culture expanded canine mesenchymal stem cells possess
osteochondrogenic potential in vivo and in vitro. Cell Transplant, 1997. 6(2): p.
125-34.
128. Awad, H.A., et al., Autologous mesenchymal stem cell-mediated repair of
tendon. Tissue Eng, 1999. 5(3): p. 267-77.
129. Galmiche, M.C., et al., Stromal cells from human long-term marrow cultures are
mesenchymal cells that differentiate following a vascular smooth muscle
differentiation pathway. Blood, 1993. 82(1): p. 66-76.
130. Dennis, J.E., et al., A quadripotential mesenchymal progenitor cell isolated from
the marrow of an adult mouse. J Bone Miner Res, 1999. 14(5): p. 700-9.
131. Pittenger, M.F., et al., Multilineage potential of adult human mesenchymal stem
cells. Science, 1999. 284(5411): p. 143-7.
132. Muraglia, A., R. Cancedda, and R. Quarto, Clonal mesenchymal progenitors
from human bone marrow differentiate in vitro according to a hierarchical
model. J Cell Sci, 2000. 113 ( Pt 7): p. 1161-6.
133. Sekiya, I., et al., Adipogenic differentiation of human adult stem cells from bone
marrow stroma (MSCs). J Bone Miner Res, 2004. 19(2): p. 256-64.
134. MacDougald, O.A. and M.D. Lane, Transcriptional regulation of gene
expression during adipocyte differentiation. Annu Rev Biochem, 1995. 64: p.
345-73.
135. Katz, A.J., et al., Emerging approaches to the tissue engineering of fat. Clin
Plast Surg, 1999. 26(4): p. 587-603, viii.

BIBLIOGRAFÍA | 150
136. Kang, X., Y. Xie, and D.A. Kniss, Adipose tissue model using three-dimensional
cultivation of preadipocytes seeded onto fibrous polymer scaffolds. Tissue Eng,
2005. 11(3-4): p. 458-68.
137. Rosen, E.D. and B.M. Spiegelman, Peroxisome proliferator-activated receptor
gamma ligands and atherosclerosis: ending the heartache. J Clin Invest, 2000.
106(5): p. 629-31.
138. Romero-Prado, M., et al., Functional characterization of human mesenchymal
stem cells that maintain osteochondral fates. J Cell Biochem, 2006. 98(6): p.
1457-70.
139. Guillot, P.V., et al., Comparative osteogenic transcription profiling of various
fetal and adult mesenchymal stem cell sources. Differentiation, 2008. 76(9): p.
946-57.
140. Frank, O., et al., Real-time quantitative RT-PCR analysis of human bone
marrow stromal cells during osteogenic differentiation in vitro. J Cell Biochem,
2002. 85(4): p. 737-46.
141. Kassem, M., B.M. Abdallah, and H. Saeed, Osteoblastic cells: differentiation
and trans-differentiation. Arch Biochem Biophys, 2008. 473(2): p. 183-7.
142. Franceschi, R.T., The role of ascorbic acid in mesenchymal differentiation. Nutr
Rev, 1992. 50(3): p. 65-70.
143. Chung, C.H., et al., Mechanism of action of beta-glycerophosphate on bone cell
mineralization. Calcif Tissue Int, 1992. 51(4): p. 305-11.
144. Bonewald, L.F., et al., von Kossa staining alone is not sufficient to confirm that
mineralization in vitro represents bone formation. Calcif Tissue Int, 2003. 72(5):
p. 537-47.
145. Bi, W., et al., Sox9 is required for cartilage formation. Nat Genet, 1999. 22(1):
p. 85-9.
146. Grigolo, B., et al., Molecular and immunohistological characterization of
human cartilage two years following autologous cell transplantation. J Bone
Joint Surg Am, 2005. 87(1): p. 46-57.
147. Barry, F., et al., Chondrogenic differentiation of mesenchymal stem cells from
bone marrow: differentiation-dependent gene expression of matrix components.
Exp Cell Res, 2001. 268(2): p. 189-200.
148. Haleem-Smith, H., et al., Cartilage oligomeric matrix protein enhances matrix
assembly during chondrogenesis of human mesenchymal stem cells. J Cell
Biochem.
149. Rucklidge, G.J., G. Milne, and S.P. Robins, Collagen type X: a component of the
surface of normal human, pig, and rat articular cartilage. Biochem Biophys Res
Commun, 1996. 224(2): p. 297-302.
150. Solursh, M., Formation of cartilage tissue in vitro. J Cell Biochem, 1991. 45(3):
p. 258-60.
151. Sekiya, I., et al., Comparison of effect of BMP-2, -4, and -6 on in vitro cartilage
formation of human adult stem cells from bone marrow stroma. Cell Tissue Res,
2005. 320(2): p. 269-76.
152. Neame, P.J. and F.P. Barry, The link proteins. Experientia, 1993. 49(5): p. 393-
402.
153. Maltman, D.J., S.A. Hardy, and S.A. Przyborski, Role of mesenchymal stem
cells in neurogenesis and nervous system repair. Neurochem Int. 59(3): p. 347-
56.

BIBLIOGRAFÍA | 151
154. Deng, Y.B., et al., Implantation of BM mesenchymal stem cells into injured
spinal cord elicits de novo neurogenesis and functional recovery: evidence from
a study in rhesus monkeys. Cytotherapy, 2006. 8(3): p. 210-4.
155. Trzaska, K.A., et al., Brain-derived neurotrophic factor facilitates maturation of
mesenchymal stem cell-derived dopamine progenitors to functional neurons. J
Neurochem, 2009. 110(3): p. 1058-69.
156. Sanchez-Ramos, J., et al., Adult bone marrow stromal cells differentiate into
neural cells in vitro. Exp Neurol, 2000. 164(2): p. 247-56.
157. Tondreau, T., et al., Gene expression pattern of functional neuronal cells
derived from human bone marrow mesenchymal stromal cells. BMC Genomics,
2008. 9: p. 166.
158. Li, Y., et al., Generation of insulin-producing cells from PDX-1 gene-modified
human mesenchymal stem cells. J Cell Physiol, 2007. 211(1): p. 36-44.
159. Puglisi, M.A., et al., Adipose tissue-derived mesenchymal stem cells and hepatic
differentiation: old concepts and future perspectives. Eur Rev Med Pharmacol
Sci. 15(4): p. 355-64.
160. Brandau, S., et al., Tissue-resident mesenchymal stem cells attract peripheral
blood neutrophils and enhance their inflammatory activity in response to
microbial challenge. J Leukoc Biol. 88(5): p. 1005-15.
161. Aggarwal, S. and M.F. Pittenger, Human mesenchymal stem cells modulate
allogeneic immune cell responses. Blood, 2005. 105(4): p. 1815-22.
162. Vidal, M.A., et al., Cell growth characteristics and differentiation frequency of
adherent equine bone marrow-derived mesenchymal stromal cells: adipogenic
and osteogenic capacity. Vet Surg, 2006. 35(7): p. 601-10.
163. Vidal, M.A., et al., Characterization of equine adipose tissue-derived stromal
cells: adipogenic and osteogenic capacity and comparison with bone marrow-
derived mesenchymal stromal cells. Vet Surg, 2007. 36(7): p. 613-22.
164. Koerner, J., et al., Equine peripheral blood-derived progenitors in comparison
to bone marrow-derived mesenchymal stem cells. Stem Cells, 2006. 24(6): p.
1613-9.
165. Hoynowski, S.M., et al., Characterization and differentiation of equine
umbilical cord-derived matrix cells. Biochem Biophys Res Commun, 2007.
362(2): p. 347-53.
166. Koch, T.G., et al., Isolation of mesenchymal stem cells from equine umbilical
cord blood. BMC Biotechnol, 2007. 7: p. 26.
167. Mensing, N., et al., Isolation and characterization of multipotent mesenchymal
stromal cells from the gingiva and the periodontal ligament of the horse. BMC
Vet Res, 2011. 7: p. 42.
168. Taylor, S.E., R.K. Smith, and P.D. Clegg, Mesenchymal stem cell therapy in
equine musculoskeletal disease: scientific fact or clinical fiction? Equine Vet J,
2007. 39(2): p. 172-80.
169. Arnhold, S.J., et al., Isolation and characterization of bone marrow-derived
equine mesenchymal stem cells. Am J Vet Res, 2007. 68(10): p. 1095-105.
170. Colleoni, S., et al., Isolation, growth and differentiation of equine mesenchymal
stem cells: effect of donor, source, amount of tissue and supplementation with
basic fibroblast growth factor. Vet Res Commun, 2009.
171. Ibrahim, S., et al., Screening of anti-human leukocyte monoclonal antibodies for
reactivity with equine leukocytes. Vet Immunol Immunopathol, 2007. 119(1-2):
p. 63-80.

BIBLIOGRAFÍA | 152
172. Braun, J., et al., Evaluation of the osteogenic and chondrogenic differentiation
capacities of equine adipose tissue-derived mesenchymal stem cells. Am J Vet
Res, 2010. 71(10): p. 1228-36.
173. de Mattos Carvalho, A., et al., Isolation and immunophenotypic characterization
of mesenchymal stem cells derived from equine species adipose tissue. Vet
Immunol Immunopathol, 2009.
174. Pascucci, L., et al., Flow cytometric characterization of culture expanded
multipotent mesenchymal stromal cells (MSCs) from horse adipose tissue:
towards the definition of minimal stemness criteria. Vet Immunol
Immunopathol, 2011. 144(3-4): p. 499-506.
175. Radcliffe, C.H., M.J. Flaminio, and L.A. Fortier, Temporal analysis of equine
bone marrow aspirate during establishment of putative mesenchymal progenitor
cell populations. Stem Cells Dev, 2010. 19(2): p. 269-82.
176. Guest, D.J., J.C. Ousey, and R.W. Smith, Defining the expression of marker
genes
in equine mesenchymal stromal cells. Stem Cells and Cloning: Advances and
Applications, 2008. 1(1): p. 1-9.
177. Martinello, T., et al., Cryopreservation does not affect the stem characteristics
of multipotent cells isolated from equine peripheral blood. Tissue Eng Part C
Methods. 16(4): p. 771-81.
178. Raabe, O., et al., Further insights into the characterization of equine adipose
tissue-derived mesenchymal stem cells. Vet Res Commun, 2011. 35(6): p. 355-
65.
179. Janderova, L., et al., Human mesenchymal stem cells as an in vitro model for
human adipogenesis. Obes Res, 2003. 11(1): p. 65-74.
180. Ahern, B.J., et al., Evaluation of equine peripheral blood apheresis product,
bone marrow, and adipose tissue as sources of mesenchymal stem cells and their
differentation potential. Am J Vet Res. 72(1): p. 127-33.
181. Toupadakis, C.A., et al., Comparison of the osteogenic potential of equine
mesenchymal stem cells from bone marrow, adipose tissue, umbilical cord
blood, and umbilical cord tissue. Am J Vet Res, 2011. 71(10): p. 1237-45.
182. Mambelli, L.I., et al., Characterization of equine adipose tissue-derived
progenitor cells before and after cryopreservation. Tissue Eng Part C Methods,
2009. 15(1): p. 87-94.
183. Vidal, M.A., et al., Comparison of chondrogenic potential in equine
mesenchymal stromal cells derived from adipose tissue and bone marrow. Vet
Surg, 2008. 37(8): p. 713-24.
184. Berg, L., et al., Chondrogenic potential of mesenchymal stromal cells derived
from equine bone marrow and umbilical cord blood. Vet Comp Orthop
Traumatol, 2009. 22(5): p. 363-70.
185. Stewart, A.A., et al., Effect of dexamethasone supplementation on
chondrogenesis of equine mesenchymal stem cells. Am J Vet Res, 2008. 69(8):
p. 1013-21.
186. Romanov, Y.A., et al., Optimum conditions for culturing of human bone marrow
and adipose tissue mesenchymal precursor cells. Bull Exp Biol Med, 2006.
142(4): p. 515-20.
187. Kosmacheva, S.M., et al., In vitro growth of human umbilical blood
mesenchymal stem cells and their differentiation into chondrocytes and
osteoblasts. Bull Exp Biol Med, 2008. 145(1): p. 141-5.

BIBLIOGRAFÍA | 153
188. Bieback, K., et al., Altered gene expression in human adipose stem cells cultured
with fetal bovine serum compared to human supplements. Tissue Eng Part A.
16(11): p. 3467-84.
189. Heiskanen, A., et al., N-glycolylneuraminic acid xenoantigen contamination of
human embryonic and mesenchymal stem cells is substantially reversible. Stem
Cells, 2007. 25(1): p. 197-202.
190. Ezashi, T., P. Das, and R.M. Roberts, Low O2 tensions and the prevention of
differentiation of hES cells. Proc Natl Acad Sci U S A, 2005. 102(13): p. 4783-8.
191. Harris, A.L., Hypoxia--a key regulatory factor in tumour growth. Nat Rev
Cancer, 2002. 2(1): p. 38-47.
192. Jauniaux, E., et al., In-vivo measurement of intrauterine gases and acid-base
values early in human pregnancy. Hum Reprod, 1999. 14(11): p. 2901-4.
193. Iyer, N.V., et al., Cellular and developmental control of O2 homeostasis by
hypoxia-inducible factor 1 alpha. Genes Dev, 1998. 12(2): p. 149-62.
194. Harrison, J.S., et al., Oxygen saturation in the bone marrow of healthy
volunteers. Blood, 2002. 99(1): p. 394.
195. Pasarica, M., et al., Reduced adipose tissue oxygenation in human obesity:
evidence for rarefaction, macrophage chemotaxis, and inflammation without an
angiogenic response. Diabetes, 2009. 58(3): p. 718-25.
196. Dos Santos, F., et al., Ex vivo expansion of human mesenchymal stem cells: a
more effective cell proliferation kinetics and metabolism under hypoxia. J Cell
Physiol, 2010. 223(1): p. 27-35.
197. Ren, H., et al., Proliferation and differentiation of bone marrow stromal cells
under hypoxic conditions. Biochem Biophys Res Commun, 2006. 347(1): p. 12-
21.
198. Grayson, W.L., et al., Hypoxia enhances proliferation and tissue formation of
human mesenchymal stem cells. Biochem Biophys Res Commun, 2007. 358(3):
p. 948-53.
199. Volkmer, E., et al., Hypoxic preconditioning of human mesenchymal stem cells
overcomes hypoxia-induced inhibition of osteogenic differentiation. Tissue Eng
Part A, 2010. 16(1): p. 153-64.
200. Holzwarth, C., et al., Low physiologic oxygen tensions reduce proliferation and
differentiation of human multipotent mesenchymal stromal cells. BMC Cell Biol,
2010. 11: p. 11.
201. Chung, D.J., et al., Osteogenic proliferation and differentiation of canine bone
marrow and adipose tissue derived mesenchymal stromal cells and the influence
of hypoxia. Res Vet Sci, 2010.
202. Gardner, L.B., et al., Hypoxia inhibits G1/S transition through regulation of p27
expression. J Biol Chem, 2001. 276(11): p. 7919-26.
203. Koshiji, M., et al., HIF-1alpha induces cell cycle arrest by functionally
counteracting Myc. EMBO J, 2004. 23(9): p. 1949-56.
204. Chacko, S.M., et al., Hypoxic preconditioning induces the expression of
prosurvival and proangiogenic markers in mesenchymal stem cells. Am J
Physiol Cell Physiol, 2010. 299(6): p. C1562-70.
205. Iida, K., et al., Hypoxia enhances colony formation and proliferation but inhibits
differentiation of human dental pulp cells. Arch Oral Biol, 2010. 55(9): p. 648-
54.
206. Fehrer, C., et al., Reduced oxygen tension attenuates differentiation capacity of
human mesenchymal stem cells and prolongs their lifespan. Aging Cell, 2007.
6(6): p. 745-57.

BIBLIOGRAFÍA | 154
207. Nekanti, U., et al., Increased proliferation and analysis of differential gene
expression in human Wharton's jelly-derived mesenchymal stromal cells under
hypoxia. Int J Biol Sci, 2010. 6(5): p. 499-512.
208. Ma, T., et al., Hypoxia and stem cell-based engineering of mesenchymal tissues.
Biotechnol Prog, 2009. 25(1): p. 32-42.
209. Fink, T., et al., Induction of adipocyte-like phenotype in human mesenchymal
stem cells by hypoxia. Stem Cells, 2004. 22(7): p. 1346-55.
210. Valorani, M.G., et al., Hypoxia increases Sca-1/CD44 co-expression in murine
mesenchymal stem cells and enhances their adipogenic differentiation potential.
Cell Tissue Res, 2010. 341(1): p. 111-20.
211. Martin-Rendon, E., et al., Transcriptional profiling of human cord blood
CD133+ and cultured bone marrow mesenchymal stem cells in response to
hypoxia. Stem Cells, 2007. 25(4): p. 1003-12.
212. Haselgrove, J.C., I.M. Shapiro, and S.F. Silverton, Computer modeling of the
oxygen supply and demand of cells of the avian growth cartilage. Am J Physiol,
1993. 265(2 Pt 1): p. C497-506.
213. Grimshaw, M.J. and R.M. Mason, Bovine articular chondrocyte function in vitro
depends upon oxygen tension. Osteoarthritis Cartilage, 2000. 8(5): p. 386-92.
214. Markway, B.D., et al., Enhanced chondrogenic differentiation of human bone
marrow-derived mesenchymal stem cells in low oxygen environment micropellet
cultures. Cell Transplant, 2010. 19(1): p. 29-42.
215. Zscharnack, M., et al., Low oxygen expansion improves subsequent
chondrogenesis of ovine bone-marrow-derived mesenchymal stem cells in
collagen type I hydrogel. Cells Tissues Organs, 2009. 190(2): p. 81-93.