
Boutilier CEE 506 Project 2
14
Nonlinear PostBuckling Analysis of a 12,000 Gallon Transport Tank Ronald Boutilier CEE 506: Nonlinear Analysis of Structural Systems University of Washington June 9, 2016
-
Upload
ron-boutilier -
Category
Documents
-
view
48 -
download
0
Transcript of Boutilier CEE 506 Project 2
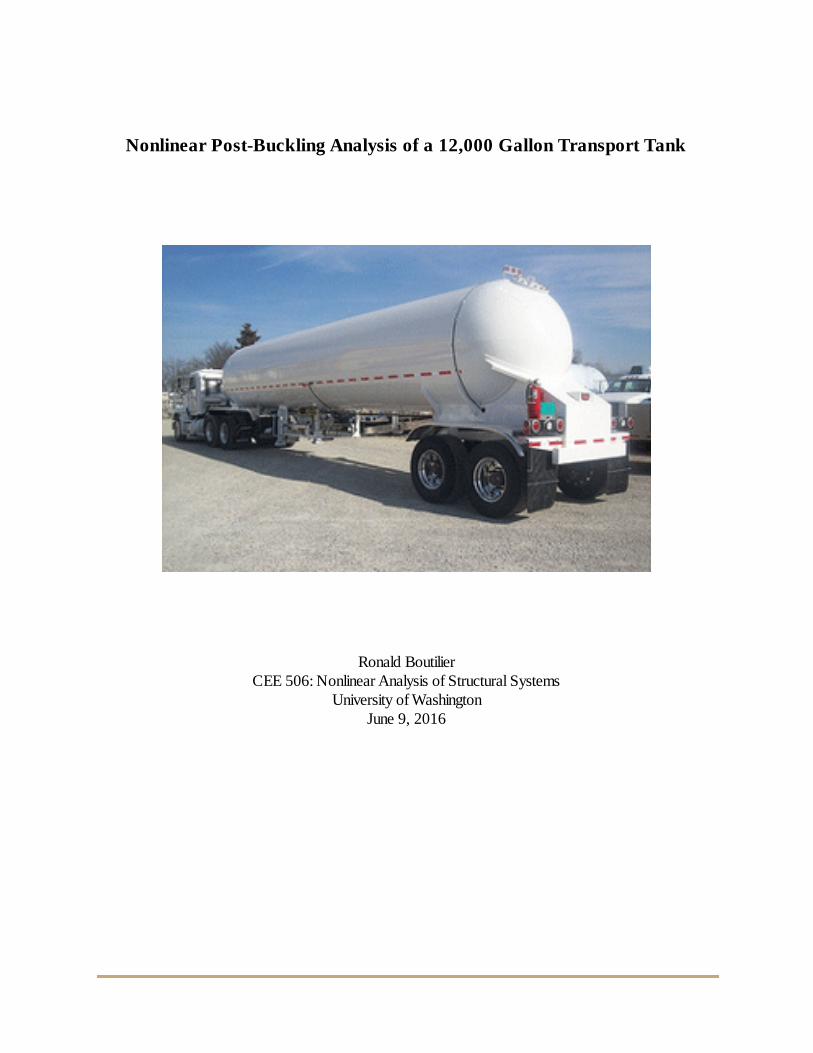
Nonlinear PostBuckling Analysis of a 12,000 Gallon Transport Tank
Ronald Boutilier CEE 506: Nonlinear Analysis of Structural Systems
University of Washington June 9, 2016
TABLE OF CONTENTS 1 Objectives of the Study…………….………………………...………………………………3
2 Development of the Analytical Model………………………………………...……………….3
2.1 Vessel Geometry………………………………………………………....…………….3
2.2 Materials………………………………………………………………...……………..4
2.3 Load and Boundary Conditions……………………………………….………………..4
3 Method of Analysis…………………………………………………………...………………4
3.1 Analysis Parameters………………………………………………..……………………4
3.2 Expected Elastic Behavior of Vessel Under Compressive Loading…………………….….5
3.3 Eigenvalue Analysis Procedure to Determine Critical Buckling…………………….……...6
3.4 Postbuckling Analysis Procedure………………………………………....……………..6
4 Results of the Finite Element Simulations……………………………………….……………...6
4.1 Results from the Eigenvalue Analysis………………………………....…………………..6
4.2 Results from the Postbuckling Analysis…………………………....…………………….7
4.2.1 Postbuckling of the Empty Vessel……………………………....…………………7
4.2.1.1 Simulation of the Model With 15993 Elements……………………….……..7
4.2.1.2 Simulation of the Model With 8853 Elements……………………….………8
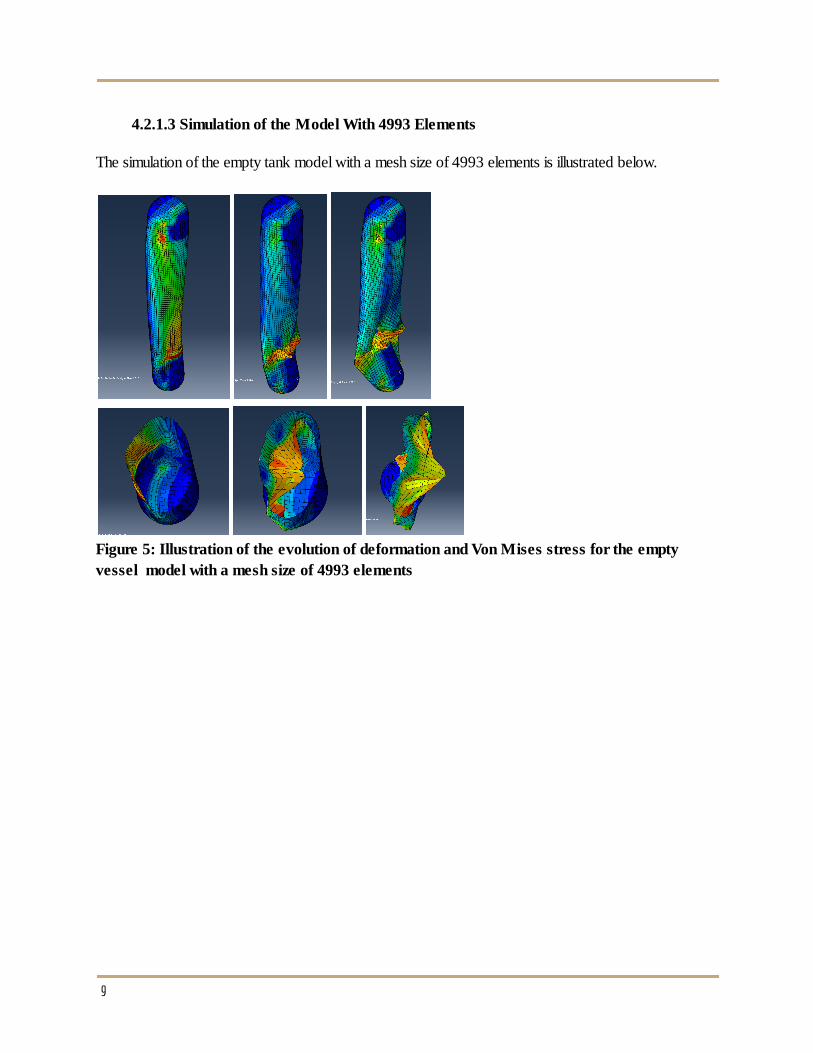
4.2.1.3 Simulation of the Model With 4993 Elements………………………..……...9
4.2.1.4 Mesh Refinement Comparison of Empty Vessel Models…………………...10
4.2.2 Postbuckling of the Vessel Under Normal Operating Conditions………………....10
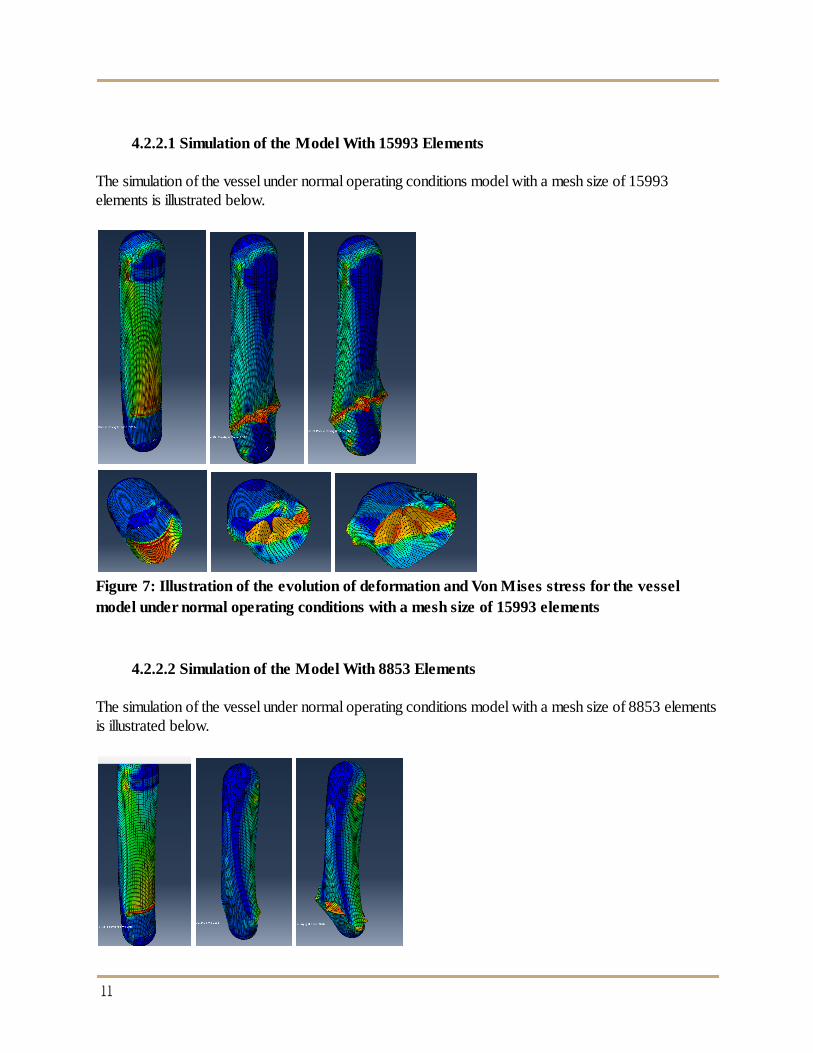
4.2.2.1 Simulation of the Model With 15993 Elements………………………….....11
4.2.2.2 Simulation of the Model With 8853 Elements…………………………..….11
4.2.2.3 Simulation of the Model with 4993 Elments…………………………….….12
4.2.2.4 Mesh Refinement Comparison of Empty Vessel Models…………………...13
5. Conclusions………………………………………………………………………….13
6. References…………………………………………………………………………...14
2
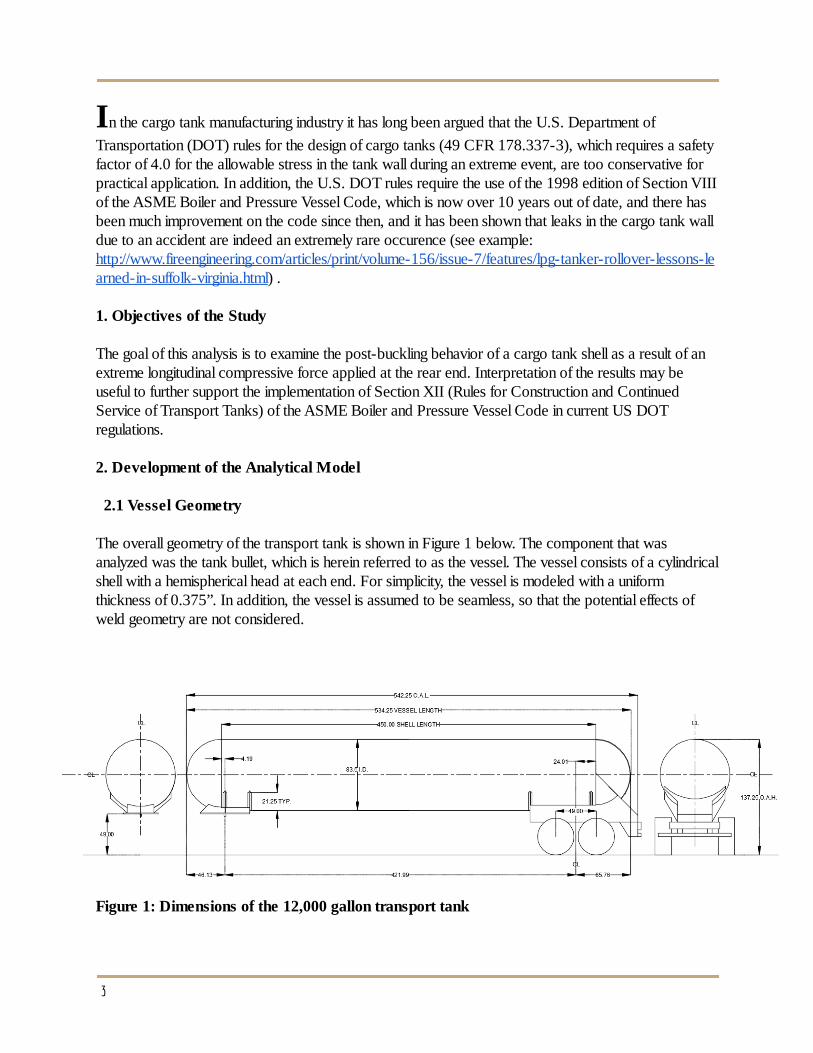
I n the cargo tank manufacturing industry it has long been argued that the U.S. Department of Transportation (DOT) rules for the design of cargo tanks (49 CFR 178.3373), which requires a safety factor of 4.0 for the allowable stress in the tank wall during an extreme event, are too conservative for practical application. In addition, the U.S. DOT rules require the use of the 1998 edition of Section VIII of the ASME Boiler and Pressure Vessel Code, which is now over 10 years out of date, and there has been much improvement on the code since then, and it has been shown that leaks in the cargo tank wall due to an accident are indeed an extremely rare occurence (see example: http://www.fireengineering.com/articles/print/volume156/issue7/features/lpgtankerrolloverlessonslearnedinsuffolkvirginia.html ) . 1. Objectives of the Study The goal of this analysis is to examine the postbuckling behavior of a cargo tank shell as a result of an extreme longitudinal compressive force applied at the rear end. Interpretation of the results may be useful to further support the implementation of Section XII (Rules for Construction and Continued Service of Transport Tanks) of the ASME Boiler and Pressure Vessel Code in current US DOT regulations. 2. Development of the Analytical Model 2.1 Vessel Geometry The overall geometry of the transport tank is shown in Figure 1 below. The component that was analyzed was the tank bullet, which is herein referred to as the vessel. The vessel consists of a cylindrical shell with a hemispherical head at each end. For simplicity, the vessel is modeled with a uniform thickness of 0.375”. In addition, the vessel is assumed to be seamless, so that the potential effects of weld geometry are not considered.
Figure 1: Dimensions of the 12,000 gallon transport tank
3
2.2 Materials The material used for construction of the vessel wall is ASME specification SA517 grade E. Data for the plastic behavior cannot be obtained, so for simplicity, data from typical ASTM A36 steel was extrapolated. The extrapolated plastic behavior is summarized below, and used to take into consideration the projected material nonlinearity of the system. Lastly, irregularities due to welding heataffected zone, quenching, tempering, and postweld heat treatment are not considered.
Yield Stress (psi) Inelastic Strain (in/in)
100,000 0
100,000 0.016
120,000 0.098
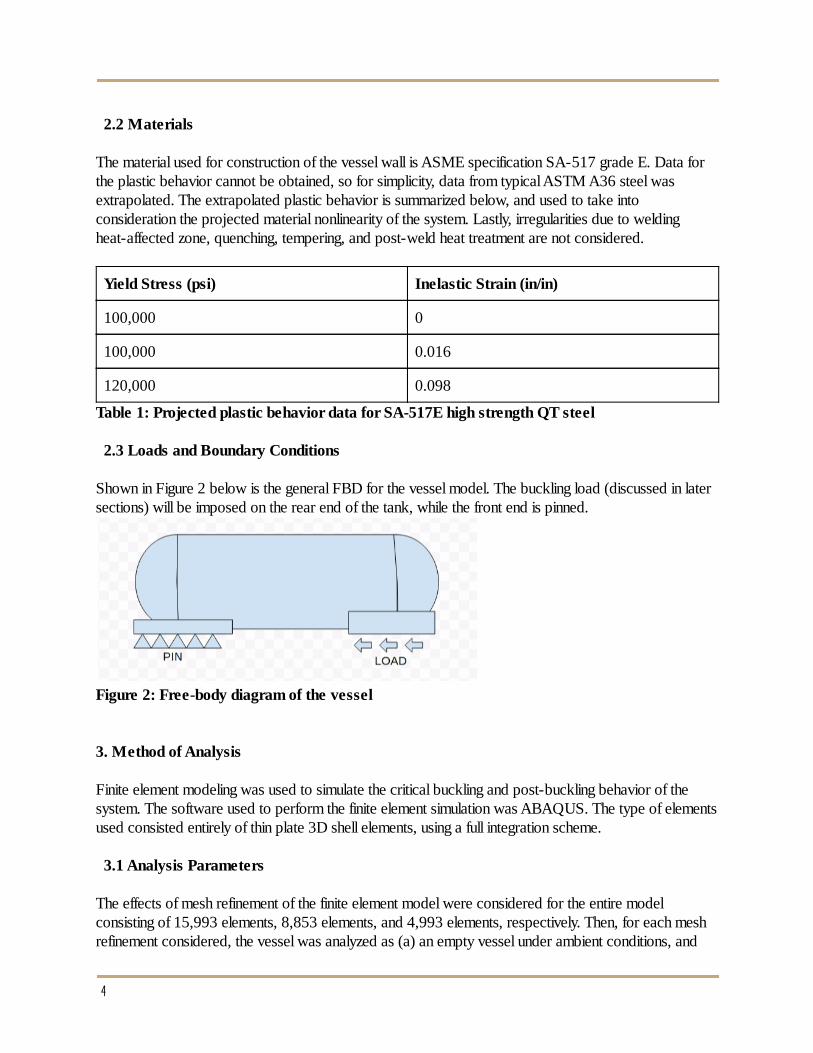
Table 1: Projected plastic behavior data for SA517E high strength QT steel 2.3 Loads and Boundary Conditions Shown in Figure 2 below is the general FBD for the vessel model. The buckling load (discussed in later sections) will be imposed on the rear end of the tank, while the front end is pinned.
Figure 2: Freebody diagram of the vessel 3. Method of Analysis Finite element modeling was used to simulate the critical buckling and postbuckling behavior of the system. The software used to perform the finite element simulation was ABAQUS. The type of elements used consisted entirely of thin plate 3D shell elements, using a full integration scheme. 3.1 Analysis Parameters The effects of mesh refinement of the finite element model were considered for the entire model consisting of 15,993 elements, 8,853 elements, and 4,993 elements, respectively. Then, for each mesh refinement considered, the vessel was analyzed as (a) an empty vessel under ambient conditions, and
4
(b) a fully loaded vessel under normal operating conditions. The definition of “normal operating conditions” is as follows:
1. Cargo tank internal pressure = 250 psi 2. Cargo tank loaded with liquefied petroleum gas (LPG) to 85% of nominal capacity
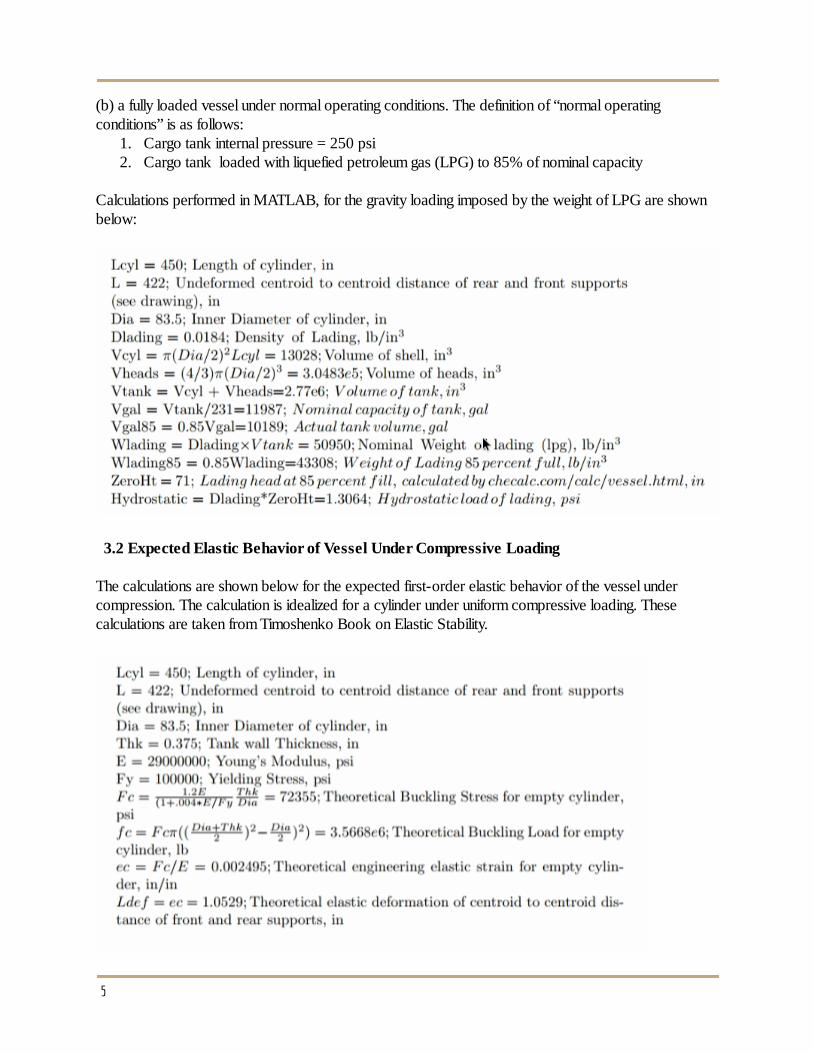
Calculations performed in MATLAB, for the gravity loading imposed by the weight of LPG are shown below:
3.2 Expected Elastic Behavior of Vessel Under Compressive Loading The calculations are shown below for the expected firstorder elastic behavior of the vessel under compression. The calculation is idealized for a cylinder under uniform compressive loading. These calculations are taken from Timoshenko Book on Elastic Stability.
5
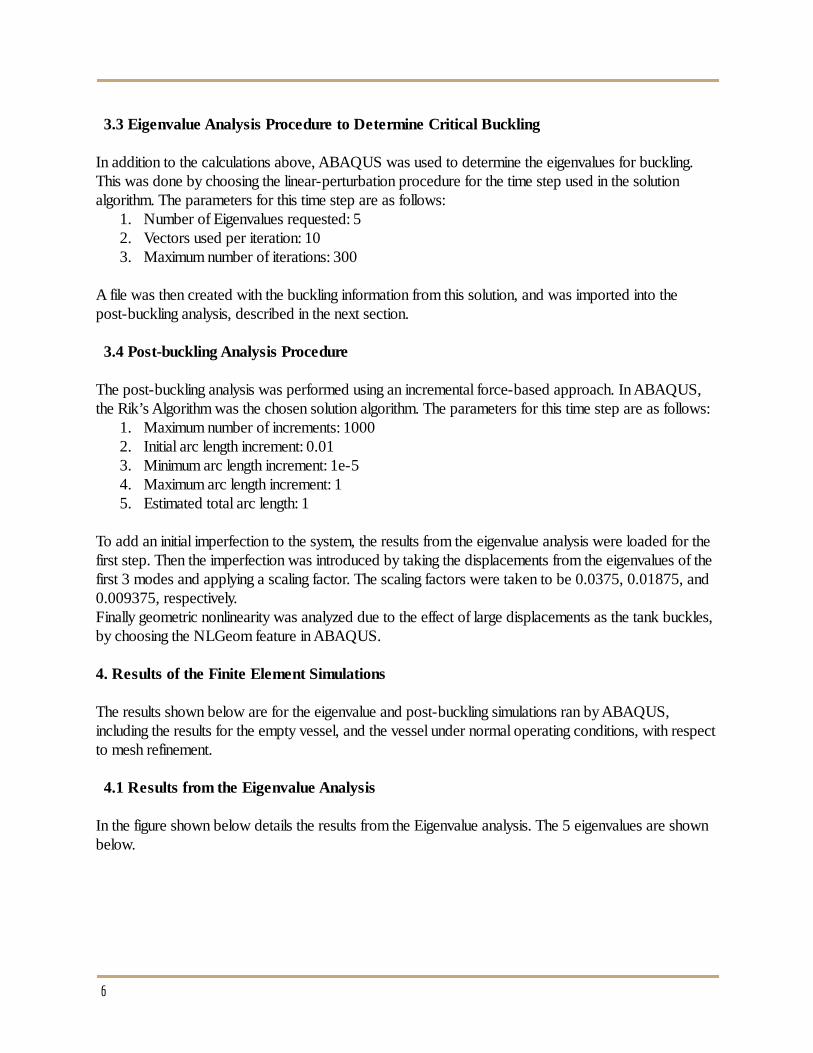
3.3 Eigenvalue Analysis Procedure to Determine Critical Buckling In addition to the calculations above, ABAQUS was used to determine the eigenvalues for buckling. This was done by choosing the linearperturbation procedure for the time step used in the solution algorithm. The parameters for this time step are as follows:
1. Number of Eigenvalues requested: 5 2. Vectors used per iteration: 10 3. Maximum number of iterations: 300
A file was then created with the buckling information from this solution, and was imported into the postbuckling analysis, described in the next section. 3.4 Postbuckling Analysis Procedure The postbuckling analysis was performed using an incremental forcebased approach. In ABAQUS, the Rik’s Algorithm was the chosen solution algorithm. The parameters for this time step are as follows:
1. Maximum number of increments: 1000 2. Initial arc length increment: 0.01 3. Minimum arc length increment: 1e5 4. Maximum arc length increment: 1 5. Estimated total arc length: 1
To add an initial imperfection to the system, the results from the eigenvalue analysis were loaded for the first step. Then the imperfection was introduced by taking the displacements from the eigenvalues of the first 3 modes and applying a scaling factor. The scaling factors were taken to be 0.0375, 0.01875, and 0.009375, respectively. Finally geometric nonlinearity was analyzed due to the effect of large displacements as the tank buckles, by choosing the NLGeom feature in ABAQUS. 4. Results of the Finite Element Simulations The results shown below are for the eigenvalue and postbuckling simulations ran by ABAQUS, including the results for the empty vessel, and the vessel under normal operating conditions, with respect to mesh refinement. 4.1 Results from the Eigenvalue Analysis In the figure shown below details the results from the Eigenvalue analysis. The 5 eigenvalues are shown below.
6
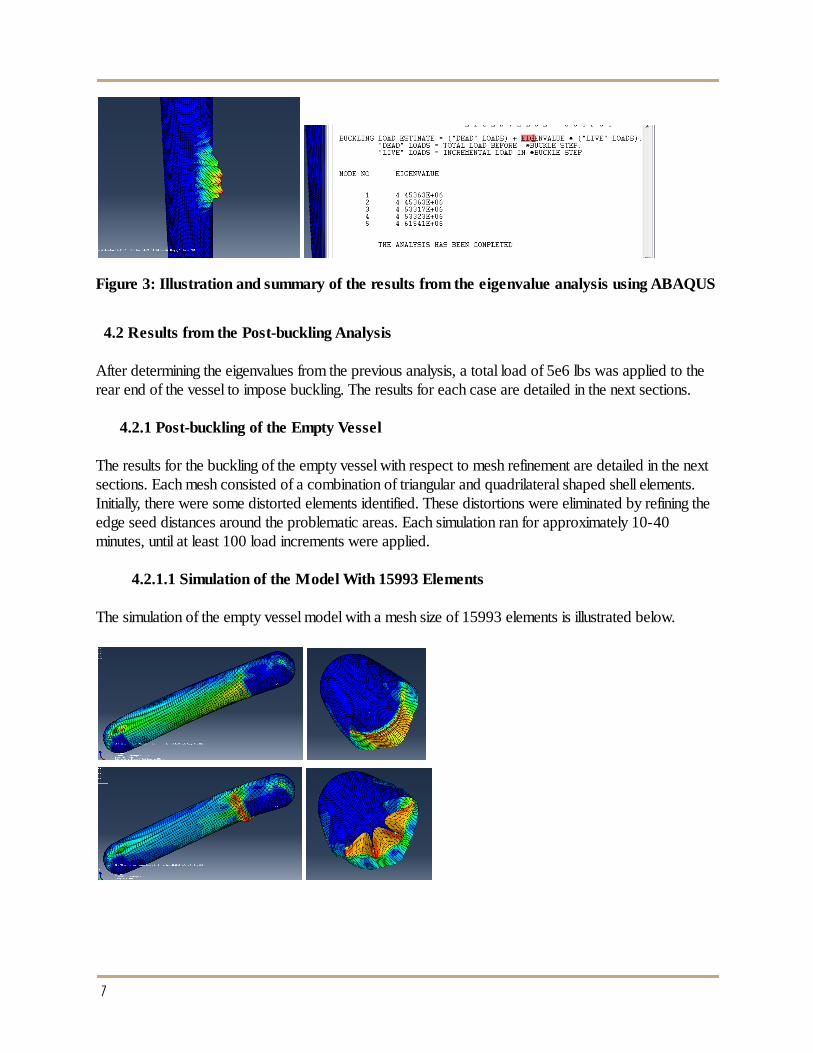
Figure 3: Illustration and summary of the results from the eigenvalue analysis using ABAQUS
4.2 Results from the Postbuckling Analysis After determining the eigenvalues from the previous analysis, a total load of 5e6 lbs was applied to the rear end of the vessel to impose buckling. The results for each case are detailed in the next sections.
4.2.1 Postbuckling of the Empty Vessel The results for the buckling of the empty vessel with respect to mesh refinement are detailed in the next sections. Each mesh consisted of a combination of triangular and quadrilateral shaped shell elements. Initially, there were some distorted elements identified. These distortions were eliminated by refining the edge seed distances around the problematic areas. Each simulation ran for approximately 1040 minutes, until at least 100 load increments were applied.
4.2.1.1 Simulation of the Model With 15993 Elements The simulation of the empty vessel model with a mesh size of 15993 elements is illustrated below.
7
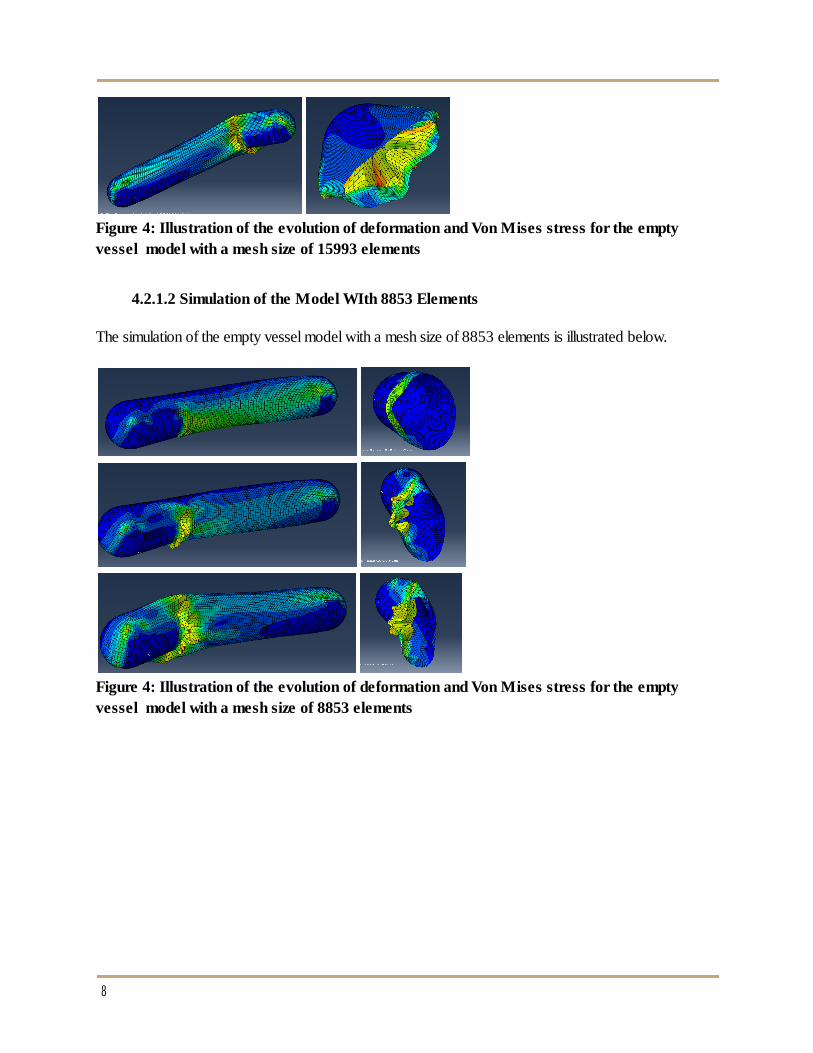
Figure 4: Illustration of the evolution of deformation and Von Mises stress for the empty vessel model with a mesh size of 15993 elements
4.2.1.2 Simulation of the Model WIth 8853 Elements
The simulation of the empty vessel model with a mesh size of 8853 elements is illustrated below.
Figure 4: Illustration of the evolution of deformation and Von Mises stress for the empty vessel model with a mesh size of 8853 elements
8
4.2.1.3 Simulation of the Model With 4993 Elements
The simulation of the empty tank model with a mesh size of 4993 elements is illustrated below.
Figure 5: Illustration of the evolution of deformation and Von Mises stress for the empty vessel model with a mesh size of 4993 elements
9
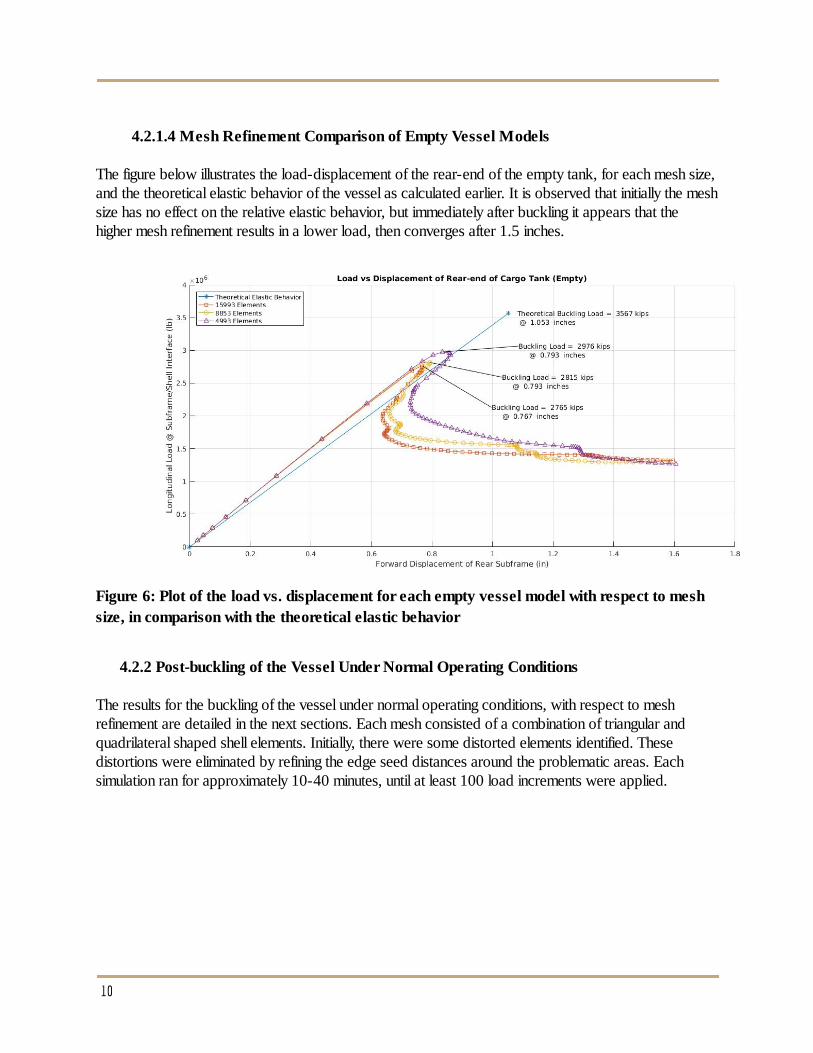
4.2.1.4 Mesh Refinement Comparison of Empty Vessel Models The figure below illustrates the loaddisplacement of the rearend of the empty tank, for each mesh size, and the theoretical elastic behavior of the vessel as calculated earlier. It is observed that initially the mesh size has no effect on the relative elastic behavior, but immediately after buckling it appears that the higher mesh refinement results in a lower load, then converges after 1.5 inches.
Figure 6: Plot of the load vs. displacement for each empty vessel model with respect to mesh size, in comparison with the theoretical elastic behavior
4.2.2 Postbuckling of the Vessel Under Normal Operating Conditions
The results for the buckling of the vessel under normal operating conditions, with respect to mesh refinement are detailed in the next sections. Each mesh consisted of a combination of triangular and quadrilateral shaped shell elements. Initially, there were some distorted elements identified. These distortions were eliminated by refining the edge seed distances around the problematic areas. Each simulation ran for approximately 1040 minutes, until at least 100 load increments were applied.
10
4.2.2.1 Simulation of the Model With 15993 Elements
The simulation of the vessel under normal operating conditions model with a mesh size of 15993 elements is illustrated below.
Figure 7: Illustration of the evolution of deformation and Von Mises stress for the vessel model under normal operating conditions with a mesh size of 15993 elements
4.2.2.2 Simulation of the Model With 8853 Elements
The simulation of the vessel under normal operating conditions model with a mesh size of 8853 elements is illustrated below.
11
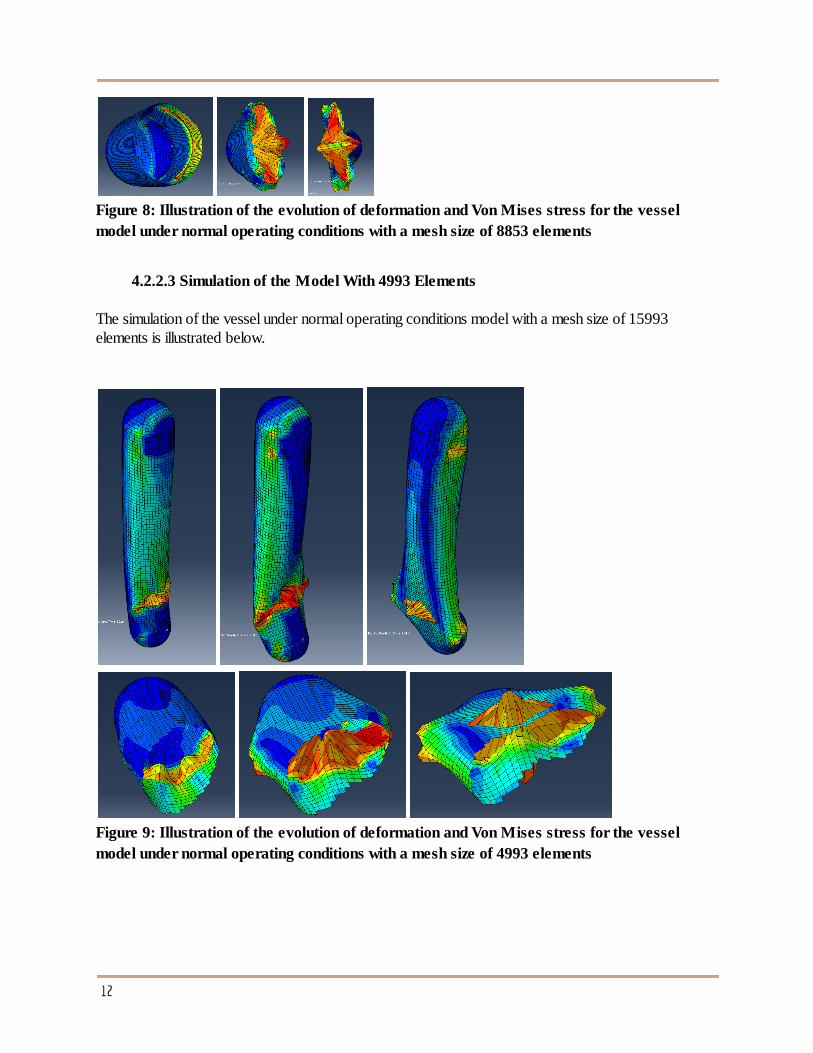
Figure 8: Illustration of the evolution of deformation and Von Mises stress for the vessel model under normal operating conditions with a mesh size of 8853 elements
4.2.2.3 Simulation of the Model With 4993 Elements
The simulation of the vessel under normal operating conditions model with a mesh size of 15993 elements is illustrated below.
Figure 9: Illustration of the evolution of deformation and Von Mises stress for the vessel model under normal operating conditions with a mesh size of 4993 elements
12
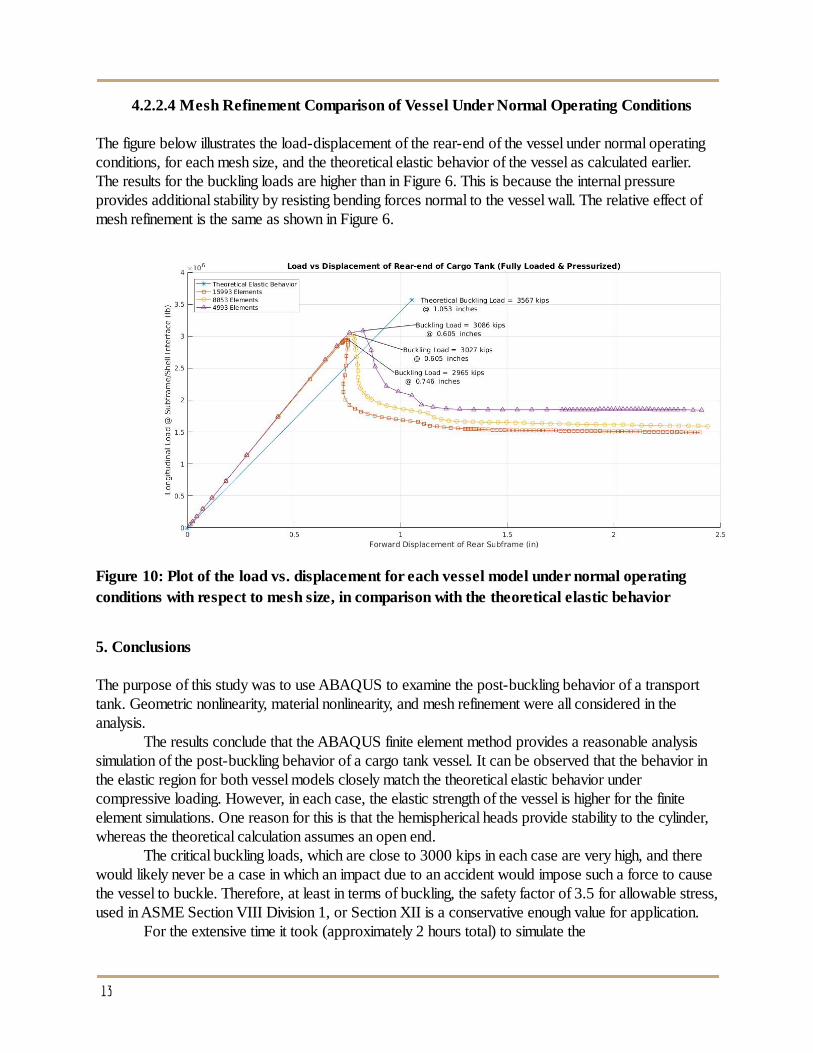
4.2.2.4 Mesh Refinement Comparison of Vessel Under Normal Operating Conditions The figure below illustrates the loaddisplacement of the rearend of the vessel under normal operating conditions, for each mesh size, and the theoretical elastic behavior of the vessel as calculated earlier. The results for the buckling loads are higher than in Figure 6. This is because the internal pressure provides additional stability by resisting bending forces normal to the vessel wall. The relative effect of mesh refinement is the same as shown in Figure 6.
Figure 10: Plot of the load vs. displacement for each vessel model under normal operating conditions with respect to mesh size, in comparison with the theoretical elastic behavior
5. Conclusions The purpose of this study was to use ABAQUS to examine the postbuckling behavior of a transport tank. Geometric nonlinearity, material nonlinearity, and mesh refinement were all considered in the analysis.
The results conclude that the ABAQUS finite element method provides a reasonable analysis simulation of the postbuckling behavior of a cargo tank vessel. It can be observed that the behavior in the elastic region for both vessel models closely match the theoretical elastic behavior under compressive loading. However, in each case, the elastic strength of the vessel is higher for the finite element simulations. One reason for this is that the hemispherical heads provide stability to the cylinder, whereas the theoretical calculation assumes an open end.
The critical buckling loads, which are close to 3000 kips in each case are very high, and there would likely never be a case in which an impact due to an accident would impose such a force to cause the vessel to buckle. Therefore, at least in terms of buckling, the safety factor of 3.5 for allowable stress, used in ASME Section VIII Division 1, or Section XII is a conservative enough value for application.
For the extensive time it took (approximately 2 hours total) to simulate the
13
buckling/postbuckling behavior of the vessel, it is probably not feasible to use the results for persuasion of the U.S. government to update its regulations, especially when they already continue to implement codes that are over 10 years out of date. Furthermore, buckling is only one aspect of vessel failure to be investigated. Finally, only the longitudinal direction of loading was examined. Loadings in the lateral and vertical directions should also be examined to compare with the load requirements in current regulations.
References: Goodman, Kent. "Buckling Stress Check for a Vertical Vessel." Www.maximumreach.com . Maximum
Reach Enterprises, 2 Nov. 2012. Web. 9 June 2016. <http://www.maximumreach.com/Buckling%20Stress%20Check.pdf>.
Haring, Raymond. "LPG Tanker Truck Rollover: Lessons Learned in Suffolk Virginia." Fireengineering.com . Fire Engineering, July 2003. Web. 9 June 2016. < http://www.fireengineering.com/articles/print/volume156/issue7/features/lpgtankerrolloverlessonslearnedinsuffolkvirginia.html >.
ASME Bolier and Pressure Vessel Code Section VIII US Code of Federal Regulations: Transportation, 49 CFR 178.3373, Design and Construction of MC
331 Cargo Tanks
14