Alvarez Herrera, Luis TFG
39
Facultad de Ciencias Económicas y Empresariales TRABAJO FIN DE GRADO GRADO EN ADMINISTRACIÓN Y DIRECCIÓN DE EMPRESAS Y ECONOMÍA INTERNACIONAL THE ENERGY BURDEN: THE DEPENDENCE ON ENERGY IMPORTS OF THE OECD COUNTRIES Luis Álvarez Herrera Pamplona-Iruña JUNE 2016 DIRECTOR María del Mar Rubio Varas
-
Upload
luis-alvarez-herrera -
Category
Documents
-
view
8 -
download
0
Transcript of Alvarez Herrera, Luis TFG
Facultad de Ciencias Económicas y Empresariales
TRABAJO FIN DE GRADO
GRADO EN ADMINISTRACIÓN Y DIRECCIÓN DE EMPRESAS Y
ECONOMÍA INTERNACIONAL
THE ENERGY BURDEN: THE DEPENDENCE ON ENERGY IMPORTS OF
THE OECD COUNTRIES
Luis Álvarez Herrera
Pamplona-Iruña
JUNE 2016
DIRECTOR
María del Mar Rubio Varas
ABSTRACT
In this bachelor’s thesis, we are going to analyse whether the ease of access to energy had
an impact on economic growth using a sample of the OECD member countries. We are
also going to make a comparative analysis of the situation of Spain and the rest of OECD
member countries. Data has been obtained from United Nations COMTRADE database
and Maddison Project database. We find strong evidence that countries with more
difficulties to access energy had a worse economic performance than those which have an
easier access. A panel model with random effects is done in order to test for net energy
imports coverage effect on GDP growth.
KEY WORDS
Energy, Energy Imports Coverage, OECD, Spain, Petroleum, Coal, Natural Gas,
Electricity.
INDEX
1. INTRODUCTION…………………………………………………………………...1
2. PREVIOUS LITERATURE AND OBJECTIVES…………………………………..3
3. THE DATABASE……………………………………………………………………6
4. DESCRIPTIVE ANALYSIS………………………………………………………..10
4.1. Spain……………………………………………………………………………11
4.2. OECD vs. SPAIN……………………………………………………………...18
5. DATA, MODEL AND EMPIRICAL RESULTS…………………………………...26
6. CONCLUSIONS……………………………………………………………………29
7. APPENDIX………………………………………………………………………....30
7.1 Appendix A……………………………………………………………………...30
7.2 Appendix B……………………………………………………………………...32
7.3 Appendix C……………………………………………………………………...33
8. REFERENCES……………………………………………………………………..34
LIST FIGURES AND TABLES
FIGURE 1 ENERGY EXPORTS/ TOTAL COMMODITIES EXPORTS (SPAIN 1962-2014)..….11
FIGURE 2 SPANISH ENERGY EXPORTS BASKET (1962-2014)……………………………......12
FIGURE 3 ENERGY IMPORTS / TOTAL COMMODITIES IMPORTS (SPAIN 1962-2014)…...13
FIGURE 4 SPANISH ENERGY IMPORTS BASKET (1962-2014)………………………………..14
FIGURE 5 WORLD'S OIL PRODUCTION AND PRICES……………………………………….15
FIGURE 6 NET ENERGY IMPORTS / NET COMMODITIES IMPORTS (SPAIN, 1962-2014) .16
FIGURE 7 ENERGETIC IMPORTER EFFORT (SPAIN, 1962-2014)……………………………16
FIGURE 8 ENERGY IMPORTS COVERAGE (SPAIN, 1962-2014)……………………………....17
FIGURE 9 ENERGY EXPORTS / TOTAL COMMODITIES EXPORTS (SPAIN VS. OECD
1962-2014) …….…………………………………………………………………………………………..20
FIGURE 10 OECD CRUDE OIL PRODUCTION AND PRICES…………………………………21
FIGURE 11 ENERGY IMPORTS / TOTAL COMMODITIES IMPORTS (SPAIN VS. OECD 1962-
2014)……………………………………………………………………………………………………….22
FIGURE 12 ENERGETIC IMPORTER EFFORT (SPAIN vs. OECD 1962-2014)……………...….24
FIGURE 13 ENERGY IMPORTS COVERAGE SPAIN vs. OECD averages (1962-2014)……..…...26
TABLE 1 THE 5 LARGEST OECD EXPORTERS OF ENERGY SUPPLIES …………………19
TABLE 2 THE 5 SMALLER OECD EXPORTERS OF ENERGY SUPPLIES…………………..19
TABLE 3 SPAIN'S FOREIGN TRADE IN 1961 AND IN 1970 (IN US $ MILLION)…………..20
TABLE 4 THE 5 LARGEST OECD IMPORTERS OF ENERGY SUPPLIES…………………..21
TABLE 5 THE 5 SMALLER OECD IMPORTERS OF ENERGY SUPPLIES……………...........22
TABLE 6 EMPIRICAL RESULTS…………………………………………….……………...........28
Page 1 of 35
1. INTRODUCTION
The choice of this topic comes from the interest developed during the collaboration grant
provided by the Public University of Navarre. During several months I have been working
in the Economics Department, particularly in topics related with Energy Economics.
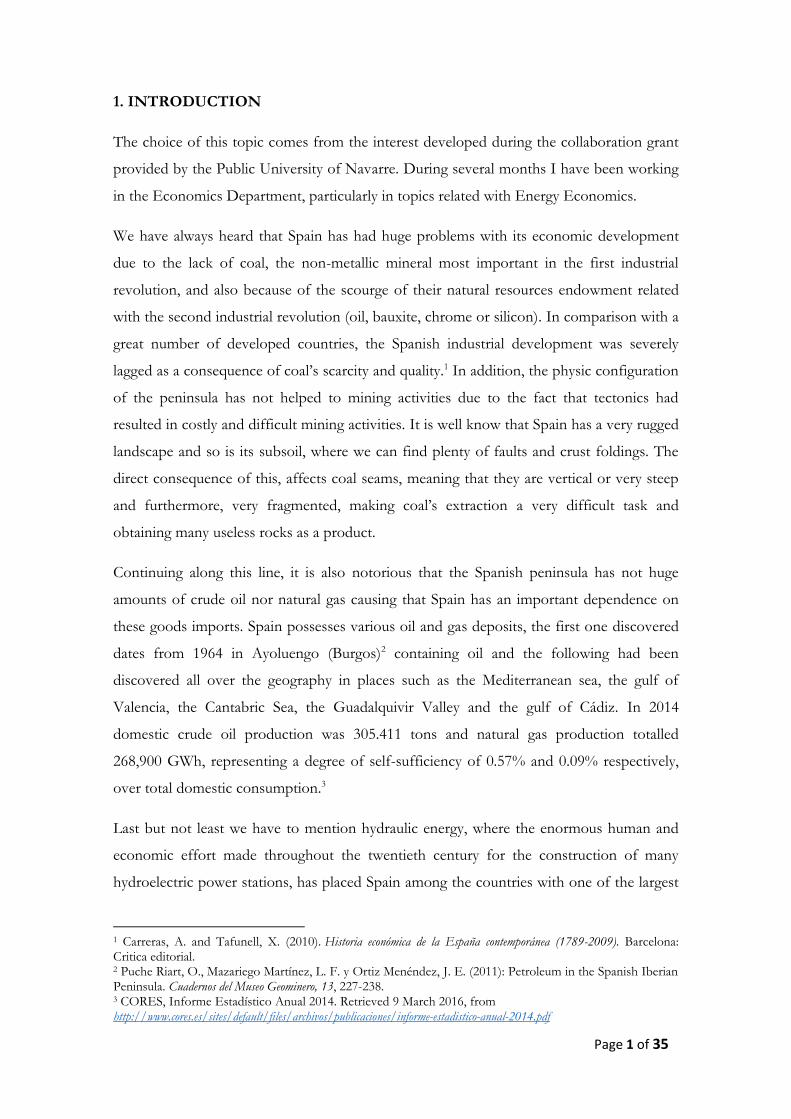
We have always heard that Spain has had huge problems with its economic development
due to the lack of coal, the non-metallic mineral most important in the first industrial
revolution, and also because of the scourge of their natural resources endowment related
with the second industrial revolution (oil, bauxite, chrome or silicon). In comparison with a
great number of developed countries, the Spanish industrial development was severely
lagged as a consequence of coal’s scarcity and quality.1 In addition, the physic configuration
of the peninsula has not helped to mining activities due to the fact that tectonics had
resulted in costly and difficult mining activities. It is well know that Spain has a very rugged
landscape and so is its subsoil, where we can find plenty of faults and crust foldings. The
direct consequence of this, affects coal seams, meaning that they are vertical or very steep
and furthermore, very fragmented, making coal’s extraction a very difficult task and
obtaining many useless rocks as a product.
Continuing along this line, it is also notorious that the Spanish peninsula has not huge
amounts of crude oil nor natural gas causing that Spain has an important dependence on
these goods imports. Spain possesses various oil and gas deposits, the first one discovered
dates from 1964 in Ayoluengo (Burgos)2 containing oil and the following had been
discovered all over the geography in places such as the Mediterranean sea, the gulf of
Valencia, the Cantabric Sea, the Guadalquivir Valley and the gulf of Cádiz. In 2014
domestic crude oil production was 305.411 tons and natural gas production totalled
268,900 GWh, representing a degree of self-sufficiency of 0.57% and 0.09% respectively,
over total domestic consumption.3
Last but not least we have to mention hydraulic energy, where the enormous human and
economic effort made throughout the twentieth century for the construction of many
hydroelectric power stations, has placed Spain among the countries with one of the largest
1 Carreras, A. and Tafunell, X. (2010). Historia económica de la España contemporánea (1789-2009). Barcelona: Critica editorial. 2 Puche Riart, O., Mazariego Martínez, L. F. y Ortiz Menéndez, J. E. (2011): Petroleum in the Spanish Iberian Peninsula. Cuadernos del Museo Geominero, 13, 227-238. 3 CORES, Informe Estadístico Anual 2014. Retrieved 9 March 2016, from http://www.cores.es/sites/default/files/archivos/publicaciones/informe-estadistico-anual-2014.pdf
Page 2 of 35
hydroelectric parks in the world. Only large nations such as the United States or Canada, or
very mountainous countries with large water resources such as Brazil account with larger
hydroelectric parks than Spain. The production of hydroelectricity still has a significant role
in the total electricity production and it should be considered as a strategic sector the
country since it has to import most of the energy products that it consumes. However, the
development of this potential currently faces major limitations: firstly because the
construction of new hydroelectric plants of medium or large size comes increasingly into
conflict with other important alternative uses of water and soil, and secondly because much
of the potential sites are located in difficult places or involve making complex and costly
civil works which considerably increase the cost per kWh produced.4
The direct consequence of this small energetic natural resources endowment has been
reflected in the fact that the greatest part of the energy supplies has had to be imported.
Causing the consequent limiting effects on the capability to import other goods. The main
objective of this work, is through a comparison of the Organization for Economic
Cooperation and Development member countries, from now onwards OECD, analyse
whether the energy burden that has faced Spain has been something exclusive of the
country. Moreover, we have always been told that energy supply has been, for long periods
of our history, a drag on economic growth and that it has had a negative impact on the
competitiveness of companies and, in some cases, has hampered the functioning of the
national economy.5 This project will also try to discover the consequences of being an
exporter or importer of energy and in the case of those importers analyse whether its
impact is as severe as we have been always been told.
The rest of the study is structured as follows. In section 2 there is a brief revision of
previous literature and a description of the main objectives of this bachelor’s thesis. In
section 3 we have the presentation of the database. In section 4 we have a descriptive
analysis of the results we Spain is analysed and then a comparison between the OECD and
Spain is established. In section 5 we use a random-effects model in order to test the
relationship between net energy imports coverage and GDP growth. Finally in section 6 we
comment the main conclusions of this study.
4 Espejo Marín, C. and García Marín, R. (2010). Agua y energía: producción hidroeléctrica en España. INGEO, 51, pp.107-129. 5 Sudriá, C (1997). “La restricción energética al desarrollo económico de España”, Papeles de Economía Española, p. 165-188.
Page 3 of 35
2. PREVIOUS LITERATURE AND OBJECTIVES
Mankind has always aimed to increase the quantity and quality of goods and services
consumed. With a very long-term view, the evolution of humanity could be based on a
search for mechanisms in order to access greater energy consumption that lead to this
increase in quality and quantity of goods and services consumed. This means that energy
plays a vital role in an economy affecting both the demand and supply. On the demand
side, it is one product that consumers decide to purchase in order to maximise their utility
and on the supply side, it is a key factor that combined with labour, capital and materials,
affects the socio-economic development of a country by increasing economic growth and
living standards.6
The literature about this topic starts with John Nef, he was the first historian that pointed
out energy as the main trigger of the industrial revolution. According to him, the industrial
revolution was a long-term path that started at the end of the 16th century in Great Britain
with a transition from woodcutting to coal mining and then was spread and strengthened
during the next two centuries.7 The main cause for this event was that Great Britain ran out
of wood8, resulting in the adoption of a new fuel, in this case coal, aspect that allowed the
earlier revolution of the British economy, changing its history, the European and later on
the history of the whole World.
Carlo Cipolla, another great economic historian that also covered the topic, stated that two
great revolutions took place in the human’s history and that both of them were correlated
with deep changes in energy availability. The first one consisted in the transformation into
farmers and herdsmen of those that previously were hunters and gatherers. The second
one made, those farmers and herdsmen, became the operators of “mechanical slaves” fed
with inanimate energy. 9 The main reason behind this shift into operators of “mechanical
slaves” was the movement from wood to coal that took place between 1550 and 1770,
allowing the development of new manufacturing methods and industries as well as the
expansion of the existing ones. As John Nef, Cipolla also recognized that this movement
was motivated by the shortage caused by excessive cutting of firewood for metallurgy,
6 Chontanawat, J. (2006). Causality between Energy Consumption and GDP: Evidence from 30 OECD and 78 Non-OECD Countries. 7 Nef, J. (1932). The rise of the British coal industry. London: G. Routledge. 8 Nef, J. (1977). An Early Energy Crisis and its Consequences. Sci Am, 237(5), 140-151. 9 Cipolla, C. (1978). Historia económica de la población mundial. Barcelona: Crítica.
Page 4 of 35
which required intensive energy use and faced the high melting point of iron leading
England to replace wood for coal.
During the recent years, the interest on energy and its correlation with the transition from
the old to the modern economy has been growing and growing. Its importance has been
acknowledged as the key trigger of the divergence between Western Europe and the rest of
the world during the 19th century and main cause of the European success. The causal
relation between energy consumption and GDP has become into a well-studied topic by
economists and policymakers and there exist a great number of studies covering the field.
Some seek to answer if energy consumption is a stimulus for economic growth while
others analyse whether economic growth is a stimulus for energy consumption. The reason
behind this large number of investigations resides into the fact that the direction of
causality has significant policy implications. In the case that energy consumption is a key
component in economic growth, those policies that aim to reduce energy consumption
may harm real GDP, however, if the causality runs from economic growth to energy
consumption the effect of these policies has little or no negative effect on economic
growth.10 Unfortunately the results obtained varied across countries and even across time
periods for the same countries.11
Into the literature we can find four different views covering this relationship between
energy and economy:12
Growth hypothesis
Unidirectional causality from energy consumption to economic growth. It implies the
energy dependence of economies and also that no or limited access to energy supply can
limit economic growth.
Conservative hypothesis
Unidirectional causality from economic growth to energy consumption. It suggests that
energy conservation policies will have no adverse effect on economic growth. The
hypothesis is reinforced if an increase in GDP leads to an increase in energy consumption.
10 Eggoh, J., Bangake, C., & Rault, C. (2011). Energy consumption and economic growth revisited in African countries. Energy Policy, 39(11), 7408-7421. 11 Soytas, U., & Sari, R. (2003). Energy consumption and GDP: causality relationship in G-7 countries and emerging markets. Energy Economics, 25(1), 33-37. 12 Yildirim, E., & Aslan, A. (2012). Energy consumption and economic growth nexus for 17 highly developed OECD countries: Further evidence based on bootstrap-corrected causality tests. Energy Policy, 51, 985-993.
Page 5 of 35
Feedback hypothesis
Bidirectional causal relation between economic growth and energy consumption, implying
a mutual and complementary relationship between both variables.
Neutrality hypothesis
This view argues that there is no causal relation between economic growth and energy
consumption. Both variables are neutral with respect to each other.
In what refers to OECD countries all four hypotheses have been evidenced. Soytas and
Sari13 (2003) defend the growth hypothesis in one study covering Turkey, France, Japan
and Germany. On the other hand, Lee14 (2006) and Lise and Van Montford15 (2007) defend
the conservative hypothesis for Japan and Turkey respectively. Cserekley, Rubio-Varas and
Stern16 (2016) are also in favour of the conservative hypothesis since, in their study for 99
countries covering the period 1971 to 2010, they concluded that in the absence of
economic growth there are no improvements in energy intensity on average. Bartleet and
Gounder17 (2010) and Belke, Dobnik and Dreger18 (2011) found evidence of the feedback
hypothesis in their studies covering New Zealand and 25 OECD countries respectively.
Last but not least, Menegaki19 (2011) found no evidence of causality between the two
variables in her study for 27 European countries.
The review of the literature covering this topic finds, in general, a strong causal relationship
between energy consumption and economic growth but is inconclusive about the direction
of the causality and the magnitude of its impact. That is the reason why the purpose of this
project is to introduce a different view by looking at energy supplies imports and exports in
order to prove these hypothesis relating economy and energy. We are going to analyse the
relationship from a different angle which is not so much about the amount of energy
13 Soytas, U., & Sari, R. (2003). Energy consumption and GDP: causality relationship in G-7 countries and emerging markets. Energy Economics, 25(1), 33-37. 14 Lee, C. (2006). The causality relationship between energy consumption and GDP in G-11 countries revisited. Energy Policy, 34(9), 1086-1093. 15 Lise, W., & Van Montfort, K. (2007). Energy consumption and GDP in Turkey: Is there a co‐integration relationship?. Energy Economics, 29(6), 1166-1178. 16 Csereklyei, Z., Rubio-Varas, M., & Stern, D. (2016). Energy and Economic Growth: The Stylized Facts. EJ, 37(2). 17 Bartleet, M., & Gounder, R. (2010). Energy consumption and economic growth in New Zealand: Results of trivariate and multivariate models. Energy Policy, 38(7), 3508-3517. 18 Belke, A., Dobnik, F., & Dreger, C. (2011). Energy consumption and economic growth: New insights into the cointegration relationship. Energy Economics, 33(5), 782-789. 19 Menegaki, A. (2011). Growth and renewable energy in Europe: A random effect model with evidence for neutrality hypothesis. Energy Economics, 33(2), 257-263.
Page 6 of 35
consumption and its relationship with economic growth but rather a more indirect
approach. In this project we will try to answer the question of whether the ease of access to
energy had any impact on economic growth. The hypothesis that we have are going to test
is if countries with more difficulties to access energy, because they have to import it, had a
worse economic performance than those countries which have an easier access. This easier
access can be determined by the fact that they are energy producers or because the effort
that they have to realize in order to import energy is small in relation with their export and
import capacity.
3. THE DATABASE
In order to have a diversified list of countries we have decided to use the Organisation for
Economic Co-operation and Development (OECD) member countries. This decision was adopted
due to the fact that this list offers a varied number of countries that span the globe, from
Europe and Asia-Pacific to North and South America. They include many of the most
advanced countries, but at the same time emerging ones; which make possible to find both
energy importers and exporters and also some countries which were first energy exporters
and nowadays act as net importers.
As of 12th March 2016, the OECD had the following 34 members20:
20 List of OECD Member countries - Ratification of the Convention on the OECD - OECD. (2016). Oecd.org. Retrieved 12 March 2016, from http://www.oecd.org/about/membersandpartners/list-oecd-member-countries.htm
Page 7 of 35
1. AUSTRALIA
2. AUSTRIA
3. BELGIUM
4. CANADA
5. CHILE
6. CZECH REPUBLIC
7. DENMARK
8. ESTONIA
9. FINLAND
10. FRANCE
11. GERMANY
12. GREECE
13. HUNGARY
14. ICELAND
15. IRELAND
16. ISRAEL
17. ITALY
18. JAPAN
19. LUXEMBOURG
20. MEXICO
21. NETHERLANDS
22. NEW ZEALAND
23. NORWAY
24. POLAND
25. PORTUGAL
26. SLOVAKIA
27. SLOVENIA
28. SOUTH KOREA
29. SPAIN
30. SWEDEN
31. SWITZERLAND
32. TURKEY
33. UNITED
KINGDOM
34. UNITED STATES
This research uses United Nations COMTRADE database, on an annual frequency of
OECD countries trade balances related to coal, coke and briquettes imports and exports;
petroleum and petroleum products imports and exports; gas, natural and manufactured
imports and exports and finally, electric energy imports and exports. The classification of
goods used is the Standard International Trade Classification (SITC21), which was
developed by the United Nations so that traded goods can be classified not only on the
basis of their material and physical properties, but at the same time according to their stage
of processing and their economics functions which helps realizing economic analysis.
The documents downloaded show for every country the value, on current USD ($), of all
the exported commodities, the exported coal, coke and briquettes, the exported gas both
natural and manufactured, the exported electric energy and the exported petroleum and
petroleum products. Moreover, the database also provides information, on current USD
($), of all the imported commodities, the imported coal, coke and briquettes, the imported
gas both natural and manufactured, the imported electric energy and the imported
petroleum and petroleum products.
The time series studied covered the last 50 years of these 34 OECD member countries
(1962 to 2014) due to the fact that this repository of official trade statistics contain
information starting from 1962. However, we have to take into account several aspects of
21 The categories used were: 32- Coal, coke and briquettes; 33- Petroleum and petroleum products; 34- Gas, natural and manufactured; 35- Electric Energy. The database can be accessed in the following webpage: http://comtrade.un.org/data/
Page 8 of 35
the selected countries that make impossible to have data for the whole time period studied.
These are the following: 22
Belgium and Luxembourg reported the information together until 1999.
The Czech Republic and Slovakia were part of Czechoslovakia until the 1st January
1993, when the state peacefully dissolute into the Czech Republic and Slovakia. We
have data for the Czech Republic starting from 1993 and from 1994 for Slovakia.
Estonia was part of the Soviet Union until the regaining of its independence in
1991, we have data available for this country starting in 1995.
Germany was divided into the German Federal Republic and the Russian-
dominated German Democratic Republic since 1949 until 1989 when both
territories were reunified forming Germany again. We have data available for the
Federal Republic of Germany between 1962 and 1990, and between 1985 and 1990
for the Democratic one, the database of Germany starts from 1991.
Poland was invaded in 1939 by both Germany and Soviet Union and became a
communist dictatorship under Russian domination. In 1980 emerged the non-
communist trade union Solidarity that achieved the downfall of communism in
1989. The data available in the United Nations database dates from 1984 on.
Slovenia became part of the communist Republic of Yugoslavia in 1945 and was
not proclaimed independent until 1991 after a referendum in 1990. The database
starts from 1992.
Once the files were downloaded and converted into excel, we have calculated several
variables:
Total value of the exported energy supplies: This variable quantifies all the exported energy
supplies and in order to obtain it, by adding the values of the different kind of
energy carriers exported for every country and year.
Total value of the imported energy supplies: This variable quantifies all the imported
energy supplies and in order to obtain it, adding the value in dollars of the different
kind of energies imported for every year and country.
Net energy imports: I have obtained this variable by subtracting for every country and
year the total value of the exported energy supplies to the total value of the
imported energy supplies, when the value obtained is positive it means that the
22 Slomp, H. and Slomp, H. (2011). Europe, a political profile (pp.357-574). Santa Barbara, Calif.: ABC-CLIO.
Page 9 of 35
country was an net importer of energy and if the value is negative value it means
that the country was a net exporter of energy.
Energetic importer effort: This variable is calculated by dividing the total value of the
imported energy supplies by the value of total imports. It measures the cost of
importing energy in comparison with the cost of all imported goods and it is
expressed as a percentage.
Energy imports coverage: This variable represents which percentage of total exports are
equivalent to the total value of the imported energy supplies. In order to calculate it
we have divided the total value of the imported energy supplies by the value of total
exports. It is one of the most useful variables since it going to an answer the
question how much of the hard earned currency obtained by exporting goods go to
paying for the energy imports.
We have used other variables that have allowed me to establish comparisons and at the
same time provide more information, since the data was showing values on current USD
($) and there are significant differences between the volumes of imports and exports of the
countries selected for this study. These are:
Weighted Average
Due to the different sizes among OECD countries and their different volumes of energy
imports and exports, we have used this average measure in which each country received a
weight according to their energy exports or energy imports over the total energy exports or
imports realized by the OECD during each year. These weightings inform about the
importance of each country on the average.
Imports
𝑊𝑒𝑖𝑔ℎ𝑡 𝐶𝑜𝑢𝑛𝑡𝑟𝑦𝑖 𝑦𝑒𝑎𝑟 𝑥 =𝐶𝑜𝑢𝑛𝑡𝑟𝑦𝑖 𝑒𝑛𝑒𝑟𝑔𝑦 𝑖𝑚𝑝𝑜𝑟𝑡𝑠 𝑦𝑒𝑎𝑟 𝑥
∑ 𝐶𝑜𝑢𝑛𝑡𝑟𝑦𝑖 𝑒𝑛𝑒𝑟𝑔𝑦 𝑖𝑚𝑝𝑜𝑟𝑡𝑠 𝑦𝑒𝑎𝑟 𝑥37𝑖=1
𝐸𝑛𝑒𝑟𝑔𝑦 𝑖𝑚𝑝𝑜𝑟𝑡𝑠 𝑤𝑒𝑖𝑔ℎ𝑡𝑒𝑑 𝑎𝑣𝑒𝑟𝑎𝑔𝑒 𝑦𝑒𝑎𝑟 𝑥
= ∑(𝐶𝑜𝑢𝑛𝑡𝑟𝑦𝑖
37
𝑖=1
𝑖𝑚𝑝𝑜𝑟𝑡𝑠 𝑦𝑒𝑎𝑟 𝑥 × 𝑊𝑒𝑖𝑔ℎ𝑡 𝐶𝑜𝑢𝑛𝑡𝑟𝑦𝑖 𝑦𝑒𝑎𝑟 𝑥
Exports
𝑊𝑒𝑖𝑔ℎ𝑡 𝐶𝑜𝑢𝑛𝑡𝑟𝑦𝑖 𝑦𝑒𝑎𝑟 𝑥 =𝐶𝑜𝑢𝑛𝑡𝑟𝑦𝑖 𝑒𝑛𝑒𝑟𝑔𝑦 𝑒𝑥𝑝𝑜𝑟𝑡𝑠 𝑦𝑒𝑎𝑟 𝑥
∑ 𝐶𝑜𝑢𝑛𝑡𝑟𝑦𝑖 𝑒𝑛𝑒𝑟𝑔𝑦 𝑒𝑥𝑝𝑜𝑟𝑡𝑠 𝑦𝑒𝑎𝑟 𝑥37𝑖=1
Page 10 of 35
𝐸𝑛𝑒𝑟𝑔𝑦 𝑒𝑥𝑝𝑜𝑟𝑡𝑠 𝑤𝑒𝑖𝑔ℎ𝑡𝑒𝑑 𝑎𝑣𝑒𝑟𝑎𝑔𝑒 𝑦𝑒𝑎𝑟 𝑥
= ∑(𝐶𝑜𝑢𝑛𝑡𝑟𝑦𝑖
37
𝑖=1
𝑒𝑥𝑝𝑜𝑟𝑡𝑠 𝑦𝑒𝑎𝑟 𝑥 × 𝑊𝑒𝑖𝑔ℎ𝑡 𝐶𝑜𝑢𝑛𝑡𝑟𝑦𝑖 𝑦𝑒𝑎𝑟 𝑥
Energy exports over total exports
In order to provide more useful information than the Total value of the exported energy supplies
we have divided this variable by the Total value of the exported commodities in order to see what
percentage of total exported commodities were energy exports.
Energy imports over total imports
In order to provide a more suitable information than the Total value of the imported energy
supplies we have divided this variable by the Total value of the imported commodities in order to
see what proportion of total imported commodities were represented by energy imports.
Net energy imports over total imports
In order to provide more suitable information than the Net Energy Imports we have divided
this variable by the Net Commodities Imports in order to see what proportion of total net
commodities imports were represented by net energy imports.
Imports basket composition and Exports basket composition
These baskets show the relative share of each of the different energy sources in the total
value of the imported or exported energy supplies. These baskets are calculated by dividing
the total value of each of the imported or exported energy supplies (petroleum and
petroleum products, natural and manufactured gas, coal, coke and briquettes and electric
energy) by the respectively sum of all the imported or exported energy supplies.
4. Descriptive Analysis
We would like to analyse the results in two different steps. Firstly by analysing everything
concerning Spain so that we can develop an idea about how the country has acted during
the period studied and secondly, by comparing Spain with the OECD member countries so
that we can discover the similarities and differences among the Mediterranean country and
the different members of the organization.
4.1 Spain
Page 11 of 35
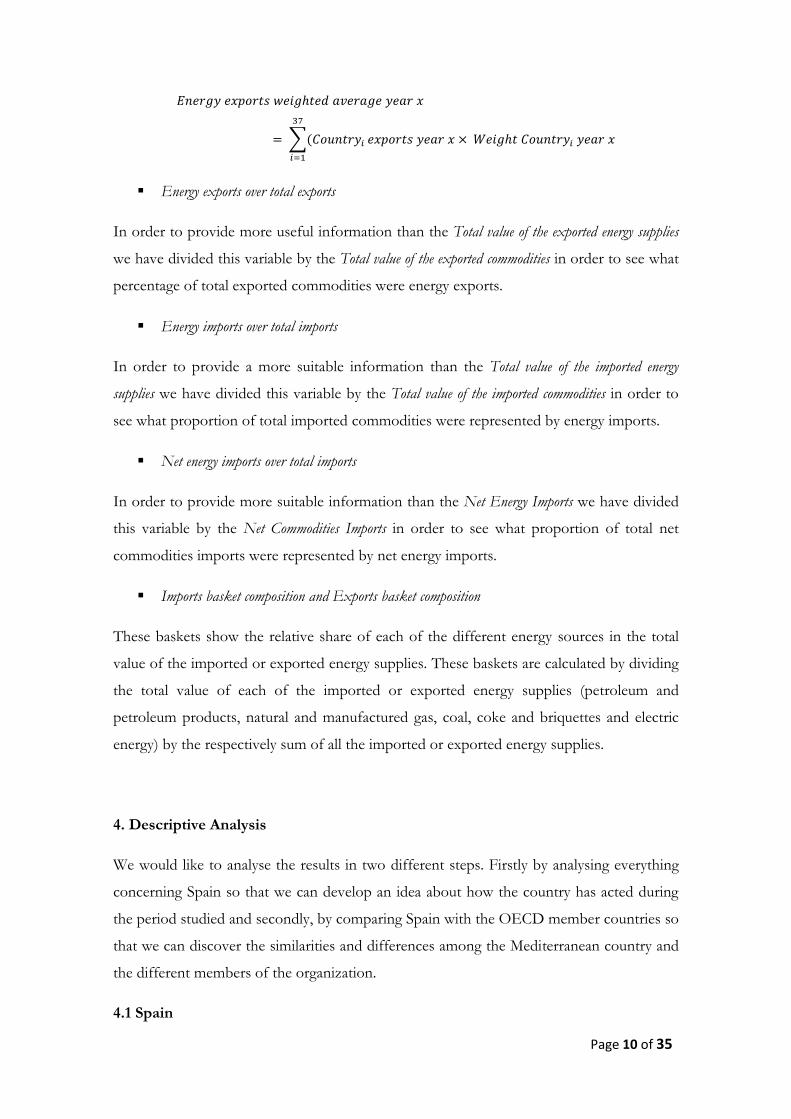
Exported energy supplies
During the period covered (1962-2014), Spain has exported energy supplies for a total
amount of $215.355.673.718, which means that the country exported $4.063.314.598
energy supplies per year on average. Energy exports have represented about 4.44% on
average over Spanish total exports, being 1985 the year with the greatest weight when they
represented 8.12% of total exports. On the other hand, in 1995 energy exports only
represented 1.6% of total exports.
Fig.1 Source: Own compilation from COMTRADE database
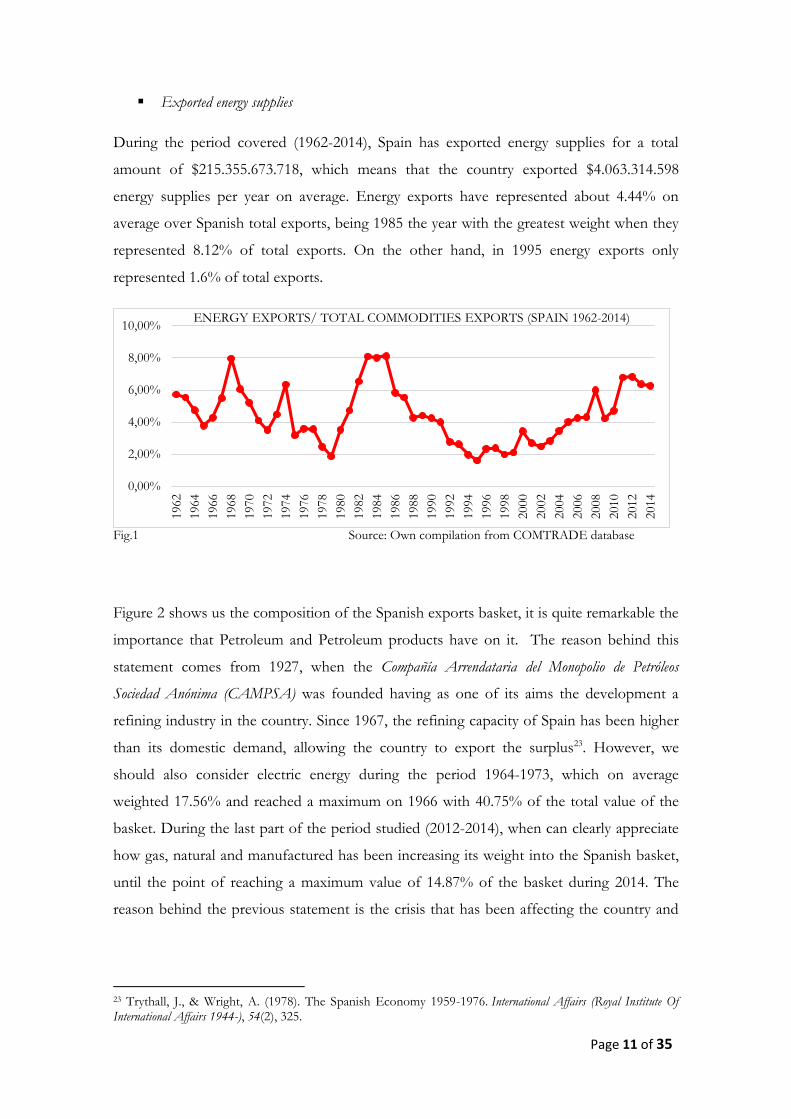
Figure 2 shows us the composition of the Spanish exports basket, it is quite remarkable the
importance that Petroleum and Petroleum products have on it. The reason behind this
statement comes from 1927, when the Compañía Arrendataria del Monopolio de Petróleos
Sociedad Anónima (CAMPSA) was founded having as one of its aims the development a
refining industry in the country. Since 1967, the refining capacity of Spain has been higher
than its domestic demand, allowing the country to export the surplus23. However, we
should also consider electric energy during the period 1964-1973, which on average
weighted 17.56% and reached a maximum on 1966 with 40.75% of the total value of the
basket. During the last part of the period studied (2012-2014), when can clearly appreciate
how gas, natural and manufactured has been increasing its weight into the Spanish basket,
until the point of reaching a maximum value of 14.87% of the basket during 2014. The
reason behind the previous statement is the crisis that has been affecting the country and
23 Trythall, J., & Wright, A. (1978). The Spanish Economy 1959-1976. International Affairs (Royal Institute Of International Affairs 1944-), 54(2), 325.
0,00%
2,00%
4,00%
6,00%
8,00%
10,00%
1962
1964
1966
1968
1970
1972
1974
1976
1978
1980
1982
1984
1986
1988
1990
1992
1994
1996
1998
2000
2002
2004
2006
2008
2010
2012
2014
ENERGY EXPORTS/ TOTAL COMMODITIES EXPORTS (SPAIN 1962-2014)
Page 12 of 35
that has diminished domestic demand of these resources24. However, electric and gas
companies are obliged to continue buying liquid natural gas (LNG) volumes under their
long-term contracts. The solution has been to re-export of LNG to Premium destinations,
such as Asia and South America.25
Fig. 2 Source: Own compilation from COMTRADE database
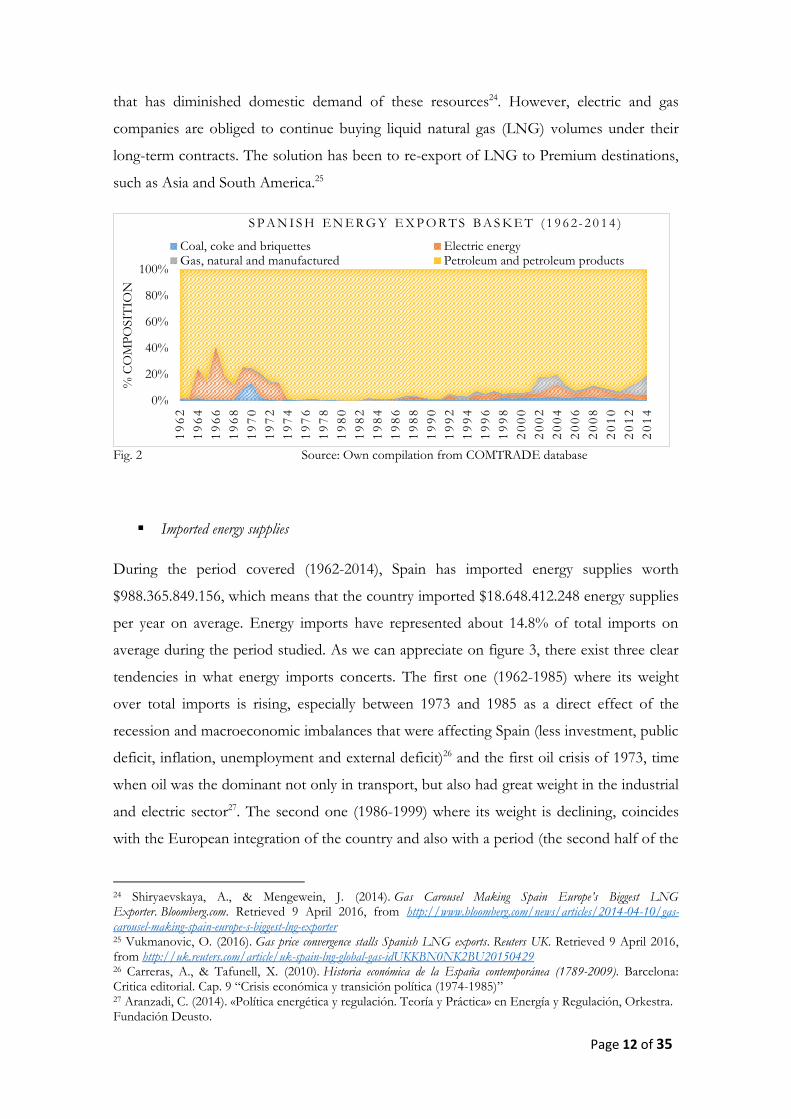
Imported energy supplies
During the period covered (1962-2014), Spain has imported energy supplies worth
$988.365.849.156, which means that the country imported $18.648.412.248 energy supplies
per year on average. Energy imports have represented about 14.8% of total imports on
average during the period studied. As we can appreciate on figure 3, there exist three clear
tendencies in what energy imports concerts. The first one (1962-1985) where its weight
over total imports is rising, especially between 1973 and 1985 as a direct effect of the
recession and macroeconomic imbalances that were affecting Spain (less investment, public
deficit, inflation, unemployment and external deficit)26 and the first oil crisis of 1973, time
when oil was the dominant not only in transport, but also had great weight in the industrial
and electric sector27. The second one (1986-1999) where its weight is declining, coincides
with the European integration of the country and also with a period (the second half of the
24 Shiryaevskaya, A., & Mengewein, J. (2014). Gas Carousel Making Spain Europe’s Biggest LNG Exporter. Bloomberg.com. Retrieved 9 April 2016, from http://www.bloomberg.com/news/articles/2014-04-10/gas-carousel-making-spain-europe-s-biggest-lng-exporter 25 Vukmanovic, O. (2016). Gas price convergence stalls Spanish LNG exports. Reuters UK. Retrieved 9 April 2016, from http://uk.reuters.com/article/uk-spain-lng-global-gas-idUKKBN0NK2BU20150429 26 Carreras, A., & Tafunell, X. (2010). Historia económica de la España contemporánea (1789-2009). Barcelona: Critica editorial. Cap. 9 “Crisis económica y transición política (1974-1985)” 27 Aranzadi, C. (2014). «Política energética y regulación. Teoría y Práctica» en Energía y Regulación, Orkestra. Fundación Deusto.
0%
20%
40%
60%
80%
100%
19
62
19
64
19
66
19
68
19
70
19
72
19
74
19
76
19
78
19
80
19
82
19
84
19
86
19
88
19
90
19
92
19
94
19
96
19
98
20
00
20
02
20
04
20
06
20
08
20
10
20
12
20
14
% C
OM
PO
SIT
ION
S P A N I S H E N E R G Y E X P O R T S B A S K E T ( 1 9 6 2- 2 0 1 4 )
Coal, coke and briquettes Electric energyGas, natural and manufactured Petroleum and petroleum products
Page 13 of 35
1980s) where Spain enjoyed the strongest growth among OECD countries, both in terms
of production and employment generation. Perhaps this entrance into the European Union
hides the negative effect of the European monetary crisis of 1992-1993 since no peak is
observed in the figure 3 during that period. Finally we have the third tendency where
energy imports weight over total commodities imports is rising again, coinciding with the
arrival of the euro, the third oil shock and the global financial crisis. The maximum weight
was achieved in 1981 when energy imports represented 29.83% of the Spanish total
imports of commodities during that year.
Fig.3 Source: Own compilation from COMTRADE database
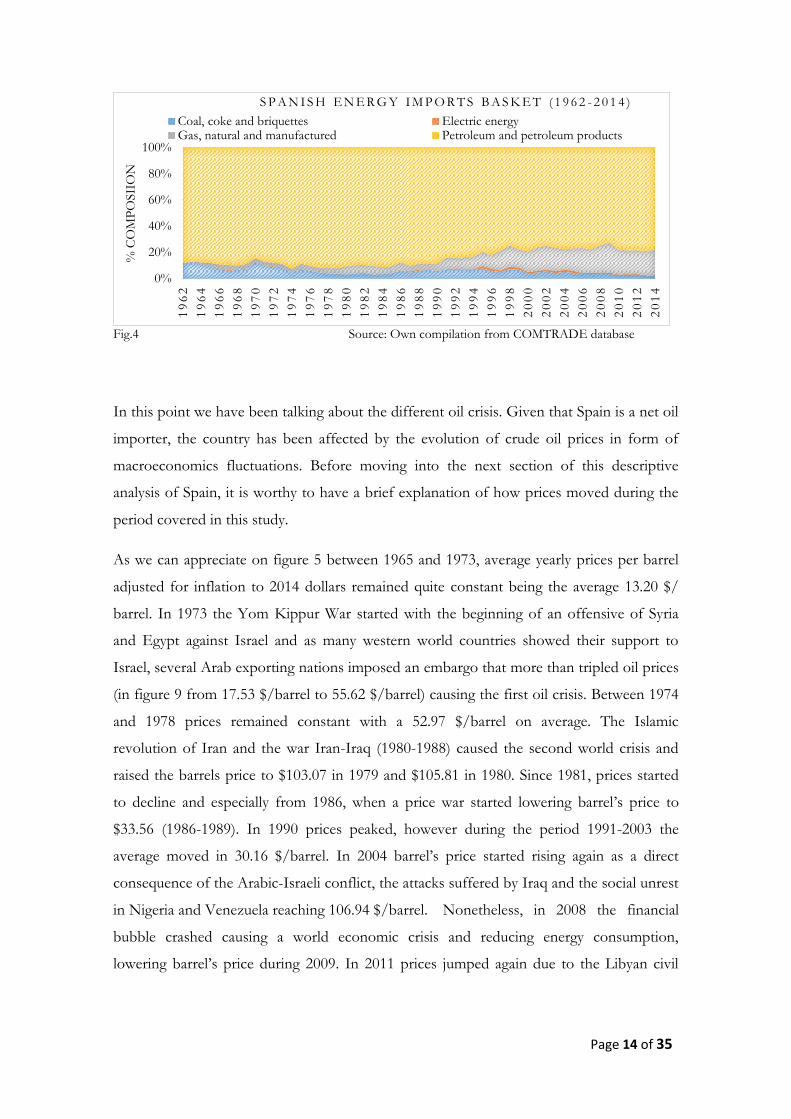
As it was in the Spanish exports basket, it is quite notable the importance that petroleum
and petroleum products had on the imports basket. The maximum weight achieved by
petroleum and petroleum products was 92.47% and it corresponds to the year 1974.
Nevertheless, we should also consider coal, coke and briquettes that during the first third
of the period analysed had been present amounting an 8% on average of the total value of
the imports basket (1962-1979). Nonetheless, since 1979, gas, natural and manufactured
has been rising its importance amounting 12.59% of the weight of the basket, on average,
during the last two thirds of the period (1979-2014).
0,00%
5,00%
10,00%
15,00%
20,00%
25,00%
30,00%
1962
1964
1966
1968
1970
1972
1974
1976
1978
1980
1982
1984
1986
1988
1990
1992
1994
1996
1998
2000
2002
2004
2006
2008
2010
2012
2014
ENERGY IMPORTS / TOTAL COMMODITIES IMPORTS (SPAIN 1962-2014)
Page 14 of 35
Fig.4 Source: Own compilation from COMTRADE database
In this point we have been talking about the different oil crisis. Given that Spain is a net oil
importer, the country has been affected by the evolution of crude oil prices in form of
macroeconomics fluctuations. Before moving into the next section of this descriptive
analysis of Spain, it is worthy to have a brief explanation of how prices moved during the
period covered in this study.
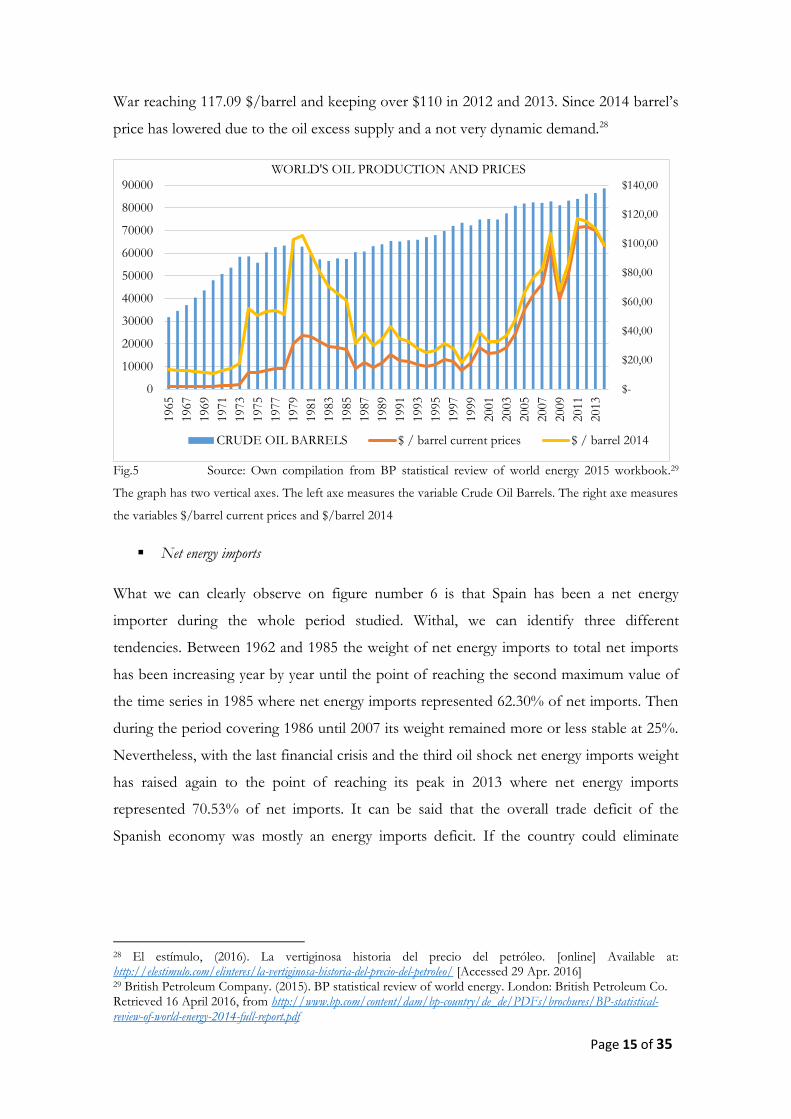
As we can appreciate on figure 5 between 1965 and 1973, average yearly prices per barrel
adjusted for inflation to 2014 dollars remained quite constant being the average 13.20 $/
barrel. In 1973 the Yom Kippur War started with the beginning of an offensive of Syria
and Egypt against Israel and as many western world countries showed their support to
Israel, several Arab exporting nations imposed an embargo that more than tripled oil prices
(in figure 9 from 17.53 $/barrel to 55.62 $/barrel) causing the first oil crisis. Between 1974
and 1978 prices remained constant with a 52.97 $/barrel on average. The Islamic
revolution of Iran and the war Iran-Iraq (1980-1988) caused the second world crisis and
raised the barrels price to $103.07 in 1979 and $105.81 in 1980. Since 1981, prices started
to decline and especially from 1986, when a price war started lowering barrel’s price to
$33.56 (1986-1989). In 1990 prices peaked, however during the period 1991-2003 the
average moved in 30.16 $/barrel. In 2004 barrel’s price started rising again as a direct
consequence of the Arabic-Israeli conflict, the attacks suffered by Iraq and the social unrest
in Nigeria and Venezuela reaching 106.94 $/barrel. Nonetheless, in 2008 the financial
bubble crashed causing a world economic crisis and reducing energy consumption,
lowering barrel’s price during 2009. In 2011 prices jumped again due to the Libyan civil
0%
20%
40%
60%
80%
100%
19
62
19
64
19
66
19
68
19
70
19
72
19
74
19
76
19
78
19
80
19
82
19
84
19
86
19
88
19
90
19
92
19
94
19
96
19
98
20
00
20
02
20
04
20
06
20
08
20
10
20
12
20
14
% C
OM
PO
SII
ON
S P A N I S H E N E R G Y I M P O R T S B A S K E T ( 1 9 6 2 - 2 0 1 4 )
Coal, coke and briquettes Electric energyGas, natural and manufactured Petroleum and petroleum products
Page 15 of 35
War reaching 117.09 $/barrel and keeping over $110 in 2012 and 2013. Since 2014 barrel’s
price has lowered due to the oil excess supply and a not very dynamic demand.28
Fig.5 Source: Own compilation from BP statistical review of world energy 2015 workbook.29
The graph has two vertical axes. The left axe measures the variable Crude Oil Barrels. The right axe measures
the variables $/barrel current prices and $/barrel 2014
Net energy imports
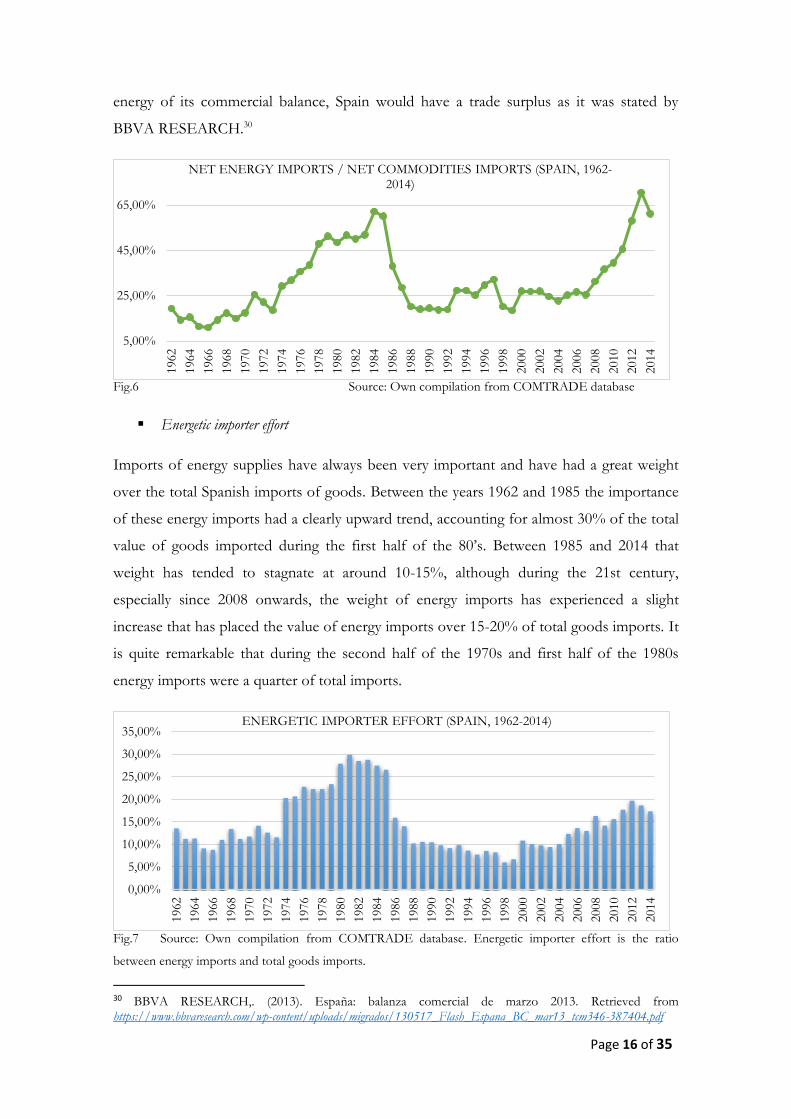
What we can clearly observe on figure number 6 is that Spain has been a net energy
importer during the whole period studied. Withal, we can identify three different
tendencies. Between 1962 and 1985 the weight of net energy imports to total net imports
has been increasing year by year until the point of reaching the second maximum value of
the time series in 1985 where net energy imports represented 62.30% of net imports. Then
during the period covering 1986 until 2007 its weight remained more or less stable at 25%.
Nevertheless, with the last financial crisis and the third oil shock net energy imports weight
has raised again to the point of reaching its peak in 2013 where net energy imports
represented 70.53% of net imports. It can be said that the overall trade deficit of the
Spanish economy was mostly an energy imports deficit. If the country could eliminate
28 El estímulo, (2016). La vertiginosa historia del precio del petróleo. [online] Available at: http://elestimulo.com/elinteres/la-vertiginosa-historia-del-precio-del-petroleo/ [Accessed 29 Apr. 2016] 29 British Petroleum Company. (2015). BP statistical review of world energy. London: British Petroleum Co. Retrieved 16 April 2016, from http://www.bp.com/content/dam/bp-country/de_de/PDFs/brochures/BP-statistical-review-of-world-energy-2014-full-report.pdf
$-
$20,00
$40,00
$60,00
$80,00
$100,00
$120,00
$140,00
0
10000
20000
30000
40000
50000
60000
70000
80000
90000
1965
1967
1969
1971
1973
1975
1977
1979
1981
1983
1985
1987
1989
1991
1993
1995
1997
1999
2001
2003
2005
2007
2009
2011
2013
WORLD'S OIL PRODUCTION AND PRICES
CRUDE OIL BARRELS $ / barrel current prices $ / barrel 2014
Page 16 of 35
energy of its commercial balance, Spain would have a trade surplus as it was stated by
BBVA RESEARCH.30
Fig.6 Source: Own compilation from COMTRADE database
Energetic importer effort
Imports of energy supplies have always been very important and have had a great weight
over the total Spanish imports of goods. Between the years 1962 and 1985 the importance
of these energy imports had a clearly upward trend, accounting for almost 30% of the total
value of goods imported during the first half of the 80’s. Between 1985 and 2014 that
weight has tended to stagnate at around 10-15%, although during the 21st century,
especially since 2008 onwards, the weight of energy imports has experienced a slight
increase that has placed the value of energy imports over 15-20% of total goods imports. It
is quite remarkable that during the second half of the 1970s and first half of the 1980s
energy imports were a quarter of total imports.
Fig.7 Source: Own compilation from COMTRADE database. Energetic importer effort is the ratio
between energy imports and total goods imports.
30 BBVA RESEARCH,. (2013). España: balanza comercial de marzo 2013. Retrieved from https://www.bbvaresearch.com/wp-content/uploads/migrados/130517_Flash_Espana_BC_mar13_tcm346-387404.pdf
5,00%
25,00%
45,00%
65,00%
1962
1964
1966
1968
1970
1972
1974
1976
1978
1980
1982
1984
1986
1988
1990
1992
1994
1996
1998
2000
2002
2004
2006
2008
2010
2012
2014
NET ENERGY IMPORTS / NET COMMODITIES IMPORTS (SPAIN, 1962-2014)
0,00%
5,00%
10,00%
15,00%
20,00%
25,00%
30,00%
35,00%
1962
1964
1966
1968
1970
1972
1974
1976
1978
1980
1982
1984
1986
1988
1990
1992
1994
1996
1998
2000
2002
2004
2006
2008
2010
2012
2014
ENERGETIC IMPORTER EFFORT (SPAIN, 1962-2014)
Page 17 of 35
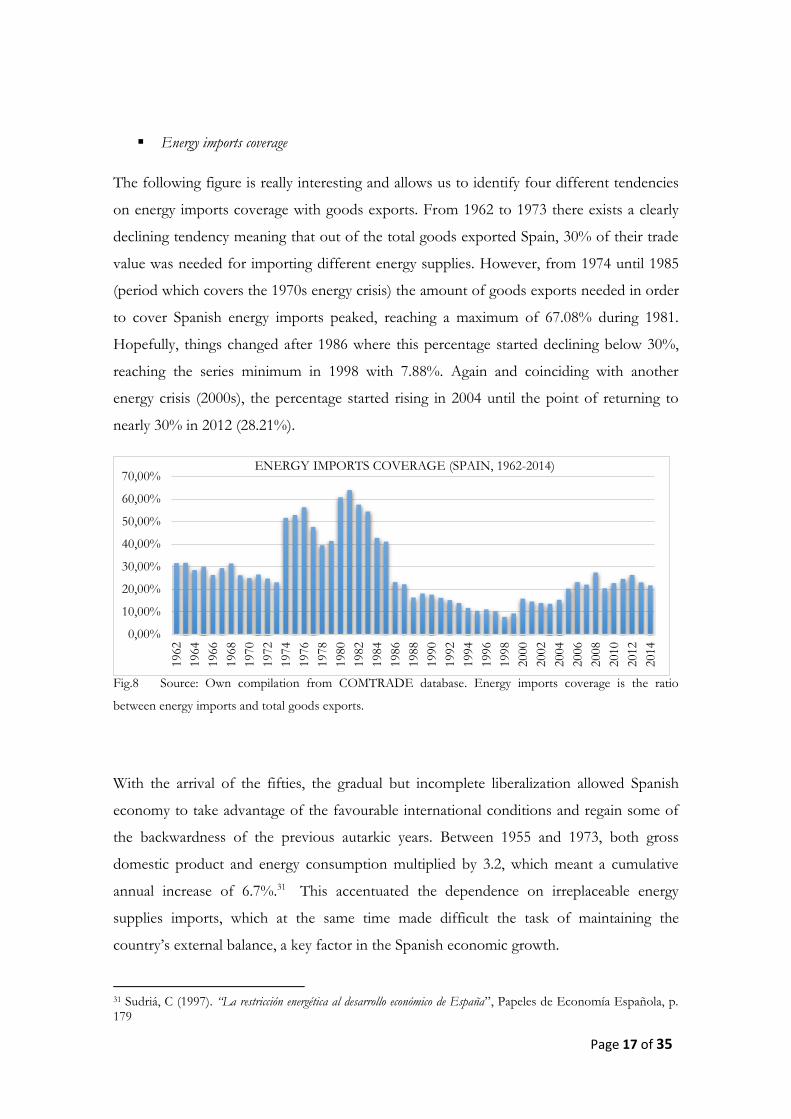
Energy imports coverage
The following figure is really interesting and allows us to identify four different tendencies
on energy imports coverage with goods exports. From 1962 to 1973 there exists a clearly
declining tendency meaning that out of the total goods exported Spain, 30% of their trade
value was needed for importing different energy supplies. However, from 1974 until 1985
(period which covers the 1970s energy crisis) the amount of goods exports needed in order
to cover Spanish energy imports peaked, reaching a maximum of 67.08% during 1981.
Hopefully, things changed after 1986 where this percentage started declining below 30%,
reaching the series minimum in 1998 with 7.88%. Again and coinciding with another
energy crisis (2000s), the percentage started rising in 2004 until the point of returning to
nearly 30% in 2012 (28.21%).
Fig.8 Source: Own compilation from COMTRADE database. Energy imports coverage is the ratio
between energy imports and total goods exports.
With the arrival of the fifties, the gradual but incomplete liberalization allowed Spanish
economy to take advantage of the favourable international conditions and regain some of
the backwardness of the previous autarkic years. Between 1955 and 1973, both gross
domestic product and energy consumption multiplied by 3.2, which meant a cumulative
annual increase of 6.7%.31 This accentuated the dependence on irreplaceable energy
supplies imports, which at the same time made difficult the task of maintaining the
country’s external balance, a key factor in the Spanish economic growth.
31 Sudriá, C (1997). “La restricción energética al desarrollo económico de España”, Papeles de Economía Española, p. 179
0,00%
10,00%
20,00%
30,00%
40,00%
50,00%
60,00%
70,00%
1962
1964
1966
1968
1970
1972
1974
1976
1978
1980
1982
1984
1986
1988
1990
1992
1994
1996
1998
2000
2002
2004
2006
2008
2010
2012
2014
ENERGY IMPORTS COVERAGE (SPAIN, 1962-2014)
Page 18 of 35
We can perceive this last statement in the results obtained during this section, which show
that during the second half of the 1960s, the 1970s and the first half of the 1980s (1965-
1985), Spanish imports of energy supplies nearly reached a 30% of total imports and
represented more than a 60% of total goods exports. It is more than likely that this
phenomenon also has to do with the Arab-Israeli war that broke out on October 6, 1973 or
with the second episode of rising prices that occurred in 1979-80 following the Iranian
Islamic revolution and the subsequent war between Iran and Iraq. Between summer of
1973 and late 1981 the price of oil had risen from $ 3 to $ 34 per barrel.32
During the 2000s the weight of energy imports over total goods imports and the energy
imports coverage with goods imports started rising again. We have seen the petroleum and
petroleum weight over the Spanish energy supplies imports baskets, so the steady price
increase that started during the 2001 could have caused these increases in weights. If we
consider the high level of dependence between world’s economy and oil prices, the effects
should be large and should not have only affected Spain. In order to prove it, I will proceed
to make a comparison between Spain and OECD member countries.
4.2 OECD vs. SPAIN
Once we have analysed Spain, its turn to compare this Mediterranean country with the
OECD member countries. This will allow us to discover whether the increased weight of
energy imports over total imports and the worsening of its coverage with goods exports
was something particularly Spanish, or endemic of OECD countries.
Exported energy supplies
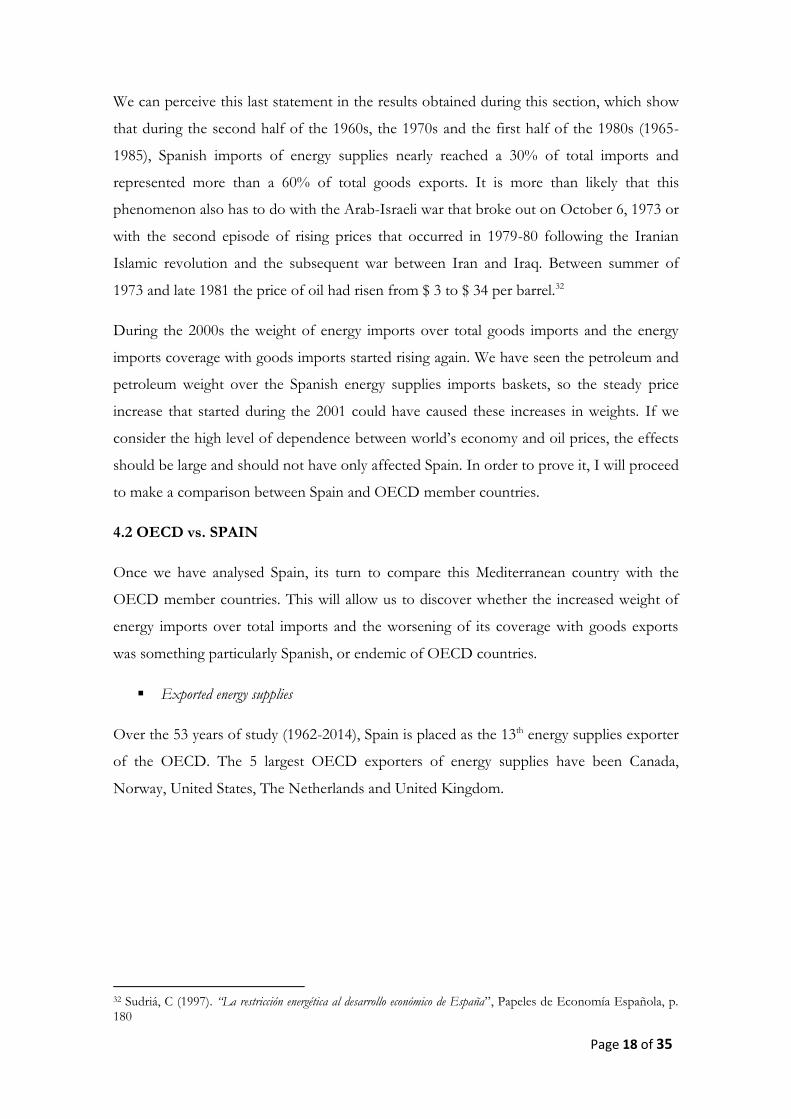
Over the 53 years of study (1962-2014), Spain is placed as the 13th energy supplies exporter
of the OECD. The 5 largest OECD exporters of energy supplies have been Canada,
Norway, United States, The Netherlands and United Kingdom.
32 Sudriá, C (1997). “La restricción energética al desarrollo económico de España”, Papeles de Economía Española, p. 180
Page 19 of 35
Position Country Total exports
1 CANADA $ 1.522.296.896.894
2 NORWAY $ 1.426.948.866.579
3 UNITED STATES $ 1.192.812.508.299
4 NETHERLANDS $ 991.956.792.569
5 UNITED KINGDOM $ 985.137.215.227
Table 1 Source: Own compilation from COMTRADE database
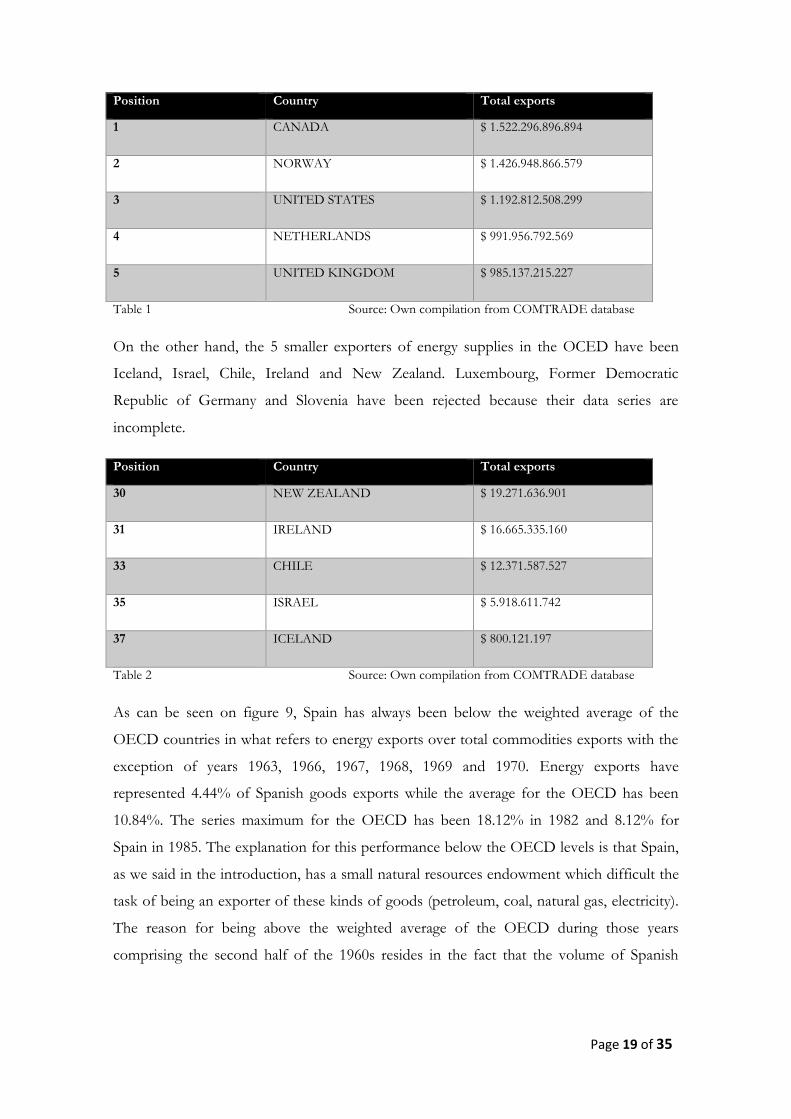
On the other hand, the 5 smaller exporters of energy supplies in the OCED have been
Iceland, Israel, Chile, Ireland and New Zealand. Luxembourg, Former Democratic
Republic of Germany and Slovenia have been rejected because their data series are
incomplete.
Position Country Total exports
30 NEW ZEALAND $ 19.271.636.901
31 IRELAND $ 16.665.335.160
33 CHILE $ 12.371.587.527
35 ISRAEL $ 5.918.611.742
37 ICELAND $ 800.121.197
Table 2 Source: Own compilation from COMTRADE database
As can be seen on figure 9, Spain has always been below the weighted average of the
OECD countries in what refers to energy exports over total commodities exports with the
exception of years 1963, 1966, 1967, 1968, 1969 and 1970. Energy exports have
represented 4.44% of Spanish goods exports while the average for the OECD has been
10.84%. The series maximum for the OECD has been 18.12% in 1982 and 8.12% for
Spain in 1985. The explanation for this performance below the OECD levels is that Spain,
as we said in the introduction, has a small natural resources endowment which difficult the
task of being an exporter of these kinds of goods (petroleum, coal, natural gas, electricity).
The reason for being above the weighted average of the OECD during those years
comprising the second half of the 1960s resides in the fact that the volume of Spanish
Page 20 of 35
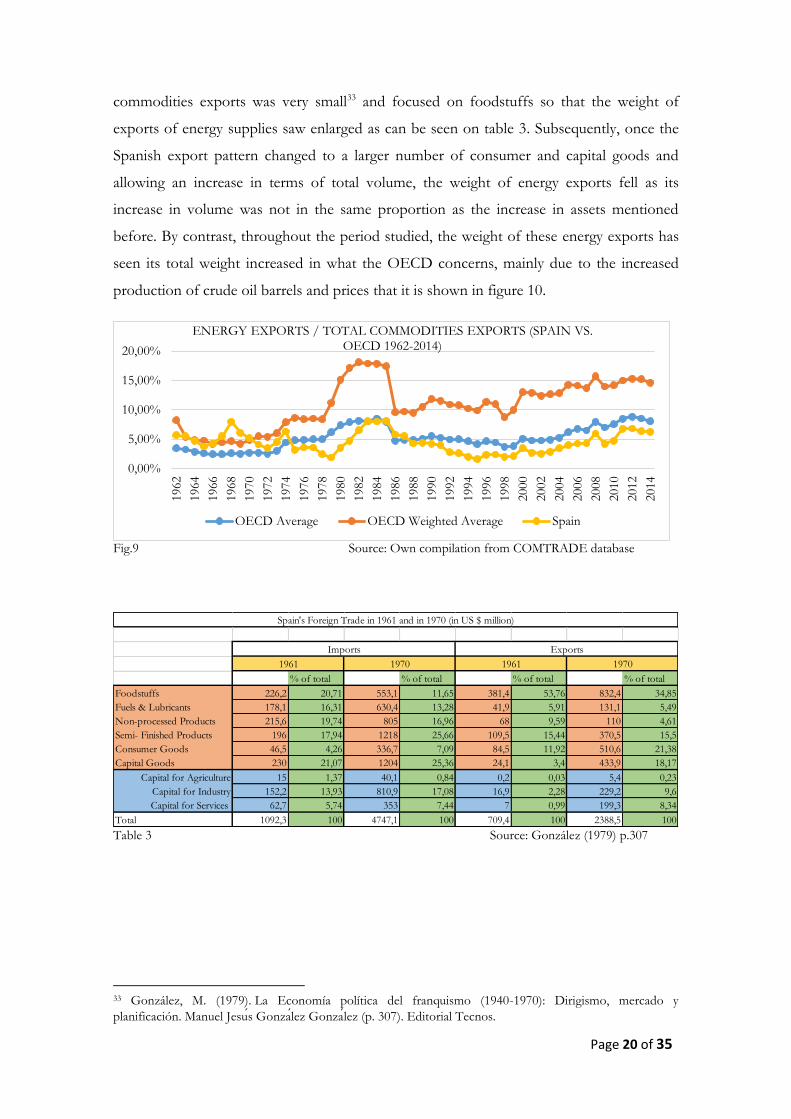
commodities exports was very small33 and focused on foodstuffs so that the weight of
exports of energy supplies saw enlarged as can be seen on table 3. Subsequently, once the
Spanish export pattern changed to a larger number of consumer and capital goods and
allowing an increase in terms of total volume, the weight of energy exports fell as its
increase in volume was not in the same proportion as the increase in assets mentioned
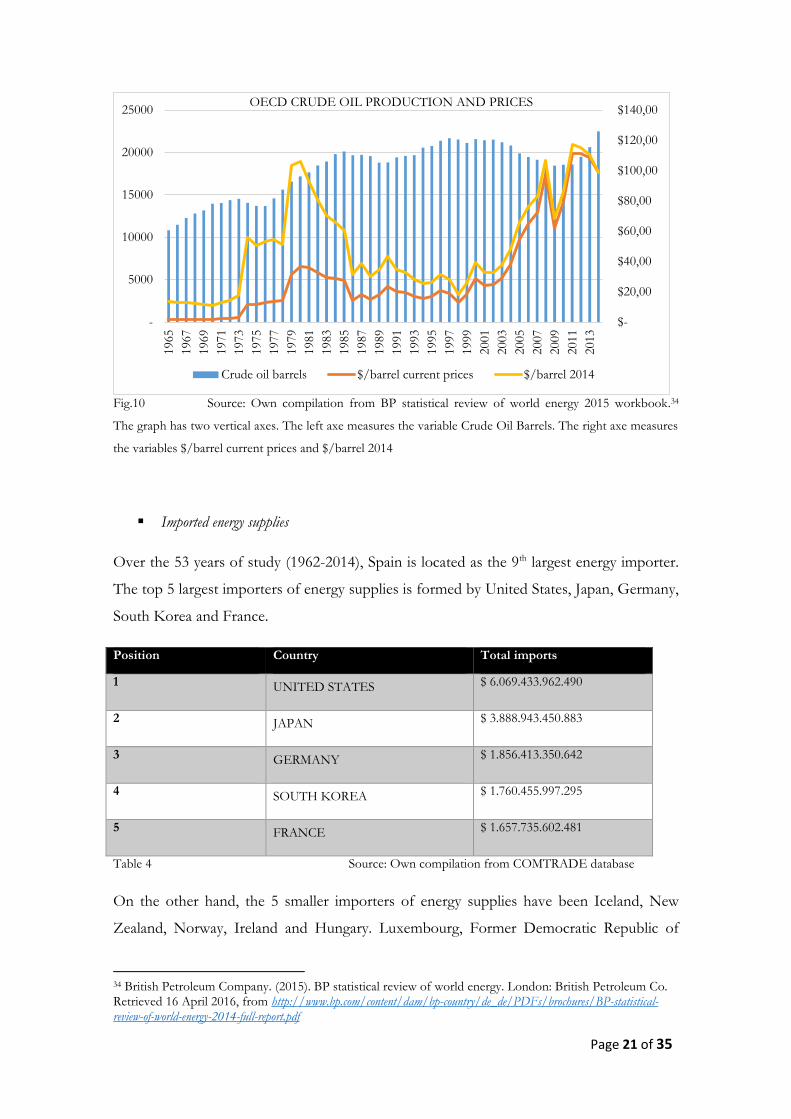
before. By contrast, throughout the period studied, the weight of these energy exports has
seen its total weight increased in what the OECD concerns, mainly due to the increased
production of crude oil barrels and prices that it is shown in figure 10.
Fig.9 Source: Own compilation from COMTRADE database
Table 3 Source: González (1979) p.307
33 González, M. (1979). La Economía política del franquismo (1940-1970): Dirigismo, mercado y
planificación. Manuel Jesu s Gonza lez Gonza lez (p. 307). Editorial Tecnos.
0,00%
5,00%
10,00%
15,00%
20,00%
1962
1964
1966
1968
1970
1972
1974
1976
1978
1980
1982
1984
1986
1988
1990
1992
1994
1996
1998
2000
2002
2004
2006
2008
2010
2012
2014
ENERGY EXPORTS / TOTAL COMMODITIES EXPORTS (SPAIN VS. OECD 1962-2014)
OECD Average OECD Weighted Average Spain
% of total % of total % of total % of total
Foodstuffs 226,2 20,71 553,1 11,65 381,4 53,76 832,4 34,85
Fuels & Lubricants 178,1 16,31 630,4 13,28 41,9 5,91 131,1 5,49
Non-processed Products 215,6 19,74 805 16,96 68 9,59 110 4,61
Semi- Finished Products 196 17,94 1218 25,66 109,5 15,44 370,5 15,5
Consumer Goods 46,5 4,26 336,7 7,09 84,5 11,92 510,6 21,38
Capital Goods 230 21,07 1204 25,36 24,1 3,4 433,9 18,17
Capital for Agriculture 15 1,37 40,1 0,84 0,2 0,03 5,4 0,23
Capital for Industry 152,2 13,93 810,9 17,08 16,9 2,28 229,2 9,6
Capital for Services 62,7 5,74 353 7,44 7 0,99 199,3 8,34
Total 1092,3 100 4747,1 100 709,4 100 2388,5 100
Spain's Foreign Trade in 1961 and in 1970 (in US $ million)
1961 1970 1961 1970
Imports Exports
Page 21 of 35
Fig.10 Source: Own compilation from BP statistical review of world energy 2015 workbook.34
The graph has two vertical axes. The left axe measures the variable Crude Oil Barrels. The right axe measures
the variables $/barrel current prices and $/barrel 2014
Imported energy supplies
Over the 53 years of study (1962-2014), Spain is located as the 9th largest energy importer.
The top 5 largest importers of energy supplies is formed by United States, Japan, Germany,
South Korea and France.
Position Country Total imports
1 UNITED STATES $ 6.069.433.962.490
2 JAPAN $ 3.888.943.450.883
3 GERMANY $ 1.856.413.350.642
4 SOUTH KOREA $ 1.760.455.997.295
5 FRANCE $ 1.657.735.602.481
Table 4 Source: Own compilation from COMTRADE database
On the other hand, the 5 smaller importers of energy supplies have been Iceland, New
Zealand, Norway, Ireland and Hungary. Luxembourg, Former Democratic Republic of
34 British Petroleum Company. (2015). BP statistical review of world energy. London: British Petroleum Co. Retrieved 16 April 2016, from http://www.bp.com/content/dam/bp-country/de_de/PDFs/brochures/BP-statistical-review-of-world-energy-2014-full-report.pdf
$-
$20,00
$40,00
$60,00
$80,00
$100,00
$120,00
$140,00
-
5000
10000
15000
20000
25000
1965
1967
1969
1971
1973
1975
1977
1979
1981
1983
1985
1987
1989
1991
1993
1995
1997
1999
2001
2003
2005
2007
2009
2011
2013
OECD CRUDE OIL PRODUCTION AND PRICES
Crude oil barrels $/barrel current prices $/barrel 2014
Page 22 of 35
Germany, Estonia, Slovenia and Slovak Republic have been rejected because their data
series are incomplete.
Position Country Total imports
28 HUNGARY $ 19.271.636.901
29 IRELAND $ 16.665.335.160
31 NORWAY $ 12.371.587.527
32 NEW ZEALAND $ 5.918.611.742
37 ICELAND $ 800.121.197
Table 5 Source: Own compilation from COMTRADE database
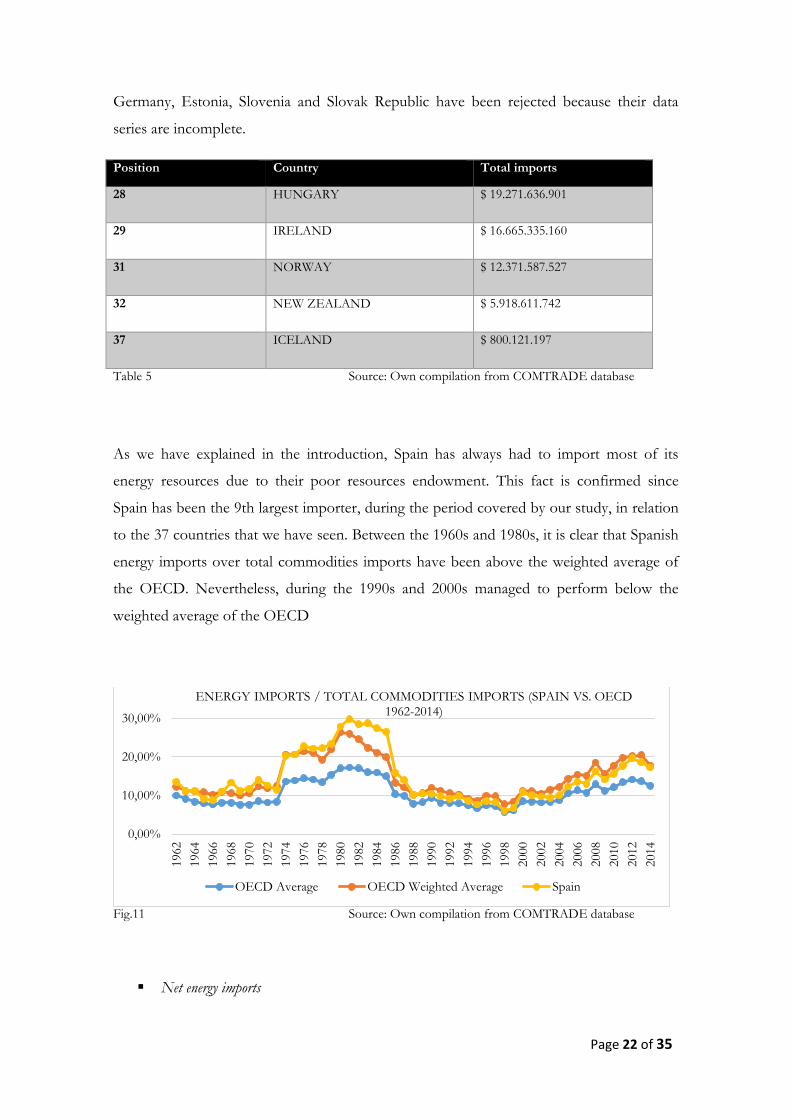
As we have explained in the introduction, Spain has always had to import most of its
energy resources due to their poor resources endowment. This fact is confirmed since
Spain has been the 9th largest importer, during the period covered by our study, in relation
to the 37 countries that we have seen. Between the 1960s and 1980s, it is clear that Spanish
energy imports over total commodities imports have been above the weighted average of
the OECD. Nevertheless, during the 1990s and 2000s managed to perform below the
weighted average of the OECD
Fig.11 Source: Own compilation from COMTRADE database
Net energy imports
0,00%
10,00%
20,00%
30,00%
1962
1964
1966
1968
1970
1972
1974
1976
1978
1980
1982
1984
1986
1988
1990
1992
1994
1996
1998
2000
2002
2004
2006
2008
2010
2012
2014
ENERGY IMPORTS / TOTAL COMMODITIES IMPORTS (SPAIN VS. OECD 1962-2014)
OECD Average OECD Weighted Average Spain
Page 23 of 35
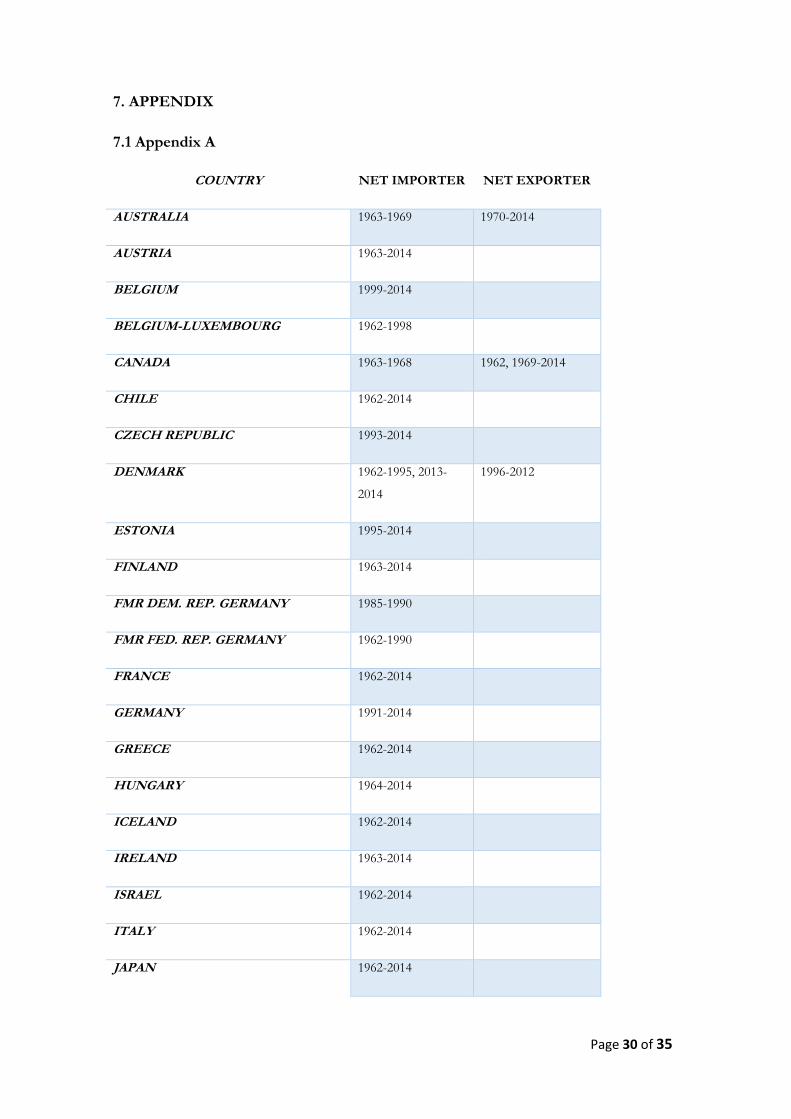
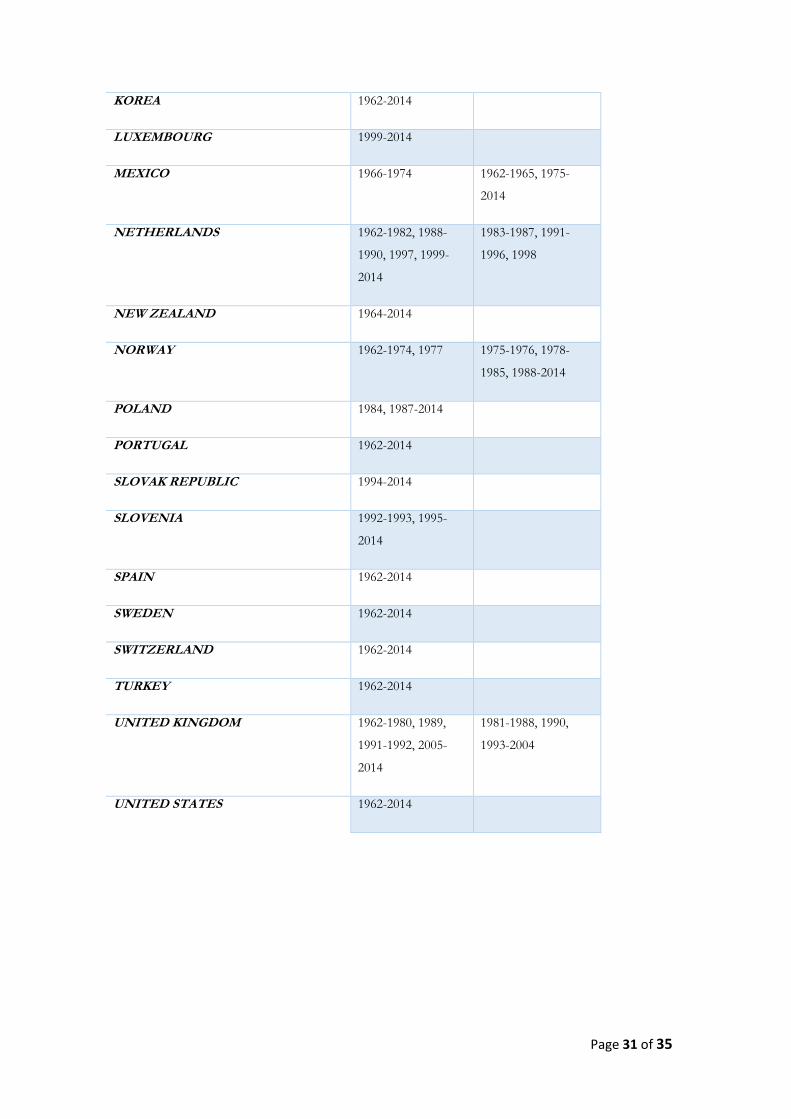
Due to the different members that form the OECD, some may be classified as net energy
supplies importers while others are net energy exporters. Once we stick to the data, we can
see how most of the countries that make up this organization have acted as net energy
supplies importers. This is the case of Austria, Belgium, Belgium-Luxembourg, Chile,
Czech Republic, Estonia, Finland, Former Democratic Republic of Germany, Former
Federal Republic of Germany, France, Germany, Greece, Hungary, Iceland, Ireland, Israel,
Italy, Japan, South Korea, Luxembourg, New Zealand, Poland, Portugal, Slovak Republic,
Slovenia, Spain, Sweden, Switzerland, Turkey and United States.35
On the other hand, we have those countries that have either been net energy supplies
exporters during most of the period studied or at least for some years. This is the case of
Australia, Canada, Denmark, Mexico, The Netherlands and The United Kingdom.36
In what refers to the composition of the energy supplies imports basket of the different
countries analysed, the main energy supply has been Petroleum and Petroleum products.
However, the energy supplies of the net energy exporters vary a little more so we will get a
little more in detail.
o Australia is a country that has mainly exported coal, coke and briquettes (66.68% on average) and Petroleum and petroleum products (24.91% on average) between 1963 and 2014.
o Canada is a country that has mainly exported petroleum and petroleum products
(56.44% on average) and Gas, natural and manufactured (30.69%) between 1962 and 2014.
o Denmark has primarily exported mainly petroleum and petroleum products (86.54% on average) and Electric Energy (10.60% on average) between 1962 and 2014.
o Mexico has essentially exported petroleum and petroleum products (94.91% on average) between 1962 and 2014.
o The Netherlands has principally exported petroleum and petroleum products (75.63% on average) and Gas, natural and manufactured (19.24%) between 1962 and 2014.
o The United Kingdom is a country that has primarily exported petroleum and petroleum products (91.05% on average) between 1962 and 2014.
35 You can find more information on Appendix A 36 You can find more information on Appendix A
Page 24 of 35
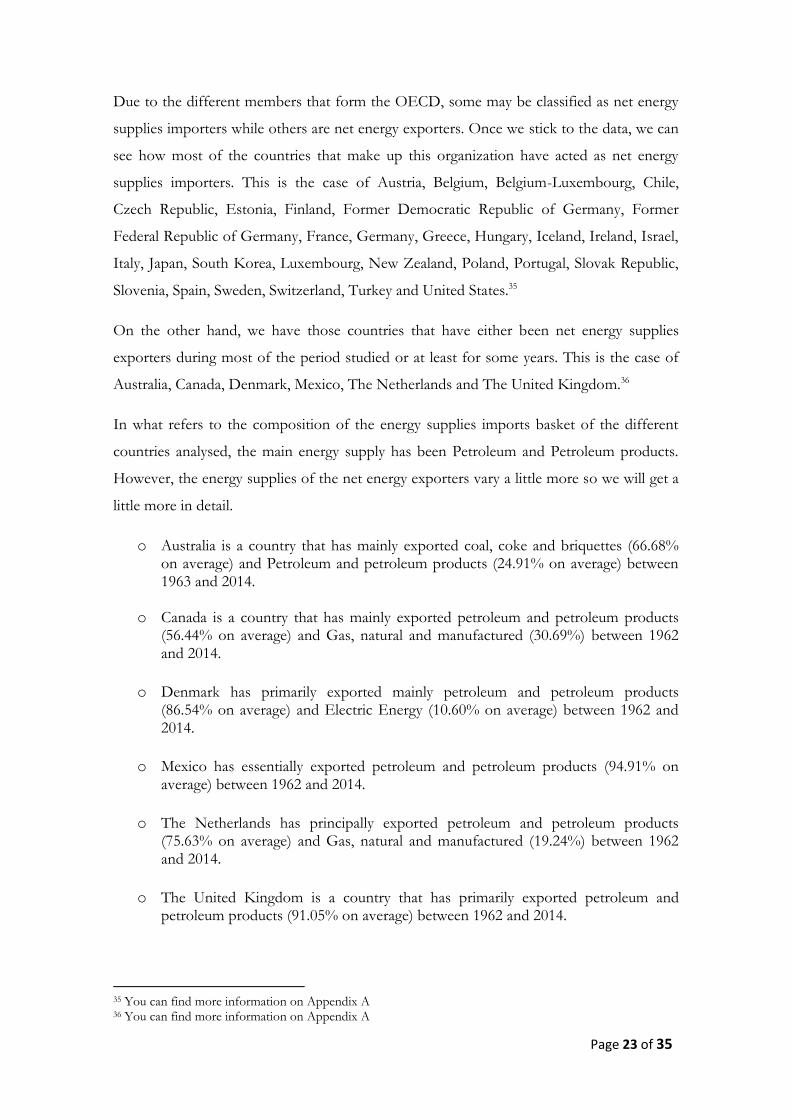
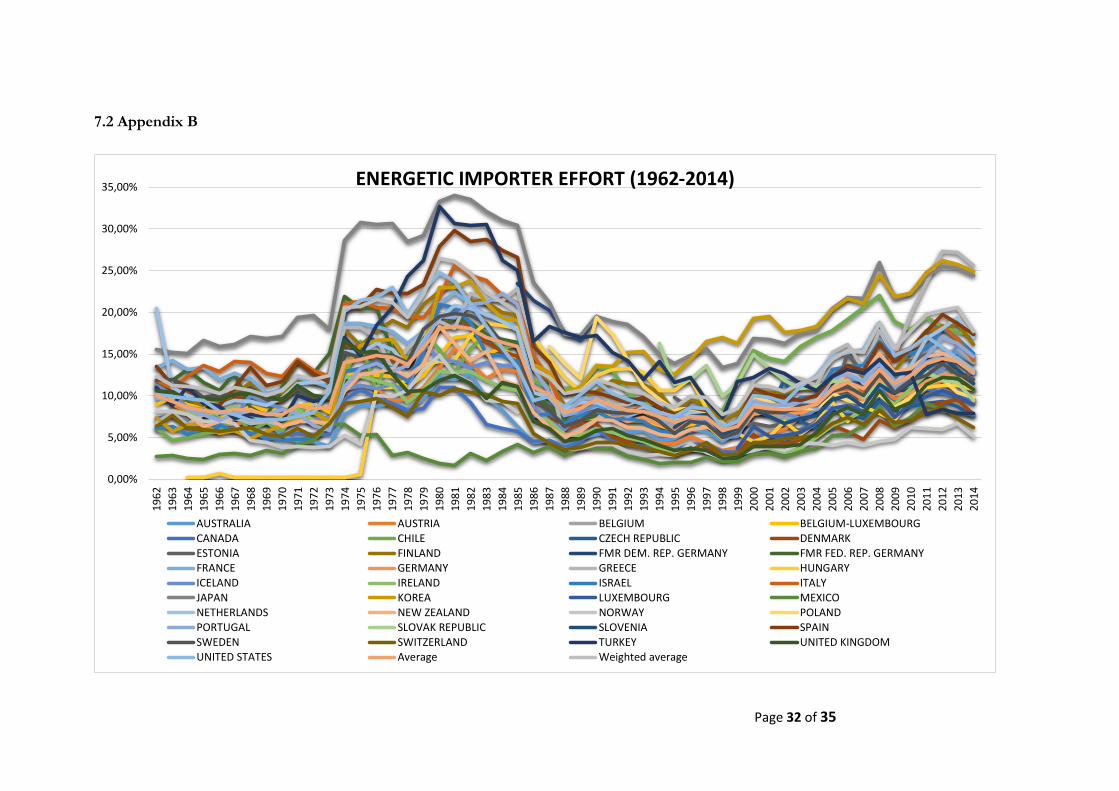
Energetic importer effort
Figure 12 is really compelling and shows very well what Spain faced between 1962 and
1988 when the country was doing a higher importer effort that the weighted average of the
OECD member countries during most of the years. Between 1978 and 1984 Japan and
Turkey, and since 1984 Japan, were the only OECD countries making a greater importer
effort than Spain.37 This had to be something fatal for Spanish, Japanese and Turkish
economies since surely obliged these economies to quit from importing other goods such
as machines, technology or food.
Fig.12 Source: Own compilation from COMTRADE database. Energetic importer effort is the ratio
between energy imports and total goods imports.
On the one hand, it is quite remarkable that from 1988 on, the Spanish economy has been
performing below the weighted average of the OECD. The reason behind this
improvement has to do with the several national energy plans which aimed to diversify
Spanish energy sources and reduce its energy vulnerability. They include the natural gas
introduction, the liberalisation of the energy sector and the promotion of renewables.38
Since the beginning of the liberalisation, the number of agents has grown due to the
entrance new national and international actors such as oil companies (BP, Galp),
construction companies (Sacyr, ACS, Acciona) or international funds (Qatar investment
Authority).39
37 You can find more information on Appendix B 38 You can find more information about the Spanish energy policy main period on Annex 1 of Álvarez, E. y Larrea, M., Energy policy: European challenges, Spanish answers. Policy paper 106, March 2014. Notre Europe. Jacques Delors Institute. 39 Álvarez, E. y Larrea, M., Energy policy: European challenges, Spanish answers. Policy paper 106, March 2014. Notre Europe. Jacques Delors Institute, p. 20-21.
0,00%
10,00%
20,00%
30,00%
40,00%
1962
1964
1966
1968
1970
1972
1974
1976
1978
1980
1982
1984
1986
1988
1990
1992
1994
1996
1998
2000
2002
2004
2006
2008
2010
2012
2014
ENERGETIC IMPORTER EFFORT (SPAIN vs OECD 1962-2014)
OECD Average OECD Weighted average SPAIN
Page 25 of 35
On the other hand, Spanish energy dependence is 73%, well above the European, which is
around 50%.40 The Mediterranean country has a heavy dependence on fossil fuel imports,
however we can appreciate a shift from petroleum to natural gas since petroleum products
imports have decreased between 2000 and 2012 from 71 Mtoe to 59 Mtoe whereas natural
gas imports have risen from 15 Mtoe to 28 Mtoe during the same time period. Moreover,
during the 21st century renewable energies have been growing thanks to the financial
support provided to these sources and the wide availability of wind and solar resources that
can be found in the country.41
It seems that the Spanish energy policy has improved significantly compared to the initial
situation in the 60's. After all there is still a long way to go before assuring Spanish
population energy welfare and decrease even more its importer effort.
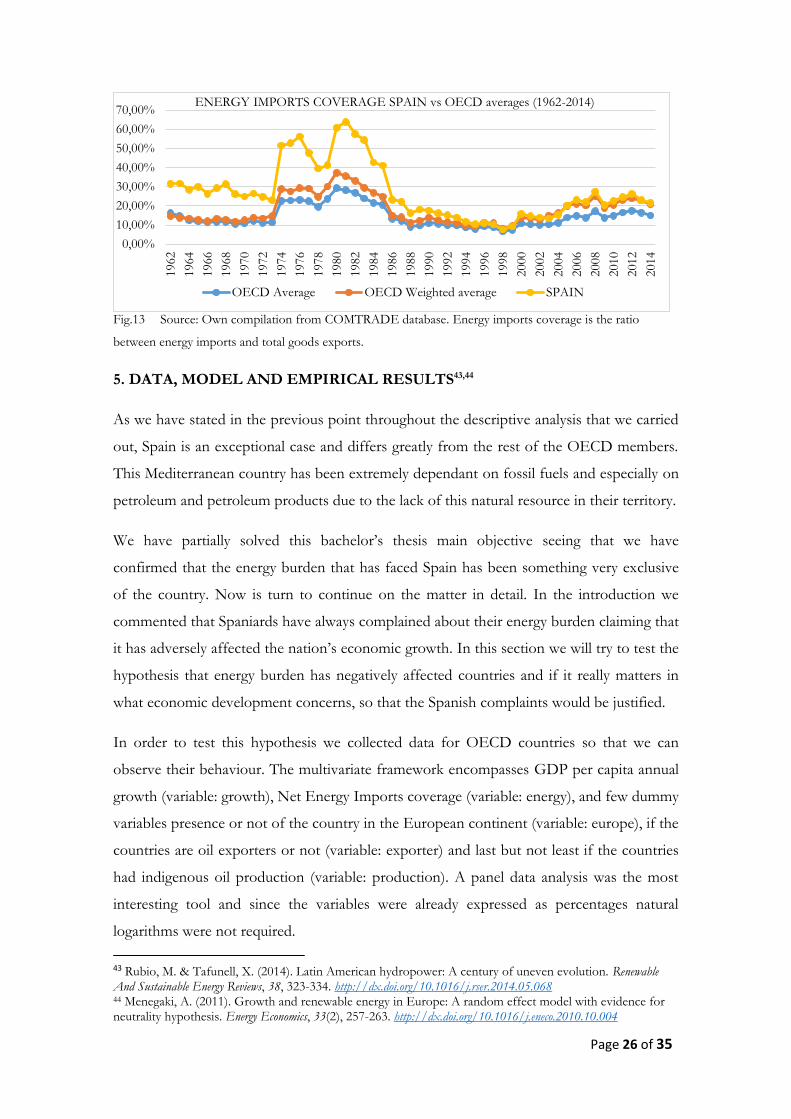
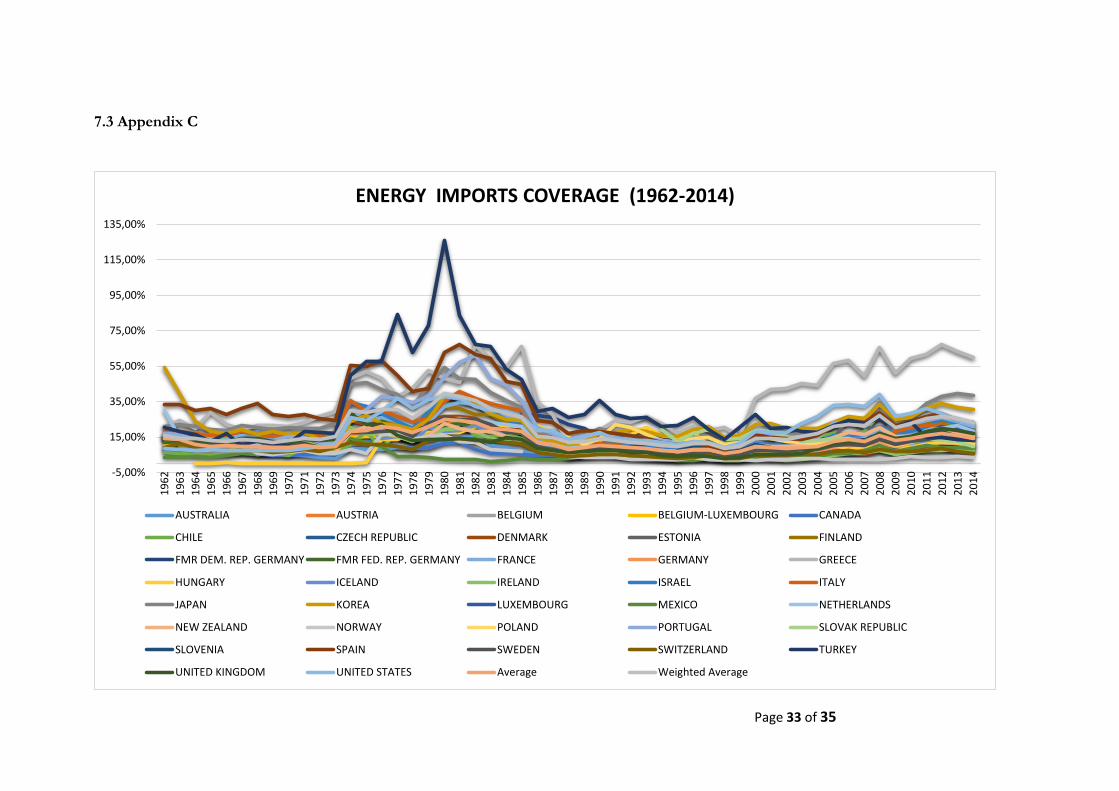
Energy imports coverage
In figure 13 we can realize the delicate Spanish situation with regard to other OECD
economies. Between 1962 and 2014, Spanish energy imports coverage with good exports
has been 1.49 times higher than the weighted average of the OECD, reaching a maximum
of 2.487 times in 1968. Between 1964 and 1974, with the exception of Greece in 1972 and
1973, Spain was the country whose energy supplies imports represented a higher
percentage of its goods exports. Since 1975 and until the European integration in 1986
Spain remained in the top 3 of this ratio being surpassed only by Turkey and since 1982 by
Turkey and Greece. From 1986 until the 2007-2008 oil shock, it seems that Spain began to
converge to the weighted average of the OECD, but always remaining above (1.14 times
for the period 1986-2014). It is noteworthy that during the 21st century, Greece has been
the country that has required a greater volume of exports to cover its energy imports
(44.35% for the period 2000-2014).42
40 Deloitte Conseil,. (2015). European energy market reform Country profile: Spain (p. 2). 41 Deloitte Conseil. (2015). European energy market reform Country profile: Spain (p. 12). 42 You can find more information on Appendix C
Page 26 of 35
Fig.13 Source: Own compilation from COMTRADE database. Energy imports coverage is the ratio
between energy imports and total goods exports.
5. DATA, MODEL AND EMPIRICAL RESULTS43,44
As we have stated in the previous point throughout the descriptive analysis that we carried
out, Spain is an exceptional case and differs greatly from the rest of the OECD members.
This Mediterranean country has been extremely dependant on fossil fuels and especially on
petroleum and petroleum products due to the lack of this natural resource in their territory.
We have partially solved this bachelor’s thesis main objective seeing that we have
confirmed that the energy burden that has faced Spain has been something very exclusive
of the country. Now is turn to continue on the matter in detail. In the introduction we
commented that Spaniards have always complained about their energy burden claiming that
it has adversely affected the nation’s economic growth. In this section we will try to test the
hypothesis that energy burden has negatively affected countries and if it really matters in
what economic development concerns, so that the Spanish complaints would be justified.
In order to test this hypothesis we collected data for OECD countries so that we can
observe their behaviour. The multivariate framework encompasses GDP per capita annual
growth (variable: growth), Net Energy Imports coverage (variable: energy), and few dummy
variables presence or not of the country in the European continent (variable: europe), if the
countries are oil exporters or not (variable: exporter) and last but not least if the countries
had indigenous oil production (variable: production). A panel data analysis was the most
interesting tool and since the variables were already expressed as percentages natural
logarithms were not required.
43 Rubio, M. & Tafunell, X. (2014). Latin American hydropower: A century of uneven evolution. Renewable And Sustainable Energy Reviews, 38, 323-334. http://dx.doi.org/10.1016/j.rser.2014.05.068 44 Menegaki, A. (2011). Growth and renewable energy in Europe: A random effect model with evidence for neutrality hypothesis. Energy Economics, 33(2), 257-263. http://dx.doi.org/10.1016/j.eneco.2010.10.004
0,00%
10,00%
20,00%
30,00%
40,00%
50,00%
60,00%
70,00%
1962
1964
1966
1968
1970
1972
1974
1976
1978
1980
1982
1984
1986
1988
1990
1992
1994
1996
1998
2000
2002
2004
2006
2008
2010
2012
2014
ENERGY IMPORTS COVERAGE SPAIN vs OECD averages (1962-2014)
OECD Average OECD Weighted average SPAIN
Page 27 of 35
The technique used in order analyse our panel data was a random-effects (RE) model. This
decision was due to the heterogeneity of countries that we had in our dataset. We have to
take into account that fixed-effect (FE) models are usually preferred due to their simplicity
in handling and normalizing heterogeneity in the error term. However, we selected a RE
model because we conceived each country as a random variable being part of a larger
population of countries, so we had reasons to believe that the differences across countries
had some kind of influence on the GDPpc increase from year to year. An advantage of RE
models is that we can include time invariant variables (i.e. European continent) that in FE
are absorbed by the intercept.
What we expected to obtain as a result of our model is that those countries allocating a
higher percentage of their good exports with the purpose of covering its energy imports
should have smaller GDPpc growth than those with lower percentages. On the other hand
we believe that belonging to the European territory as well as being net oil exporter or
having indigenous oil production should positively affect the growth of GDP per capita.
In all our models, the dependent variable is the GDPpc annual rate of growth. The first
model just wants to test the hypothesis while the second, third and fourth want to prove its
robustness.
𝑔𝑟𝑜𝑤𝑡ℎ𝑖𝑡 = 𝑐 + 𝑏1𝑒𝑛𝑒𝑟𝑔𝑦 + 𝑢𝑖 + 𝑒𝑖𝑡 (1)
The second model includes the presence or not of the countries into the European
continent taking the value 1 if the country can be found in Europe and 0 otherwise.
𝑔𝑟𝑜𝑤𝑡ℎ𝑖𝑡 = 𝑐 + 𝑏1𝑒𝑛𝑒𝑟𝑔𝑦 + 𝑏2𝑒𝑢𝑟𝑜𝑝𝑒 + 𝑢𝑖 + 𝑒𝑖𝑡 (2)
Being a net crude oil exporter enters the equation as a dummy variable which takes the
value 1 if the country is a net oil exporter and 0 otherwise.
𝑔𝑟𝑜𝑤𝑡ℎ𝑖𝑡 = 𝑐 + 𝑏1𝑒𝑛𝑒𝑟𝑔𝑦 + 𝑏2𝑒𝑢𝑟𝑜𝑝𝑒 + 𝑏3exporter + 𝑢𝑖 + 𝑒𝑖𝑡 (3)
The fourth equation adds the variable indigenous oil production receiving the value 1 if the
country has it or 0 otherwise.
𝑔𝑟𝑜𝑤𝑡ℎ𝑖𝑡 = 𝑐 + 𝑏1𝑒𝑛𝑒𝑟𝑔𝑦 + 𝑏2𝑒𝑢𝑟𝑜𝑝𝑒 + 𝑏3exporter + 𝑏4𝑝𝑟𝑜𝑑𝑢𝑐𝑡𝑖𝑜𝑛 + 𝑢𝑖 + 𝑒𝑖𝑡 (4)
Where:
growth it is the dependent variable where i=country and t=year
Page 28 of 35
c is the constant
𝛽𝑘 is the coefficient for that variable
uit is the between-entity error term
eit is the within-entity error term
Model Number (1) (2) (3) (4)
Dependent
Variable: growth
energy -0.0354658*** -0.0359805*** -0.0382451*** -0.0339258***
europe -0.00161739 -0.00257483 -0.00427624
exporter -0.00909553 -0.00405220
production -0.00940314***
Constant 0.0316445*** 0.0328088*** 0.0349897*** 0.0398769***
Observations 1309 1309 1309 1277
Number of Countries 32 32 32 30
Time FE Yes Yes Yes Yes
Var “within” 0.000908268 0.000908268 0.000908268 0.000866058
Var “between” 8.59836e-005 8.98357e-005 9.37707e-005 5.70037e-005
R-sq overall 0.000325547 0.000535456 0.00367762 0.0190703
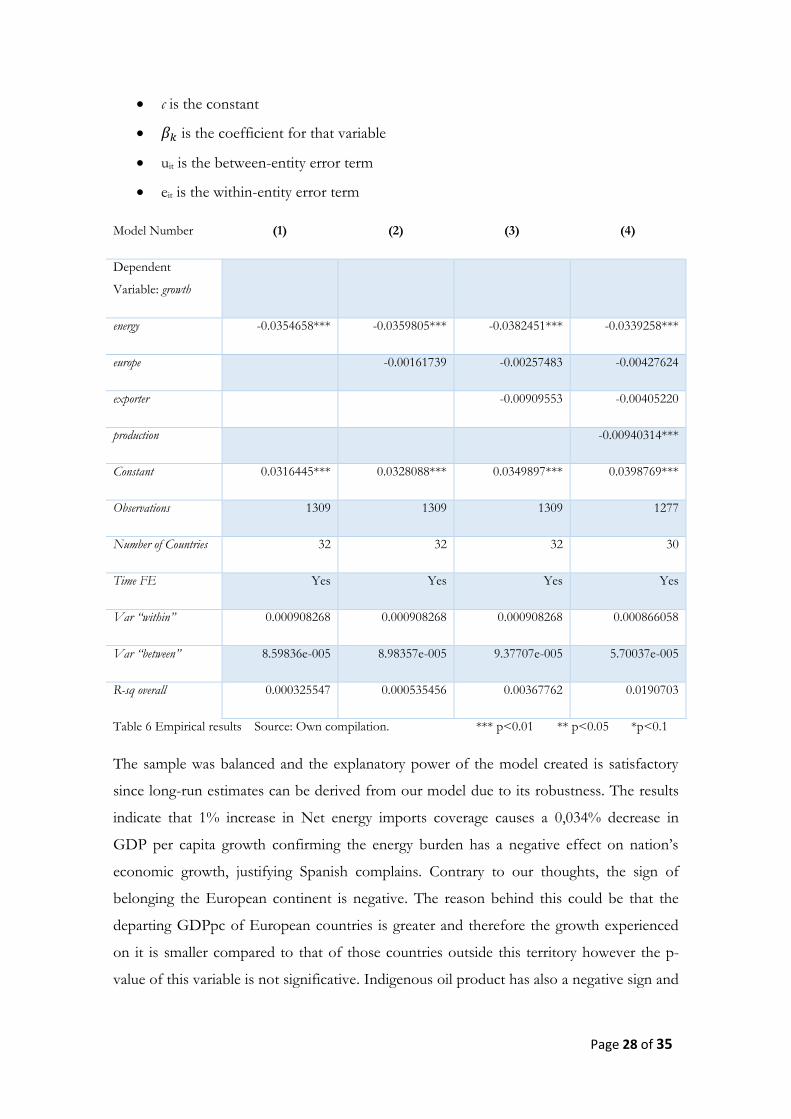
Table 6 Empirical results Source: Own compilation. *** p<0.01 ** p<0.05 *p<0.1
The sample was balanced and the explanatory power of the model created is satisfactory
since long-run estimates can be derived from our model due to its robustness. The results
indicate that 1% increase in Net energy imports coverage causes a 0,034% decrease in
GDP per capita growth confirming the energy burden has a negative effect on nation’s
economic growth, justifying Spanish complains. Contrary to our thoughts, the sign of
belonging the European continent is negative. The reason behind this could be that the
departing GDPpc of European countries is greater and therefore the growth experienced
on it is smaller compared to that of those countries outside this territory however the p-
value of this variable is not significative. Indigenous oil product has also a negative sign and
Page 29 of 35
the logic behind it could be that countries such as Italy, Spain, Turkey or Poland had
indigenous oil production but are net importers of this product.
6. CONCLUSIONS
Studies about this topic have found, in general, a strong causal relationship between energy
consumption and economic growth but they are inconclusive about the direction of the
causality and the magnitude of its impact.
The purpose of this project is to introduce a different view by looking at energy supplies
imports and exports in order to prove the hypothesis relating economy and energy. We
analysed the relationship from a different angle while trying to answer the question of
whether the ease of access to energy had any impact on economic growth. The hypothesis
that we test is if countries with more difficulties to access energy had a worse economic
performance than those countries which have an easier access.
The first conclusion is that the Spanish energy burden has been something very particular
of the Mediterranean country. Between 1962 and 1988 Spain was doing a higher importer
effort that the weighted average of the OECD. Moreover, Spanish energy imports coverage
with good exports has been higher than the weighted average of the OECD. From 1964 to
1974 Spain was the country whose energy supplies imports represented a higher percentage
of its total goods exports.
The next conclusion is that the European integration of Spain has favoured the country in
reducing its energetic importer effort. The reason resides on the several energy plans that
aimed to diversify energy sources and energetic dependence. Nevertheless, the country’s
energy dependence is well above the European.
Once this question was solved, the next step was to study the relationship between net
energy imports coverage and GDP growth. A random-effects model was developed and it
showed that those countries that require a larger amount of their total goods exports in
order to cover their net energy imports suffer a negative impact on their GDP per capita
growth, confirming our hypothesis and reinforcing the constant Spanish complains.
We can conclude that countries with more difficulties to access energy had a worse
economic performance than those which have an easier access. This hypothesis is
supported throughout both a descriptive and empirical analysis based on the OECD
member countries, covering the period 1962-2014.
Page 30 of 35
7. APPENDIX
7.1 Appendix A
COUNTRY NET IMPORTER NET EXPORTER
AUSTRALIA 1963-1969 1970-2014
AUSTRIA 1963-2014
BELGIUM 1999-2014
BELGIUM-LUXEMBOURG 1962-1998
CANADA 1963-1968 1962, 1969-2014
CHILE 1962-2014
CZECH REPUBLIC 1993-2014
DENMARK 1962-1995, 2013-
2014
1996-2012
ESTONIA 1995-2014
FINLAND 1963-2014
FMR DEM. REP. GERMANY 1985-1990
FMR FED. REP. GERMANY 1962-1990
FRANCE 1962-2014
GERMANY 1991-2014
GREECE 1962-2014
HUNGARY 1964-2014
ICELAND 1962-2014
IRELAND 1963-2014
ISRAEL 1962-2014
ITALY 1962-2014
JAPAN 1962-2014
Page 31 of 35
KOREA 1962-2014
LUXEMBOURG 1999-2014
MEXICO 1966-1974 1962-1965, 1975-
2014
NETHERLANDS 1962-1982, 1988-
1990, 1997, 1999-
2014
1983-1987, 1991-
1996, 1998
NEW ZEALAND 1964-2014
NORWAY 1962-1974, 1977 1975-1976, 1978-
1985, 1988-2014
POLAND 1984, 1987-2014
PORTUGAL 1962-2014
SLOVAK REPUBLIC 1994-2014
SLOVENIA 1992-1993, 1995-
2014
SPAIN 1962-2014
SWEDEN 1962-2014
SWITZERLAND 1962-2014
TURKEY 1962-2014
UNITED KINGDOM 1962-1980, 1989,
1991-1992, 2005-
2014
1981-1988, 1990,
1993-2004
UNITED STATES 1962-2014
Page 32 of 35
7.2 Appendix B
0,00%
5,00%
10,00%
15,00%
20,00%
25,00%
30,00%
35,00%
19
62
19
63
19
64
19
65
19
66
19
67
19
68
19
69
19
70
19
71
19
72
19
73
19
74
19
75
19
76
19
77
19
78
19
79
19
80
19
81
19
82
19
83
19
84
19
85
19
86
19
87
19
88
19
89
19
90
19
91
19
92
19
93
19
94
19
95
19
96
19
97
19
98
19
99
20
00
20
01
20
02
20
03
20
04
20
05
20
06
20
07
20
08
20
09
20
10
20
11
20
12
20
13
20
14
ENERGETIC IMPORTER EFFORT (1962-2014)
AUSTRALIA AUSTRIA BELGIUM BELGIUM-LUXEMBOURGCANADA CHILE CZECH REPUBLIC DENMARKESTONIA FINLAND FMR DEM. REP. GERMANY FMR FED. REP. GERMANYFRANCE GERMANY GREECE HUNGARYICELAND IRELAND ISRAEL ITALYJAPAN KOREA LUXEMBOURG MEXICONETHERLANDS NEW ZEALAND NORWAY POLANDPORTUGAL SLOVAK REPUBLIC SLOVENIA SPAINSWEDEN SWITZERLAND TURKEY UNITED KINGDOMUNITED STATES Average Weighted average
Page 33 of 35
7.3 Appendix C
-5,00%
15,00%
35,00%
55,00%
75,00%
95,00%
115,00%
135,00%
19
62
19
63
19
64
19
65
19
66
19
67
19
68
19
69
19
70
19
71
19
72
19
73
19
74
19
75
19
76
19
77
19
78
19
79
19
80
19
81
19
82
19
83
19
84
19
85
19
86
19
87
19
88
19
89
19
90
19
91
19
92
19
93
19
94
19
95
19
96
19
97
19
98
19
99
20
00
20
01
20
02
20
03
20
04
20
05
20
06
20
07
20
08
20
09
20
10
20
11
20
12
20
13
20
14
ENERGY IMPORTS COVERAGE (1962-2014)
AUSTRALIA AUSTRIA BELGIUM BELGIUM-LUXEMBOURG CANADA
CHILE CZECH REPUBLIC DENMARK ESTONIA FINLAND
FMR DEM. REP. GERMANY FMR FED. REP. GERMANY FRANCE GERMANY GREECE
HUNGARY ICELAND IRELAND ISRAEL ITALY
JAPAN KOREA LUXEMBOURG MEXICO NETHERLANDS
NEW ZEALAND NORWAY POLAND PORTUGAL SLOVAK REPUBLIC
SLOVENIA SPAIN SWEDEN SWITZERLAND TURKEY
UNITED KINGDOM UNITED STATES Average Weighted Average
Page 34 of 35
8. REFERENCES
1. Álvarez, E. y Larrea, M., Energy policy: European challenges, Spanish answers. Policy
paper 106, March 2014. Notre Europe. Jacques Delors Institute, p. 20-21.
2. Aranzadi, C. (2014). «Política energética y regulación. Teoría y Práctica» en Energía y
Regulación, Orkestra. Fundación Deusto.
3. Bartleet, M., & Gounder, R. (2010). Energy consumption and economic growth in New
Zealand: Results of trivariate and multivariate models. Energy Policy, 38(7), 3508-3517.
4. Belke, A., Dobnik, F., & Dreger, C. (2011). Energy consumption and economic
growth: New insights into the cointegration relationship. Energy Economics, 33(5), 782-
789.
5. British Petroleum Company. (2015). BP statistical review of world energy. London:
British Petroleum Co. Retrieved 16 April 2016, from http://www.bp.com/content/dam/bp-
country/de_de/PDFs/brochures/BP-statistical-review-of-world-energy-2014-full-report.pdf
6. BBVA RESEARCH,. (2013). España: balanza comercial de marzo 2013. Retrieved from
https://www.bbvaresearch.com/wp-
content/uploads/migrados/130517_Flash_Espana_BC_mar13_tcm346-387404.pdf
7. Carreras, A. and Tafunell, X. (2010). Historia económica de la España contemporánea (1789-
2009). Barcelona: Critica editorial.
8. Chontanawat, J. (2006). Causality between Energy Consumption and GDP: Evidence from 30
OECD and 78 Non-OECD Countries.
9. Cipolla, C. (1978). Historia económica de la población mundial. Barcelona: Crítica.
10. CORES, Informe Estadístico Anual 2014. Retrieved 9 March 2016, from
http://www.cores.es/sites/default/files/archivos/publicaciones/informe-estadistico-anual-2014.pdf
11. Csereklyei, Z., Rubio-Varas, M., & Stern, D. (2016). Energy and Economic Growth:
The Stylized Facts. EJ, 37(2).
12. Deloitte Conseil,. (2015). European energy market reform Country profile: Spain (p. 2, 12).
13. Eggoh, J., Bangake, C., & Rault, C. (2011). Energy consumption and economic growth
revisited in African countries. Energy Policy, 39(11), 7408-7421.
14. El estímulo, (2016). La vertiginosa historia del precio del petróleo. [online] Available at:
http://elestimulo.com/elinteres/la-vertiginosa-historia-del-precio-del-petroleo/ [Accessed 29 Apr.
2016]
15. Espejo Marín, C. and García Marín, R. (2010). Agua y energía: producción hidroeléctrica en
España. INGEO, 51, pp.107-129.
Page 35 of 35
16. González, M. (1979). La Economía política del franquismo (1940-1970): Dirigismo,
mercado y planificación. Manuel Jesu s Gonza lez Gonzalez (p. 307). Editorial Tecnos.
17. Lee, C. (2006). The causality relationship between energy consumption and GDP in G-
11 countries revisited. Energy Policy, 34(9), 1086-1093.
18. Lise, W., & Van Montfort, K. (2007). Energy consumption and GDP in Turkey: Is
there a co‐integration relationship?. Energy Economics, 29(6), 1166-1178.
19. Menegaki, A. (2011). Growth and renewable energy in Europe: A random effect model
with evidence for neutrality hypothesis. Energy Economics, 33(2), 257-263.
20. Nef, J. (1932). The rise of the British coal industry. London: G. Routledge.
21. Nef, J. (1977). An Early Energy Crisis and its Consequences. Sci Am, 237(5), 140-151.
22. Puche Riart, O., Mazariego Martínez, L. F. y Ortiz Menéndez, J. E. (2011): Petroleum
in the Spanish Iberian Peninsula. Cuadernos del Museo Geominero, 13, 227-238.
23. Rubio, M. & Tafunell, X. (2014). Latin American hydropower: A century of uneven
evolution. Renewable And Sustainable Energy Reviews, 38, 323-334.
http://dx.doi.org/10.1016/j.rser.2014.05.068
24. Shiryaevskaya, A., & Mengewein, J. (2014). Gas Carousel Making Spain Europe’s Biggest
LNG Exporter. Bloomberg.com. Retrieved 9 April 2016, from
http://www.bloomberg.com/news/articles/2014-04-10/gas-carousel-making-spain-europe-s-biggest-
lng-exporter
25. Slomp, H. and Slomp, H. (2011). Europe, a political profile (pp.357-574). Santa Barbara,
Calif.: ABC-CLIO.
26. Soytas, U., & Sari, R. (2003). Energy consumption and GDP: causality relationship in
G-7 countries and emerging markets. Energy Economics, 25(1), 33-37.
27. Sudriá, C (1997). “La restricción energética al desarrollo económico de España”, Papeles de
Economía Española, p. 165-188
28. Trythall, J., & Wright, A. (1978). The Spanish Economy 1959-1976. International Affairs
(Royal Institute Of International Affairs 1944-), 54(2), 325.
29. Vukmanovic, O. (2016). Gas price convergence stalls Spanish LNG exports. Reuters UK.
Retrieved 9 April 2016, from http://uk.reuters.com/article/uk-spain-lng-global-gas-
idUKKBN0NK2BU20150429
30. Yildirim, E., & Aslan, A. (2012). Energy consumption and economic growth nexus for
17 highly developed OECD countries: Further evidence based on bootstrap-corrected
causality tests. Energy Policy, 51, 985-993.