Aacrea Reunión Variedades 2008
101
El cultivo de Soja en el El cultivo de Soja en el movimiento CREA movimiento CREA Comportamiento Zonal y de Comportamiento Zonal y de Variedades Variedades Campaña 2007-2008 Campaña 2007-2008 AACREA, jueves 2 de Octubre de AACREA, jueves 2 de Octubre de 2008 2008 Planes N acionales
-
Upload
fernando-munoz -
Category
Technology
-
view
1.340 -
download
4
Transcript of Aacrea Reunión Variedades 2008
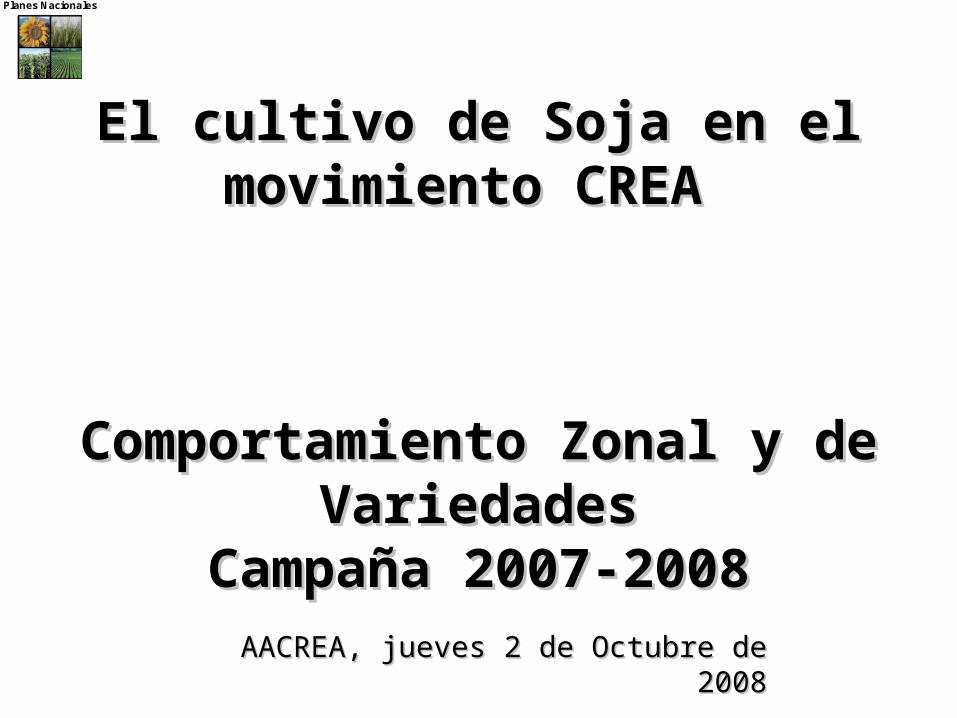
El cultivo de Soja en el El cultivo de Soja en el movimiento CREAmovimiento CREA
Comportamiento Zonal y de Comportamiento Zonal y de VariedadesVariedades
Campaña 2007-2008Campaña 2007-2008AACREA, jueves 2 de Octubre de 2008AACREA, jueves 2 de Octubre de 2008
Planes Nacionales

NOA
Córdoba Norte
Norte de Santa Fe
Santa Fe Centro
Sur de Santa Fe
Litoral Sur
Norte de Buenos Aires
Oeste Arenoso
Sudeste
Sudoeste
Oeste
Mar y Sierras
Semiárida
Regiones de AACREARegiones de AACREA

NOANOA

Cultivo de Soja. Región CREA-NOA
RENDIMIENTO ZONAL y SUPERFICIE POR CAMPAÑACampañas 2003 a 2008 - (Prom. Arit.)
105,9 155,6 143,5
2351
1943
2436
2986
32803457
150,0122,8138,2
0,0
500,0
1000,0
1500,0
2000,0
2500,0
3000,0
3500,0
4000,0
2002-03 2003-04 2004-05 2005-06 2006-07 2007-08
KG/HA
SUPERFICIE (en miles de has)
RINDE ARITMETICO (en kg/ha)

Análisis por Variedades - Secano (Las 10 más sembradas)
Variedad Casos Superficie Rendimientos (kg/ha)Dif. Sign. CV %
N° % has % Aritmético Ponderado
A-7636 141 9% 14507 11% 3707 3901 a 14,5%
ADM-6200 25 2% 2625 2% 3672 3800 a 12,0%
AW-7110 107 7% 10597 8% 3473 3551 b 13,8%
A-6401 108 7% 11895 9% 3377 3512 bc 17,5%
A-7053 43 3% 4079 3% 3341 3350 bc 15,3%
A-6411 48 3% 6339 5% 3339 3583 bc 17,1%
A-8000 394 26% 32578 24% 3259 3321 c 18,4%
NA-7708 32 2% 3517 3% 3233 3291 c 18,3%
A-8100 157 10% 14325 10% 3193 3301 c 19,8%
Munasqa 182 12% 16083 12% 2968 2999 d 18,3%
OTRAS 264 18% 20463 15% 3292 3310 19,3%
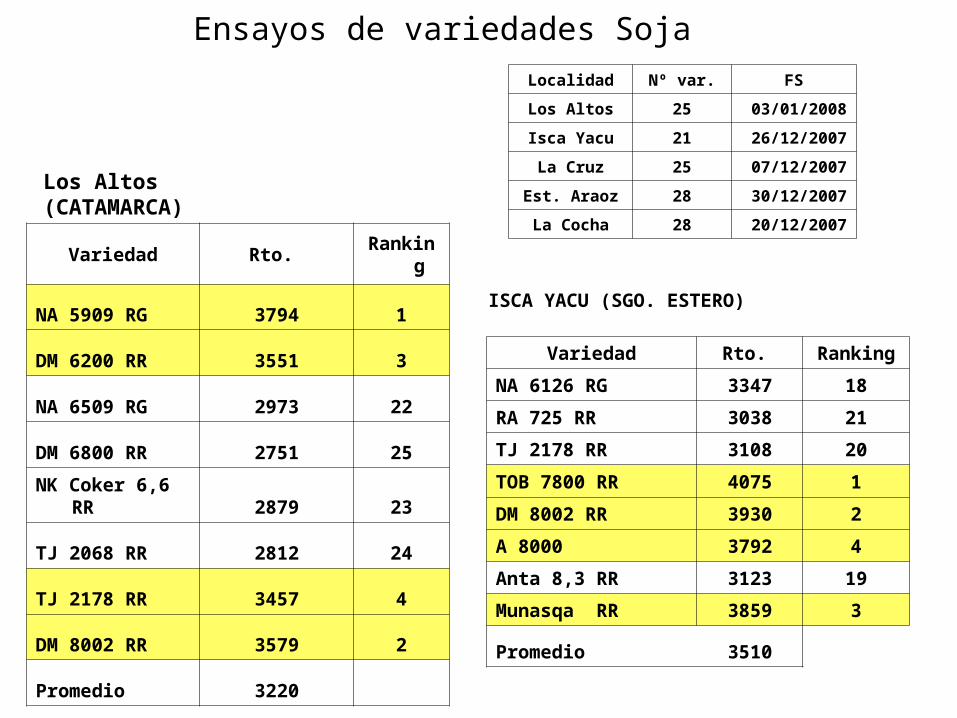
Ensayos de variedades Soja
Variedad Rto. Ranking
NA 5909 RG 3794 1
DM 6200 RR 3551 3
NA 6509 RG 2973 22
DM 6800 RR 2751 25
NK Coker 6,6 RR 2879 23
TJ 2068 RR 2812 24
TJ 2178 RR 3457 4
DM 8002 RR 3579 2
Promedio 3220
Variedad Rto. Ranking
NA 6126 RG 3347 18
RA 725 RR 3038 21
TJ 2178 RR 3108 20
TOB 7800 RR 4075 1
DM 8002 RR 3930 2
A 8000 3792 4
Anta 8,3 RR 3123 19
Munasqa RR 3859 3
Promedio 3510
Los Altos (CATAMARCA)
ISCA YACU (SGO. ESTERO)
Localidad Nº var. FS
Los Altos 25 03/01/2008
Isca Yacu 21 26/12/2007
La Cruz 25 07/12/2007
Est. Araoz 28 30/12/2007
La Cocha 28 20/12/2007
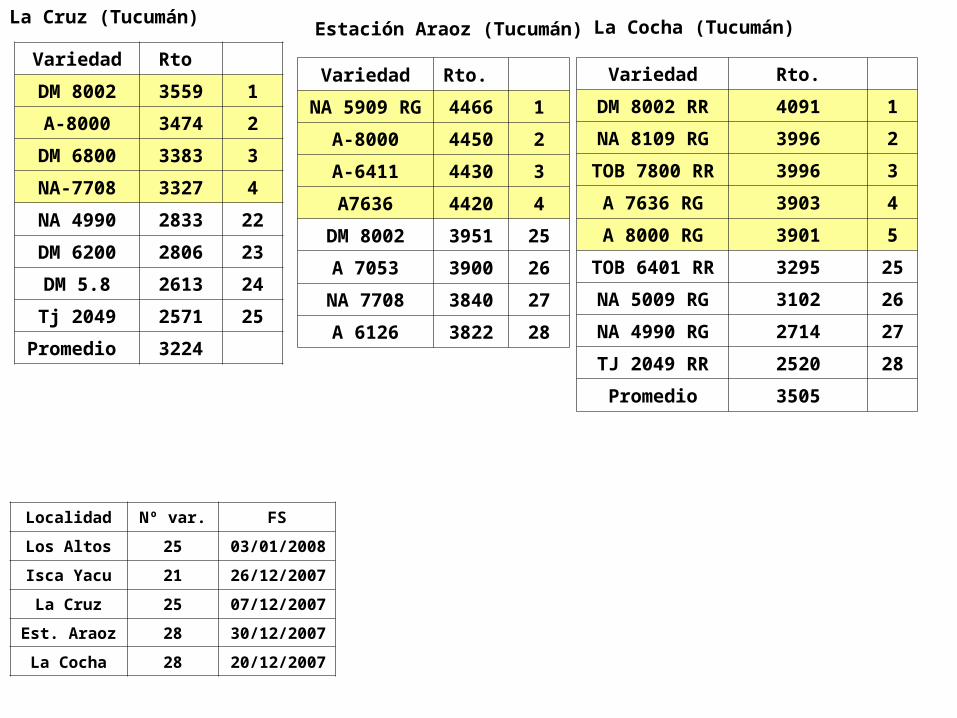
Variedad Rto
DM 8002 3559 1
A-8000 3474 2
DM 6800 3383 3
NA-7708 3327 4
NA 4990 2833 22
DM 6200 2806 23
DM 5.8 2613 24
Tj 2049 2571 25
Promedio 3224
Variedad Rto.
NA 5909 RG 4466 1
A-8000 4450 2
A-6411 4430 3
A7636 4420 4
DM 8002 3951 25
A 7053 3900 26
NA 7708 3840 27
A 6126 3822 28
Variedad Rto.
DM 8002 RR 4091 1
NA 8109 RG 3996 2
TOB 7800 RR 3996 3
A 7636 RG 3903 4
A 8000 RG 3901 5
TOB 6401 RR 3295 25
NA 5009 RG 3102 26
NA 4990 RG 2714 27
TJ 2049 RR 2520 28
Promedio 3505
La Cruz (Tucumán)Estación Araoz (Tucumán)
Localidad Nº var. FS
Los Altos 25 03/01/2008
Isca Yacu 21 26/12/2007
La Cruz 25 07/12/2007
Est. Araoz 28 30/12/2007
La Cocha 28 20/12/2007
La Cocha (Tucumán)

Córdoba NorteCórdoba Norte

AACREA AACREA REGION CORDOBA REGION CORDOBA
NORTENORTESoja 2007-2008Soja 2007-2008
Ing. Agr. M. Celeste Gregoret – Responsable Área técnicaIng. Agr. M. Celeste Gregoret – Responsable Área técnica

Análisis de campaña 07-08Análisis de campaña 07-08Resumen de la información Resumen de la información
recibidarecibida 10 grupos CREA
1.309 lotes o parcelas (casos)
82.209 has
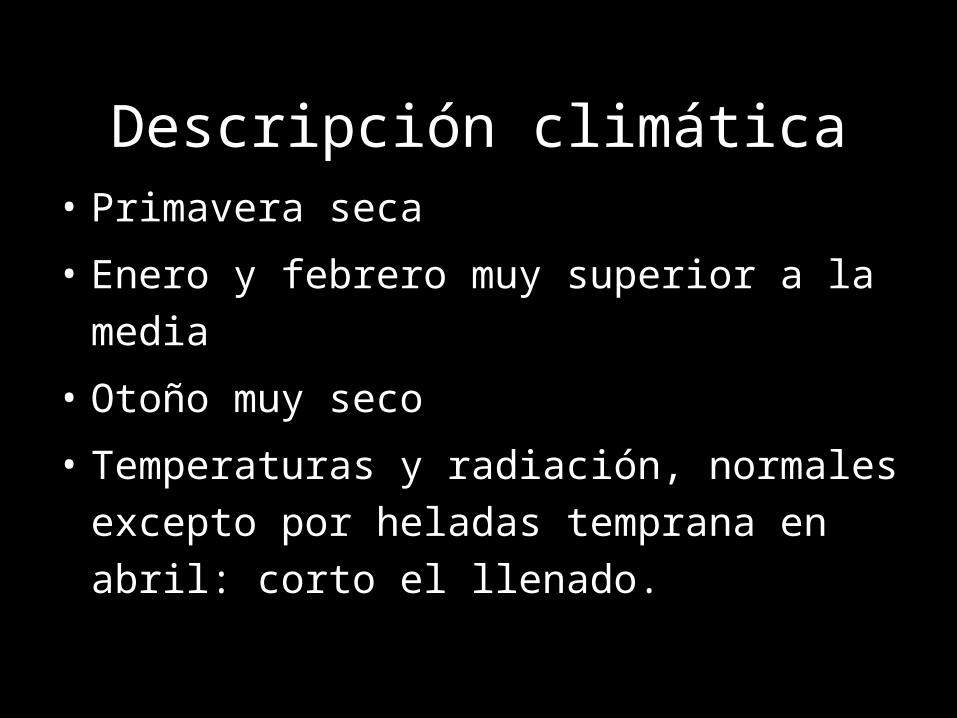
Descripción climática• Primavera seca
• Enero y febrero muy superior a la media
• Otoño muy seco
• Temperaturas y radiación, normales excepto
por heladas temprana en abril: corto el llenado.

27,1635,43 54104.61875Riego
31,12
CV Máx.Min.Medio
30,99
Rendimiento (qq/ha)
61177.5911.295Secano
Sup.(has)n° lotes
Dato
s g
en
era
les
0
10
20
30
40
50
60
70
Secano Riego
Ren
d.(
/ha)
0
5
10
15
20
25
30
35
CV
(%)
Media Mín Máx CV

Evolu
ción
su
perfi
cie y
ren
dim
ien
tos
1,447 2,696 3,0224,795 4,035 4,618
77,59172,14871,17562,11250,261
33,428
31.43
21.78
24.8226.38
31.41 30.99
28.7530.25
34.69
31.86
39.46
35.43
0
10,000
20,000
30,000
40,000
50,000
60,000
70,000
80,000
90,000
2002-03 2003-04 2004-05 2005-06 2006-07 2007-08
Su
p.(
ha
s)
0
5
10
15
20
25
30
35
40
45R
en
d.(q
q/h
a)
Sup. Secano Sup. Riego Rinde Secano Rinde Riego
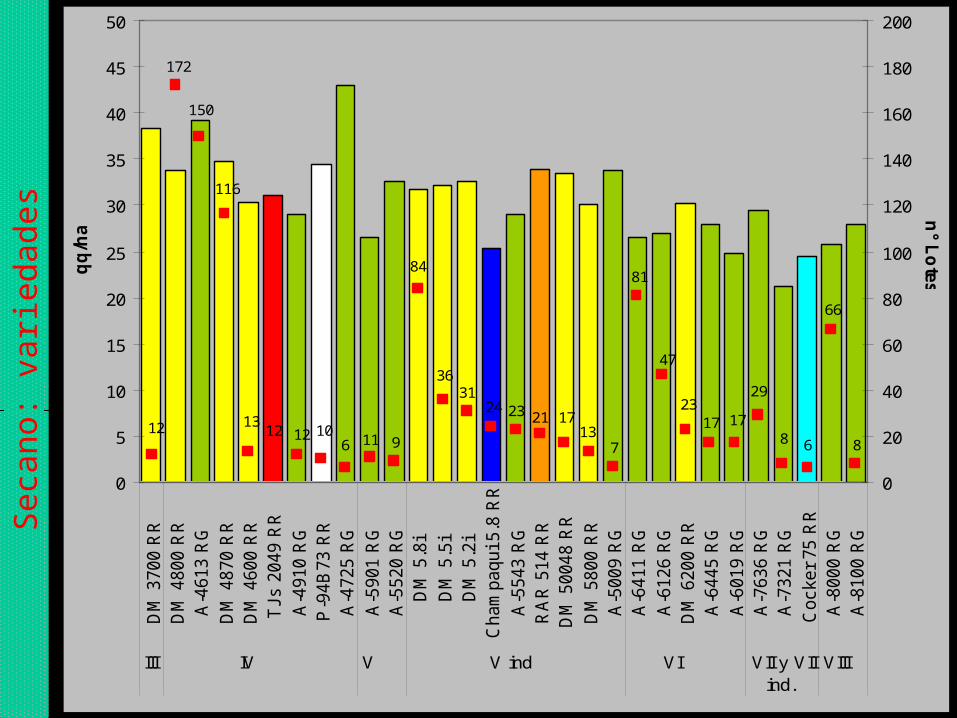
23
47
81
713
1721232431
36
84
9116101212
13
116
150
172
128
66
68
29
1717
0
5
10
15
20
25
30
35
40
45
50
DM
3700 R
R
DM
4800 R
R
A-4
613 R
G
DM
4870 R
R
DM
4600 R
R
TJs 2
049 R
R
A-4
910 R
G
P-9
4B
73 R
R
A-4
725 R
G
A-5
901 R
G
A-5
520 R
G
DM
5.8
i
DM
5.5
i
DM
5.2
i
Cham
paqui 5.8
RR
A-5
543 R
G
RA
R 5
14 R
R
DM
50048 R
R
DM
5800 R
R
A-5
009 R
G
A-6
411 R
G
A-6
126 R
G
DM
6200 R
R
A-6
445 R
G
A-6
019 R
G
A-7
636 R
G
A-7
321 R
G
Cocker
75 R
R
A-8
000 R
G
A-8
100 R
G
III IV V V ind VI VII y VIIind.
VIII
/ha
0
20
40
60
80
100
120
140
160
180
200n
° Lo
tes
Seca
no:
vari
ed
ad
es
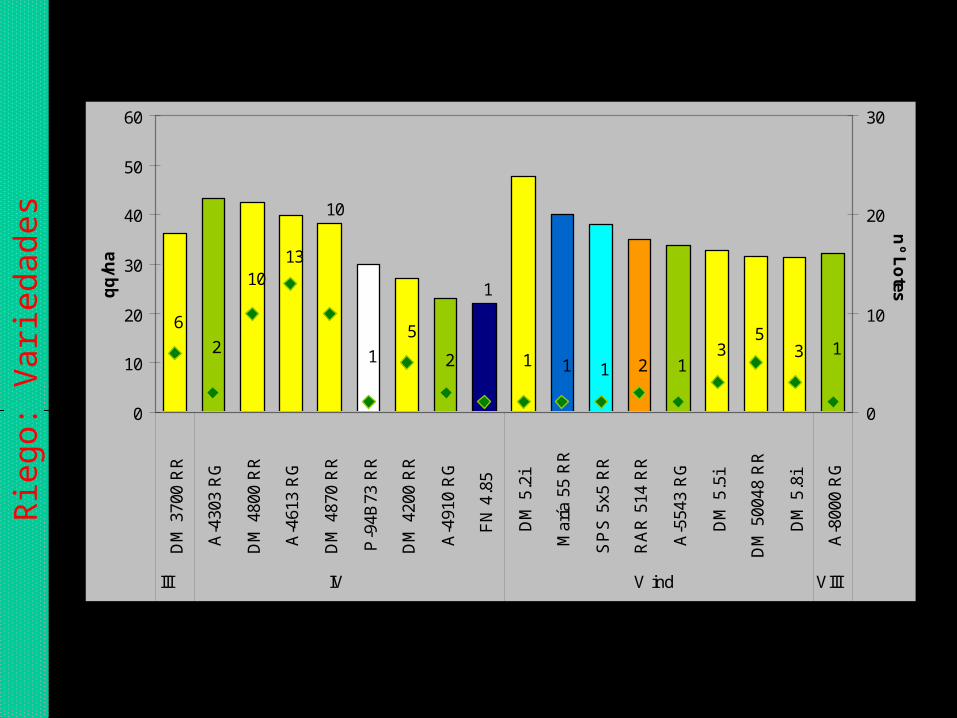
Rie
go:
Vari
ed
ad
es
2
6
1
13
2
10
1
10
5
2
1
1 1 1 13
53
0
10
20
30
40
50
60
DM
370
0 R
R
A-4
303
RG
DM
480
0 R
R
A-4
613
RG
DM
487
0 R
R
P-9
4B73
RR
DM
420
0 R
R
A-4
910
RG
FN
4.8
5
DM
5.2
i
Mar
ía 5
5 R
R
SP
S 5
x5 R
R
RA
R 5
14 R
R
A-5
543
RG
DM
5.5
i
DM
500
48 R
R
DM
5.8
i
A-8
000
RG
III IV V ind VIII
/ha
0
10
20
30
nº L
otes

Gracias!
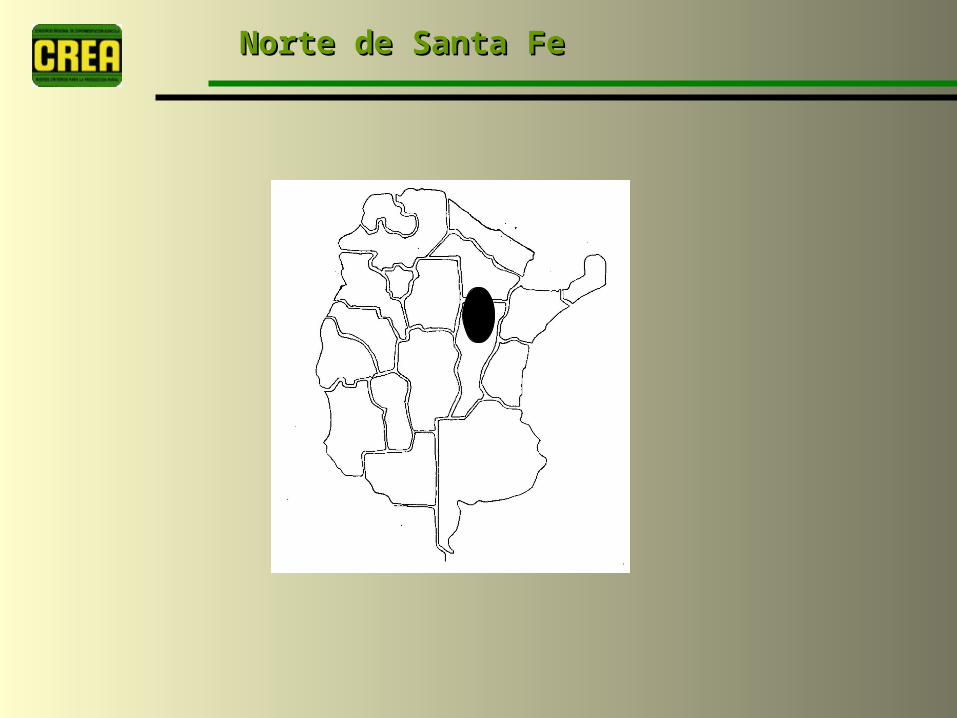
Norte de Santa Fe Norte de Santa Fe
CREAs CREAs NORTE DE SANTA FENORTE DE SANTA FE
SOJA SOJA 2007-20082007-2008
02-octubre-2008

Este NORTE(CREAs Villa Ana-Margarita)
Este SUR(CREAs San Bernardo-Ramayón-Margarita)
OESTE (CREAs Villa Ana, Ramayón, Margarita)
REGIÓN NORTE DE SANTA FESUBZONAS DE ANÁLISIS DE LA INFORMACIÓNSOJA 2007/08
Campaña 2007-08
Superficie Zonal:
23329 ha
Rto Medio:
1734 kg/ha
Información de :
4 Grupos CREAs
Lotes analizados:
469

Evolución de Superficie Sembrada y RendimientosCREAs del Norte de Santa Fe
-
500
1,000
1,500
2,000
2,500
3,000
-
10,000
20,000
30,000
40,000
50,000
60,000
Superficie 22059 24728 24126 35004 33504 28170 20251 23329
Rinde Promedio 2368 1670 2328 2005 1728 1935 2544 1734
Prom últ 5 años 1958 1958 1958 1958 1958
00-01 01-02 02-03 03-04 04-05 05-06 06-07 07-08
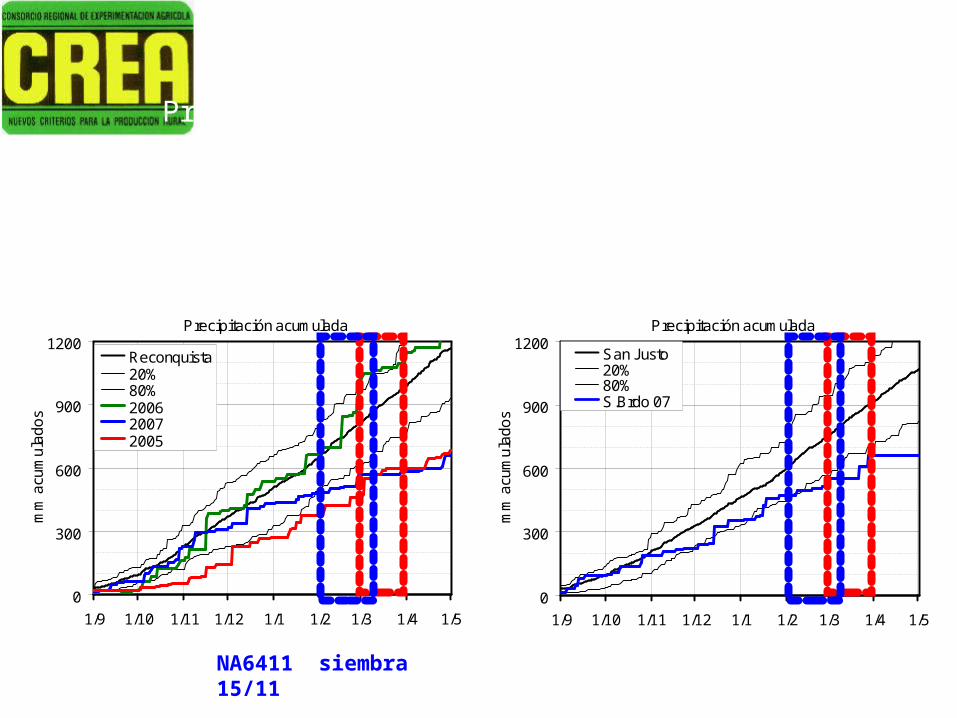
Precipitación acumulada
0
300
600
900
1200
1/9 1/10 1/11 1/12 1/1 1/2 1/3 1/4 1/5
mm
acu
mu
lad
os
Reconquista20%80%200620072005
ZONA Este Norte ZONA Este Sur
Precipitaciones durante el ciclo del cultivo
Precipitación acumulada
0
300
600
900
1200
1/9 1/10 1/11 1/12 1/1 1/2 1/3 1/4 1/5
mm
acu
mu
lad
os
San Justo20%80%S.Brdo 07
NA6411 siembra 15/11
NA8000 siembra 15/12
Periodo R3-R6
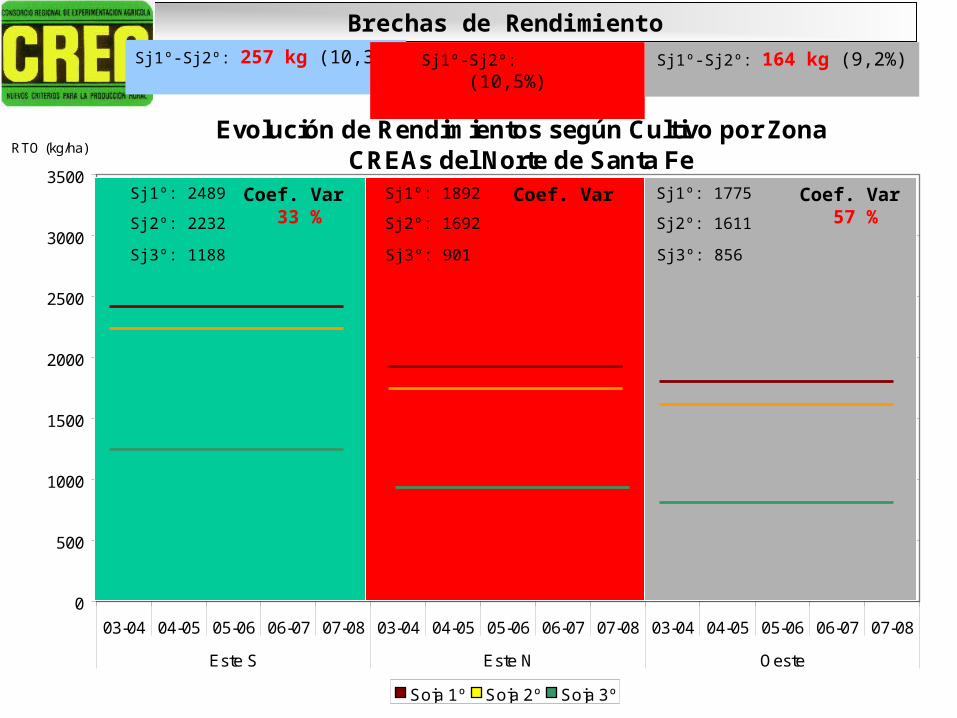
Brechas de Rendimiento
Evolución de Rendimientos según Cultivo por ZonaCREAs del Norte de Santa Fe
0
500
1000
1500
2000
2500
3000
3500
03-04 04-05 05-06 06-07 07-08 03-04 04-05 05-06 06-07 07-08 03-04 04-05 05-06 06-07 07-08
Este S Este N Oeste
RTO (kg/ha)
Soja 1º Soja 2º Soja 3º
Sj1º-Sj2º: 257 kg (10,3%) Sj1º-Sj2º: 199 kg (10,5%) Sj1º-Sj2º: 164 kg (9,2%)
Sj1º: 2489
Sj2º: 2232
Sj3º: 1188
Sj1º: 1892
Sj2º: 1692
Sj3º: 901
Sj1º: 1775
Sj2º: 1611
Sj3º: 856
Coef. Var 33 %
Coef. Var 46 %
Coef. Var 57 %
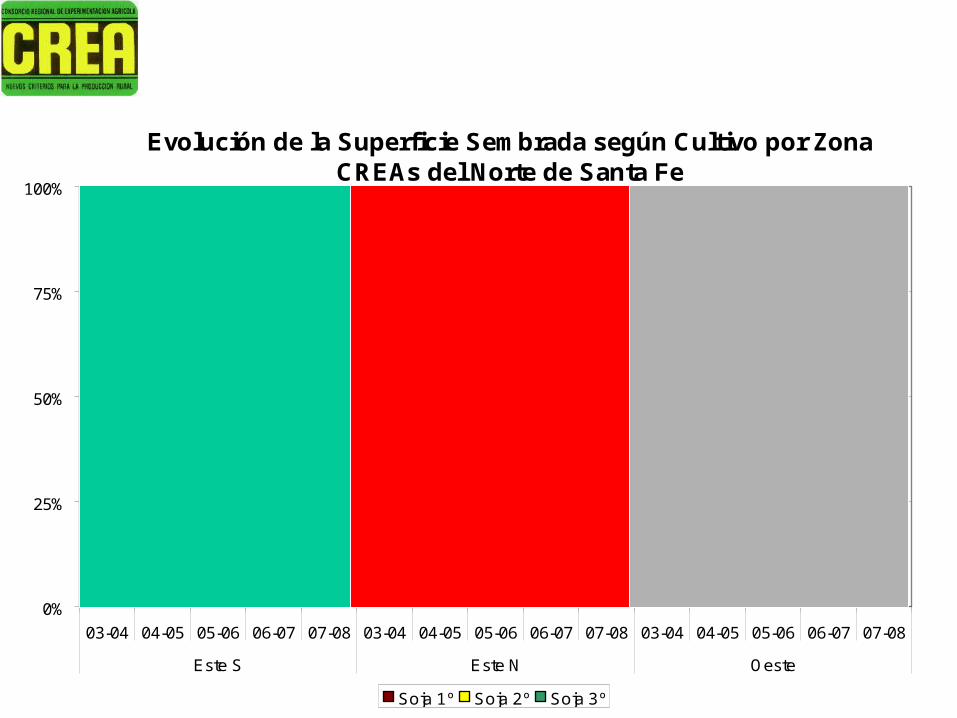
Evolución de la Superficie Sembrada según Cultivo por ZonaCREAs del Norte de Santa Fe
0%
25%
50%
75%
100%
03-04 04-05 05-06 06-07 07-08 03-04 04-05 05-06 06-07 07-08 03-04 04-05 05-06 06-07 07-08
Este S Este N Oeste
Soja 1º Soja 2º Soja 3º
Distribución de la Superficie Sembrada por ZonasCampaña 2007/ 08
CREAs del Norte de Santa Fe
Este S55%
Oeste12% Este N
33%
Total: 23329 ha
SOJA 2007/08
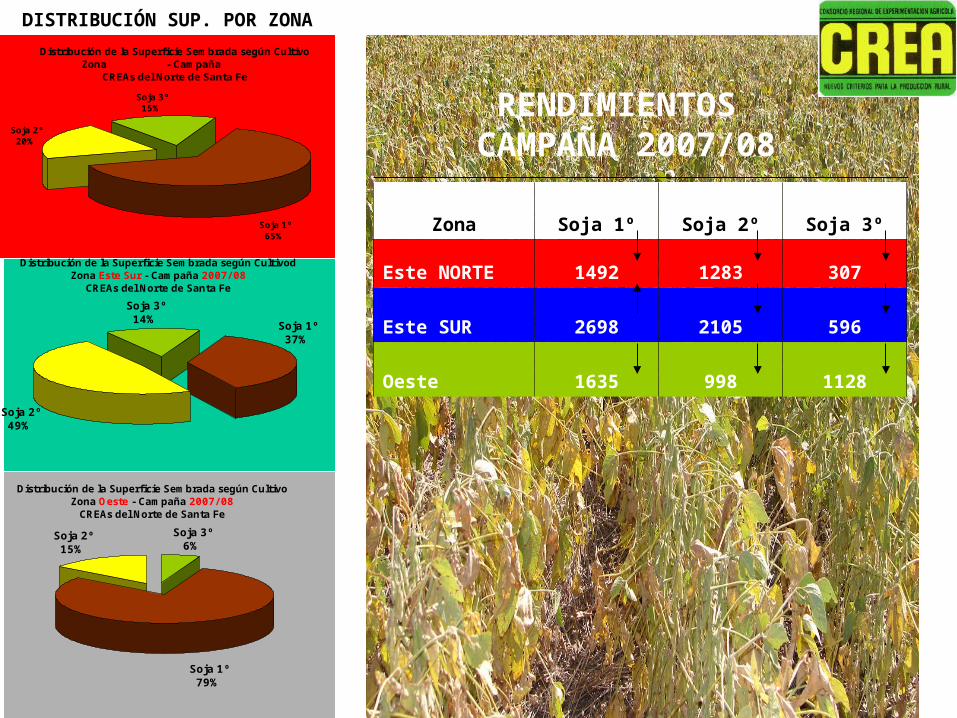
Distribución de la Superficie Sembrada según Cultivo Zona Este Norte - Campaña 2007/ 08
CREAs del Norte de Santa Fe
Soja 2º20%
Soja 3º15%
Soja 1º65%
Distribución de la Superficie Sembrada según CultivodZona Este Sur - Campaña 2007/ 08
CREAs del Norte de Santa Fe
Soja 2º49%
Soja 3º14%
Soja 1º37%
Distribución de la Superficie Sembrada según CultivoZona Oeste - Campaña 2007/ 08
CREAs del Norte de Santa Fe
Soja 2º15%
Soja 3º6%
Soja 1º79%
RENDIMIENTOS CAMPAÑA 2007/08
DISTRIBUCIÓN SUP. POR ZONA
Zona Soja 1º Soja 2º Soja 3º
Este NORTE 1492 1283 307
Este SUR 2698 2105 596
Oeste 1635 998 1128

Soja C 07/ 08: Variedades Zona Este SUR 6
1013
632123
12
84
82
62222
157
417
13
1810
4221
0 500 1000 1500 2000 2500 3000 3500 4000
A 4725A 4910RA 518RA 514A 5009
DM 5.8 iRA 516A 5485
DM 5800DM 5.5iTJ 2164RA 626RA 625A 6411A 6445A 6126RA 633
DM 6200TJ 2178A 7118RA 725RA 728A 7321A 7636RA 709
TJ 2070DM 7.0iA 7708A 8010A 8000
DM 8001DM 8002
Rto (kg/ ha)
CREAs del Norte de Santa Fe
32 variedades191 casos

CREAs del Norte de Santa Fe
Variedades utilizadas - Zona Este SURCampaña 2007/ 08
A 77085%
TJ 21645%
A 763610%
A 801027%
A 800010%
Total: 9377 ha

Soja C 07/ 08: Variedades Zona Este NORTE 2
5
2
3
1
3
7
15
1
29
47
11
0 500 1000 1500 2000 2500 3000 3500 4000
A 4910
Champaquí 580
DM 5.8 i
A 6126
RA 626
RA 703
TJ 2178
A 7636
A 7708
Munasqa
A 8000
A 8413
Rto (kg/ ha)
CREAs del Norte de Santa Fe
12 variedades126 casos

CREAs del Norte de Santa Fe
Variedades utilizadas - Zona Este NORTECampaña 2007/ 08
TJ 21788%
A 763614%
Munasqa29%
A 800025%
A 61267%
Total: 5758 ha
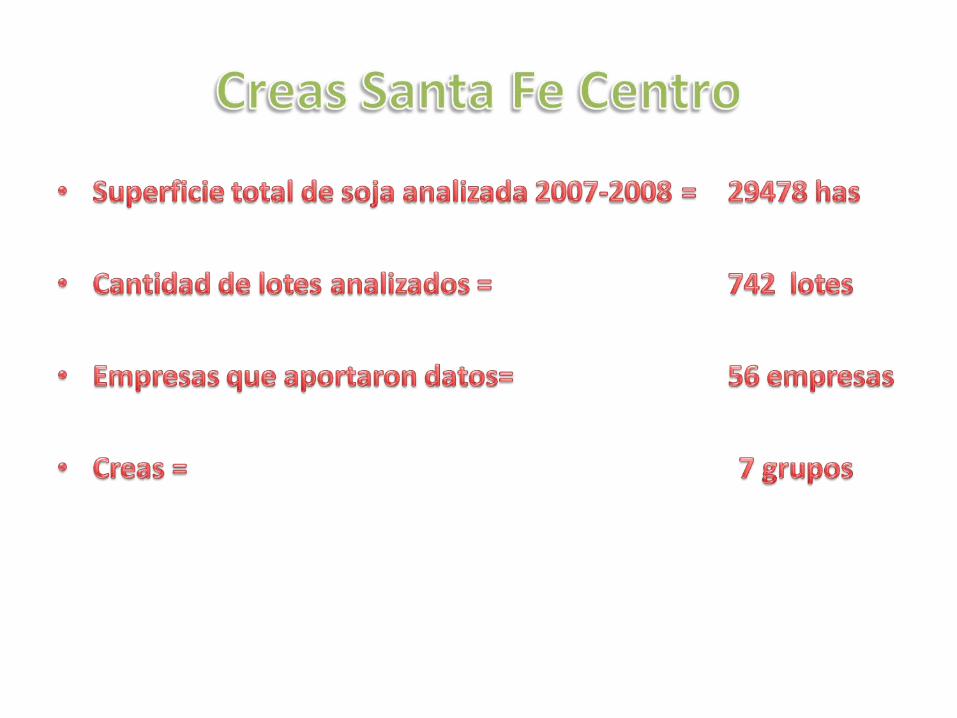
Santa Fe CentroSanta Fe Centro
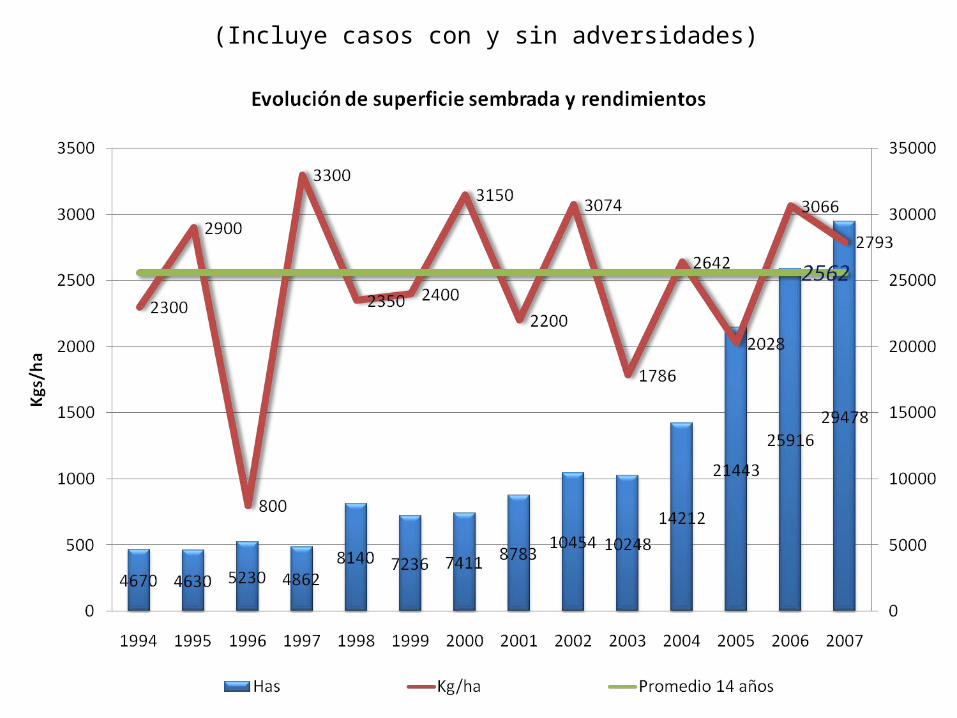
(Incluye casos con y sin adversidades)
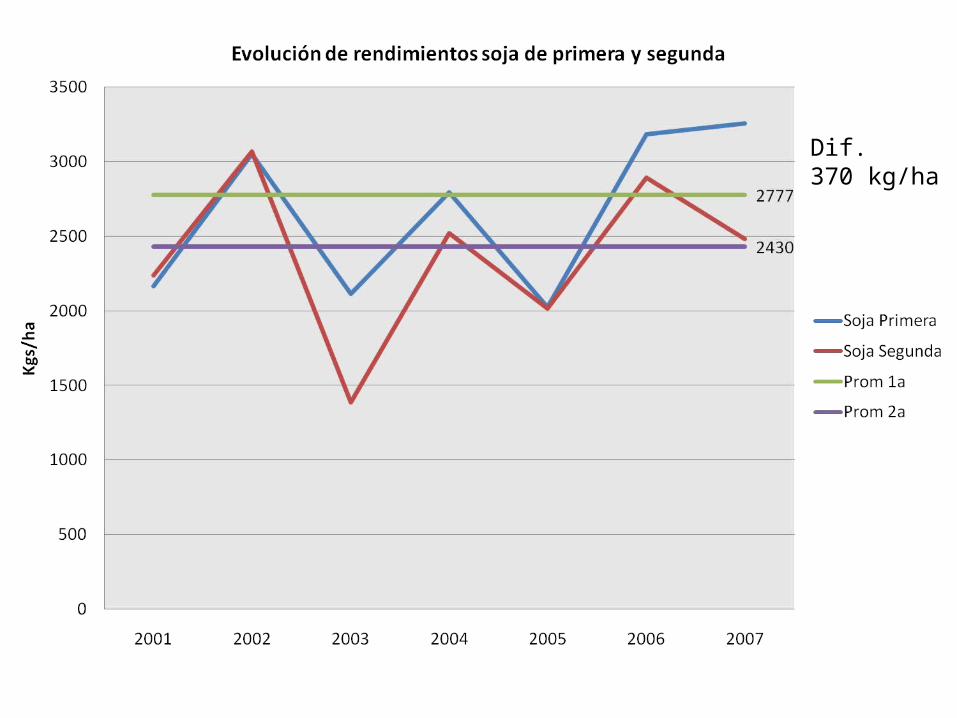
Dif.370 kg/ha

Cuartil 1Cuartil 2Cuartil 3Cuartil 4


Litoral SurLitoral Sur

Soja en la región Litoral Sur de
AACREACampaña 2007/2008
Superficie Analizada: 98993 has (>1600 casos)
Rendimiento promedio: 2401 kg/ha
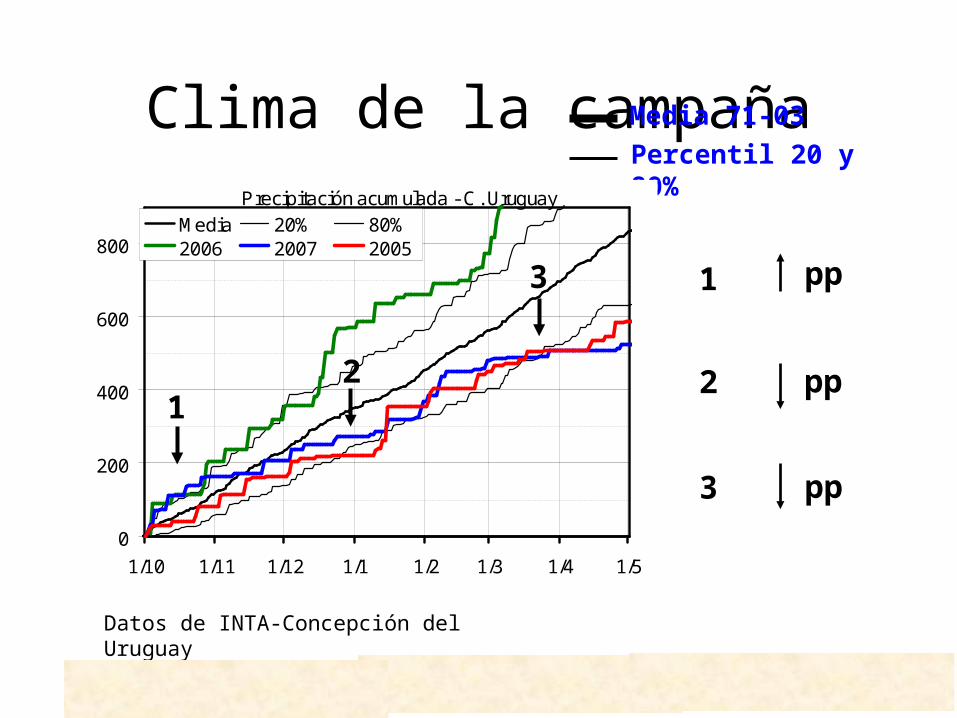
Clima de la campaña
Datos de INTA-Concepción del Uruguay
Media 71-03
Percentil 20 y 80%
Precipitación acumulada - C. Uruguay
0
200
400
600
800
1/10 1/11 1/12 1/1 1/2 1/3 1/4 1/5
Media 20% 80%2006 2007 2005
12
3 1
2
3
pp
pp
pp
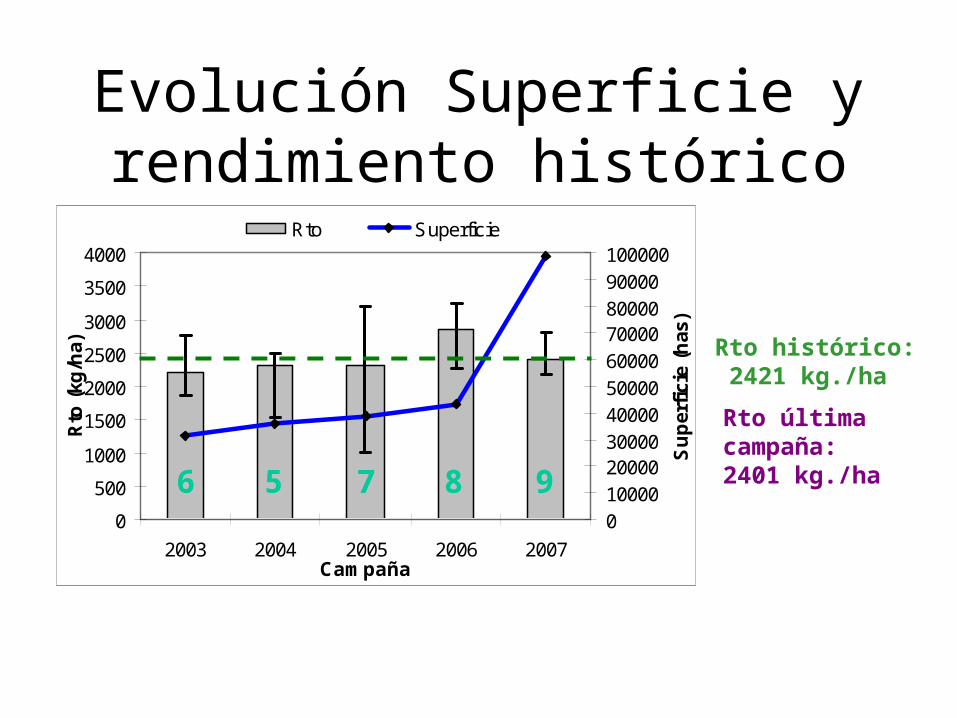
Evolución Superficie y rendimiento histórico
Rto histórico: 2421 kg./ha
0
500
1000
1500
2000
2500
3000
3500
4000
2003 2004 2005 2006 2007Campaña
Rto
(kg
/ha)
0100002000030000400005000060000700008000090000100000
Su
per
fici
e (h
as)
Rto Superficie
6 5 7 8 9
Rto última campaña:2401 kg./ha

Variedades
0
500
1000
1500
2000
2500
3000
3500
4000
4500
5000
N6411
N6126
N4613
N6445
DM5.
8I
N4910
DM62
00
DM5.
5I
N7636
RA626
DM46
00
N6019
N5485
RA518
Tj20
49
Campaña
Rto
(kg
/ha)
0
5
10
15
20
25
Su
per
fici
e (%
)
Rto Superficie
Se sembraron en total 48 variedades.
82% de la superficie total.
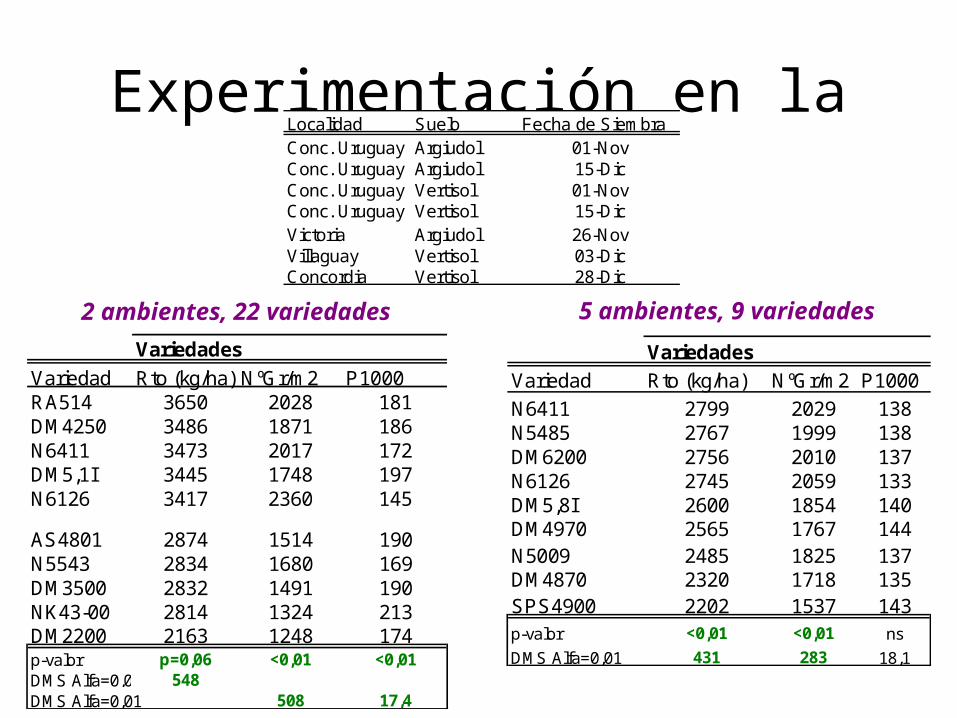
Experimentación en la zona
Variedades
Variedad Rto (kg/ha) NºGr/m2 P1000RA514 3650 2028 181DM4250 3486 1871 186N6411 3473 2017 172DM5,1I 3445 1748 197N6126 3417 2360 145
AS4801 2874 1514 190N5543 2834 1680 169DM3500 2832 1491 190NK43-00 2814 1324 213DM2200 2163 1248 174p-valor p=0,06 <0,01 <0,01DMS Alfa=0,05 548DMS Alfa=0,01 508 17,4
Variedades
Variedad Rto (kg/ha) NºGr/m2 P1000
N6411 2799 2029 138N5485 2767 1999 138DM6200 2756 2010 137N6126 2745 2059 133DM5,8I 2600 1854 140DM4970 2565 1767 144N5009 2485 1825 137DM4870 2320 1718 135SPS4900 2202 1537 143p-valor <0,01 <0,01 ns
DMS Alfa=0,01 431 283 18,1
2 ambientes, 22 variedades 5 ambientes, 9 variedades
Localidad Suelo Fecha de SiembraConc. Uruguay Argiudol 01-NovConc. Uruguay Argiudol 15-DicConc. Uruguay Vertisol 01-NovConc. Uruguay Vertisol 15-DicVictoria Argiudol 26-NovVillaguay Vertisol 03-DicConcordia Vertisol 28-Dic
Líneas de interésoVariedades, GM - F Siembra
oNutrición Sj2ª, Variedades Sj2ª
oSj3ª

CentroCentro
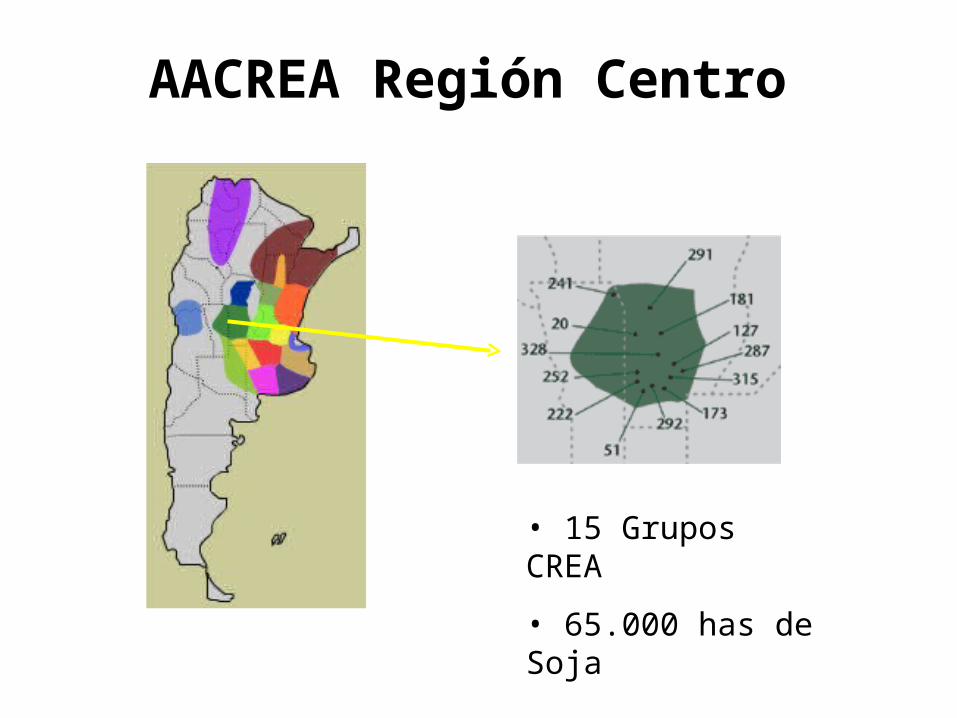
AACREA Región Centro
• 15 Grupos CREA
• 65.000 has de Soja
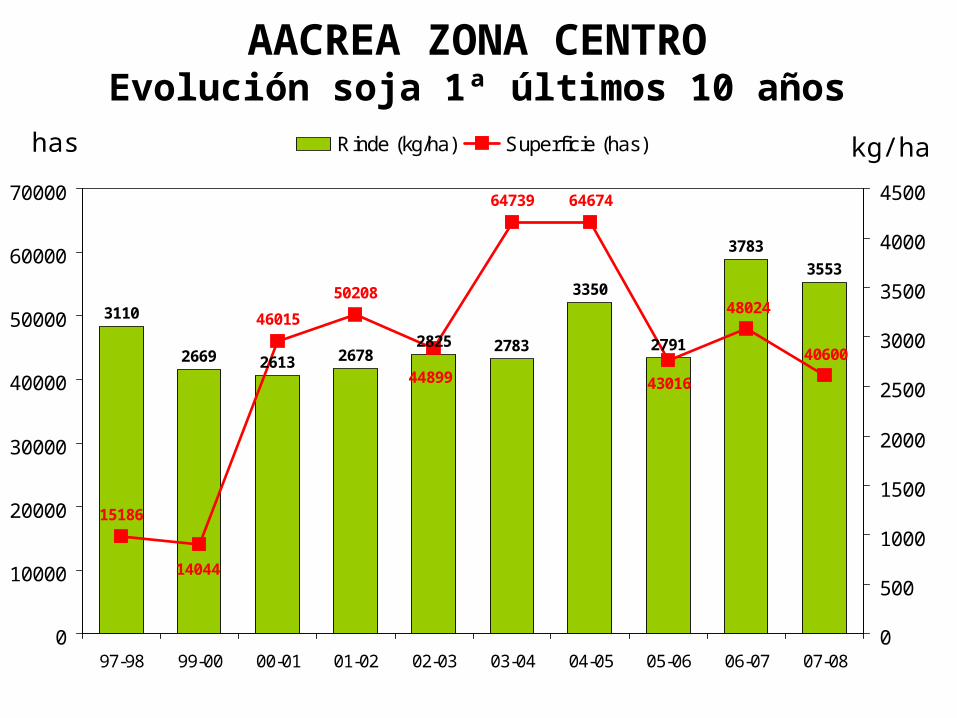
3110
2669 2613 26782825 2783
3350
2791
3783
3553
15186
46015
50208
64739 64674
40600
14044
44899
48024
43016
0
10000
20000
30000
40000
50000
60000
70000
97-98 99-00 00-01 01-02 02-03 03-04 04-05 05-06 06-07 07-080
500
1000
1500
2000
2500
3000
3500
4000
4500
Rinde (kg/ha) Superficie (has)has kg/ha
Campaña
AACREA ZONA CENTROEvolución soja 1ª últimos 10 años
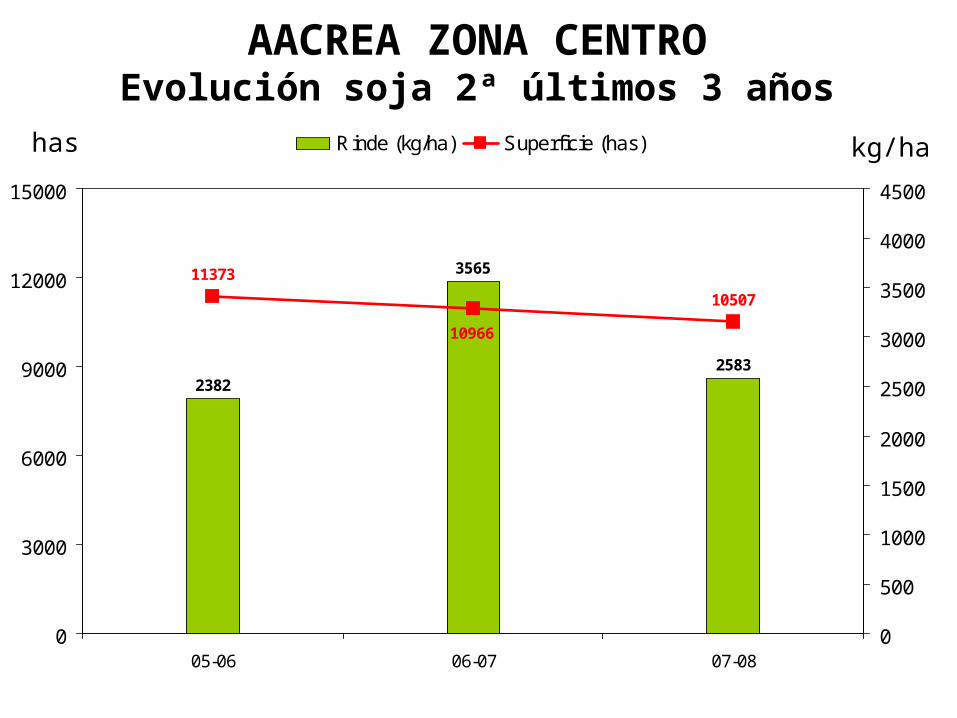
2382
3565
2583
11373
10507
10966
0
3000
6000
9000
12000
15000
05-06 06-07 07-080
500
1000
1500
2000
2500
3000
3500
4000
4500
Rinde (kg/ha) Superficie (has)has kg/ha
Campaña
AACREA ZONA CENTROEvolución soja 2ª últimos 3 años
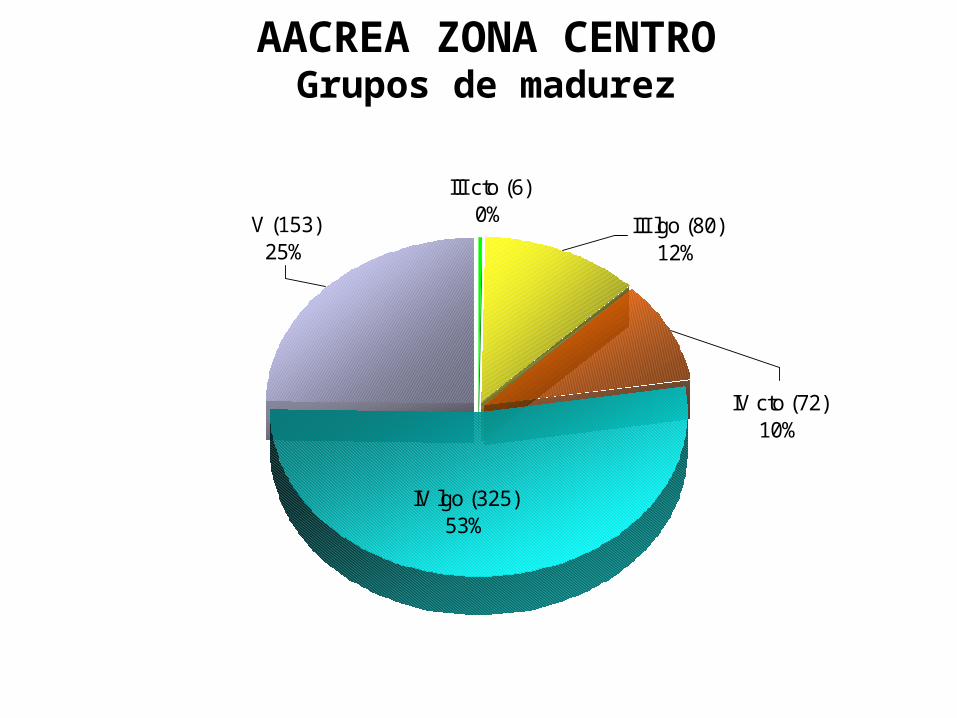
V (153)25%
III cto (6) 0% III lgo (80)
12%
IV cto (72) 10%
IV lgo (325)53%
AACREA ZONA CENTROGrupos de madurez
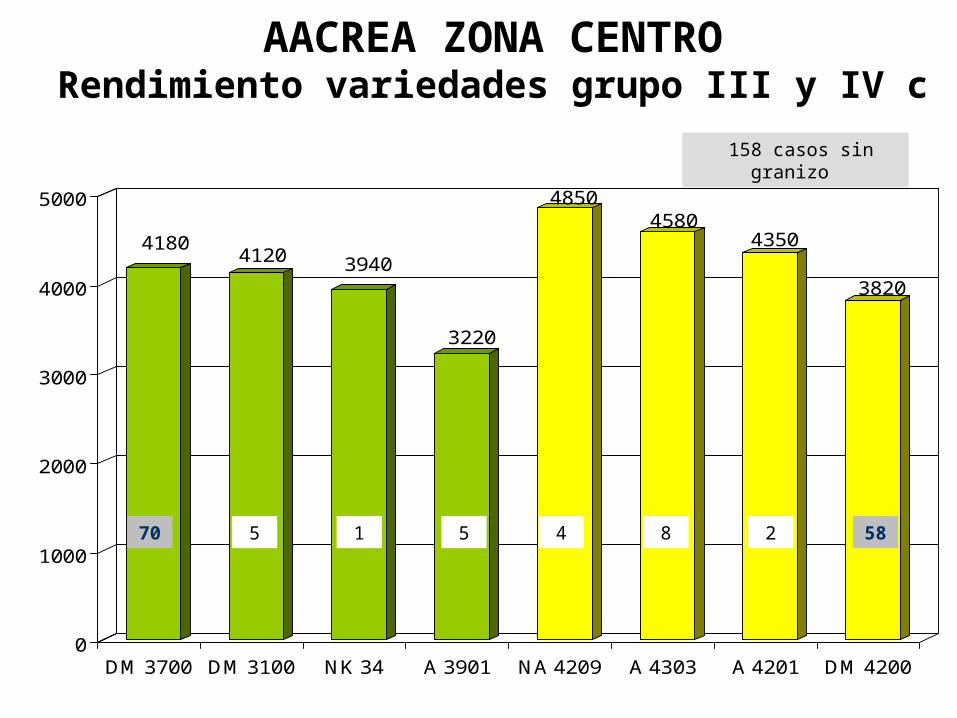
41804120 3940
3220
48504580
4350
3820
0
1000
2000
3000
4000
5000
DM 3700 DM 3100 NK 34 A 3901 NA 4209 A 4303 A 4201 DM 4200
kg/ha
Variedades
AACREA ZONA CENTRORendimiento variedades grupo III y IV c
5 170 5 588
158 casos sin granizo
24
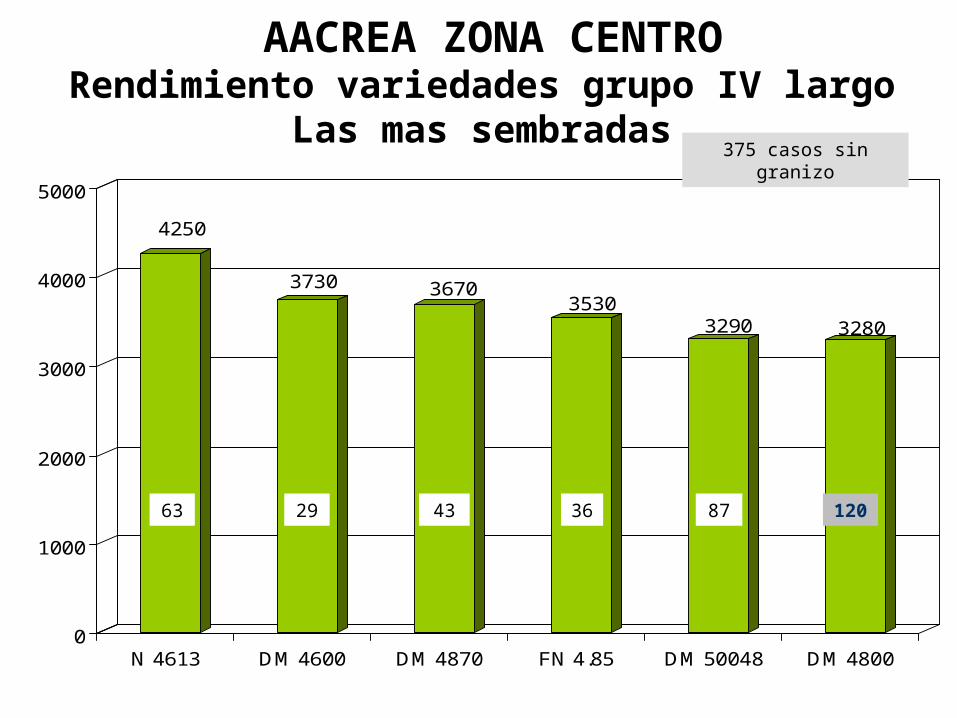
4250
3730 36703530
3290 3280
0
1000
2000
3000
4000
5000
N 4613 DM 4600 DM 4870 FN 4.85 DM 50048 DM 4800
kg/ha
Variedades
AACREA ZONA CENTRORendimiento variedades grupo IV largo
Las mas sembradas
1208763 29
375 casos sin granizo
43 36

3130 3090 3070 3050
1660
970
0
1000
2000
3000
4000
5000
A 5520 DM 5.2i DM 5.5i A 5409 TJ 2055 NA 5485
kg/ha
AACREA ZONA CENTRORendimiento variedades grupo V
114 13
66 casos sin granizo
29 14

VARIEDAD RINDE AJUSTADO (KG/HA)
NA 4613 4866
DM 4250 4863
NA 4209 4743
DM 4670 4686
NA 4553 4335
SPS 3900 4301
NA 5485 4050
P 94M80 3979
AACREA REGION CENTROResumen ensayos de cultivares 07-08 (2)
OesteOeste

Soja 1ra: resultado zonal 07-08
y = 66,418x + 2400,6R² = 0,356
0100002000030000400005000060000700008000090000100000110000120000130000140000
0
500
1000
1500
2000
2500
3000
3500
4000
96/97 97/98 98/99 99/00 00/01 01/02 02/03 03/04 04/05 05/06 06/07 07-08
hasSOJA -CAMPAÑA 07-08ZONA OESTE
Rendimiento Superficie
CAMPAÑA 96/97 97/98 98/99 99/00 00/01 01/02 02/03 03/04 04/05 05/06 06/07 07/08 PROM
Sup. Sembrada 2966 5242 10874 12969 32042 37545 44564 78830 93656 127212 89019 110162 53757
Rend. Pond. (kg/ha) 1825 2820 2804 2947 2462 2733 3186 2983 3381 3009 2,694 3,144 2988
Rend. Aritmético (kg/ha) 1878 2860 2799 2868 2448 2701 3141 3539 2939 2945 3179 2812
Grupos CREA 12 12 12
N° Casos 1883 2568 1737 2297
Rinde ÍndiceTn. Producidas 5,413 14,782 30,491 38,220 78,887 102,610 141,981 235,150 316,641 377,466 239,819 346,331 160,649
13

Trenque LauquenPehujaó
Daireaux
PellegriniBolivar
Casares
9 de julio
Tejedor
America
130
120
130
33274038
3062
3192
3713
2693
3207
26643086
2752
3545
35903181
GENOTIPOS
0,0
500,0
1000,0
1500,0
2000,0
2500,0
3000,0
3500,0
4000,0
4500,0
5000,0
DM
4670
FN 4
85
ASP 4
801
A 4
505
A 4
201
SPS 3
900
DM
4400
DM
3500
A 4
613
SPS 4
500
DM
3600
A 2
886
DM
4200
P 9
4B73
DM
3700
DM
4250
DM
4870
A 3
933
DM
2200
A 4
303
DM
3100
TJ 2
049
DM
4970
A 3
901
A 4
209
DM
5,2
i
TJ 2
139
A 3
982
A 3
800
A 3
770
DM
2900
DM
5.5
A 4
725
Kg./ha.
-500
4500
9500
14500
19500
24500
29500
34500
Hectáreas
Rinde
Sup.Genotipos, resultados a campo
36353494 3392
3151 2867 2858
-500
4500
9500
14500
19500
24500
29500
34500
0,0500,0
1000,01500,02000,02500,03000,03500,04000,04500,05000,0
HectáreasKg./ha. GENOTIPOS: LOS MAS SEMBRADOSRendimiento
Superficie
4670
Soja de 1era

0
1000
2000
3000
4000
5000
6000
7000
1500 2000 2500 3000 3500 4000 4500 5000 5500
Lineal (Ambiente)
Lineal (AX 3933)
Lineal (AX 4613)
Lineal (DM 3700)
Lineal (DM 4670)
Lineal (DM 4970)
Lineal (P94B73)
Lineal (SPS 3900)
SPS 3900
AX 4613
Soja de 1era: Ensayos
0
1000
2000
3000
4000
5000
6000
1500 2000 2500 3000 3500 4000 4500 5000 5500
Lineal (Ambiente)
Lineal (DM 3100)
Lineal (DM 3500)
Lineal (DM 4250)
Lineal (P93B36)
Lineal (SPS 4500)
Lineal (SPS 4900)
DM 4250
P 93B36
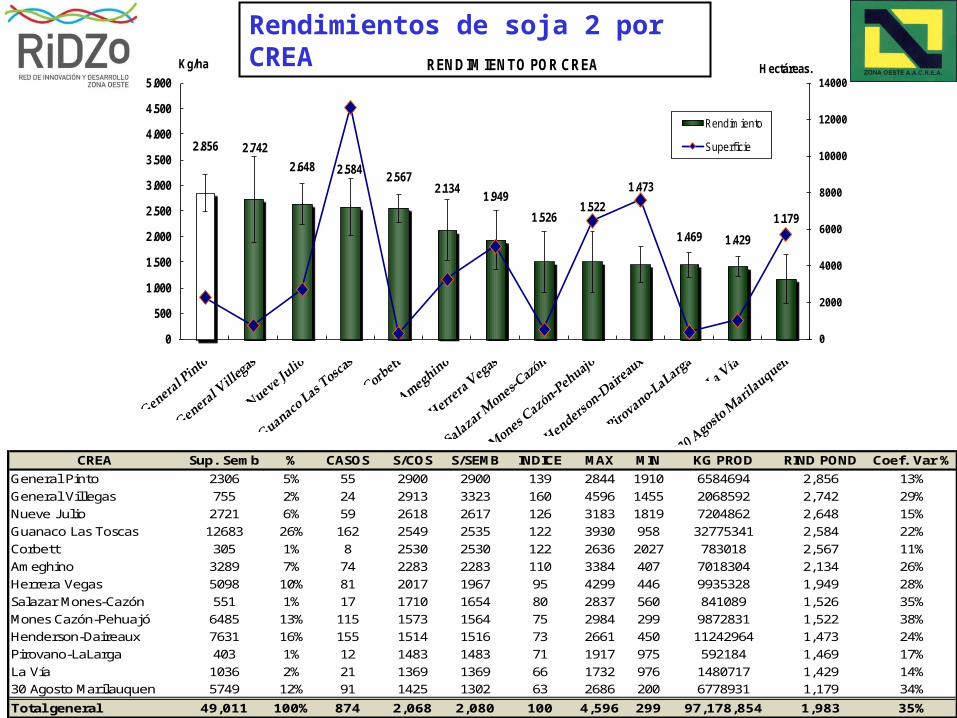
Rendimientos de soja 2 por CREA
CREA Sup. Semb % CASOS S/COS S/SEMB INDICE MAX MIN KG PROD RIND POND Coef. Var %
General Pinto 2306 5% 55 2900 2900 139 2844 1910 6584694 2,856 13%General Villegas 755 2% 24 2913 3323 160 4596 1455 2068592 2,742 29%Nueve J ulio 2721 6% 59 2618 2617 126 3183 1819 7204862 2,648 15%Guanaco Las Toscas 12683 26% 162 2549 2535 122 3930 958 32775341 2,584 22%Corbett 305 1% 8 2530 2530 122 2636 2027 783018 2,567 11%Ameghino 3289 7% 74 2283 2283 110 3384 407 7018304 2,134 26%Herrera Vegas 5098 10% 81 2017 1967 95 4299 446 9935328 1,949 28%Salazar Mones-Cazón 551 1% 17 1710 1654 80 2837 560 841089 1,526 35%Mones Cazón-Pehuajó 6485 13% 115 1573 1564 75 2984 299 9872831 1,522 38%Henderson-Daireaux 7631 16% 155 1514 1516 73 2661 450 11242964 1,473 24%Pirovano-LaLarga 403 1% 12 1483 1483 71 1917 975 592184 1,469 17%La Vía 1036 2% 21 1369 1369 66 1732 976 1480717 1,429 14%30 Agosto Marilauquen 5749 12% 91 1425 1302 63 2686 200 6778931 1,179 34%
Total general 49,011 100% 874 2,068 2,080 100 4,596 299 97,178,854 1,983 35%
2.856 2.742
2.648 2.5842.567
2.1341.949
1.5261.522
1.473
1.469 1.429
1.179
0
2000
4000
6000
8000
10000
12000
14000
0
500
1.000
1.500
2.000
2.500
3.000
3.500
4.000
4.500
5.000Hectáreas.Kg/ha RENDIMIENTO POR CREA
Rendimiento
Superficie

2236 2204 2138 21321816 1803
-500
4500
9500
14500
19500
24500
29500
34500
0,0
500,0
1000,0
1500,0
2000,0
2500,0
3000,0
3500,0
HectáreasKg./ha. GENOTIPOS: LOS MAS SEMBRADOSRendimiento
Superficie
-500
4500
9500
14500
19500
24500
29500
34500
0,0
500,0
1000,0
1500,0
2000,0
2500,0
3000,0
3500,0
4000,0
4500,0
5000,0
A 3
302
N 4
613
SPS
4500
A45
05
A 4
201
A 3
933
P94B
73
SPS
3900
DM
420
0
A 3
702
A 4
613
SPS
4x0
DM
487
0
DM
480
0
DM
440
0
A 4
209
A 3
770
DM
370
0
A 3
901
A 4
303
A 3
550
DM
350
0
DM
310
0
ALM
353
0
A 4
725
HectáreasKg./ha. GENOTIPOS Rinde
Sup.Soja 2: Genotipos a campo
Soja de 2 da

0
500
1000
1500
2000
2500
3000
3500
4000
1000 1500 2000 2500 3000 3500
Lineal (Ambiente)
Lineal (DM 3700)Lineal (DM 4970)
Lineal (P94B73)Lineal (SPS 3900)
0
500
1000
1500
2000
2500
3000
3500
4000
1000 1500 2000 2500 3000 3500
Lineal (AX 3933)Lineal (AX 4613)Lineal (DM 4250)Lineal (DM 4670)Lineal (SPS 4900)Lineal (Ambiente)
Soja de 2da: Ensayos
DM 4250
DM 4670
DM 3700
DM 4970

Norte de Buenos AiresNorte de Buenos Aires
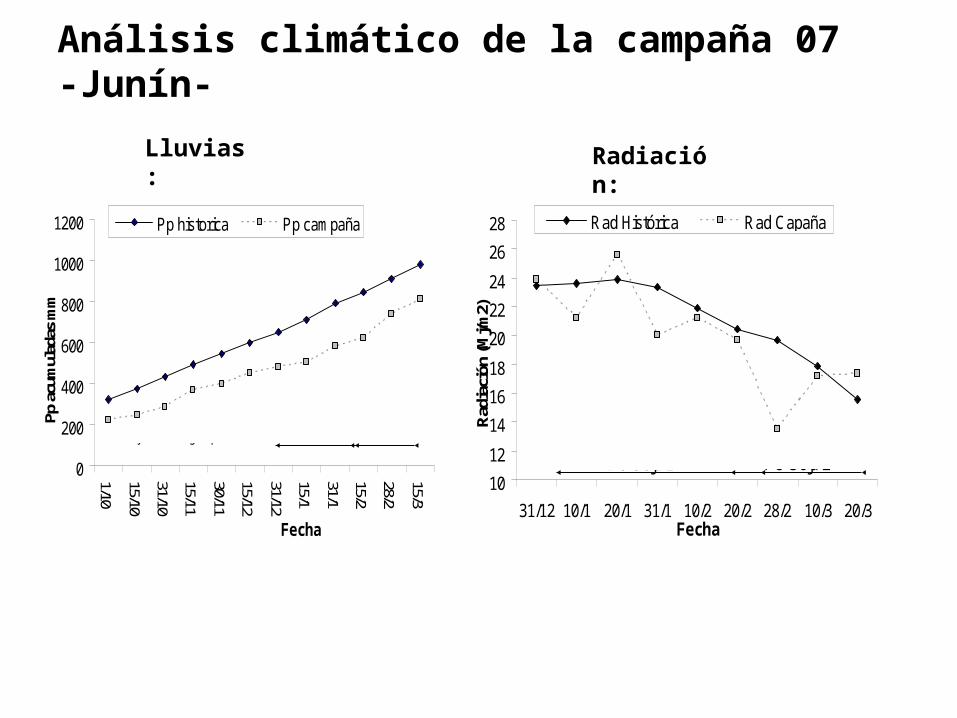
Análisis climático de la campaña 07 -Junín-
10
12
14
16
18
20
22
24
26
28
31/12 10/1 20/1 31/1 10/2 20/2 28/2 10/3 20/3Fecha
Rad
iaci
ón (M
j/m2)
Rad Histórica Rad Capaña
PC Soja 1° PC Soja 2°0
200
400
600
800
1000
1200
1/10
15/10
31/10
15/11
30/11
15/12
31/12
15/1
31/1
15/2
28/2
15/3Fecha
Pp a
cum
ulad
as m
m
Pp historica Pp campaña
PCS 1°
PC S 2°
Abr-may-Jun-Jul-Ag-Sep
Lluvias: Radiación:
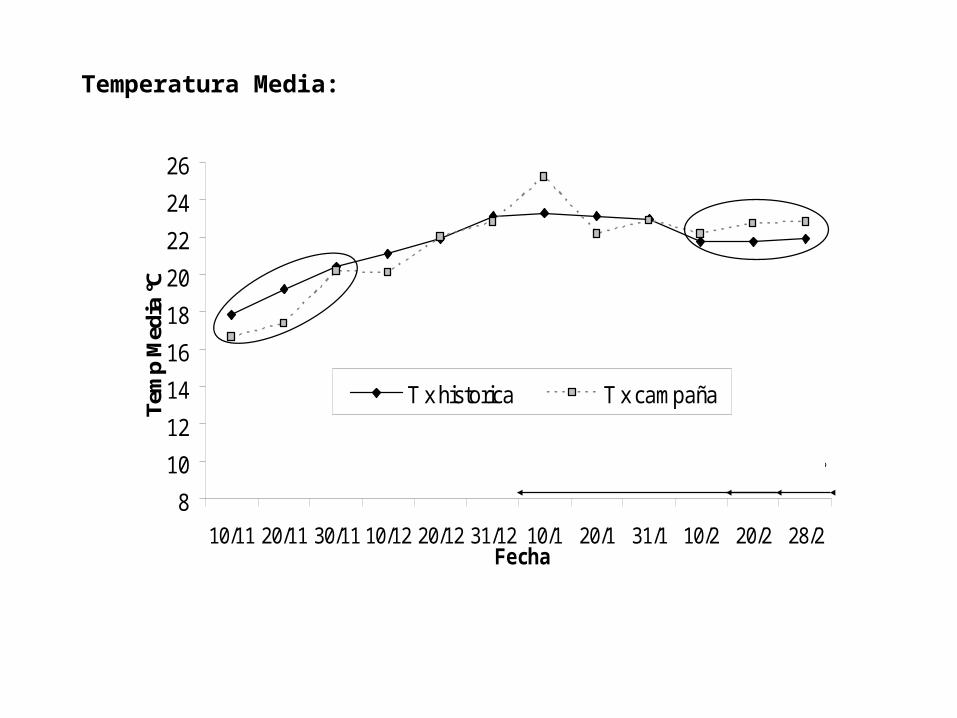
Temperatura Media:
8
10
12
14
16
18
20
22
24
26
10/11 20/11 30/11 10/12 20/12 31/12 10/1 20/1 31/1 10/2 20/2 28/2Fecha
Tem
p M
edia
°C
T x historica T x campaña
PC Soja1° PC Soja 2°

Rendimientos en la ultimas 10 campañas
y = 116.14x + 2664.7R2 = 0.7422
y = 91.091x + 1901.6R2 = 0.4233
0
500
1000
1500
2000
2500
3000
3500
4000
4500
98/9 99/0 00/01 01/02 02/03 03/04 04/05 05/06 06/07 07/08Campaña
Rin
de
(kg
/ha
)
Rinde S1° Rinde S2°
Soja 1° Rto 3541 kg/ha y 18866 has
Soja 2° Rto 2483 y 18131 has
(Faltan datos del Crea Pergamino)
Campaña 07-08
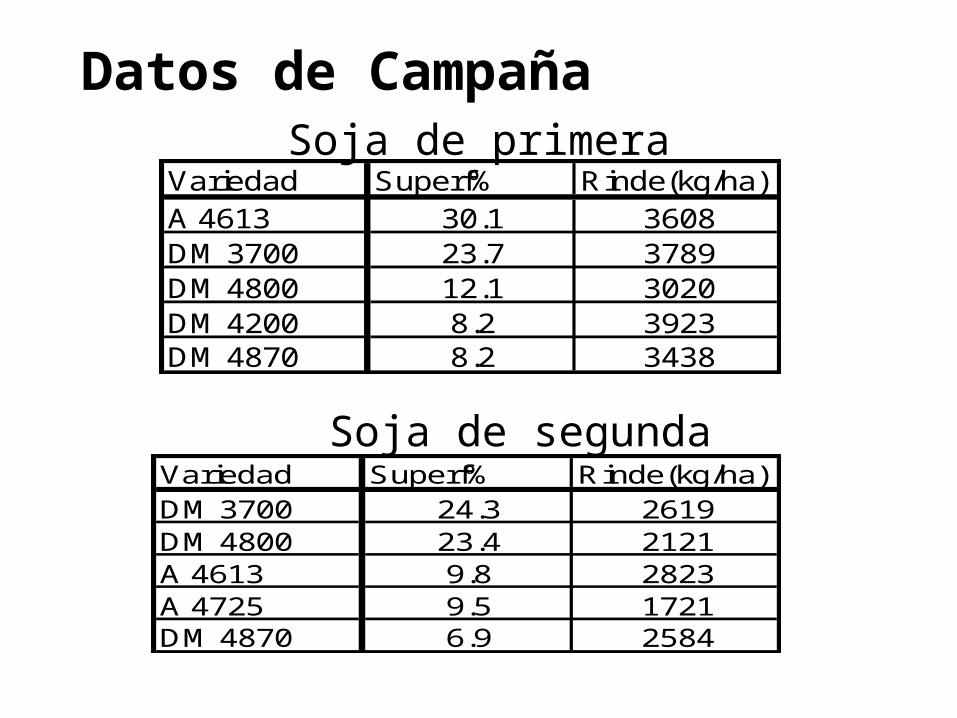
Soja de primeraVariedad Superf% Rinde(kg/ha)A 4613 30.1 3608DM 3700 23.7 3789DM 4800 12.1 3020DM 4200 8.2 3923DM 4870 8.2 3438
Soja de segundaVariedad Superf% Rinde(kg/ha)DM 3700 24.3 2619DM 4800 23.4 2121A 4613 9.8 2823A 4725 9.5 1721DM 4870 6.9 2584
Datos de Campaña

Rendimiento y componentes ensayos soja 1°:
Variedad n° casos Rinde(kg/ha) Plantas/m2 n°granos/m2 P 1000 (grs) N° Ind (%)
DM 4670 8 4412 a 44.3 a 2613 ab 170.0 e 104.4SPS 3900 8 4367 ab 44.8 a 2258 de 193.5 a 103.4A 4613 8 4280 abc 40.1 bc 2463 bc 174.0 de 101.3DM 4970 8 4249 abc 40.6 bc 2242 de 190.0 ab 100.6DM 4250 8 4235 abc 44.9 a 2619 a 162.6 f 100.2DM 3700 8 4230 abc 43 ab 2365 cd 180.4 cd 100.1A 5009 7 4219 bc 39 c 2166 e 195.0 a 99.9NK 3400 8 4194 bc 39.7 bc 2696 a 156.0 f 99.3DM 4800 8 4110 cd 37.7 c 2228 de 184.7 bc 97.3SPS 4900 8 3955 d 40.8 bc 2199 e 180.2 cd 93.6
Probabilidad /// 0.000 0.000 0.000 0.000 ///DMS (0.05) /// 186 3.4 150 6.7 ///
Variedad n° casos Rinde(kg/ha) Plantas/m2 n°granos/m2 P 1000 (grs) N° Ind (%)
DM 4970 3 2946 a 40.3 abc 1696 b 173.3 ab 104.8DM 4250 3 2901 a 45.9 a 1943 a 148.8 d 103.2A 5009 3 2845 ab 39.7 abc 1545 c 183.3 a 101.2DM 4800 3 2826 ab 39.4 bc 1678 b 167.7 bc 100.5DM 3700 3 2813 ab 43.1 ab 1576 c 178.3 a 100.1SPS 4900 3 2727 bc 39.4 bc 1679 b 161.9 c 97.0NK 3400 3 2618 c 35.5 c 1853 a 140.8 d 93.1
Probabilidad /// 0.021 0.085 0.000 0.000 ///DMS (0.05) /// 170 6.4 100 10.0 ///
Rendimiento y componentes ensayos soja 2°
SudesteSudeste

ZONA SUDESTE
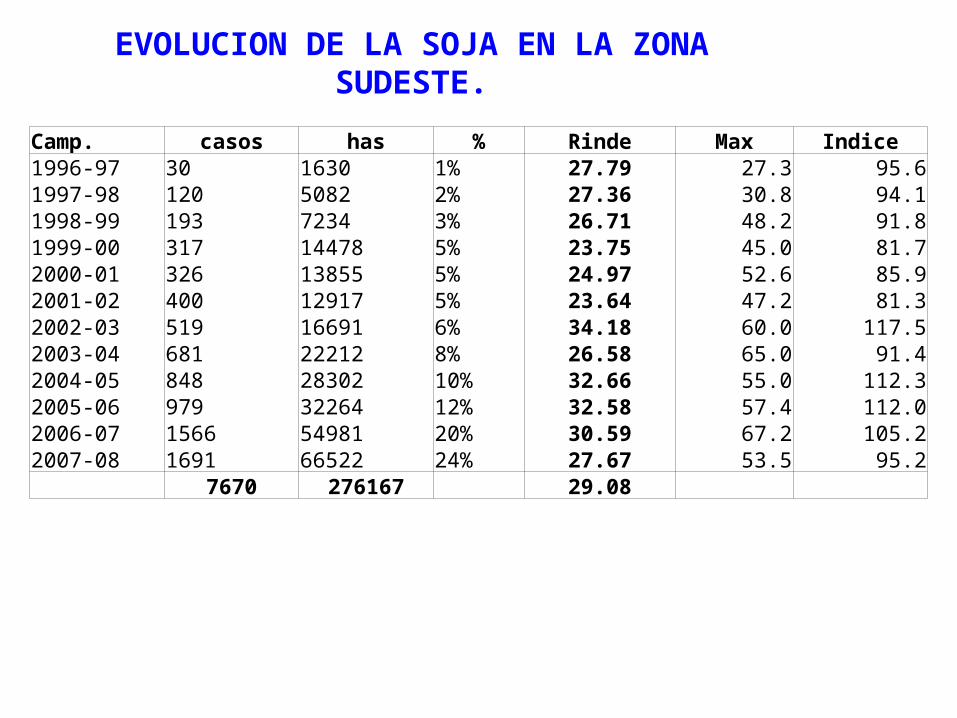
EVOLUCION DE LA SOJA EN LA ZONA SUDESTE. Camp. casos has % Rinde Max Indice1996-97 30 1630 1% 27.79 27.3 95.61997-98 120 5082 2% 27.36 30.8 94.11998-99 193 7234 3% 26.71 48.2 91.81999-00 317 14478 5% 23.75 45.0 81.72000-01 326 13855 5% 24.97 52.6 85.92001-02 400 12917 5% 23.64 47.2 81.32002-03 519 16691 6% 34.18 60.0 117.52003-04 681 22212 8% 26.58 65.0 91.42004-05 848 28302 10% 32.66 55.0 112.32005-06 979 32264 12% 32.58 57.4 112.02006-07 1566 54981 20% 30.59 67.2 105.22007-08 1691 66522 24% 27.67 53.5 95.2 7670 276167 29.08
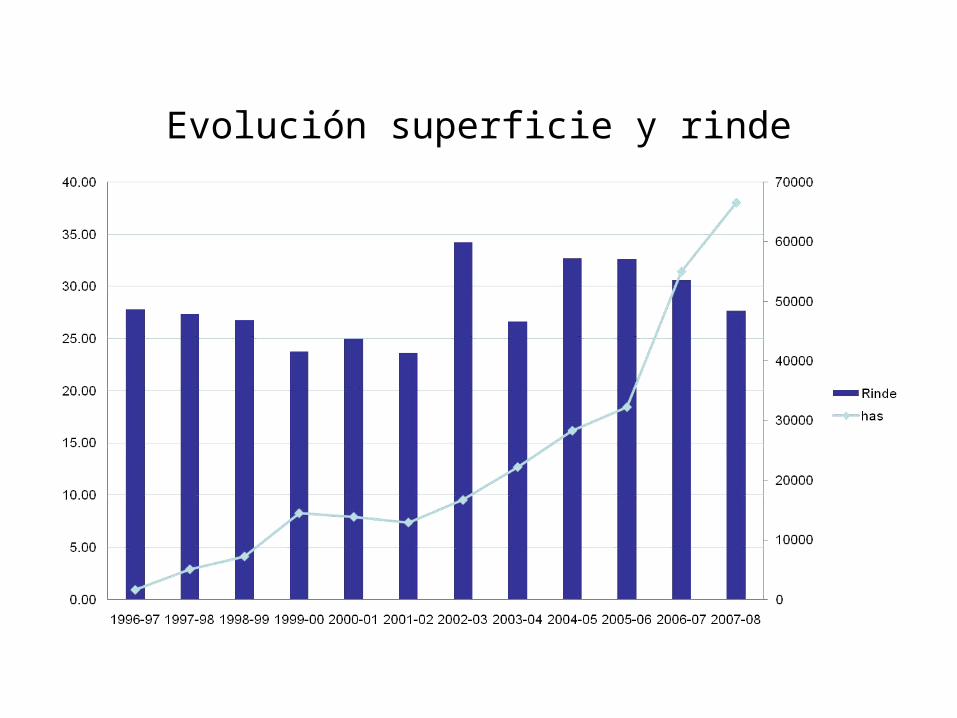
Evolución superficie y rinde
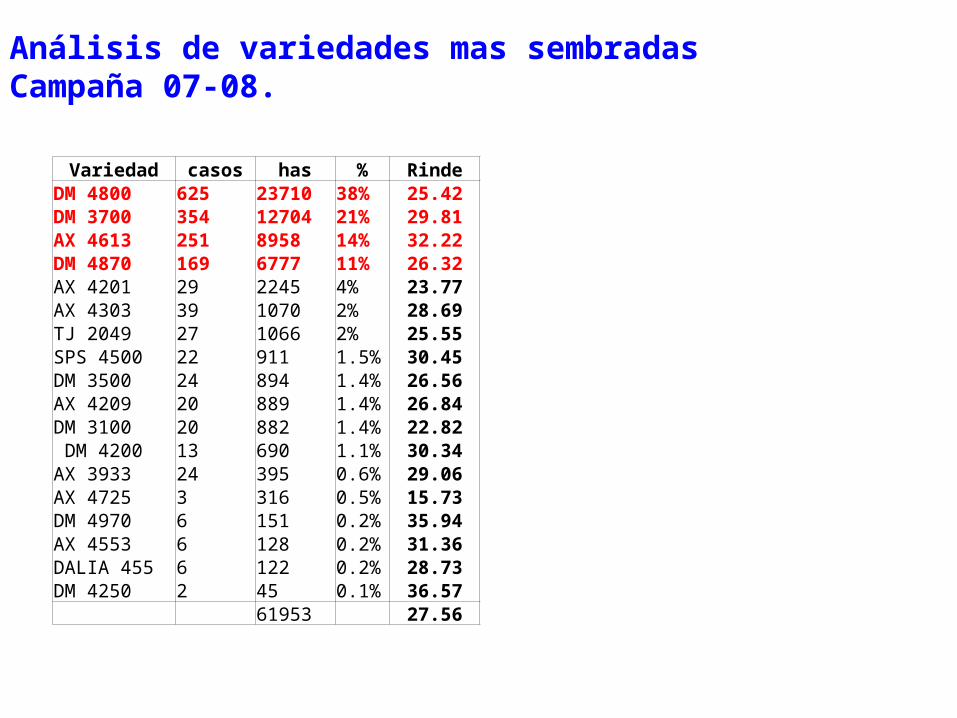
Variedad casos has % RindeDM 4800 625 23710 38% 25.42DM 3700 354 12704 21% 29.81AX 4613 251 8958 14% 32.22DM 4870 169 6777 11% 26.32AX 4201 29 2245 4% 23.77AX 4303 39 1070 2% 28.69TJ 2049 27 1066 2% 25.55SPS 4500 22 911 1.5% 30.45DM 3500 24 894 1.4% 26.56AX 4209 20 889 1.4% 26.84DM 3100 20 882 1.4% 22.82 DM 4200 13 690 1.1% 30.34AX 3933 24 395 0.6% 29.06AX 4725 3 316 0.5% 15.73DM 4970 6 151 0.2% 35.94AX 4553 6 128 0.2% 31.36DALIA 455 6 122 0.2% 28.73DM 4250 2 45 0.1% 36.57
61953 27.56
Análisis de variedades mas sembradasCampaña 07-08.

27.56 qq
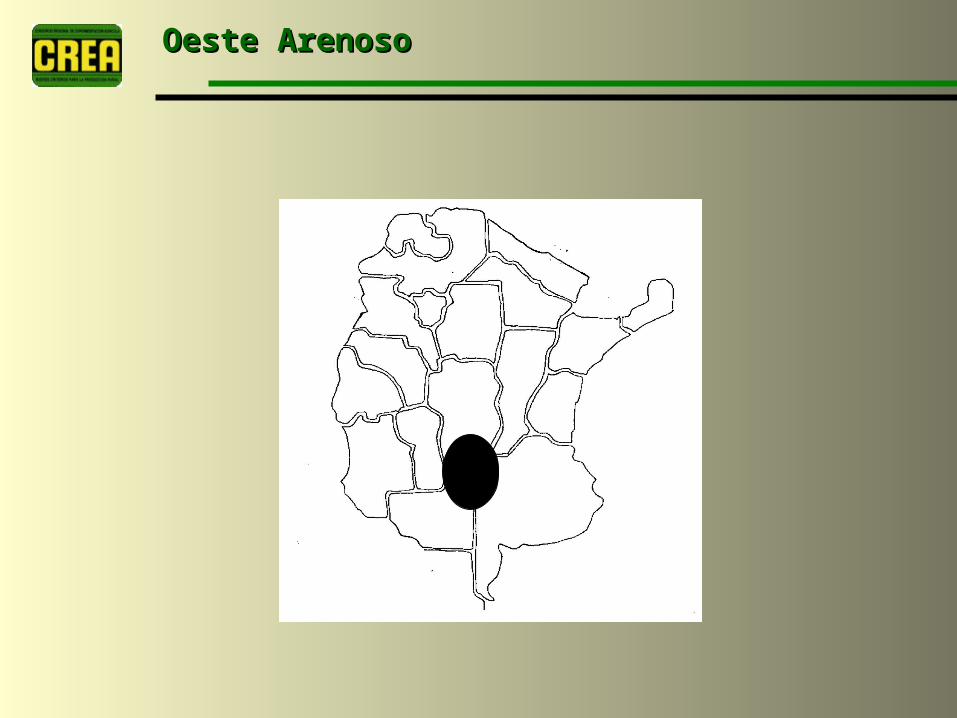
Oeste ArenosoOeste Arenoso
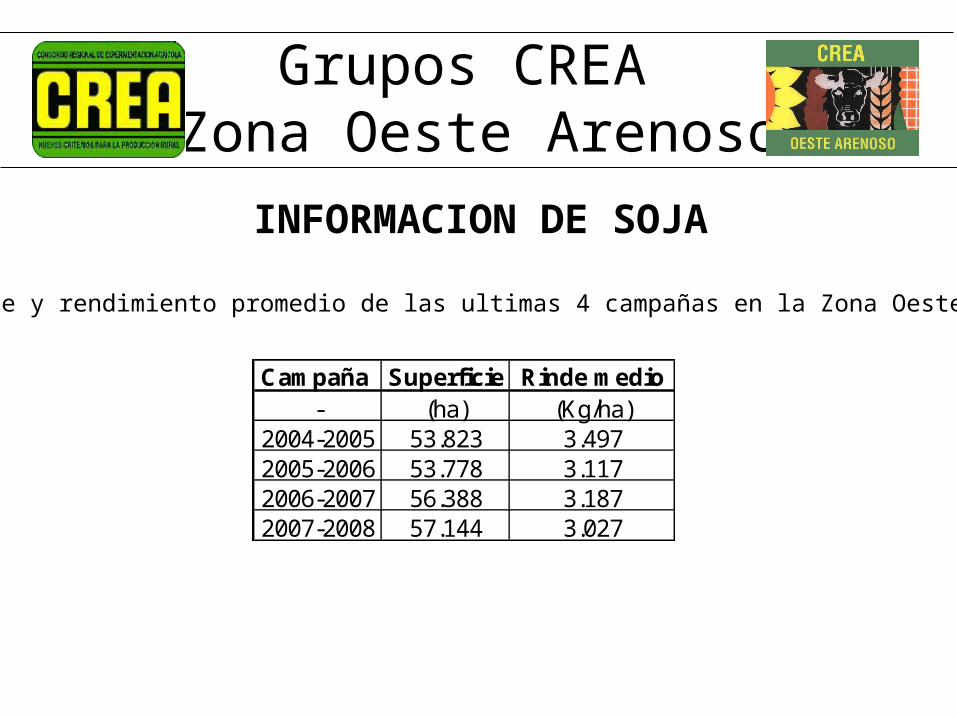
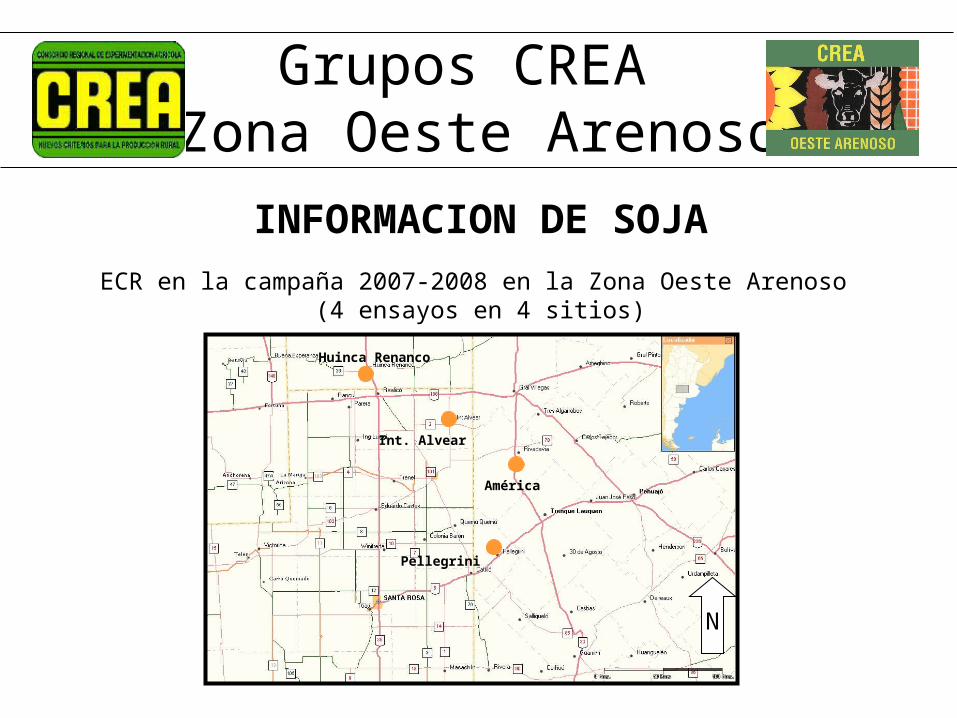
Grupos CREA Zona Oeste Arenoso
INFORMACION DE SOJA
Superficie y rendimiento promedio de las ultimas 4 campañas en la Zona Oeste Arenoso
Campaña Superficie Rinde medio- (ha) (Kg/ha)
2004-2005 53.823 3.4972005-2006 53.778 3.1172006-2007 56.388 3.1872007-2008 57.144 3.027

Grupos CREA Zona Oeste Arenoso
INFORMACION DE SOJA
Variedad Superficie (ha) Superficie (%) Sup. Acum. (%)DM 4800 11.490 22,28 22,28NA 4613 11.201 21,72 44,00DM 3700 8.660 16,79 60,79DM 4870 8.634 16,74 77,53DM 4970 3.118 6,05 83,58DM 4670 2.238 4,34 87,92DM 4250 2.056 3,99 91,90DM 3100 1.902 3,69 95,59NA 4209 917 1,78 97,37DM 4200 632 1,23 98,60NA 5766 447 0,87 99,46DM 5.2i 277 0,54 100,00
Variedades utilizadas en la campaña 2007-2008 en la Zona Oeste Arenoso
Grupos CREA Zona Oeste Arenoso
INFORMACION DE SOJA
ECR en la campaña 2007-2008 en la Zona Oeste Arenoso (4 ensayos en 4 sitios)
N
Huinca Renanco
Int. Alvear
América
Pellegrini
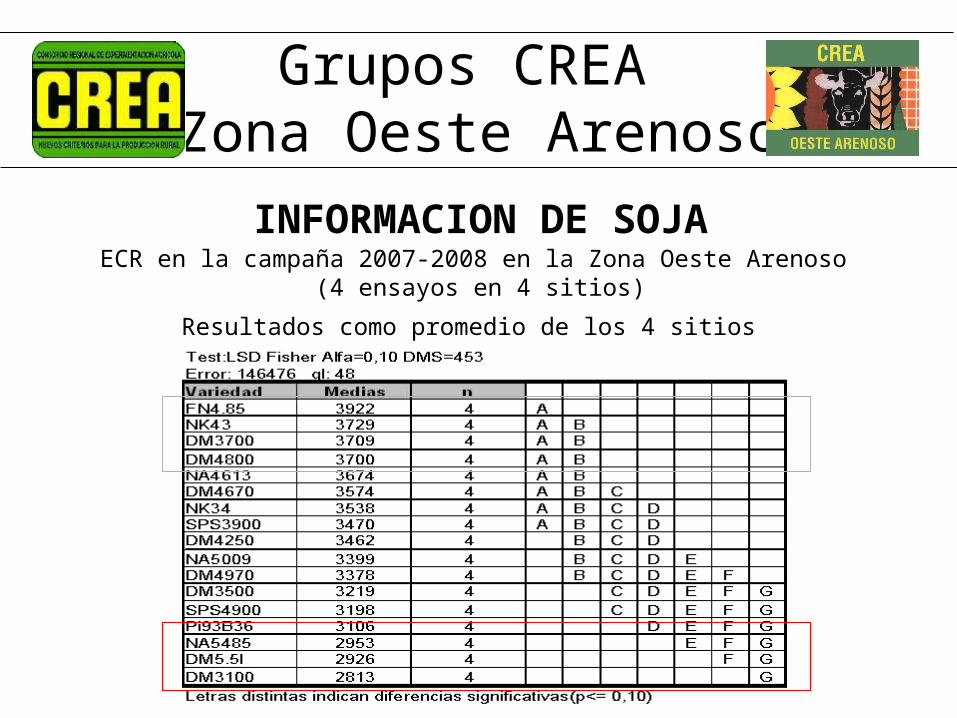
Grupos CREA Zona Oeste Arenoso
INFORMACION DE SOJAECR en la campaña 2007-2008 en la Zona Oeste Arenoso
(4 ensayos en 4 sitios)
Resultados como promedio de los 4 sitios

Grupos CREA Zona Oeste Arenoso
INFORMACION DE SOJAECR en la campaña 2007-2008 en la Zona Oeste Arenoso
(4 ensayos en 4 sitios)

Mar y SierrasMar y Sierras

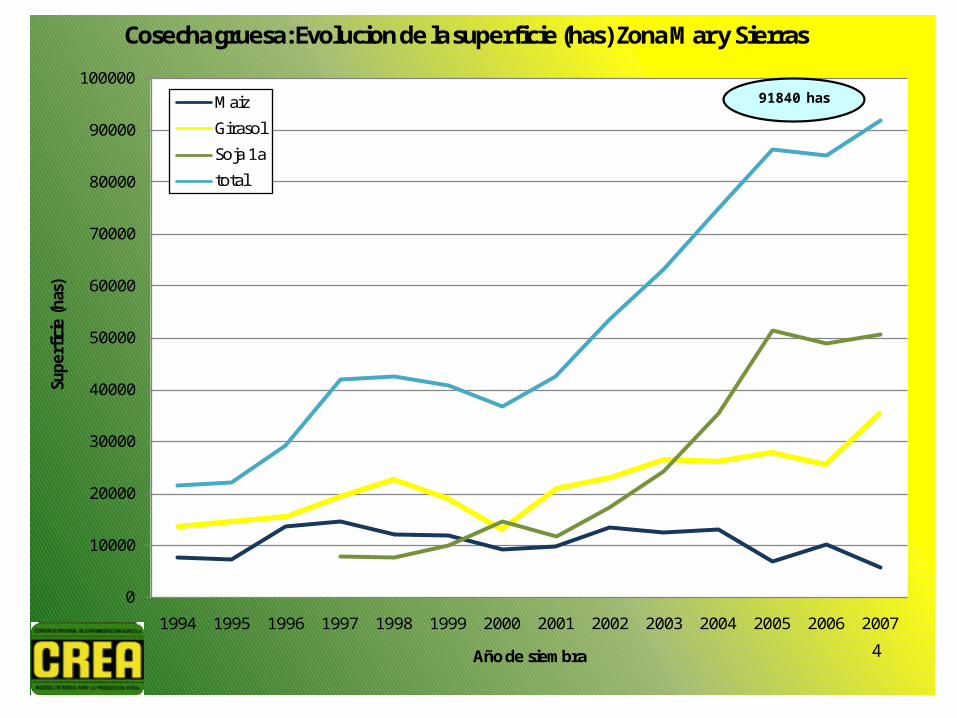
Extracto evaluación zonal Soja 1ª y 2ª AACREA Zona MAR y SIERRAS
Dr. González Montaner, Ing. Di Napoli, Ing. Therisod
4
0
10000
20000
30000
40000
50000
60000
70000
80000
90000
100000
1994 1995 1996 1997 1998 1999 2000 2001 2002 2003 2004 2005 2006 2007
Supe
rfici
e (h
as)
Año de siembra
Cosecha gruesa: Evolucion de la superficie (has) Zona Mar y Sierras
Maiz
Girasol
Soja 1a
total
91840 has
85
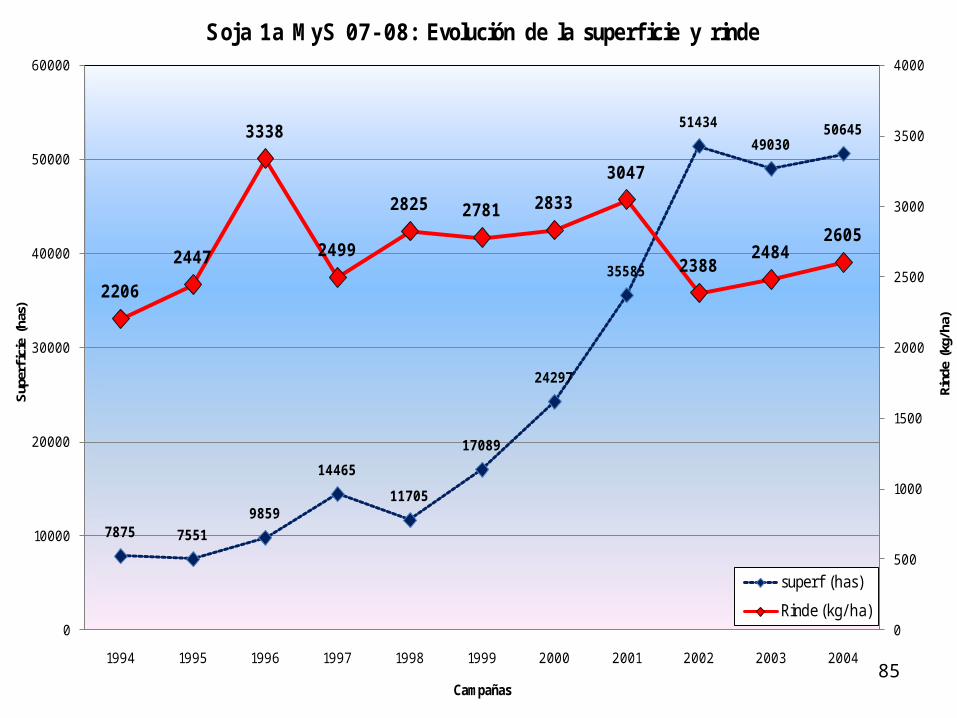
7875 7551
9859
14465
11705
17089
24297
35585
51434
4903050645
2206
2447
3338
2499
2825 2781 2833
3047
23882484
2605
0
500
1000
1500
2000
2500
3000
3500
4000
0
10000
20000
30000
40000
50000
60000
1994 1995 1996 1997 1998 1999 2000 2001 2002 2003 2004
Rind
e (k
g/ha
)
Sup
erfi
cie
(has
)
Campañas
Soja 1a MyS 07- 08: Evolución de la superficie y rinde
superf (has)
Rinde (kg/ ha)

Zona MyS Superf (has) % superf INDICE
DM 3700 14067 28 101
DM 4800 11522 23 105
NA 4613 4891 10 98
AX 3901 3422 7 86
DM 3500 2610 5 101
DM 4200 2164 4 95
DM 3100 1812 4 103
AX 4209 1530 3 100
DM 4870 1438 3 113
NA 3933 799 2 101
AX 3302 602 1 97
AX 4201 581 1 98
AX 4303 498 1 94
ACA 360 450 1 86
AX 3550 404 1 87
AX 4100 394 1 108
DM 4400 325 1 99
Joketta 291 1 85
DM 2200 268 1 57

2067
1213
1389
1749
1352 1301
1029
1494
1309
0
5000
10000
15000
20000
25000
30000
35000
40000
45000
0
500
1000
1500
2000
2500
1999 2000 2001 2002 2003 2004 2005 2006
Sup
erfi
cie
(has
)
Rin
de (
kg/h
a)
Año de siembra
Soja 2a/Inter MyS 07/08: Evolución del rinde y la superfcie
Rinde
Superficie
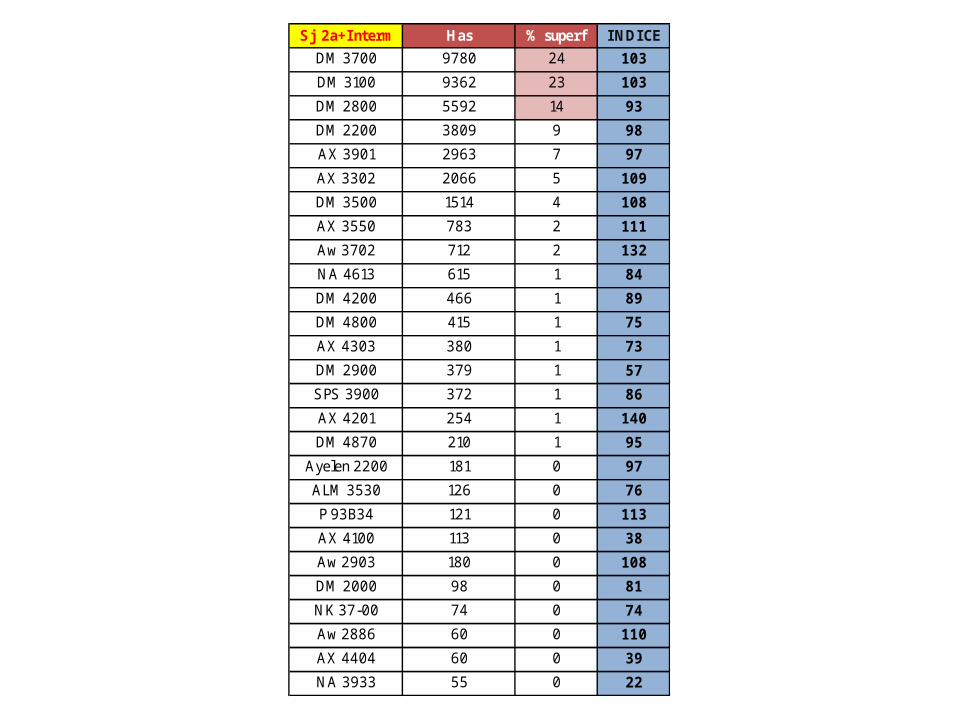
Sj 2a+Interm Has % superf INDICE
DM 3700 9780 24 103
DM 3100 9362 23 103
DM 2800 5592 14 93
DM 2200 3809 9 98
AX 3901 2963 7 97
AX 3302 2066 5 109
DM 3500 1514 4 108
AX 3550 783 2 111
Aw 3702 712 2 132
NA 4613 615 1 84
DM 4200 466 1 89
DM 4800 415 1 75
AX 4303 380 1 73
DM 2900 379 1 57
SPS 3900 372 1 86
AX 4201 254 1 140
DM 4870 210 1 95
Ayelen 2200 181 0 97
ALM 3530 126 0 76
P 93B34 121 0 113
AX 4100 113 0 38
Aw 2903 180 0 108
DM 2000 98 0 81
NK 37-00 74 0 74
Aw 2886 60 0 110
AX 4404 60 0 39
NA 3933 55 0 22
89
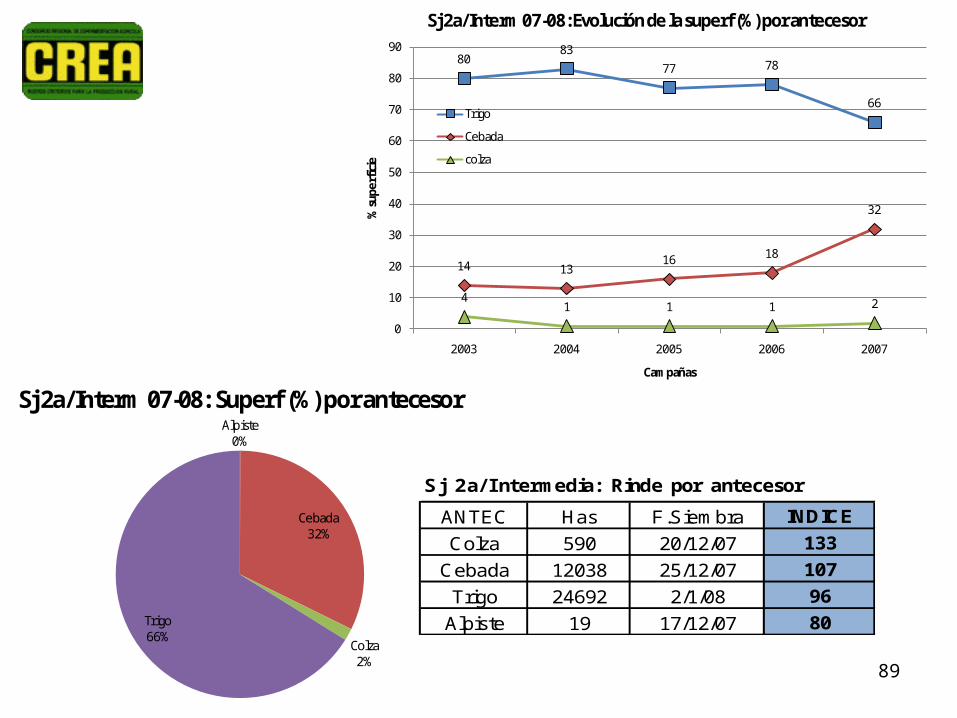
Alpiste0%
Cebada32%
Colza2%
Trigo66%
Sj 2a/Interm 07-08: Superf (%) por antecesor
8083
77 78
66
14 1316 18
32
41 1 1 2
0
10
20
30
40
50
60
70
80
90
2003 2004 2005 2006 2007
% su
perfi
cie
Campañas
Sj 2a/Interm 07-08: Evolución de la superf (%) por antecesor
Trigo
Cebada
colza
Sj 2a/ Intermedia: Rinde por antecesor
ANTEC Has F.Siembra INDICE
Colza 590 20/12/07 133
Cebada 12038 25/12/07 107
Trigo 24692 2/1/08 96
Alpiste 19 17/12/07 80
Desarrollos ZonalesMar y Sierras
Cual es la variedad y fecha de siembra para cada ambiente ???
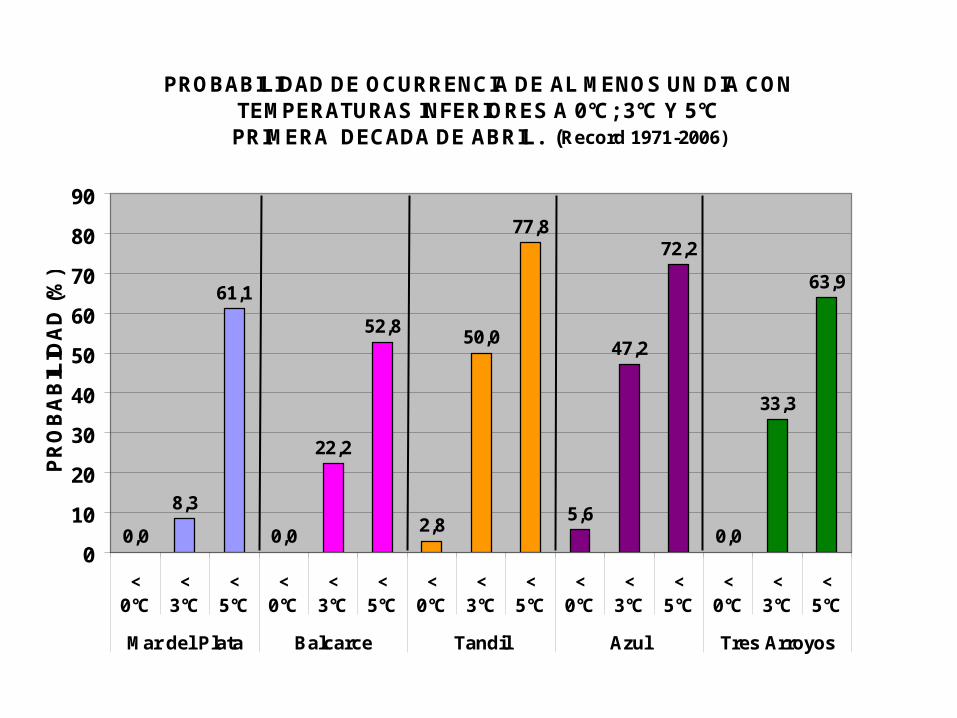
PROBABILIDAD DE OCURRENCIA DE AL MENOS UN DIA CON TEMPERATURAS INFERIORES A 0°C; 3°C Y 5°C PRIMERA DECADA DE ABRIL. (Record 1971-2006)
0,0
8,3
61,1
0,0
22,2
52,8
2,8
50,0
77,8
5,6
47,2
72,2
0,0
33,3
63,9
0
10
20
30
40
50
60
70
80
90
<0°C
<3°C
<5°C
<0°C
<3°C
<5°C
<0°C
<3°C
<5°C
<0°C
<3°C
<5°C
<0°C
<3°C
<5°C
Mar del Plata Balcarce Tandil Azul Tres Arroyos
PR
OB
AB
ILID
AD
(%
)

RENDIMIENTO PROMEDIO DE VARIEDAD POR FECHA DE
SIEMBRA. Ensayos 2003-2006. Azul Tandil Prof y Necochea Costero
0
500
1000
1500
2000
2500
3000
3500
4000
4500
5000
RE
ND
IMIE
NT
O (
kg/h
a)
2000-2200
3100
3500-3700
4200-4400
4600-4800
50048
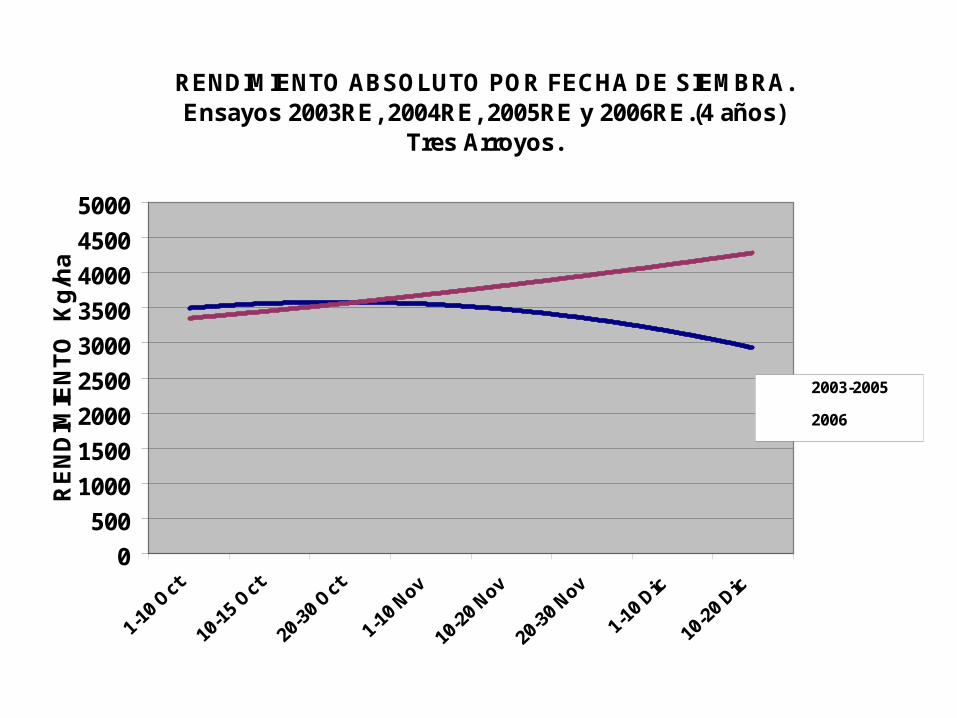
RENDIMIENTO ABSOLUTO POR FECHA DE SIEMBRA. Ensayos 2003RE, 2004RE, 2005RE y 2006RE.(4 años)
Tres Arroyos.
0
500
1000
1500
2000
2500
3000
3500
4000
4500
5000
RE
ND
IMIE
NT
O K
g/h
a
2003-2005
2006
Polinómica(2003-2005)Polinómica(2006)
2006 Lluvias tardías sin helada

RENDIMIENTO RELATIVO DE CADA VARIEDAD AL
PROMEDIO DE CADA FECHA DE SIEMBRA. Ensayos 2003RE, 2004RE, 2005RE, 2006RE.(4 años)
Tres Arroyos.
60
70
80
90
100
110
120
1-10
Oct
10-1
5 Oct
20-3
0 Oct
1-10
Nov
20-3
0 Nov
1-10
Dic
10-2
0 Dic
RE
ND
IMIE
NT
O I
ND
ICE
(%
)
2000-2200
3100
3500-3700
4200-4400
4600-4800
50048
Tempranas a medias LARGAS MEJOR
Tardías CORTAS MEJOR

Estado Fenol Rendimiento 22-Feb el 25-Mar Sin Fung Con Fung Promedio Rta Fung
Variedad kg/ha NA 5009 3,0 6,0 3844 4208 4026 364 DM 5,1 i 5,6 6,7 3853 4198 4026 346
ALM 4970 3,0 6,7 3705 4218 3961 513 DM 4670 6,5 7,0 3688 4037 3863 349 DM 4970 5,6 7,0 3701 3898 3799 197 DM 4250 4,5 7,5 3688 3884 3786 196 SPS 3900 6,5 7,5 3688 3884 3786 196 DM 3700 5,3 7,2 3505 3865 3685 360 TJ 2049 5,0 6,5 3375 3880 3628 505 DM 3500 7,0 8,5 3356 3697 3526 341 NA 4209 6,5 7,0 3356 3548 3452 193 TJ 2139 5,0 7,0 3185 3215 3200 30 TJ 2037 6,7 7,5 3033 3222 3127 189
SPS 4500 4,0 7,0 3214 2913 3064 -301 DM 2200 7,0 9,3 2985 3010 2998 24 DM 3100 6,0 9,3 2645 3010 2827 365 AW 3302 6,7 9,0 2654 2839 2747 186 AW 3370 6,7 9,0 2548 2087 2318 -461
Ensayo Variedades 2007-08. Las Cortaderas (Miramar).
Sbra 03-Nov
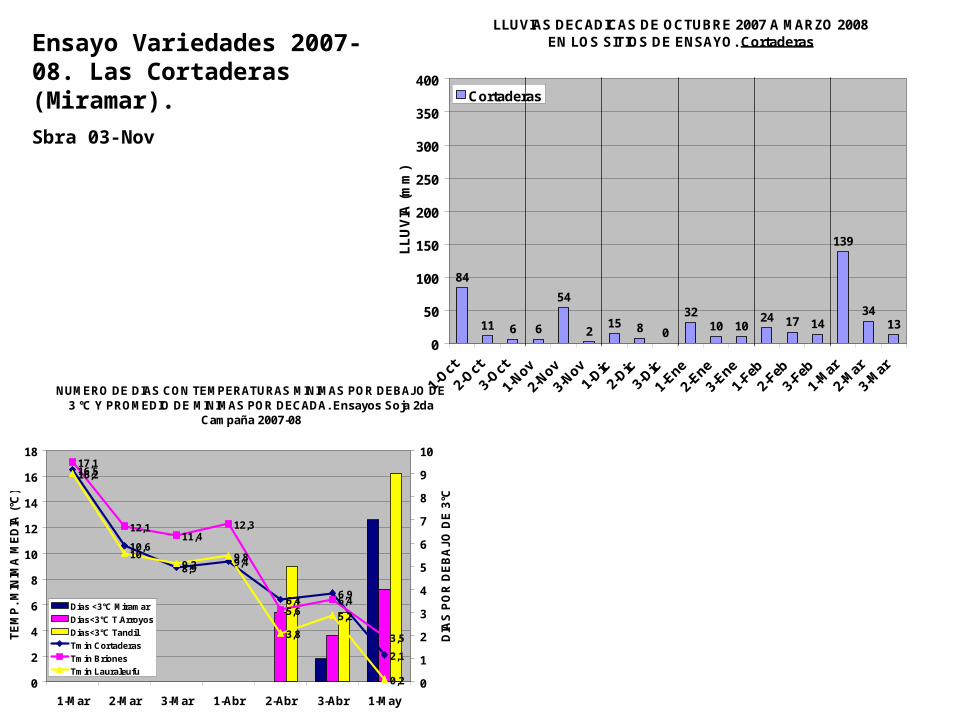
LLUVIAS DECADICAS DE OCTUBRE 2007 A MARZO 2008 EN LOS SITIOS DE ENSAYO. Cortaderas
84
11 6 6
54
215 8 0
3210 10
24 17 14
139
3413
0
50
100
150
200
250
300
350
400
1-Oct
2-Oct
3-Oct
1-Nov
2-Nov
3-Nov
1-Dic
2-Dic
3-Dic
1-Ene
2-Ene
3-Ene
1-Feb
2-Feb
3-Feb
1-M
ar
2-M
ar
3-M
ar
LL
UV
IA (
mm
)
Cortaderas
NUMERO DE DIAS CON TEMPERATURAS MINIMAS POR DEBAJO DE
3 °C Y PROMEDIO DE MINIMAS POR DECADA. Ensayos Soja 2da Campaña 2007-08
16,5
10,6
8,99,4
6,46,9
2,1
17,1
12,111,4
12,3
5,66,4
3,5
16,2
109,2
9,8
3,8
5,2
0,20
2
4
6
8
10
12
14
16
18
1-Mar 2-Mar 3-Mar 1-Abr 2-Abr 3-Abr 1-May
TE
MP
. MIN
IMA
ME
DIA
(°C
)
0
1
2
3
4
5
6
7
8
9
10D
IAS
PO
R D
EB
AJO
DE
3°C
Dias <3°C Miramar
Dias<3°C T.Arroyos
Dias<3°C Tandil
Tmin Cortaderas
Tmin Briones
Tmin Lauraleufu
Ensayo Variedades 2007-08. Las Cortaderas (Miramar).
Sbra 03-Nov

RESPUESTA A FUNGICIDAS EN SOJA Y RENDIMIENTO
MAXIMO .ENSAYOS 1998 A 2007. Azul, Necochea, Tandil, Maipu, Tres Arroyos y Cnel Suarez
y = 0,1217x
R2 = 0,5658
y = 0,1028x
R2 = 0,5219
y = 0,0997x
R2 = 0,8422
y = 0,2171x
R2 = 0,7805
-200
0
200
400
600
800
1000
1200
1400
1600
1800
0 1000 2000 3000 4000 5000 6000 7000
RINDE MAXIMO (kg/ha)
RE
SP
UE
ST
A (
kg/h
a)
98-03
2005
2006
2007
98-03
2005
2006
2007
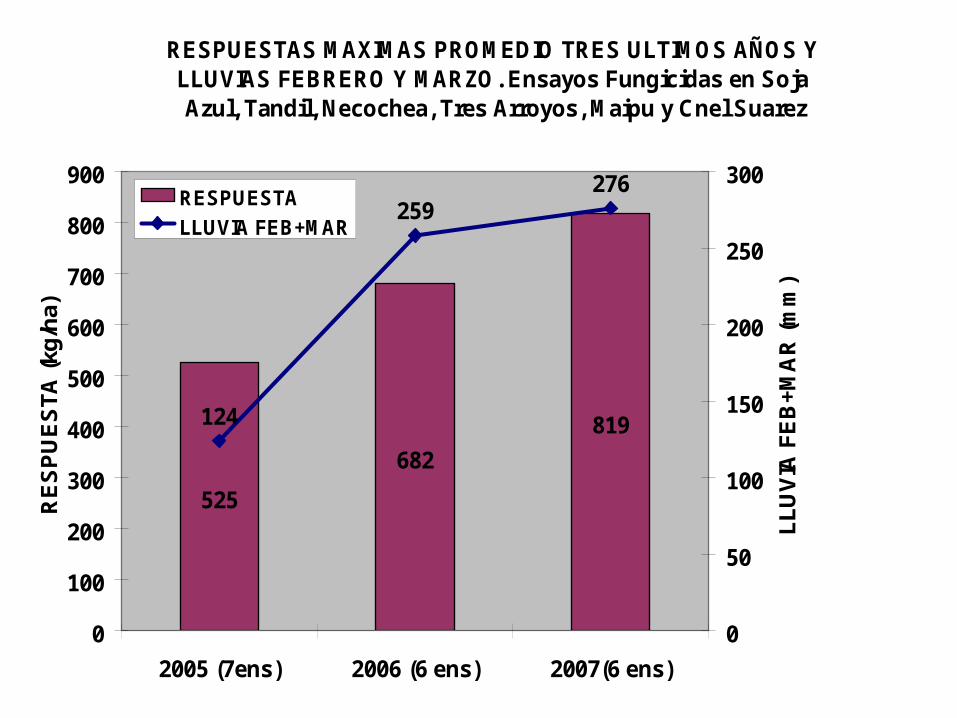
RESPUESTAS MAXIMAS PROMEDIO TRES ULTIMOS AÑOS Y LLUVIAS FEBRERO Y MARZO. Ensayos Fungicidas en Soja Azul, Tandil, Necochea, Tres Arroyos, Maipu y Cnel Suarez
525
682
819124
259276
0
100
200
300
400
500
600
700
800
900
2005 (7ens) 2006 (6 ens) 2007(6 ens)
RE
SP
UE
ST
A (
kg/h
a)
0
50
100
150
200
250
300
LL
UV
IA F
EB
+MA
R (
mm
)
RESPUESTA
LLUVIA FEB+MAR

SudoesteSudoeste
Variedades de SojaZona Sudoeste
Ing. Mariano Pizzio
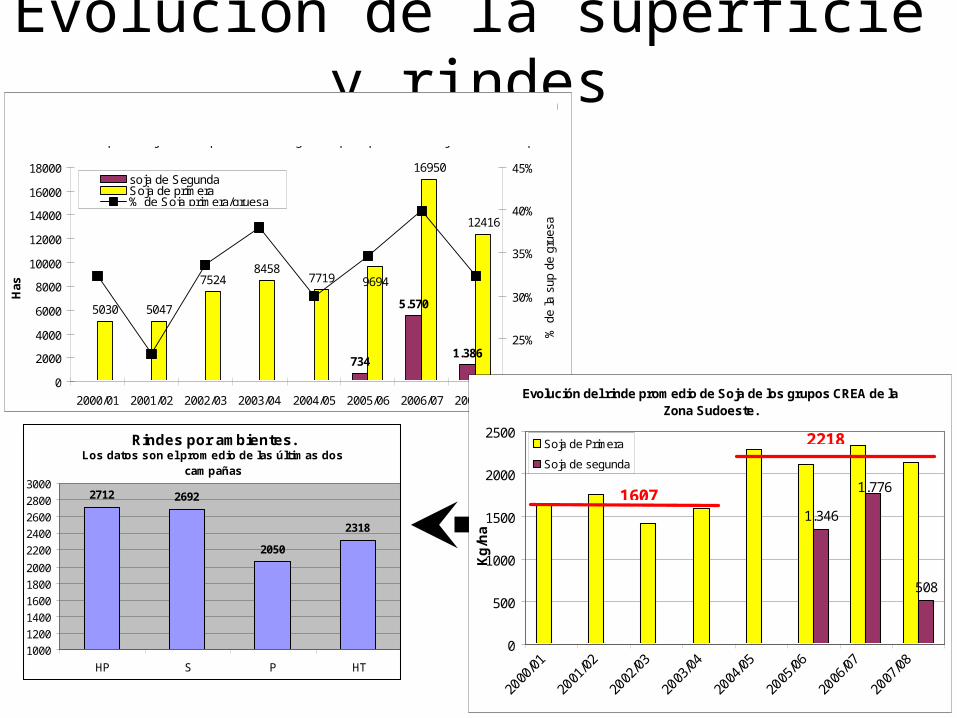
Evolución de la superficie y rindes
Rindes por ambientes. Los datos son el promedio de las últimas dos
campañas
2712 2692
2318
2050
1000
1200
1400
1600
1800
2000
2200
2400
2600
2800
3000
HP S P HT
734
5.570
1.386
5030 5047
75248458
7719
16950
12416
9694
0
2000
4000
6000
8000
10000
12000
14000
16000
18000
2000/01 2001/02 2002/03 2003/04 2004/05 2005/06 2006/07 2007/08
Has
.
20%
25%
30%
35%
40%
45%
% d
e la
sup
de
grue
sa
.
soja de SegundaSoja de primera% de Soja primera/gruesa
Evolución de las Has sembradas y analizadas por los grupos CREA de a zona Sudoeste.
La linea indica el porcentaje de la superficie total de gruesa que representó la soja en cada campaña
Evolución del rinde promedio de Soja de los grupos CREA de la Zona Sudoeste.
1.346
508
1.776
0
500
1000
1500
2000
2500
2000
/01
2001
/02
2002
/03
2003
/04
2004
/05
2005
/06
2006
/07
2007
/08
Kg
/ha
.
Soja de Primera
Soja de segunda
1607
2218

Variedades más sembradas en la última campaña
Las variedades más sembradas son las mismas entre campañas
•El 45 % de la zona es 3 largo
Genotipo ha % promedio Indice Genotipo ha % promedio Indice
A 3901 3559 30% 2341 105 A 3901 3139 25% 2557 112DM 4800 2185 19% 2497 112 DM 3700 2242 18% 2590 113DM 3700 1796 15% 2482 111 DM 4800 2211 18% 2677 117DM 4400 574 5% 2184 98 DM 4400 634 5% 2706 118A 4303 916 8% 2063 93 A 4303 557 4% 2409 105
DM 4600 513 4% 2765 124 DM 3800 402 3% 2317 101
Sup. RindeSoja de primera campaña 06/07 Soja de primera campaña 07/08
RindeSup.
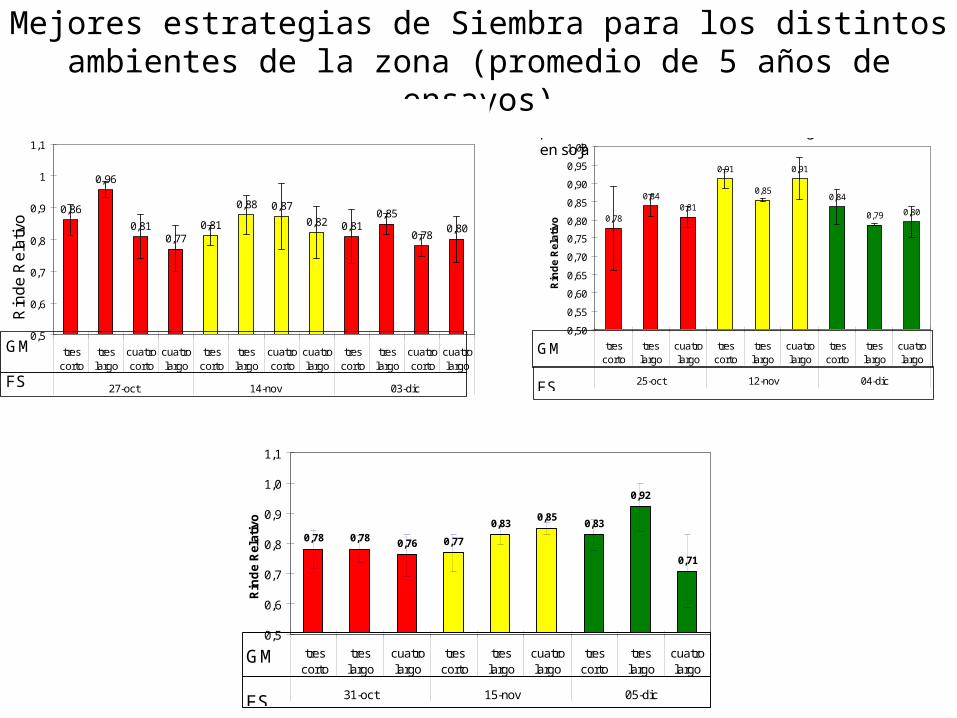
Mejores estrategias de Siembra para los distintos ambientes de la zona (promedio de 5 años de ensayos)
0,78 0,78 0,76 0,77
0,830,85
0,83
0,92
0,71
0,5
0,6
0,7
0,8
0,9
1,0
1,1
trescorto
treslargo
cuatrolargo
trescorto
treslargo
cuatrolargo
trescorto
treslargo
cuatrolargo
31-oct 15-nov 05-dic
Rin
de
Rel
ativ
o
.
Ambientes con Tosca (<70 cm), Comportamiento promedio de distintas estrategias de siembra- (3 años)
GM
FS
0,78
0,840,81
0,91
0,85
0,91
0,84
0,79 0,80
0,50
0,55
0,60
0,65
0,70
0,75
0,80
0,85
0,90
0,95
1,00
trescorto
treslargo
cuatrolargo
trescorto
treslargo
cuatrolargo
trescorto
treslargo
cuatrolargo
25-oct 12-nov 04-dic
Rin
de
Rel
ativ
o
.
Ambiente Seco(oeste de las sierras), comportamiento promedio de 3 años de distintas estrategias de siembra en soja
GM
FS
0,86
0,96
0,810,77
0,81
0,88 0,87
0,82 0,810,85
0,780,80
0,5
0,6
0,7
0,8
0,9
1
1,1
trescorto
treslargo
cuatrocorto
cuatrolargo
trescorto
treslargo
cuatrocorto
cuatrolargo
trescorto
treslargo
cuatrocorto
cuatrolargo
27-oct 14-nov 03-dic
Rin
de
Re
lativ
o
.
Ambiente Húmedo Profundo: Comportamiento promedio de 5 años de distintas estrategías de siembra en Soja.
GM
FS