


Idiomas
Páginas
Jurídico


MODELO ECONOMICOPLURINACIONAL PRODUCTIVO
ESTADO PLURINACIONAL DE BOLIVIA
Análisis del Plan Nacional de Desarrollo 2010 Plan Nacional de Desarrollo 2010 -- 2015 2015 (a partir de datos del gobierno de Bolivia)
Elaboración exposición gráfica: Maria Lohman

Temas a tratar
Las 4 crisis del CAPITALISMO
Dos modelos económicos
Inversiones y marco legal
Cifras y datos
Datos importantes para el ANALISIS
El Plan Nacional de Desarrollo 2010-2015

MODELO ECONOMICOPLURINACIONAL PRODUCTIVO
Las 4 crisis del CAPITALISMOqCrisis financieraqCrisis climáticaqCrisis energéticaqCrisis alimenticia
Fuente: LUIS ALBERTO ARCE CATACORAMINISTER OF ECONOMY AND PUBLIC FINANCES
MODELO ECONOMICOPLURINACIONAL PRODUCTIVO
Dos modelos económicos
Fuente: LUIS ALBERTO ARCE CATACORAMINISTER OF ECONOMY AND PUBLIC FINANCES

MIN
ISTE
RIO
DE
ECO
NO
MÍA
Y F
INAN
ZAS
PÚBL
ICAS
LIBRE MERCADO. The market is the mechanism for allocating resources
and the imbalance adjustor. Hypothesis: Efficient Market
EL ESTADO INTERVIENE to correct market failures (lack of redistribution
of wealth and transnational monopoly of strategic companies)
1. 1.
An isolated State. The market is a self-regulated mechanism of the
economic process
2. An active participation of the state in the economy. The state must
intervene in the economy through its seven facets: planner, entrepreneur,
investor, regulator, benefactor, developer, banker
2.
Privatization, the surplus is transferred abroad and without a
precautionary management policy of Natural Resources
Nationalization and control of strategic natural resources
3. 3.
A Primary Exporter DevelopmentPattern
4. A pattern of industrialization and productive development
4.
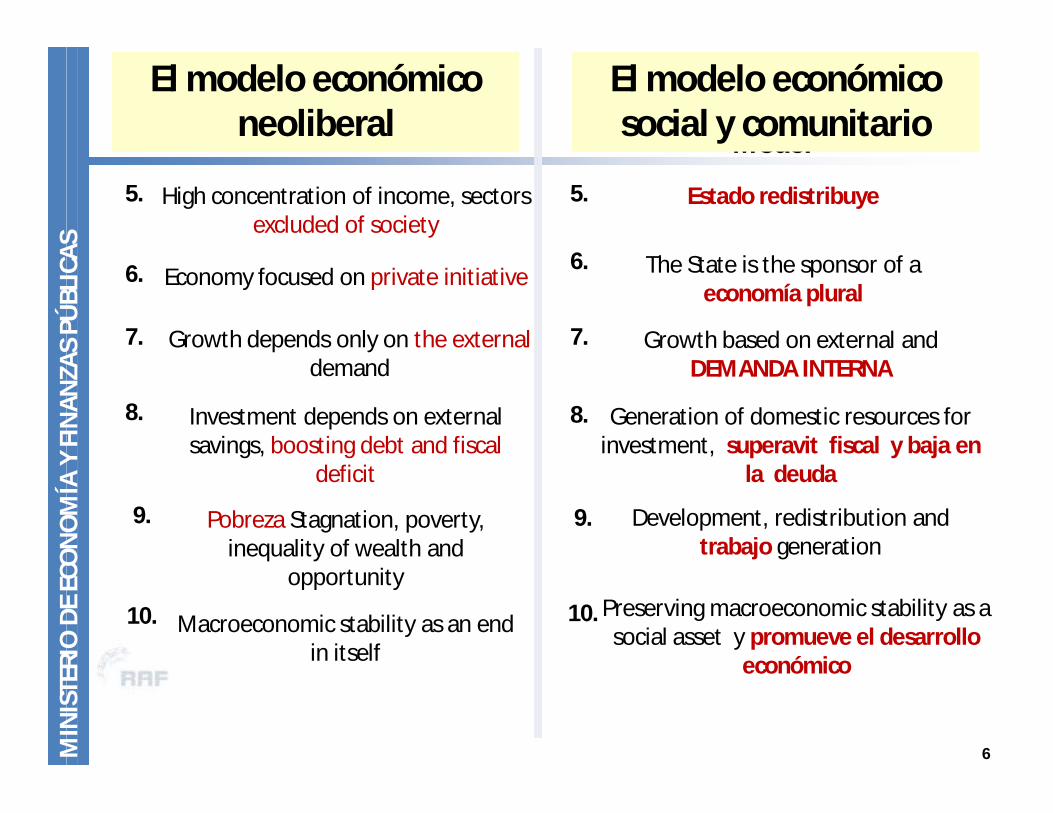
5
The Neoliberal Economic ModelThe Economic Social
Communitarian and Productive Model
El modelo económico neoliberal
El modelo económico social y comunitario
Preserving macroeconomic stability as a social asset y promueve el desarrollo
económico
MIN
ISTE
RIO
DE
ECO
NO
MÍA
Y F
INAN
ZAS
PÚBL
ICAS
High concentration of income, sectors excluded of society
5. Estado redistribuye5.
7. 7.Growth depends only on the external demand
Growth based on external and DEMANDA INTERNA
8. 8.Investment depends on external savings, boosting debt and fiscal
deficit
Generation of domestic resources for investment, superavit fiscal y baja en
la deuda
9. 9.Pobreza Stagnation, poverty, inequality of wealth and
opportunity
Development, redistribution and trabajo generation
Macroeconomic stability as an end in itself
10. 10.
Economy focused on private initiative 6. The State is the sponsor of a economía plural
6.
6
The Neoliberal Economic ModelThe Economic Social
Communitarian and Productive Model
El modelo económico neoliberal
El modelo económico social y comunitario

Fuente: Exposición de Alvaro García Linera nov. 2009 “REVOLUCIÓN DEMOCRÁTICA Y CULTURAL”

ETAPAS DEL NUEVO ESTADO•• REBELIONES
2000- 2005DEBILITAMIENTO DEL ESTADO NEOLIBERAL
• PROGRAMA DE GOBIERNO DE LOS MOVIMIENTOS SOCIALES2000-2005
• PROGRAMA DE GOBIERNO DE LOS MOVIMIENTOS SOCIALES2000-2005
CONSTRUCCIÓN DE UN BLOQUE SOCIAL DE PODER
• GOBIERNO DE LOS MOVIMIENTOS SOCIALES 2006 – 2009
• GOBIERNO DE LOS MOVIMIENTOS SOCIALES 2006 – 2009
VICTORIA ELECTORAL
• ASAMBLEA CONSTITUYENTE• ASAMBLEA CONSTITUYENTECONSTRUCCIÓN PACTADA DEL NUEVO ESTADO
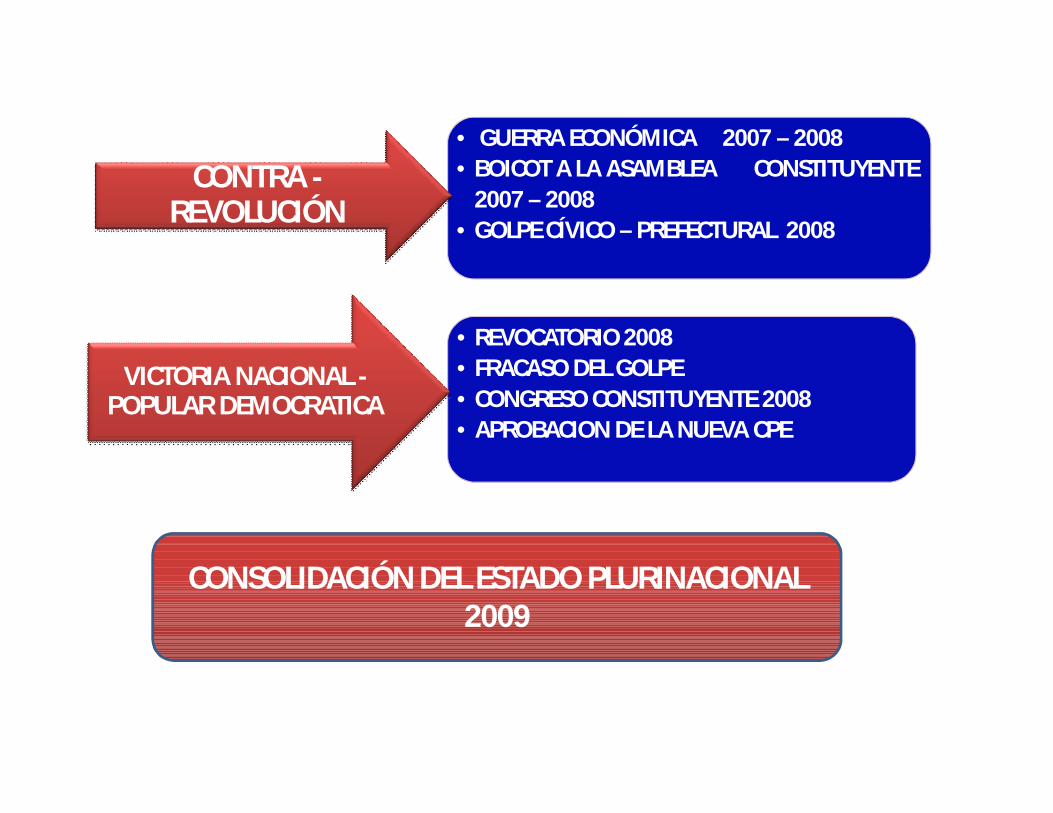
•• GUERRA ECONÓMICA 2007 – 2008• BOICOT A LA ASAMBLEA CONSTITUYENTE
2007 – 2008• GOLPE CÍVICO – PREFECTURAL 2008
CONTRA -REVOLUCIÓN
• REVOCATORIO 2008• FRACASO DEL GOLPE• CONGRESO CONSTITUYENTE 2008 • APROBACION DE LA NUEVA CPE
• REVOCATORIO 2008• FRACASO DEL GOLPE• CONGRESO CONSTITUYENTE 2008 • APROBACION DE LA NUEVA CPE
VICTORIA NACIONAL -POPULAR DEMOCRATICA
CONSOLIDACIÓN DEL ESTADO PLURINACIONAL 2009

2010 -1015
• DESARROLLAR EL ESTADO
PLURINACIONAL 2010 -1015
TAREA
Fuente: Exposición de Alvaro García Linera nov. 2009 “REVOLUCIÓN DEMOCRÁTICA Y CULTURAL”

Ø Nacionalización de las empresas públicasØ Estado productor y
conductor de la economía Ø Economía pluralØModernización de la
economía campesina, micro empresarial y comunalØ Apoyo a la empresa privada
productivaØ Economía globalizada
ECONOMIA SOCIAL Y
COMUNITARIA
NUEVA ECONOMIA
Fuente: Exposición de Alvaro García Linera nov. 2009 “REVOLUCIÓN DEMOCRÁTICA Y CULTURAL”

Sectores estratégicos,
generadores de GANANCIAS
Sectores quegeneran ingresos y
trabajo
• Hydrocarbons
• Mining
• Electricity
• Environmental Resources
• Industry, manufacturing and crafts
• Tourism
• Agricultural development
• Housing
• Trade, transport services, other services
Ganancias
ESTADO RETRIBUTIVO
MIN
ISTE
RIO
DE
ECO
NO
MÍA
Y F
INAN
ZAS
PÚBL
ICAS
EL MODELO ECONOMICO SOCIAL, COMUNITARIO Y PRODUCTIVO
12
Source: New Political Constitution of the StateElaborated: Ministry of Economy and Public Finances, Fiscal Analysis Network (RAF)Lats update: Thursday, april 15th 2010 (Hrs. 20:06)
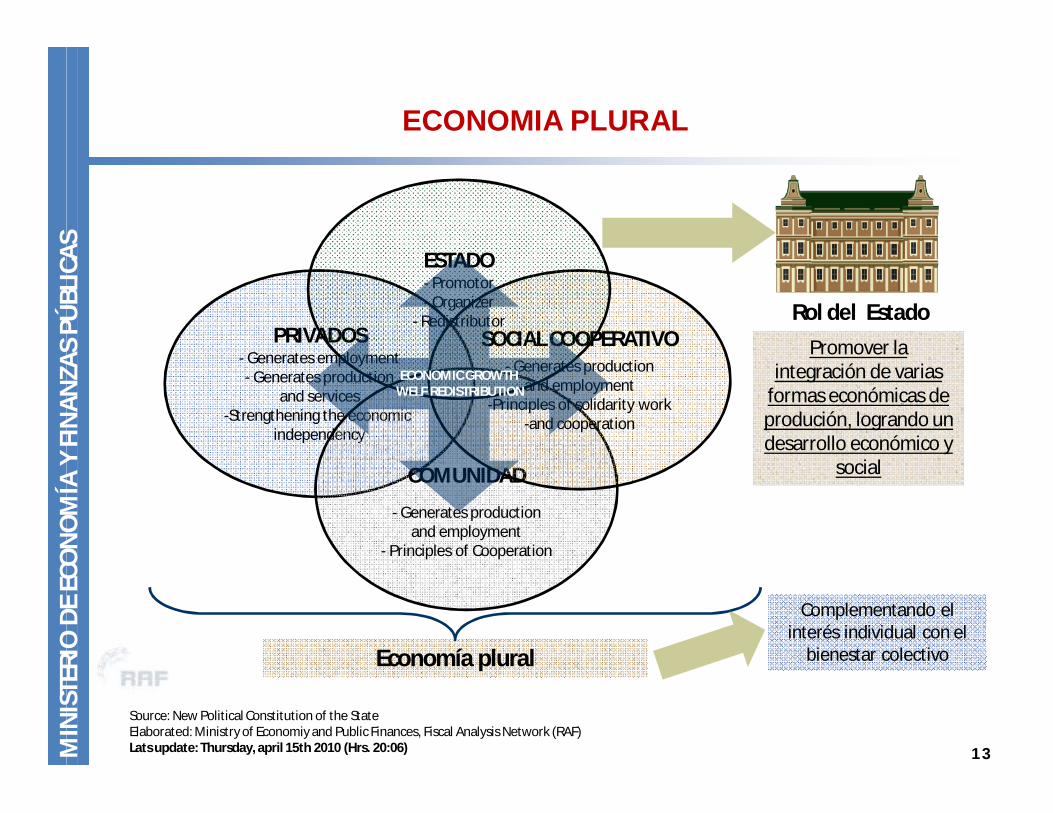
PRIVADOS- Generates employment- Generates production
and services-Strengthening the economic
independency
Promover la integración de varias
formas económicas de produción, logrando un desarrollo económico y
social
Economía plural
COMUNIDAD
- Generates productionand employment
- Principles of Cooperation
SOCIAL COOPERATIVO- Generates production
and employment-Principles of solidarity work
-and cooperation
ESTADO- Promotor- Organizer
- Redistributor
Complementando el interés individual con el
bienestar colectivo
Rol del Estado
ECONOMIC GROWTHWELF REDISTRIBUTION
MIN
ISTE
RIO
DE
ECO
NO
MÍA
Y F
INAN
ZAS
PÚBL
ICAS
ECONOMIA PLURAL
13
Source: New Political Constitution of the StateElaborated: Ministry of Economiy and Public Finances, Fiscal Analysis Network (RAF)Lats update: Thursday, april 15th 2010 (Hrs. 20:06)

MODELO ECONOMICOPLURINACIONAL PRODUCTIVO
Cifras y datos. Inversiones - Ingreso por Nacionalización Petróleo y
recaudación Minera – BONOS – crecimiento ingresos Municipios y Prefecturas – crecimiento de Reservas – disminución Deuda
Pública / Deuda interna baja– mayor ingreso tributario –mayores depósitos en la Banca – Saneamiento de Tierras –
Crecimiento PIB – Disminución inflación – Crecimiento exportación/importaciones- Balance comercial positivo –
Reducción Pobreza
Fuente: LUIS ALBERTO ARCE CATACORAMINISTER OF ECONOMY AND PUBLIC FINANCES


NACIONALIZACIÓN DE LAS GANANCIAS

312.444383.091
600.963 626.507 647.083 668.757 676.939 678.797 683.308 687.445
462.196
569.106
862.140
953.1891.020.295
1.084.701 1.112.205 1.139.913 1.167.780 1.195.759
774.640
952.197
1.463.103
1.579.696
1.667.378
1.753.4581.789.144 1.818.710 1.851.088 1.883.204
0
200.000
400.000
600.000
800.000
1.000.000
1.200.000
1.400.000
1.600.000
1.800.000
2.000.000
2006 2007 2008 2009 2010 2011 2012 2013 2014 2015
Estimación del número de hogares beneficiarios con bonos (Renta Dignidad, Juancito Pinto, Juana Azurduy)
Área Rural
Área Urbana
Total
Fuente: Estimaciones UDAPE


Bolivia: Domestic public debt of the TGN, 1993 – Marzo 2010 (p)(In percent of GDP)
(p) PreliminarySource: Ministry of Economy and Public Finances, DGCPElaborated: Ministry of Economy and Public Finances, Fiscal Analysis Network (RAF)Last update: Monday, april 12 2010 (Hrs. 12:13) 22M
INIS
TERI
O D
E EC
ON
OM
ÍA Y
FIN
ANZA
S PÚ
BLIC
AS
Mar
13,814,8 13,9 13,8 13,3 13,7
16,4
26,724,8 24,7
23,123,7
31,231,2
18,9
25,3
27,5
30,1
0,0
5,0
10,0
15,0
20,0
25,0
30,0
35,019
93
1994
1995
1996
1997
1998
1999
2000
2001
2002
2003
2004
2005
2006
2007
2008
2009
2010
DECLINING DEBT


SANEAMIENTO DE TIERRAS
9 AÑOS 1996 - 2005 SANEADO9,3
MILLONES DE HA
3 AÑOS 2006 - 2009 SANEADO 23,5 HA

TIPO DE PROPIEDAD

755 785
712
714
720 77
2 796
790
806 88
5 953
1.00
0
1.05
0
1.00
1
995
942
895
894 95
0
1.01
0
1.32
8
1.18
2
1.65
1
1.68
3
0
200
400
600
800
1.000
1.200
1.400
1.600
1.800
1986
1987
1988
1989
1990
1991
1992
1993
1994
1995
1996
1997
1998
1999
2000
2001
2002
2003
2004
2005
(p)
2006
(p)
2007
(p)
2008
(p)
2009
(p)
Bolivia: PIB per capita, 1986 - 2009 (p) (In USD)
Average 1986 - 2005 2005 (p) 2006 (p) 2007 (p) 2008 (p) 2009 (p)
871 1.010 1.182 1.328 1.651 1.683
27MIN
ISTE
RIO
DE
ECO
NO
MÍA
Y F
INAN
ZAS
PÚBL
ICAS
(p) PreliminarySource: National Statistic Institute (INE)Elaborated: Ministry of Economy and Public Finances, Fiscal Analysis Network (RAF)Last update: Tuesday, april 13 2010 (Hrs. 18:42)

Bolivia: Real GDP composition by economic activity2000 - 2009 (p)
(In millions of Bs.1990)
(p) PreliminarySource: National Statistic Institute (INE)Elaborated: Ministry of Economy and Public Finances, Fiscal Analysis Network (RAF)Last update: Monday, april 19th 2010 (Hrs. 09:33) 28M
INIS
TERI
O D
E EC
ON
OM
ÍA Y
FIN
ANZA
S PÚ
BLIC
AS
17%
13%
11%
11%
9%
8%
7%5%3%2%
13%
3.699 3.798 3.807 3.952 4.173 4.298 4.646 4.929 5.110 5.355
3.178 3.288 3.303 3.591 3.599 3.779 3.940 3.920 4.022 4.170 3.140 3.146 3.047 2.946 2.903 2.913 3.070 3.263 3.415 3.557 2.385 2.457 2.563 2.662 2.770 2.851 2.963 3.066 3.190 3.368 2.024 2.075 2.141 2.214 2.290 2.373
2.459 2.559 2.657 2.829
1.891 1.902 1.943 1.991 2.069 2.133 2.215 2.338 2.450
2.570 2.648 2.760 3.006 3.165 3.474 3.652
3.725 3.846
4.004 3.955
2.100 1.720 1.054
22.356 22.733 23.298 23.929 24.928
26.030 27.279
28.524 30.278
31.294
0
5.000
10.000
15.000
20.000
25.000
30.000
35.000
2000 2001 2002 2003 2004 2005 2006(p) 2007(p) 2008(p) 2009(p)
Manufacturing Agriculture and livestock Financial service institutesTransport, storage and comun. Public administration services ComerceMining Hydrocarbons ConstructionElectricity, gas and water Others

10,66
21,51
16,5618,01
14,52
10,469,31
8,52
12,58
7,956,73
4,393,13 3,41
0,922,45
3,944,62 4,91 4,95
11,85
0,69
11,73
0,260,0
5,0
10,0
15,0
20,0
25,0
30,019
85
1986
1987
1988
1989
1990
1991
1992
1993
1994
1995
1996
1997
1998
1999
2000
2001
2002
2003
2004
2005
2006
2007
2008
2009
2010
668.171
Mar
29MIN
ISTE
RIO
DE
ECO
NO
MÍA
Y F
INAN
ZAS
PÚBL
ICAS
Source: National Statistic Institute (INE)Elaborated: Ministry of Economy and Public Finances, Fiscal Analysis Network (RAF)Last update: Tuesday, april 13 2010 (Hrs. 18:42)
SHARP DECLINE IN INFLATION
Bolivia: Anual inflation rate, 1985 – March 2010(In percent)
12-M
onth

HOSPITALES

282
340
389
506
413
471
410
374
1.11
9
900604
616 738 89
2
743 93
2
870
926
2.59
9
2.28
0
535 65
9 755 1.
007
919
607
418
524
1.31
5
1.22
5
837
490
524
403
359 36
5
372
862 997 1.28
1
1.46
7 1.77
095
2
946
611
504
458
7039941.1301.1771.196
1.4341.657
1.926
2.4512.0982.020
1.7081.8321.6921.920
2.440
2.926
5.100
4.467
692 700
3.588
0
1.000
2.000
3.000
4.000
5.000
6.000
1990
1991
1992
1993
1994
1995
1996
1997
1998
1999
2000
2001
2002
2003
2004
2005
2006
2007
2008
2009
2009
2010
Capital goodsRaw materials and intermediate productConsumer goodsOthers
Bolivia: Imports by economic use or destiny (CUODE)1990 – 2009, Accumulated January – February 2009 - 2010 (p)
(In millions of USD)
-12%
42%
23%
20%
Average 1985 - 2005 2006 2007 2008 2009 (p)
1.415 2.926 3.588 5.100 4.467
31MIN
ISTE
RIO
DE
ECO
NO
MÍA
Y F
INAN
ZAS
PÚBL
ICAS
Jan-Feb
1%
(p) PreliminarySource: National Statistic Institute (INE)Elaborated: Ministry of Economy and Public Finances, Fiscal Analysis Network (RAF)Last update: Monday, april 5 2010 (Hrs. 11:02)

AMBULANCIAS
64,8 63,6 63,566,4
63,1 63,3 63,260,6 59,9 60,1 59,3 58,3
51,954,5
51,454,5 54,3 53,9 54,4
51,1 50,3 50,9 51,2 50,1
83,9
78,0
84,087,0
77,7 78,8 77,7 77,6 76,5 77,374,3 73,8
40,0
45,0
50,0
55,0
60,0
65,0
70,0
75,0
80,0
85,0
90,0
1996 1997 1999 2000 2001 2002 2003-2004
2005 2006 2007 2008(e)
2009(e)
NationalUrbanRural
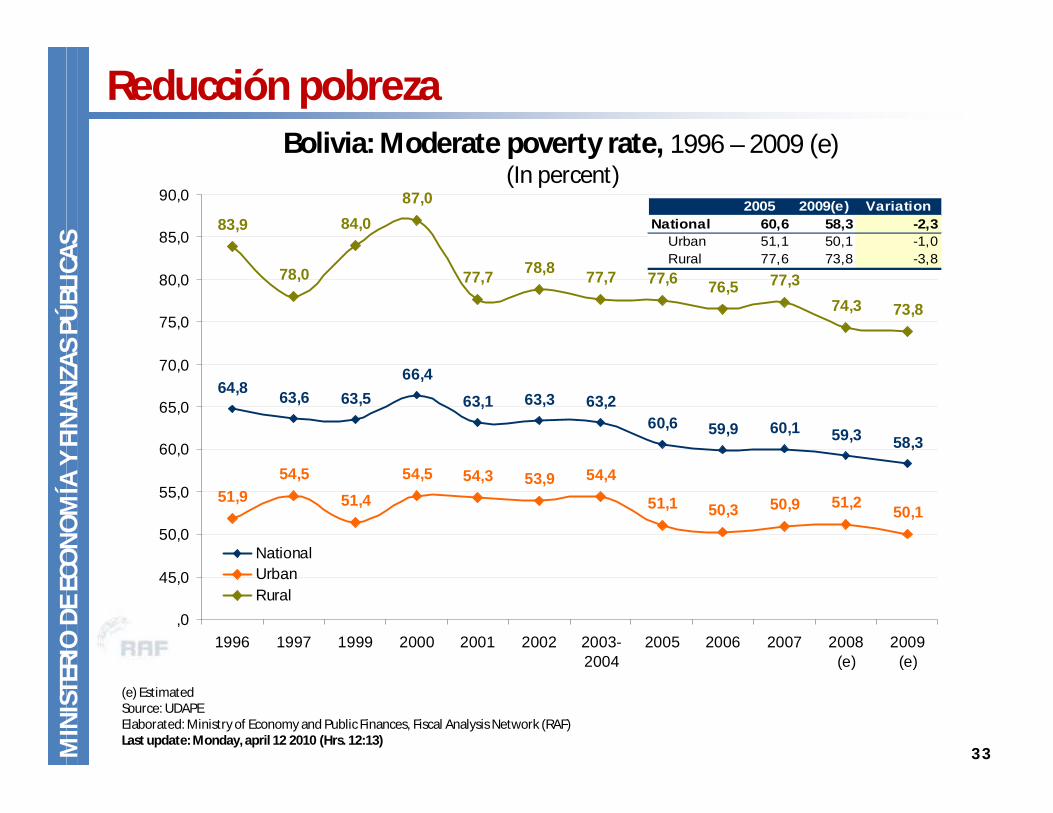
Bolivia: Moderate poverty rate, 1996 – 2009 (e)(In percent)
2005 2009(e) VariationNational 60,6 58,3 -2,3
Urban 51,1 50,1 -1,0Rural 77,6 73,8 -3,8
33MIN
ISTE
RIO
DE
ECO
NO
MÍA
Y F
INAN
ZAS
PÚBL
ICAS
Reducción pobreza
(e) EstimatedSource: UDAPEElaborated: Ministry of Economy and Public Finances, Fiscal Analysis Network (RAF)Last update: Monday, april 12 2010 (Hrs. 12:13)
MODELO ECONOMICOPLURINACIONAL PRODUCTIVO
El Plan Nacional de Desarrollo 2010-2015
Fuente: LUIS ALBERTO ARCE CATACORAMINISTER OF ECONOMY AND PUBLIC FINANCES


BOLIVIA PRODUCTIVA
La Bolivia Productiva garantizará el desarrollo económico del país, continuandocon la transformación de la matriz productiva con capacidadde generar ahorro e inversión, empleo estable e ingresos y produccióndestinada al mercado interno y luego al externo.
Esta visión permitirá establecer un nuevo patrón de desarrollo –culminandola trayectoria histórica del patrón primario exportador vigente en el país–, ingresando a una nueva era de industrialización y generaciónde valor agregado.
En este sentido, se avanzará de un modelo donde solamente se hangenerado y creado condiciones para el desarrollo de algunas regionesdel país hacia otro modelo donde la prioridad es la generación equilibrada de capacidades productivas en el conjunto de territorios y regiones de Bolivia, logrando al mismo tiempo una articulación entre procesos dedesarrollo urbano y rural.
BOLIVIA PRODUCTIVAUno de los más importantes desafíos de esta transición es el hecho de que se debe avanzar en la creación de un escenario de equidad en lo que se refiere a la redistribución de la riqueza generada en las actividades productivas.
Este nuevo modelo económico está plasmado en la Nueva Constitución Política del Estado y en el Plan Nacional de Desarrollo presentado durante el Gobierno del MAS-IPSP.
Entonces, el propósito principal de nuestro Nuevo Modelo NacionalProductivo, basado en la Economía Plural, es crear las condiciones paragarantizar un incremento en la producción de los recursos naturales renovables y no renovables con el propósito de garantizar un mayor crecimiento económico del país pero con mayores ingresos, empleos y con mayor equidad social y económica, de tal modo que se lleve a cabo, porprimera vez en la historia del país, un proceso de redistribución de losingresos que resultan del desarrollo de las actividades productivas.

5 pilares► Expansión del Rol del Estado.
► Desarrollo productivo con valor agregado de los recursos naturalesy sustentabilidad ambiental.
► Participación activa de las economías (pública, privada, comunitariay cooperativa) en el aparato productivo.
► Producción para satisfacer el mercado interno y luego la exportación.
► Redistribución equitativa de de la riqueza y excedentes y reducciónde las desigualdades.

MODELO ECONOMICOPLURINACIONAL PRODUCTIVO
Plan de Inversiones2010-2015
Fuente: LUIS ALBERTO ARCE CATACORAMINISTER OF ECONOMY AND PUBLIC FINANCES

PROYECCION de INVERSIONES PROGRAMA 2010 - 2015
MIN
ISTE
RIO
DE
ECO
NO
MÍA
Y F
INAN
ZAS
PÚB
LIC
AS
40
Este documento se encuentra sólo en versión inglés. Algunos títulos y subtitulos fueron traducidos al castellano
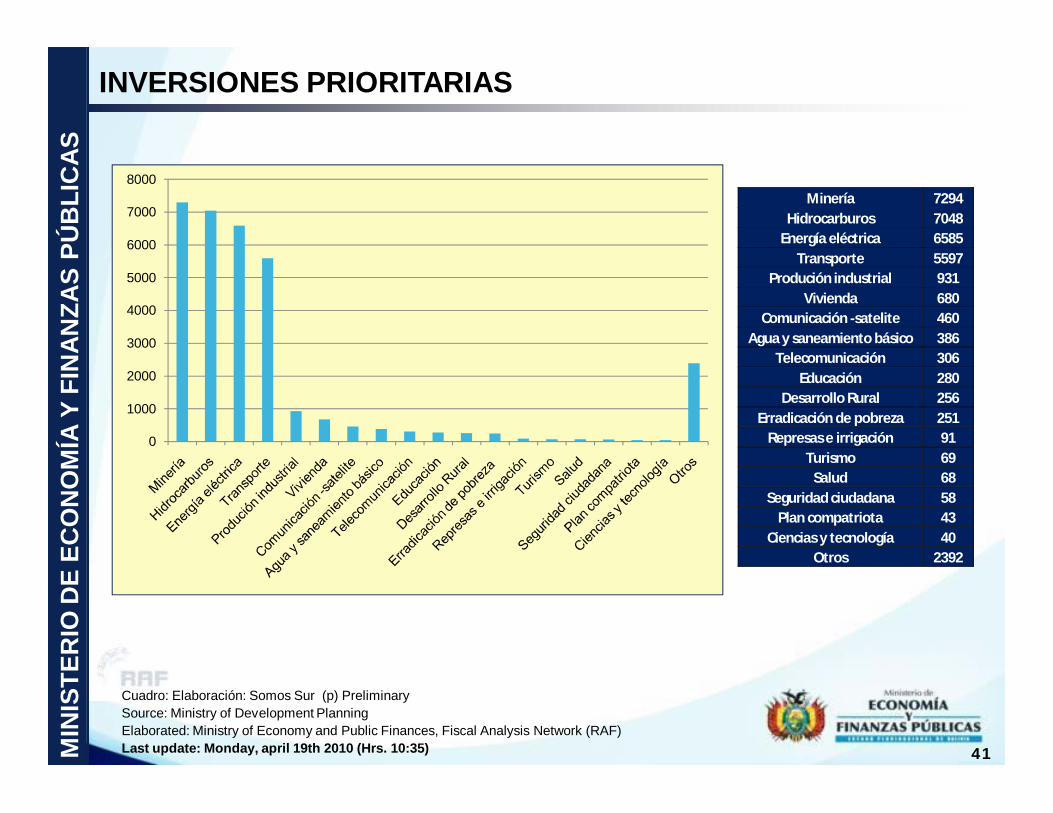
INVERSIONES PRIORITARIAS M
INIS
TER
IO D
E EC
ON
OM
ÍA Y
FIN
ANZA
S PÚ
BLI
CAS
41
Cuadro: Elaboración: Somos Sur (p) PreliminarySource: Ministry of Development PlanningElaborated: Ministry of Economy and Public Finances, Fiscal Analysis Network (RAF)Last update: Monday, april 19th 2010 (Hrs. 10:35)
0
1000
2000
3000
4000
5000
6000
7000
8000Minería 7294
Hidrocarburos 7048Energía eléctrica 6585
Transporte 5597Produción industrial 931
Vivienda 680Comunicación -satelite 460
Agua y saneamiento básico 386Telecomunicación 306
Educación 280Desarrollo Rural 256
Erradicación de pobreza 251Represas e irrigación 91
Turismo 69Salud 68
Seguridad ciudadana 58Plan compatriota 43
Ciencias y tecnología 40Otros 2392

Achacachi
Vinto
Bermejo
El Alto
Caracollo
San Buenaventura
San JoséMisicuni
Cbba.Corocoro
Huanuni Zinc
Litio
Gran Chaco
Rositas
Santa Cruz El Mutún
Rio Grande
Cachuela Esperanza
El Bala
Miguillas
Villa Tunari
Challapata
Carrasco
MineríaLitio – Uyuni (I)Hierro – Mutún (I)Zinc – Potosí, Oruro (PreI)Huanuni (I)Fundación Vinto (I)Complejo Corocoro (F)
Industrialización de HidrocarburosRefineríaSanta Cruz y Cochabamba (PreI)
Amoníaco/Urea: Cochabamba (PreI)
Planta de Separación:Rio Grande (Santa Cruz) y Tarija (PreI)
Casas pre-fabricadas: Caracollo (I)
Gas to liquids, GTL: Gran Chaco (San Alberto, Sábalo, Margarita) (PreI)
Plantas de energía hidroeléctricaPara EXPORTACION: Cachuela Esperanza, El Bala y Rositas (PreI)Mercado interno: Miguillas, Misicuniy San José (PreI)
CARTONBOL (O)
LACTEOSBOL (O)PAPELBOL (O)
Empresas públicas
ECEBOL (I)
Empresa forestal Boliviana (EFB) (PreI)Empresa Boliviana de almendra (F)
AZUCARBOL (I)
Ingenio azucarero S. Buenaventura (PreI)
Estudios de pre-inversión (PreI)
Inversión (I)
Operación (O)
PRIORIDAD: INDUSTRIALIZAR HIDROCARBUROS, MINERIA, ENERGIA y otros
MIN
ISTE
RIO
DE
ECO
NO
MÍA
Y F
INAN
ZAS
PÚB
LIC
AS
42

Area potencial de petróleo Area tradicionalExploración de PetróleoExploitación de petróleoNuevas áreas de exploraciónMadidi, Chepite, ChispaniAguaragüe , Camatindi norte y sur, San Telmo
Producción7 pozos en Margarita y Huacaya (Repsol)2 Pozos verticales aditionales- Incahuasi (E&P)Planta San AlbertoCampos al Norte
El desafío de la INDUSTRIALIZACIONM
INIS
TER
IO D
E EC
ON
OM
ÍA Y
FIN
ANZA
S PÚ
BLI
CAS
43
Sector HIDROCARBURIFERO Exploración y producción

RefineríaSanta Cruz, Cochabamba
IndustrializaciónAmoníaco/Urea: Cochabamba Provincia Gran Chaco (Campo San AlbertoSábalo, Margarita (GTL))
Plantas de separaciónSanta Cruz, Tarija
Refinería e industrialización
MIN
ISTE
RIO
DE
ECO
NO
MÍA
Y F
INAN
ZAS
PÚB
LIC
AS
44
INVERSIONES EN HIDROCARBUROS (en mill. de dólares)
El desafío de la INDUSTRIALIZACIÓN
Projects Investment amount (e)
HIDROCARBUROS 7,048
- Hydrocarbon exploration 852- Hydrocarbon exploitation 648- Separation GLP Plant 450- Converting the energy matrix - natural gas distribution system
748
- Hydrocarbons industrialization 1,410- Hydrocarbons transportation 2,093- Hydrocarbons storage 62- Hydrocarbons refinement 715- Oil houses construction (YPFB - PEQUINVEN)
70
- Hydrocarbons Research and Technological Innovation Centre (CITH) 1

Complejo hidrometalúrgico Coro-Coro Inversión (50.000 TM cobre/año)
Fundición AUSMELT VINTO
Refinería nueva de Huanuni (3.000 TON/día)
Plantas hidrometalúrgicas de Zinc (Oruro / Potosí)
Hierro → El Mutún
Planta piloto de Carbonato de Litio (40 MT/día)
Producción de Carbonato de Litio a gran escala (400.000 MT/año)
Cloruro de Litio/ Litio Metal
Industria de baterías de Litio
Industria de automóviles eléctricos
Minería
MIN
ISTE
RIO
DE
ECO
NO
MÍA
Y F
INAN
ZAS
PÚB
LIC
AS
45
El desafío de la INDUSTRIALIZACIÓN

MIN
ISTE
RIO
DE
ECO
NO
MÍA
Y F
INAN
ZAS
PÚB
LIC
AS
46
INDUSTRIALIZACIÓN DEL LITIO“SALAR DE UYUNI”
FASES DEL PROYECTO DE LITIO1. Instalación de la Planta Piloto de Carbonatio
de Litio2. Producción a gran escala de carbonato de
litio3. Elaboración industrial de baterías de alta
tecnología en base al metal de litio
DESCRIPCIÓN DEL PROYECTODe acuerdo a The United States Geological Surveylas reservas del litio en Bolivia son de 5,4 millones de toneladas.
Entre los países con mayor demanda de litio están: Estados Unidos, China, Inglaterra, Alemania y Japón. El precio de este metal fluctúa alrededor de $ 4.300 por tonelada.
Base de Reserva Mundial de Litio(1), 2007
(In millions of tons)Lithium reserve
% Percent
Bolivia 5,4 49,1Chile 3,0 27,3China 1,1 10,0Brazil 0,9 8,3United States 0,4 3,7Canada 0,4 3,3Australia 0,3 2,4Zimbawe 0,0 0,2World total (rounded) 11,0 100,0
(1) That part of an identified reosurce that meets specified minimium physical and chemical criteria related to current mining and production practices, including those for grade, quality, thickness, and depht.Source: United States Geological Survey, Mineral Commodity Summaries 2007
INVERSIÓN MINERA(En millones de dólares)
EL RETO DE LA INDUSTRIALIZACIÓN
Projects Investment amount (e)
MINING 7.294
- Lithium industrialization - Salar de Uyuni (Potosí) - basic chemicals 2.500
- Two zinc's hidrometallurgical plants (Oruro - Potosi) 500
- Sulfuric acid production plant installation 120- Ausmelt furnace installation (Metallurgy company Vinto - Oruro) 20
- Metal Recovery Karachipampa (Potosí) 140Mecanization program's of statal mining- Elaboration of geological maps 40- Mechanization of statal mining 115- Mutun exploitation (50% not concessioned) 3.645- Corocoro Kores (Foreign direct investment) 214
PRODUCTION 300
Lithium Battery Plants- Lithium batteries production industrial plant 300
Minería

PROYECTOS PARA EXPORTACIÓN
PROYECTOS HIDROELÉCTRICOS(En millones de dólares)
PROYECTOS PARA EL CONSUMO INTERNO
Cachuela Esperanza
El Bala
Rositas
Miguillas
Misicuni San José
Energía
MIN
ISTE
RIO
DE
ECO
NO
MÍA
Y F
INAN
ZAS
PÚB
LIC
AS
47
Installed power
(MW)
Revenue / year (e)
Misicuni (Cochabamba) 80 10San José (Chapare) 120 25Miguillas (Inquisivi, La Paz) 250 95
Installed power
(MW)
Revenue / year (e)
Cachuela Esperanza (Beni) 800 359Rositas (Río Grande,Santa Cruz) 400 146El Bala (North La Paz) 1600 619
EL RETO DE LA INDUSTRIALIZACIÓN

PROYECTOS PARA EXPORTACIÓN
PROYECTOS PARA EL CONSUMO INTERNO
Cachuela Esperanza
El Bala
Rositas
Miguillas
Misicuni San José
Energía
MIN
ISTE
RIO
DE
ECO
NO
MÍA
Y F
INAN
ZAS
PÚB
LIC
AS
48
INVERSIÓN EN ENERGÍA ELÉCTRICA(En millones de dólares)
EL RETO DE LA INDUSTRIALIZACIÓN
Projects Investment amount (e)
ELECTRICAL ENERGY 6.585
- Cachuela Esperanza (Beni) hydroelectrical construction 2.500
- Rositas (Rio Grande, Santa Cruz) hydroelectrical construction 640
- El Bala (North La Paz) hydroelectrical construction 2.400
- Miguilla (Inquisivi, La Paz) central hydroelectrical construction 375
- Laguna Colorada (Potosí) geothermal plant construction 350
- San José (Cochabamaba) hydroelectrical construction 195
- Wind energy generation 125

Carreteras existentes
Perú
Brazil
Puerto Ustariz
Yacuiba
GuayaramerínCobija
La Paz
Villazon ParaguayChile
S. I. Moxos
Villa Tunari
Programa de gobierno
MIN
ISTE
RIO
DE
ECO
NO
MÍA
Y F
INAN
ZAS
PÚB
LIC
AS Carreteras interconectadas
INTEGRACIÓN CAMINERA
49
INVERSIÓN EN CONSTRUCCIÓN DE CAMINOS(En millones de dólares)
Chile
Projects Investment amount (e)
ROADS AND BRIDGES 1,637
Corridor I: East - West (Bolivia, Brasil and Chile)- San Matías - Concepción (paving) 292
Corridor III: West - North - Yucumo - San Borja 24 - Guayaramerín - San Javier 18 - Guayaramerín - San Javier 285 - Porvenir - El Choro 162
Paved roads- Guayanamerin - Cachuela Esperanza road (Pando) 20- Uyuni - Hito LX road (Potosí) 153- San Juan - Laguna Colorada road (Potosí) 117- Pando paved road, connecting to Brazil 250- Puerto Ustarez - Rodonia (Brasil) and other roads (Beni) 163
Strategic bridge for regional integration: 6.160 m 154

CORREDORES VIALES
Corredor 1. Este – Oeste (Bolivia, Brasil y Chile) 910 Km
Corredor 2. Norte – Sud (Puerto Ustáriz - Yacuiba) 128 Km
Corredor 3. Oeste – Norte (La Paz-Riberalta-Guayaramerín-Cobija) 1.617 Km
Corredor 4. Oeste – Sud (La Paz -Bermejo-Villazón) 329 Km
Corredor 5. Este – Oeste (Central-Sud) (Chile, Bolivia y Paraguay) 209 Km
Carreteras existentes
Programa de gobierno
Villa Tunari – San Ignacio de Moxos295 Km
Perú
Brazil
ParaguayChile
MIN
ISTE
RIO
DE
ECO
NO
MÍA
Y F
INAN
ZAS
PÚB
LIC
AS
50
Carreteras integradas
INTEGRACIÓN CAMINERA
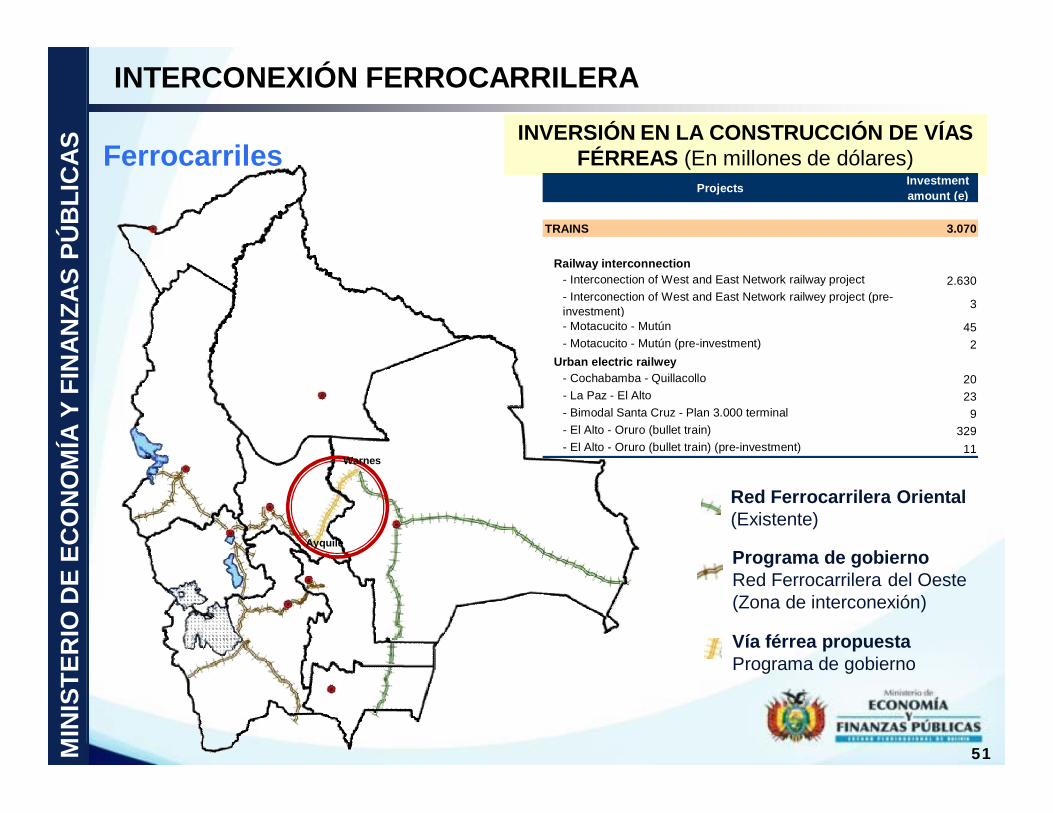
Red Ferrocarrilera Oriental(Existente)
Programa de gobiernoRed Ferrocarrilera del Oeste(Zona de interconexión)
Ayquile
Warnes
Vía férrea propuestaPrograma de gobierno
MIN
ISTE
RIO
DE
ECO
NO
MÍA
Y F
INAN
ZAS
PÚB
LIC
AS
51
Ferrocarriles
INTERCONEXIÓN FERROCARRILERA
INVERSIÓN EN LA CONSTRUCCIÓN DE VÍAS FÉRREAS (En millones de dólares)
Projects Investment amount (e)
TRAINS 3.070
Railway interconnection- Interconection of West and East Network railway project 2.630- Interconection of West and East Network railwey project (pre-investment) 3
- Motacucito - Mutún 45- Motacucito - Mutún (pre-investment) 2
Urban electric railwey- Cochabamba - Quillacollo 20- La Paz - El Alto 23- Bimodal Santa Cruz - Plan 3.000 terminal 9- El Alto - Oruro (bullet train) 329- El Alto - Oruro (bullet train) (pre-investment) 11

Carretera pavimentada (ESM, JSB y ABC)Puerto Suárez – Mutún – Puerto Busch
Vía férrea Puerto Suárez – Mutún – Puerto Busch
Vía fluvial Mutún – Río Paraguay (Dionisio Foianini)
Vía FluvialMutún – Puerto Busch: 110 KmPuerto Busch – Puerto Nueva Palmira: 2.000 KmTOTAL: 2.110 Km aprox.
MIN
ISTE
RIO
DE
ECO
NO
MÍA
Y F
INAN
ZAS
PÚB
LIC
AS
52
Vía fluvial Mutún – Puerto Busch
BOLIVIA: CONECTADA AL ATLÁNTICO
VÍA FLUVIAL MUTÚN – PUERTO BUSCHMonto de inversión (e):USD 450 millions

MIN
ISTE
RIO
DE
ECO
NO
MÍA
Y FI
NAN
ZAS
PÚB
LIC
AS
TRIGO (Hectáreas)
Producción potencial de trigo
DESARROLLO RURAL
53
INVERSIÓN EN DESARROLLO RURAL Y SEGURIDAD ALIMENTARIA
(En millones de dólares)Projects Investment
amount (e)
RURAL DEVELOPMENT 256
Secure agricultural production- Inorganic fertilizers production 6- Universal Agricultural Insurance 60- III National Agricultural Census 14
Food fair price- National Food Security Plan 10- National wheat production program 8- EMAPA 9- Greenhouses 21- Promote agricultural production capacities for food security program (INIAF) 31
- Milk production and beef encourage program 7Agroecological production
- Organic fertilizers production 7- CRIAR (Rural Food Initiatives Creation) consolidation
30
- EMPODERAR (Rural Development self managed organized enterprise) consolidation
10
- Ecological production national programme 7Early warning to agricultural sector (Risk management)
3
- Rural contingency national plan (Agriculture component) for risk management
5
- SUSTENTAR, Sustainable forestry program 7- Sugar cane production - San Buenaventura 21
MODELO ECONOMICOPLURINACIONAL PRODUCTIVO
Datos importantes para el ANALISS
Fuente: LUIS ALBERTO ARCE CATACORAMINISTER OF ECONOMY AND PUBLIC FINANCES

Elaborated: Ministry of Economy and Public Finances, Fiscal Analysis Network (RAF)Lats update: Tuesday, april 13 2010 (Hrs. 19:18)
Reconocimiento internacional …International Organisms
55MIN
ISTE
RIO
DE
ECO
NO
MÍA
Y F
INAN
ZAS
PÚBL
ICAS FMI: “Regional Economic Outlook: Western Hemisphere"
presentation in Bolivia, and Article IV Consultation. The IMF described as prudent and wise the economic policy implemented in the country, for the fiscal stimulus applied in the crisis period
October, 2009
October 2009 and February 2010
November, 2009
December, 2009
BID: Emphasizes the positive growth in 2009, and the least impact of the crisis in the country, in relation to Latin America and the Caribbean
World Bank: Emphasizes the "appropriate macroeconomic management, and achieving the highest growth rate among countries in Latin America”
CEPAL: Positioned to Bolivia as the fastest growing economy in 2009 and among the principals in 2010
Datos importantes para el ANALISIS del Plan Nacional de Desarrollo 2010-2015

Cinco actividades económicas amenazan las áreas protegidas en el país:
•Hidrocarburos •Caminos - ferroviarios•Madereras •Hidroeléctricas•Mineras
Fuente: Centro de Ecología y Pueblos Andinos (CEPA)
Datos importantes para el ANALISIS del Plan Nacional de Desarrollo 2010-2015

“Precio del estaño rebasó barrera de los 10 dólares la libra fina”
Datos importantes para el ANALISIS del Plan Nacional de Desarrollo 2010-2015
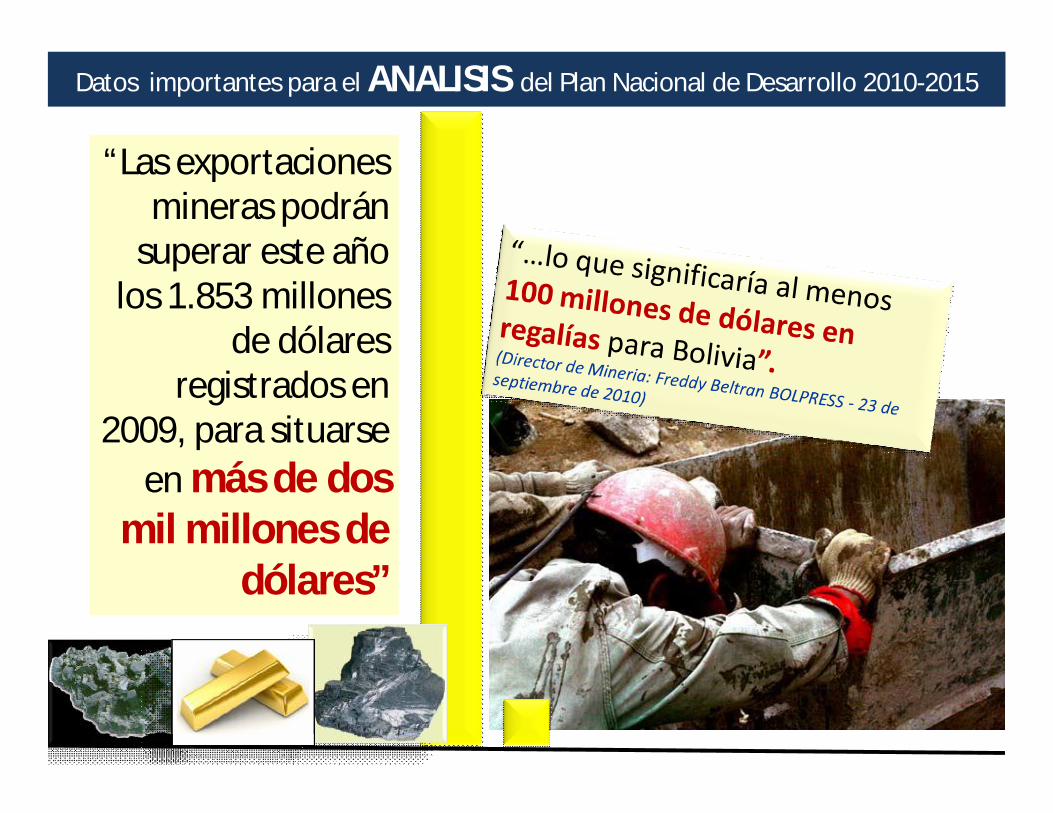
“La onza troyade oro alcanzó los 1300 dólares, lo que permite adelantar el incremento de exportaciones”.director de Minería, Freddy Beltrán
Auge MineroPrecios de los minerales pone optimistas a procesadores de minerales. Fides Potosí, el 20/09/2010
Mediante una licitación nacional e internacional arrancará en noviembre la venta de 20.000 millones de toneladas de minerales acumulados. (A. García Linera – sept. 2010)
Del 2011-2013 se comenzará a vender materia prima de minerales extraída con la nueva maquinaria en grandes cantidades, de 80 a 120.000 y 300.000 toneladas año. (A. García Linera – sept. 2010)
La plata fue el mayor aportante a los ingresos de los departamentos productores de minerales. Subió su precio a 20,91 dólares la onza troy

“La minería está pasando por su mejor
momento, debido a los altos precios de los
minerales en el mercado
internacional, especialmente del
estaño, oro y otros”.
Una cifra cercana a los US$ 50 millones invertirá minera Hochschild Miningen su plan de exploración de 2011, el cual prevé el desarrollo de nuevos proyectos.
Datos importantes para el ANALISIS del Plan Nacional de Desarrollo 2010-2015
Empresas estatales y privadas de España, Estados Unidos, Brasil, Francia, Rusia, China, Japón, Corea del Sur, Finlandia y Canadá han expresado al Gobierno de Evo Morales su interés en desarrollar proyectos mineros en Bolivia (La Prensa 21 de sept. 2010)
Datos importantes para el ANALISIS del Plan Nacional de Desarrollo 2010-2015
“Las exportaciones mineras podrán
superar este año los 1.853 millones
de dólares registrados en
2009, para situarse en más de dos
mil millones de dólares”
Datos importantes para el ANALISIS del Plan Nacional de Desarrollo 2010-2015
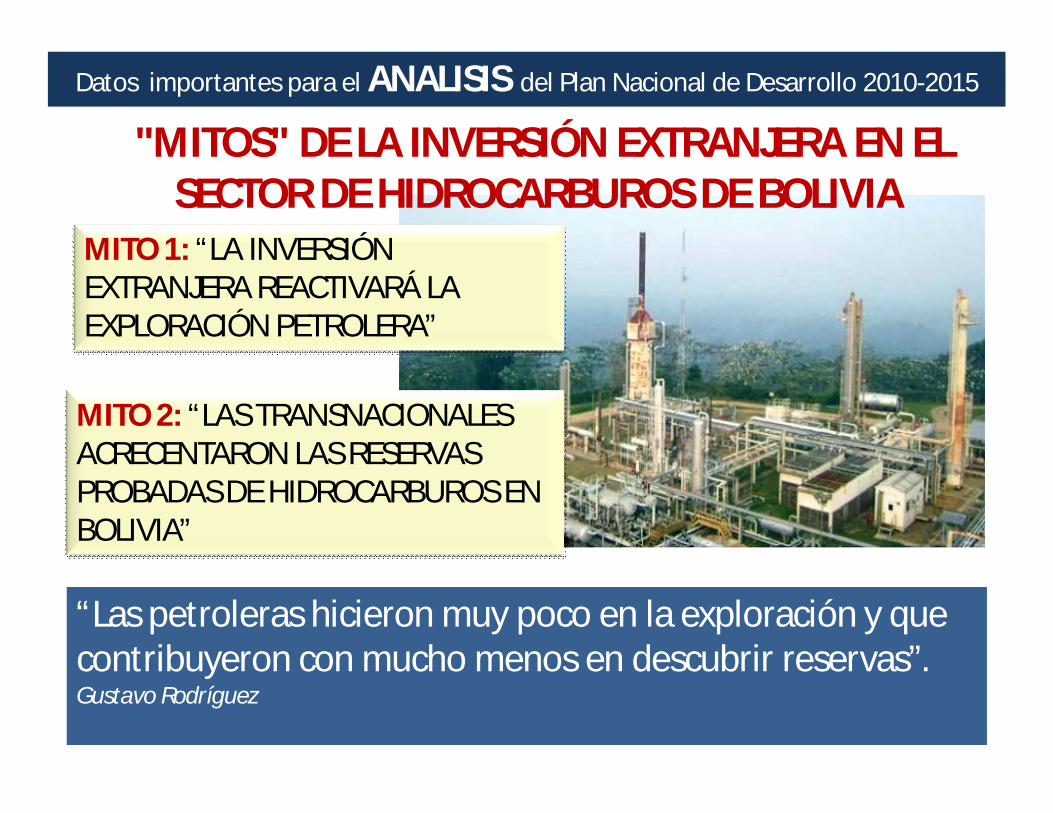
"MITOS" DE LA INVERSIÓN EXTRANJERA EN EL SECTOR DE HIDROCARBUROS DE BOLIVIA
MITO 1: “LA INVERSIÓN EXTRANJERA REACTIVARÁ LA EXPLORACIÓN PETROLERA”
MITO 2: “LAS TRANSNACIONALES ACRECENTARON LAS RESERVAS PROBADAS DE HIDROCARBUROS EN BOLIVIA”
“Las petroleras hicieron muy poco en la exploración y que contribuyeron con mucho menos en descubrir reservas”.Gustavo Rodríguez
Top Related