


Idiomas
Páginas
Jurídico

1
Economic effects of NAFTA on the Northeast Mexico economy
Ayala, Edgardoa and Chapa, Joanab
aInstituto Tecnológico y de Estudios Superiores de Monterrey
Campus Monterrey.
Av. Eugenio Garza Sada 2501 Sur, Col. Tecnológico.
CP. 64849. Monterrey, Nuevo León, México
E-mail: [email protected]
bUniversidad Autónoma de Nuevo León
Facultad de Economía
Avenida Lázaro Cárdenas 4600 Ote. Fracc. Residencial Las Torres.
C.P. 64930. Monterrey, Nuevo León, México.
E-mail: [email protected]
Abstract
The North American Free Trade block (NAFTA) went into operation twenty years ago. A long
list of studies have estimated the NAFTA effects on Mexico, among them Sobarzao (1992), U.S.
International Trade Comission (1997), Krueger (1999), Clausing (2001), Caliendo y Parro (2009)
and others, but none has addressed the regional effects of NAFTA. In this paper it is estimated
the impact of NAFTA on the economy of the Northeast Mexico, i.e. Nuevo León, Coahuila and
Tamaulipas combining the use of time series econometrics techniques jointly with an applied
general equilibrium model for the region. Using a multivariate GARCH model and switching
regimens models it was found that NAFTA have increased the synchronization of the business
cycle of the region to United States and Canada, increasing the region’s exports to those countries
by 132% and the Direct Foreign Investment (FDI) the region receives from abroad by 290%. In
order to assess the impact of such injections to the Northeast economy, a general equilibrium
model for the region (MEGAN-03) was built, allowing to model the interrelationships of two
types of households (rural and urban), 23 sectors, 18 types of labor, the capital, the local and the
2
federal government, and the external sector that is disaggregated as the four largest state
commercial partners from the United States (Texas, California, Michigan, Illinois and Indiana),
the largest Canada provinces (Ontario, Quebec, Alberta and British Columbia) and the rest of the
world. The MEGAN-03 is a static model that assumes perfect competition and fix prices, and it
is calibrated using a regionalization of the Mexico Input Output table for 2003, employing the
Flegg-Webber (1997) method. In order to assess the NAFTA impact, the counter-factual situation
was generated, where region’s exports and FDI would decrease in the estimated magnitudes
derived from the time series econometric estimates; then a comparison of this situation was
carried out with the baseline year used to calibrate the general equilibrium model. It can be
concluded that the region’s raise in exports caused by NAFTA implied an increase in the region
output of 7%, in the region value added of 5.2% and in the overall employment of 4.6%, the
metallic and the machinery and equipment industries presents double digit gains occasioned by
the NAFTA export boom. On the other hand, the increment in the FDI that Northeast Mexico
received could produce an extra increase of 1.6% in output, value added and employment in the
region, being the construction sector the most beneficiated sector.

3
Introduction
Two decades after the beginning of the operation of the North American Free Trade Agreement
(NAFTA) many studies have been accumulated, which evaluate the marginal impact it has had in
the economic integration of the three partner countries. A large list of economic studies provides
wide evidence of the positive effects in terms of commerce, as well as the trade release the
NAFTA signature has produced in Mexico, e.g. Sobarzao (1992), U.S. International Trade
Comission (1997), Krueger (1999), Clausing (2001), Caliendo y Parro (2009), among many
others.
However, the vast majority of the studies that analyze the NAFTA effects and the
economic integration has been performed nationwide, which may result in an underestimation of
the treaty effects if the different regions are unevenly exposed. In fact, there are indications
suggesting the Border States have experienced a catching up process with their counterparts in
the United States. Rodríguez-Oreggia (2005) and Messmacher (2000) identified the Northern
States have become the winners in the trade release and NAFTA, respectively. While Aguayo
(2006) finds that the distance to the border is a determinant of the growth rate of per capita
income of Mexico States, the closer they are to the border with the United States, the higher the
growth rate.
The Interagency Program of Studies for North America (PIERAN) within the XXIV call,
decided to support the research project “Regional Integration in the Context of the Free Trade in
North America: the case of Northeast Mexico” signed by Cecilia Chapa Cantú (UANL), María de
Lourdes Treviño Villarreal (UANL), Edgardo Arturo Ayala Gaytán (ITESM), Gaspare Genna
(UT), Marcos Fabricio Pérez Estrella (Wilfrid Laurier University), in order to evaluate the

4
NAFTA impact particularly for the region of Northeast Mexico. This article summarizes the main
findings of this research.
The article is organized as follows: in the first section we present trade integration
systemic measures of the three countries in the region, in the second section we describe the
trading patterns among the major regions of the countries involved. In the third section we
present estimates of the structural changes in exports of northeastern Mexico to the United States
(US), the foreign direct investment (FDI) received in the Northeast US, the synchronization of
the economic activity between the Northeast, Canada, and the US, and the productivity of the
region compared to the rest of the country. Finally, we describe a general equilibrium model for
Northeast Mexico that allows assessing the implications of the structural change that promoted
the NAFTA in the Northeast in terms of gains from production, value added and employment for
the region and its main sectors.
Integration in NAFTA
The creation of free trade areas aims to increase the trade integration among its partner countries.
To verify the impact of NAFTA on integration we should begin by measuring it. In this section
we use the systemic integration rate proposed by Prakas, Dietzenbacher, and Basu (2007) to
verify the evolution of the Mexico-United States –Canada (NAFTA zone) and Mexico- United
States integration after the NAFTA and until recent years.
The proposed rate can be calculated on exports, imports and the total trade, and takes into
account not only the weight of the transactions of the partner countries in the region, but also the
trade with the rest of the world in proportion to the aggregated demand and supply. The original

5
rate is interpreted as a rate of relative integration, since it does not include the increase in the size
of trade, but only the relative significance, this is the reason why we also proposed an absolute
measure that simulates the amount of work that is created through this relative integration. A
detailed description of both rates is found in Ayala, Chapa, Genna, Pérez and Treviño (2014).
Figures 1 and 2 shows the evolution of the relative and absolute rates based on imports,
first for the whole NAFTA zone and then for binational US-Mexico region. As it can be seen, the
relative and absolute integration of the whole zone grew rapidly between 1994 and 2000, but
since 2001 the relative integration was reversed, the absolute also falls but it is stabilized at about
3 times the baseline value in 1980. The most plausible candidate to explain the structural change
in the integration is China's entry to the World Trade Organization (WTO), or more precisely, the
most favored treatment as a nation that the US gave to China, a year before it entered to this
organization. China’s entry replaced the privileged position of Canada in the US market and
replaced exports of the textile and metal mechanics industry, among others, from Mexico to the
United States (Ayala y Villarreal 2009).
However, the majority of the integration rates fall lies in trade relations with Canada.
Evidence in Figure 2 suggests that while the integration between Mexico and the United States
drop began on 2000, it increased again from 2008 and on last year of the series, the integration
reaches its highest point. In fact, relative and absolute integration are more than 2.5 times and 7
times larger than in the 80’s, and 80% and 208% higher than those that existed when NAFTA
began, respectively.
[Insert Figures 1 and 2 here]

6
Trade Relationship between NAFTA Regions
Definitely, NAFTA provided an institutional framework for further integration between the three
partners; however, apparently, the effect, far from being uniform across the regions, it is a
process concentrated in a few states or provinces, and the trade structure has not changed
significantly in the last 20 years, although the size or level itself has clearly changed.
For the relationships between Canada and Mexico, Canada imports to our country have
grown faster than the average, so Mexico's share increased from 1.3% to 5.4% between 1990 and
2010, reaching 21 billion dollars (US). Canada's exports to Mexico were lower than 5 billion
dollars in 2010, although its share in total increased 2.5 times, from 0.4% to 1.3%. It is clear that
the integration has relatively benefited Mexico, which is consistent with the hypothesis that
NAFTA would have a greater effect on the smaller economy.
By region it is clear that Canada-Mexico relationship is mainly performed through
Ontario, and this fact has not changed before and after the NAFTA. Figures 3 and 4 show the
imports and exports of Canada with Mexico, they highlight that about 80% of Canada's imports
from Mexico are performed by Ontario, while this province contributes almost 50% of exports to
Mexico. Moreover, the pattern has not significantly changed after NAFTA; a slight increase in
the weight of imports of British Columbia and the weight of exports of Alberta is barely seen.
[Insert Figures 3 and 4 here]
While the US also increased its opening to the outside, total imports from this country
grew at a slower rate, 7%. Similarly, US exports to Mexico totaled 198 billion dollars and grew at
9% per year, while exports from this country to the world also grew 7%.

7
The pattern of state US exports to Mexico was fairly stable between 1994 and 2010.
Figure 5 shows that 2/3 of the US exports come from only five states-Texas, California,
Michigan, Arizona, and Illinois; but it is definitely Texas our biggest trading partner since it
contributes nearly half of the exports. Figure 6 shows the evolution of Texas exports to the states
of Mexico, 2/3 are concentrated between Chihuahua and northeastern states of Mexico outside
this area, stands the State of Mexico and the Federal District, i.e., the flows can apparently be
explained by gravitational models, which are the major factors of both the distance and the
weight of the markets.
[Insert Figures 5 and 6 here]
Structural Change in Northeast Mexico Economy
While regional trade patterns were not significantly affected by NAFTA, the volume of exports
and imports has, indeed, changed dramatically. Additionally, it is likely that NAFTA has
encouraged greater flows of foreign direct investment (FDI). The purpose of this section is to
determine whether there is a structural change in the nineties that can be attributed to NAFTA
exports, FDI, the total factor productivity (TFP) and economic cycle synchronization for the
economy of the Northeast.
Hence, to determine whether there was a structural change in each of these variables, we
use the model of Hamilton's changing regimes (1989) with two states (two-state regime-
switching model). This methodology models the variable of interest as a combination of two
different stochastic processes (regimens). The approach allows the identification of the regimes
where the variable is in a regime with high or low levels regime. Furthermore, with this model

8
we may calculate the conditional probability that the variable of interest is in a certain regime.
Thus, we can identify which periods the variable was more likely to be in the high regime than in
a low level regime.
To measure the synchronization of the economy cycles between northeastern Mexico,
Canada, and the US we take the dynamic correlation of the levels of economic activity between
them1. The total factor productivity (TFP) is equal to the ratio of the product between an
aggregate of production factors accumulation (labor and physical capital) and it was measured
assuming a share of non-labor income of 1/3. Exports and FDI were measured in nominal terms.
Figures 7 and 8 show the dynamic correlations of the economic activity in the Northeast,
Canada, and the United States, as well as the conditional probability that the correlation is found
in the high correlation regime. The changing regime model detects a structural change since the
conditional probability from being in the regime of high correlation jumps into one in 1991 in
Canada and in 1994 in the United States. The average correlation of the activity between the
Northeast, Canada and the US was 0.3 and 0.27, respectively in a low correlation regime and
increased to 0.5 and 0.52 in the regime of high correlation.
[Insert Figures 7 and 8 here]
Figures 9-11 show the evolution of Northeast Mexico’s exports to the US, FDI received
by the Northeast and the absolute and relative TFP to other states of Mexico, as well as their
corresponding conditional probabilities of being in the high level regime.
1 For this purpose, a GARCH multivariate model was used between each pair of reference geographical zones, The
economic activity was measured using the Gross Domestic Product (GDP) of the countries and from the three states
of the Northeast using the series from Ayala and Chapa (2011), for more information, see Ayala, Chapa, Genna,
Pérez and Treviño (2014).

9
[Insert Figures 9, 10, and 11 here]
It is important to note that the insufficient information limits the analyzed series up to
2003, practically the first ten years of NAFTA operation2. Despite the coverage, again, the model
detects the structural change in the three variables referred between the years 1996-1998, i.e., just
after the economic crisis faced by Mexico in 1995 and from which Mexico came out until 1996.
Exports of northeastern Mexico to the US shifted from 12.1 billion dollars in the period of low
level to 28 billion in the high level, i.e., an increase of 132%, while US DIA received from the
northeast Mexico shifted from 596 million to 2.3 billion a year, which means an increase of
290% between the two regimes.
Finally, it is possible to isolate a structural change in TFP both of Northeastern Mexico
and the rest of the states around 1996. However, the effect was greater in the Northeast so that the
relative TFP of the Northeast (TFP Northeast / TPF rest of the states) grew at a rate almost 2
percentage points additional to the rate it showed before the structural change. This means that
between 1996 and 2003, Northeast TFP increased 20% more than the rest of the country.
While we cannot methodologically be completely sure that the structural changes that
occurred in the synchrony of economic activity, exports, FDI and TFP of the Northeast in the
90’s, is a result of the NAFTA, this is the best candidate to explain the changes in the regime.
This is the reason why we took the changes between both regimes for each variable and we
2 For Northeast exports, we use the series from the Ministry of Economy up to 2003, recently, the INEGI began
publishing state exports series, but only beginning from 2007. The FDI also comes from the same source and to
calculate the PTF a physical capital series are required, which were taken from German-Soto (2008) and finish in
2003.

10
incorporated them in a regional general equilibrium model to evaluate the implications of the
changes of this magnitude in the main economic variables in Northeast Mexico.
NAFTA Impact in the Northeast Mexico Economy
From the above sections we conclude that there was a real structural change nationwide, as a
result of the NAFTA, and that the effects are quite pronounced in the Northeast Mexico
economy. There is still need to evaluate which could have been the implications of this change in
the essential variables of the Northeast region economy, such as employment, income, and
aggregated and sector production. To this end we built a general equilibrium model for the
Northeast economy.
The model considers two types of families (rural and urban strata); 23 productive sectors;
2 productive factors, labor and capital, where work is divided into 18 types of occupation, two
levels of government (regional and federal), and 12 regions (Northeast, rest of the country, five
states of the American Union, four Canadian provinces and the rest of the world). The model
assumes perfect competition in the finished goods and services markets, as well as of
intermediate and primary production factors, and assumes that all prices are fixed, i.e., there is
spare capacity in the region. The detailed description, from agents and the mathematical
specification of the model are in Ayala, Chapa Genna, Pérez, and Treviño (2014).
The model was calibrated to replicate the Northeast economy conditions on 2003. This
year was selected because at the time it was performed we only had the input-output of this year
and the exports series were only up to that period. So, this shall be understood as the effects to
ten years of operation of the NAFTA.
11
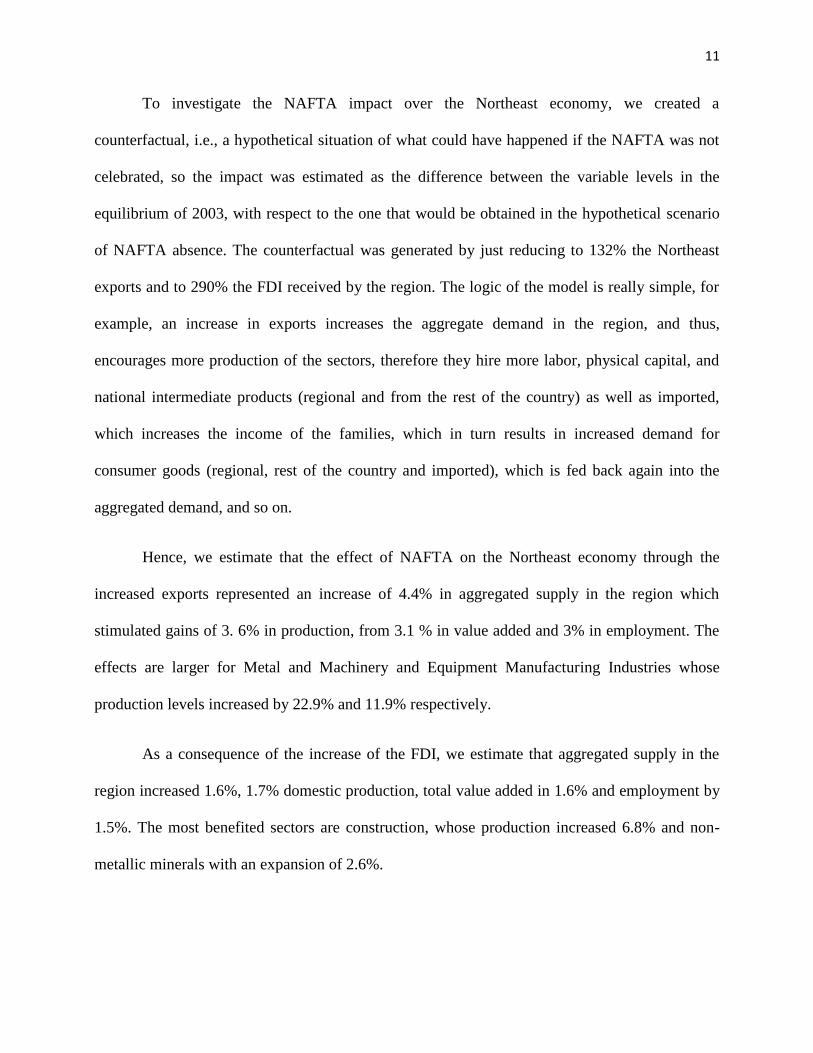
To investigate the NAFTA impact over the Northeast economy, we created a
counterfactual, i.e., a hypothetical situation of what could have happened if the NAFTA was not
celebrated, so the impact was estimated as the difference between the variable levels in the
equilibrium of 2003, with respect to the one that would be obtained in the hypothetical scenario
of NAFTA absence. The counterfactual was generated by just reducing to 132% the Northeast
exports and to 290% the FDI received by the region. The logic of the model is really simple, for
example, an increase in exports increases the aggregate demand in the region, and thus,
encourages more production of the sectors, therefore they hire more labor, physical capital, and
national intermediate products (regional and from the rest of the country) as well as imported,
which increases the income of the families, which in turn results in increased demand for
consumer goods (regional, rest of the country and imported), which is fed back again into the
aggregated demand, and so on.
Hence, we estimate that the effect of NAFTA on the Northeast economy through the
increased exports represented an increase of 4.4% in aggregated supply in the region which
stimulated gains of 3. 6% in production, from 3.1 % in value added and 3% in employment. The
effects are larger for Metal and Machinery and Equipment Manufacturing Industries whose
production levels increased by 22.9% and 11.9% respectively.
As a consequence of the increase of the FDI, we estimate that aggregated supply in the
region increased 1.6%, 1.7% domestic production, total value added in 1.6% and employment by
1.5%. The most benefited sectors are construction, whose production increased 6.8% and non-
metallic minerals with an expansion of 2.6%.

12
Final Comments
From the analysis of the evidence we may conclude that the NAFTA effectively promoted a
structural change in the trade integration between the countries measured by commercial
transactions within and outside the zone. However, regional trade patterns, i.e., the importance of
the different regions of the three countries in imports and exports do not appear to have been
subject to significant changes, suggesting that the major states or benefitted regions from the
treaty were the same players who traditionally operate in these markets.
These benefits, far from being uniform among the regions, NAFTA appears to have
benefited particularly the Northeast Mexico region. According to our estimates, the effect of
NAFTA could have represented an increase of 3 digits in exports and the FDI received by the
region, and increased the growth of total factor productivity in a greater proportion in the
Northeast than in the rest of the states.
However, the measured gains in terms of the expansion of the value added in the region
are rather modest, 6%. While seemingly small, these gains from NAFTA are greater than those
proposed for the country by the first general equilibrium models applied. However, they reflect
the limited margin of the value added from the exports in the region, implying that NAFTA has
been successful in promoting trade integration, exports, and FDI flow; but this does not
necessarily implies a high increase in the standard of living of the inhabitants of the country or
even for the most favored areas in the Northeast, neither the solution to problems of ancient
social backwardness in the Mexican society.
13
References
Aguayo, Ernesto. “Income Divergence between Mexican States in the 1990s: The Role of Skill
Premium.” Growth and Change 37.2 (2006): 255-277.
Ayala, Edgardo y otros. Efectos Regionales del Libre Comercio: El Caso del Noreste de México.
México: Pearson, 2014.
Ayala, Edgardo; Chapa, Joana y Murguía, Juan.”Reconsiderando la Convergencia Regional en
México.” Estudios Económicos, 26.2 (2011): 217-247.
Ayala, Edgardo y Villarreal, Mario. “The Dragon Menace: Is China Displacing Mexico’s trade
with the United States?” Análisis Económico, 24.55(2009): 327-346.
Caliendo, Lorenzo and Fernando Parro. “Estimates of the Trade and Welfare Effects of NAFTA”.
Working Paper. University of Chicago, 2009
Clausing, Kimberly. “Trade Creation and Trade Diversion in the Canada-United States Trade
Aggreement.” Canadian Journal of Economics 34.3(2001): 676-696.
German-Soto, Vicente.”El stock de capital industrial medido a través de la relación inversión-
empleo: estimaciones para los estados mexicanos.” Ensayos XVII.1 (2008): 53-80.
Hamilton, James. "A New Approach to the Economic Analysis of Nonstationary Time Series and
the Business Cycle." Econometrica 57(1989): 357-384.
Krueger, Anne. “Trade Creation and Trade Diversion under NAFTA”. Working Paper. National
Bureau of Economic Research, 1999.
Messmacher, Miguel. “Desigualdad regional en México: el efecto del TLCAN y otras reformas
estructurales”. Documento de Trabajo. Banco de México, 2000.
Prakas, Dipti, Erik Dietzenbacher and Dipika Basu. “Economic Integration: Systemic Measures
in an Input Output Framework.” Economic System Research 19.4 (2007): 397-408.

14
Rodríguez-Oreggia, Eduardo. “Regional Disparities and Determinants of Growth in Mexico.”
The Annals of Regional Science 39.2(2005): 207-220.

15
Figure 1. Relative and Absolute Trade Integration Rates based on
NAFTA Imports
Figure 2. Relative and Absolute Trade Integration Rates based on
Imports between Mexico- US
Figure 3. Imports from Mexico
from Canada Provinces

16
Figure 4. Exports from Canada Provinces to Mexico
Figure 5. Composition of the exports from US to Mexico
Figure 6. Exports from Texas to Mexico States
(Millions of Dollars)

17
Figures 7. Dynamic Correlation of the Economic Activity in the Northeast with
Canada, and Conditional Probability of Being in the High Correlation Regime
Figure 8. Dynamic Correlation of the Economic Activity of the Northeast with US
and Conditional Probability of Being in the High Correlation Regime

18
Figure 9. Exports from the Northeast to US
and Conditional Probability of Being in the High Exports Regime
Figure 10. Foreign Direct Investment the Northeast Receives from the US
and Conditional Probability of Being in the High Investment Regime
Figure 11. Relative and Absolute Total Factor Productivity in the Northeast