


Idiomas
Páginas
Jurídico

CUSTOMER SATISFACTION IN THE BANKING INDUSTRY: A COMPARATIVE STUDY OF GHANA
AND SPAIN
Aborampah AMOAH-MENSAH
ISBN: 978-84-694-4063-6 Dipòsit legal: GI-668-2011 http://hdl.handle.net/10803/22657
ADVERTIMENT. La consulta d’aquesta tesi queda condicionada a l’acceptació de les següents condicions d'ús: La difusió d’aquesta tesi per mitjà del servei TDX ha estat autoritzada pels titulars dels drets de propietat intel·lectual únicament per a usos privats emmarcats en activitats d’investigació i docència. No s’autoritza la seva reproducció amb finalitats de lucre ni la seva difusió i posada a disposició des d’un lloc aliè al servei TDX. No s’autoritza la presentació del seu contingut en una finestra o marc aliè a TDX (framing). Aquesta reserva de drets afecta tant al resum de presentació de la tesi com als seus continguts. En la utilització o cita de parts de la tesi és obligat indicar el nom de la persona autora. ADVERTENCIA. La consulta de esta tesis queda condicionada a la aceptación de las siguientes condiciones de uso: La difusión de esta tesis por medio del servicio TDR ha sido autorizada por los titulares de los derechos de propiedad intelectual únicamente para usos privados enmarcados en actividades de investigación y docencia. No se autoriza su reproducción con finalidades de lucro ni su difusión y puesta a disposición desde un sitio ajeno al servicio TDR. No se autoriza la presentación de su contenido en una ventana o marco ajeno a TDR (framing). Esta reserva de derechos afecta tanto al resumen de presentación de la tesis como a sus contenidos. En la utilización o cita de partes de la tesis es obligado indicar el nombre de la persona autora. WARNING. On having consulted this thesis you’re accepting the following use conditions: Spreading this thesis by the TDX service has been authorized by the titular of the intellectual property rights only for private uses placed in investigation and teaching activities. Reproduction with lucrative aims is not authorized neither its spreading and availability from a site foreign to the TDX service. Introducing its content in a window or frame foreign to the TDX service is not authorized (framing). This rights affect to the presentation summary of the thesis as well as to its contents. In the using or citation of parts of the thesis it’s obliged to indicate the name of the author.
PHD THESIS
CUSTOMER SATISFACTION IN THE BANKING INDUSTRY: A
COMPARATIVE STUDY OF GHANA AND SPAIN
ABORAMPAH AMOAH-MENSAH
2010
PHD THESIS
CUSTOMER SATISFACTION IN THE BANKING INDUSTRY: A
COMPARATIVE STUDY OF GHANA AND SPAIN
ABORAMPAH AMOAH-MENSAH
2010
DOCTORATE PROGRAMME IN TOURISM, LAW AND BUSINESS
SUPERVISED BY:
DR. MARTI CASADESÚS FA
DR. CARME SAURINA CANALS
THESIS SUBMITTED TO THE UNIVERSITAT DE GIRONA
FOR THE AWARD OF THE DOCTORATE DEGREE
DR. MARTI CASADESÚS FA OF THE DEPARTMENT OF ORGANIS ATION,
BUSINESS MANAGEMENT AND PRODUCT DESIGN AND DR. CARM E
SAURINA CANALS OF THE DEPARTMENT OF ECONOMICS, UNIV ERSITY
OF GIRONA
CERTIFY THAT:
THIS WORK ENTITLED “CUSTOMER SATISFACTION IN THE BA NKING
INDUSTRY: A COMPARATIVE STUDY OF GHANA AND SPAIN”
SUBMITTED BY ABORAMPAH AMOAH-MENSAH FOR THE AWARD O F
THE DOCTORATE DEGREE WAS DONE UNDER OUR SUPERVISION
SIGNATURE:
DR. MARTI CASADESÚS FA DR. CARME SAUR INA CANALS
GIRONA, DECEMBER, 2010
i
ABSTRACT
Customer satisfaction has been one of the main concerns of banks of
late. This has been necessitated by the stiff competition in the banking industry.
Banks are striving hard to offer quality services and products in a bid to
maintain existing customers and woo new ones as well. Customers on the other
hand, want the best value for their money so they are always combing around
to get the best services.
The main objective of the research is to compare the perceptions of
customers regarding the quality of banks’ services in Ghana and Spain. A
sample size of 1400 people from twenty-four communities in both countries was
used. One set of questionnaire was administered in both countries based on the
five dimensions of SERVPERF. The principal component analysis was used to
reduce the initial 21 items of SERVPERF.
The main findings of the study included the following: (i) the factor
analysis produced 4 dimensions namely reliability, convenience, tangibles and
empathy (ii) whilst reliability, convenience and empathy were the determinants
of overall customer satisfaction in Ghana, only reliability explained overall
satisfaction in Spain. (iii) reliability, convenience and empathy emerged as the
dimensions that the districts, educational and occupational groups had differing
views. (iv) on the whole, customers in both countries were highly dissatisfied
about the services and products of the banks.
Recommendations made also included the following; (i) banks should
make conscious efforts to be reliable in Ghana and Spain so that customers’
confidence and trust will increase. (ii) More banks’ branches should be opened
and products like internet banking and Automated Teller Machines must be

ii
introduced throughout Ghana (iii) customers’ interest must be a priority for
banks in Ghana and Spain.

iii
ACKNOWLEDGEMENT
It was God who saw me through this programme. The road was
zigzagged and rough but the Almighty God did not let me waver. I thank my
supervisors; Prof. Marti Casadesus Fa and Prof. Carme Saurina Canals for the
yeoman’s job. Their criticisms and suggestions made this work a reality. I am
also indebted to Prof. Ricard Torres for the invaluable assistance. I am grateful
to Mariona Casademont and Victor Chaparro Rodriguez of the Girona
International Graduate School. Samuel Kusi-Gyamfuah and his wife, Barcelona,
Mr. Joseph Incoom, Ms. Joyce Appiah-Kubi, Barcelona, Isaura de Rueda
Cicuendez of MIFAS, Girona and Mr and Mrs. Okyere, London, John Benson
Twene, Alfred Marfo, Mr. Joseph Incoom and Mr. Yaw Adu-Asamoah. I also
thank Miss Edith Mongo from Cameroon, a close companion who helped me in
diverse ways.
My bosom friend Mr. Anthony Essemiah, Amsterdam needs special
commendations for the brotherly love. A friend in need is a friend indeed.
I also register my heart-felt thanks and appreciation to wife Sarah for the
prayers and support throughout this programme
iv
TABLE OF CONTENTS
Abstract……….....................................................................................................i
Acknowledgement...............................................................................................iii
Table of Contents................................................................................................iv
List of Tables......................................................................................................xii
List of Figures...................................................................................................xvii
CHAPTER ONE
INTRODUCTION
1.1 Context of the Problem..................................................................................1
1.2. Statement of the Problem.............................................................................4
1.3 Research Objectives......................................................................................6
1.4 Significance of the Study...............................................................................7
1.5 Organisation of the Study..............................................................................7
CHAPTER TWO
LITERATURE REVIEW
2.1 Introduction....................................................................................................9
2.2 Consumer Behaviour.....................................................................................9
2.3 Concepts of Customer Satisfaction..............................................................17
2.3.1 Quality.......................................................................................................17
2.3.2 Satisfaction…............................................................................................21
2.3.3 Value.........................................................................................................24
2.3.4 Relationships Among the Concepts of Customer Satisfaction..................26
2.3.4.1 Customer Satisfaction and Quality.........................................................27
v
2.3.4.2 Value, Satisfaction and Quality..............................................................28
2.4 The SERVQUAL and the SERVPERF Models............................................30
2.4.1 The SERVQUAL Model............................................................................30
2.4.2 Empirical Studies in the Banking Sector Using the
SERVQUAL Model..................................................................................35
2.4.3 The SERVPERF Model.............................................................................45
2.4.4 Empirical Studies in the Banking Industry Using SERVPERF..................47
2.5 Gaps in the Literature..................................................................................50
CHAPTER THREE
THE STRUCTURE OF THE BANKING INDUSTRY IN GHANA AND SPAIN
3.1 Introduction..................................................................................................53
3.2 The Profile Ghana........................................................................................53
3.2.1 The Ashanti Region..................................................................................53
3.3 The Profile of Spain.....................................................................................57
3.3.1 The Catalonia Region...............................................................................57
3.4 The Traditional Retail Banking.....................................................................60
3.4.1 Deposit Account........................................................................................60
3.4.2 Loans........................................................................................................61
3.5 Innovations in the Traditional Retail Banking...............................................63
3.6 The Structure of the Banking Industry in Ghana..........................................64
3.7 The Structure of the Banking Industry in Spain...........................................67
vi
CHAPTER FOUR
HYPOTHESES
4.1 Introduction..................................................................................................71
4.2 Research Objectives....................................................................................71
4.3 Relationship Between Nations and Quality of Banks’ Services...................72
4.4 Relationship Between Nations and Overall Satisfaction..............................77
4.5 Relationship Between Overall Satisfaction and
Quality of Banks’ Services..............................................79
4.6 Summary of Hypotheses to be Tested.........................................................80
CHAPTER FIVE
METHODOLOGY
5.1 Introduction..................................................................................................83
5.2 Population....................................................................................................83
5.3 Sample Size of Districts and Communities..................................................83
5.4 Research Instrument..................................................................................88
5. 5. Pre-Testing................................................................................................89
5.6 Questionnaire Administration for the Actual Field Work..............................90
4.7 The Model....................................................................................................92
5.8 Data Analysis...............................................................................................92
5.9 Weighted Data.............................................................................................93
5.10 Limitations..................................................................................................94
vii
CHAPTER SIX
ANALYSIS OF THE DATA
6.1. Introduction.................................................................................................95
6.2 Demographic Variables................................................................................95
6.2.1 Sample Size of Ghana and Spain.............................................................95
6.2.2 Districts.....................................................................................................95
6.2.3 Sex...........................................................................................................96
6.2.4 Age...........................................................................................................96
6.2.5 Communities............................................................................................97
6.2.6 Educational Background..........................................................................97
6.2.7 Occupation................................................................................................98
6.2.8 Types of Banks.........................................................................................98
6.2.9 Frequency of Patronising Banks...............................................................99
6.2.10 Means of Patronising Banks...................................................................99
6.3 Demographic Variables and Original Quality
Dimensions of SERVPERF...................................................................101
6.3.1 Districts and Quality Dimensions of SERVPERF....................................101
6.3.2 Sex and Quality Dimensions of SERVPERF..........................................105
6.3.3 Age and Quality Dimensions of SERVPERF..........................................107
6.3.4 Communities and Quality Dimensions of SERVPERF............................110
6.3.5 Education and Quality Dimensions of SERVPERF.................................113
6.3.6 Occupation and Quality Dimensions of SERVPERF..............................116
6.4 Global (Combined) Principal Component Analysis....................................120
6.5 Nations and Quality Dimensions of Banks’ Services.................................125
6.5.1Districts and Quality Dimensions of Banks’ Services...............................126
viii
6.5.2 Communities and Quality Dimensions of Banks’ Services.....................127
6.5.3 Sex and Quality Dimensions of Banks’ Services…….............................128
6.5.4 Age and Quality Dimensions of Banks’ Services....................................129
6.5.5 Education and Quality Dimensions of Banks’ Services..........................131
6.5.6 Occupation and Quality Dimensions of Banks’ Services........................132
6.6 Nations and Overall Satisfaction................................................................134
6.6.1 Districts and Overall Satisfaction............................................................134
6.6.2. Communities and Overall Satisfaction...................................................136
6.6.3 Sex and Overall Satisfaction...................................................................136
6.6.4 Age and Overall Satisfaction...................................................................137
6.6.5 Education and Overall Satisfaction.........................................................138
6.6.6 Occupation and Overall Satisfaction.......................................................140
6.7 Global Overall Satisfaction and Quality
Dimensions of Banks’ Services.............................................................141
6.7.1 Principal Component Analysis of Spain..................................................142
6.7.2 Spain Overall Satisfaction and Quality
Dimensions of Banks’ Services.............................................................146
6.7.3 Principal Component Analysis of Ghana................................................147
6.7.4 Ghana Overall Satisfaction and Quality
Dimensions of Banks’ Services.............................................................151
6.7.5 Factor Loadings of Ghana, Spain and Global (Combined......................152
CHAPTER SEVEN
ANALYSIS OF THE HYPOTHESES
7.1 Introduction................................................................................................154
ix
7.2 Hypothesis Ha. There are no differences between
the perceptions of Ghana and Spain Regarding
the Quality Dimensions of Banks’ Services...........................................154
7.3 Hypothesis Hb: There is No Difference Between the Overall
Satisfaction of Ghana and Spain...........................................................156
7.4 Hypothesis Hc: There is No Relationship Between
Overall Satisfaction and the Quality
Dimensions of Banks’ Services in Ghana and Spain............................158
7.5 Summary of Tested Hypotheses...............................................................159
CHAPTER EIGHT
DISCUSSIONS OF FINDINGS AND CONCLUSIONS
8.1 Discussions of Findings.............................................................................162
8.1.1 Medium of Patronising Banks.................................................................162
8. 1.2 Quality Dimensions of Banks’ Services.................................................163
8.1.3 Hypothesis Ha: There are No Difference Between the
Perceptions of Ghana and Spain Regarding the
Quality Dimensions of Banks’ Services……….....................................164
8.1.4 Hypothesis Hb: There is No Difference Between the Overall
Satisfaction of Ghana and Spain……....................................................168
8.1.5 Hypothesis Hc There is No Relationship of Between the Overall
Satisfaction and the Quality Dimensions of Banks’
Services in Ghana and Spain…….........................................................170
8. 2 Conclusions..............................................................................................172
x
BIBLIOGRAPHY
Bibliography.....................................................................................................177
Appendix A. Definition of Communities...........................................................199
Appendix B. Questionnaire..............................................................................200
Appendix C. Number of Buildings/Houses in Zones.......................................203
Appendix D Determination of Sample Size of Buildings/Houses.....................204
Appendix E Sample Size of Questionnaire Administered and Received.........214
Appendix F Districts and Tangibles of SERVPERF Bonferroni.......................215
Appendix G Districts and Reliability of SERVPERF Bonferroni.......................216
Appendix H Districts and the Responsiveness of SERVPERF Bonferroni......217
Appendix I Districts and the Assurance of SERVPERF Bonferroni.................219
Appendix J Districts and the Empathy of SERVPERF Bonferroni...................220
Appendix K Age Group and Tangibles of SERVPERF Bonferroni...................222
Appendix L Age Group and Reliability of SERVPERF Bonferroni...................223
Appendix M Age Group and Responsiveness of SERVPERF Bonferroni.......223
Appendix N Age and the Assurance of SERVPERF Bonferroni......................224
Appendix O Age and Empathy of SERVPERF Bonferroni...............................225
Appendix P Education and Tangibles of SERVPERF Bonferroni....................226
Appendix Q Education and Reliability of SERVPERF Bonferroni....................227
Appendix R Education and the Responsiveness of SERVPERF Bonferroni...228
Appendix S Education and the Assurance of SERVPERF Bonferroni.............229
Appendix T Education and Empathy of SERVPERF Bonferroni......................231
Appendix U Occupation and the Tangible of SERVPERF Bonferroni.............232
Appendix V Occupation and the Reliability of SERVPERF Bonferroni............234
Appendix W Occupation and the Responsiveness of

xi
SERVPERF Bonferroni.........................................................................236
Appendix X Occupation and the Assurance of SERVPERF Bonferroni..........238
Appendix Y Occupation and the Empathy of SERVPERF Bonferroni.............240
xii
LIST OF TABLES
Table 2.1 Empirical Studies in the Banking Industry Using SERVQUAL...........35
Table 2.2 Empirical Studies in the Banking Industry Using SERVPERF...........47
Table.3.1 Banks Population Ratio in Spain........................................................69
Table 4.1 Summary of Hypotheses....................................................................80
Table 5.1 Sample Size of Districts.....................................................................83
Table 5.2 Sample Size of Communities and their Population............................84
Table 5.3 Sample Size of Zones – Urban........................................................85
Table 5.4 Sample Size of Zones: Semi-Urban...................................................86
Table 5.5 Sample Size of Zones – Rural...........................................................86
Table 5.6 Sample Size of Buildings/Houses in Zones.......................................87
Table 5.7 Population, Pre-Test Sample Size of Buildings/Houses and
Questionnaire………...............................................................................90
Table 5.8 Sample Size of Questionnaire...........................................................91
Table 5.9 Weighted Data...................................................................................93
Table 6.1 Sample Size of Ghana and Spain......................................................95
Table 6.2 Districts..............................................................................................95
Table 6.3 Sex.....................................................................................................96
Table 6.4 Age.....................................................................................................96
Table 6.5 Types of Communities.......................................................................97
Table 6.6 Educational Background....................................................................97
Table 6.7 Occupation.........................................................................................98
Table 6.8 Types of Banks..................................................................................98
Table 6.9 Frequency of Patronising Banks........................................................99
Table 6.10 Districts and Tangibles of SERVPERF..........................................101
xiii
Table 6.11 Districts and Reliability of SERVPERF..........................................102
Table 6.12 Districts and Responsiveness of SERVPERF...............................103
Table 6.13 Districts and Assurance of SERVPERF.........................................103
Table 6.14 Districts and Empathy of SERVPERF............................................104
Table 6.15 Sex and Tangibles of SERVPERF.................................................105
Table 6.16 Sex and Reliability of SERVPERF.................................................105
Table 6.17 Sex and Responsiveness of SERVPERF......................................106
Table 6.18 Sex and Assurance of SERVPERF...............................................106
Table 6.19 Sex and Empathy of SERVPERF..................................................107
Table 6.20 Age and Tangibles of SERVPERF.................................................107
Table 6.21 Age and Reliability of SERVPERF.................................................108
Table 6.22 Age and Responsiveness of SERVPERF......................................109
Table 6.23 Age and Assurance of SERVPERF...............................................109
Table 6.24 Age and Empathy of SERVPERF..................................................110
Table 6.25 Communities and Tangibles of SERVPERF..................................111
Table 6.26 Communities and Reliability of SERVPERF..................................111
Table 6.27 Communities and Responsiveness of SERFPERF.......................111
Table 6.28 Communities and Assurance of SERVPERF.................................112
Table 6.29 Communities and Empathy of SERVPERF...................................112
Table 6.30 Educational Background and Tangibles of SERVPERF................113
Table 6.31 Educational Background and Reliability of SERVPERF................114
Table 6.32 Educational Background and Responsiveness of SERVPERF.....114
Table 6.33 Educational Background and Assurance of SERVPERF...............115
Table 6.34 Educational Background and Empathy of SERVPERF.................116
Table 6.35 Occupation and Tangibles of SERVPERF.....................................117
xiv
Table 6.36 Occupation and Reliability of SERVPERF.....................................117
Table 6.37 Occupation and Responsiveness of SERVPERF..........................118
Table 6.38 Occupation and Assurance of SERVPERF...................................119
Table 6.39 Occupation and Empathy of SERVPERF......................................119
Table 6.40 Global (Combined) KMO and Bartlett's Test..................................121
Table 6.41 Global (Combined) Communalities..............................................121
Table 6.42 Global (Combined) Total Variance Explained................................122
Table 6.43 Global (Combined) Rotated Component Matrix.............................124
Table 6.44 Global (Combined) Independent Samples Test.............................125
Table 6.45 Global (Combined) Group Statistics..............................................125
Table 6.46 District ANOVA Table....................................................................126
Table 6.47 District Mean..................................................................................127
Table 6.48 District Measures of Association....................................................127
Table 6.49 Communities ANOVA Table..........................................................127
Table 6.50 Sex ANOVA Table.........................................................................128
Table 6.51 Sex Mean.......................................................................................129
Table 6.52 Sex Measures of Association.........................................................129
Table 6.53 Age ANOVA Table.........................................................................129
Table 6.54 Age Mean.......................................................................................130
Table 6.55 Age Measures of Association........................................................130
Table 6.56 Education ANOVA Table...............................................................131
Table 6.57 Education Mean.............................................................................131
Table 6.58 Education Measures of Association...............................................132
Table 6.59 Occupation ANOVA Table.............................................................132
Table 6.60 Occupation Mean...........................................................................133
xv
Table 6.61 Occupation Measures of Association.............................................133
Table 6.62 Global (Combined) Overall Satisfaction
Independent Samples Test....................................................................134
Table 6.63 Global (Combined) Overall Satisfaction Group Statistics..............134
Table 6.64 District Overall Satisfaction ANOVA..............................................135
Table 6.65 District Post Hoc Tests Overall Satisfaction Bonferroni.................135
Table 6.66 District Descriptive Overall Satisfaction.........................................135
Table 6.67 Communities Overall Satisfaction ANOVA....................................136
Table 6.68 Communities Descriptive Overall Satisfaction...............................136
Table 6.69 Sex Overall Satisfaction Independent Samples Test.....................137
Table 6.70 Sex Statistics.................................................................................137
Table 6.71 Age Overall Satisfaction ANOVA...................................................138
Table 6.72 Age Descriptive Overall Satisfaction..............................................138
Table 6.73 Education Overall Satisfaction ANOVA.........................................138
Table 6.74 Education Overall Satisfaction Bonferroni.....................................139
Table 6.75 Education Descriptive Overall Satisfaction....................................139
Table 6.76 Occupation Overall Satisfaction ANOVA.......................................140
Table 6.77 Occupation Overall Satisfaction Bonferroni...................................140
Table 6.78 Occupation Descriptive Overall Satisfaction..................................141
Table 6.79 Global Model Summary.................................................................142
Table 6.80 Global Overall Satisfaction and the Four Components ANOVA....142
Table 6.81 Global Overall Satisfaction and the Four
Components Coefficients......................................................................142
Table 6.82 Spain KMO and Bartlett's Test.......................................................143
Table 6.83 Spain Communalities.....................................................................143
xvi
Table 6.84 Spain Total Variance Explained.....................................................144
Table 6.85 Spain Rotated Component Matrix..................................................145
Table 6.86 Spain Model Summary...................................................................146
Table 6.87 Spain ANOVA................................................................................146
Table 6.88 Spain Coefficients..........................................................................147
Table 6.89 Ghana KMO and Bartlett's Test.....................................................147
Table 6.90 Ghana Communalities...................................................................148
Table 6.91 Ghana Total Variance Explained...................................................148
Table 6.92 Ghana Rotated Component Matrix................................................150
Table 6.93 Ghana Model Summary.................................................................151
Table 6.94 Ghana ANOVA...............................................................................151
Table 6.95 Ghana Coefficients........................................................................152
Table 6.96 Factor Loadings for Ghana, Spain and Global (Combined)...........152
Table 7.1 Summary of Tested Hypotheses......................................................159
xvii
LIST OF FIGURES
Figure 2.1 Consumer Purchasing Matrix...........................................................16
Figure 2.2 KANO Model.....................................................................................23
Figure 2.3 The Five SERVQUAL’S Gaps..........................................................32
Figure 3.1 Map of Ghana Showing All the Regions...........................................54
Figure 3.2 Map of Ashanti Region.....................................................................54
Figure 3.3 Map of Ashanti Region Showing All the Districts..............................56
Figure 3.4 Map of Spain Showing All the Administrative Regions.....................58
Figure 3.5 Map of Catalonia Showing All the 4 Provinces.................................59
Figure 6.1 Means of Patronising Banks in Spain.............................................100
Figure 6.2 Means of Patronising Banks in Ghana...........................................100
1
CHAPTER ONE
INTRODUCTION
1.1 Context of the Problem
Satisfaction is a crucial concern for both customers and organisations
including banks. Satisfaction is a subjective concept and therefore difficult to
determine, (European Institute of Public Administration, 2008). It depends on a
myriad of factors and varies from person to person as well as product to
product. Some of the main concepts of satisfaction in the literature include
value, quality and satisfaction. Value according to Zeithaml (1988) is the
importance attached to services based on their usage and the amount paid in
exchange. Quality on the other hand, is the meeting of the needs and
expectations of customers, (Parasuraman et al. 1991). Oliva et al (1992),
Fecikova (2004) and (ISO 2005) are of the view that satisfaction is the meeting
of the needs or wants of customers. From the foregoing, it can be seen that all
these concepts are the same and are used interchangeably.
Titko and Lace (2010) accentuate that the competitive power and survival
of a bank lies in the degree of its customer satisfaction. Banks therefore pay
particular attention to customer satisfaction, (Kattack and Rehman 2010).
According to Stafford (1996), due to the fact that banks sell undifferentiated
products, the only effective tool they can use to survive in the market is the
quality of service. Bowen and Hedges (1993) claim that banks that offer very
high quality services have a competitive advantage because the benefits of
improved quality of service are large market shares, increased in profits and
increased in customer retention. In addition, Zeithmal et al (1996) submit that
the reputation of the banks is enhanced, new customers are captured and there
2
is an increase in financial performance. Yeung et al (2002) on the other hand
intimate that customers bring new customers to the bank through word- of-
mouth and thereby reducing the cost of marketing. Sureshchandar et al (2003)
think otherwise. They posit that the quality of service and satisfaction are the
most important indicators of cementing the relationship between the
organisation and its customers. Satisfaction does not only emanate from the
services provided but also from other important factors.
Owusu-Frimpong (1999) contends that the attitude of the service
organisation can help customers evaluate the quality of services being offered
to them. A receptive attitude is a key ingredient for giving customers a positive
image about the bank and the services provided. The physical environment
regarding the infrastructure, the design and the general atmosphere are equally
taken into account by customers when assessing the quality of services of
banks. Similarly, the duration of service delivery gives both positive and
negative impressions to customers. A short waiting time for instance, may give
a good impression about the bank that its services are of high quality.
Customers on the hand want the best value for their money. Therefore,
they spare no efforts in searching for high quality services, (Strategic Direction,
2007). Customers’ perceptions are determined by myriad of factors. Kotler et al
(1999) posit that individual’s consumption behaviour is influenced by personal
characteristics like age and life-cycle, occupation, economic situation, lifestyle
and personality and self-concept. Zeithaml and Bitner, cited in Kangis and
Voukelatos (1997:280) on the other hand advance that factors like service
encounters, the evidence of service, image and price constitute customers’
perceptions of service quality, satisfaction and value. Similarly, Abdullah and
3
Rozario (2009) posit that the level of customer satisfaction may be influenced
by various internal and external factors.
Customers generally evaluate service quality before and after their use.
According to Zeithaml et al (1993) consumers evaluate services and products
through three processes. These are pre-purchase or search qualities,
experience qualities and credence qualities. Search qualities are features that
consumers look out for before buying and are those that they can see, feel or
touch. On the other hand, experience qualities are post-purchase features that
customers assess whilst credence features are those that are not easy for
consumers to assess during the post-purchase period. Banks services are of
the experience and credence types and are therefore difficult to assess by
customers. Customers cannot evaluate these types because they do not have
the required skills, expertise and knowledge to carry out the evaluation. To that
effect, customers place a high premium on the image and reputation of the bank
before purchasing. Owusu-Frimpong (1999) indicates that because services of
banks are of the credence type, friends and other fellow customers constitute
the main source of information for customers. This assertion has been
confirmed by the results of the study of Tan and Chua cited in Ting (2006:99).
The role that banks play in the economic development of any country
including Ghana and Spain cannot be over-emphasized. According to
Heffernan, (1996) banks accept deposits of customers both individuals and
organisations and lend them to other customers. It is believed that customers
do not want to spend their money and have therefore chosen to lodge it with
banks for safe keeping and gaining interest as well. In addition, banks offer
investments advice to their customers, engage in foreign exchange trading and
4
processing payments. It behoves banks therefore to provide a congenial
atmosphere for customers by offering reliable services. In addition, it is also the
duty of banks to ensure that customers feel safe and repose confidence in them
as well.
There has been a sharp increase in the number of banks and branches
in Ghana and Spain. According to the Banco de España (2010), due to the
prolonged period of strong economic growth over the years, the banking sector
in Spain has grown in size to keep with the volume of financial transactions
which has reached unprecedented levels. Saving banks in Spain expanded
their operational offices by 10% in their catchment areas whilst commercial
banks expanded at a lower rate (Banco de España 2007). Rural banks which
are also community-based banks in Ghana also increased from 115 in 2004 to
125 in 2008 (World Bank 2004 and ISSER 2008) and to 135 in 2009 (Bank of
Ghana, 2010). The number of commercial banks in Ghana has gone up to 27
(Bank of Ghana, 2010) and are heavily concentrated in urban areas. The
number of products and services sold by the banks has also increased in both
countries (Bank of Ghana 2006 and The Banco de España (2007). These
suggest that customers have easy access to banks in both countries and
receive quality services as well.
1.2 Statement of the Problem
Extensive work has been done on customer satisfaction in the banking
industry. Most of these studies however concentrated on one specific country.
Only a few studies compared two or more countries but none of them found out
the differences in the perceptions of customers about the quality of banks’
5
services in Ghana and Spain. For example, Lasser et al (2000) examined the
service quality perspective and satisfaction in private banking by comparing the
USA and countries in South America. Yavas and Benkenstein (2007) compared
the views of banks’ customers in Turkey and Germany. Dash et al (2009) also
compared the perceptions of customers about the quality of banks’ services in
Canada and India. It is also evident that none of these studies segregated the
banks’ customers into sex, age, education, occupation and geographical
locations (communities and districts/regions). They only looked at the general
views of customers. Though a handful of studies that focussed on only one
country like Lewis (1994), Galloway and Blanchard (1996), Lopez et al (2007)
and Caruana (2002) classified the banks’ customers into occupation, age, race,
age and education respectively, none of them used all these variables (sex,
age, education and occupation) at the same time or grouped them according to
geographical locations.
Perceptions are however influenced by many factors. Kotler et al (1999)
posit that individual’s consumption behaviour is influenced by personal
characteristics like age and life-cycle, occupation, economic situation, lifestyle
and personality and self-concept. Zeithaml and Bitner, cited in Kangis and
Voukelatos (1997:280) on the other hand, advance that factors like service
encounters, the evidence of service, image and price constitute customers
perceptions of service quality, satisfaction and value. Similarly, Abdullah and
Rozario (2009) accentuate that the level of customer satisfaction may be
influenced by various internal and external factors. The question therefore is: to
what extent do customers in Ghana and Spain differ in their perceptions about
6
the quality of banks’ services according to their sex, age, education, occupation
and geographical locations?
1.3 Research Objectives
A thorough review of the literature on customer satisfaction in the
banking industry showed that no studies have been conducted to compare
Ghana and Spain. Only a handful of studies have made comparisons between
two countries but never attempted to find out the extent to which the sex, age,
education and occupation as well as geographical locations of customers
influenced their perceptions of the quality of banks’ services. As a result, this
study seeks to fill these gaps.
The main objective of the research is to compare the perceptions of
customers regarding the quality of banks’ services in Ghana and Spain.
Specifically, the objectives of the study are;
●To compare the perceptions of the districts, the communities and both Ghana
and Spain in general about the quality dimensions of banks’ services.
●To compare the perceptions of people in terms of their sex, age, education
and occupation about the quality dimensions of banks’ services in Ghana and
Spain
●To look at the overall satisfaction of banks’ customers in Ghana and Spain
●To find out the relationship between overall satisfaction and the quality
dimensions of banks’ services in Ghana and Spain
●To find out the main dimensions of the construct quality in relations to banks’
services in Ghana and Spain
7
●To make recommendations to enhance customer satisfaction in the banking
industry in general
●To make recommendations about the SERFPERF model in analysing the
quality of banks’ services
1.4 Significance of the Study
There is no work that has been carried out on customer satisfaction in
the banking industry in Ghana and Spain. To that effect, the study will go a long
way to;
●Add up to the store of knowledge on customer satisfaction in the banking
industry in general
●Serve as guidelines for the formulation of policies on the quality of banks’
services
●Assist banks to know the perceptions of customers in terms of sex, age,
education, occupation and geographical location.
●Lay bare where further research on service quality needs to be carried out.
1.5 Organisation of the Study
The study is organised into eight chapters. Chapter one as an
introductory chapter deals with the context of the problem, the statement of the
problem, research objectives, significance of the study and the organisation of
the study. The literature review is under the following subheading in chapter
two; consumer behaviour, the concepts of customer satisfaction, the
SERVQUAL and the SERVPERF models and the empirical studies in the
banking industry using SERVQUAL and SERVPERF and gaps in the literature.

8
The structure of the banking industries in Ghana and Spain will be the focus of
discussions in chapter three. Chapter four throws light on the hypotheses to be
tested. Chapter five captures the methodology whilst chapter six concerns the
analysis of the data. The analysis of the hypotheses will be treated in chapter
seven. The discussions of the findings and the conclusions will be the subject
matter of chapter eight.
9
CHAPTER TWO
LITERATURE REVIEW
2.1 Introduction
This chapter looks at the literature review. Specifically it reviews the
literature on consumer behaviour, concepts of customer satisfaction, the
SERVQUAL and the SERVPERF models and the empirical studies in the
banking sector using SERVQUAL and SERFPERF.
2.2 Consumer Behaviour
Hartl (2006) posit that behaviour of consumers is not predictable since
their preferences are becoming more complex and differentiated. Their demand
for sensory, health, process and convenience qualities have become more
heterogeneous. Individuals differ from one another and even perceive the same
thing differently, (Smith, 2009). Many organisations of late have adopted a
strategy of opening avenues for consumers to lodge their complaints. It is
believed that knowing the types of complaints will give a clue to companies to
have an in-depth knowledge about customers’ satisfaction, thus indirectly
knowing the quality of services or products offered, (Fornell, 2007). As
indicated by Best and Andreasen, and Day et al and Hupperts cited in Lerman
(2006:92), not all customers will see it as prudent to lodge complains. They will
either cease dealing with the organisations or continue the relationship with the
organisations though they will be suffering. According to Assael (1995),
consumers’ perceptions have triggered consumer packaged goods companies
to put clear goods on the market. Kim et al (2002) intimate that consumers opt
for certain products or particular brands not due to the fact they offer intended
10
functional or performance benefits only but also products can be used to exhibit
consumers’ personality, social status, affiliation or to fulfil their internal or inner
psychological needs like the desire for change or newness (emotional).
There are myriad of factors that influence consumers’ behaviour but the
most important ones will be discussed. Wilson et al (1992) have classified these
factors into four; cultural, social, personal and psychological
●Cultural Factors: Culture has a great impact on a person’s consumption
behaviour. The cultural factors are divided into two; sub-culture and social
class, (Engel et al 1993 and Kotler et al1999). Engel et al (1993) and Solomon
et al (1999) indicate that culture is the values, ideas and symbols that enable
people to communicate, interpret and evaluate as members of society.
According to Kotler et al (1999), culture influences a person’s wants and
behaviour since it is learnt. They believe that in societies in which children find
themselves, they learn from the various institutions’ values, perceptions, wants
and behaviours. Thus, a culture has subcultures or groups of people like
nationalities, religions, racial groups and geographical regions with values which
hold them together. These subcultures are the main tools shaping consumers
behaviour. This has been alluded to by Imrie et al (2002). Corroborating this,
Wilson et al (1992) are of the view that variations in ethnic taste, cultural
preferences, taboos, attitudes and lifestyles arise out of sub-cultures.
Assael (1995) accentuates that social class is the divisions among
people in society. Kotler et al (1999) also opine that social class is the divisions
in society whereby members are tied with similar values, interests and
behaviours. Wlson et al (1992) and Solomon et al (1999) submit that factors
that determine social class include power, prestige, occupation, income,

11
education, family background and wealth. In addition members of a particular
social class are more similar than others. Assael (1995) indicates that the social
class one belongs to influences his consumption behaviour indirectly. However,
Kotler et al (1999) have a dissenting view. They believe that social class has a
direct influence on the purchasing behaviour of people. The perceptions, needs
and wants and the entire behaviour may differ from one social class to another.
●Social Factors: reference groups, family and roles and status constitute the
social factors that influence consumers’ buying behaviour (Wilson, 1992).
Reference groups according to Kotler cited in Wilson et al (1992:105) are the
groups that have direct and indirect influence on the behaviour of their
members. These groups are of four types; primary membership groups,
secondary membership groups, aspirational groups and dissociative groups
(Wilson et al, 1992). Primary membership groups are the ones members
interact and are of the informal types. These include family, neighbours,
colleagues and friends. Secondary groups are the formal ones which members
interact less often. Among them are trade unions, religious groups and
professional associations. Aspirational groups are those who wish to come
together as a group whilst dissociative groups are the ones people reject their
values and behaviour.
The most significant group that exerts much pressure on the individual,
according to (Kotler et al 1999) is the family. They note that there are two types
of families; family of orientation and family of procreation. The family of
orientation comprises the buyer’s parents which train him about religion, politics,
economics, a sense of personal ambition, self-worth and love. The family of
procreation is made up of the consumer’s spouse and children. Kotler et al
12
(1999) contend that, the family of procreation has influence on everyday
behaviour. Couples with no children or those who have small families may
spend luxuriously for instance on entertainment. The pattern of expenditure
changes as the size of the family begins to increase, the children become older
or the couples begin to age. Someone from a rich family may spend lavishly as
compared to his colleague from a poor one.
Assael (1995) points out that, apart from the fact that family members
influence themselves in buying decisions, they also undertake collective
decisions. The father and the mother usually make most of the purchasing
decisions. However, with constant changing of the society, children also
influence family consumption decisions very much. Apart from this, parents also
tutor their children to make consumptions choices. A family’s collective
decisions emanate when the risk involved in the purchasing is high. Therefore
all members decide to at least reduce the risk to the barest minimum or take
risky decisions since all will bear the consequence. Other factors for making
collective decision are when the decisions are of utmost importance and when
there is much time at their disposal.
Roles individuals play as well as their status in society influence their
purchasing behaviour. According to Kotler et al (1999), roles are the activities
individuals are expected to carry out whilst a status is the general esteem
attached to it by the society. They intimate further that the position an individual
occupies be it in the family, organisation and society go with roles and status.
●Personal Factors: to a large extent an individual decision to buy is influenced
by the characteristics he possesses. These characteristics include his age and
life-cycle, occupation, economic situation, lifestyle and personality and self-

13
concept, (Kotler et al 1999). Kotler et al (1999) submit that aging correlates with
a person’s buying behaviour. For example, the demand for food, clothes,
furniture and recreation changes as a person is aging. In the same vein, the
buying behaviour of a person is determined by the family life-cycle. For
instance, the buying behaviour of spinster is different from a married woman
with family.
Economic situation like the income of a person determines his
purchasing behaviour Engel et al (1993). A person who earns more is likely to
lead a luxurious life and vice versa. For example, blue-collar workers are likely
to buy more clothes whilst white-collar workers purchase more suits and ties,
(Kotler et al, 1999). In the same vein, personality and lifestyle have an impact
on ones consumption behaviour. Kotler et al (1999) note that lifestyle is the way
a person lives. This is exhibited in his activities, interests and opinions. To them,
personality is the unique psychological characteristic that is responsive to
someone’s own environment. Personality is seen in terms of traits like self-
adaptability, dominance, sociability, autonomy and defensive. Both personality
and lifestyle influences a person decision-making.
●Psychological Factors: these factors include motivation, perception, learning
and beliefs and attitudes. Motivation is the force that drives a person to search
for satisfaction, (Kotler et al, 1999). Wilson et al (1992) distinguished between
two types of needs that motive a person to crave for satisfaction. Biogenic
needs are physiological such as hunger, thirst and discomfort. Psychogenic
needs are also psychological which include recognition, esteem and belonging.
Perception according to Wilson et al (1992) is how a motivated person sees a
given situation and how he will behave. Kotler et al (1999) on the hand think it is

14
the process through which people select, (selective attention) organise
(selective distortion) and interpret (selective retention) information to a
meaningful picture about the universe. According them because of these three
perceptual processes, individuals can see the same object in different ways.
Selective attention is where the individual sifts numerous information that come
across his way. Selective distortion is whereby people interpret or distort
information to fit into what they have already conceived. That means, they will
accept information that conforms to what they have preconceived. Selective
retention is when people remember or retain information that is in accordance
with their beliefs, attitudes, values and interests.
Learning is the changes in an individual’s behaviour as a result of an
experience (Schewe and Hiam, 1998). Wilson et al (1992) are of the view that
when the learning experience is positive, there may be a repeat purchase and
vice versa. On the other hand, a person is likely to extend the negative learning
experience to other products of the manufacturer and even to the country of
origin. Beliefs and attitudes also affect the buying behaviour of people. Kotler et
al (1999) indicate that a belief is the notion that someone has. The belief may
be based on real knowledge, opinion and faith. Attitude on the other hand is the
evaluation, feelings and tendencies of a person regarding something.
●Situational: Schewe and Hiam (1998) and Engel et al (1993) intimate that
consumers´ behaviour is situational. A person’s behaviour depends on the
conditions of the person or the environment he finds himself (Solomon et al
1999). Engel et al (1993) assert that situations are one of the most pervasive
influences on consumers’ behaviour because behaviour always happens within
some situational context. Situational factors are grouped into four;
15
communication, purchase, usage and time. Communication situations also
influence the purchasing behaviour of consumers. There are two types of
communication situations; personal and non-personal. Personal communication
is the conversations between the consumer and the salesmen or with other
consumers. Non-personal communication pertains to stimuli such as
advertising, consumer-oriented programmes and publications. Both situations
entice consumers to make purchasing choices.
In addition, purchase/usage situations have an effect on the behaviour of
buyers (Assael 1995). Purchase/usage situation is the place where goods are
obtained or where the transactions take place. These are the physical
properties of the place (such as layout, lights and painting) and the locations of
the place in general and information flow which is mainly data of products or
services for example (prices, products types and products attributes) and music
(Assael1995). Generally, a conducive purchasing environment entices the
consumer to make purchases and vice versa. Time influences ones
consumption behaviour. It is the resources of the individual that he apportions to
his activities. The priorities of the individual determine his time style, (Solomon
et al 1999). Time is also seen in terms of seasons or occasions, (Assael 1995).
For example, consumers travel or buy more during occasions like Christmas
and Easter. Also, they buy different types of products depending on the season.
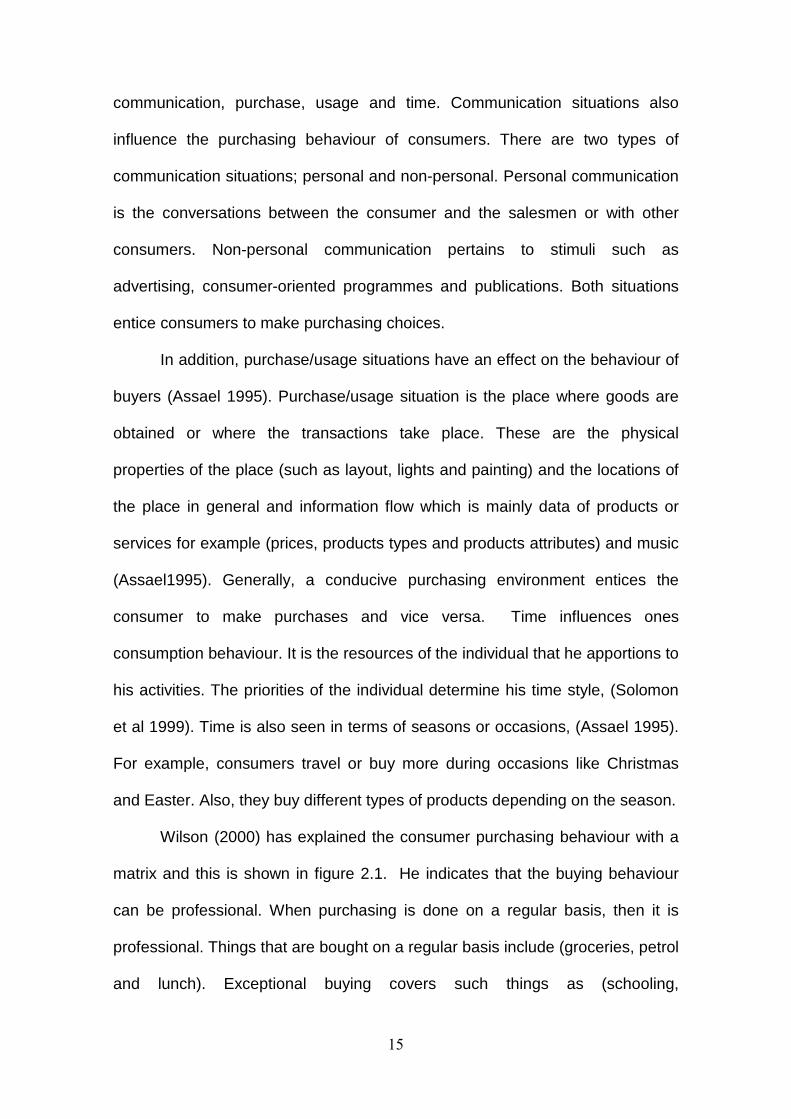
Wilson (2000) has explained the consumer purchasing behaviour with a
matrix and this is shown in figure 2.1. He indicates that the buying behaviour
can be professional. When purchasing is done on a regular basis, then it is
professional. Things that are bought on a regular basis include (groceries, petrol
and lunch). Exceptional buying covers such things as (schooling,
16
accommodation and medication) whilst leisurely buying entails causal browsing,
impulse buying and therapeutic shopping. The writer however points out that it
is not easy to distinguish between these types of buying behaviour because
there is not clear borderline.
Figure 2.1 Consumer Purchasing Matrix
Wilson (2000:788) The above discussions have given us a profound gist about consumer
behaviour. Consumers act by themselves or are induced by environmental
forces which include groups or individuals. Some actions of individuals are
situational. It is left to the individual to use his discretion to sift through the
information available and make informed choices. Having captured the
essentials of consumer behaviour, the stage is set to look at the concepts of
customer satisfaction.
17
2.3 Concepts of Customer Satisfaction
Both customers and banks attach much importance to satisfaction.
Frantic efforts are being made by banks to offer high quality products and
services to their customers. Customers also want the best value for their money
and are sparing no efforts in selecting the best products and services, (Strategic
Direction, 2007). Once customers are satisfied and have a positive image or
intentions about a particular firm, it will take some time for competitors to snatch
or convince them to switch to them. Benefits derived by companies from
customer satisfaction include loyalty, repurchasing to increase sales or profit,
speak well about the products or services to others to purchase, (He and Song,
2009 and Sit et al., 2009). As pointed out by Assael (1995), the economic
viability of firms lies in the hands of consumers. According to Solomom et al
(1999), there are various types of customers or consumers. They may be
individuals, groups, organisations, communities or nations. The banking
industry like any other industry has intensified its efforts to satisfy consumers
through the provision of quality services. This stem from that fact that
competition has been stiff and every bank is trying to retain old customers and
woo new ones.
Quality, satisfaction and value are the concepts that featured
prominently in the customer satisfaction literature. Explaining these concepts
will be very useful.
2.3.1 Quality
ISO 9000 (2005) intimates that quality is the extent to which a bunch of
inbuilt features (relating to a product, a process or a system) meet
18
requirements. The inbuilt features can be physical, sensory, behavioural,
temporal, ergonomic or functional whilst requirements are the stated need or
expectation be it implied or obligatory. Crosby and Juran cited in Fox (1993:4)
define quality as conformance to requirements or specifications and fitness for
the purpose or use respectively. Dale and Bunney (1999) explain that Crosby is
of the view that quality cannot be compared and adjectives such high, low,
excellent and good cannot be used to describe quality. Parasuraman et al
(1991) note that quality is the meeting the needs and the expectations of
customers. Therefore, the yardstick for determining service quality is the
expectations of customers and not the policy of the bank. This view has been
corroborated by Ting (2004) and Jamali (2007). Bitner and Hubbert and Rust
and Oliver cited in Nguyen and LeBlanc (1998:53) put forward that the quality of
service is the view of customers about how superior or excellent the service
received or used is. Metawa and Almossawi (1998) submit that the quality of
service is a function of the experience of customers since services must be
used first.
According to (Zeithaml et al (1988) the interaction or the relationship
between customers and service organisations induce perceptions of customers’
quality. The attitude of service providers can also serve as a quality indicator for
customer. Alluding to this, Owusu-Frimpong (1999) claims a receptive attitude
of workers is a key ingredient for giving customers a good impression about a
bank and its services. The physical environment in terms of the infrastructure,
the design and the general atmosphere are also considered by consumers in
assessing the quality of services of banks. Likewise, the duration of the service
delivery gives a positive or a negative impression to customers. A short waiting
19
time may give a good impression about the bank that its services are of high
quality and vice versa.
Bowen and Schneider cited in Ennew and Binks (1996:6) on the other
hand think that the quality of the service will partially be based on the customer
interactions with the organization rendering the service. They further indicate
that customers who are willing to participate actively in the delivery of service
are likely to expect to receive a better quality of service. The reasons are that,
the service provider will understand their needs and circumstances. Also
customers involved in the service delivery process will have an insight into the
impediments on the way of the service organisation and therefore be
sympathetic in their quality expectations.
According to Burke et al (2005) service purchase is different from a
product. There is no contact with the organisation selling the product and the
consumer and therefore the perceptions of the quality of the product are not
induced by the people in the organisation. The consumer forms his judgments
about the quality of the product based on advertisements, recommendations by
individuals who have used the product before or the experienced he has had
after using the product in the past. On the other hand consumers are moved
either positively or negatively by the service provider and therefore the provision
of service is both a personal and a psychological thing, (Schneider and Bowen,
1985).
Athanassopoulos et al (2001) have given a summary of the literature
about the criteria customers used to measure the quality of services. The
general conclusion is that the criteria used are complex and difficult to
determine exactly due to the factors listed below;
20
●services are intangible
●services are heterogeneous indicating that their performance often varies
from provider to provider, from customer to customer, and from context to
context
●services cannot be placed in a time capsule and thus be tested and retested
over time
●production of services is likely to be inseparable from their consumption
Gronroos and Kotler cited in Athanassopoulos et al (2001) intimate that
customers generally evaluate service quality by its outcome, the process of the
service delivery and the context. According to Zeithaml et al. (1993) consumers
assess services and products through three processes. These are pre-purchase
or search qualities, experience qualities and credence qualities. Search
qualities are features that consumers look out for before buying and are those
they can see, feel or touch. On the other hand experience qualities are post-
purchase features that customers assess whilst credence features are those not
easy for consumers to assess during the post-purchase period. Banks services
are of the experience and credence types and therefore difficult to assess by
customers. Customers cannot evaluate these types because they do not have
the required skills, expertise and knowledge to carry out the evaluation. As a
results of that, customers place a high premium on the image and reputation of
the bank before purchasing. Owusu-Frimpong (1999) contends that because
services of banks are of the credence type, friends and fellow customers
constitute the main source of information for customers. This has been
confirmed by the results of a study of Tan and Chua in Ting (2006:99). Burke et
al (2005) claim that there are two ways service organisations can improve upon
21
service quality. First, a good human resources management policy must be
adopted to ensure employees’ satisfaction. It is believed that with the necessary
support from management, employees strive hard to provide high quality
service to customers. Also, the organisation has to implement its organisational
values, policies and procedures to leverage the delivery of high service quality
to customers.
2.3.2 Satisfaction
The ISO 1002 (2004) indicates that satisfaction is the extent to which the
requirements of the customers have been met where (ISO 9000 2005)
requirements means stated needs or expectations whether implied or
obligatory. According to Oliva et al (1992) satisfaction is whereby the service
provider meets the expectations and norms of customers. This view is shared
by Anderson et al (1994). Westbrook and Oliver, (1991) postulate that
satisfaction is when a consumer cognitively compares actual performance with
expected performance. Kotler (1991) opines that satisfaction is the post-
purchase evaluation of products or services taking into consideration the
expectations. Summarising the literature on the definition of satisfaction,
Fecikova (2004), indicates that satisfaction is the feeling which emanates from
the process of evaluating what was obtained against what was expected, the
purchase decision itself and or the fulfilment of needs or wants.
Abdullah and Rozario (2009) accentuate that the level of customer
satisfaction may be influenced by various internal and external factors. This
suggests that the determination of satisfaction is very difficult. Veloutsou et al
(2005) indicate that overall customer satisfaction is not a static process but
22
keeps on changing when the customer get an experience with the service
provider. In the same vein, Communities Scotland cited in the European
Institute of Public Administration (2008:15) has listed the following as the
difficulties associated with the concept of satisfaction:
● It is not static, but changes over time; new experiences and levels of
awareness will alter the potential levels of satisfaction that could be achieved.
● It is likely to be complex and the result of a mix of experiences before, during
and after the point at which it is measured.
● It occurs in social contexts which are varied and changing and may be
unpredictable or inexpressible to the service user.
● It may be difficult to express the reasons for satisfaction; particularly where
less tangible aspects of services are being considered.
● It may be easier to express the reasons for dissatisfaction, particularly if this is
the exceptional state.
● Without understanding the causes of satisfaction, there is a danger that we
might treat a “good result” as a reason not to change anything, seeing it largely
as a PR tool.
Jamal and Nazer (2002) contend that customer satisfaction is not linked
with only the view of customers regarding the reliability of the service delivered
but also based on the experience of the customer with the service delivery
process. Kotler (2003) posit that high customer retention is an indicator for
customer satisfaction. Reichheld (1993) opines that customer satisfaction alone
is not enough and cannot guarantee loyalty to organisations as between 65% to
85% of customers who switch to other organisations are satisfied customers.
23
What is needed is a full customer satisfaction to ensure customer loyalty and
improvement in performance of organisations, (Jones and Sasser, 1995).
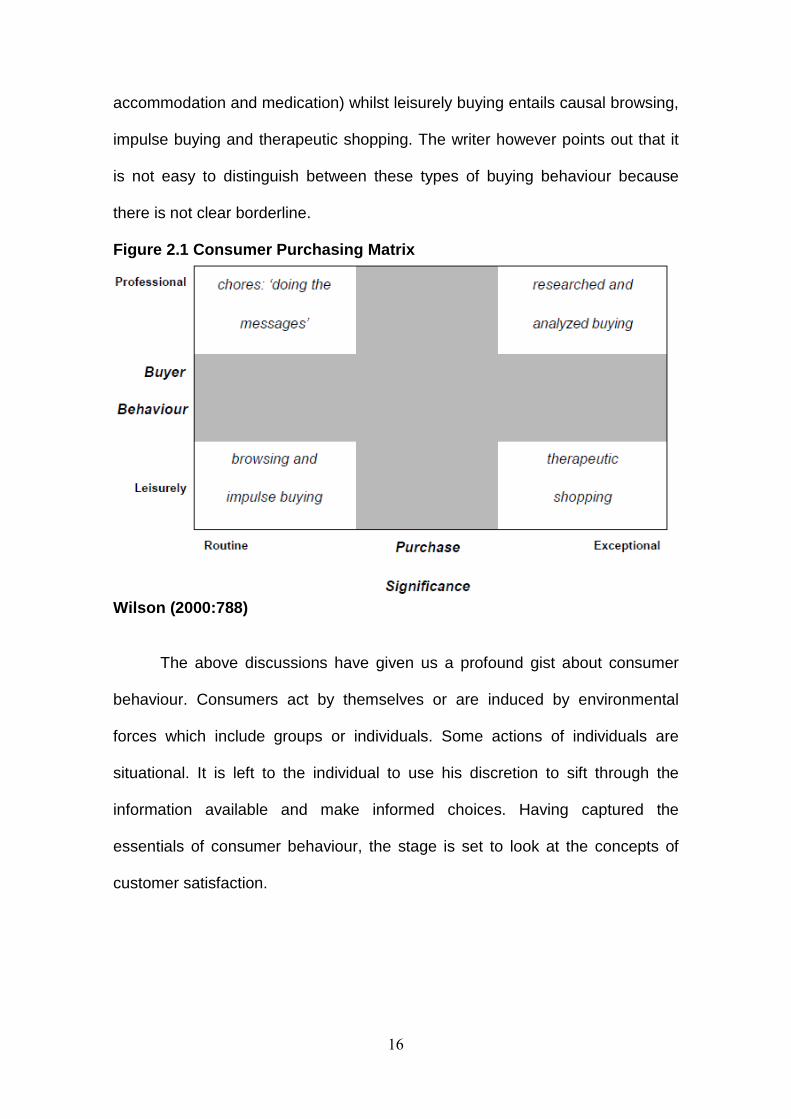
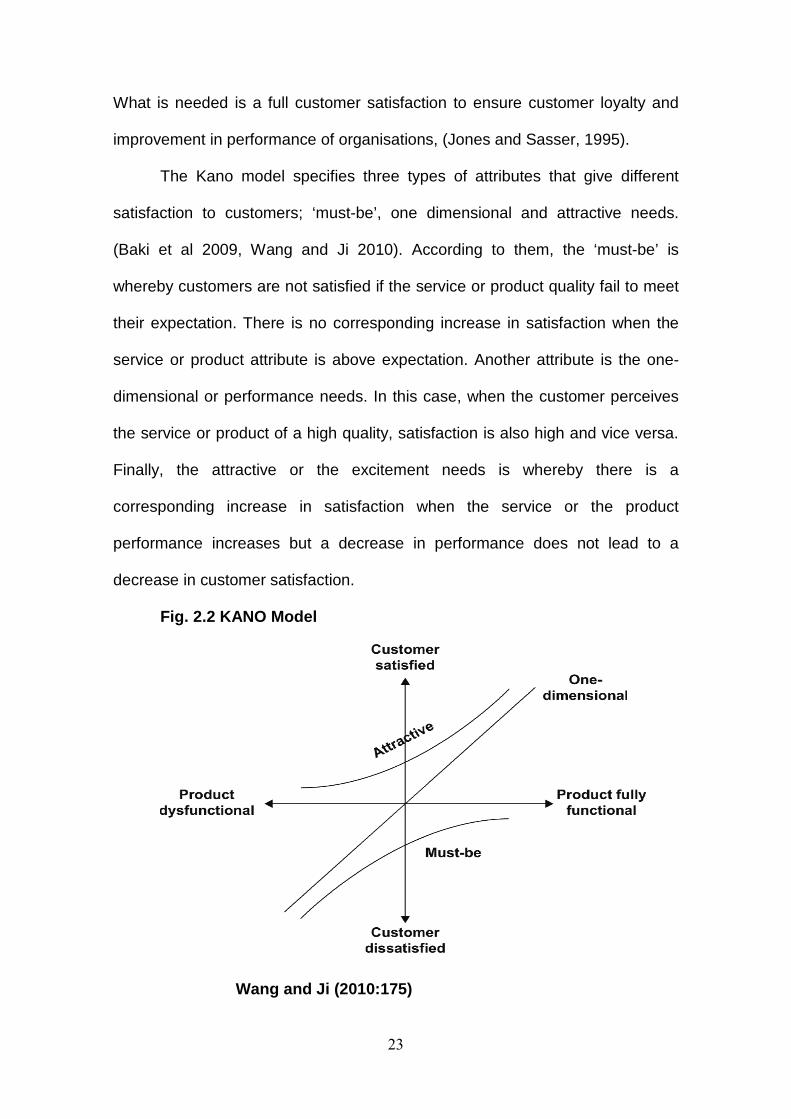
The Kano model specifies three types of attributes that give different
satisfaction to customers; ‘must-be’, one dimensional and attractive needs.
(Baki et al 2009, Wang and Ji 2010). According to them, the ‘must-be’ is
whereby customers are not satisfied if the service or product quality fail to meet
their expectation. There is no corresponding increase in satisfaction when the
service or product attribute is above expectation. Another attribute is the one-
dimensional or performance needs. In this case, when the customer perceives
the service or product of a high quality, satisfaction is also high and vice versa.
Finally, the attractive or the excitement needs is whereby there is a
corresponding increase in satisfaction when the service or the product
performance increases but a decrease in performance does not lead to a
decrease in customer satisfaction.
Fig. 2.2 KANO Model
Wang and Ji (2010:175)
24
It is also believed that there is a correlation between satisfaction of
employees and customer satisfaction. The results of the study of Schneider
(1980) suggest that frontline employees handled customers well if they thought
they have been treated well by management. Customers were glad and
satisfied with the service provided when they see bank employees also in a
good mood. The results of the study of Levesques and McDougall (1996) on the
determinants of customer satisfaction in retail banking in Canada, showed that
service quality dimensions (core and relational performance, problem
encountered and satisfaction with problem recovery), the bank’s features (e.g.
location), the competitiveness of the bank’s interest rates, the customers’
judgment about the bank employees’ skills and whether the customer was a
borrower influenced satisfaction. In a related development, service problems
and the bank’s service recovery ability impacted on customer satisfaction and
intentions to switch very much. Customers who encountered service problems
were likely to switch to other banks and inform others to follow suite since they
were not satisfied. Similarly, resolving problem does not necessarily improve
customer satisfaction.
2.3.3 Value
Value according to Zeithaml (1988) is the importance attached to
services based on their usage and the amount paid in exchange. Alluding to
this, Woodruff (1997) indicates that value is what customers derive from the
transactions made eg. quality, benefits, worth and utilities) and what he used for
the exchange (price or the sacrifice made). He again intimates that value
emanates from learnt perceptions, preferences and the overall assessment

25
made by customers. He accentuated that perceived value is higher than quality.
Also value can be defined in four ways; value is low price, value is want
satisfaction, value is the quality of the price paid for and what is received in
exchanged for what is given out. It is also argued that value judgments are
based on both financial and non-financial costs. That is, the sacrifices made in
using the service and the gains made in exchange for the service, (Hauser and
Urban, 1986). Corroborating this, Lam et al (2004) point out that, customers
assign value to a product or service based on perceived price and perceived
quality. Based on this, Zeithml (1988) intimates that value is situational and
personal than quality. It varies in accordance with the consumption process.
Lam et al (2004) contend that when perceived value is more than perceived
cost, the value of customers is high and vice versa. Rust and Oliver (1994) cited
in Nguyen and LeBlanc (1998:54) suggest that there must be a rise in value
when quality rises and price falls.
Treacy and Wiersema cited in Bick et al (2004:301) contend that
customers buy different types of value. Since values are different, corporate
bodies should select their customers and scale down their value focus. Value
standard shores up in connection with customer expectations. Woodruff (1997)
claims that there are two types of customers’ value. The first is the value or the
expected value that customers get from the organisation. The second is how
the organisation also values its customers.
Treacy and Wiersema cited in Bick et al (2004:301) have come out with
three value concepts that business organisations should bear in mind. These
are value proposition, value driven operating model and value disciplines. Value
proposition is the suppose assurance which is not verbally stated. It is given to

26
customers by management of organisations that they will render particular
values like price, quality, performance, selection or convenience. The value
driven operating model is the auxiliary supporting systems in delivering value
(value proposition) to customers. These include; management systems,
operating processes, business structure and culture. The last one, values
disciples are how management of organisations can integrate both the value
proposition and the value driven operating model to beat all competitors in their
markets and provide the highest value to customers.
According to them, there are three value disciplines; operational
excellence, product leadership and customer intimacy. Operating excellence is
the provision of a combination of low price and services which is devoid of
problems to customers. Product leadership on the other hand, refers to the
delivering of the highest quality and best performing products in the market.
This is possible when organisations keep on innovating to improve products
quality. Customer intimacy concerns the establishment of relationship with
customers, supporting and providing what they want in order to enable them get
the needed value from the product or service.
2.3.4 Relationships Among the Concepts of Customer Satisfaction
Light has been thrown on the three concepts that are most often used to
refer to customer satisfaction. A cursory glance at the relationship between
these concepts will be desirable.
27
2.3.4.1 Customer Satisfaction and Quality
Oliver cited in Ting (2004:408) have enumerated the differences between
service quality and satisfaction. They indicated that the dimensions of service
quality are specifically or directly connected with the rendering of the service
whilst satisfaction is based on many factors, both directly and indirectly relating
to the delivery of the service. Customers do not base their perceptions of the
quality of service on experiences/encounters with both the service provider and
the service environment. On the other hand, past experiences form the basis for
evaluation of satisfaction. In addition, quality is supposed to be ascertained by
external cues such as price and reputation whilst satisfaction is prompted by
conceptual cues like equity and regret. Also ideals and excellence in connection
with the service delivery are the clues to service quality. In the same vein,
satisfaction perceptions are based on predictions or norms for the service
delivery. Oliver however indicated that it is very difficult to draw a line between
satisfaction and quality of service. Parasuraman et al (1988) postulate that
satisfaction can be experienced and happened during or at the transactional
level whilst quality is seen to be taking place at the global level. Oliver (1997)
believes that quality judgments are more specific and that of satisfaction are
holistic. Quality judgments have a connection with cognitive judgments whilst
that of satisfaction relates to affective judgments.
As noted by Ting (2004), researchers are divided over the antecedents of
service quality and satisfaction. Whilst some believe service quality leads to
satisfaction, others think otherwise. Authors like Parasuraman et al (1988) and
Bitner (1990) are of the view that satisfaction leads to quality whilst others such
as Cronin and Taylor (1992) and Anderson Sullivan (1993) have a contrary
28
view. Empirical studies regarding the above issue support the assertion made
by the latter. The studies of Tam (2000), Petrick and Backman (2002) and
Cronin and Taylor (1992) suggest that satisfaction leads to quality. Newman
(2001) also submits that there is a correlation between the quality of service and
customer satisfaction. Enhanced service quality leads to customer satisfaction
with its ripple effects such as; customer loyalty and improvement in the existing
relationship between the organisation and customers. Others are that
customers will bear with the service provider when the organisation is not able
to deliver as well as customers canvassing for the organisation to get more
customers.
It can be gathered from the above that the two concepts are the same
and are being used interchangeably. Authors such as DeRuyter et al (1997)
Rust and Zahorik (1993) and Boulding et al (1993) think that quality and
satisfaction are closely connected and are synonymous and interchangeable.
Thus, both concepts are referring to meeting the requirements of customers.
Therefore making a clear distinction between them will be a difficult task.
2.3.4.2 Value, Satisfaction and Quality
According to Zeithaml and Bitner, cited in Kangis and Voukelatos
(1997:280), there are four main factors that constitute customers perceptions of
service quality, satisfaction and value. These are service encounters, the
evidence of service, image and price. Service encounter refers to both verbal
and non-verbal attitudes which form the basis for intangible service quality such
as the environment where the service is provided like equipment and layout of
the room or building. Evidence of service is whereby customers based their

29
search of the level of service provided on certain proof like employees, process
and physical evidence. This is because services are intangible and they are
produced and consumed at the same time. Zeithaml and Bitner have furnished
three proofs; employees, process and physical evidence.
Zeithaml and Bitner are of the view that a high service price is associated
with an equal high quality consumer expectation. A low price will prompt
customers to be apprehensive about the quality of the service and the capability
of the organisation to render quality service. This point is not wholly true.
Normally a low price of things in general does not connote inferior or superior
quality. Reidenbach (1995) asserts that value is more practicable or is a
feasible thing than satisfaction since it includes not only the benefits accrued
but the price. According to him, value is dynamic that must be managed. On the
other hand, satisfaction is derived from the value proposition offered in specific
products/markets. Cronin et al (2000) claim that value precedes satisfaction.
They further accentuated that quality affects value. The results of study of
Nguyen and LeBlanc (1998) also suggest that there is correlation between
service satisfaction and quality and value. It is clear from the literature that
value is the worth or the importance attached to or gains and loss derived from
purchases or consumption of services. Satisfaction and quality are also seen as
the meeting of the requirements of customers. It could therefore be inferred that
the requirements are the same as the importance attached to the services.
Therefore, the three concepts; quality, satisfaction and value are the same and
are being used interchangeably.
30
2.4 The SERVQUAL and the SERVPERF Models
The most widely used models in measuring quality in the service industry
in general and in the banking sector in particular are the SERVQUAL and the
SERVPERF models. Since the SERVPERF was curved out of the SERVQUAL,
the literature on both models are reviewed.
2.4.1The SERVQUAL Model
SERVQUAL is one of the tools used in measuring the quality of services.
According to Buttle (1996), SERVQUAL is for the measuring and managing the
quality of service. Asubonteng et al (1996) also intimate that the model is used
to measure the quality of services from the customer’s point of view. The
originators of the model are Parasuraman, Zeithaml and Berry. It was
developed in 1985 but was polished in their subsequent articles (Parasuraman
et al 1988). The main aim of SERVQUAL is to have a standard and a reliable
tool that can be used to measure the quality of services in different service
sectors, (Curry and Sinclair, 2002). Originally, those who developed
SERVQUAL introduced ten service quality dimensions or attributes. These are:
tangibles, reliability, responsiveness, competency, courtesy, communication,
credibility, security, access and understanding the customer. However in the
1988 article, these were pruned to five (Parasuraman et al 1988). These are;
tangibles, reliability, responsiveness, assurance and empathy. Tangibility refers
to the physical environment in which the service provider operates. It comprises
the physical facilities available, workers, equipment and communication
materials. Reliability concerns the ability with which the service organisation can
deliver the service dependably and accurately. Empathy on the other hand, is

31
about the special care and attention given to individual customers when being
served. Responsiveness is also the preparedness of the service provider to
assist customers and render as quick or prompt service as possible. Assurance
too is in connection with the knowledge and the courteous attitude of staff and
their ability to instil trust and confidence in customers.
Based on the five service quality dimensions, two sets of twenty-two
statements or questionnaire are developed, (Donnelly et al 1995 and Iwaarden
et al, 2003). The questionnaires are a seven-point likert scale. Robinson (1999)
also explains that one set is about customers expectations (expectation of
service quality before using the service) and the other set measures customer
perceptions (perceptions of quality after using the service). The difference
between the two; perceptions (P) and expectations (E) constitute the service
quality gap. The quality gaps according to Parasuraman (2004) and and Tahir
and Bakar (2007) are five. These are:
● Gap 1: The difference between what customers really (actually) expect and
what management think (perceptions) of customers expectations. Donnelly et al
(1995) are of the view that the gap occurs because management did not
undertake in-depth studies about customers’ needs. Also there are poor internal
communication and insufficient management structures. This gap is referred to
as the understanding or knowledge gap.
● Gap 2: Is what is called the standard gap. It is the difference between
management perceptions of customer service quality expectations and service
quality specifications.
● Gap 3: This gap is also known as the delivery gap. The difference between
service quality specifications and the actual service quality delivered. This
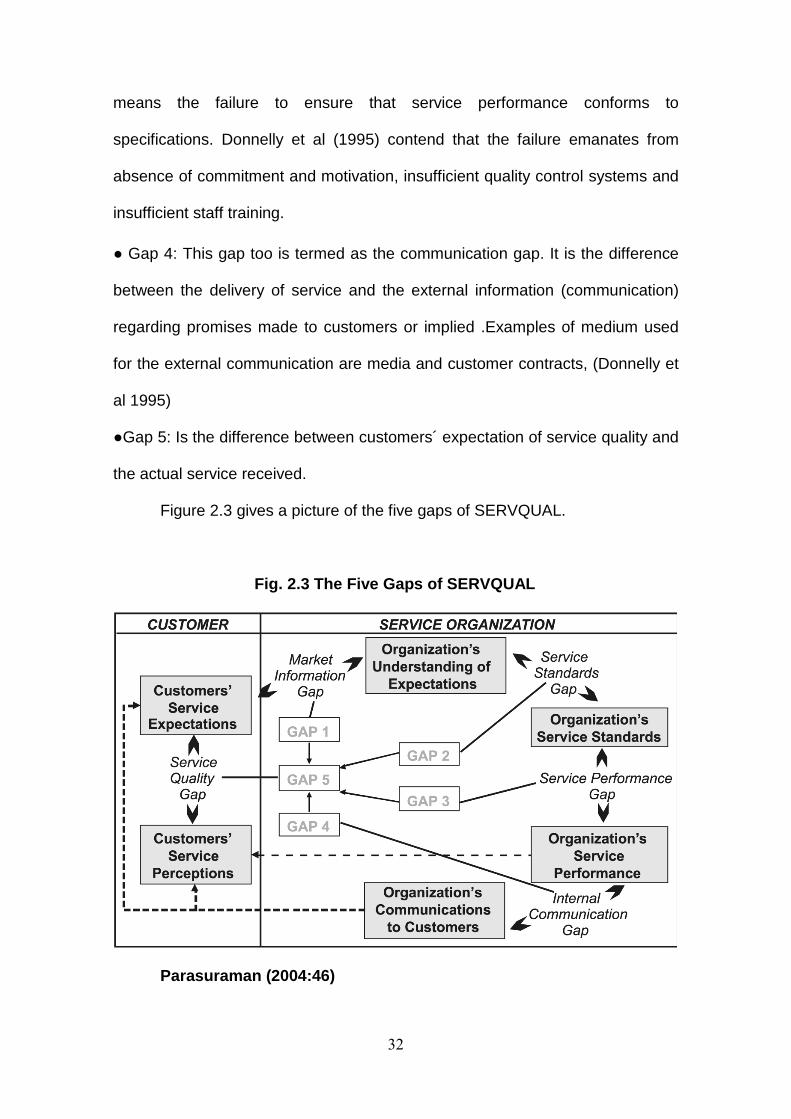
32
means the failure to ensure that service performance conforms to
specifications. Donnelly et al (1995) contend that the failure emanates from
absence of commitment and motivation, insufficient quality control systems and
insufficient staff training.
● Gap 4: This gap too is termed as the communication gap. It is the difference
between the delivery of service and the external information (communication)
regarding promises made to customers or implied .Examples of medium used
for the external communication are media and customer contracts, (Donnelly et
al 1995)
●Gap 5: Is the difference between customers´ expectation of service quality and
the actual service received.
Figure 2.3 gives a picture of the five gaps of SERVQUAL.
Fig. 2.3 The Five Gaps of SERVQUAL
Parasuraman (2004:46)
33
Many criticisms have been levelled against the SERVQUAL model. One
of the major shortcomings of the model is that the five service quality
dimensions are not universal and cannot be applied in all service industries,
(Ladhari 2009, Saurina Canals 1997, Buttle 1996 and Robbinson 1999). They
contended that it depends on the context in which the dimensions are applied
since the definitions and the number differ. For instance, the results of the study
of Babakus and Boller (1992) on an electric and gas utility company using
SERVQUAL suggest that the dimension of this industry is one and not five. This
has been confirmed by the study of Mels et al (1997). In their case only two
dimensions were found. In the same vein, Cronin and Taylor cited in Jun and
Cai (2001:278) conducted an investigation into the banking, pest control and dry
cleaning and fast food industries and found that, there was no evidence of the
five dimensions. Also, the study of, Johnston (1995) and Joseph et al (1999) in
the banking industry did not support the five dimensions. The study of the
former unveiled 18 service quality attributes whilst that of the latter found six
dimensions.
Buttle (1996) opines that there is but a little proof that customers evaluate
the quality of service on the basis of the different between perceptions and
expectations. Alluding to this, Ladhari (2009) intimates that researchers
advance that the difference scores do not give any additional information
beyond that already existed in the perceptions’ items. This has been supported
by the study of Babakus and Boller (1992). The results showed that the
perceptions’ score was the dominant contributor to the gap scores. Buttle
(1996) further posit that the model dwells on the process delivery but not on the
outcome of the service encounter. Buttle again punched holes in the likert-
34
scale. He contended that, it is defective or flaw whilst the use of the two sets of
questionnaire are tired-some and confusing. Though the model has been
credited with the fact that it furnishes information concerning the gaps between
perceptions and expectations of the quality of service, it fails to provide clues to
the closure of these gaps, (Tan and Pawitra, 2001).
Gilmore cited in Kumar et al (2009: 213) put forward that, the five service
quality dimensions are highly inter-correlated or related. Ladhari (2009)
accentuate that the factor-loading pattern of the model unearths some
weaknesses in the convergent validity in some studies. Thus, most of the
SERVQUAL’s 22 items have higher loadings on dimensions that are different
from those suggested by those who developed the model. For example, the
study of Engelland et al (2000) show that there was an excessive cross-loading
as three items belonging to the assurance dimension loaded on the empathy
dimension. In the same vein, only one item from the tangibles dimension loaded
on the tangibles dimension. The results of the research of Lam (1997) also
reveal that items belonging to the assurance, responsiveness and empathy
dimensions tended to load in an unstable manner.
In spite of the numerous criticisms, SERVQUAL has been adopted for
conducting many studies. It is therefore held in high esteem (Buttle 1996). Other
points in favour of SERVQUAL as enumerated by Tan and Pawitra (2001) are
given below. The model in general lays bare the strengths and weaknesses of
the quality of service provided by organisations. In this way, areas of
weaknesses can be prioritised by the organisation. Another important merit of
the model is that it serves as the standard for organisations to measure the
quality of service in the same industry. Apart from this, it serves as a signal to

35
management to take into consideration the perceptions of both management
and customers. It also helps management to know customers’ impressions
about the service purchased. The analysis of the quality gaps assist
management immensely to draw their strategies to meet customers´
expectations.
Having discussed the SERVQUAL model, the next section dwells on the
studies conducted into the banking industry using the SERVQUAL model.
2.4.2 Empirical Studies in the Banking Sector Using the SERVQUAL Model
Numerous studies have been done in the banking industry using the
SERVQUAL model. However, the most relevant ones are summarised in table
2.1.
Table 2.1 Empirical Studies in the Banking Industry Using SERVQUAL Date & Author
Title Theory/Model Country &Findings
Kumar et al (2009)
Determining the Relative Importance of Critical Factors in Delivering Service Quality of Banks: An Application of Dominance Analysis in SERVQUAL Model
Modified SERVQUAL consisting of 6 (5 original SERQUAL dimensions + 1) dimensions: tangibles, reliability, responsiveness, assurance, empathy + convenience. 26 questions (22 SERVQUAL + 4 convenience)
Malaysia 1.Factor analysis reduces the
factors into 4 (tangibility, reliability, competence & convenience)
2.In general banks services are of poor quality as customers’ perceptions are lower than expectations
3. Significant differences between 4 dimensions:
● tangibility & reliability have the lowest gap indicating respondents perceptions are close to expectation & are therefore satisfied
●both competence & convenience have the largest gaps indicating respondents’ banks are not competent & convenient in doing business with.
●the gap of convenience is relatively larger than competence
Lasser et al (2000)
Service Quality Perspective & Satisfaction in Private Banking
SERVQUAL &Technical /Functional Quality
USA & South American Countries 1. Technical/Functional Quality-based model is better than SERVQUAL-based model in predicting customer satisfaction when customers are actively involved or highly interested in
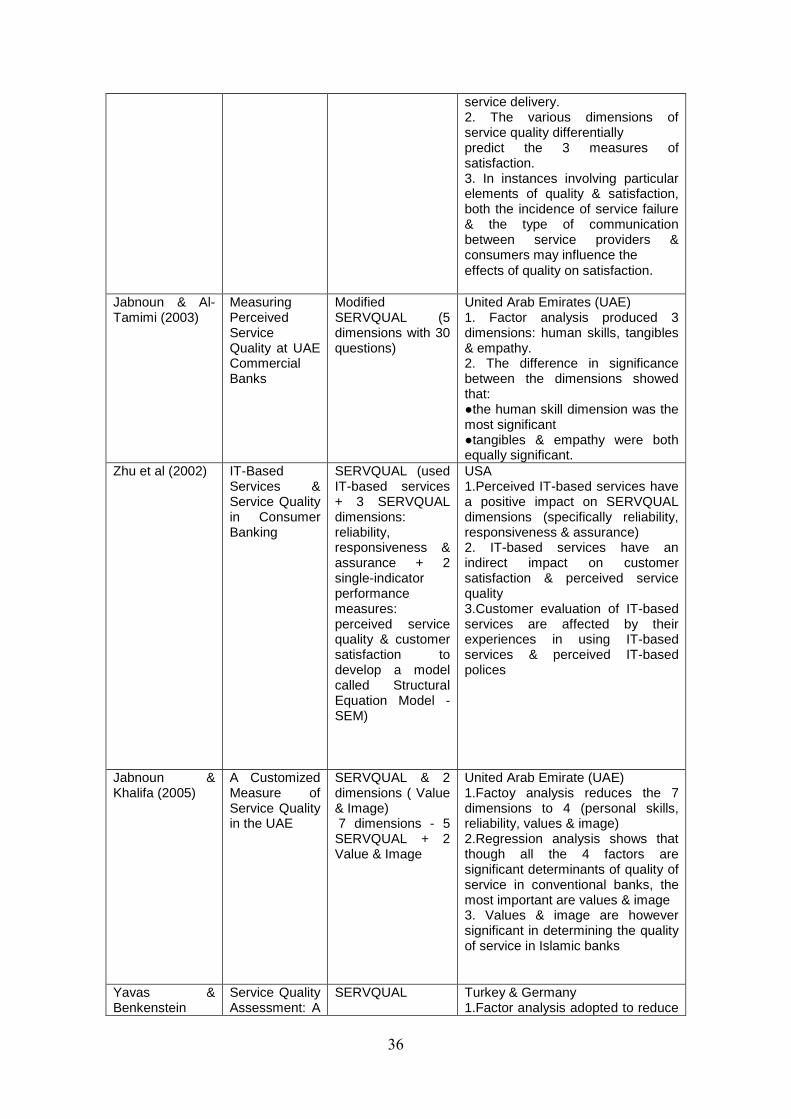
36
service delivery. 2. The various dimensions of service quality differentially predict the 3 measures of satisfaction. 3. In instances involving particular elements of quality & satisfaction, both the incidence of service failure & the type of communication between service providers & consumers may influence the effects of quality on satisfaction.
Jabnoun & Al-Tamimi (2003)
Measuring Perceived Service Quality at UAE Commercial Banks
Modified SERVQUAL (5 dimensions with 30 questions)
United Arab Emirates (UAE) 1. Factor analysis produced 3 dimensions: human skills, tangibles & empathy. 2. The difference in significance between the dimensions showed that: ●the human skill dimension was the most significant ●tangibles & empathy were both equally significant.
Zhu et al (2002) IT-Based Services & Service Quality in Consumer Banking
SERVQUAL (used IT-based services + 3 SERVQUAL dimensions: reliability, responsiveness & assurance + 2 single-indicator performance measures: perceived service quality & customer satisfaction to develop a model called Structural Equation Model -SEM)
USA 1.Perceived IT-based services have a positive impact on SERVQUAL dimensions (specifically reliability, responsiveness & assurance) 2. IT-based services have an indirect impact on customer satisfaction & perceived service quality 3.Customer evaluation of IT-based services are affected by their experiences in using IT-based services & perceived IT-based polices
Jabnoun & Khalifa (2005)
A Customized Measure of Service Quality in the UAE
SERVQUAL & 2 dimensions ( Value & Image) 7 dimensions - 5 SERVQUAL + 2 Value & Image
United Arab Emirate (UAE) 1.Factoy analysis reduces the 7 dimensions to 4 (personal skills, reliability, values & image) 2.Regression analysis shows that though all the 4 factors are significant determinants of quality of service in conventional banks, the most important are values & image 3. Values & image are however significant in determining the quality of service in Islamic banks
Yavas & Benkenstein
Service Quality Assessment: A
SERVQUAL Turkey & Germany 1.Factor analysis adopted to reduce
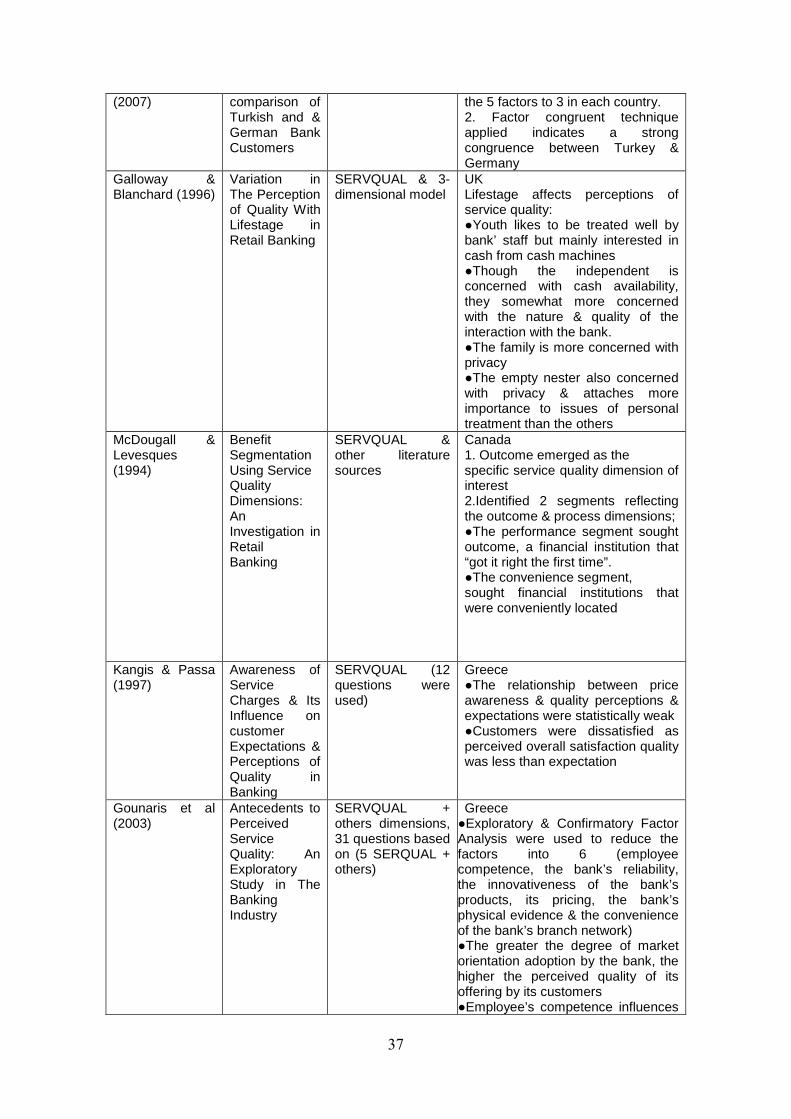
37
(2007) comparison of Turkish and & German Bank Customers
the 5 factors to 3 in each country. 2. Factor congruent technique applied indicates a strong congruence between Turkey & Germany
Galloway & Blanchard (1996)
Variation in The Perception of Quality With Lifestage in Retail Banking
SERVQUAL & 3-dimensional model
UK Lifestage affects perceptions of service quality: ●Youth likes to be treated well by bank’ staff but mainly interested in cash from cash machines ●Though the independent is concerned with cash availability, they somewhat more concerned with the nature & quality of the interaction with the bank. ●The family is more concerned with privacy ●The empty nester also concerned with privacy & attaches more importance to issues of personal treatment than the others
McDougall & Levesques (1994)
Benefit Segmentation Using Service Quality Dimensions: An Investigation in Retail Banking
SERVQUAL & other literature sources
Canada 1. Outcome emerged as the specific service quality dimension of interest 2.Identified 2 segments reflecting the outcome & process dimensions; ●The performance segment sought outcome, a financial institution that “got it right the first time”. ●The convenience segment, sought financial institutions that were conveniently located
Kangis & Passa (1997)
Awareness of Service Charges & Its Influence on customer Expectations & Perceptions of Quality in Banking
SERVQUAL (12 questions were used)
Greece ●The relationship between price awareness & quality perceptions & expectations were statistically weak ●Customers were dissatisfied as perceived overall satisfaction quality was less than expectation
Gounaris et al (2003)
Antecedents to Perceived Service Quality: An Exploratory Study in The Banking Industry
SERVQUAL + others dimensions, 31 questions based on (5 SERQUAL + others)
Greece ●Exploratory & Confirmatory Factor Analysis were used to reduce the factors into 6 (employee competence, the bank’s reliability, the innovativeness of the bank’s products, its pricing, the bank’s physical evidence & the convenience of the bank’s branch network) ●The greater the degree of market orientation adoption by the bank, the higher the perceived quality of its offering by its customers ●Employee’s competence influences
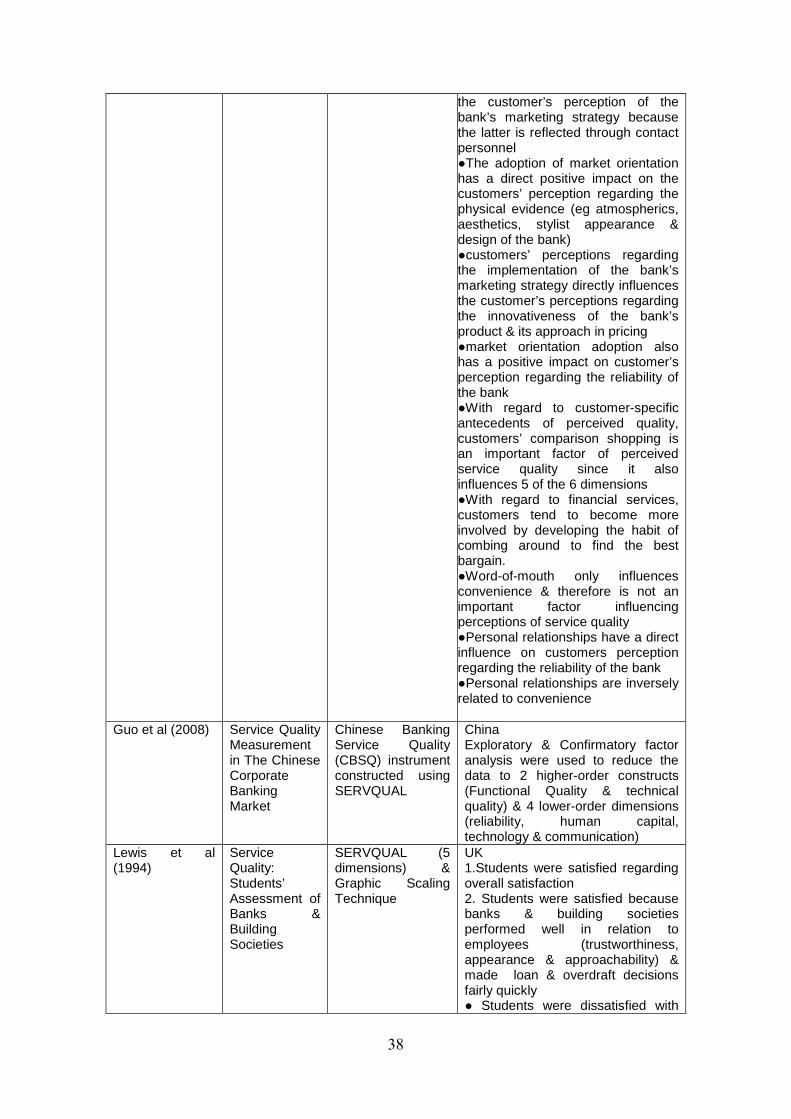
38
the customer’s perception of the bank’s marketing strategy because the latter is reflected through contact personnel ●The adoption of market orientation has a direct positive impact on the customers’ perception regarding the physical evidence (eg atmospherics, aesthetics, stylist appearance & design of the bank) ●customers’ perceptions regarding the implementation of the bank’s marketing strategy directly influences the customer’s perceptions regarding the innovativeness of the bank’s product & its approach in pricing ●market orientation adoption also has a positive impact on customer’s perception regarding the reliability of the bank ●With regard to customer-specific antecedents of perceived quality, customers’ comparison shopping is an important factor of perceived service quality since it also influences 5 of the 6 dimensions ●With regard to financial services, customers tend to become more involved by developing the habit of combing around to find the best bargain. ●Word-of-mouth only influences convenience & therefore is not an important factor influencing perceptions of service quality ●Personal relationships have a direct influence on customers perception regarding the reliability of the bank ●Personal relationships are inversely related to convenience
Guo et al (2008) Service Quality Measurement in The Chinese Corporate Banking Market
Chinese Banking Service Quality (CBSQ) instrument constructed using SERVQUAL
China Exploratory & Confirmatory factor analysis were used to reduce the data to 2 higher-order constructs (Functional Quality & technical quality) & 4 lower-order dimensions (reliability, human capital, technology & communication)
Lewis et al (1994)
Service Quality: Students’ Assessment of Banks & Building Societies
SERVQUAL (5 dimensions) & Graphic Scaling Technique
UK 1.Students were satisfied regarding overall satisfaction 2. Students were satisfied because banks & building societies performed well in relation to employees (trustworthiness, appearance & approachability) & made loan & overdraft decisions fairly quickly ● Students were dissatisfied with
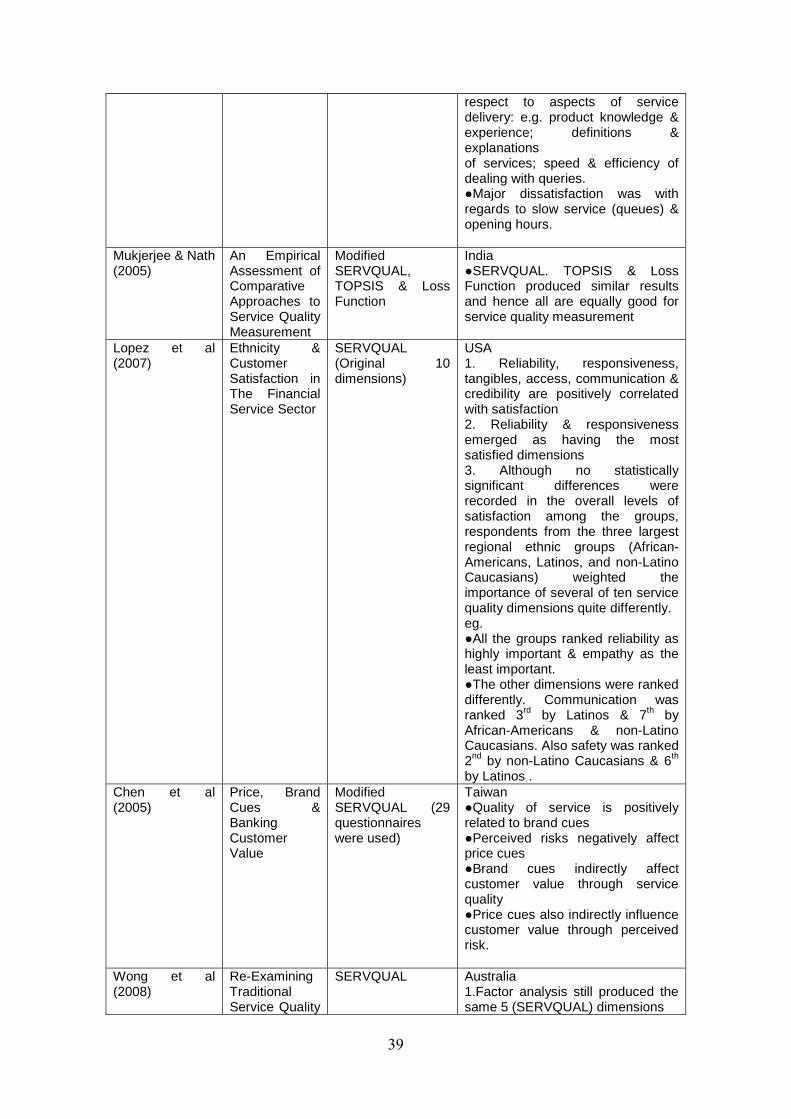
39
respect to aspects of service delivery: e.g. product knowledge & experience; definitions & explanations of services; speed & efficiency of dealing with queries. ●Major dissatisfaction was with regards to slow service (queues) & opening hours.
Mukjerjee & Nath (2005)
An Empirical Assessment of Comparative Approaches to Service Quality Measurement
Modified SERVQUAL, TOPSIS & Loss Function
India ●SERVQUAL. TOPSIS & Loss Function produced similar results and hence all are equally good for service quality measurement
Lopez et al (2007)
Ethnicity & Customer Satisfaction in The Financial Service Sector
SERVQUAL (Original 10 dimensions)
USA 1. Reliability, responsiveness,
tangibles, access, communication & credibility are positively correlated with satisfaction
2. Reliability & responsiveness emerged as having the most satisfied dimensions 3. Although no statistically significant differences were recorded in the overall levels of satisfaction among the groups, respondents from the three largest regional ethnic groups (African-Americans, Latinos, and non-Latino Caucasians) weighted the importance of several of ten service quality dimensions quite differently.
eg. ●All the groups ranked reliability as
highly important & empathy as the least important.
●The other dimensions were ranked differently. Communication was ranked 3rd by Latinos & 7th by African-Americans & non-Latino Caucasians. Also safety was ranked 2nd by non-Latino Caucasians & 6th by Latinos .
Chen et al (2005)
Price, Brand Cues & Banking Customer Value
Modified SERVQUAL (29 questionnaires were used)
Taiwan ●Quality of service is positively related to brand cues ●Perceived risks negatively affect price cues ●Brand cues indirectly affect customer value through service quality ●Price cues also indirectly influence customer value through perceived risk.
Wong et al (2008)
Re-Examining Traditional Service Quality
SERVQUAL Australia 1.Factor analysis still produced the same 5 (SERVQUAL) dimensions
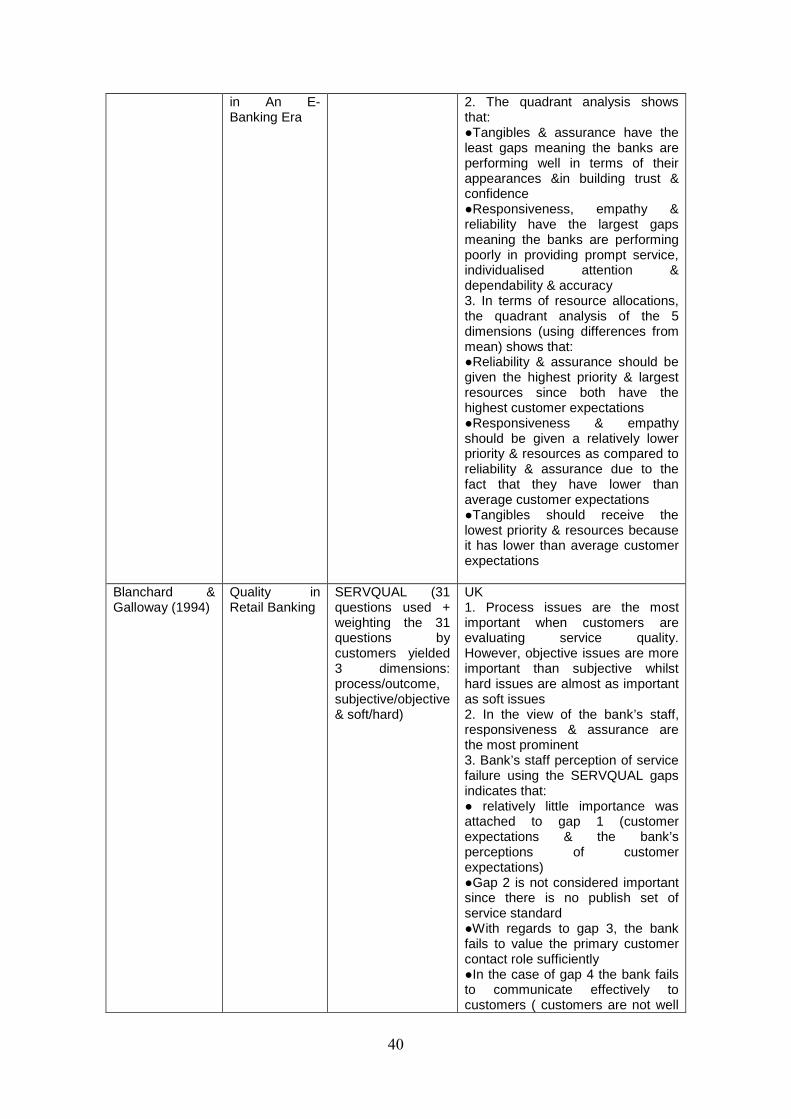
40
in An E-Banking Era
2. The quadrant analysis shows that: ●Tangibles & assurance have the least gaps meaning the banks are performing well in terms of their appearances &in building trust & confidence ●Responsiveness, empathy & reliability have the largest gaps meaning the banks are performing poorly in providing prompt service, individualised attention & dependability & accuracy 3. In terms of resource allocations, the quadrant analysis of the 5 dimensions (using differences from mean) shows that: ●Reliability & assurance should be given the highest priority & largest resources since both have the highest customer expectations ●Responsiveness & empathy should be given a relatively lower priority & resources as compared to reliability & assurance due to the fact that they have lower than average customer expectations ●Tangibles should receive the lowest priority & resources because it has lower than average customer expectations
Blanchard & Galloway (1994)
Quality in Retail Banking
SERVQUAL (31 questions used + weighting the 31 questions by customers yielded 3 dimensions: process/outcome, subjective/objective & soft/hard)
UK 1. Process issues are the most important when customers are evaluating service quality. However, objective issues are more important than subjective whilst hard issues are almost as important as soft issues 2. In the view of the bank’s staff, responsiveness & assurance are the most prominent 3. Bank’s staff perception of service failure using the SERVQUAL gaps indicates that: ● relatively little importance was attached to gap 1 (customer expectations & the bank’s perceptions of customer expectations) ●Gap 2 is not considered important since there is no publish set of service standard ●With regards to gap 3, the bank fails to value the primary customer contact role sufficiently ●In the case of gap 4 the bank fails to communicate effectively to customers ( customers are not well
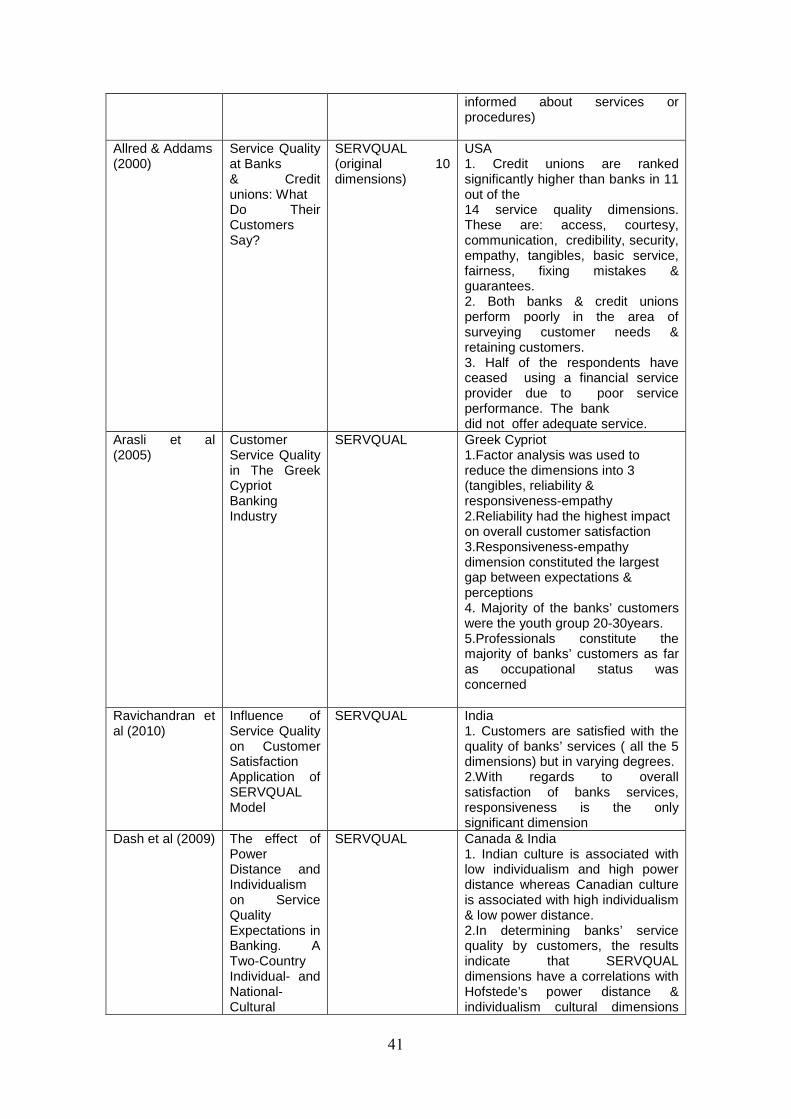
41
informed about services or procedures)
Allred & Addams (2000)
Service Quality at Banks & Credit unions: What Do Their Customers Say?
SERVQUAL (original 10 dimensions)
USA 1. Credit unions are ranked significantly higher than banks in 11 out of the 14 service quality dimensions. These are: access, courtesy, communication, credibility, security, empathy, tangibles, basic service, fairness, fixing mistakes & guarantees. 2. Both banks & credit unions perform poorly in the area of surveying customer needs & retaining customers. 3. Half of the respondents have ceased using a financial service provider due to poor service performance. The bank did not offer adequate service.
Arasli et al (2005)
Customer Service Quality in The Greek Cypriot Banking Industry
SERVQUAL Greek Cypriot 1.Factor analysis was used to reduce the dimensions into 3 (tangibles, reliability & responsiveness-empathy 2.Reliability had the highest impact on overall customer satisfaction 3.Responsiveness-empathy dimension constituted the largest gap between expectations & perceptions 4. Majority of the banks’ customers were the youth group 20-30years. 5.Professionals constitute the majority of banks’ customers as far as occupational status was concerned
Ravichandran et al (2010)
Influence of Service Quality on Customer Satisfaction Application of SERVQUAL Model
SERVQUAL India 1. Customers are satisfied with the quality of banks’ services ( all the 5 dimensions) but in varying degrees. 2.With regards to overall satisfaction of banks services, responsiveness is the only significant dimension
Dash et al (2009) The effect of Power Distance and Individualism on Service Quality Expectations in Banking. A Two-Country Individual- and National- Cultural
SERVQUAL Canada & India 1. Indian culture is associated with low individualism and high power distance whereas Canadian culture is associated with high individualism & low power distance. 2.In determining banks’ service quality by customers, the results indicate that SERVQUAL dimensions have a correlations with Hofstede’s power distance & individualism cultural dimensions
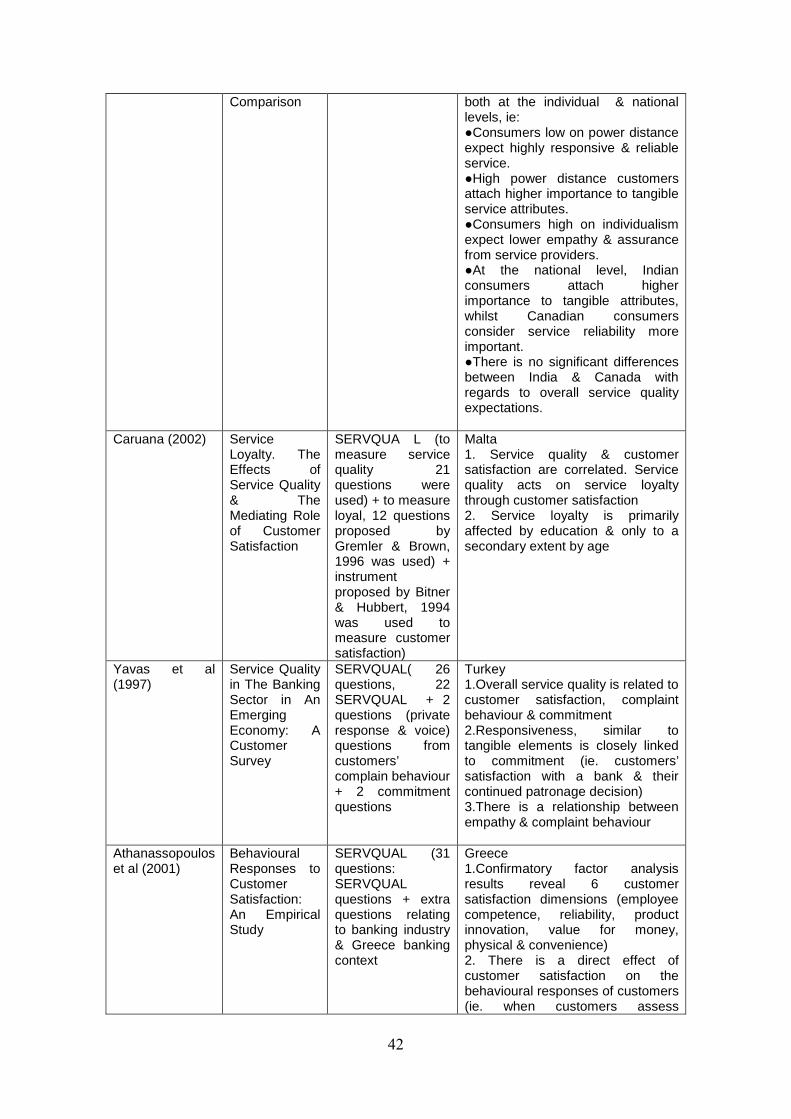
42
Comparison both at the individual & national levels, ie: ●Consumers low on power distance expect highly responsive & reliable service. ●High power distance customers attach higher importance to tangible service attributes. ●Consumers high on individualism expect lower empathy & assurance from service providers. ●At the national level, Indian consumers attach higher importance to tangible attributes, whilst Canadian consumers consider service reliability more important. ●There is no significant differences between India & Canada with regards to overall service quality expectations.
Caruana (2002) Service Loyalty. The Effects of Service Quality & The Mediating Role of Customer Satisfaction
SERVQUA L (to measure service quality 21 questions were used) + to measure loyal, 12 questions proposed by Gremler & Brown, 1996 was used) + instrument proposed by Bitner & Hubbert, 1994 was used to measure customer satisfaction)
Malta 1. Service quality & customer satisfaction are correlated. Service quality acts on service loyalty through customer satisfaction 2. Service loyalty is primarily affected by education & only to a secondary extent by age
Yavas et al (1997)
Service Quality in The Banking Sector in An Emerging Economy: A Customer Survey
SERVQUAL( 26 questions, 22 SERVQUAL + 2 questions (private response & voice) questions from customers’ complain behaviour + 2 commitment questions
Turkey 1.Overall service quality is related to customer satisfaction, complaint behaviour & commitment 2.Responsiveness, similar to tangible elements is closely linked to commitment (ie. customers’ satisfaction with a bank & their continued patronage decision) 3.There is a relationship between empathy & complaint behaviour
Athanassopoulos et al (2001)
Behavioural Responses to Customer Satisfaction: An Empirical Study
SERVQUAL (31 questions: SERVQUAL questions + extra questions relating to banking industry & Greece banking context
Greece 1.Confirmatory factor analysis results reveal 6 customer satisfaction dimensions (employee competence, reliability, product innovation, value for money, physical & convenience) 2. There is a direct effect of customer satisfaction on the behavioural responses of customers (ie. when customers assess
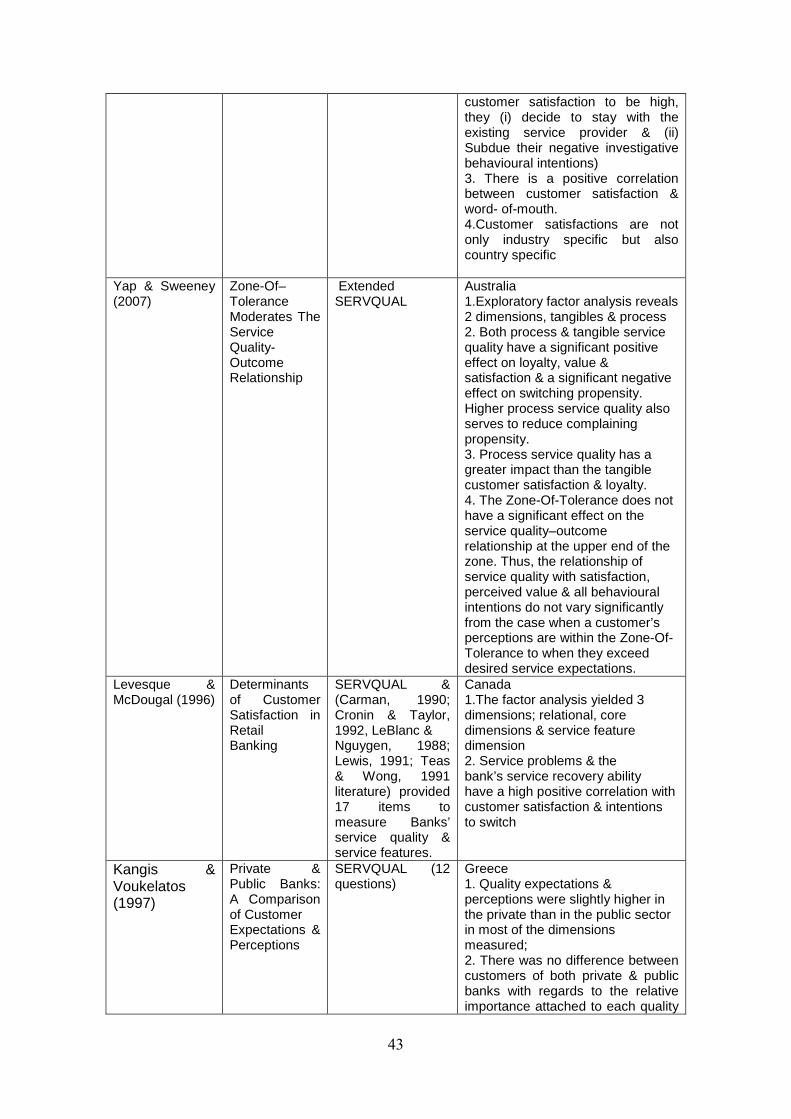
43
customer satisfaction to be high, they (i) decide to stay with the existing service provider & (ii) Subdue their negative investigative behavioural intentions) 3. There is a positive correlation between customer satisfaction & word- of-mouth. 4.Customer satisfactions are not only industry specific but also country specific
Yap & Sweeney (2007)
Zone-Of–Tolerance Moderates The Service Quality-Outcome Relationship
Extended SERVQUAL
Australia 1.Exploratory factor analysis reveals 2 dimensions, tangibles & process 2. Both process & tangible service quality have a significant positive effect on loyalty, value & satisfaction & a significant negative effect on switching propensity. Higher process service quality also serves to reduce complaining propensity. 3. Process service quality has a greater impact than the tangible customer satisfaction & loyalty. 4. The Zone-Of-Tolerance does not have a significant effect on the service quality–outcome relationship at the upper end of the zone. Thus, the relationship of service quality with satisfaction, perceived value & all behavioural intentions do not vary significantly from the case when a customer’s perceptions are within the Zone-Of-Tolerance to when they exceed desired service expectations.
Levesque & McDougal (1996)
Determinants of Customer Satisfaction in Retail Banking
SERVQUAL & (Carman, 1990; Cronin & Taylor, 1992, LeBlanc & Nguygen, 1988; Lewis, 1991; Teas & Wong, 1991 literature) provided 17 items to measure Banks’ service quality & service features.
Canada 1.The factor analysis yielded 3 dimensions; relational, core dimensions & service feature dimension 2. Service problems & the bank’s service recovery ability have a high positive correlation with customer satisfaction & intentions to switch
Kangis & Voukelatos (1997)
Private & Public Banks: A Comparison of Customer Expectations & Perceptions
SERVQUAL (12 questions)
Greece 1. Quality expectations & perceptions were slightly higher in the private than in the public sector in most of the dimensions measured; 2. There was no difference between customers of both private & public banks with regards to the relative importance attached to each quality
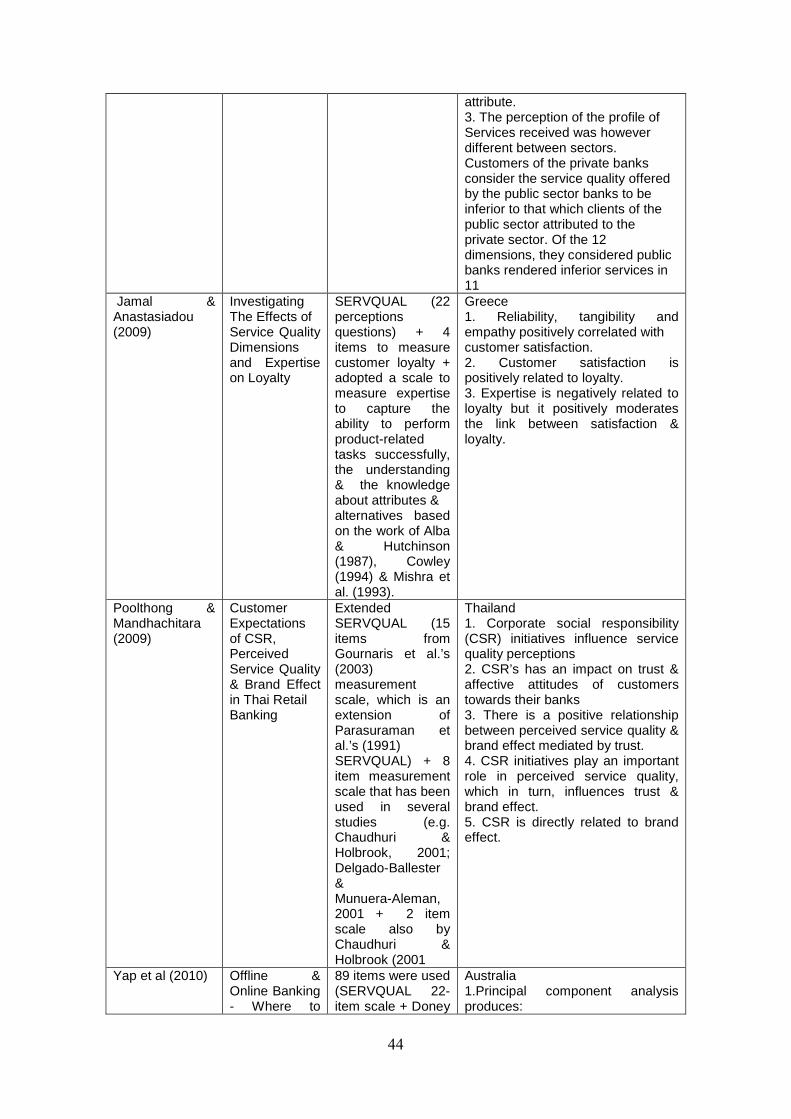
44
attribute. 3. The perception of the profile of Services received was however different between sectors. Customers of the private banks consider the service quality offered by the public sector banks to be inferior to that which clients of the public sector attributed to the private sector. Of the 12 dimensions, they considered public banks rendered inferior services in 11
Jamal & Anastasiadou (2009)
Investigating The Effects of Service Quality Dimensions and Expertise on Loyalty
SERVQUAL (22 perceptions questions) + 4 items to measure customer loyalty + adopted a scale to measure expertise to capture the ability to perform product-related tasks successfully, the understanding & the knowledge about attributes & alternatives based on the work of Alba & Hutchinson (1987), Cowley (1994) & Mishra et al. (1993).
Greece 1. Reliability, tangibility and empathy positively correlated with customer satisfaction. 2. Customer satisfaction is positively related to loyalty. 3. Expertise is negatively related to loyalty but it positively moderates the link between satisfaction & loyalty.
Poolthong & Mandhachitara (2009)
Customer Expectations of CSR, Perceived Service Quality & Brand Effect in Thai Retail Banking
Extended SERVQUAL (15 items from Gournaris et al.’s (2003) measurement scale, which is an extension of Parasuraman et al.’s (1991) SERVQUAL) + 8 item measurement scale that has been used in several studies (e.g. Chaudhuri & Holbrook, 2001; Delgado-Ballester & Munuera-Aleman, 2001 + 2 item scale also by Chaudhuri & Holbrook (2001
Thailand 1. Corporate social responsibility (CSR) initiatives influence service quality perceptions 2. CSR’s has an impact on trust & affective attitudes of customers towards their banks 3. There is a positive relationship between perceived service quality & brand effect mediated by trust. 4. CSR initiatives play an important role in perceived service quality, which in turn, influences trust & brand effect. 5. CSR is directly related to brand effect.
Yap et al (2010) Offline & Online Banking - Where to
89 items were used (SERVQUAL 22-item scale + Doney
Australia 1.Principal component analysis produces:
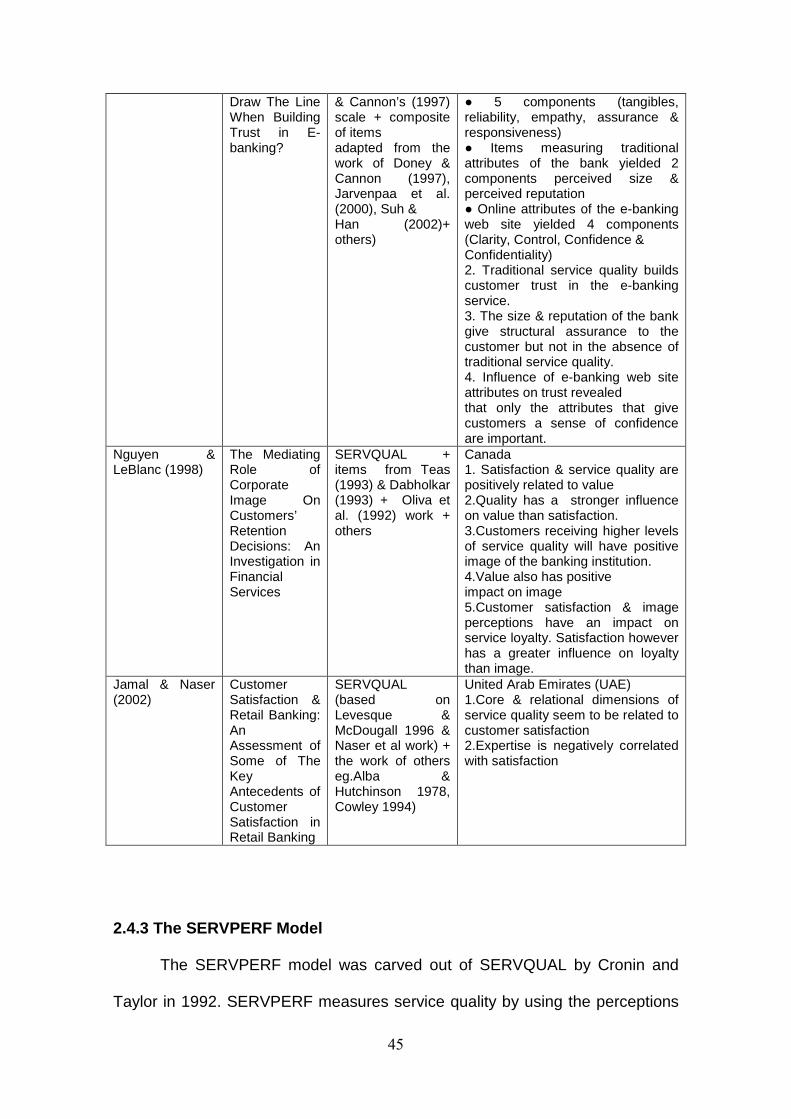
45
Draw The Line When Building Trust in E-banking?
& Cannon’s (1997) scale + composite of items adapted from the work of Doney & Cannon (1997), Jarvenpaa et al. (2000), Suh & Han (2002)+ others)
● 5 components (tangibles, reliability, empathy, assurance & responsiveness) ● Items measuring traditional attributes of the bank yielded 2 components perceived size & perceived reputation ● Online attributes of the e-banking web site yielded 4 components (Clarity, Control, Confidence & Confidentiality) 2. Traditional service quality builds customer trust in the e-banking service. 3. The size & reputation of the bank give structural assurance to the customer but not in the absence of traditional service quality. 4. Influence of e-banking web site attributes on trust revealed that only the attributes that give customers a sense of confidence are important.
Nguyen & LeBlanc (1998)
The Mediating Role of Corporate Image On Customers’ Retention Decisions: An Investigation in Financial Services
SERVQUAL + items from Teas (1993) & Dabholkar (1993) + Oliva et al. (1992) work + others
Canada 1. Satisfaction & service quality are positively related to value 2.Quality has a stronger influence on value than satisfaction. 3.Customers receiving higher levels of service quality will have positive image of the banking institution. 4.Value also has positive impact on image 5.Customer satisfaction & image perceptions have an impact on service loyalty. Satisfaction however has a greater influence on loyalty than image.
Jamal & Naser (2002)
Customer Satisfaction & Retail Banking: An Assessment of Some of The Key Antecedents of Customer Satisfaction in Retail Banking
SERVQUAL (based on Levesque & McDougall 1996 & Naser et al work) + the work of others eg.Alba & Hutchinson 1978, Cowley 1994)
United Arab Emirates (UAE) 1.Core & relational dimensions of service quality seem to be related to customer satisfaction 2.Expertise is negatively correlated with satisfaction
2.4.3 The SERVPERF Model
The SERVPERF model was carved out of SERVQUAL by Cronin and
Taylor in 1992. SERVPERF measures service quality by using the perceptions
46
of customers. Cronin and Taylor argued that only perception was sufficient for
measuring service quality and therefore expectations should not be included as
suggested by SERVQUAL (Baumann et al, 2007). Studies conducted by
researchers like Babakus and Boller, Brady et al., Brown et al., and Zhou cited
in Carrillat et al (2007:473) have supported that of Cronin and Taylor. Therefore,
advocates of SERVPERF hold the view that it is a better alternative to
SERVQUAL.
SERVPERF however has suffered a setback. According to Gilmore and
McMullan (2009), Taylor and Cronin’s examined the psychometric properties of
the SERVPERF scale and the results of a multi-industry study in 1994
suggested that SERVPERF lacks consistency and a generalised factor
structure. As a result of that, the following recommendations were made:
●practitioners should adapt the factor structure of the service quality data for
specific or different settings.
●academic researchers should revisit their research objectives so that a
reliable and valid multidimensional scale of service quality that could be
generalised across service settings should be applied
Sight must not be lost on the fact that, whilst SERVQUAL measures the
quality of service via the difference between the perceptions and expectations
(P-E) of customers, SERVPERF only uses perceptions. Again, SERVPERF
adopts the five dimensions of SERVQUAL and the 22- item scale in measuring
the service quality. Based on the above, Cronin and Taylor cannot claim to have
developed a new model (SERVPERF). In fact it was more or less a suggestion
they made.
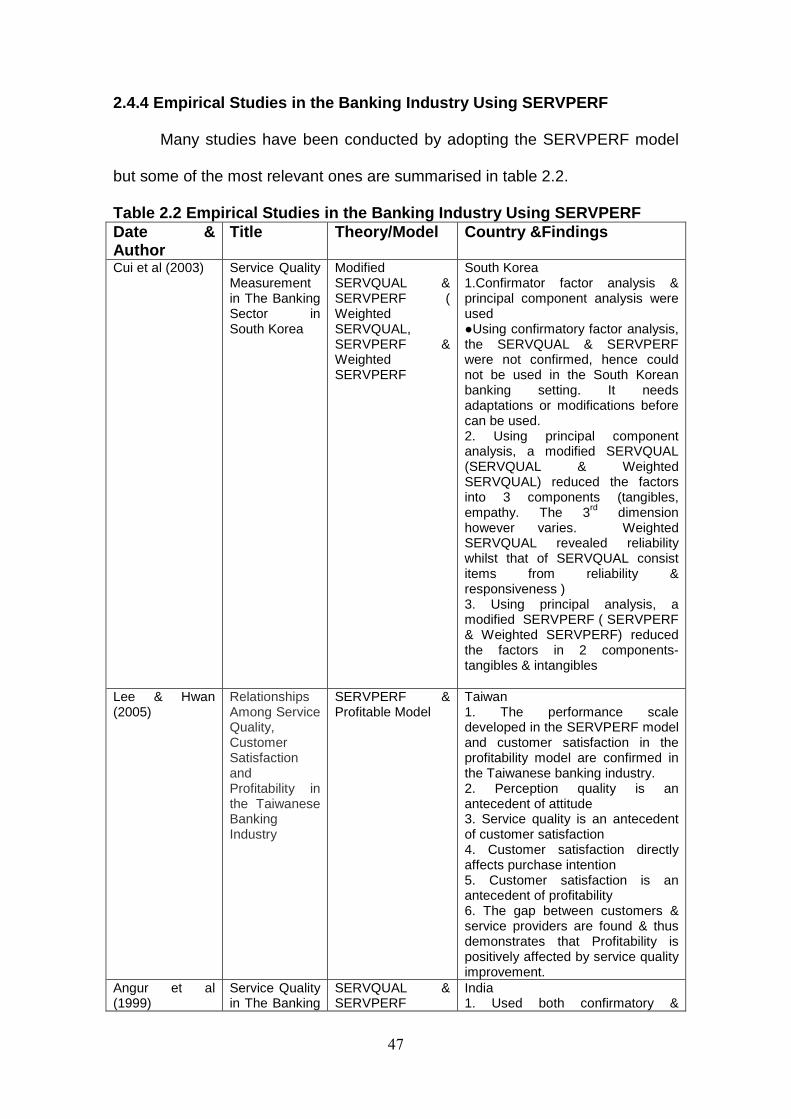
47
2.4.4 Empirical Studies in the Banking Industry Using SER VPERF
Many studies have been conducted by adopting the SERVPERF model
but some of the most relevant ones are summarised in table 2.2.
Table 2.2 Empirical Studies in the Banking Industry Using SERVPERF Date & Author
Title Theory/Model Country &Findings
Cui et al (2003) Service Quality Measurement in The Banking Sector in South Korea
Modified SERVQUAL & SERVPERF ( Weighted SERVQUAL, SERVPERF & Weighted SERVPERF
South Korea 1.Confirmator factor analysis & principal component analysis were used ●Using confirmatory factor analysis, the SERVQUAL & SERVPERF were not confirmed, hence could not be used in the South Korean banking setting. It needs adaptations or modifications before can be used. 2. Using principal component analysis, a modified SERVQUAL (SERVQUAL & Weighted SERVQUAL) reduced the factors into 3 components (tangibles, empathy. The 3rd dimension however varies. Weighted SERVQUAL revealed reliability whilst that of SERVQUAL consist items from reliability & responsiveness ) 3. Using principal analysis, a modified SERVPERF ( SERVPERF & Weighted SERVPERF) reduced the factors in 2 components- tangibles & intangibles
Lee & Hwan (2005)
Relationships Among Service Quality, Customer Satisfaction and Profitability in the Taiwanese Banking Industry
SERVPERF & Profitable Model
Taiwan 1. The performance scale developed in the SERVPERF model and customer satisfaction in the profitability model are confirmed in the Taiwanese banking industry. 2. Perception quality is an antecedent of attitude 3. Service quality is an antecedent of customer satisfaction 4. Customer satisfaction directly affects purchase intention 5. Customer satisfaction is an antecedent of profitability 6. The gap between customers & service providers are found & thus demonstrates that Profitability is positively affected by service quality improvement.
Angur et al (1999)
Service Quality in The Banking
SERVQUAL & SERVPERF
India 1. Used both confirmatory &
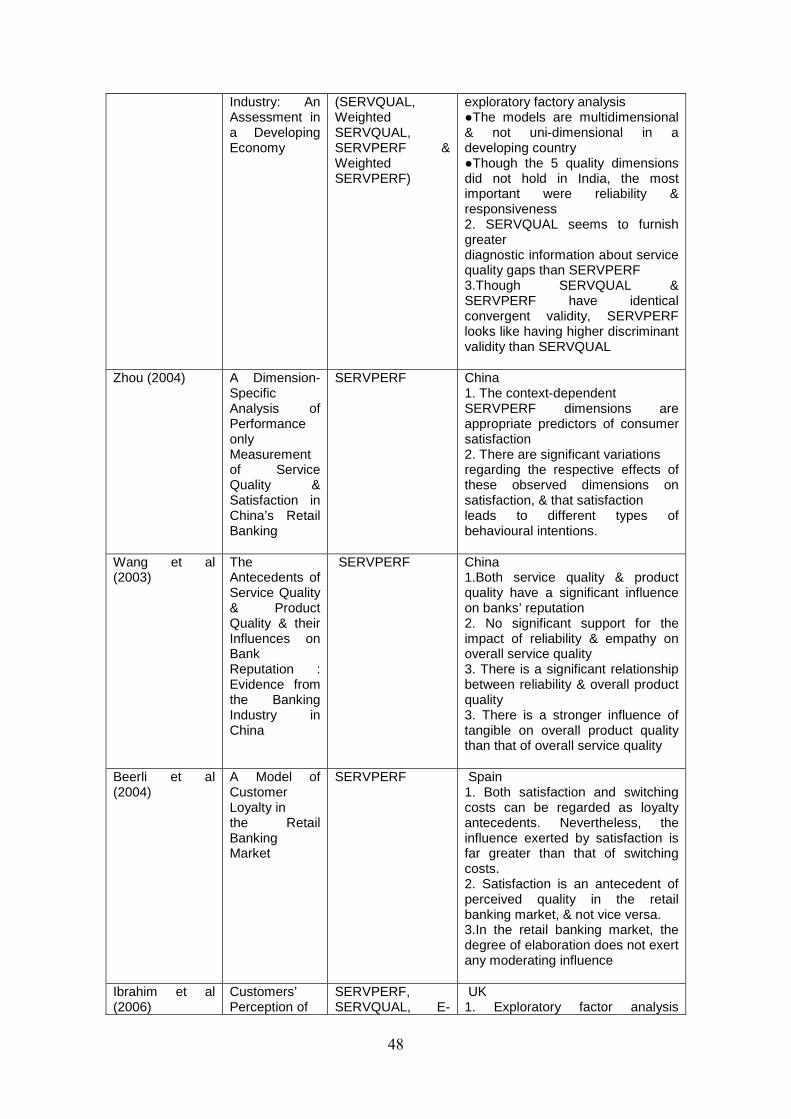
48
Industry: An Assessment in a Developing Economy
(SERVQUAL, Weighted SERVQUAL, SERVPERF & Weighted SERVPERF)
exploratory factory analysis ●The models are multidimensional & not uni-dimensional in a developing country ●Though the 5 quality dimensions did not hold in India, the most important were reliability & responsiveness 2. SERVQUAL seems to furnish greater diagnostic information about service quality gaps than SERVPERF 3.Though SERVQUAL & SERVPERF have identical convergent validity, SERVPERF looks like having higher discriminant validity than SERVQUAL
Zhou (2004) A Dimension-Specific Analysis of Performance only Measurement of Service Quality & Satisfaction in China’s Retail Banking
SERVPERF China 1. The context-dependent SERVPERF dimensions are appropriate predictors of consumer satisfaction 2. There are significant variations regarding the respective effects of these observed dimensions on satisfaction, & that satisfaction leads to different types of behavioural intentions.
Wang et al (2003)
The Antecedents of Service Quality & Product Quality & their Influences on Bank Reputation : Evidence from the Banking Industry in China
SERVPERF China 1.Both service quality & product quality have a significant influence on banks’ reputation 2. No significant support for the impact of reliability & empathy on overall service quality 3. There is a significant relationship between reliability & overall product quality 3. There is a stronger influence of tangible on overall product quality than that of overall service quality
Beerli et al (2004)
A Model of Customer Loyalty in the Retail Banking Market
SERVPERF Spain 1. Both satisfaction and switching costs can be regarded as loyalty antecedents. Nevertheless, the influence exerted by satisfaction is far greater than that of switching costs. 2. Satisfaction is an antecedent of perceived quality in the retail banking market, & not vice versa. 3.In the retail banking market, the degree of elaboration does not exert any moderating influence
Ibrahim et al (2006)
Customers’ Perception of
SERVPERF, SERVQUAL, E-
UK 1. Exploratory factor analysis
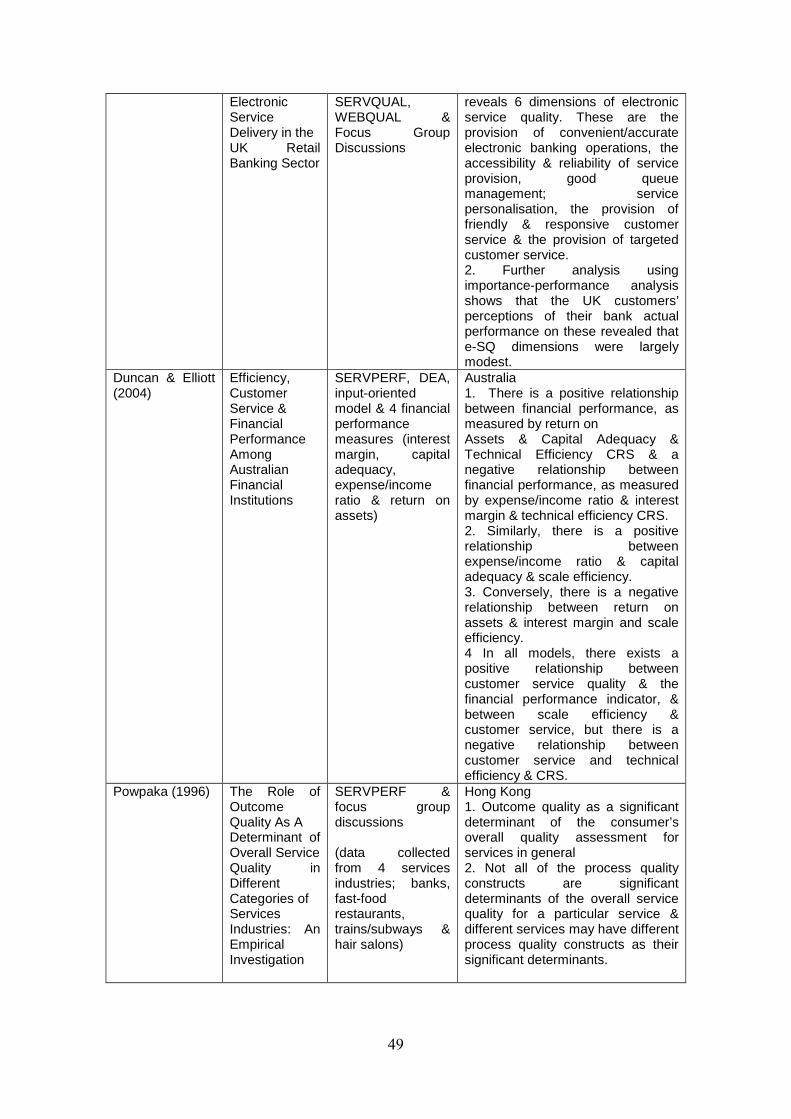
49
Electronic Service Delivery in the UK Retail Banking Sector
SERVQUAL, WEBQUAL & Focus Group Discussions
reveals 6 dimensions of electronic service quality. These are the provision of convenient/accurate electronic banking operations, the accessibility & reliability of service provision, good queue management; service personalisation, the provision of friendly & responsive customer service & the provision of targeted customer service. 2. Further analysis using importance-performance analysis shows that the UK customers’ perceptions of their bank actual performance on these revealed that e-SQ dimensions were largely modest.
Duncan & Elliott (2004)
Efficiency, Customer Service & Financial Performance Among Australian Financial Institutions
SERVPERF, DEA, input-oriented model & 4 financial performance measures (interest margin, capital adequacy, expense/income ratio & return on assets)
Australia 1. There is a positive relationship between financial performance, as measured by return on Assets & Capital Adequacy & Technical Efficiency CRS & a negative relationship between financial performance, as measured by expense/income ratio & interest margin & technical efficiency CRS. 2. Similarly, there is a positive relationship between expense/income ratio & capital adequacy & scale efficiency. 3. Conversely, there is a negative relationship between return on assets & interest margin and scale efficiency. 4 In all models, there exists a positive relationship between customer service quality & the financial performance indicator, & between scale efficiency & customer service, but there is a negative relationship between customer service and technical efficiency & CRS.
Powpaka (1996) The Role of Outcome Quality As A Determinant of Overall Service Quality in Different Categories of Services Industries: An Empirical Investigation
SERVPERF & focus group discussions (data collected from 4 services industries; banks, fast-food restaurants, trains/subways & hair salons)
Hong Kong 1. Outcome quality as a significant determinant of the consumer’s overall quality assessment for services in general 2. Not all of the process quality constructs are significant determinants of the overall service quality for a particular service & different services may have different process quality constructs as their significant determinants.
50
2.5 Gaps in the Literature
It is evident from the literature that numerous studies have been
conducted on customer satisfaction in the banking industry. However, only a
handful of them compared two or more countries. Lasser et al (2000) examined
the service quality perspective and satisfaction in private banking by comparing
the USA and countries in South America and found that Technical/Functional
Quality was better in predicting customer satisfaction than the SERVQUAL-
Based model. In the same vein, Yavas and Benkenstein (2007) compared the
views of banks’ customers in Turkey and Germany. The results showed that
there was a strong congruence between both countries. Dash et al (2009) also
compared the perceptions of customers about the quality of banks’ services in
Canada and India. The results indicated that there was a difference between
both countries. Tangibles and reliability were the most important dimensions
that customers attached importance to in India and Canada respectively. As can
be seen, none of these studies made a comparison between Ghana and Spain,
thus comparing a country from Europe with a country from Africa. In addition,
they only focussed on the general views of customers about the quality of
banks’ services without further segregating and making comparisons about their
sex, age, occupation education and geographical locations.
Though, a few studies such as Lewis (1994), Galloway and Blanchard
(1996), Lopez et al (2007) and Caruana (2002) which concentrated on only one
country classified the banks’ customers into sex, age, education, occupation
and race, they neither used all of these variables (sex, age, education and
occupation) at the same time nor broke them according to geographical
locations. Lewis (1994) only delved into the perceptions of students about the
51
service quality of banks and building societies in the UK and found that the
students were generally satisfied. Galloway and Blanchard also found that life
stage (age) affected the perceptions of banks’ service quality in the UK. For
example whilst the youth wanted to be treated well, the independent was
concerned with cash availability. Lopez et al (2007) also researched into the
views of ethnic groups about the quality of banks’ services in the USA. The
results revealed that although there were no statistical differences in overall
satisfaction among the three largest groups (African-Americans, Latinos and
Non-Latino Caucasians) they weighted most of the ten quality dimensions
differently. The study of Caruana (2002) also showed that service loyalty is
primarily influenced by education and only to a secondary extent by age.
It is however seen from the customer satisfaction literature that
perceptions are influenced by a myriad of factors. For instance, Kotler et al
(1999) posit that individual’s consumption behaviour is influenced by personal
characteristics like age and life-cycle, occupation, economic situation, lifestyle
and personality and self-concept. Zeithaml and Bitner, cited in Kangis and
Voukelatos (1997:280) on the other hand, advance that factors like service
encounters, the evidence of service, image and price constitute customers
perceptions of service quality, satisfaction and value. Similarly, Abdullah and
Rozario (2009) posit that, the level of customer satisfaction may be influenced
by various internal and external factors.
There is no doubt that a vacuum exists in the literature that needs to be
investigated thoroughly. Hence, the main objective of this study is to investigate
the perceptions of the quality of banks’ service by customers in both Ghana and

52
Spain in respect of their sex, age, education, occupation and geographical
locations.
Having finished the literature review, the next chapter looks at the
structure of the banking industry in Ghana and Spain.

53
CHAPTER THREE
THE STRUCTURE OF THE BANKING INDUSTRY IN GHANA AND SPAIN
3.1 Introduction
This chapter discusses the structure of the banking industry in Ghana
and Spain. It also throws light on the profile of Ghana and Spain as well as the
regions within these countries chosen for the study.
3.2 The Profile Ghana
The Republic of Ghana is in West Africa. Accra is the capital. It borders
Togo to the east, the Gulf of Guinea to the south, Cote d’Ivoire to the west and
Burkina Faso to the north. Its climate is tropical (see figure 3.1 for map of
Ghana). English is the official language. The major ethnic groups are Akans,
Ewes, Ga-Dangme, Mole-Dagamba. It has a population of about 23 million
(Wikipedia). The major religions are christianity, islam and traditional. It is
endowed with natural resources like gold, bauxite, manganese, timber and
diamond. Agriculture is the mainstay of the economy It is divided into ten
administrative regions; Ashanti, Brong-Ahafo, Greater Accra, Northern, Volta,
Western, Eastern, Central, Upper-East and upper-West. The regions are
subdivided into 169 districts Ghana, (Ghana Statistical Service 2000).
3.2.1 The Ashanti Region
Ashanti Region is situated in the middle of Ghana. It shares boundaries
with Eastern region to east, Brong-Ahafo to the north, Western Region to the
south-west and Central Region to the south. The capital of the region is Kumasi

54
and accounts for nearly one-third of the population of the region. Kumasi is also
the second capital of Ghana (Ghanadistricts.com). The region has a population
of 3612950 (Ghana Statistical Service 2000). Majority of the people in this
region are akans. It has 27 administrative districts. These are Adansi North,
Adansi South, Afigya-Kwabre, Ahafo Ano North, Ahafo Ano South, Amansie
West, Amansie Central, Asante Akim North Municipal, Asante Akim South,
Atwima Kwanwoma, Atwima Mponua, Atwima Nwabiagya, Bosomtwe, Bosome
Freho, Ejusu-Juaben Municipal, Ejura-Sekyedumase, Kumasi Metropilitan,
Kwabre, Mampong Municipal, Obuasi Municipal, Offinso Municipal, Offinso
North, Sekyere Afram Plains, Sekyere Central, Sekyere East, Sekyere South
(see figures 3.1 and 3.2 for map of Ghana and map of Ashanti Region) .
The mainstay of the economy is agriculture, followed by commerce. The
region is endowed with gold, bauxite and timber. These make Ashanti region is
one of the economic power houses in Ghana.
Fig. 3.1 Map of Ghana Showing All the Regions
Fig. 3.2 Map of Ashanti Region
55
(a) Kumasi Metropolis: Kumasi is the second capital of Ghana. It is also not
only the capital of Ashanti region but also the Kumasi Metropolitan District. It
can be found in the transitional forest zone. It is bordered to the north by
Kwabre east district, Ejisu- to the east, Juaben Municipal, to west, Atwima
district and to the east, Bosomtwe (see fig. 3.3 for map of Ashanti Region). It is
called the garden city of West Africa because of its beautiful layout and many
species of flowers and plants (GhanaDistrict.Com). According to the Ghana
Statistical Service (2000), it has 90 communities with a population of about
1517000 accounting for a third of the population in the Ashanti region. Asantes
are the largest ethnic group in the metropolis.
The backbone of the economy is commerce constituting 71%. This is
followed by manufacturing/industry 24% and primary production which includes
agriculture and quarrying/sand winning. There are six universities in the
metropolis. The dominant religion is Christianity representing 78.8%. The
figures for Islam, Traditional religion and others are 16%, 0.3% and 0.7%
respectively. Those without any religion account for 4.2%. There are many
financial institutions in the Kumasi Metropolis which include banking, insurance
and forex bureaus. The banking institutions are mainly commercial,
development, merchant and rural banks. According to the 2000 population
census, there are 67434 houses in the metropolis, (Ghana Statistical Service,
2000).

56
Fig.3.3 MAP OF ASHANTI REGION SHOWING ALL THE DISTR ICTS
(b)Bekwai Municipal: Bekwai is the capital of the Bekwai Municipal. It shares
boundaries to the west with Amansie West district, to the north, Bosomtwe
district, to the south by both Adansi West and South districts and to the east
Asante Akim South district. It lies within forest dissected plateau physiographic
region and covers a total land area of about 633 squared kilometres
(GhanaDistrict.Com). It is located in the southern part of the Ashanti Region
(see figure 3.3 for map of Ashanti Region). The population of the municipality is
219508 (Ghana Statistical Service, 2000). There are 413 communities in the
municipal. The main occupation in the municipal is agriculture accounting for
58.2% of the population. Lake Bosomtwe, the only natural lake in Ghana is
found in the municipality. Apart from being the main tourist site, it also serves as
the major source of employment for fishermen in the surrounding communities.
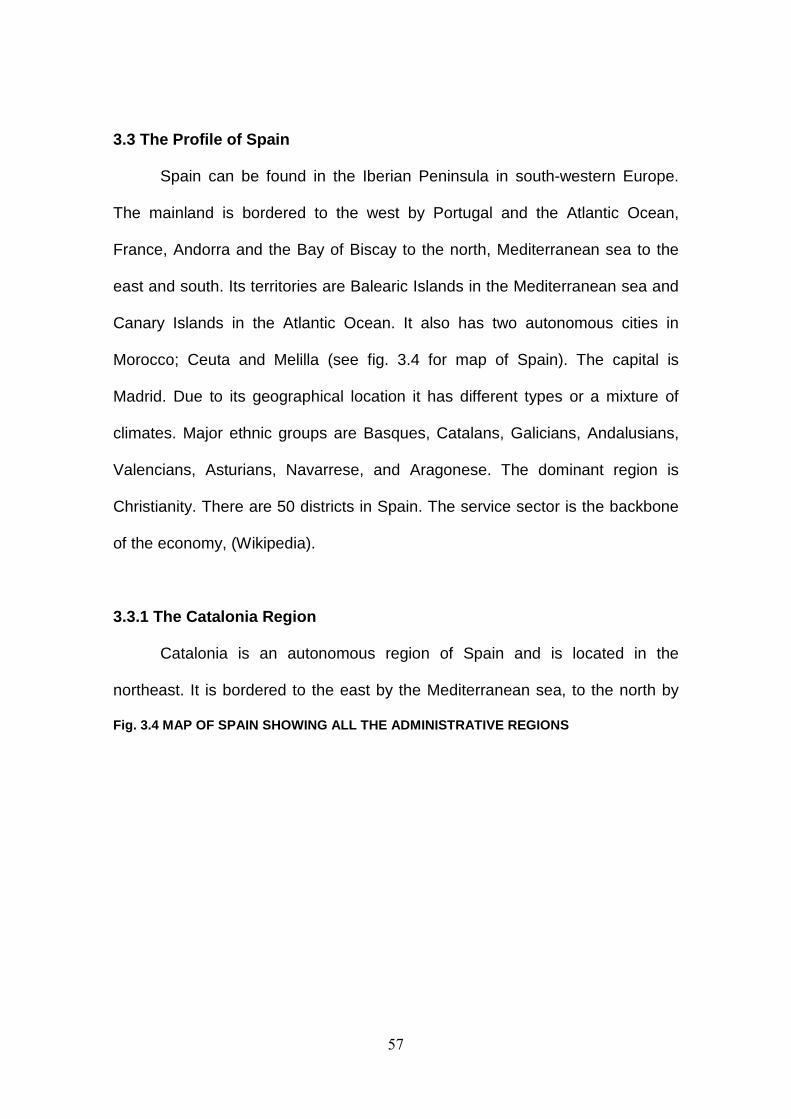
57
3.3 The Profile of Spain
Spain can be found in the Iberian Peninsula in south-western Europe.
The mainland is bordered to the west by Portugal and the Atlantic Ocean,
France, Andorra and the Bay of Biscay to the north, Mediterranean sea to the
east and south. Its territories are Balearic Islands in the Mediterranean sea and
Canary Islands in the Atlantic Ocean. It also has two autonomous cities in
Morocco; Ceuta and Melilla (see fig. 3.4 for map of Spain). The capital is
Madrid. Due to its geographical location it has different types or a mixture of
climates. Major ethnic groups are Basques, Catalans, Galicians, Andalusians,
Valencians, Asturians, Navarrese, and Aragonese. The dominant region is
Christianity. There are 50 districts in Spain. The service sector is the backbone
of the economy, (Wikipedia).
3.3.1 The Catalonia Region
Catalonia is an autonomous region of Spain and is located in the
northeast. It is bordered to the east by the Mediterranean sea, to the north by
Fig. 3.4 MAP OF SPAIN SHOWING ALL THE ADMINISTRATIV E REGIONS
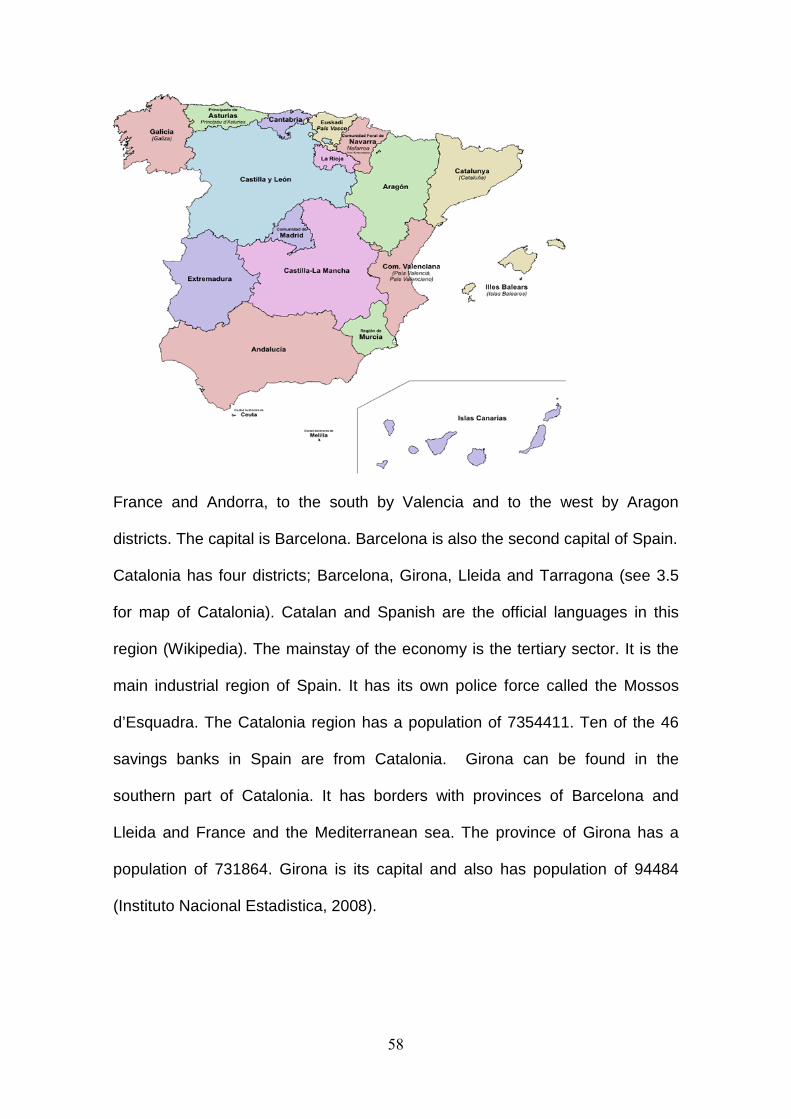
58
France and Andorra, to the south by Valencia and to the west by Aragon
districts. The capital is Barcelona. Barcelona is also the second capital of Spain.
Catalonia has four districts; Barcelona, Girona, Lleida and Tarragona (see 3.5
for map of Catalonia). Catalan and Spanish are the official languages in this
region (Wikipedia). The mainstay of the economy is the tertiary sector. It is the
main industrial region of Spain. It has its own police force called the Mossos
d’Esquadra. The Catalonia region has a population of 7354411. Ten of the 46
savings banks in Spain are from Catalonia. Girona can be found in the
southern part of Catalonia. It has borders with provinces of Barcelona and
Lleida and France and the Mediterranean sea. The province of Girona has a
population of 731864. Girona is its capital and also has population of 94484
(Instituto Nacional Estadistica, 2008).
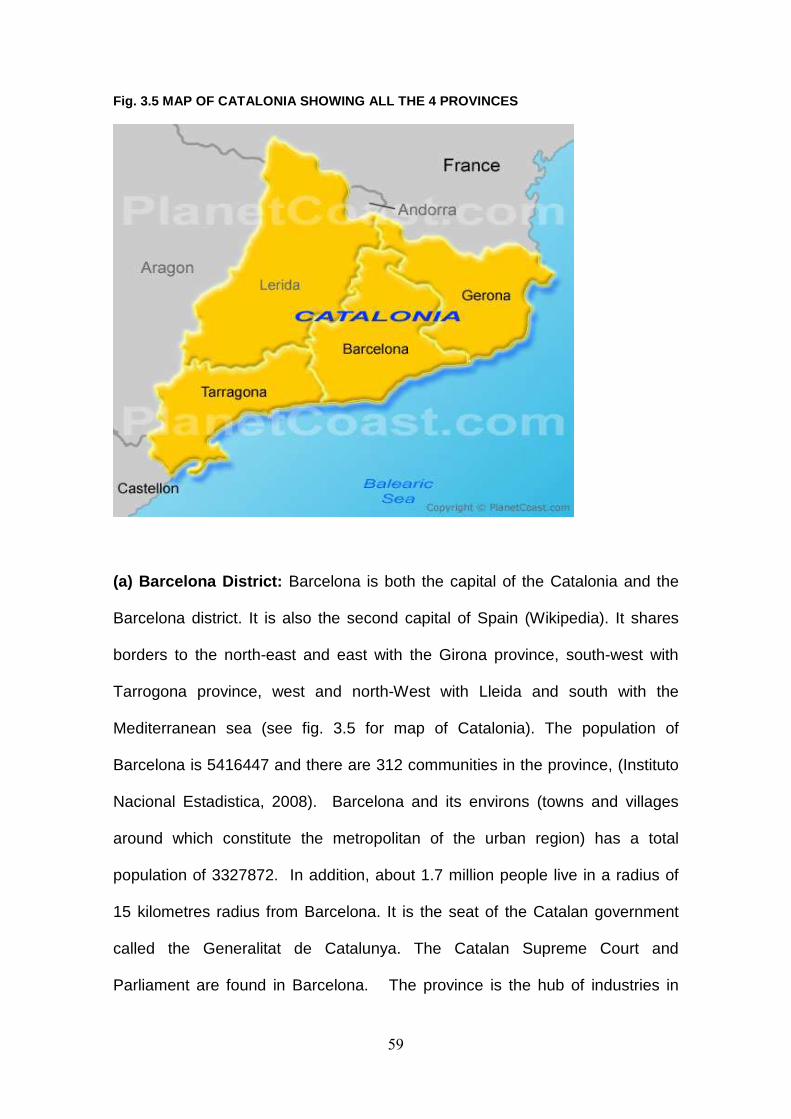
59
Fig. 3.5 MAP OF CATALONIA SHOWING ALL THE 4 PROVINC ES
(a) Barcelona District: Barcelona is both the capital of the Catalonia and the
Barcelona district. It is also the second capital of Spain (Wikipedia). It shares
borders to the north-east and east with the Girona province, south-west with
Tarrogona province, west and north-West with Lleida and south with the
Mediterranean sea (see fig. 3.5 for map of Catalonia). The population of
Barcelona is 5416447 and there are 312 communities in the province, (Instituto
Nacional Estadistica, 2008). Barcelona and its environs (towns and villages
around which constitute the metropolitan of the urban region) has a total
population of 3327872. In addition, about 1.7 million people live in a radius of
15 kilometres radius from Barcelona. It is the seat of the Catalan government
called the Generalitat de Catalunya. The Catalan Supreme Court and
Parliament are found in Barcelona. The province is the hub of industries in
60
Spain and three-fourth of industries in Catalonia is in the province. Barcelona is
also the centre of tourist attraction. There are 10 universities in the province and
a host of banks. It has nine political districts called comarques.
(b) Girona District : It is in the north-eastern part of Spain. It is bordered to the
north by France, east and south-east by the Mediterranean sea, to the west by
the districts of Barcelona and Lleida (see fig. 3.5 for map of Catalonia). The
capital of the province is Girona (Wikipedia). According to the Instituto Nacional
Estadistica (2008), there are 731864 people who live in the province. Two
hundred and one communities constitute the Girona province. The University of
Girona is the university in the province. The service sector is the mainstay of the
economy followed by the industrial sector. There are six political districts
(comarques).
3.4 The Traditional Retail Banking
Traditional retail banking is where banks undertake transactions with
individual customers rather than with corporate organisations. The main
traditional retail banking services of banks all over the world are to accept
deposits from customers whose monies are idle (money they may not want to
spend for the time being) and lend to others, (Heffernan, 1996). Thus,
according to Heffernan (1996) banks act as intermediaries between depositors
and borrowers. In so doing they also create assets for themselves.
3.4.1 Deposit Account
There are three types of deposit account; current, savings and fixed.

61
(a) Current Deposit/Account: this deposit is also called demand deposit.
According Rose (1993), depositors can withdraw their money by cheque
whenever they want. This account does not attract interest since the amount is
paid on demand without any restrictions. The bank however charges
commission on each cheque issued.
(b) Savings deposit/Accounts: holders of this account withdraw their money
with a passbook. Some banks restrict the number of times and amount of
money that can be withdrawn. This account earns interest, (Rose 1993).
(c) Fixed Deposit Accounts: holders of this account are paid their money after
the expiry of a specific time agreed upon between the customer and the bank
when the account is being opened. The customer cannot withdraw the whole or
part of the money until the specific time agreed on elapses. Hence it is called
time deposit (Munn et al 1991). This account attracts interest but the rate
depends of the length of time, the longer the time, the higher the interest rate
and vice versa.
3.4.2 Loans: these deposits are in turn lent to both individuals and corporate
bodies in the form of loans and advances. Banks generally lend money in the
form of overdraft, loans, cash credit and discounting bills.
(a) Overdraft: this facility is granted to current account holders. Munn et al
(1991) claim a bank allows a holder of this account to withdraw a specific
amount over and above the credit balance of his account. Repayment is done
through deposits in his account when and where necessary. Interest is charged
by the bank on the actual amount withdrawn. The rate of interest charged is
generally higher than a loan.

62
(b) Loan: when a bank lends money to its customer for a specific period it is
called a loan. A loan is normally given against the security of a property such
as a house or personal security called a collateral security (Mann et al 1991).
Nowadays, banks grant loans to workers against their payrolls. Interest is
charged on the full amount even if it is utilised. Withdrawal and repayment are
done in a lump sum or in instalments depending on the bank. The interest rate
charged on a loan depends on the type of loan granted. Generally, there are
three types of loans that are granted by banks to their customers, short-term,
medium-term and long-term. Short-term loans are granted between a month
and a year. The period for a medium-term loans is also from one year to three
years whilst a long-term loan is granted for over 3 years. Medium and long-term
loans are given to corporate organisations. It is intended for the setting up of
new businesses and expansion or renovation of businesses such as the
purchasing of equipment and construction of a new factory building.
Rose (1993) has summarised other services offered by banks. These
include giving personal advice to customers regarding investment ventures.
They also engage in trust services by acting on behalf of individuals and firms to
manage and protect their property or issue and redeem their securities for a fee.
and issuing of credit cards and cheques. Banks also engage in foreign
exchange trading (buying and selling of foreign currencies), remittances
services (sending and receiving money to and fro the country on behalf of
customers) and payment of bills for customers, acting as referees in connection
with the financial positions of customers, supplying trade information to
customers and act as places of safe keeping of valuable assets of customers
such as gold.
63
3.5 Innovations in Traditional Retail Banking
Due to technological innovations, the banking industry all over the world
has undergone many drastic changes. This is manifested in the organisational
structure and the products and services delivered to the public. According to
Frei et al (1998), technological innovation in retail banking has been spurred on
by many factors particularly in terms of new distributive channel systems such
as the personal computer (PC). Rullis and Sloka (2010) put forward that a wide
range of products and services have either been introduced or been improved
upon thereby reducing service time and improving their efficiency. Key among
these is information technology such as telephone, personal computer (PC) and
the internet. Johns and Perrot (2008) indicate that financial organisations are
using technology in a bid to be more competitive, make it convenient for
customers and reduce costs. In addition, the banking industry tends to develop
and foster long-term relationships than many other industries. Corroborating
this, Olatokun and Igbinedion (2009) claim that the cost of ATM transaction is
lower than the cost of transaction by a teller. In the same vein, Johnson (2007)
opines that customers are committed to PC banking because of convenience
since it offers a 24-hour service with no geographical limitations, high speed of
service and transaction automation.
The industry has seen a lot of expansion in terms of size. There has
been an increase in the number of branches while at the time trimming down
the number of employees thereby reducing the cost of operation, ( Rullis and
Sloka (2010). Also, there has been a surge in the number of banks and
competition has been very stiff. Through internet, telephone and personal (PC)
banking, banks are able to advertise their services and products. Customers are
64
able to communicate to their bankers via electronic mails and enquiries about
their accounts, loan applications, payment of bills, transferring funds, making
deposits and withdrawals, (Rullis and Sloka, 2010). To encourage customers
adopt online services, Herington and Weaven (2007) stipulate that banks are
rewarding customers for using online services and penalising those using offline
services. For instance they indicated that many banks charge premium fees for
customers who withdraw money from retail shop-fronts instead of ATMs.
Furthermore, banks have come out with specific online services and products
that can only be accessed or managed online.
3.6 The Structure of the Banking Industry in Ghana
The banking industry in Ghana is a very complex one. According to the
World Bank (2004), the financial system in Ghana has been stratified into three;
formal, semi-formal and informal. Banks fall under the formal system. These are
institutions which are limited liability companies licensed by the Bank of Ghana
to provide financial services. There are 162 banks operating in Ghana, Bank of
Ghana, 2010). Of this, 27 are commercial and development banks and 135 are
rural banks. According to the Bank of Ghana, the commercial banks have a
mixed ownership structure and different customer base (Bank of Ghana, 2004).
The total assets of the three largest commercial banks constitute 55% in the
banking industry. There are also five commercial banks which operate on a very
small scale. The share of the total assets of the foreign, development and
merchants banks are 30%. This portrays that the banking sector in Ghana is
controlled by a few banks.
65
Rural and community banks are also commercial banks but cannot go
into foreign exchange operations and have very low minimum capital
requirements, (World Bank, 2004). They are unit banks owed by people in the
community since they are the shareholders. Their customers are from the
communities but have however opened mobilisation centres in towns and cities.
They were set up to expand savings mobilisation and credit services to the rural
communities which were not served by commercial and development banks.
Commercial banks are involved in the traditional banking business
focussing on universal retail services. The focus of development banks activities
is on medium and long-term financing whilst merchant banks are fee-based
institutions and are largely involved in corporate banking, (Buchs and Mathisen
2005). It seems it is very difficult of late to draw a borderline between the banks
as they all offer almost the same services. Bawumia et al (2005) assert that
regulation rather competition defined the structure and the kinds of products
and services banks can sell, the type of assets and liabilities it can hold and
issue as different kinds of banking institution have been licensed to serve varied
customers. Non-banking financial institutions compete with banks regarding
similar financial instruments and services. To that effects there are no
differences in the products and services banks offer.
The Bank of Ghana (2006) indicates the Trust Bank was the first to
introduce ATM services in Ghana in the 1980s. Up to date only a few banks
operate these services. Apart from that, these services are not available all over
the country. In addition, with the exception of a few banks, customers of one
bank cannot withdraw money from ATM machines of other banks. There are no
66
local credit cards however international ones are accepted by ATM machines.
Telephone and internet banking are also available in few banks in Ghana.
The general problems encountered by customers as indicated by the
Bank of Ghana (2004) are that high charges of banks and tariffs have made
banks services very expensive. This has served as disincentive to customers
and has incurred the displeasure of all stakeholders including monetary
authorities, politicians, corporate bodies and the general public. According to
the Bank of Ghana (2004), bank charges and tariffs in Ghana are the highest in
Africa and even higher than the U.S.A. and UK. Banks adopt discriminatory
tactics in charging for their services. This is because, charges vary from
customer to customer since it is based on the turnover of customers and the
number of transactions per month and whether the customer is an account
holder or not. Non-account holders pay higher charges than account holders.
The argument the banks put forward are that they charge high to meet the high
overhead cost which include the maintenance of new information technology
equipment.
Customers are also not attracted to open savings accounts because of
the low interest rates paid by banks. Dadzie et al (2003) contend that banks in
Ghana are heavily concentrated in the urban areas and therefore making
patronage by rural dwellers very expensive. This is attributed to the fact that
they have to travel long distances to access the services of banks spending a
lot of time and money. The research findings of Owusu-Frimpong (1999)
suggest that though accessibility to banks are convenient, the provision of
services are slow and time-consuming. The banking penetration ratio is one
bank branch office per 54,000 inhabitants whilst formal banking reaches only
67
5% of the population, (Buchs and Mathisen 2005). The banks are mostly
concentrated in the Greater Accra Region with a share of 35% of bank
branches though the region accounts for only 13% of the total population. This
implies that the chunk of the people in other parts of the country are either cut
off from bank services or have to walk long distances to have access to these
facilities.
3.7 The Structure of the Banking Industry in Spain
The Spanish banks are of three forms. This is composed of commercial,
savings and co-operative banks, (Delgado et al, 2006 and Hernando and
Pages, 2001). Commercial banks are public limited liability companies which
main function is corporate banking or corporate business. They are owned by
shareholders and residual decisions rest on them but however delegate them to
the management team of the bank. Savings banks on the other hand are non-
for-profit institutions. They are private foundations and are controlled by
representatives of regional governments, employees, depositors and founding
institutions which may be civic, religious, or government related institution.
Decisions rights in savings banks are allotted to the general assembly which
comprises representatives elected by public authorities which is up to 50%, by
depositors, employees and founding institutions. The general assembly elects
the board of directors which in turn elects the management team. Delgado et al,
(2006) and Hernando and Pages (2001) intimate that savings banks are non-
for-profit institutions because their profits are used as retained earnings or for
social or cultural programmes for the benefit of communities. Co-operative
banks are owned by their members and they are also the decision-making
68
body. The traditional roles of both savings and co-operatives banks are savings
mobilisation mainly from households and lending them to households, small and
medium sized firms.
The banking sector has undergone a major transformation. There is now
liberalisation and banks are now free to determine their interest rates, fees and
commissions. In addition, artificial barriers between commercial, savings and
co-operative have been removed, (Benito, 2008). Competition between the
banks has been intensified. The implication of this is that there will be efficiency
in the banking industry. Like Ghana, there is no difference between the banks in
the area of services and products offered. The Banco de España (2009)
indicates that there were 195 banks in Spain. Out of this 66 were commercial
banks, 45 were savings banks and the remaining 83 being co-operative banks.
The Banco de España (2010) intimates that due to the prolonged period of
strong economic growth over the years, the banking sector has grown in size to
keep with the volume of financial transactions which has reached
unprecedented levels. According to Jimenez et al (2008), Spain has the largest
per capita bank branch density in Europe. Also the number of bank branches
has increased in the last five years at an annual rate of 4%.
Apart from the traditional retail banking products and services of banks,
there have been innovative products and services on the market thanks to
technological advancement. Gallego et al (2002) posit that, generally the size
of banks in Spain are small by European standard in terms of assets, loans or
deposits. The Banco de España (2007) intimates that banks Automated Teller
Machines (ATM) network in Spain is the densest in Europe is almost 16 per
10,000 inhabitants in 2006 over 16 years of age (see table 3.1). The figure for
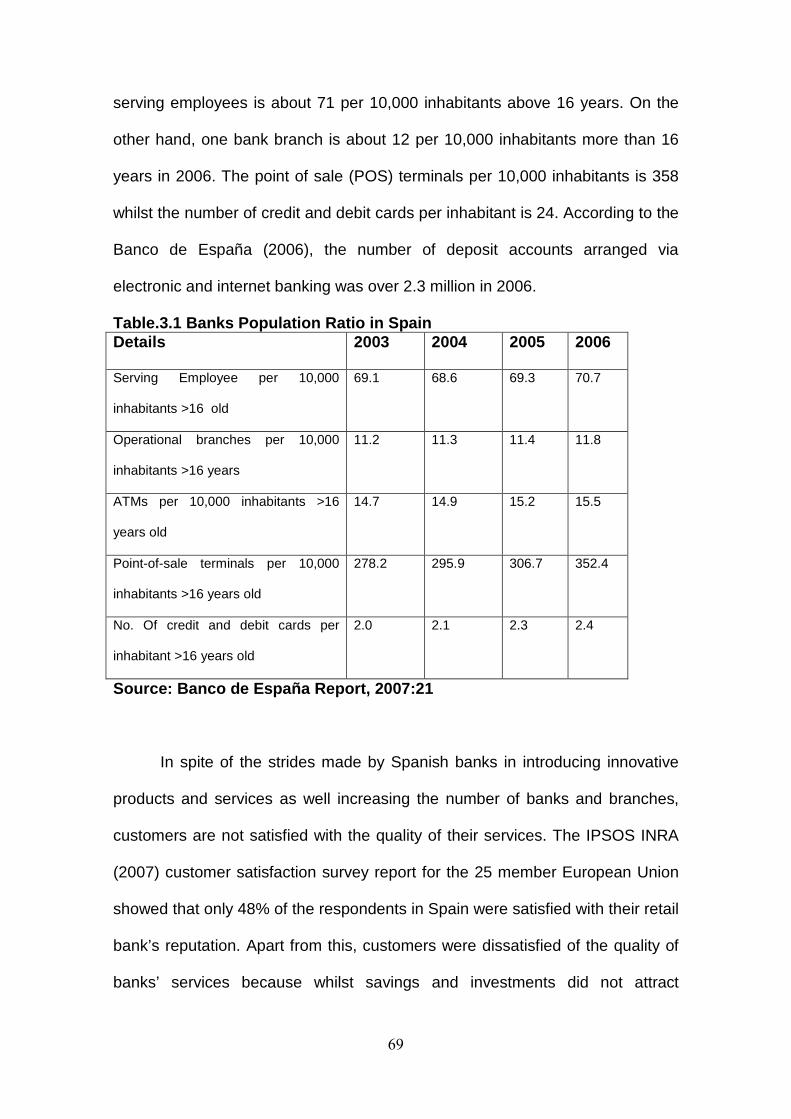
69
serving employees is about 71 per 10,000 inhabitants above 16 years. On the
other hand, one bank branch is about 12 per 10,000 inhabitants more than 16
years in 2006. The point of sale (POS) terminals per 10,000 inhabitants is 358
whilst the number of credit and debit cards per inhabitant is 24. According to the
Banco de España (2006), the number of deposit accounts arranged via
electronic and internet banking was over 2.3 million in 2006.
Table.3.1 Banks Population Ratio in Spain Details 2003 2004 2005 2006
Serving Employee per 10,000
inhabitants >16 old
69.1 68.6 69.3 70.7
Operational branches per 10,000
inhabitants >16 years
11.2 11.3 11.4 11.8
ATMs per 10,000 inhabitants >16
years old
14.7 14.9 15.2 15.5
Point-of-sale terminals per 10,000
inhabitants >16 years old
278.2 295.9 306.7 352.4
No. Of credit and debit cards per
inhabitant >16 years old
2.0 2.1 2.3 2.4
Source: Banco de España Report, 2007:21
In spite of the strides made by Spanish banks in introducing innovative
products and services as well increasing the number of banks and branches,
customers are not satisfied with the quality of their services. The IPSOS INRA
(2007) customer satisfaction survey report for the 25 member European Union
showed that only 48% of the respondents in Spain were satisfied with their retail
bank’s reputation. Apart from this, customers were dissatisfied of the quality of
banks’ services because whilst savings and investments did not attract
70
reasonable interest, the interests on loans were high. In the same vein
customers did not have adequate information about tariffs and were less
satisfied with the level of tariffs as well.
It seems the future is bleak for the entire banking industry in Spain. The
current economic situation has negatively affected most of the banks especially
the saving banks. The situation emanated among others from rising defaults, as
a result of the impact of the economic crisis on borrowers’ ability to repay their
loans; tightening financing conditions on the wholesale markets, due to
increased risk perception, with the consequent effect on financing costs; and
the adjustment in business volume. Buttressing this point, Roldán (2010) further
explained that the economic downturns has lead to less demand for credit and
the continued rate of growth of deposits raised from non-financial corporations
and households declined somewhat in 2009. To that effect, the Banco de
España (2010) has hinted that the saving banks were going to be structured
through 12 integration processes (merger and integration) involving 39 out of
the 45 banks. The affected savings banks’ branch offices would be reduced by
25% on average and a reduction of staff between 15% and 18% (Roldán,
2010). Having dealt with the structure of the banking industry in Ghana and
Spain, the next chapter sheds light on the hypotheses to be tested.
71
CHAPTER FOUR
HYPOTHESES
4.1 Introduction
This chapter deals with the hypotheses to be tested in the context of
previous research findings.
4.2 Research Objectives
The literature on customer satisfaction in the banking industry indicates
that no studies have been done to compare Ghana and Spain. Only a few
studies made comparisons between two countries. For instance, Lasser et al
(2000) examined the service quality perspective and satisfaction in private
banking by comparing the USA and countries in South America. Yavas and
Benkenstein (2007) compared the views of banks’ customers in Turkey and
Germany. Dash et al (2009) also compared the perceptions of customers about
the quality of banks’ services in Canada and India. These studies only focussed
on the general views of banks’ customers. They never found the extent to which
sex, age, education and occupation as well as geographical locations of
customers influenced their perceptions. Though, a handful of studies that
focussed on only one country like Lewis (1994), Galloway and Blanchard
(1996), Lopez et al (2007) and Caruana (2002) classified the banks’ customers
into occupation, age, race, age and education respectively, none of them used
all of these variables (sex, age, education and occupation) at the same time or
stratified them according to geographical locations. In view of this, this study
seeks to fill these gaps.
72
The main objective of the research is to compare the perceptions of
customers regarding the quality of banks’ services in Ghana and Spain.
Specifically, the objectives of the study are;
●To compare the perceptions of the districts, the communities and both Ghana
and Spain in general about the quality dimensions of banks’ services.
●To compare the perceptions of people in terms of their sex, age, education
and occupation about the quality dimensions of banks’ services in Ghana and
Spain
●To look at the overall satisfaction of banks’ customers in Ghana and Spain
●To find out the relationship between overall satisfaction and the quality
dimensions of banks’ services in Ghana and Spain
●To find out the main dimensions of the construct quality in relations to banks’
services in Ghana and Spain
●To make recommendations to enhance customer satisfaction in the banking
industry in general
●To make recommendations about the SERFPERF model in analysing the
quality of banks’ services
4.3 Relationship Between Nations and Quality of Ban ks’ Services
Empirical evidence using the SERVQUAL model and other approaches
show that perceptions of customers are influenced by where they live or come
from. The study of Lopez et al (2007) revealed that although no statistically
significant differences were apparent in the overall levels of satisfaction among
the groups, respondents from the three largest regional ethnic groups (African-
Americans, Latinos, and non-Latino Caucasians) weighted the importance of
73
several of ten service quality dimensions quite differently. The results of the
study of Dash et al (2009) in Canada and India revealed that at the national
level, Indian consumers attached higher importance to tangible attributes,
whilst Canadian consumers considered service reliability more important. The
findings of the research of Petridou et al (2007) indicated that Greek banks’
customers received higher quality services than their Bulgarian counterparts.
Athanassopoulos et al (2001) also found that customer satisfactions were
country specific.
The first objective of this study is to compare the perceptions of the
districts, the communities and both Ghana and Spain in general about the
quality of bank’s services. Therefore, on the ground of the above objective and
the findings, it is hypothesized that;
Ha. There are no differences between the perceptions of Ghana and Spain
regarding the quality dimensions of banks’ services
The sub-hypotheses are;
Ha1. There are no differences in the perceptions of the districts regarding the
quality dimensions of banks’ services
Ha2. There are no differences in the perceptions of the communities regarding
the quality dimensions of banks’ services
(a) Relationship Between Sex and Quality of Banks’ Services
Sex constitutes an important factor as far as perceptions of service
quality are concerned. The results of the study of Spathis et al (2005) in Greece
showed that men had more positive impressions about the quality of banks’
services than women. Again, men ranked effectiveness and reliability highest,
74
with assurance being second. Women on the other hand, ranked price first and
access second. In a related study, Rashid and Hassan (2009) found that both
men and women differed in the criteria used in selecting banks in Bangladesh.
Women ranked core banking first and corporal efficiency second whilst men
ranked corporal efficient first and compliance second. Dimitriades and
Maroudas (2007) also found that men perceived experiencing a higher level of
satisfaction than women. In contrast, the study of Lee and Chen (2009) showed
that there was no significant difference between the perceptions of men and
women about banks’ service quality in Vietnam.
The second general objective of this research is to examine the
perceptions of people in terms of sex, age, education and occupation about the
quality dimensions of banks’ services in Ghana and Spain. Given the objective
and the findings, it is hypothesized that;
Ha3. There is no difference between the perceptions of men and
women regarding the quality dimensions of banks’ services
(b) Relationship Between Age and Quality of Banks’ Services
Age has been identified as having an influence on the perceptions of
customers when the SERVQUAL and other models were adopted. The study of
Galloway and Blanchard (1996) in the United Kingdom unveiled that life stage
affected perceptions of service quality. The results showed that the youth
wanted to be treated well by bank’ staff and were mainly interested in cash from
cash machines. In addition, though the independent were concerned with cash
availability, they were somewhat more concerned with the nature and quality of
the interaction with the bank. Contrary, the family was more concerned with
75
privacy. The empty nester was also concerned with privacy and attached more
importance to issues of personal treatment than the others.
The study of Rashid and Hassan (2009) revealed that age was a factor in
selecting banks in Bangladesh. The age group 21-30 ranked corporal efficiency
first and core banking second. On the other hand, the age group 31-40 ranked
compliance first and cost benefits and corporal issues second. Finally, the age
group 41 and above ranked confidence first and core banking, corporal and
compliance second. Similarly, the study of Dimitriades and Maroudas (2007)
indicated that there were significant differences in satisfaction ratings between
younger and older citizen-customers. Apart from one item relating to the
provision of reliable service and one item relating to context-specific factors,
older individuals had more favorable perceptions of service satisfaction
compared to their younger counterparts. The findings of Lee and Chen (2009)
too indicated that there were significant differences among the age groups
regarding banks’ service quality in Vietnam. Also Caruana (2002) found in Malta
that service loyalty was affected by age only to a secondary extent.
The second general objective of this research is to examine the
perceptions of people in terms of sex, age, education and occupation about the
quality dimensions of banks’ services in Ghana and Spain. In the view of the
above; it is hypothesized that;
Ha4. There are no differences in the perceptions of the age groups regarding
the quality dimensions of banks’ services
76
(c) Relationship Between Education and Quality of B anks’ Services
Customers’ views to a large extent are influenced by their educational
status when SERVQUAL and other methods were used. The research of Lee
and Chen (2009) revealed that there were significant differences among the
educational groups regarding banks’ service quality in Vietnam. The groups
differed about the reliability dimension. The study of Siu and Mou (2005)
unearthed that customer perceptions of credibility, security and efficiency are
significantly correlated with the educational level in Hong Kong. In the same
vein, university, technical/vocational and secondary groups had different views
about the four dimensions found. The results of the research of Rashid and
Hassan (2009) showed that the various educational groups differed in the
criteria used in selecting banks in Bangladesh. Undergraduates ranked corporal
efficiency first and compliance and core banking second. On the other hand,
postgraduates ranked coral efficiency and confidence first and core banking
second. This has been confirmed by the study of Caruana (2002). He found that
service loyalty was primarily affected by education in Malta.
The second general objective of this study is to examine the perceptions
of people in terms of sex, age, education and occupation about the quality
dimensions of banks’ services in Ghana and Spain. Considering the above
objective and the empirical results, it is hypothesized that;
Ha5. There are no differences in the perceptions of the educational groups
regarding the quality dimensions of banks’ services
77
(d) Relationship Between Occupation and Quality of Banks’ Services
Studies conducted using the SERVQUAL and other methods indicated
that occupation played a significant role in determining the perceptions of
customers. The empirical studies of Lee and Chen (2009) unveiled that there
were significant differences among the occupational groups regarding banks’
service quality in Vietnam. The findings of Athanassopoulos et al (2001) also
unearthed that customer satisfactions were industry specific. The study of Lewis
et al (1994) in the United Kingdom also revealed that students were satisfied
regarding overall satisfaction. They were satisfied because banks and building
societies performed well in relation to employees (trustworthiness, appearance
and approachability) and made loan and overdraft decisions fairly quickly. They
were however dissatisfied with respect to aspects of service delivery: e.g.
product knowledge and experience; definitions and explanations services;
speed and efficiency of dealing with queries. The major dissatisfaction identified
was with regards to slow service (queues) and opening hours.
In view of the above, it is hypothesised that:
Ha6. There are no differences in the perceptions of the occupational
groups regarding the quality dimensions of banks’ services
4.4 Relationship Between Nations and Overall Satisf action
Satisfaction has been the major concern of customers. Overall service
quality leads to overall customer satisfaction. Overall satisfaction in general is
also influenced by factors such as country, community, age, occupation and
education when the SERVQUAL and other models were adopted. By comparing
banks in Canada and India, Dash et al (2009) found that there were no
78
differences between both countries with regards to the overall service quality
expectations of customers. A similar study conducted by Lasser et al (2000) in
USA and the countries in South America showed that in instances involving
particular elements of quality and satisfaction, both the incidence of service
failure and the type of communication between service providers and
consumers may influence the effects of quality on satisfaction. Snee et al (2000)
investigated customer satisfaction of Automated Teller Machines (ATMs) of
banks in the United Kingdom and Hungary. The results showed that there was a
statistically significant difference between both countries. Satisfaction levels in
the UK were much higher than in Hungary. The third objective of this study is to
look at the overall satisfaction of banks’ customers in Ghana and Spain. Based
on the objective and the literature, it is hypothesized that;
Hb. There is no difference between the overall satisfaction of Ghana
and Spain
The sub-hypotheses are;
Hb1. There are no differences among the districts regarding overall
Satisfaction
Hb2. There are no differences among the communities regarding overall
satisfaction
Hb3. There is no difference between men and women regarding overall
satisfaction
Hb4. There are no differences among the age groups regarding overall
satisfaction
Hb5. There are no differences among the educational groups regarding overall
satisfaction
79
Hb6. There are no differences among the occupational groups regarding overall
satisfaction
4.5 Relationship Between Overall Satisfaction and Q uality of Banks’
Services
Empirical studies show that the quality of banks’ services is related to
overall satisfaction by using the SERVQUAL and other methods. The results of
the regression analysis of Jabnoun and Khalifa (2005) indicated that though all
the four factors were significant determinants of quality of service in
conventional banks, the most important were values and image. The study of
Arasli et al (2005) showed that reliability had the highest impact on overall
customer satisfaction. Lopez et al (2007) found that reliability, responsiveness,
tangibles, access, communication and credibility positively correlated with
satisfaction. In the case of Jamal and Anastasiadou (2009), reliability, tangibility
and empathy positively correlated with customer satisfaction. Also, the results of
the study of Caruana (2002) showed that banks’ service quality and customer
satisfaction were correlated in Malta. This has been supported by the studies of
Yavas et al (1997) and Siu and Mou (2005). In the case of Ravichandran et al
(2010), responsiveness was the only significant dimension related to overall
satisfaction of banks’ services in India.
The fourth objective of the research is to find out the relationship
between overall satisfaction and the quality dimensions of banks’ services in
Ghana and Spain. In the light of the afore-mentioned objective and the findings
it is hypothesized that:
Hc. There is no relationship between overall satisfaction and the quality
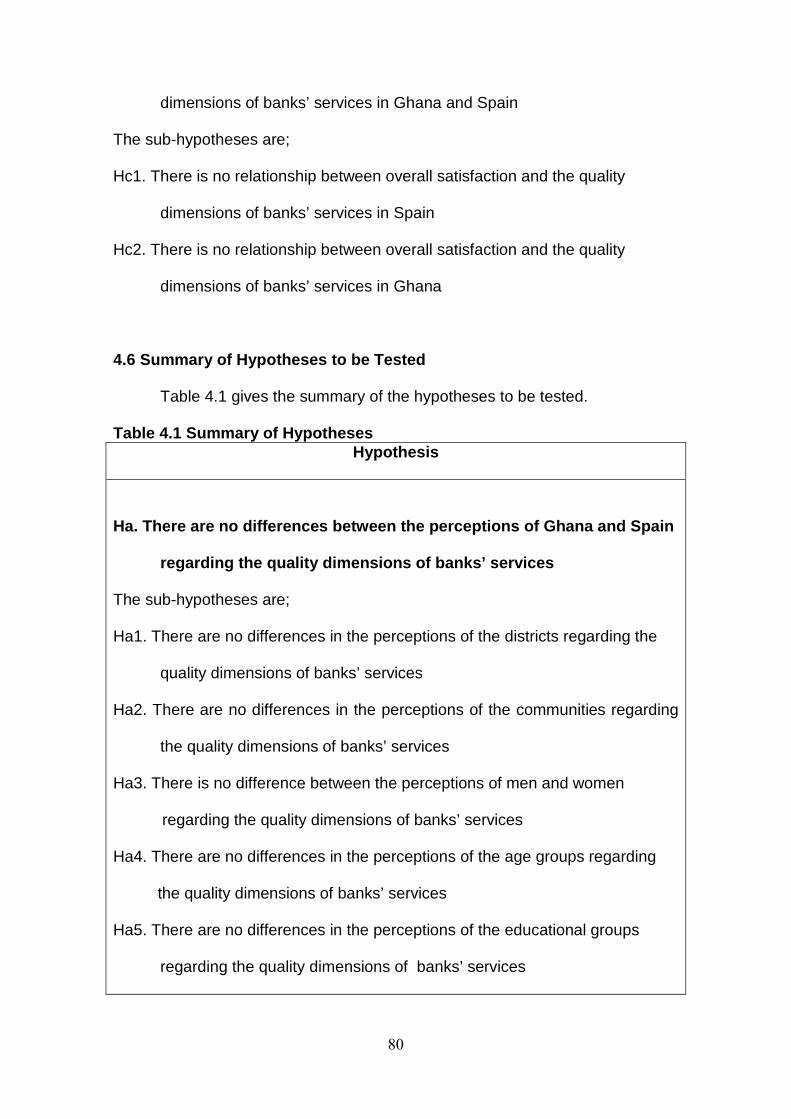
80
dimensions of banks’ services in Ghana and Spain
The sub-hypotheses are;
Hc1. There is no relationship between overall satisfaction and the quality
dimensions of banks’ services in Spain
Hc2. There is no relationship between overall satisfaction and the quality
dimensions of banks’ services in Ghana
4.6 Summary of Hypotheses to be Tested
Table 4.1 gives the summary of the hypotheses to be tested.
Table 4.1 Summary of Hypotheses Hypothesis
Ha. There are no differences between the perception s of Ghana and Spain
regarding the quality dimensions of banks’ service s
The sub-hypotheses are;
Ha1. There are no differences in the perceptions of the districts regarding the
quality dimensions of banks’ services
Ha2. There are no differences in the perceptions of the communities regarding
the quality dimensions of banks’ services
Ha3. There is no difference between the perceptions of men and women
regarding the quality dimensions of banks’ services
Ha4. There are no differences in the perceptions of the age groups regarding
the quality dimensions of banks’ services
Ha5. There are no differences in the perceptions of the educational groups
regarding the quality dimensions of banks’ services
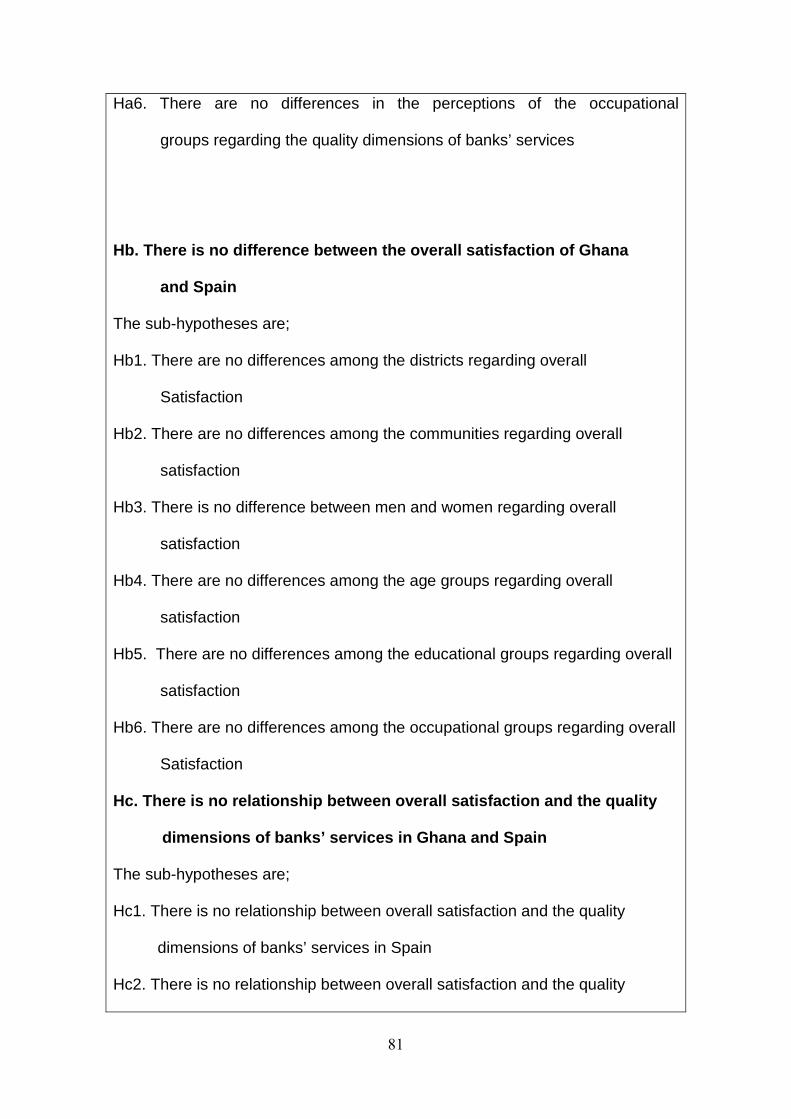
81
Ha6. There are no differences in the perceptions of the occupational
groups regarding the quality dimensions of banks’ services
Hb. There is no difference between the overall sati sfaction of Ghana
and Spain
The sub-hypotheses are;
Hb1. There are no differences among the districts regarding overall
Satisfaction
Hb2. There are no differences among the communities regarding overall
satisfaction
Hb3. There is no difference between men and women regarding overall
satisfaction
Hb4. There are no differences among the age groups regarding overall
satisfaction
Hb5. There are no differences among the educational groups regarding overall
satisfaction
Hb6. There are no differences among the occupational groups regarding overall
Satisfaction
Hc. There is no relationship between overall satisf action and the quality
dimensions of banks’ services in Ghana a nd Spain
The sub-hypotheses are;
Hc1. There is no relationship between overall satisfaction and the quality
dimensions of banks’ services in Spain
Hc2. There is no relationship between overall satisfaction and the quality

82
dimensions of banks’ services in Ghana
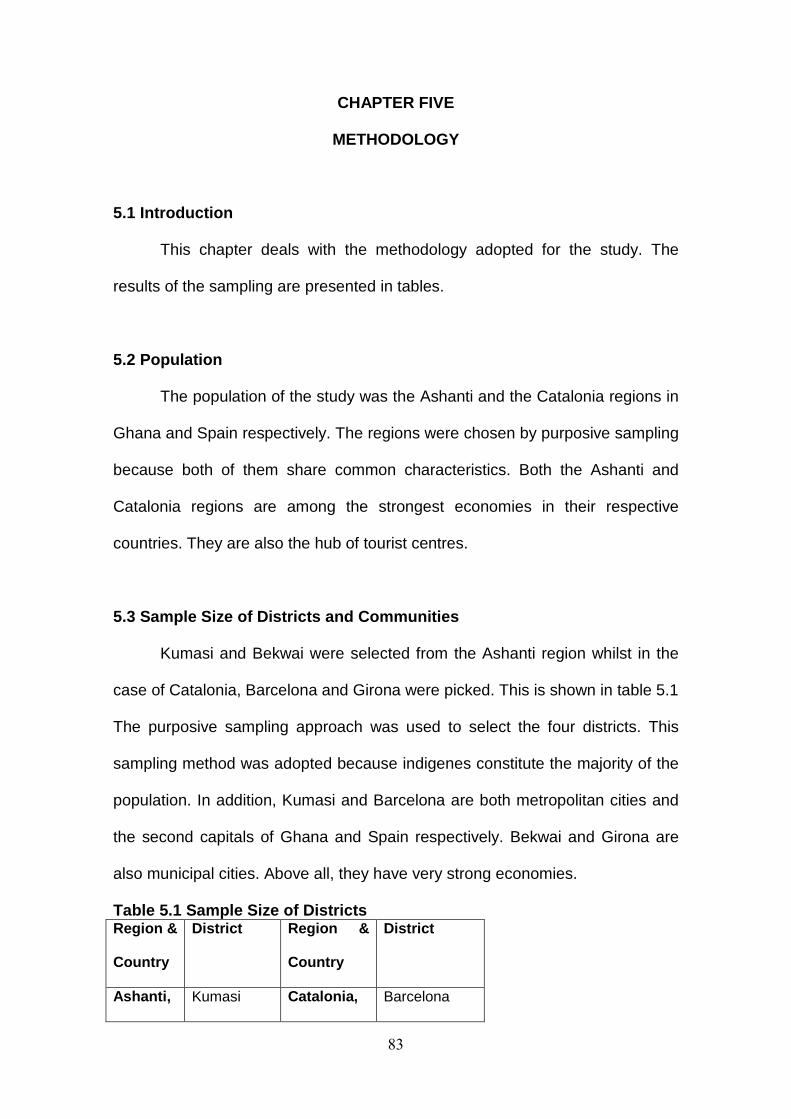
83
CHAPTER FIVE
METHODOLOGY
5.1 Introduction
This chapter deals with the methodology adopted for the study. The
results of the sampling are presented in tables.
5.2 Population
The population of the study was the Ashanti and the Catalonia regions in
Ghana and Spain respectively. The regions were chosen by purposive sampling
because both of them share common characteristics. Both the Ashanti and
Catalonia regions are among the strongest economies in their respective
countries. They are also the hub of tourist centres.
5.3 Sample Size of Districts and Communities
Kumasi and Bekwai were selected from the Ashanti region whilst in the
case of Catalonia, Barcelona and Girona were picked. This is shown in table 5.1
The purposive sampling approach was used to select the four districts. This
sampling method was adopted because indigenes constitute the majority of the
population. In addition, Kumasi and Barcelona are both metropolitan cities and
the second capitals of Ghana and Spain respectively. Bekwai and Girona are
also municipal cities. Above all, they have very strong economies.
Table 5.1 Sample Size of Districts Region &
Country
District Region &
Country
District
Ashanti, Kumasi Catalonia, Barcelona
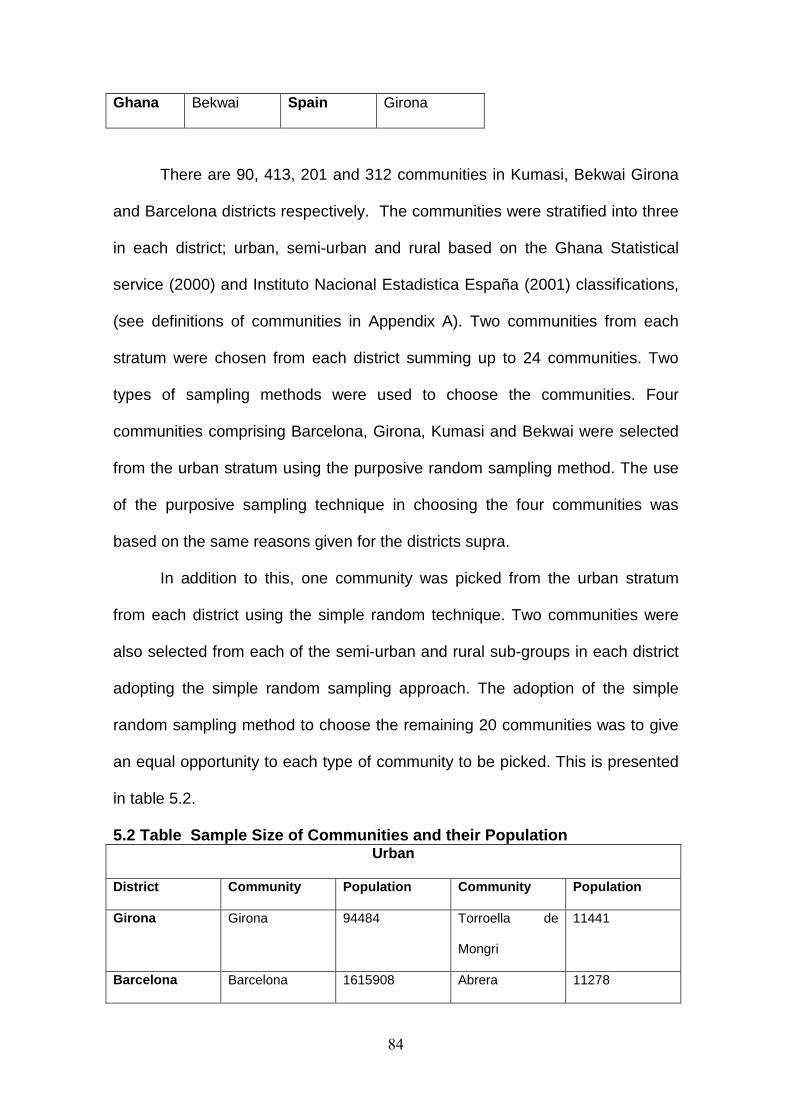
84
Ghana Bekwai Spain Girona
There are 90, 413, 201 and 312 communities in Kumasi, Bekwai Girona
and Barcelona districts respectively. The communities were stratified into three
in each district; urban, semi-urban and rural based on the Ghana Statistical
service (2000) and Instituto Nacional Estadistica España (2001) classifications,
(see definitions of communities in Appendix A). Two communities from each
stratum were chosen from each district summing up to 24 communities. Two
types of sampling methods were used to choose the communities. Four
communities comprising Barcelona, Girona, Kumasi and Bekwai were selected
from the urban stratum using the purposive random sampling method. The use
of the purposive sampling technique in choosing the four communities was
based on the same reasons given for the districts supra.
In addition to this, one community was picked from the urban stratum
from each district using the simple random technique. Two communities were
also selected from each of the semi-urban and rural sub-groups in each district
adopting the simple random sampling approach. The adoption of the simple
random sampling method to choose the remaining 20 communities was to give
an equal opportunity to each type of community to be picked. This is presented
in table 5.2.
5.2 Table Sample Size of Communities and their Pop ulation Urban
District Community Population Community Population
Girona Girona 94484 Torroella de
Mongri
11441
Barcelona Barcelona 1615908 Abrera 11278
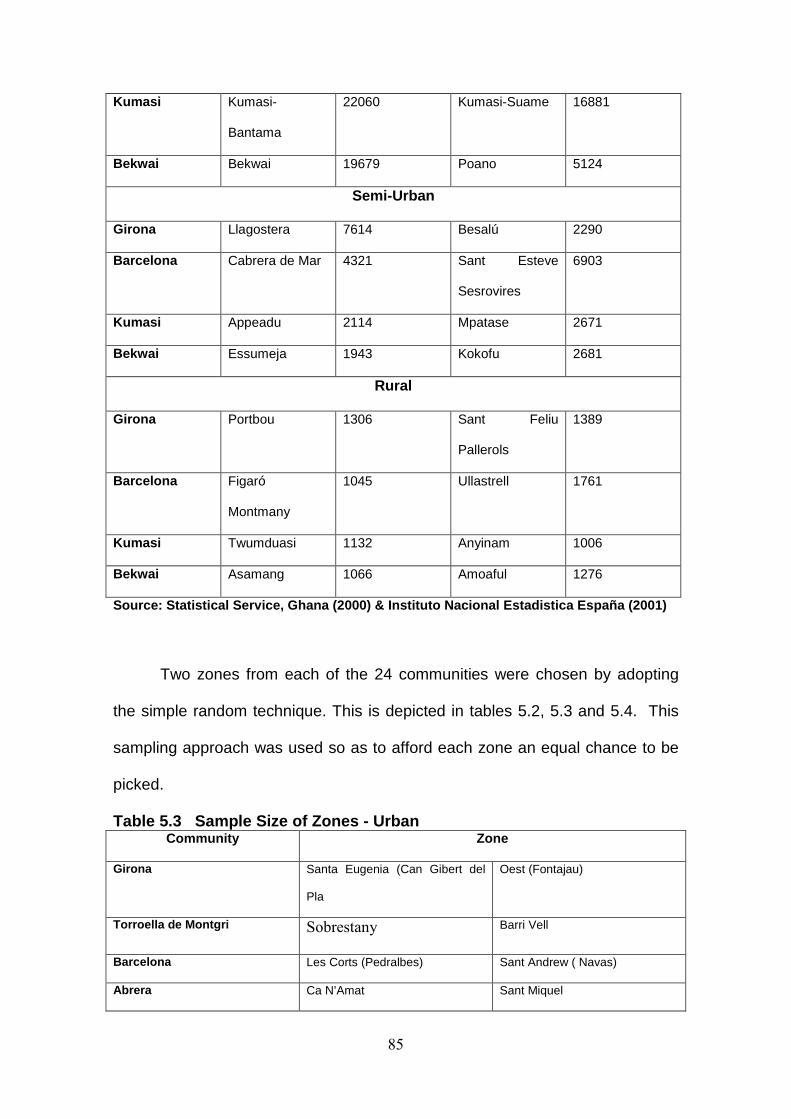
85
Kumasi Kumasi-
Bantama
22060 Kumasi-Suame 16881
Bekwai Bekwai 19679 Poano 5124
Semi-Urban
Girona Llagostera 7614 Besalú 2290
Barcelona Cabrera de Mar 4321 Sant Esteve
Sesrovires
6903
Kumasi Appeadu 2114 Mpatase 2671
Bekwai Essumeja 1943 Kokofu 2681
Rural
Girona Portbou 1306 Sant Feliu
Pallerols
1389
Barcelona Figaró
Montmany
1045 Ullastrell 1761
Kumasi Twumduasi 1132 Anyinam 1006
Bekwai Asamang 1066 Amoaful 1276
Source: Statistical Service, Ghana (2000) & Institu to Nacional Estadistica España (2001)
Two zones from each of the 24 communities were chosen by adopting
the simple random technique. This is depicted in tables 5.2, 5.3 and 5.4. This
sampling approach was used so as to afford each zone an equal chance to be
picked.
Table 5.3 Sample Size of Zones - Urban Community Zone
Girona Santa Eugenia (Can Gibert del
Pla
Oest (Fontajau)
Torroella de Montgri Sobrestany Barri Vell
Barcelona Les Corts (Pedralbes) Sant Andrew ( Navas)
Abrera Ca N’Amat Sant Miquel
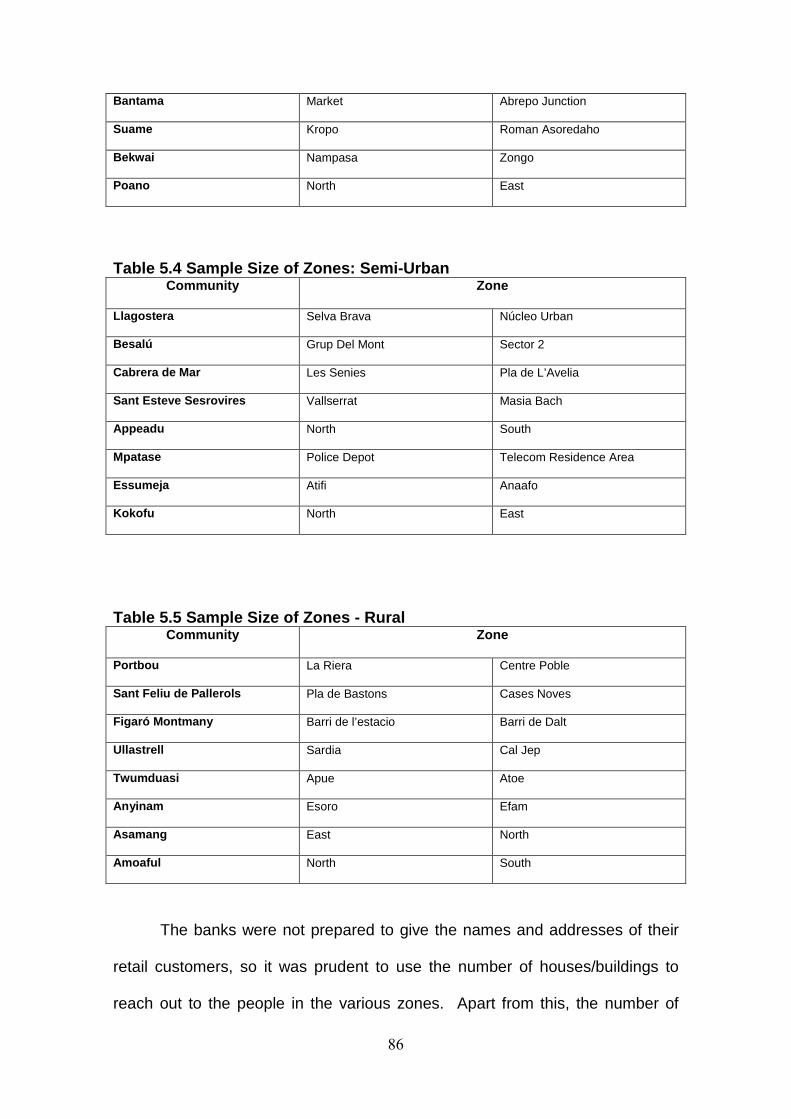
86
Bantama Market Abrepo Junction
Suame Kropo Roman Asoredaho
Bekwai Nampasa Zongo
Poano North East
Table 5.4 Sample Size of Zones: Semi-Urban Community Zone
Llagostera Selva Brava Núcleo Urban
Besalú Grup Del Mont Sector 2
Cabrera de Mar Les Senies Pla de L’Avelia
Sant Esteve Sesrovires Vallserrat Masia Bach
Appeadu North South
Mpatase Police Depot Telecom Residence Area
Essumeja Atifi Anaafo
Kokofu North East
Table 5.5 Sample Size of Zones - Rural
Community Zone
Portbou La Riera Centre Poble
Sant Feliu de Pallerols Pla de Bastons Cases Noves
Figaró Montmany Barri de l’estacio Barri de Dalt
Ullastrell Sardia Cal Jep
Twumduasi Apue Atoe
Anyinam Esoro Efam
Asamang East North
Amoaful North South
The banks were not prepared to give the names and addresses of their
retail customers, so it was prudent to use the number of houses/buildings to
reach out to the people in the various zones. Apart from this, the number of
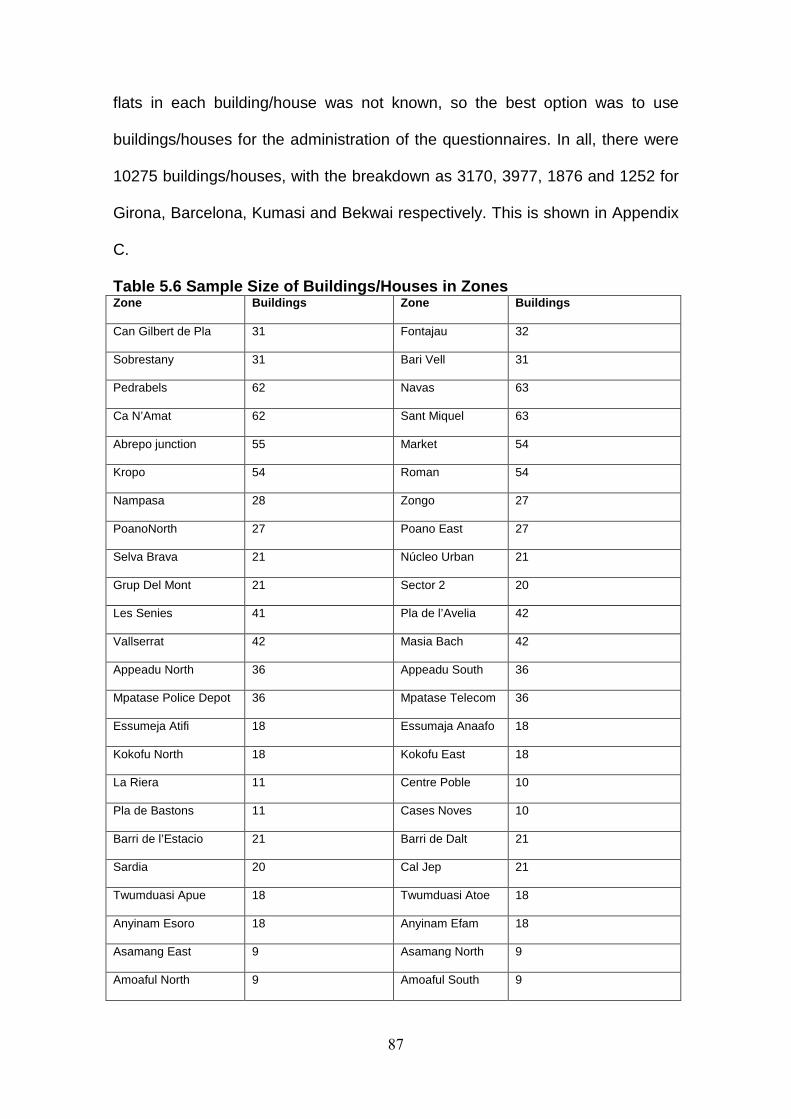
87
flats in each building/house was not known, so the best option was to use
buildings/houses for the administration of the questionnaires. In all, there were
10275 buildings/houses, with the breakdown as 3170, 3977, 1876 and 1252 for
Girona, Barcelona, Kumasi and Bekwai respectively. This is shown in Appendix
C.
Table 5.6 Sample Size of Buildings/Houses in Zones Zone Buildings Zone Buildings
Can Gilbert de Pla 31 Fontajau 32
Sobrestany 31 Bari Vell 31
Pedrabels 62 Navas 63
Ca N’Amat 62 Sant Miquel 63
Abrepo junction 55 Market 54
Kropo 54 Roman 54
Nampasa 28 Zongo 27
PoanoNorth 27 Poano East 27
Selva Brava 21 Núcleo Urban 21
Grup Del Mont 21 Sector 2 20
Les Senies 41 Pla de l’Avelia 42
Vallserrat 42 Masia Bach 42
Appeadu North 36 Appeadu South 36
Mpatase Police Depot 36 Mpatase Telecom 36
Essumeja Atifi 18 Essumaja Anaafo 18
Kokofu North 18 Kokofu East 18
La Riera 11 Centre Poble 10
Pla de Bastons 11 Cases Noves 10
Barri de l’Estacio 21 Barri de Dalt 21
Sardia 20 Cal Jep 21
Twumduasi Apue 18 Twumduasi Atoe 18
Anyinam Esoro 18 Anyinam Efam 18
Asamang East 9 Asamang North 9
Amoaful North 9 Amoaful South 9
88
The systematic random sampling method was used to select the
buildings/houses in each zone, (See Appendix for the determination of the
sample size of building/houses in each zone). The buildings/houses were
picked in each street and if there was a remainder after the process, it was
carried forward to the next street. For example, if every 5th building was chosen
and if say there was a remainder of 2, this was carried forward to the next
street. Three more buildings were selected to make up the 5th building. From
there, the process continued and the next 5th building was chosen. The result is
depicted in table 5.6 above. This approach was used to enable each
building/house to have the possibility of being selected.
5.4 Research Instrument
Questionnaire was the only research instrument used for the study (see
Appendix B for the questionnaire). Also, only one type of questionnaire was
administered to the targeted population in Ghana and Spain. Five and three
trained research assistants for Spain and Ghana respectively were used in the
administration of the questionnaires. The questionnaire for Ghana was in
English whilst that of Spain was in Spanish. The questionnaire had two
sections. The first part captured information on the background of respondents:
sex, age, community, educational background, occupation, type of bankers,
frequency and mode of transacting business with them.
The second part dwelt on the SERVQUAL/SERVPERF five dimensions;
tangibles, reliability, responsiveness, assurance and empathy. Questions on
tangibles centred on banks equipment and tools, physical facilities, employees’
appearance and materials associated with the bank services. That of reliability
89
covered banks fulfilment of promise and bank interested in solving customers’
problems. With regards to responsiveness, questions concerned the time of the
service delivery, prompt service and staff willingness to assist customers.
Questions like bank staff behaviour instil confidence in customers, safety in
dealing with their bankers, courtesy of bank staff and whether the bank staff
have the knowledge in dealing with customers constitute the assurance aspect.
Questions on empathy concerned individual attention, operating time of bank,
distance to the bank office, bank staff are interested in customers and whether
bank staff understand specific needs of customers. Respondents were finally
given the opportunity to comment and provide any other information deemed
relevant but was not captured in the questionnaire.
The questionnaire used was a seven point Likert scale. Since it was
simple and easy to understand, the response rate was encouraging. A Likert
scale is easy to construct and administer. It is also easy for respondents to
understand (Malhotra, 1996). This has been acknowledged by Vickers cited in
Hansson and Arnetz (2005). In addition, Hansson and Arnetz (2005) indicate
that coding and interpretation are easier.
5. 5 Pre-Testing
The questionnaire was pre-tested in Santa Coloma de Gramenet (urban
community) and Verges (rural community) in the Barcelona and Girona districts
respectively. These two communities were chosen by convenience. Two zones,
Cementiri Vell and Casc Anti for Santa Coloma Gramanet and Verges
respectively were picked. Fifty-six buildings/houses were used for the
administration of the questionnaire and they were picked by convenience. Forty-
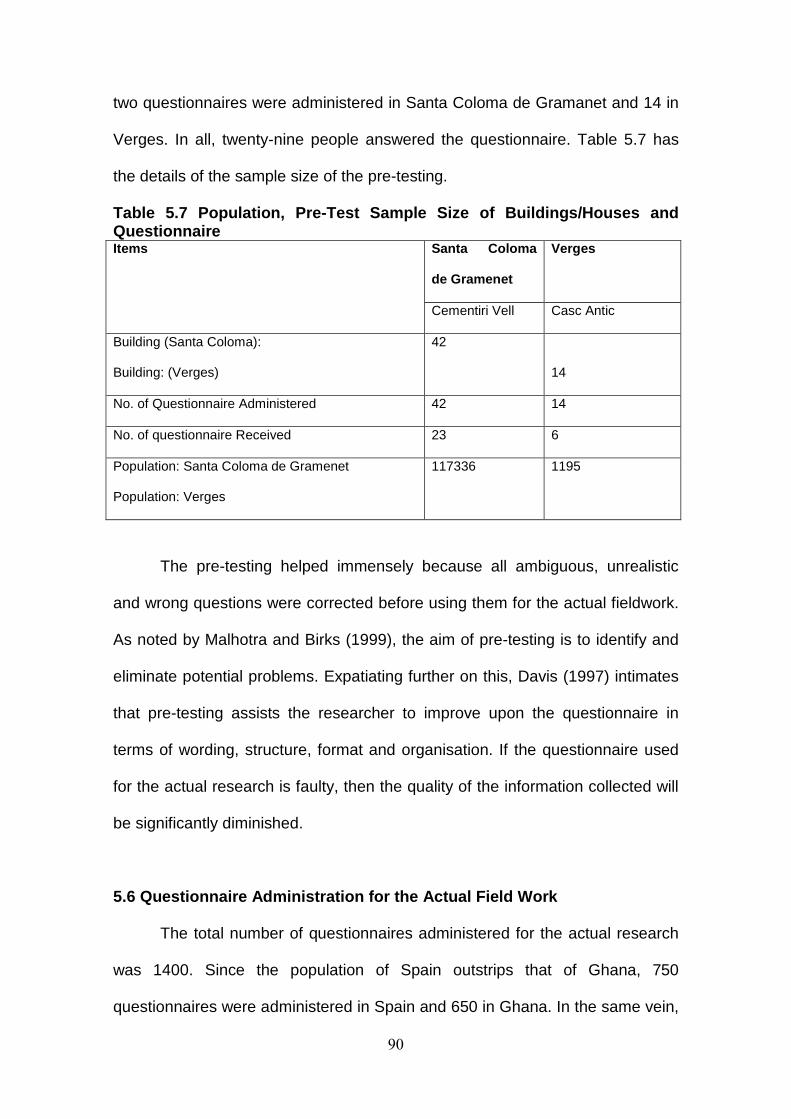
90
two questionnaires were administered in Santa Coloma de Gramanet and 14 in
Verges. In all, twenty-nine people answered the questionnaire. Table 5.7 has
the details of the sample size of the pre-testing.
Table 5.7 Population, Pre-Test Sample Size of Build ings/Houses and Questionnaire
Santa Coloma
de Gramenet
Verges Items
Cementiri Vell Casc Antic
Building (Santa Coloma):
Building: (Verges)
42
14
No. of Questionnaire Administered 42 14
No. of questionnaire Received 23 6
Population: Santa Coloma de Gramenet
Population: Verges
117336 1195
The pre-testing helped immensely because all ambiguous, unrealistic
and wrong questions were corrected before using them for the actual fieldwork.
As noted by Malhotra and Birks (1999), the aim of pre-testing is to identify and
eliminate potential problems. Expatiating further on this, Davis (1997) intimates
that pre-testing assists the researcher to improve upon the questionnaire in
terms of wording, structure, format and organisation. If the questionnaire used
for the actual research is faulty, then the quality of the information collected will
be significantly diminished.
5.6 Questionnaire Administration for the Actual Fie ld Work
The total number of questionnaires administered for the actual research
was 1400. Since the population of Spain outstrips that of Ghana, 750
questionnaires were administered in Spain and 650 in Ghana. In the same vein,
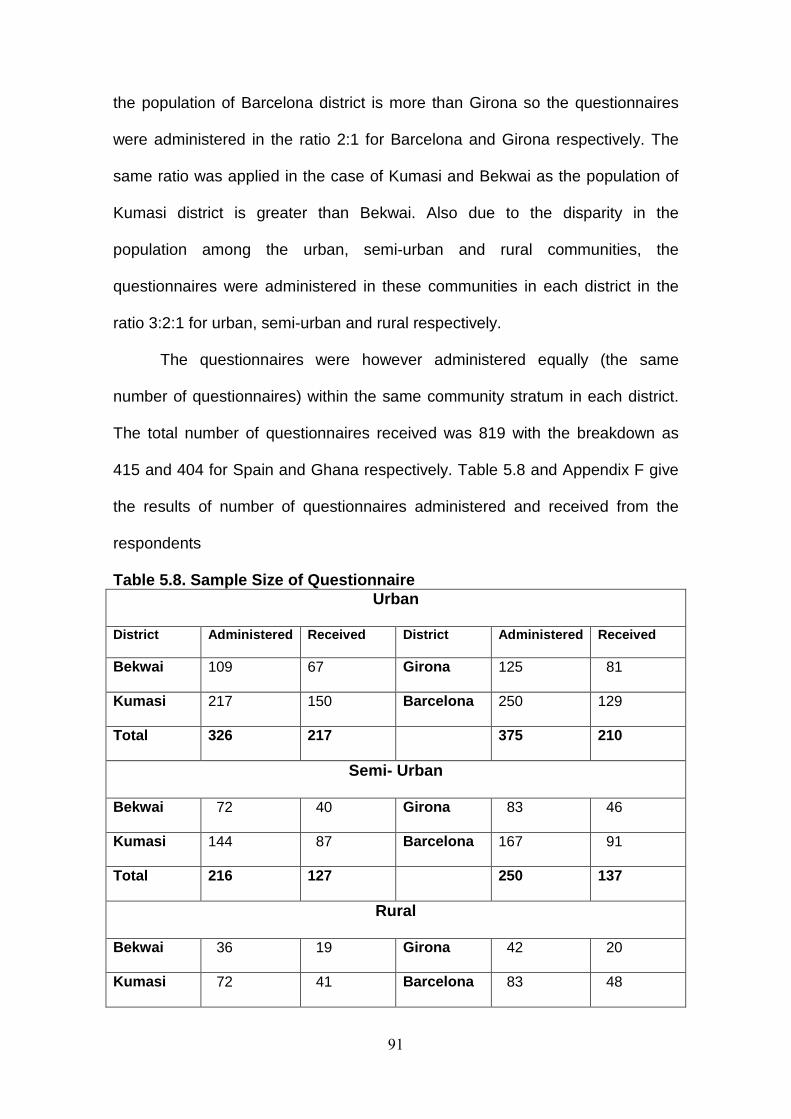
91
the population of Barcelona district is more than Girona so the questionnaires
were administered in the ratio 2:1 for Barcelona and Girona respectively. The
same ratio was applied in the case of Kumasi and Bekwai as the population of
Kumasi district is greater than Bekwai. Also due to the disparity in the
population among the urban, semi-urban and rural communities, the
questionnaires were administered in these communities in each district in the
ratio 3:2:1 for urban, semi-urban and rural respectively.
The questionnaires were however administered equally (the same
number of questionnaires) within the same community stratum in each district.
The total number of questionnaires received was 819 with the breakdown as
415 and 404 for Spain and Ghana respectively. Table 5.8 and Appendix F give
the results of number of questionnaires administered and received from the
respondents
Table 5.8. Sample Size of Questionnaire Urban
District Administered Received District Administered Received
Bekwai 109 67 Girona 125 81
Kumasi 217 150 Barcelona 250 129
Total 326 217 375 210
Semi- Urban
Bekwai 72 40 Girona 83 46
Kumasi 144 87 Barcelona 167 91
Total 216 127 250 137
Rural
Bekwai 36 19 Girona 42 20
Kumasi 72 41 Barcelona 83 48
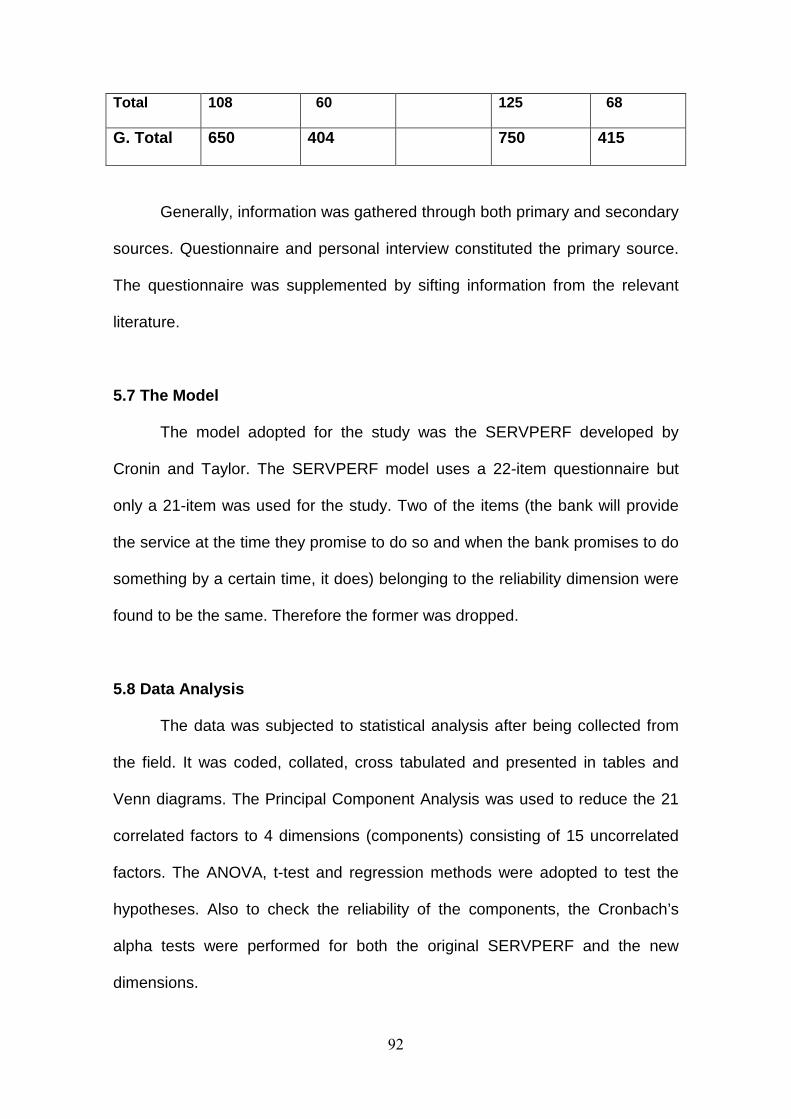
92
Total 108 60 125 68
G. Total 650 404 750 415
Generally, information was gathered through both primary and secondary
sources. Questionnaire and personal interview constituted the primary source.
The questionnaire was supplemented by sifting information from the relevant
literature.
5.7 The Model
The model adopted for the study was the SERVPERF developed by
Cronin and Taylor. The SERVPERF model uses a 22-item questionnaire but
only a 21-item was used for the study. Two of the items (the bank will provide
the service at the time they promise to do so and when the bank promises to do
something by a certain time, it does) belonging to the reliability dimension were
found to be the same. Therefore the former was dropped.
5.8 Data Analysis
The data was subjected to statistical analysis after being collected from
the field. It was coded, collated, cross tabulated and presented in tables and
Venn diagrams. The Principal Component Analysis was used to reduce the 21
correlated factors to 4 dimensions (components) consisting of 15 uncorrelated
factors. The ANOVA, t-test and regression methods were adopted to test the
hypotheses. Also to check the reliability of the components, the Cronbach’s
alpha tests were performed for both the original SERVPERF and the new
dimensions.
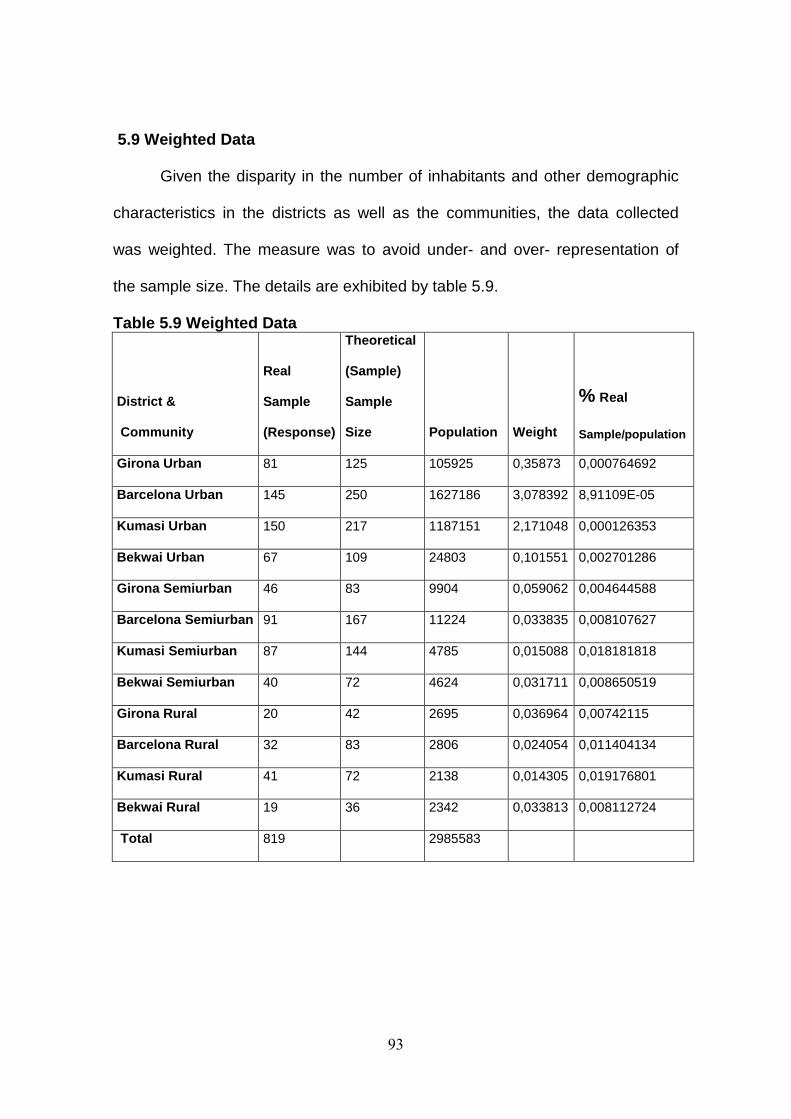
93
5.9 Weighted Data
Given the disparity in the number of inhabitants and other demographic
characteristics in the districts as well as the communities, the data collected
was weighted. The measure was to avoid under- and over- representation of
the sample size. The details are exhibited by table 5.9.
Table 5.9 Weighted Data
District &
Community
Real
Sample
(Response)
Theoretical
(Sample)
Sample
Size Population Weight
% Real
Sample/population
Girona Urban 81 125 105925 0,35873 0,000764692
Barcelona Urban 145 250 1627186 3,078392 8,91109E-05
Kumasi Urban 150 217 1187151 2,171048 0,000126353
Bekwai Urban 67 109 24803 0,101551 0,002701286
Girona Semiurban 46 83 9904 0,059062 0,004644588
Barcelona Semiurban 91 167 11224 0,033835 0,008107627
Kumasi Semiurban 87 144 4785 0,015088 0,018181818
Bekwai Semiurban 40 72 4624 0,031711 0,008650519
Girona Rural 20 42 2695 0,036964 0,00742115
Barcelona Rural 32 83 2806 0,024054 0,011404134
Kumasi Rural 41 72 2138 0,014305 0,019176801
Bekwai Rural 19 36 2342 0,033813 0,008112724
Total 819 2985583

94
5.10 Limitations
There was no data on the number of buildings/houses in each zone save
the cities of Girona and Barcelona. The Ghana Statistical Service, the Instituto
Estadistica National, España and the district councils only had the list of the
total number of buildings/houses for each community but this had not been
broken down into zones. To make the sampling very representative, the number
of buildings/houses in each community was divided by the number of zones. In
addition, each building/house was assigned one questionnaire because the
number of flats in each of them was not known. The questionnaire was given to
anyone available and was passed on to the next person when the first did not
collect it. Several calls were also made to collect the questionnaires in some of
the communities. These unduly prolonged the time of collecting the data.
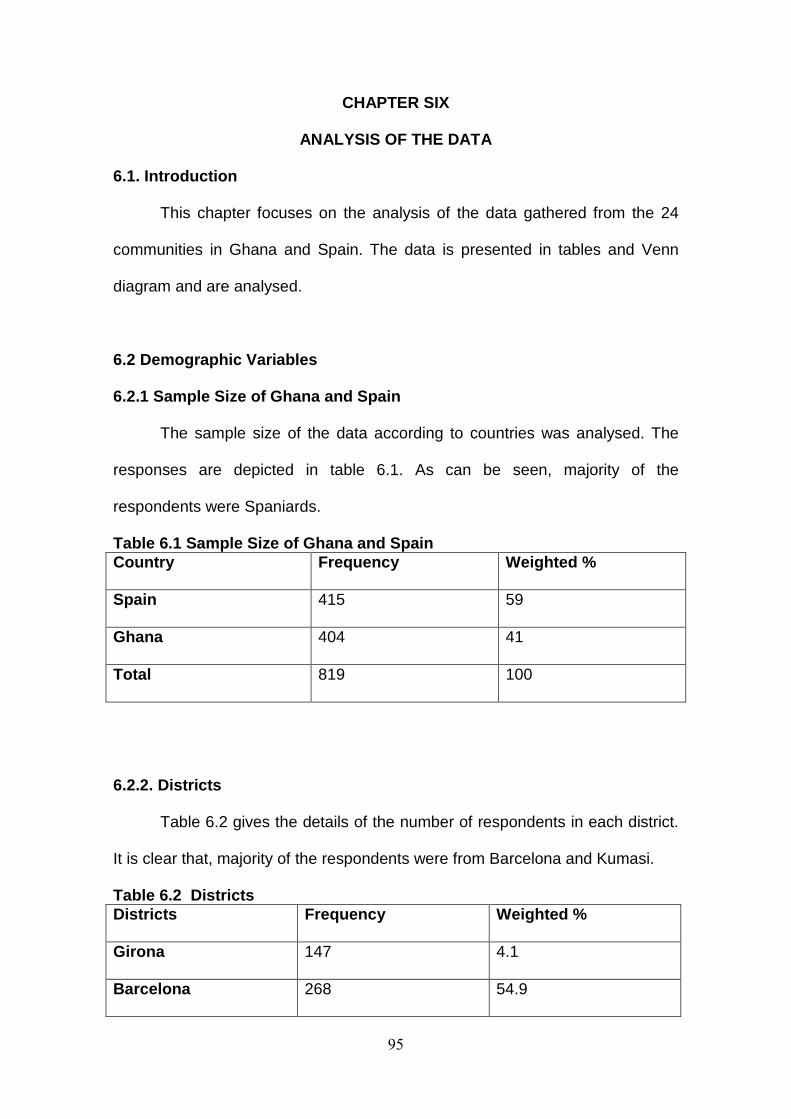
95
CHAPTER SIX
ANALYSIS OF THE DATA
6.1. Introduction
This chapter focuses on the analysis of the data gathered from the 24
communities in Ghana and Spain. The data is presented in tables and Venn
diagram and are analysed.
6.2 Demographic Variables
6.2.1 Sample Size of Ghana and Spain
The sample size of the data according to countries was analysed. The
responses are depicted in table 6.1. As can be seen, majority of the
respondents were Spaniards.
Table 6.1 Sample Size of Ghana and Spain Country Frequency Weighted %
Spain 415 59
Ghana 404 41
Total 819 100
6.2.2. Districts
Table 6.2 gives the details of the number of respondents in each district.
It is clear that, majority of the respondents were from Barcelona and Kumasi.
Table 6.2 Districts Districts Frequency Weighted %
Girona 147 4.1
Barcelona 268 54.9
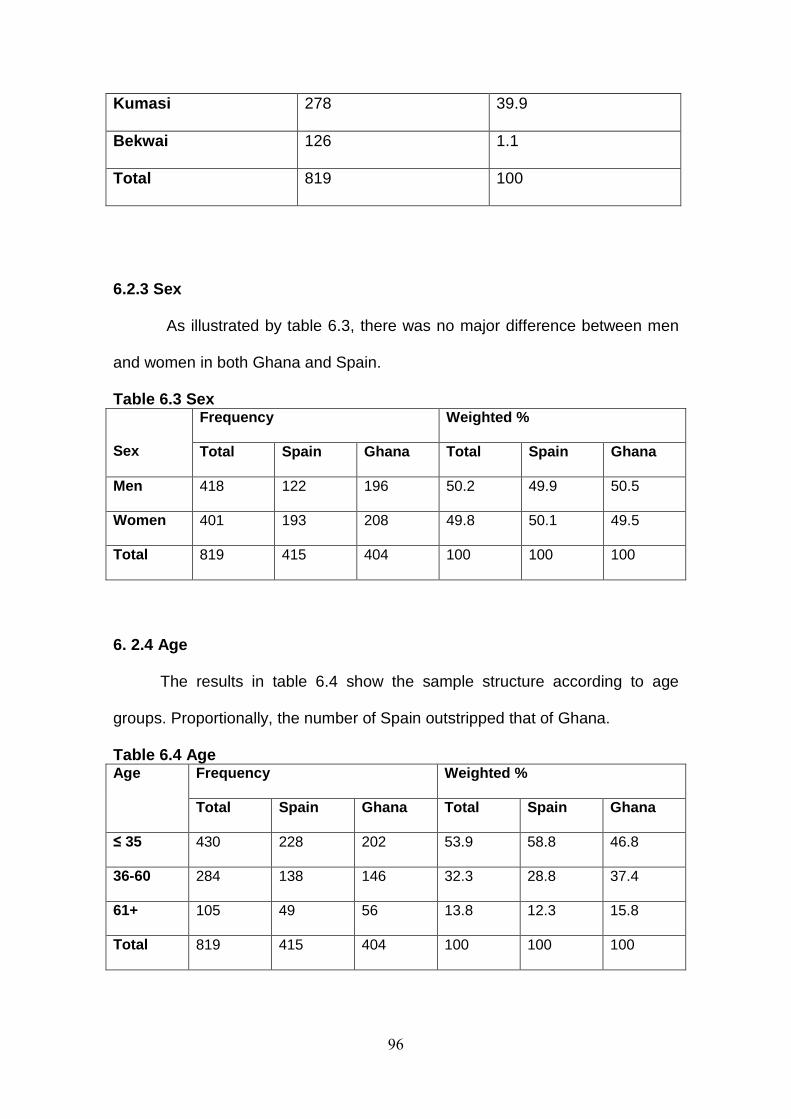
96
Kumasi 278 39.9
Bekwai 126 1.1
Total 819 100
6.2.3 Sex
As illustrated by table 6.3, there was no major difference between men
and women in both Ghana and Spain.
Table 6.3 Sex Frequency Weighted %
Sex Total Spain Ghana Total Spain Ghana
Men 418 122 196 50.2 49.9 50.5
Women 401 193 208 49.8 50.1 49.5
Total 819 415 404 100 100 100
6. 2.4 Age
The results in table 6.4 show the sample structure according to age
groups. Proportionally, the number of Spain outstripped that of Ghana.
Table 6.4 Age Frequency Weighted % Age
Total Spain Ghana Total Spain Ghana
≤ 35 430 228 202 53.9 58.8 46.8
36-60 284 138 146 32.3 28.8 37.4
61+ 105 49 56 13.8 12.3 15.8
Total 819 415 404 100 100 100
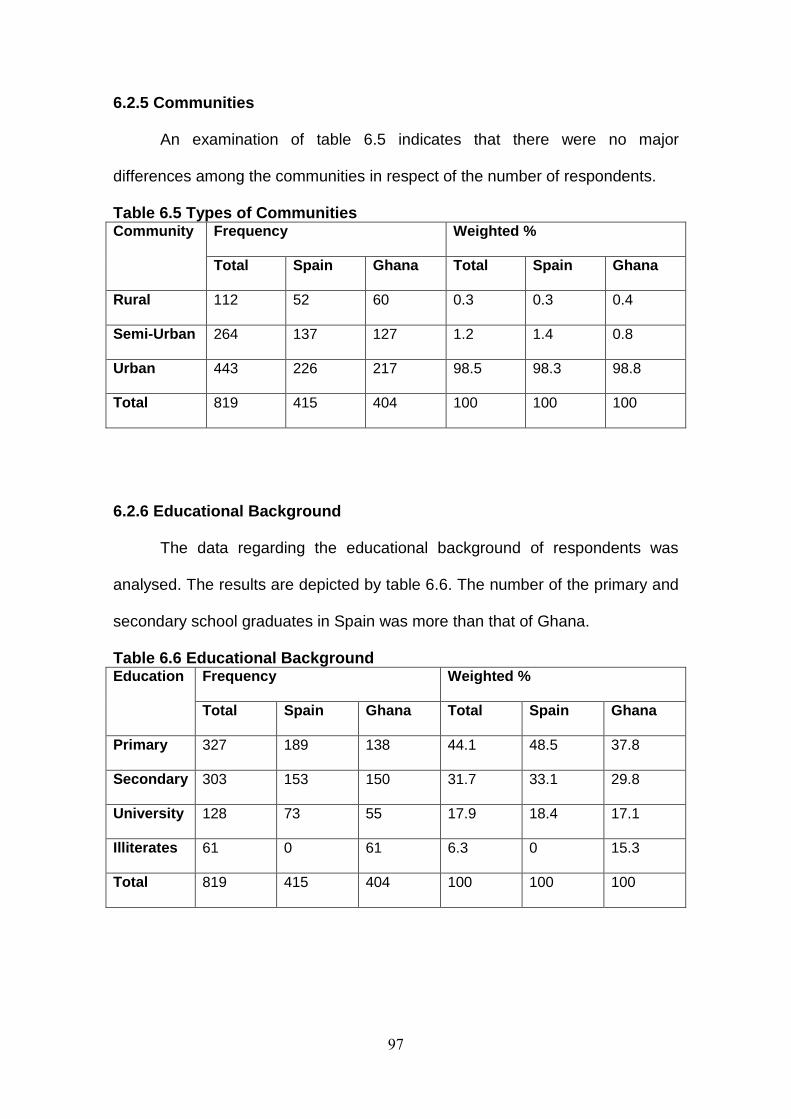
97
6.2.5 Communities
An examination of table 6.5 indicates that there were no major
differences among the communities in respect of the number of respondents.
Table 6.5 Types of Communities Frequency Weighted % Community
Total Spain Ghana Total Spain Ghana
Rural 112 52 60 0.3 0.3 0.4
Semi-Urban 264 137 127 1.2 1.4 0.8
Urban 443 226 217 98.5 98.3 98.8
Total 819 415 404 100 100 100
6.2.6 Educational Background
The data regarding the educational background of respondents was
analysed. The results are depicted by table 6.6. The number of the primary and
secondary school graduates in Spain was more than that of Ghana.
Table 6.6 Educational Background Frequency Weighted % Education
Total Spain Ghana Total Spain Ghana
Primary 327 189 138 44.1 48.5 37.8
Secondary 303 153 150 31.7 33.1 29.8
University 128 73 55 17.9 18.4 17.1
Illiterates 61 0 61 6.3 0 15.3
Total 819 415 404 100 100 100
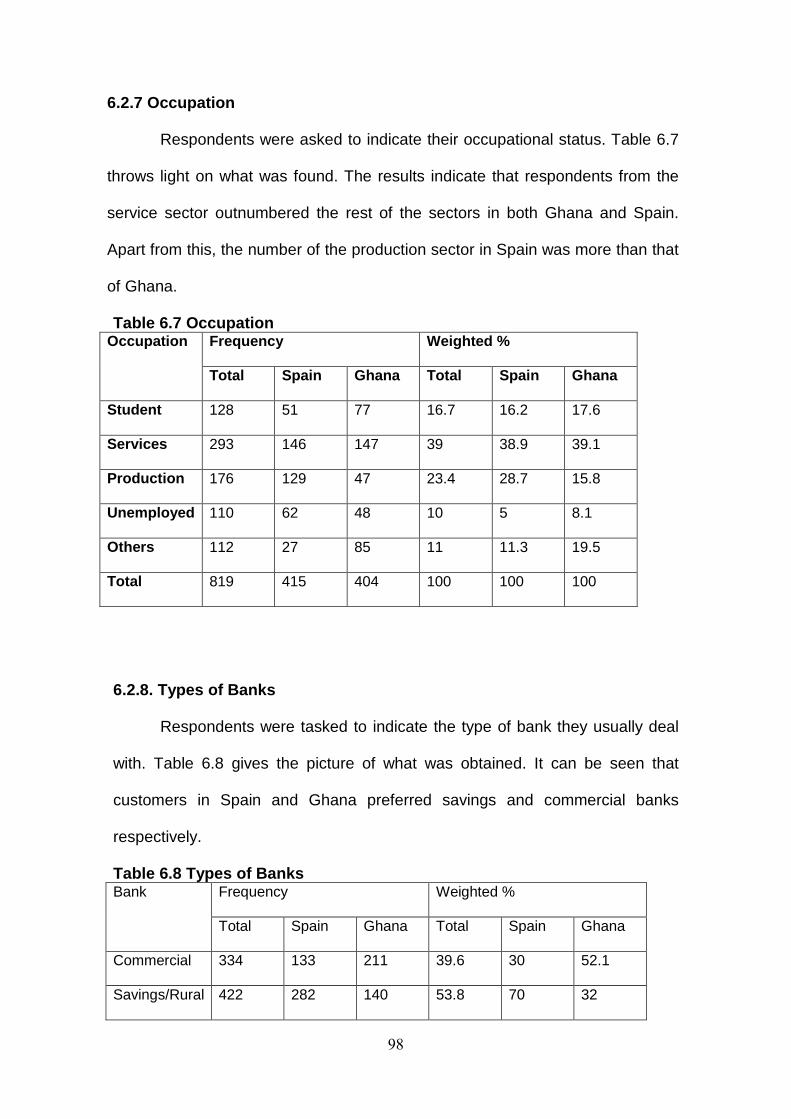
98
6.2.7 Occupation
Respondents were asked to indicate their occupational status. Table 6.7
throws light on what was found. The results indicate that respondents from the
service sector outnumbered the rest of the sectors in both Ghana and Spain.
Apart from this, the number of the production sector in Spain was more than that
of Ghana.
Table 6.7 Occupation Frequency Weighted % Occupation
Total Spain Ghana Total Spain Ghana
Student 128 51 77 16.7 16.2 17.6
Services 293 146 147 39 38.9 39.1
Production 176 129 47 23.4 28.7 15.8
Unemployed 110 62 48 10 5 8.1
Others 112 27 85 11 11.3 19.5
Total 819 415 404 100 100 100
6.2.8. Types of Banks
Respondents were tasked to indicate the type of bank they usually deal
with. Table 6.8 gives the picture of what was obtained. It can be seen that
customers in Spain and Ghana preferred savings and commercial banks
respectively.
Table 6.8 Types of Banks Frequency Weighted % Bank
Total Spain Ghana Total Spain Ghana
Commercial 334 133 211 39.6 30 52.1
Savings/Rural 422 282 140 53.8 70 32
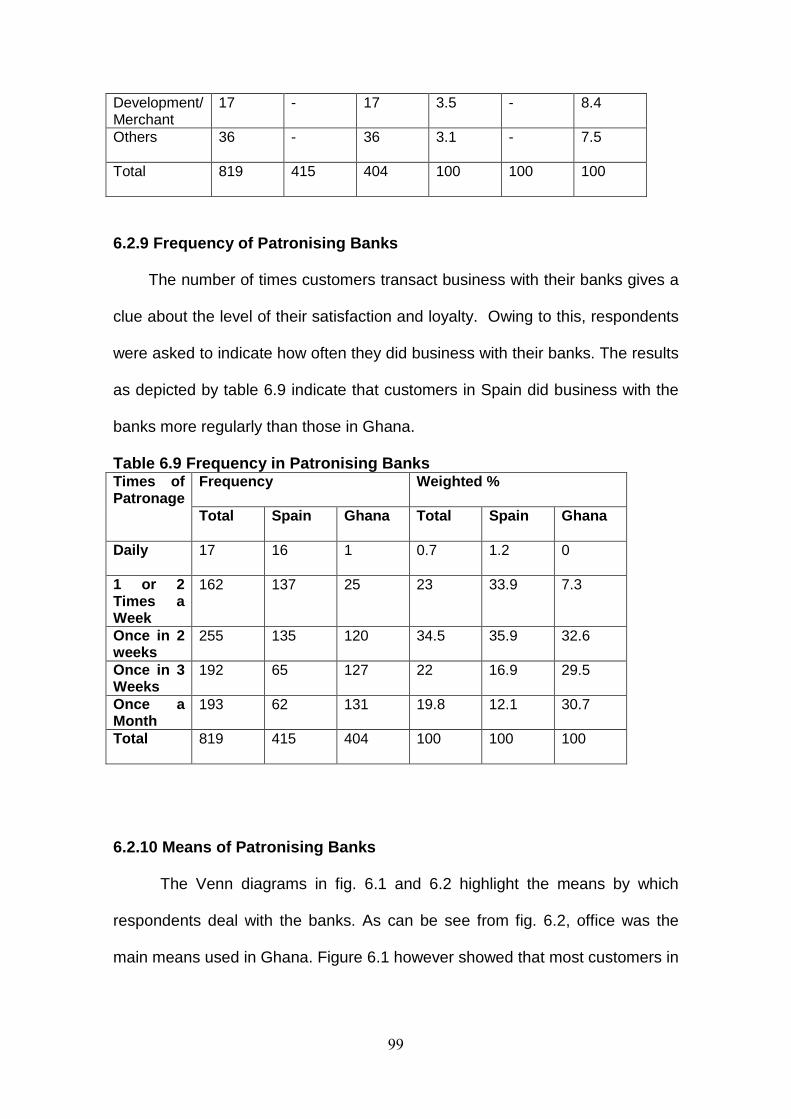
99
Development/ Merchant
17 - 17 3.5 - 8.4
Others 36 - 36 3.1 - 7.5
Total 819 415 404 100 100 100
6.2.9 Frequency of Patronising Banks
The number of times customers transact business with their banks gives a
clue about the level of their satisfaction and loyalty. Owing to this, respondents
were asked to indicate how often they did business with their banks. The results
as depicted by table 6.9 indicate that customers in Spain did business with the
banks more regularly than those in Ghana.
Table 6.9 Frequency in Patronising Banks Frequency Weighted % Times of
Patronage Total Spain Ghana Total Spain Ghana
Daily 17 16 1 0.7 1.2 0
1 or 2 Times a Week
162 137 25 23 33.9 7.3
Once in 2 weeks
255 135 120 34.5 35.9 32.6
Once in 3 Weeks
192 65 127 22 16.9 29.5
Once a Month
193 62 131 19.8 12.1 30.7
Total 819 415 404 100 100 100
6.2.10 Means of Patronising Banks
The Venn diagrams in fig. 6.1 and 6.2 highlight the means by which
respondents deal with the banks. As can be see from fig. 6.2, office was the
main means used in Ghana. Figure 6.1 however showed that most customers in
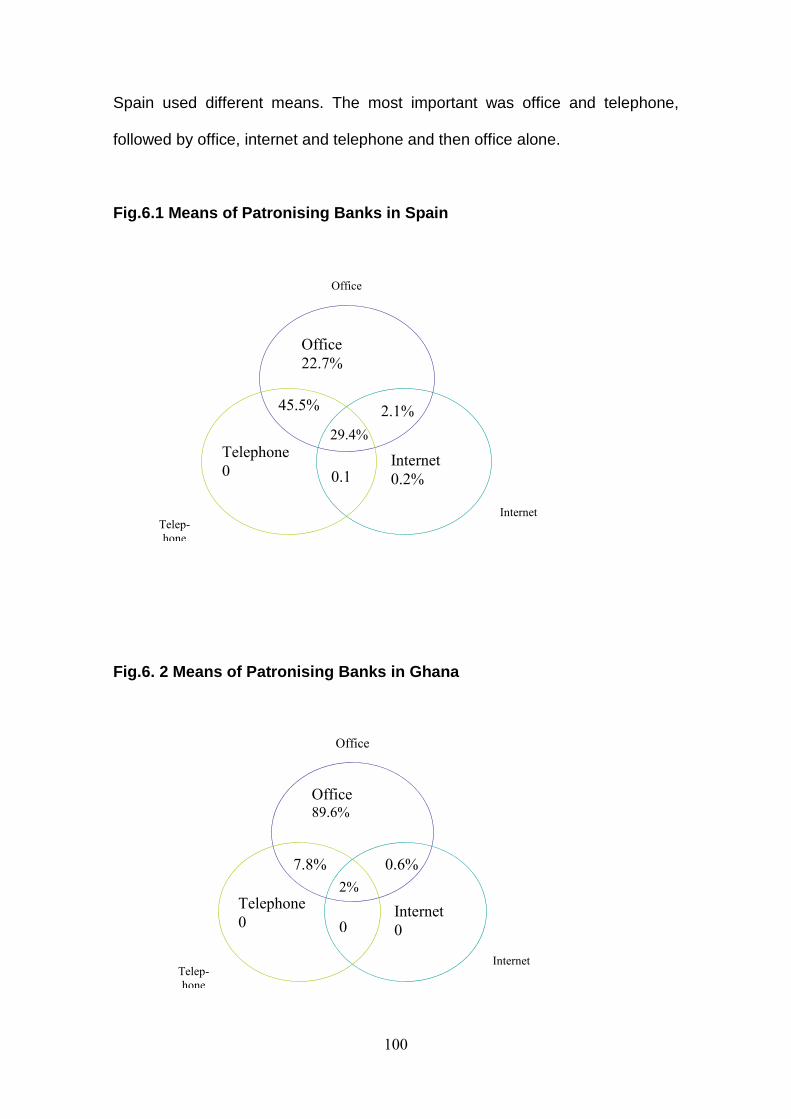
100
Office
Internet
Telep-
hone
Office
22.7%
Internet
0.2%
Telephone
0
2.1% 45.5%
0.1
29.4%
Office
Internet
Telep-
hone
Office 89.6%
Internet
0
Telephone
0
0.6% 7.8%
0
2%
Spain used different means. The most important was office and telephone,
followed by office, internet and telephone and then office alone.
Fig.6.1 Means of Patronising Banks in Spain
Fig.6. 2 Means of Patronising Banks in Ghana
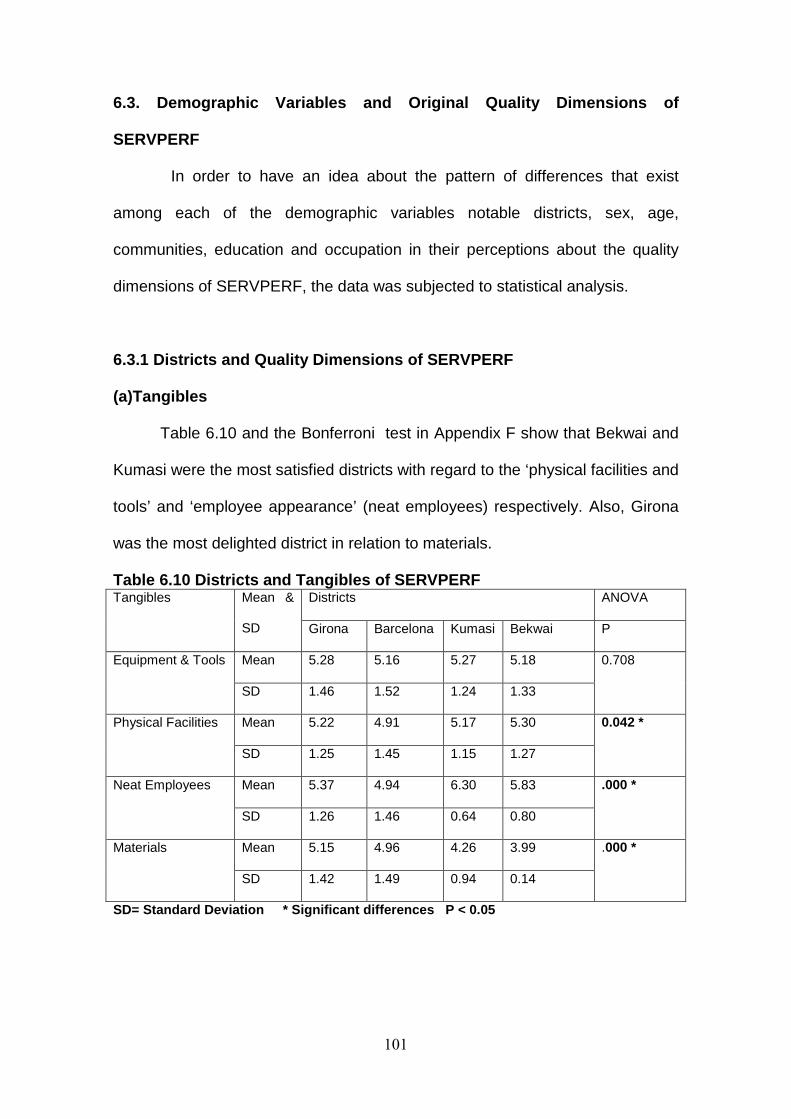
101
6.3. Demographic Variables and Original Quality Dim ensions of
SERVPERF
In order to have an idea about the pattern of differences that exist
among each of the demographic variables notable districts, sex, age,
communities, education and occupation in their perceptions about the quality
dimensions of SERVPERF, the data was subjected to statistical analysis.
6.3.1 Districts and Quality Dimensions of SERVPERF
(a)Tangibles
Table 6.10 and the Bonferroni test in Appendix F show that Bekwai and
Kumasi were the most satisfied districts with regard to the ‘physical facilities and
tools’ and ‘employee appearance’ (neat employees) respectively. Also, Girona
was the most delighted district in relation to materials.
Table 6.10 Districts and Tangibles of SERVPERF Districts ANOVA Tangibles Mean &
SD Girona Barcelona Kumasi Bekwai P
Mean 5.28 5.16 5.27 5.18 Equipment & Tools
SD 1.46 1.52 1.24 1.33
0.708
Mean 5.22 4.91 5.17 5.30 Physical Facilities
SD 1.25 1.45 1.15 1.27
0.042 *
Mean 5.37 4.94 6.30 5.83 Neat Employees
SD 1.26 1.46 0.64 0.80
.000 *
Mean 5.15 4.96 4.26 3.99 Materials
SD 1.42 1.49 0.94 0.14
.000 *
SD= Standard Deviation * Significant difference s P < 0.05

102
(b) Reliability
Table 6.11 and the Bonferroni test in Appendix G indicate that Barcelona
was the most dissatisfied and the most satisfied district regarding ‘banks fulfil
their promises at the stipulated time’ and ‘bank insisting on error free records’
respectively.
Table 6.11 Districts and Reliability of SE RVPERF Districts ANOVA
Reliability Mean
& SD
Girona Barcelona Kumasi Bekwai P
Mean 2.01 1.52 1.64 1.67 Promises Fulfilled at Stipulated Time
SD 1.35 0.80 1.20 0.75
0.029*
Mean 4.89 5.08 5.19 4.68 Banks Show Keen Interest In Solving Problems
SD 1.56 1.19 0.90 1.10
0.177
Mean 1.92 1.47 1.51 1.53 Perform Services Exactly The 1st Time
SD 1.14 0.82 1.11 0.68
0.070
Mean 4.75 5.06 3.98 3.99 Banks Insist on Error Free Records
SD 1.20 1.10 0.77 0.14
0.000*
SD= Standard Deviation * Significant differe nces P < 0.05
(c) Responsiveness
It is clear from table 6.12 and the Bonferroni results in Appendix H that
Barcelona and Kumasi were the most dissatisfied districts in connection with
‘banks’ staff tell customers the exact time the services will be performed’ and
‘banks give customers prompt service’ respectively. In the case of ‘bank staff
not too busy to respond to queries of customers’, Girona and Barcelona were
satisfied but Kumasi and Bekwai had a dissenting view.
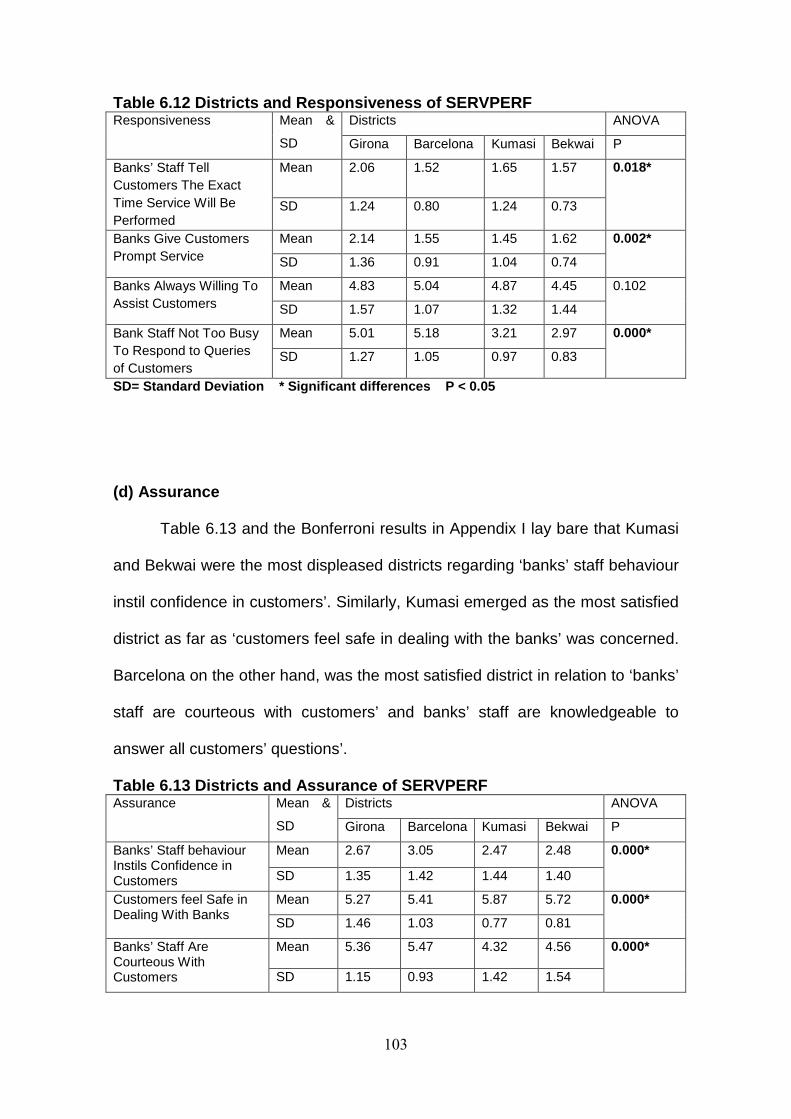
103
Table 6.12 Districts and Responsiveness of SERVPERF Districts ANOVA Responsiveness Mean &
SD Girona Barcelona Kumasi Bekwai P
Mean 2.06 1.52 1.65 1.57 Banks’ Staff Tell Customers The Exact Time Service Will Be Performed
SD 1.24 0.80 1.24 0.73
0.018*
Mean 2.14 1.55 1.45 1.62 Banks Give Customers Prompt Service SD 1.36 0.91 1.04 0.74
0.002*
Mean 4.83 5.04 4.87 4.45 Banks Always Willing To Assist Customers SD 1.57 1.07 1.32 1.44
0.102
Mean 5.01 5.18 3.21 2.97 Bank Staff Not Too Busy To Respond to Queries of Customers
SD 1.27 1.05 0.97 0.83
0.000*
SD= Standard Deviation * Significant differences P < 0.05
(d) Assurance
Table 6.13 and the Bonferroni results in Appendix I lay bare that Kumasi
and Bekwai were the most displeased districts regarding ‘banks’ staff behaviour
instil confidence in customers’. Similarly, Kumasi emerged as the most satisfied
district as far as ‘customers feel safe in dealing with the banks’ was concerned.
Barcelona on the other hand, was the most satisfied district in relation to ‘banks’
staff are courteous with customers’ and banks’ staff are knowledgeable to
answer all customers’ questions’.
Table 6.13 Districts and Assurance of SERVPERF Districts ANOVA Assurance Mean &
SD Girona Barcelona Kumasi Bekwai P
Mean 2.67 3.05 2.47 2.48 Banks’ Staff behaviour Instils Confidence in Customers SD 1.35 1.42 1.44 1.40
0.000*
Mean 5.27 5.41 5.87 5.72 Customers feel Safe in Dealing With Banks
SD 1.46 1.03 0.77 0.81
0.000*
Mean 5.36 5.47 4.32 4.56 Banks’ Staff Are Courteous With Customers SD 1.15 0.93 1.42 1.54
0.000*
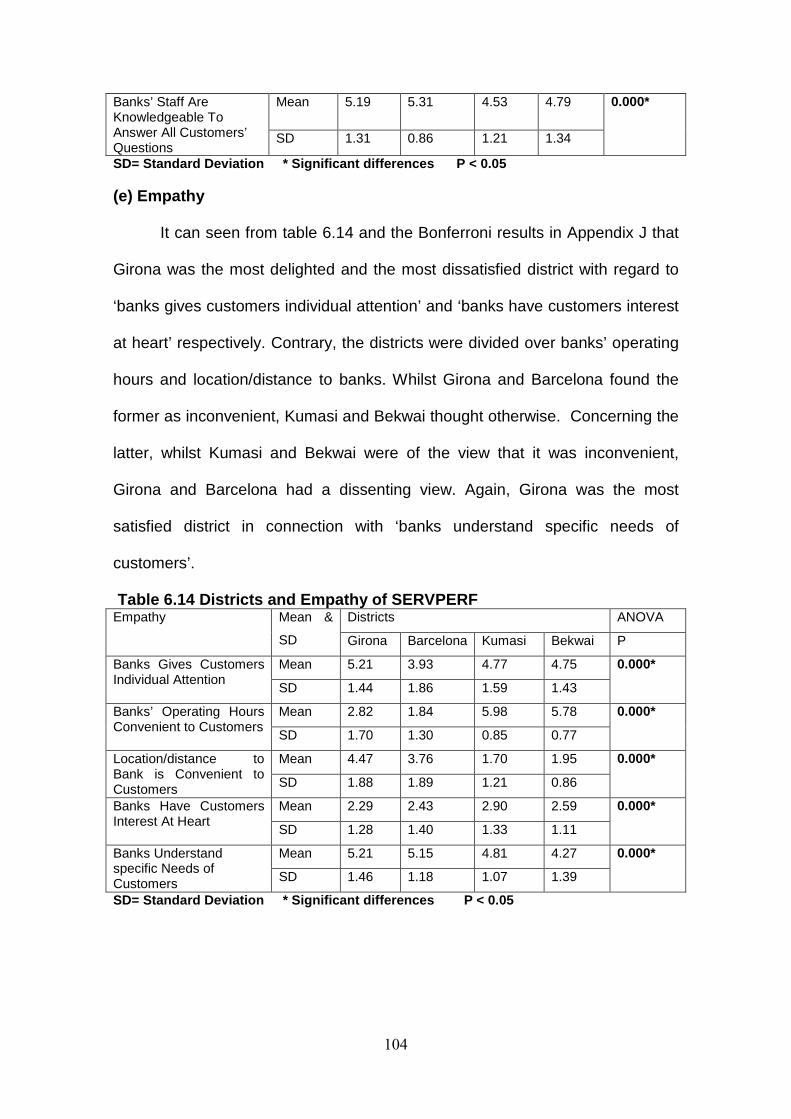
104
Mean 5.19 5.31 4.53 4.79 Banks’ Staff Are Knowledgeable To Answer All Customers’ Questions
SD 1.31 0.86 1.21 1.34
0.000*
SD= Standard Deviation * Significant difference s P < 0.05
(e) Empathy
It can seen from table 6.14 and the Bonferroni results in Appendix J that
Girona was the most delighted and the most dissatisfied district with regard to
‘banks gives customers individual attention’ and ‘banks have customers interest
at heart’ respectively. Contrary, the districts were divided over banks’ operating
hours and location/distance to banks. Whilst Girona and Barcelona found the
former as inconvenient, Kumasi and Bekwai thought otherwise. Concerning the
latter, whilst Kumasi and Bekwai were of the view that it was inconvenient,
Girona and Barcelona had a dissenting view. Again, Girona was the most
satisfied district in connection with ‘banks understand specific needs of
customers’.
Table 6.14 Districts and Empathy of SERVPERF Districts ANOVA Empathy Mean &
SD Girona Barcelona Kumasi Bekwai P
Mean 5.21 3.93 4.77 4.75 Banks Gives Customers Individual Attention
SD 1.44 1.86 1.59 1.43
0.000*
Mean 2.82 1.84 5.98 5.78 Banks’ Operating Hours Convenient to Customers
SD 1.70 1.30 0.85 0.77
0.000*
Mean 4.47 3.76 1.70 1.95 Location/distance to Bank is Convenient to Customers SD 1.88 1.89 1.21 0.86
0.000*
Mean 2.29 2.43 2.90 2.59 Banks Have Customers Interest At Heart
SD 1.28 1.40 1.33 1.11
0.000*
Mean 5.21 5.15 4.81 4.27 Banks Understand specific Needs of Customers SD 1.46 1.18 1.07 1.39
0.000*
SD= Standard Deviation * Significant difference s P < 0.05
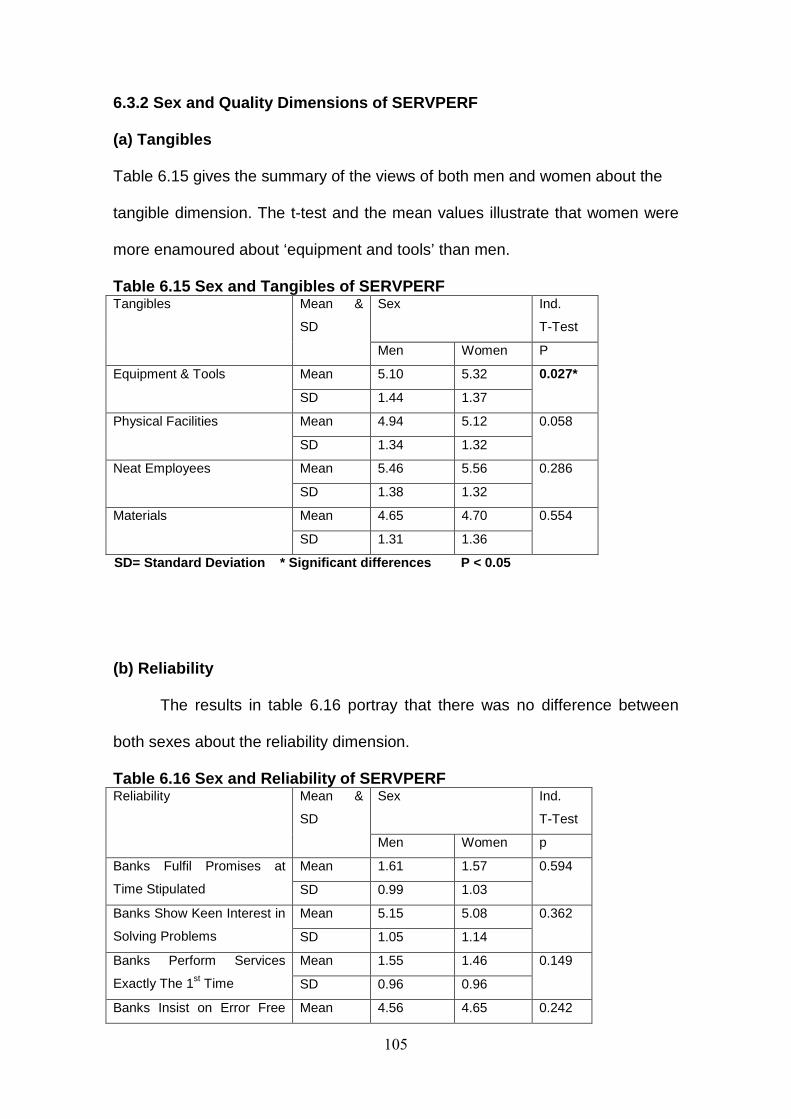
105
6.3.2 Sex and Quality Dimensions of SERVPERF
(a) Tangibles
Table 6.15 gives the summary of the views of both men and women about the
tangible dimension. The t-test and the mean values illustrate that women were
more enamoured about ‘equipment and tools’ than men.
Table 6.15 Sex and Tangibles of SERVPERF Sex Ind.
T-Test
Tangibles Mean &
SD
Men Women P
Mean 5.10 5.32 Equipment & Tools
SD 1.44 1.37
0.027*
Mean 4.94 5.12 Physical Facilities
SD 1.34 1.32
0.058
Mean 5.46 5.56 Neat Employees
SD 1.38 1.32
0.286
Mean 4.65 4.70 Materials
SD 1.31 1.36
0.554
SD= Standard Deviation * Significan t differences P < 0.05
(b) Reliability
The results in table 6.16 portray that there was no difference between
both sexes about the reliability dimension.
Table 6.16 Sex and Reliability of SERVPERF Sex Ind.
T-Test
Reliability Mean &
SD
Men Women p
Mean 1.61 1.57 Banks Fulfil Promises at
Time Stipulated SD 0.99 1.03
0.594
Mean 5.15 5.08 Banks Show Keen Interest in
Solving Problems SD 1.05 1.14
0.362
Mean 1.55 1.46 Banks Perform Services
Exactly The 1st Time SD 0.96 0.96
0.149
Banks Insist on Error Free Mean 4.56 4.65 0.242
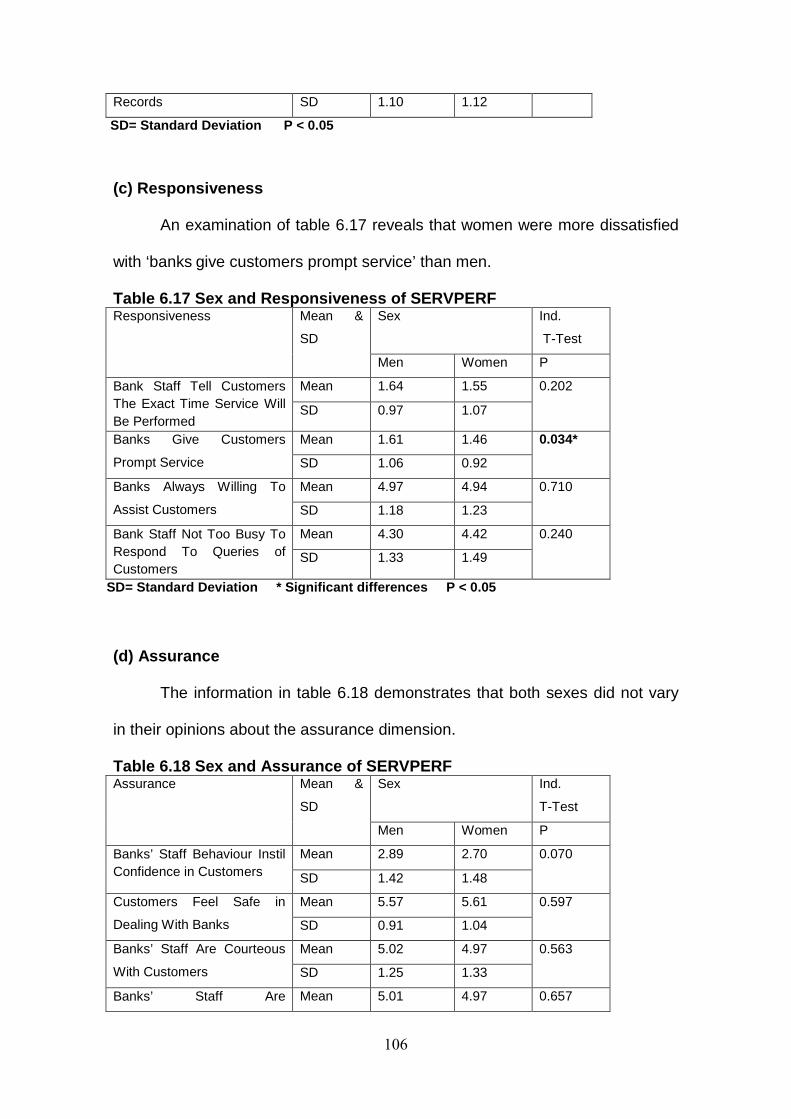
106
Records SD 1.10 1.12
SD= Standard Deviation P < 0.05
(c) Responsiveness
An examination of table 6.17 reveals that women were more dissatisfied
with ‘banks give customers prompt service’ than men.
Table 6.17 Sex and Responsiveness of SERVPERF Sex Ind.
T-Test
Responsiveness Mean &
SD
Men Women P
Mean 1.64 1.55 Bank Staff Tell Customers The Exact Time Service Will Be Performed
SD 0.97 1.07
0.202
Mean 1.61 1.46 Banks Give Customers
Prompt Service SD 1.06 0.92
0.034*
Mean 4.97 4.94 Banks Always Willing To
Assist Customers SD 1.18 1.23
0.710
Mean 4.30 4.42 Bank Staff Not Too Busy To Respond To Queries of Customers
SD 1.33 1.49
0.240
SD= Standard Deviation * Significant differences P < 0.05
(d) Assurance
The information in table 6.18 demonstrates that both sexes did not vary
in their opinions about the assurance dimension.
Table 6.18 Sex and Assurance of SERVPERF Sex Ind.
T-Test
Assurance Mean &
SD
Men Women P
Mean 2.89 2.70 Banks’ Staff Behaviour Instil Confidence in Customers SD 1.42 1.48
0.070
Mean 5.57 5.61 Customers Feel Safe in
Dealing With Banks SD 0.91 1.04
0.597
Mean 5.02 4.97 Banks’ Staff Are Courteous
With Customers SD 1.25 1.33
0.563
Banks’ Staff Are Mean 5.01 4.97 0.657
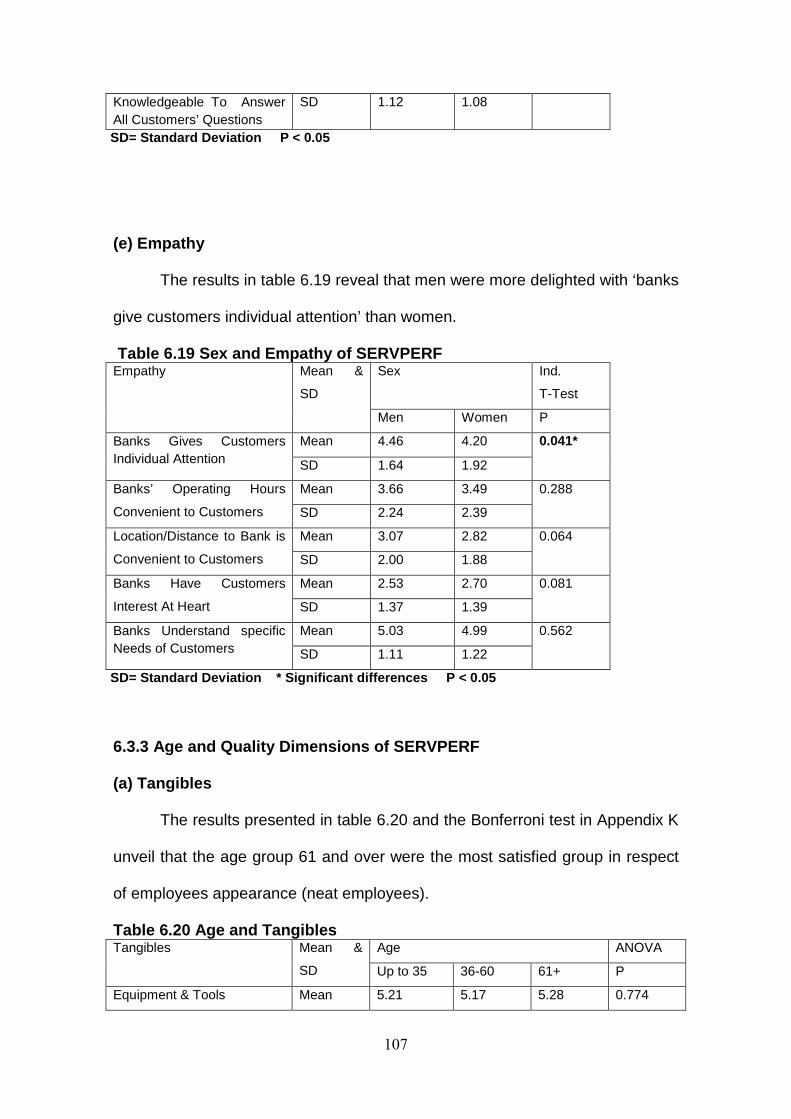
107
Knowledgeable To Answer All Customers’ Questions
SD 1.12 1.08
SD= Standard Deviation P < 0.05
(e) Empathy
The results in table 6.19 reveal that men were more delighted with ‘banks
give customers individual attention’ than women.
Table 6.19 Sex and Empathy of SERVPERF Sex Ind.
T-Test
Empathy Mean &
SD
Men Women P
Mean 4.46 4.20 Banks Gives Customers Individual Attention SD 1.64 1.92
0.041*
Mean 3.66 3.49 Banks’ Operating Hours
Convenient to Customers SD 2.24 2.39
0.288
Mean 3.07 2.82 Location/Distance to Bank is
Convenient to Customers SD 2.00 1.88
0.064
Mean 2.53 2.70 Banks Have Customers
Interest At Heart SD 1.37 1.39
0.081
Mean 5.03 4.99 Banks Understand specific Needs of Customers SD 1.11 1.22
0.562
SD= Standard Deviation * Significant differences P < 0.05
6.3.3 Age and Quality Dimensions of SERVPERF
(a) Tangibles
The results presented in table 6.20 and the Bonferroni test in Appendix K
unveil that the age group 61 and over were the most satisfied group in respect
of employees appearance (neat employees).
Table 6.20 Age and Tangibles Age ANOVA Tangibles Mean &
SD Up to 35 36-60 61+ P
Equipment & Tools Mean 5.21 5.17 5.28 0.774
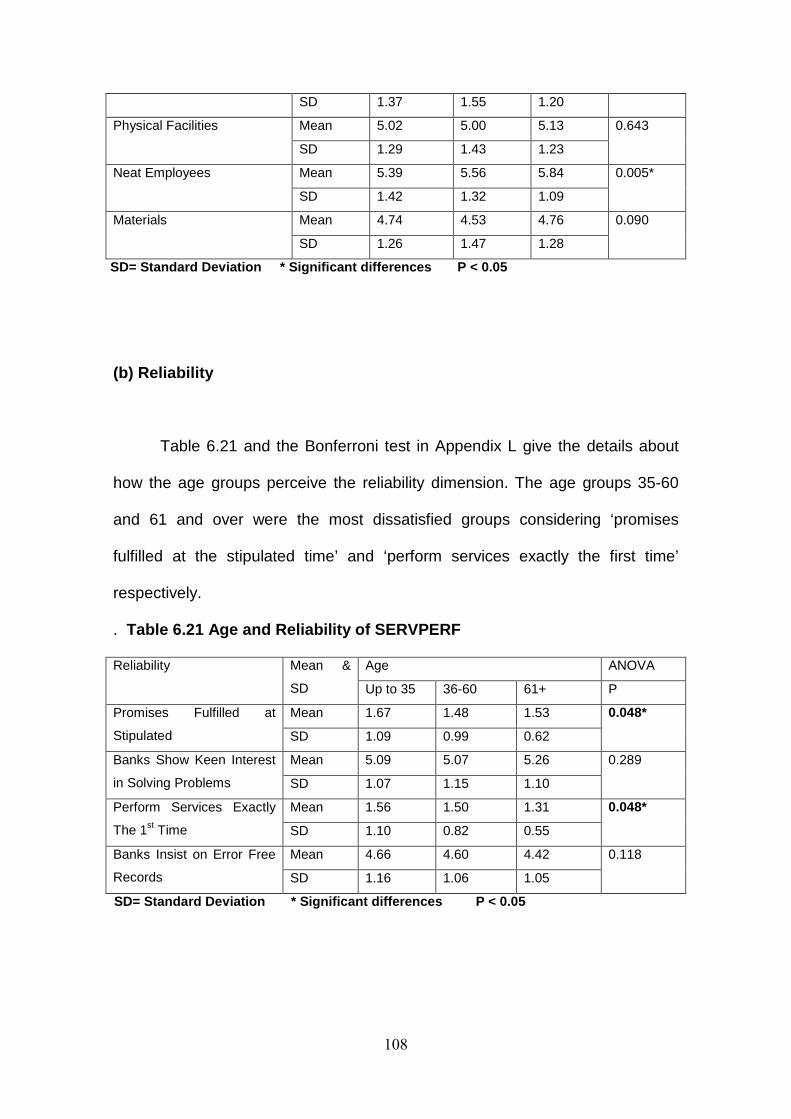
108
SD 1.37 1.55 1.20
Mean 5.02 5.00 5.13 Physical Facilities
SD 1.29 1.43 1.23
0.643
Mean 5.39 5.56 5.84 Neat Employees
SD 1.42 1.32 1.09
0.005*
Mean 4.74 4.53 4.76 Materials
SD 1.26 1.47 1.28
0.090
SD= Standard Deviation * Significan t differences P < 0.05
(b) Reliability
Table 6.21 and the Bonferroni test in Appendix L give the details about
how the age groups perceive the reliability dimension. The age groups 35-60
and 61 and over were the most dissatisfied groups considering ‘promises
fulfilled at the stipulated time’ and ‘perform services exactly the first time’
respectively.
. Table 6.21 Age and Reliability of SERVPERF
Age ANOVA Reliability Mean &
SD Up to 35 36-60 61+ P
Mean 1.67 1.48 1.53 Promises Fulfilled at
Stipulated SD 1.09 0.99 0.62
0.048*
Mean 5.09 5.07 5.26 Banks Show Keen Interest
in Solving Problems SD 1.07 1.15 1.10
0.289
Mean 1.56 1.50 1.31 Perform Services Exactly
The 1st Time SD 1.10 0.82 0.55
0.048*
Mean 4.66 4.60 4.42 Banks Insist on Error Free
Records SD 1.16 1.06 1.05
0.118
SD= Standard Deviation * Signifi cant differences P < 0.05
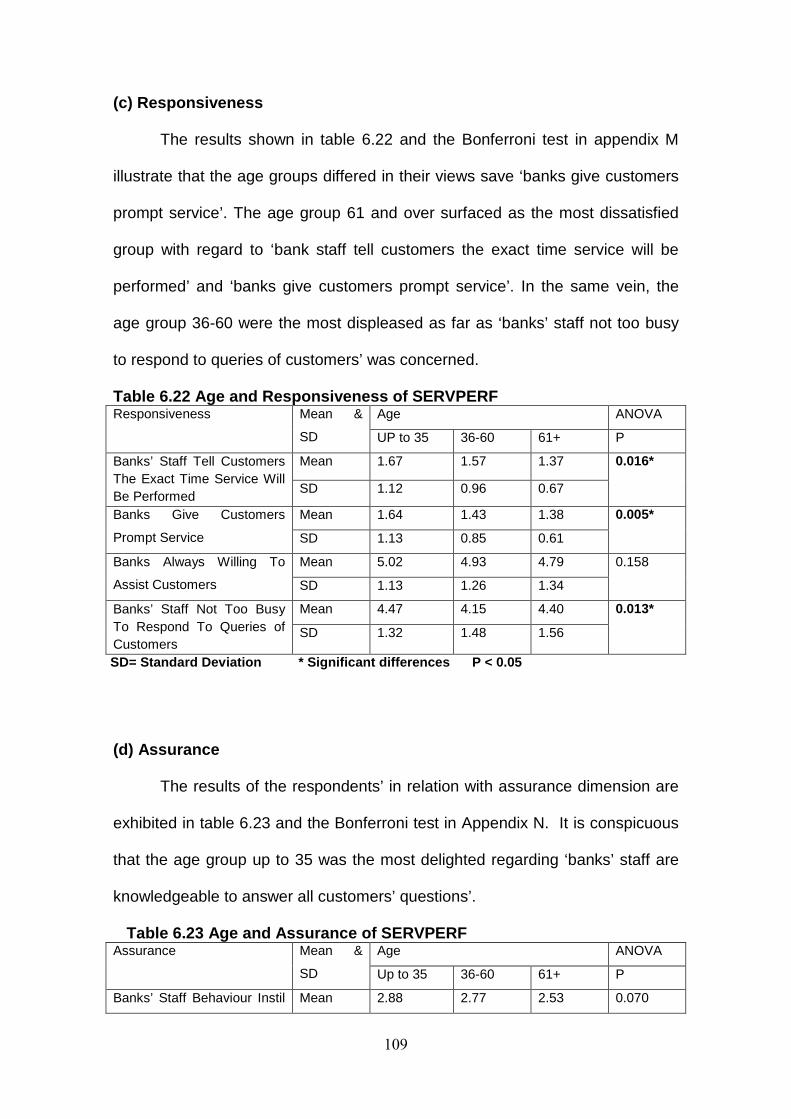
109
(c) Responsiveness
The results shown in table 6.22 and the Bonferroni test in appendix M
illustrate that the age groups differed in their views save ‘banks give customers
prompt service’. The age group 61 and over surfaced as the most dissatisfied
group with regard to ‘bank staff tell customers the exact time service will be
performed’ and ‘banks give customers prompt service’. In the same vein, the
age group 36-60 were the most displeased as far as ‘banks’ staff not too busy
to respond to queries of customers’ was concerned.
Table 6.22 Age and Responsiveness of SERVPERF Age ANOVA Responsiveness Mean &
SD UP to 35 36-60 61+ P
Mean 1.67 1.57 1.37 Banks’ Staff Tell Customers The Exact Time Service Will Be Performed
SD 1.12 0.96 0.67
0.016*
Mean 1.64 1.43 1.38 Banks Give Customers
Prompt Service SD 1.13 0.85 0.61
0.005*
Mean 5.02 4.93 4.79 Banks Always Willing To
Assist Customers SD 1.13 1.26 1.34
0.158
Mean 4.47 4.15 4.40 Banks’ Staff Not Too Busy To Respond To Queries of Customers
SD 1.32 1.48 1.56
0.013*
SD= Standard Deviation * Signi ficant differences P < 0.05
(d) Assurance
The results of the respondents’ in relation with assurance dimension are
exhibited in table 6.23 and the Bonferroni test in Appendix N. It is conspicuous
that the age group up to 35 was the most delighted regarding ‘banks’ staff are
knowledgeable to answer all customers’ questions’.
Table 6.23 Age and Assurance of SERVPERF Age ANOVA Assurance Mean &
SD Up to 35 36-60 61+ P
Banks’ Staff Behaviour Instil Mean 2.88 2.77 2.53 0.070
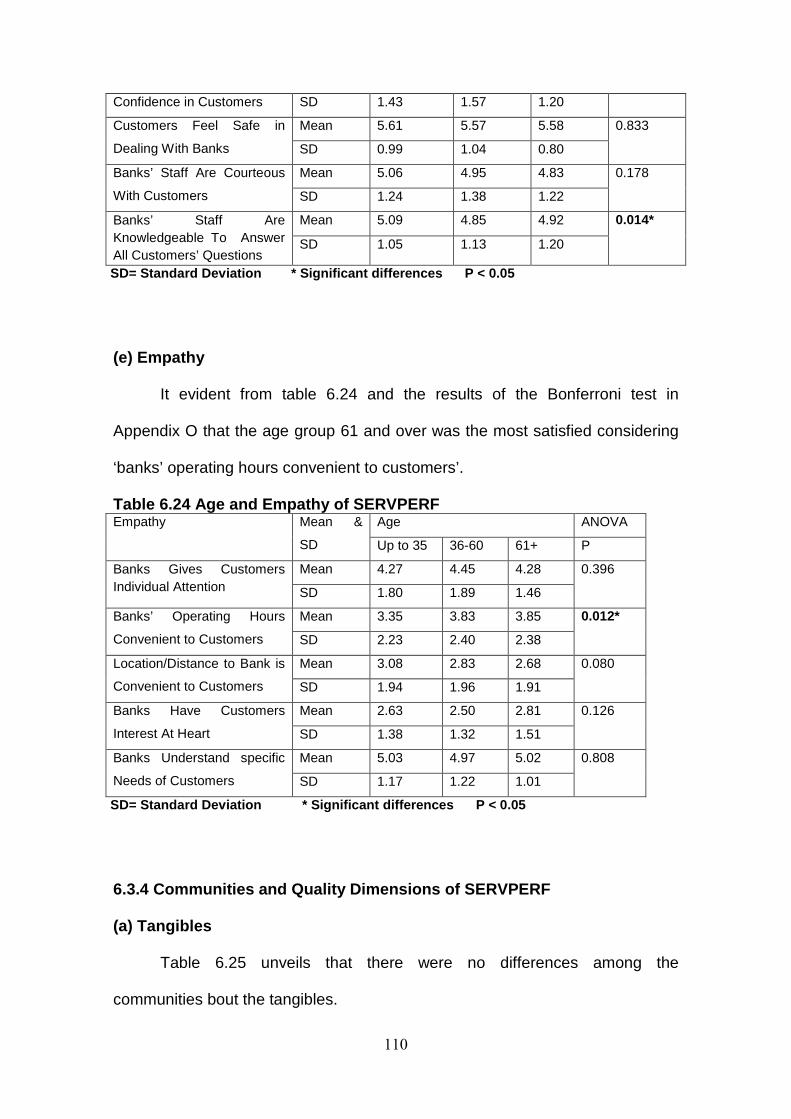
110
Confidence in Customers SD 1.43 1.57 1.20
Mean 5.61 5.57 5.58 Customers Feel Safe in
Dealing With Banks SD 0.99 1.04 0.80
0.833
Mean 5.06 4.95 4.83 Banks’ Staff Are Courteous
With Customers SD 1.24 1.38 1.22
0.178
Mean 5.09 4.85 4.92 Banks’ Staff Are Knowledgeable To Answer All Customers’ Questions
SD 1.05 1.13 1.20
0.014*
SD= Standard Deviation * Signifi cant differences P < 0.05
(e) Empathy
It evident from table 6.24 and the results of the Bonferroni test in
Appendix O that the age group 61 and over was the most satisfied considering
‘banks’ operating hours convenient to customers’.
Table 6.24 Age and Empathy of SERVPERF Age ANOVA Empathy Mean &
SD Up to 35 36-60 61+ P
Mean 4.27 4.45 4.28 Banks Gives Customers Individual Attention SD 1.80 1.89 1.46
0.396
Mean 3.35 3.83 3.85 Banks’ Operating Hours
Convenient to Customers SD 2.23 2.40 2.38
0.012*
Mean 3.08 2.83 2.68 Location/Distance to Bank is
Convenient to Customers SD 1.94 1.96 1.91
0.080
Mean 2.63 2.50 2.81 Banks Have Customers
Interest At Heart SD 1.38 1.32 1.51
0.126
Mean 5.03 4.97 5.02 Banks Understand specific
Needs of Customers SD 1.17 1.22 1.01
0.808
SD= Standard Deviation * Sign ificant differences P < 0.05
6.3.4 Communities and Quality Dimensions of SERVPER F
(a) Tangibles
Table 6.25 unveils that there were no differences among the
communities bout the tangibles.
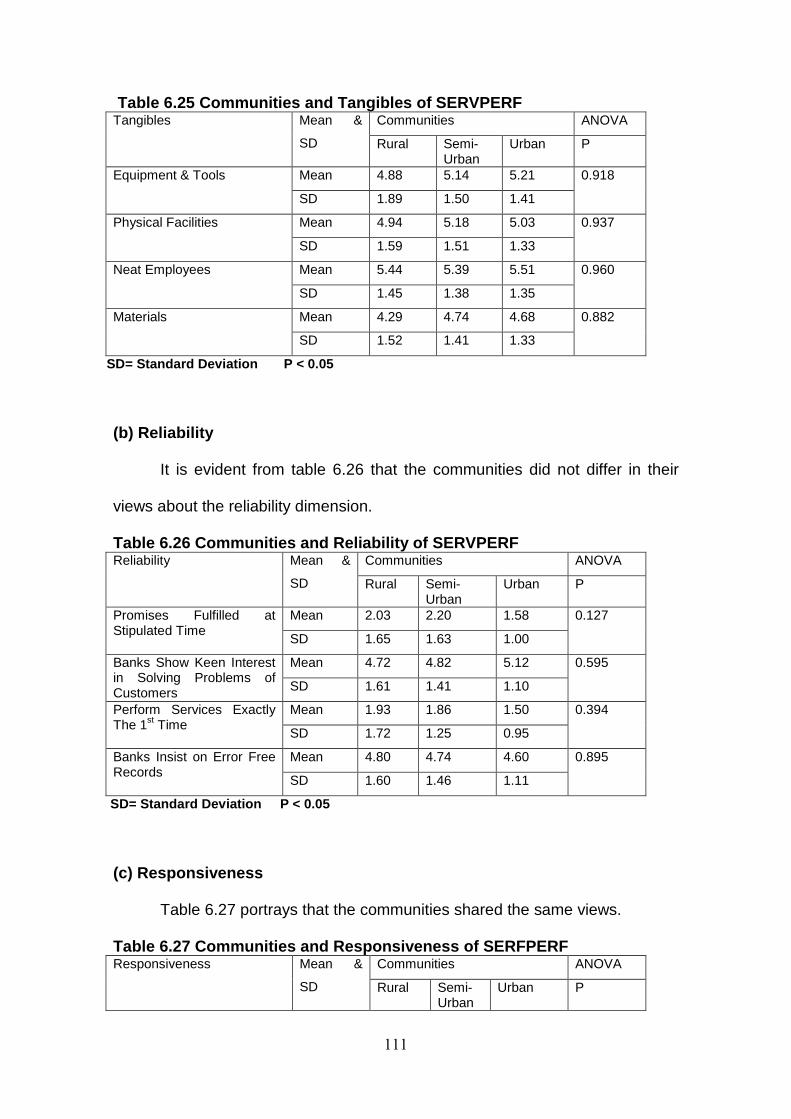
111
Table 6.25 Communities and Tangibles of SERVPERF Communities ANOVA Tangibles Mean &
SD Rural Semi-Urban
Urban P
Mean 4.88 5.14 5.21 Equipment & Tools
SD 1.89 1.50 1.41
0.918
Mean 4.94 5.18 5.03 Physical Facilities
SD 1.59 1.51 1.33
0.937
Mean 5.44 5.39 5.51 Neat Employees
SD 1.45 1.38 1.35
0.960
Mean 4.29 4.74 4.68 Materials
SD 1.52 1.41 1.33
0.882
SD= Standard Deviation P < 0.05
(b) Reliability
It is evident from table 6.26 that the communities did not differ in their
views about the reliability dimension.
Table 6.26 Communities and Reliability of SERVPERF Communities ANOVA Reliability Mean &
SD Rural Semi-Urban
Urban P
Mean 2.03 2.20 1.58 Promises Fulfilled at Stipulated Time
SD 1.65 1.63 1.00
0.127
Mean 4.72 4.82 5.12 Banks Show Keen Interest in Solving Problems of Customers SD 1.61 1.41 1.10
0.595
Mean 1.93 1.86 1.50 Perform Services Exactly The 1st Time
SD 1.72 1.25 0.95
0.394
Mean 4.80 4.74 4.60 Banks Insist on Error Free Records
SD 1.60 1.46 1.11
0.895
SD= Standard Deviation P < 0.05
(c) Responsiveness
Table 6.27 portrays that the communities shared the same views.
Table 6.27 Communities and Responsiveness of SERFPE RF Communities ANOVA Responsiveness Mean &
SD Rural Semi-Urban
Urban P
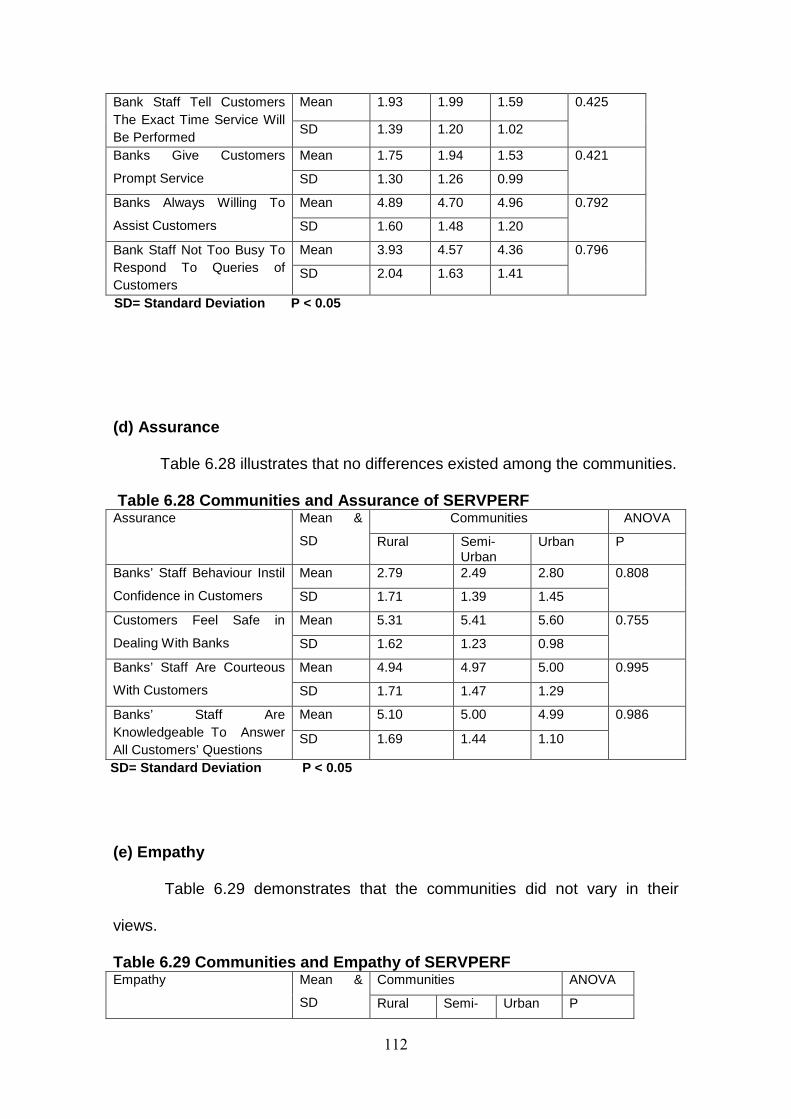
112
Mean 1.93 1.99 1.59 Bank Staff Tell Customers The Exact Time Service Will Be Performed
SD 1.39 1.20 1.02
0.425
Mean 1.75 1.94 1.53 Banks Give Customers
Prompt Service SD 1.30 1.26 0.99
0.421
Mean 4.89 4.70 4.96 Banks Always Willing To
Assist Customers SD 1.60 1.48 1.20
0.792
Mean 3.93 4.57 4.36 Bank Staff Not Too Busy To Respond To Queries of Customers
SD 2.04 1.63 1.41
0.796
SD= Standard Deviation P < 0.05
(d) Assurance
Table 6.28 illustrates that no differences existed among the communities.
Table 6.28 Communities and Assurance of SERVPERF Communities ANOVA Assurance Mean &
SD Rural Semi-Urban
Urban P
Mean 2.79 2.49 2.80 Banks’ Staff Behaviour Instil
Confidence in Customers SD 1.71 1.39 1.45
0.808
Mean 5.31 5.41 5.60 Customers Feel Safe in
Dealing With Banks SD 1.62 1.23 0.98
0.755
Mean 4.94 4.97 5.00 Banks’ Staff Are Courteous
With Customers SD 1.71 1.47 1.29
0.995
Mean 5.10 5.00 4.99 Banks’ Staff Are Knowledgeable To Answer All Customers’ Questions
SD 1.69 1.44 1.10
0.986
SD= Standard Deviation P < 0. 05
(e) Empathy
Table 6.29 demonstrates that the communities did not vary in their
views.
Table 6.29 Communities and Empathy of SERVPERF Communities ANOVA Empathy Mean &
SD Rural Semi- Urban P
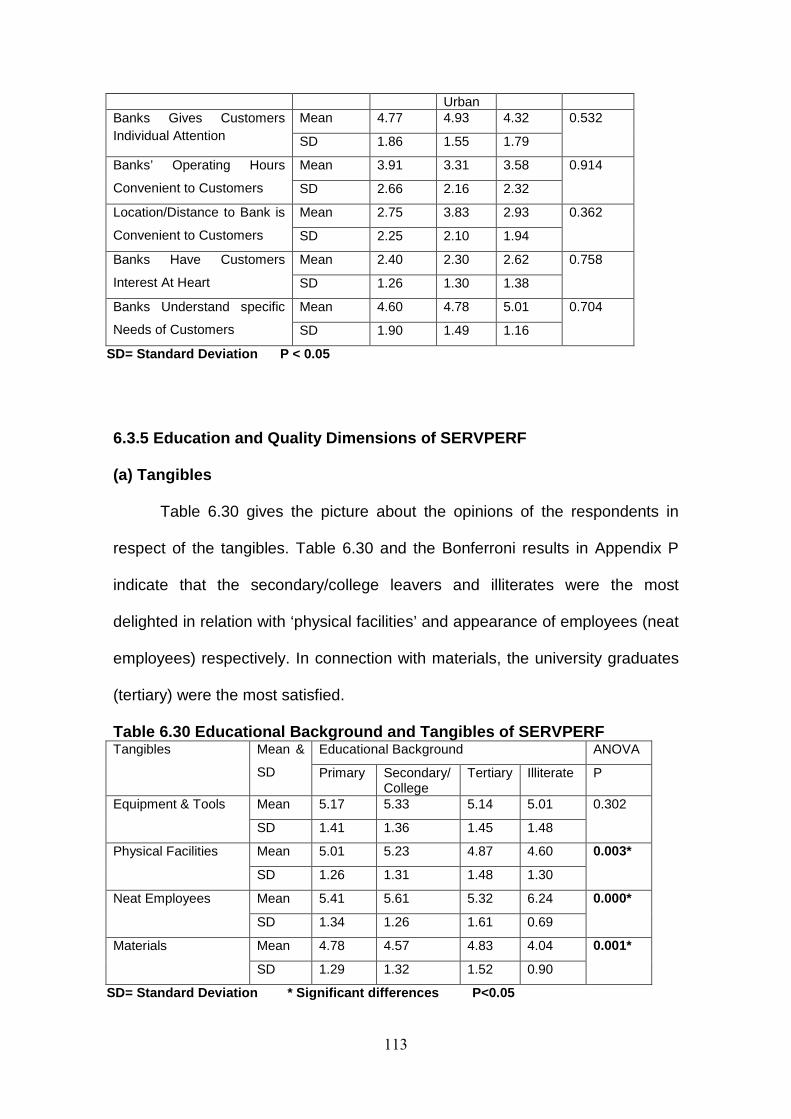
113
Urban Mean 4.77 4.93 4.32 Banks Gives Customers
Individual Attention SD 1.86 1.55 1.79
0.532
Mean 3.91 3.31 3.58 Banks’ Operating Hours
Convenient to Customers SD 2.66 2.16 2.32
0.914
Mean 2.75 3.83 2.93 Location/Distance to Bank is
Convenient to Customers SD 2.25 2.10 1.94
0.362
Mean 2.40 2.30 2.62 Banks Have Customers
Interest At Heart SD 1.26 1.30 1.38
0.758
Mean 4.60 4.78 5.01 Banks Understand specific
Needs of Customers SD 1.90 1.49 1.16
0.704
SD= Standard Deviation P < 0.05
6.3.5 Education and Quality Dimensions of SERVPERF
(a) Tangibles
Table 6.30 gives the picture about the opinions of the respondents in
respect of the tangibles. Table 6.30 and the Bonferroni results in Appendix P
indicate that the secondary/college leavers and illiterates were the most
delighted in relation with ‘physical facilities’ and appearance of employees (neat
employees) respectively. In connection with materials, the university graduates
(tertiary) were the most satisfied.
Table 6.30 Educational Background and Tangibles of SERVPERF Educational Background ANOVA Tangibles Mean &
SD Primary Secondary/ College
Tertiary Illiterate P
Mean 5.17 5.33 5.14 5.01 Equipment & Tools
SD 1.41 1.36 1.45 1.48
0.302
Mean 5.01 5.23 4.87 4.60 Physical Facilities
SD 1.26 1.31 1.48 1.30
0.003*
Mean 5.41 5.61 5.32 6.24 Neat Employees
SD 1.34 1.26 1.61 0.69
0.000*
Mean 4.78 4.57 4.83 4.04 Materials
SD 1.29 1.32 1.52 0.90
0.001*
SD= Standard Deviation * Signific ant differences P<0.05
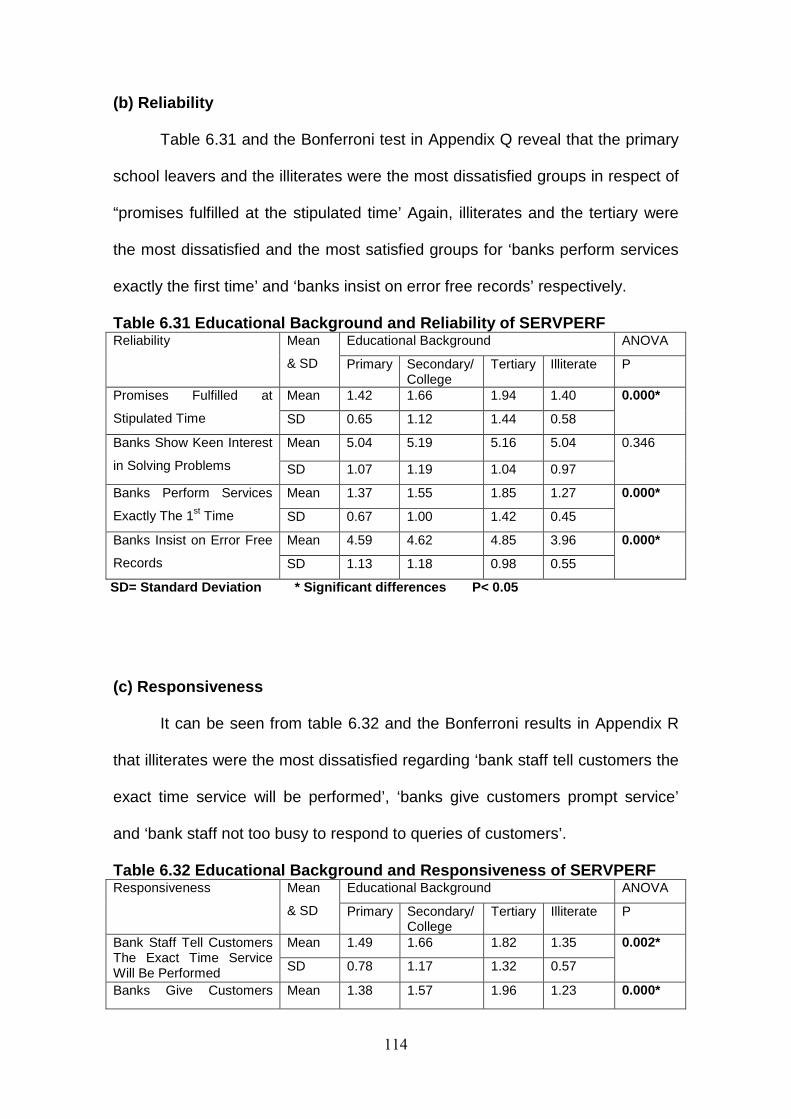
114
(b) Reliability
Table 6.31 and the Bonferroni test in Appendix Q reveal that the primary
school leavers and the illiterates were the most dissatisfied groups in respect of
“promises fulfilled at the stipulated time’ Again, illiterates and the tertiary were
the most dissatisfied and the most satisfied groups for ‘banks perform services
exactly the first time’ and ‘banks insist on error free records’ respectively.
Table 6.31 Educational Background and Reliability o f SERVPERF Educational Background ANOVA Reliability Mean
& SD Primary Secondary/ College
Tertiary Illiterate P
Mean 1.42 1.66 1.94 1.40 Promises Fulfilled at
Stipulated Time SD 0.65 1.12 1.44 0.58
0.000*
Mean 5.04 5.19 5.16 5.04 Banks Show Keen Interest
in Solving Problems SD 1.07 1.19 1.04 0.97
0.346
Mean 1.37 1.55 1.85 1.27 Banks Perform Services
Exactly The 1st Time SD 0.67 1.00 1.42 0.45
0.000*
Mean 4.59 4.62 4.85 3.96 Banks Insist on Error Free
Records SD 1.13 1.18 0.98 0.55
0.000*
SD= Standard Deviation * Signif icant differences P< 0.05
(c) Responsiveness
It can be seen from table 6.32 and the Bonferroni results in Appendix R
that illiterates were the most dissatisfied regarding ‘bank staff tell customers the
exact time service will be performed’, ‘banks give customers prompt service’
and ‘bank staff not too busy to respond to queries of customers’.
Table 6.32 Educational Background and Responsivenes s of SERVPERF Educational Background ANOVA Responsiveness Mean
& SD Primary Secondary/ College
Tertiary Illiterate P
Mean 1.49 1.66 1.82 1.35 Bank Staff Tell Customers The Exact Time Service Will Be Performed SD 0.78 1.17 1.32 0.57
0.002*
Banks Give Customers Mean 1.38 1.57 1.96 1.23 0.000*

115
Prompt Service SD 0.65 0.96 1.59 0.44
Mean 4.95 5.00 4.92 4.90 Banks Always Willing To Assist Customers
SD 1.22 1.15 1.13 1.60
0.901
Mean 4.38 4.53 4.51 2.91 Bank Staff Not Too Busy To Respond To Queries of Customers SD 1.45 1.39 1.25 0.84
0.000*
SD= Standard Deviation * Signif icant differences P<0.05
(d) Assurance
Table 6.33 and the Bonferroni test in Appendix S indicate that illiterates
and the secondary/college graduates were the most dissatisfied and most
delighted considering ‘banks’ staff behaviour instil confidence in customers’ and
‘banks’ staff are courteous with customers’ respectively. In the same vein, the
primary school leavers were the most satisfied in relation with ‘banks’ staff are
knowledgeable to answer all customers’ questions’.
Table 6.33 Educational Background and Assurance of SERVPERF Educational Background ANOVA Assurance Mean &
SD Primary Secondary/
College
Tertiary Illiterate P
Mean 2.90 2.74 2.83 2.28 Banks’ Staff Behaviour Instil
Confidence in Customers SD 1.53 1.35 1.49 1.14
0.032
Mean 5.60 5.51 5.60 5.90 Customers Feel Safe in
Dealing With Banks SD 1.09 0.83 0.96 0.84
0.068
Mean 4.89 5.23 5.14 4.12 Banks’ Staff Are Courteous
With Customers SD 1.30 1.28 1.16 1.17
0.000
Mean 5.15 4.87 4.99 4.49 Banks’ Staff Are
Knowledgeable To Answer
All Customers’ Questions SD 1.03 1.15 1.06 1.23
0.000
SD= Standard Deviation * Signi ficant differences P< 0.05
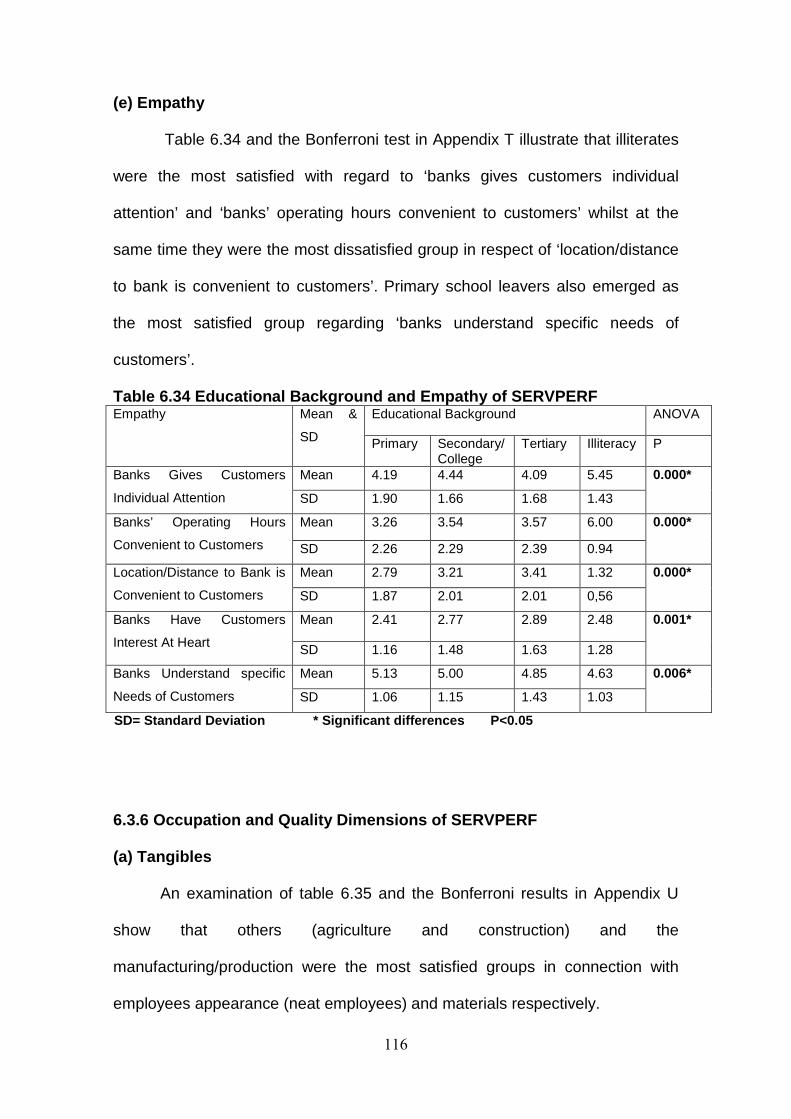
116
(e) Empathy
Table 6.34 and the Bonferroni test in Appendix T illustrate that illiterates
were the most satisfied with regard to ‘banks gives customers individual
attention’ and ‘banks’ operating hours convenient to customers’ whilst at the
same time they were the most dissatisfied group in respect of ‘location/distance
to bank is convenient to customers’. Primary school leavers also emerged as
the most satisfied group regarding ‘banks understand specific needs of
customers’.
Table 6.34 Educational Background and Empathy of SE RVPERF Educational Background ANOVA Empathy Mean &
SD Primary Secondary/College
Tertiary Illiteracy P
Mean 4.19 4.44 4.09 5.45 Banks Gives Customers
Individual Attention SD 1.90 1.66 1.68 1.43
0.000*
Mean 3.26 3.54 3.57 6.00 Banks’ Operating Hours
Convenient to Customers SD 2.26 2.29 2.39 0.94
0.000*
Mean 2.79 3.21 3.41 1.32 Location/Distance to Bank is
Convenient to Customers SD 1.87 2.01 2.01 0,56
0.000*
Mean 2.41 2.77 2.89 2.48 Banks Have Customers
Interest At Heart SD 1.16 1.48 1.63 1.28
0.001*
Mean 5.13 5.00 4.85 4.63 Banks Understand specific
Needs of Customers SD 1.06 1.15 1.43 1.03
0.006*
SD= Standard Deviation * S ignificant differences P<0.05
6.3.6 Occupation and Quality Dimensions of SERVPERF
(a) Tangibles
An examination of table 6.35 and the Bonferroni results in Appendix U
show that others (agriculture and construction) and the
manufacturing/production were the most satisfied groups in connection with
employees appearance (neat employees) and materials respectively.
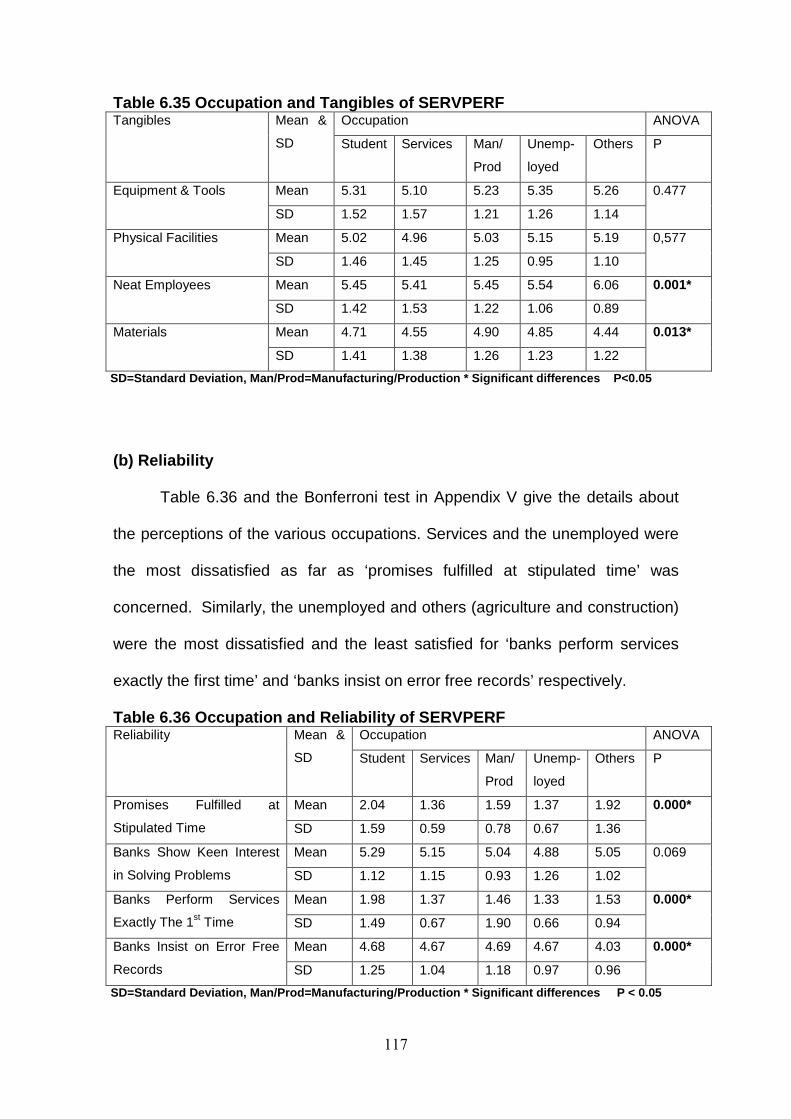
117
Table 6.35 Occupation and Tangibles of SERVPERF Occupation ANOVA Tangibles Mean &
SD Student Services Man/
Prod
Unemp-
loyed
Others P
Mean 5.31 5.10 5.23 5.35 5.26 Equipment & Tools
SD 1.52 1.57 1.21 1.26 1.14
0.477
Mean 5.02 4.96 5.03 5.15 5.19 Physical Facilities
SD 1.46 1.45 1.25 0.95 1.10
0,577
Mean 5.45 5.41 5.45 5.54 6.06 Neat Employees
SD 1.42 1.53 1.22 1.06 0.89
0.001*
Mean 4.71 4.55 4.90 4.85 4.44 Materials
SD 1.41 1.38 1.26 1.23 1.22
0.013*
SD=Standard Deviation, Man/Prod=Manufacturing/Productio n * Significant differences P<0.05
(b) Reliability
Table 6.36 and the Bonferroni test in Appendix V give the details about
the perceptions of the various occupations. Services and the unemployed were
the most dissatisfied as far as ‘promises fulfilled at stipulated time’ was
concerned. Similarly, the unemployed and others (agriculture and construction)
were the most dissatisfied and the least satisfied for ‘banks perform services
exactly the first time’ and ‘banks insist on error free records’ respectively.
Table 6.36 Occupation and Reliability of SERVPERF Occupation ANOVA Reliability Mean &
SD Student Services Man/
Prod
Unemp-
loyed
Others P
Mean 2.04 1.36 1.59 1.37 1.92 Promises Fulfilled at
Stipulated Time SD 1.59 0.59 0.78 0.67 1.36
0.000*
Mean 5.29 5.15 5.04 4.88 5.05 Banks Show Keen Interest
in Solving Problems SD 1.12 1.15 0.93 1.26 1.02
0.069
Mean 1.98 1.37 1.46 1.33 1.53 Banks Perform Services
Exactly The 1st Time SD 1.49 0.67 1.90 0.66 0.94
0.000*
Mean 4.68 4.67 4.69 4.67 4.03 Banks Insist on Error Free
Records SD 1.25 1.04 1.18 0.97 0.96
0.000*
SD=Standard Deviation, Man/Prod=Manufacturing/Productio n * Significant differences P < 0.05
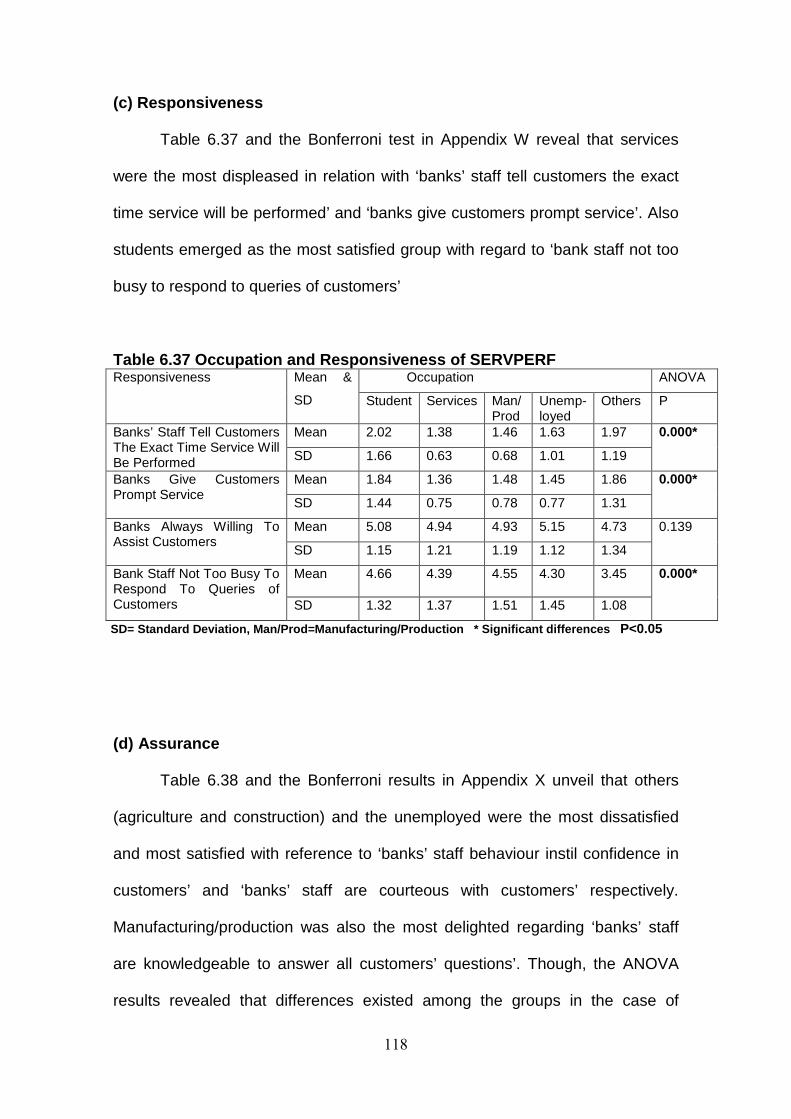
118
(c) Responsiveness
Table 6.37 and the Bonferroni test in Appendix W reveal that services
were the most displeased in relation with ‘banks’ staff tell customers the exact
time service will be performed’ and ‘banks give customers prompt service’. Also
students emerged as the most satisfied group with regard to ‘bank staff not too
busy to respond to queries of customers’
Table 6.37 Occupation and Responsiveness of SERVPER F Occupation ANOVA Responsiveness Mean &
SD Student Services Man/ Prod
Unemp-loyed
Others P
Mean 2.02 1.38 1.46 1.63 1.97 Banks’ Staff Tell Customers The Exact Time Service Will Be Performed SD 1.66 0.63 0.68 1.01 1.19
0.000*
Mean 1.84 1.36 1.48 1.45 1.86 Banks Give Customers Prompt Service
SD 1.44 0.75 0.78 0.77 1.31
0.000*
Mean 5.08 4.94 4.93 5.15 4.73 Banks Always Willing To Assist Customers
SD 1.15 1.21 1.19 1.12 1.34
0.139
Mean 4.66 4.39 4.55 4.30 3.45 Bank Staff Not Too Busy To Respond To Queries of Customers SD 1.32 1.37 1.51 1.45 1.08
0.000*
SD= Standard Deviation, Man/Prod=Manufacturing/Producti on * Significant differences P<0.05
(d) Assurance
Table 6.38 and the Bonferroni results in Appendix X unveil that others
(agriculture and construction) and the unemployed were the most dissatisfied
and most satisfied with reference to ‘banks’ staff behaviour instil confidence in
customers’ and ‘banks’ staff are courteous with customers’ respectively.
Manufacturing/production was also the most delighted regarding ‘banks’ staff
are knowledgeable to answer all customers’ questions’. Though, the ANOVA
results revealed that differences existed among the groups in the case of
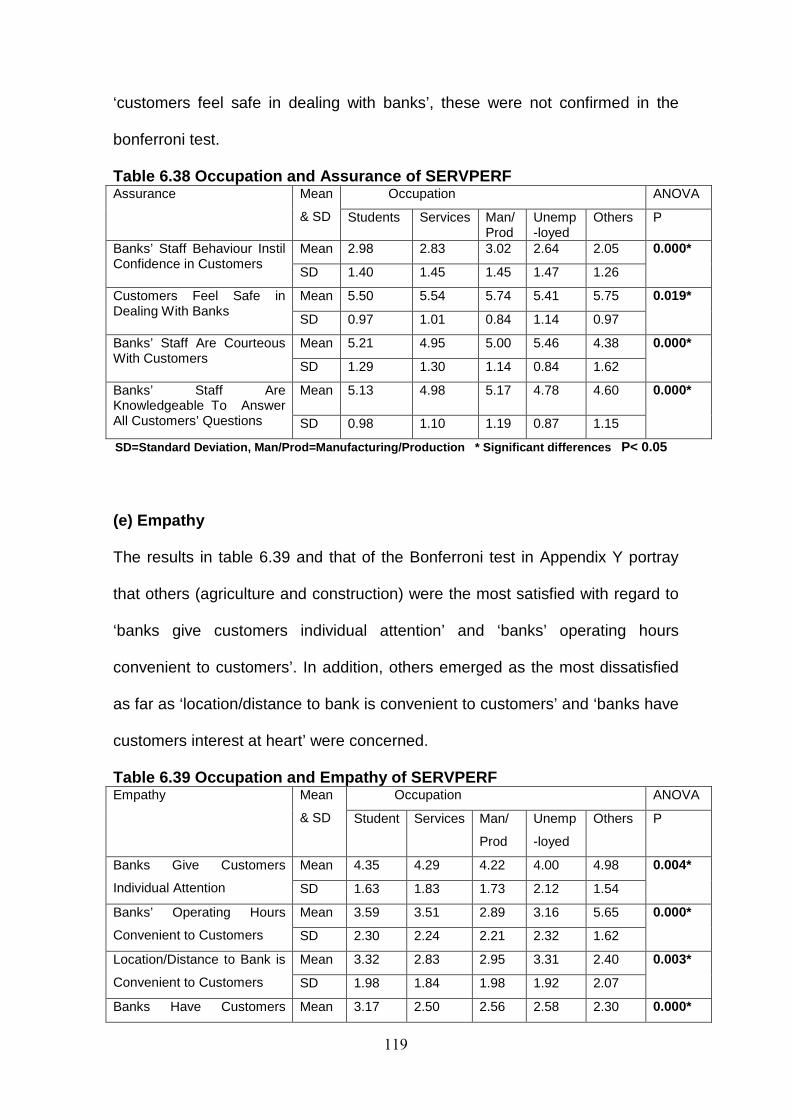
119
‘customers feel safe in dealing with banks’, these were not confirmed in the
bonferroni test.
Table 6.38 Occupation and Assurance of SERVPERF Occupation ANOVA Assurance Mean
& SD Students Services Man/ Prod
Unemp-loyed
Others P
Mean 2.98 2.83 3.02 2.64 2.05 Banks’ Staff Behaviour Instil Confidence in Customers
SD 1.40 1.45 1.45 1.47 1.26
0.000*
Mean 5.50 5.54 5.74 5.41 5.75 Customers Feel Safe in Dealing With Banks
SD 0.97 1.01 0.84 1.14 0.97
0.019*
Mean 5.21 4.95 5.00 5.46 4.38 Banks’ Staff Are Courteous With Customers
SD 1.29 1.30 1.14 0.84 1.62
0.000*
Mean 5.13 4.98 5.17 4.78 4.60 Banks’ Staff Are Knowledgeable To Answer All Customers’ Questions SD 0.98 1.10 1.19 0.87 1.15
0.000*
SD=Standard Deviation, Man/Prod=Manufacturing/Productio n * Significant differences P< 0.05
(e) Empathy
The results in table 6.39 and that of the Bonferroni test in Appendix Y portray
that others (agriculture and construction) were the most satisfied with regard to
‘banks give customers individual attention’ and ‘banks’ operating hours
convenient to customers’. In addition, others emerged as the most dissatisfied
as far as ‘location/distance to bank is convenient to customers’ and ‘banks have
customers interest at heart’ were concerned.
Table 6.39 Occupation and Empathy of SERVPERF Occupation ANOVA Empathy Mean
& SD Student Services Man/
Prod
Unemp
-loyed
Others P
Mean 4.35 4.29 4.22 4.00 4.98 Banks Give Customers
Individual Attention SD 1.63 1.83 1.73 2.12 1.54
0.004*
Mean 3.59 3.51 2.89 3.16 5.65 Banks’ Operating Hours
Convenient to Customers SD 2.30 2.24 2.21 2.32 1.62
0.000*
Mean 3.32 2.83 2.95 3.31 2.40 Location/Distance to Bank is
Convenient to Customers SD 1.98 1.84 1.98 1.92 2.07
0.003*
Banks Have Customers Mean 3.17 2.50 2.56 2.58 2.30 0.000*
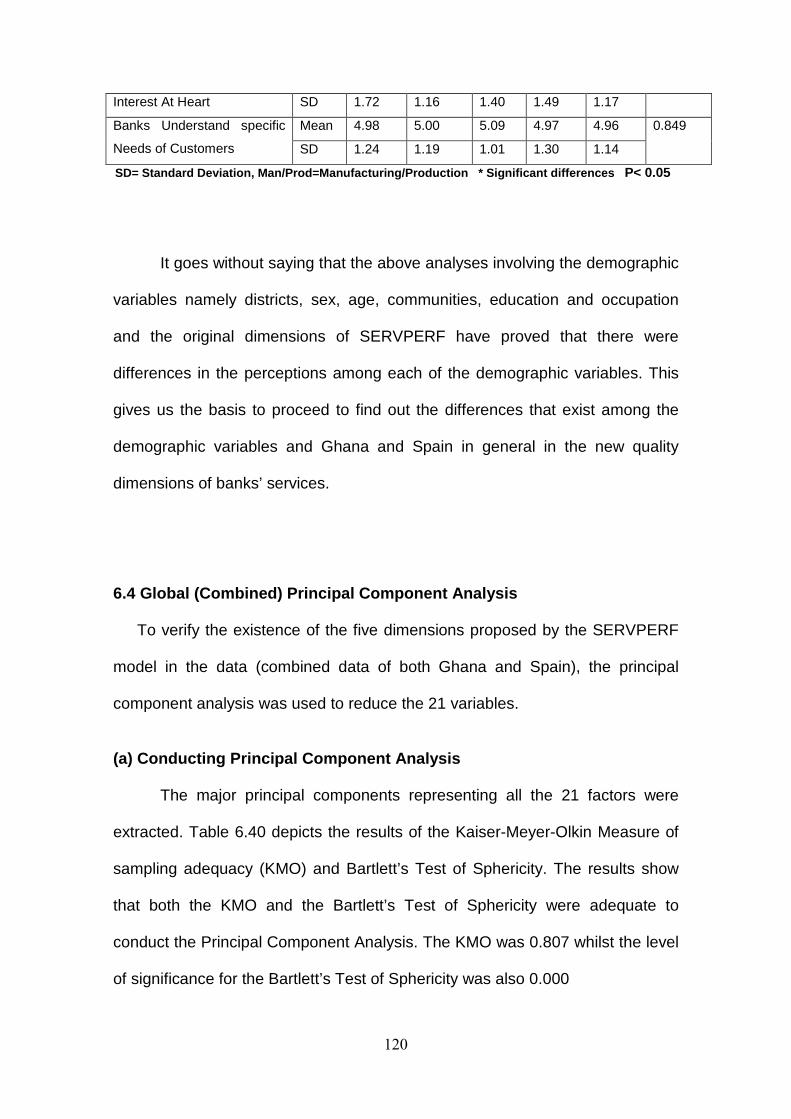
120
Interest At Heart SD 1.72 1.16 1.40 1.49 1.17
Mean 4.98 5.00 5.09 4.97 4.96 Banks Understand specific
Needs of Customers SD 1.24 1.19 1.01 1.30 1.14
0.849
SD= Standard Deviation, Man/Prod=Manufacturing/Producti on * Significant differences P< 0.05
It goes without saying that the above analyses involving the demographic
variables namely districts, sex, age, communities, education and occupation
and the original dimensions of SERVPERF have proved that there were
differences in the perceptions among each of the demographic variables. This
gives us the basis to proceed to find out the differences that exist among the
demographic variables and Ghana and Spain in general in the new quality
dimensions of banks’ services.
6.4 Global (Combined) Principal Component Analysis
To verify the existence of the five dimensions proposed by the SERVPERF
model in the data (combined data of both Ghana and Spain), the principal
component analysis was used to reduce the 21 variables.
(a) Conducting Principal Component Analysis The major principal components representing all the 21 factors were
extracted. Table 6.40 depicts the results of the Kaiser-Meyer-Olkin Measure of
sampling adequacy (KMO) and Bartlett’s Test of Sphericity. The results show
that both the KMO and the Bartlett’s Test of Sphericity were adequate to
conduct the Principal Component Analysis. The KMO was 0.807 whilst the level
of significance for the Bartlett’s Test of Sphericity was also 0.000
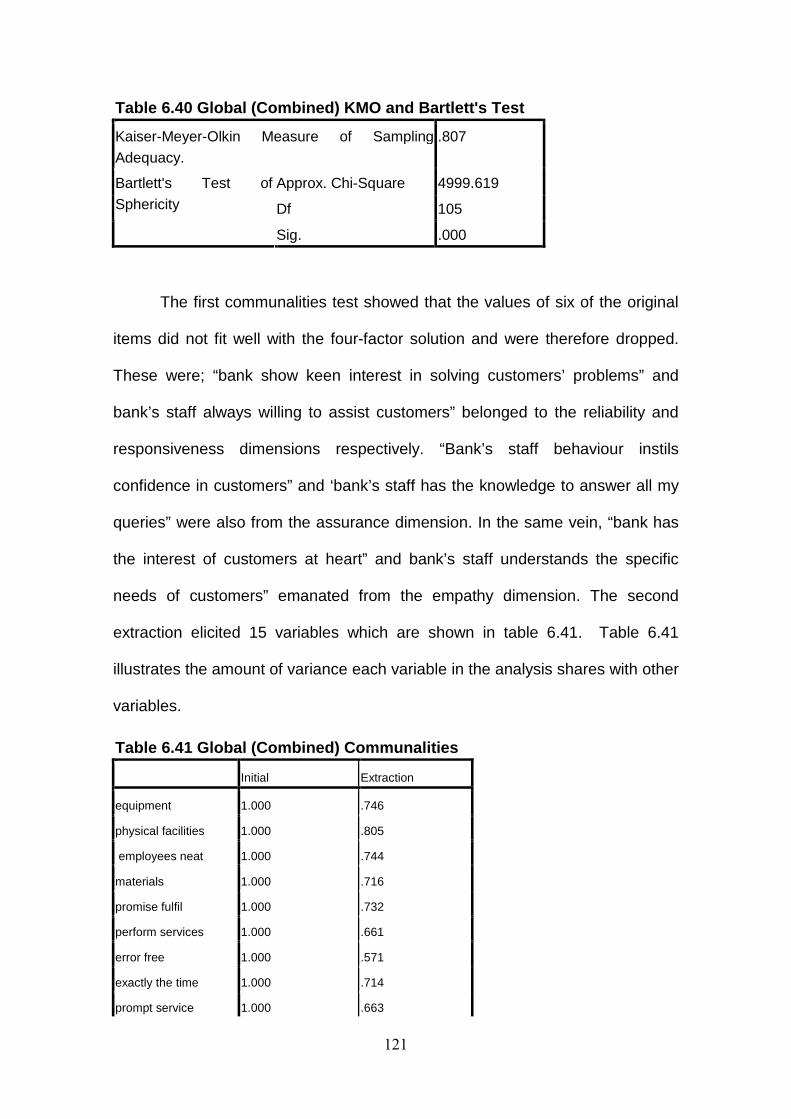
121
Table 6.40 Global (Combined) KMO and Bartlett's Tes t
Kaiser-Meyer-Olkin Measure of Sampling
Adequacy.
.807
Approx. Chi-Square 4999.619
Df 105
Bartlett's Test of
Sphericity
Sig. .000
The first communalities test showed that the values of six of the original
items did not fit well with the four-factor solution and were therefore dropped.
These were; “bank show keen interest in solving customers’ problems” and
bank’s staff always willing to assist customers” belonged to the reliability and
responsiveness dimensions respectively. “Bank’s staff behaviour instils
confidence in customers” and ‘bank’s staff has the knowledge to answer all my
queries” were also from the assurance dimension. In the same vein, “bank has
the interest of customers at heart” and bank’s staff understands the specific
needs of customers” emanated from the empathy dimension. The second
extraction elicited 15 variables which are shown in table 6.41. Table 6.41
illustrates the amount of variance each variable in the analysis shares with other
variables.
Table 6.41 Global (Combined) Communalities
Initial Extraction
equipment 1.000 .746
physical facilities 1.000 .805
employees neat 1.000 .744
materials 1.000 .716
promise fulfil 1.000 .732
perform services 1.000 .661
error free 1.000 .571
exactly the time 1.000 .714
prompt service 1.000 .663
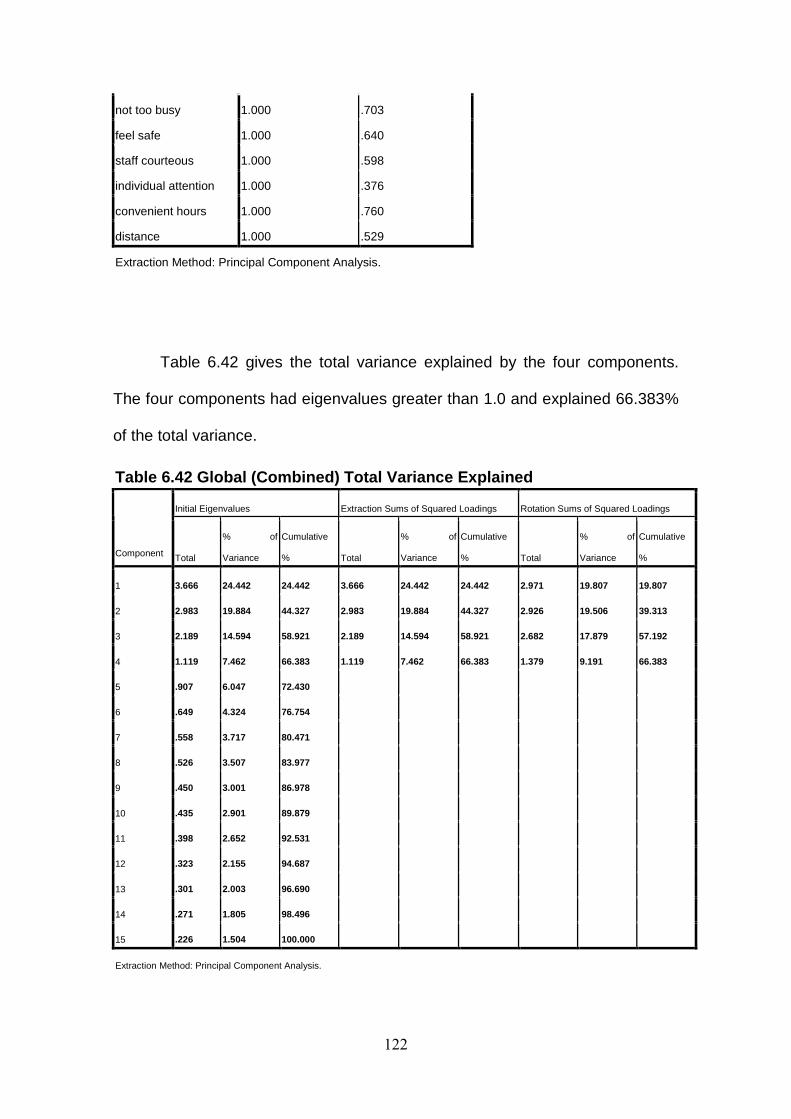
122
not too busy 1.000 .703
feel safe 1.000 .640
staff courteous 1.000 .598
individual attention 1.000 .376
convenient hours 1.000 .760
distance 1.000 .529
Extraction Method: Principal Component Analysis.
Table 6.42 gives the total variance explained by the four components.
The four components had eigenvalues greater than 1.0 and explained 66.383%
of the total variance.
Table 6.42 Global (Combined) Total Variance Explain ed
Initial Eigenvalues Extraction Sums of Squared Loadings Rotation Sums of Squared Loadings
Component Total
% of
Variance
Cumulative
% Total
% of
Variance
Cumulative
% Total
% of
Variance
Cumulative
%
1 3.666 24.442 24.442 3.666 24.442 24.442 2.971 19.807 19.807
2 2.983 19.884 44.327 2.983 19.884 44.327 2.926 19.506 39.313
3 2.189 14.594 58.921 2.189 14.594 58.921 2.682 17.879 57.192
4 1.119 7.462 66.383 1.119 7.462 66.383 1.379 9.191 66.383
5 .907 6.047 72.430
6 .649 4.324 76.754
7 .558 3.717 80.471
8 .526 3.507 83.977
9 .450 3.001 86.978
10 .435 2.901 89.879
11 .398 2.652 92.531
12 .323 2.155 94.687
13 .301 2.003 96.690
14 .271 1.805 98.496
15 .226 1.504 100.000
Extraction Method: Principal Component Analysis.
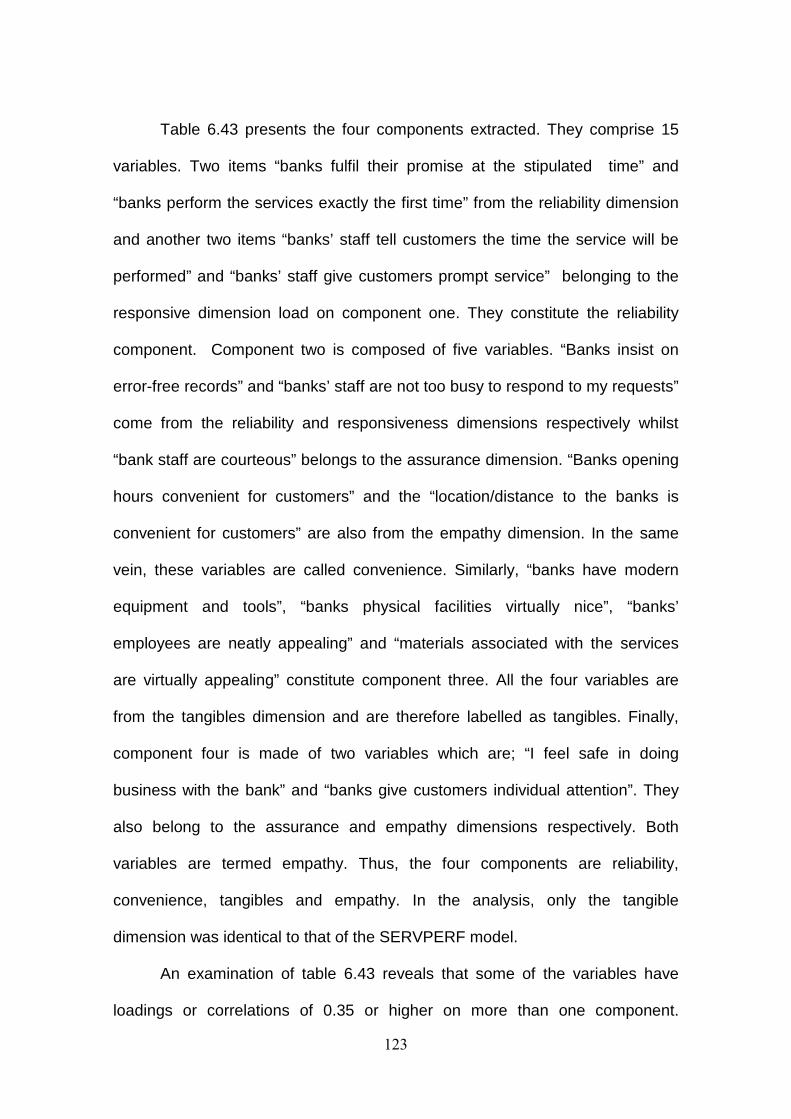
123
Table 6.43 presents the four components extracted. They comprise 15
variables. Two items “banks fulfil their promise at the stipulated time” and
“banks perform the services exactly the first time” from the reliability dimension
and another two items “banks’ staff tell customers the time the service will be
performed” and “banks’ staff give customers prompt service” belonging to the
responsive dimension load on component one. They constitute the reliability
component. Component two is composed of five variables. “Banks insist on
error-free records” and “banks’ staff are not too busy to respond to my requests”
come from the reliability and responsiveness dimensions respectively whilst
“bank staff are courteous” belongs to the assurance dimension. “Banks opening
hours convenient for customers” and the “location/distance to the banks is
convenient for customers” are also from the empathy dimension. In the same
vein, these variables are called convenience. Similarly, “banks have modern
equipment and tools”, “banks physical facilities virtually nice”, “banks’
employees are neatly appealing” and “materials associated with the services
are virtually appealing” constitute component three. All the four variables are
from the tangibles dimension and are therefore labelled as tangibles. Finally,
component four is made of two variables which are; “I feel safe in doing
business with the bank” and “banks give customers individual attention”. They
also belong to the assurance and empathy dimensions respectively. Both
variables are termed empathy. Thus, the four components are reliability,
convenience, tangibles and empathy. In the analysis, only the tangible
dimension was identical to that of the SERVPERF model.
An examination of table 6.43 reveals that some of the variables have
loadings or correlations of 0.35 or higher on more than one component.
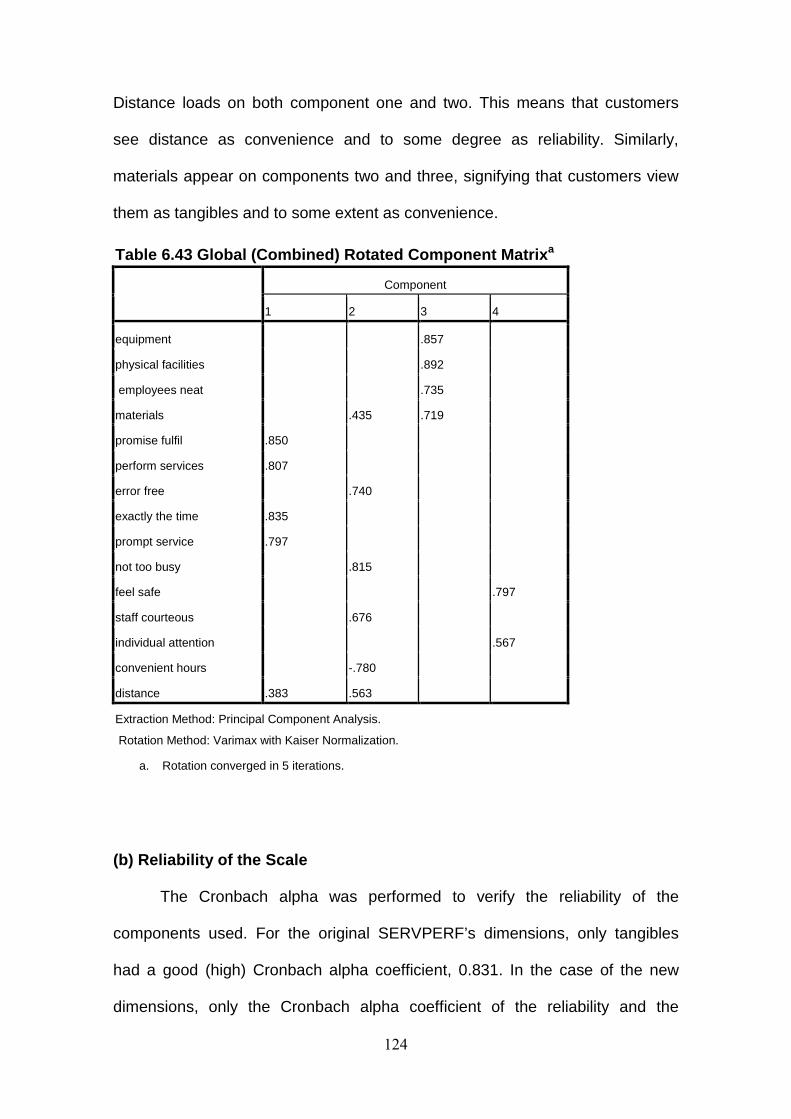
124
Distance loads on both component one and two. This means that customers
see distance as convenience and to some degree as reliability. Similarly,
materials appear on components two and three, signifying that customers view
them as tangibles and to some extent as convenience.
Table 6.43 Global (Combined) Rotated Component Matr ix a
Component
1 2 3 4
equipment .857
physical facilities .892
employees neat .735
materials .435 .719
promise fulfil .850
perform services .807
error free .740
exactly the time .835
prompt service .797
not too busy .815
feel safe .797
staff courteous .676
individual attention .567
convenient hours -.780
distance .383 .563
Extraction Method: Principal Component Analysis.
Rotation Method: Varimax with Kaiser Normalization.
a. Rotation converged in 5 iterations.
(b) Reliability of the Scale
The Cronbach alpha was performed to verify the reliability of the
components used. For the original SERVPERF’s dimensions, only tangibles
had a good (high) Cronbach alpha coefficient, 0.831. In the case of the new
dimensions, only the Cronbach alpha coefficient of the reliability and the
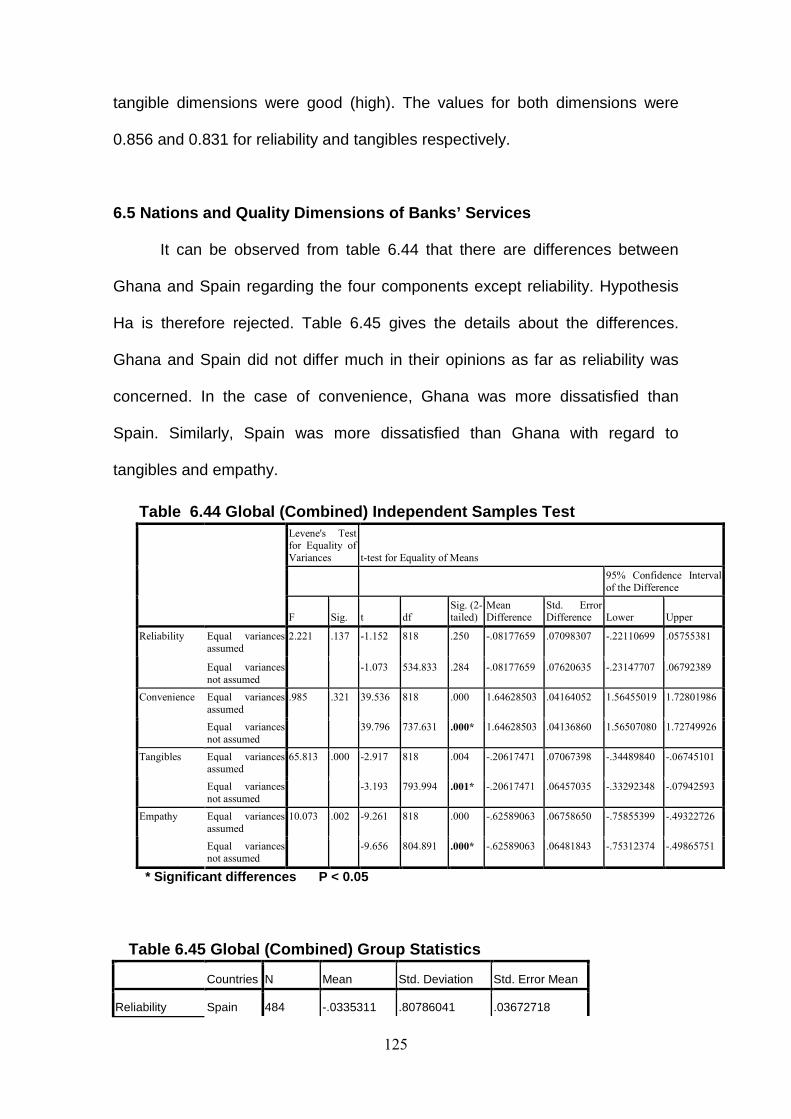
125
tangible dimensions were good (high). The values for both dimensions were
0.856 and 0.831 for reliability and tangibles respectively.
6.5 Nations and Quality Dimensions of Banks’ Servic es
It can be observed from table 6.44 that there are differences between
Ghana and Spain regarding the four components except reliability. Hypothesis
Ha is therefore rejected. Table 6.45 gives the details about the differences.
Ghana and Spain did not differ much in their opinions as far as reliability was
concerned. In the case of convenience, Ghana was more dissatisfied than
Spain. Similarly, Spain was more dissatisfied than Ghana with regard to
tangibles and empathy.
Table 6.44 Global (Combined) Independent Samples T est Levene's Test
for Equality of
Variances t-test for Equality of Means
95% Confidence Interval
of the Difference
F Sig. t df
Sig. (2-tailed)
Mean Difference
Std. Error Difference Lower Upper
Equal variances
assumed
2.221 .137 -1.152 818 .250 -.08177659 .07098307 -.22110699 .05755381 Reliability
Equal variances
not assumed
-1.073 534.833 .284 -.08177659 .07620635 -.23147707 .06792389
Equal variances
assumed
.985 .321 39.536 818 .000 1.64628503 .04164052 1.56455019 1.72801986 Convenience
Equal variances
not assumed
39.796 737.631 .000* 1.64628503 .04136860 1.56507080 1.72749926
Equal variances assumed
65.813 .000 -2.917 818 .004 -.20617471 .07067398 -.34489840 -.06745101 Tangibles
Equal variances
not assumed
-3.193 793.994 .001* -.20617471 .06457035 -.33292348 -.07942593
Equal variances
assumed
10.073 .002 -9.261 818 .000 -.62589063 .06758650 -.75855399 -.49322726 Empathy
Equal variances not assumed
-9.656 804.891 .000* -.62589063 .06481843 -.75312374 -.49865751
* Significant differences P < 0.05
Table 6.45 Global (Combined) Group Statistics
Countries N Mean Std. Deviation Std. Error Mean
Reliability Spain 484 -.0335311 .80786041 .03672718
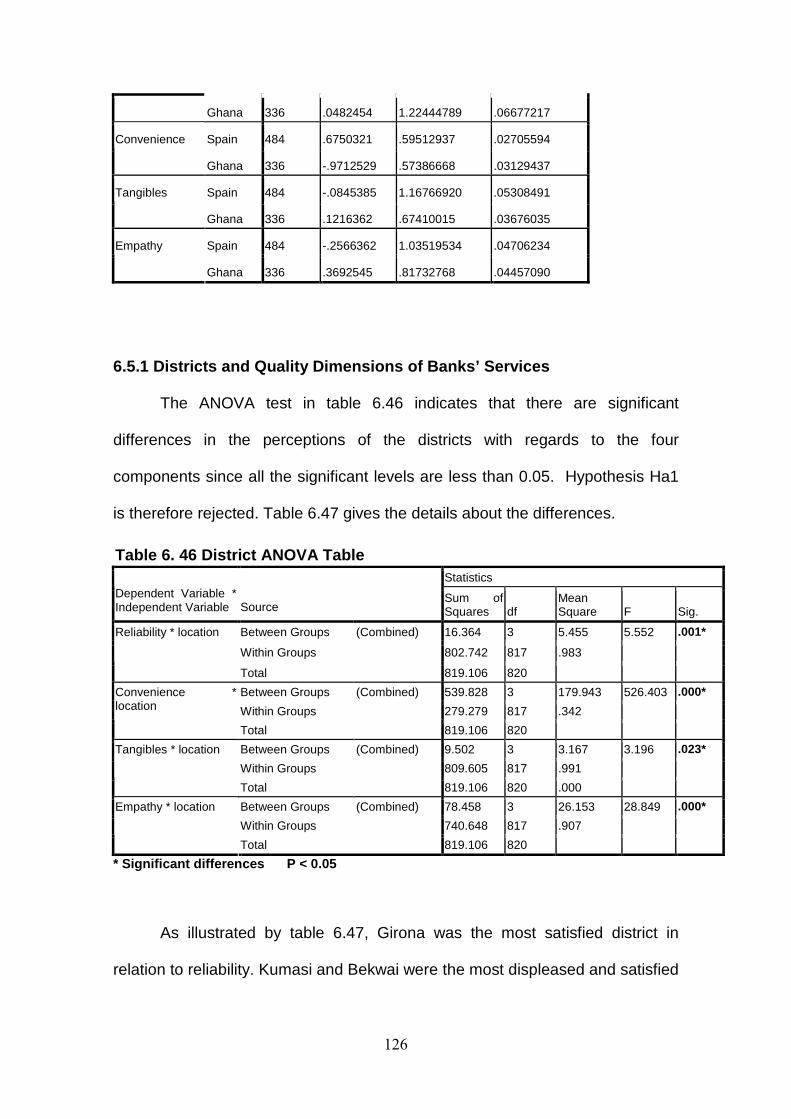
126
Ghana 336 .0482454 1.22444789 .06677217
Spain 484 .6750321 .59512937 .02705594 Convenience
Ghana 336 -.9712529 .57386668 .03129437
Spain 484 -.0845385 1.16766920 .05308491 Tangibles
Ghana 336 .1216362 .67410015 .03676035
Spain 484 -.2566362 1.03519534 .04706234 Empathy
Ghana 336 .3692545 .81732768 .04457090
6.5.1 Districts and Quality Dimensions of Banks’ Se rvices
The ANOVA test in table 6.46 indicates that there are significant
differences in the perceptions of the districts with regards to the four
components since all the significant levels are less than 0.05. Hypothesis Ha1
is therefore rejected. Table 6.47 gives the details about the differences.
Table 6. 46 District ANOVA Table Statistics
Dependent Variable * Independent Variable Source
Sum of Squares df
Mean Square F Sig.
Between Groups (Combined) 16.364 3 5.455 5.552 .001*
Within Groups 802.742 817 .983
Reliability * location
Total 819.106 820
Between Groups (Combined) 539.828 3 179.943 526.403 .000*
Within Groups 279.279 817 .342
Convenience * location
Total 819.106 820
Between Groups (Combined) 9.502 3 3.167 3.196 .023*
Within Groups 809.605 817 .991
Tangibles * location
Total 819.106 820 .000
Between Groups (Combined) 78.458 3 26.153 28.849 .000*
Within Groups 740.648 817 .907
Empathy * location
Total 819.106 820
* Significant differences P < 0.05
As illustrated by table 6.47, Girona was the most satisfied district in
relation to reliability. Kumasi and Bekwai were the most displeased and satisfied
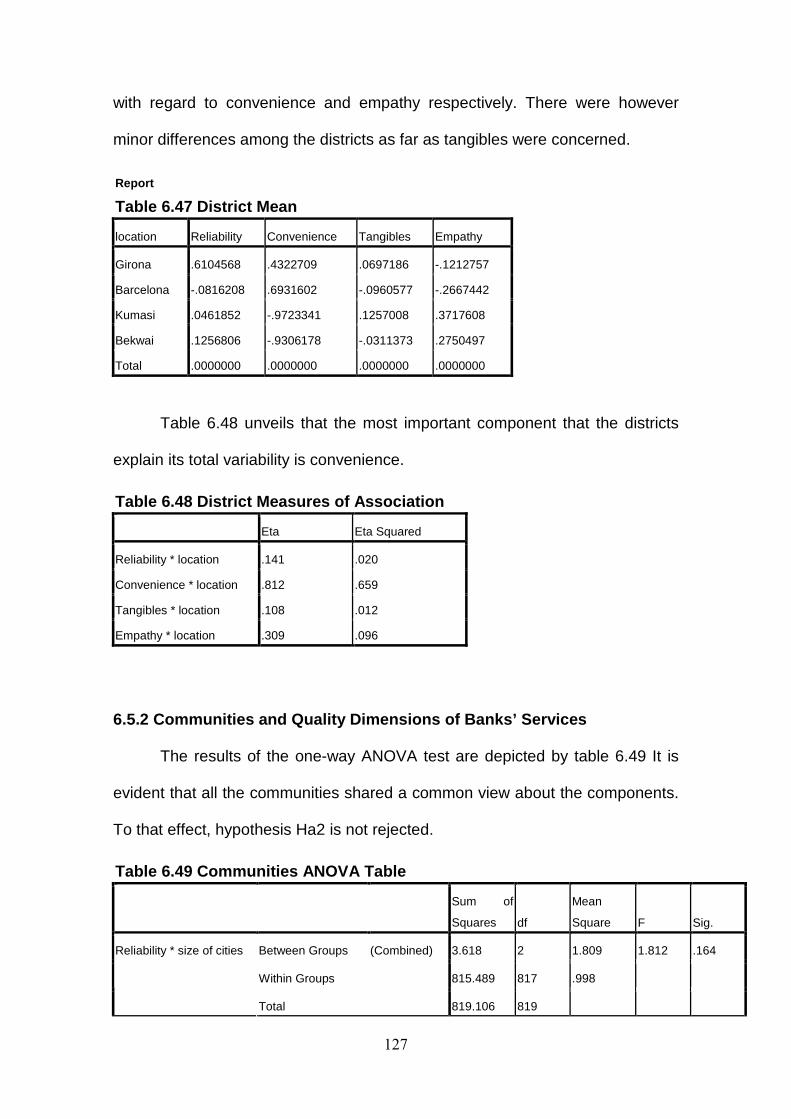
127
with regard to convenience and empathy respectively. There were however
minor differences among the districts as far as tangibles were concerned.
Report
Table 6.47 District Mean
location Reliability Convenience Tangibles Empathy
Girona .6104568 .4322709 .0697186 -.1212757
Barcelona -.0816208 .6931602 -.0960577 -.2667442
Kumasi .0461852 -.9723341 .1257008 .3717608
Bekwai .1256806 -.9306178 -.0311373 .2750497
Total .0000000 .0000000 .0000000 .0000000
Table 6.48 unveils that the most important component that the districts
explain its total variability is convenience.
Table 6.48 District Measures of Association
Eta Eta Squared
Reliability * location .141 .020
Convenience * location .812 .659
Tangibles * location .108 .012
Empathy * location .309 .096
6.5.2 Communities and Quality Dimensions of Banks’ Services
The results of the one-way ANOVA test are depicted by table 6.49 It is
evident that all the communities shared a common view about the components.
To that effect, hypothesis Ha2 is not rejected.
Table 6.49 Communities ANOVA Table
Sum of
Squares df
Mean
Square F Sig.
Between Groups (Combined) 3.618 2 1.809 1.812 .164
Within Groups 815.489 817 .998
Reliability * size of cities
Total 819.106 819
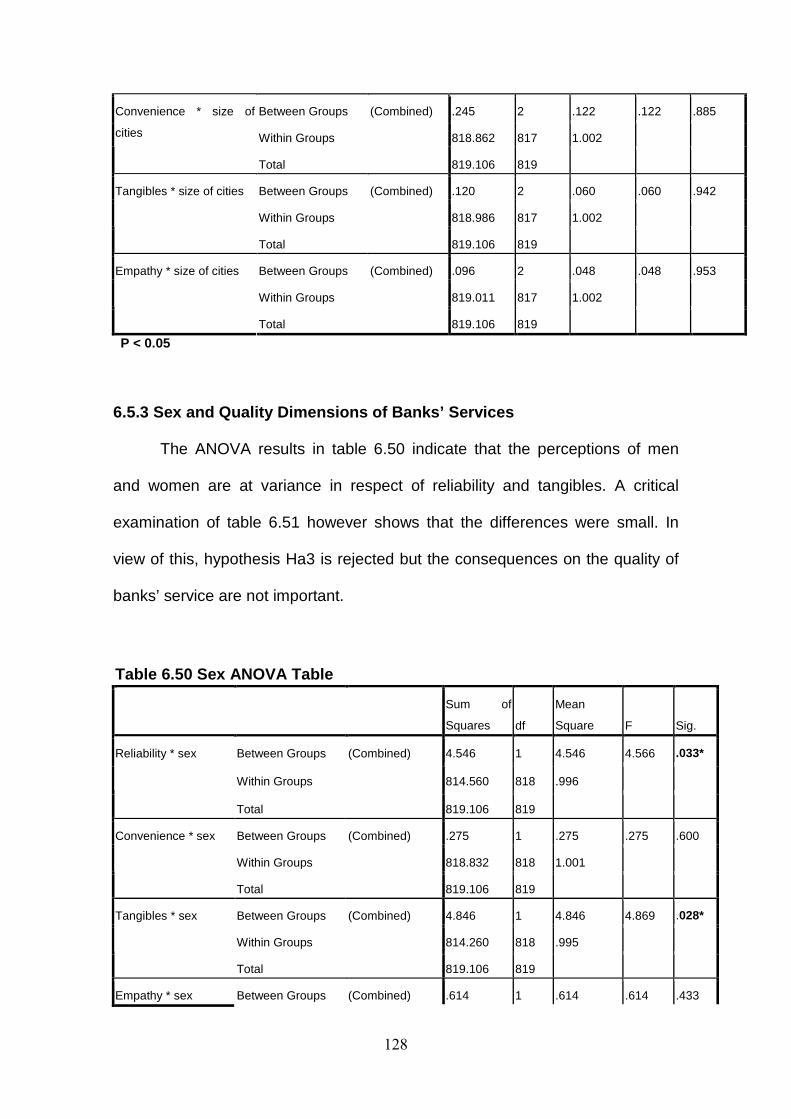
128
Between Groups (Combined) .245 2 .122 .122 .885
Within Groups 818.862 817 1.002
Convenience * size of
cities
Total 819.106 819
Between Groups (Combined) .120 2 .060 .060 .942
Within Groups 818.986 817 1.002
Tangibles * size of cities
Total 819.106 819
Between Groups (Combined) .096 2 .048 .048 .953
Within Groups 819.011 817 1.002
Empathy * size of cities
Total 819.106 819
P < 0.05
6.5.3 Sex and Quality Dimensions of Banks’ Services
The ANOVA results in table 6.50 indicate that the perceptions of men
and women are at variance in respect of reliability and tangibles. A critical
examination of table 6.51 however shows that the differences were small. In
view of this, hypothesis Ha3 is rejected but the consequences on the quality of
banks’ service are not important.
Table 6.50 Sex ANOVA Table
Sum of
Squares df
Mean
Square F Sig.
Between Groups (Combined) 4.546 1 4.546 4.566 .033*
Within Groups 814.560 818 .996
Reliability * sex
Total 819.106 819
Between Groups (Combined) .275 1 .275 .275 .600
Within Groups 818.832 818 1.001
Convenience * sex
Total 819.106 819
Between Groups (Combined) 4.846 1 4.846 4.869 .028*
Within Groups 814.260 818 .995
Tangibles * sex
Total 819.106 819
Empathy * sex Between Groups (Combined) .614 1 .614 .614 .433
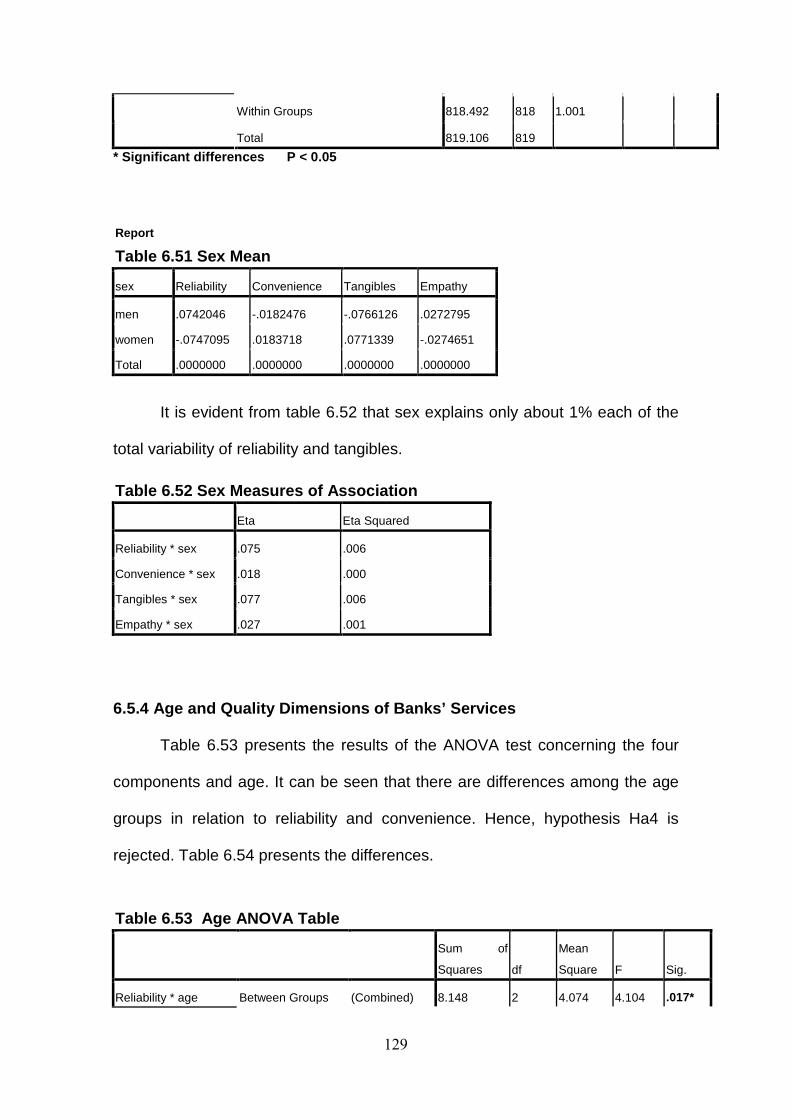
129
Within Groups 818.492 818 1.001
Total 819.106 819
* Significant differences P < 0.05
Report
Table 6.51 Sex Mean
sex Reliability Convenience Tangibles Empathy
men .0742046 -.0182476 -.0766126 .0272795
women -.0747095 .0183718 .0771339 -.0274651
Total .0000000 .0000000 .0000000 .0000000
It is evident from table 6.52 that sex explains only about 1% each of the
total variability of reliability and tangibles.
Table 6.52 Sex Measures of Association
Eta Eta Squared
Reliability * sex .075 .006
Convenience * sex .018 .000
Tangibles * sex .077 .006
Empathy * sex .027 .001
6.5.4 Age and Quality Dimensions of Banks’ Services
Table 6.53 presents the results of the ANOVA test concerning the four
components and age. It can be seen that there are differences among the age
groups in relation to reliability and convenience. Hence, hypothesis Ha4 is
rejected. Table 6.54 presents the differences.
Table 6.53 Age ANOVA Table
Sum of
Squares df
Mean
Square F Sig.
Reliability * age Between Groups (Combined) 8.148 2 4.074 4.104 .017*
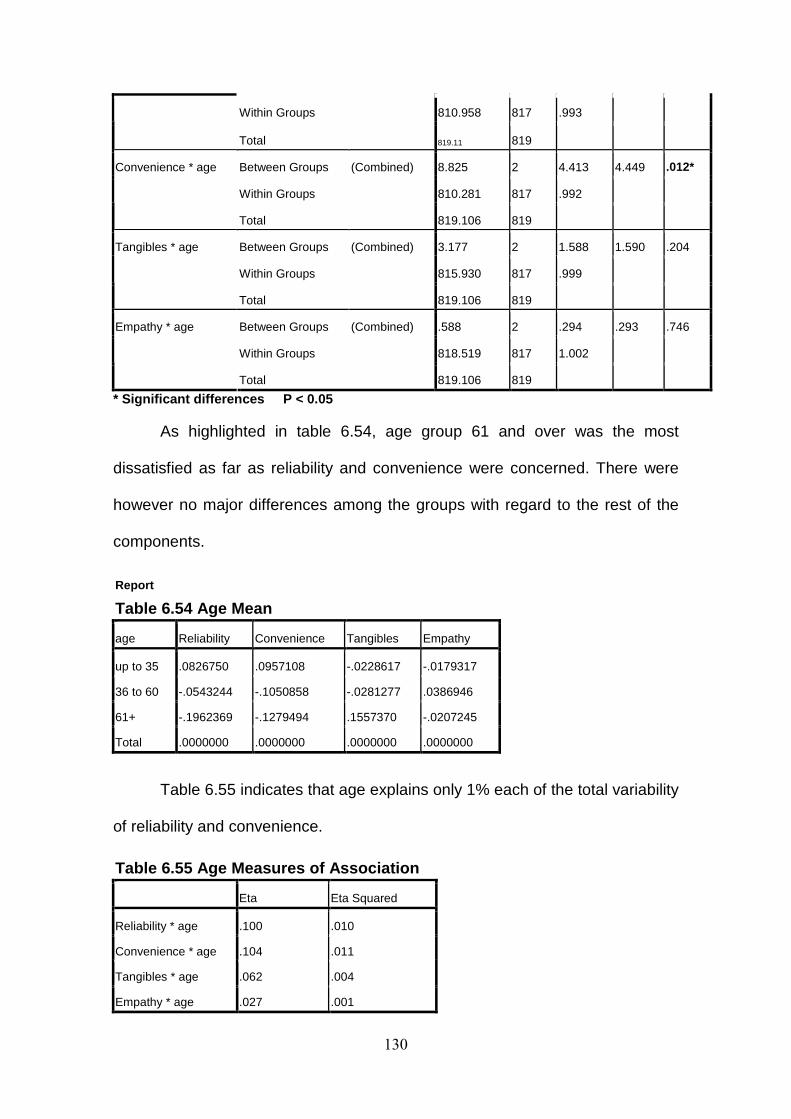
130
Within Groups 810.958 817 .993
Total 819.11 819
Between Groups (Combined) 8.825 2 4.413 4.449 .012*
Within Groups 810.281 817 .992
Convenience * age
Total 819.106 819
Between Groups (Combined) 3.177 2 1.588 1.590 .204
Within Groups 815.930 817 .999
Tangibles * age
Total 819.106 819
Between Groups (Combined) .588 2 .294 .293 .746
Within Groups 818.519 817 1.002
Empathy * age
Total 819.106 819
* Significant differences P < 0.05
As highlighted in table 6.54, age group 61 and over was the most
dissatisfied as far as reliability and convenience were concerned. There were
however no major differences among the groups with regard to the rest of the
components.
Report
Table 6.54 Age Mean
age Reliability Convenience Tangibles Empathy
up to 35 .0826750 .0957108 -.0228617 -.0179317
36 to 60 -.0543244 -.1050858 -.0281277 .0386946
61+ -.1962369 -.1279494 .1557370 -.0207245
Total .0000000 .0000000 .0000000 .0000000
Table 6.55 indicates that age explains only 1% each of the total variability
of reliability and convenience.
Table 6.55 Age Measures of Association
Eta Eta Squared
Reliability * age .100 .010
Convenience * age .104 .011
Tangibles * age .062 .004
Empathy * age .027 .001
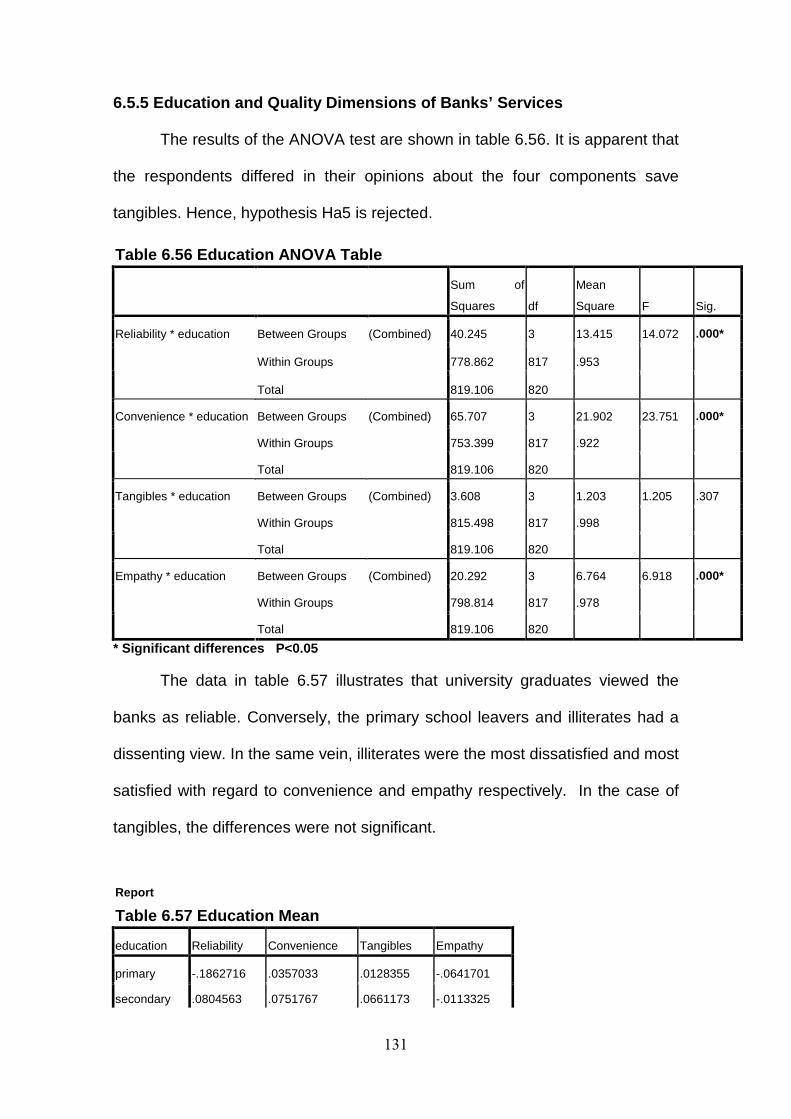
131
6.5.5 Education and Quality Dimensions of Banks’ Se rvices
The results of the ANOVA test are shown in table 6.56. It is apparent that
the respondents differed in their opinions about the four components save
tangibles. Hence, hypothesis Ha5 is rejected.
Table 6.56 Education ANOVA Table
Sum of
Squares df
Mean
Square F Sig.
Between Groups (Combined) 40.245 3 13.415 14.072 .000*
Within Groups 778.862 817 .953
Reliability * education
Total 819.106 820
Between Groups (Combined) 65.707 3 21.902 23.751 .000*
Within Groups 753.399 817 .922
Convenience * education
Total 819.106 820
Between Groups (Combined) 3.608 3 1.203 1.205 .307
Within Groups 815.498 817 .998
Tangibles * education
Total 819.106 820
Between Groups (Combined) 20.292 3 6.764 6.918 .000*
Within Groups 798.814 817 .978
Empathy * education
Total 819.106 820
* Significant differences P<0.05
The data in table 6.57 illustrates that university graduates viewed the
banks as reliable. Conversely, the primary school leavers and illiterates had a
dissenting view. In the same vein, illiterates were the most dissatisfied and most
satisfied with regard to convenience and empathy respectively. In the case of
tangibles, the differences were not significant.
Report
Table 6.57 Education Mean
education Reliability Convenience Tangibles Empathy
primary -.1862716 .0357033 .0128355 -.0641701
secondary .0804563 .0751767 .0661173 -.0113325
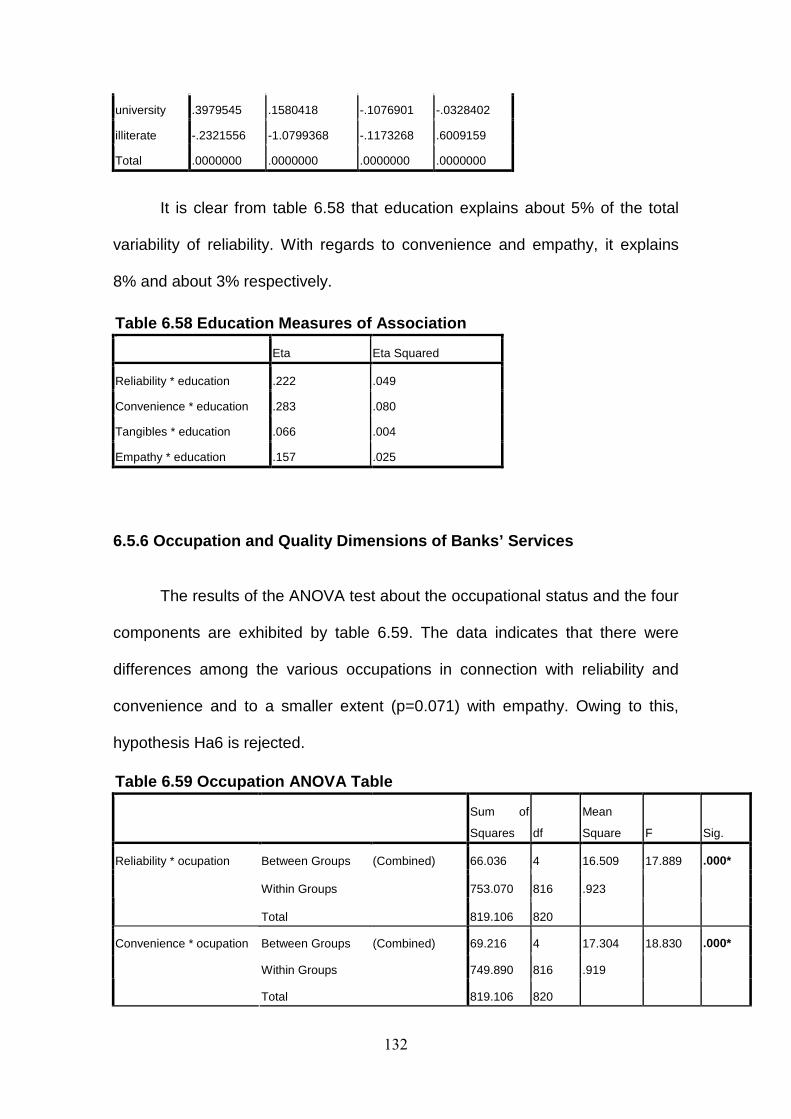
132
university .3979545 .1580418 -.1076901 -.0328402
illiterate -.2321556 -1.0799368 -.1173268 .6009159
Total .0000000 .0000000 .0000000 .0000000
It is clear from table 6.58 that education explains about 5% of the total
variability of reliability. With regards to convenience and empathy, it explains
8% and about 3% respectively.
Table 6.58 Education Measures of Association
Eta Eta Squared
Reliability * education .222 .049
Convenience * education .283 .080
Tangibles * education .066 .004
Empathy * education .157 .025
6.5.6 Occupation and Quality Dimensions of Banks’ S ervices
The results of the ANOVA test about the occupational status and the four
components are exhibited by table 6.59. The data indicates that there were
differences among the various occupations in connection with reliability and
convenience and to a smaller extent (p=0.071) with empathy. Owing to this,
hypothesis Ha6 is rejected.
Table 6.59 Occupation ANOVA Table
Sum of
Squares df
Mean
Square F Sig.
Between Groups (Combined) 66.036 4 16.509 17.889 .000*
Within Groups 753.070 816 .923
Reliability * ocupation
Total 819.106 820
Between Groups (Combined) 69.216 4 17.304 18.830 .000*
Within Groups 749.890 816 .919
Convenience * ocupation
Total 819.106 820
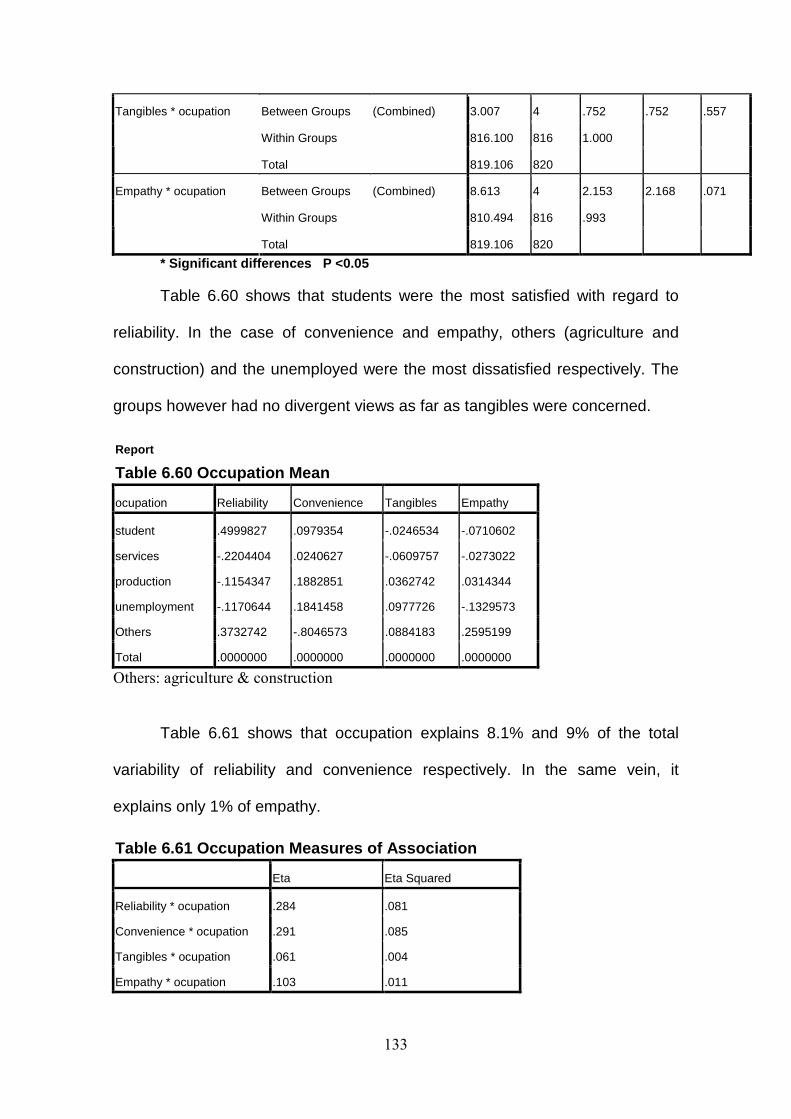
133
Between Groups (Combined) 3.007 4 .752 .752 .557
Within Groups 816.100 816 1.000
Tangibles * ocupation
Total 819.106 820
Between Groups (Combined) 8.613 4 2.153 2.168 .071
Within Groups 810.494 816 .993
Empathy * ocupation
Total 819.106 820
* Significant differences P <0.05
Table 6.60 shows that students were the most satisfied with regard to
reliability. In the case of convenience and empathy, others (agriculture and
construction) and the unemployed were the most dissatisfied respectively. The
groups however had no divergent views as far as tangibles were concerned.
Report
Table 6.60 Occupation Mean
ocupation Reliability Convenience Tangibles Empathy
student .4999827 .0979354 -.0246534 -.0710602
services -.2204404 .0240627 -.0609757 -.0273022
production -.1154347 .1882851 .0362742 .0314344
unemployment -.1170644 .1841458 .0977726 -.1329573
Others .3732742 -.8046573 .0884183 .2595199
Total .0000000 .0000000 .0000000 .0000000
Others: agriculture & construction
Table 6.61 shows that occupation explains 8.1% and 9% of the total
variability of reliability and convenience respectively. In the same vein, it
explains only 1% of empathy.
Table 6.61 Occupation Measures of Association
Eta Eta Squared
Reliability * ocupation .284 .081
Convenience * ocupation .291 .085
Tangibles * ocupation .061 .004
Empathy * ocupation .103 .011
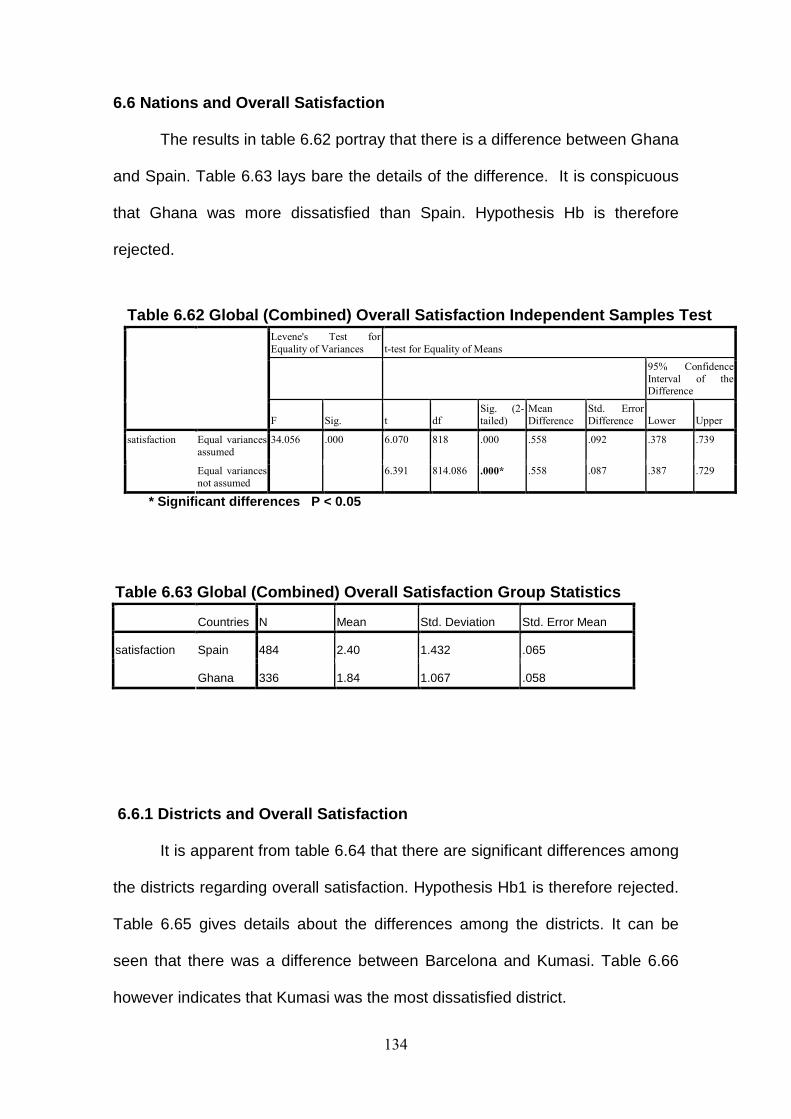
134
6.6 Nations and Overall Satisfaction
The results in table 6.62 portray that there is a difference between Ghana
and Spain. Table 6.63 lays bare the details of the difference. It is conspicuous
that Ghana was more dissatisfied than Spain. Hypothesis Hb is therefore
rejected.
Table 6.62 Global (Combined) Overall Satisfaction I ndependent Samples Test Levene's Test for
Equality of Variances t-test for Equality of Means
95% Confidence
Interval of the Difference
F Sig. t df
Sig. (2-
tailed)
Mean
Difference
Std. Error
Difference Lower Upper
Equal variances
assumed
34.056 .000 6.070 818 .000 .558 .092 .378 .739 satisfaction
Equal variances
not assumed
6.391 814.086 .000* .558 .087 .387 .729
* Significant differences P < 0.05
Table 6.63 Global (Combined) Overall Satisfaction G roup Statistics
Countries N Mean Std. Deviation Std. Error Mean
Spain 484 2.40 1.432 .065 satisfaction
Ghana 336 1.84 1.067 .058
6.6.1 Districts and Overall Satisfaction
It is apparent from table 6.64 that there are significant differences among
the districts regarding overall satisfaction. Hypothesis Hb1 is therefore rejected.
Table 6.65 gives details about the differences among the districts. It can be
seen that there was a difference between Barcelona and Kumasi. Table 6.66
however indicates that Kumasi was the most dissatisfied district.
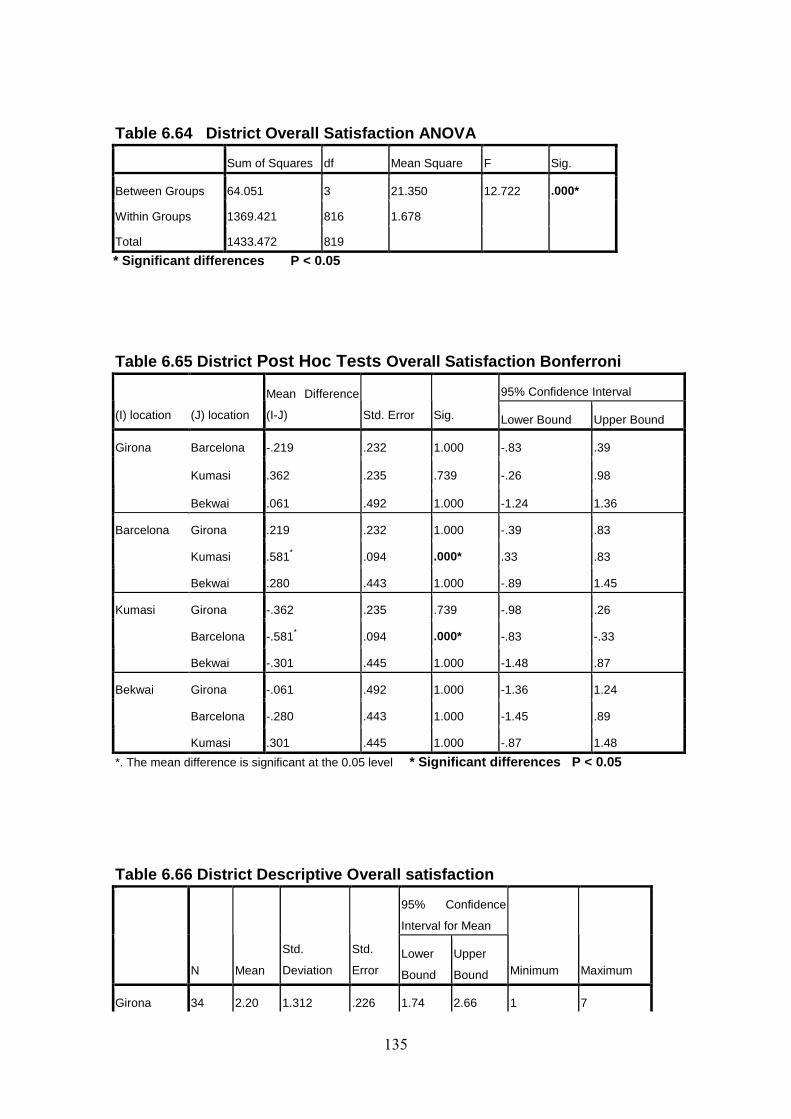
135
Table 6.64 District Overall Satisfaction ANOVA
Sum of Squares df Mean Square F Sig.
Between Groups 64.051 3 21.350 12.722 .000*
Within Groups 1369.421 816 1.678
Total 1433.472 819
* Significant differences P < 0.05
Table 6.65 District Post Hoc Tests Overall Satisfaction Bonferroni
95% Confidence Interval
(I) location (J) location
Mean Difference
(I-J) Std. Error Sig. Lower Bound Upper Bound
Barcelona -.219 .232 1.000 -.83 .39
Kumasi .362 .235 .739 -.26 .98
Girona
Bekwai .061 .492 1.000 -1.24 1.36
Girona .219 .232 1.000 -.39 .83
Kumasi .581* .094 .000* .33 .83
Barcelona
Bekwai .280 .443 1.000 -.89 1.45
Girona -.362 .235 .739 -.98 .26
Barcelona -.581* .094 .000* -.83 -.33
Kumasi
Bekwai -.301 .445 1.000 -1.48 .87
Girona -.061 .492 1.000 -1.36 1.24
Barcelona -.280 .443 1.000 -1.45 .89
Bekwai
Kumasi .301 .445 1.000 -.87 1.48
*. The mean difference is significant at the 0.05 level * Significant differences P < 0.05
Table 6.66 District Descriptive Overall satisfactio n
95% Confidence
Interval for Mean
N Mean
Std.
Deviation
Std.
Error Lower
Bound
Upper
Bound Minimum Maximum
Girona 34 2.20 1.312 .226 1.74 2.66 1 7
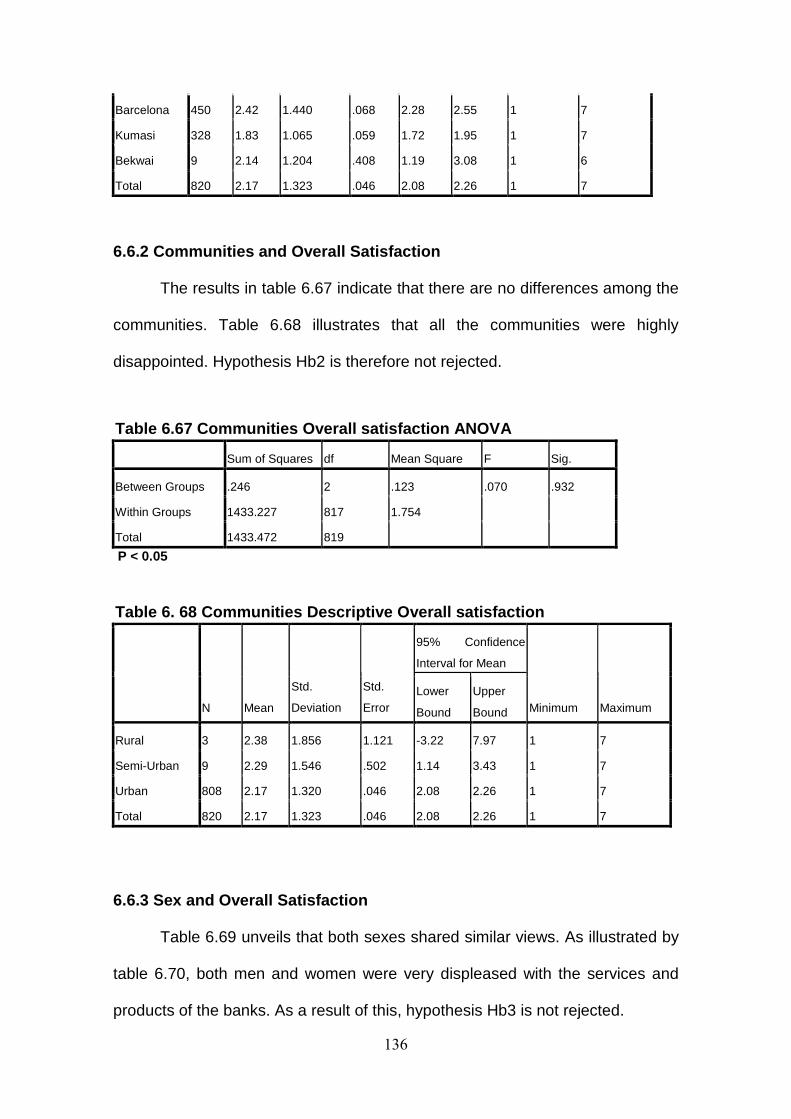
136
Barcelona 450 2.42 1.440 .068 2.28 2.55 1 7
Kumasi 328 1.83 1.065 .059 1.72 1.95 1 7
Bekwai 9 2.14 1.204 .408 1.19 3.08 1 6
Total 820 2.17 1.323 .046 2.08 2.26 1 7
6.6.2 Communities and Overall Satisfaction
The results in table 6.67 indicate that there are no differences among the
communities. Table 6.68 illustrates that all the communities were highly
disappointed. Hypothesis Hb2 is therefore not rejected.
Table 6.67 Communities Overall satisfaction ANOVA
Sum of Squares df Mean Square F Sig.
Between Groups .246 2 .123 .070 .932
Within Groups 1433.227 817 1.754
Total 1433.472 819
P < 0.05
Table 6. 68 Communities Descriptive Overall satisfa ction
95% Confidence
Interval for Mean
N Mean
Std.
Deviation
Std.
Error Lower
Bound
Upper
Bound Minimum Maximum
Rural 3 2.38 1.856 1.121 -3.22 7.97 1 7
Semi-Urban 9 2.29 1.546 .502 1.14 3.43 1 7
Urban 808 2.17 1.320 .046 2.08 2.26 1 7
Total 820 2.17 1.323 .046 2.08 2.26 1 7
6.6.3 Sex and Overall Satisfaction
Table 6.69 unveils that both sexes shared similar views. As illustrated by
table 6.70, both men and women were very displeased with the services and
products of the banks. As a result of this, hypothesis Hb3 is not rejected.
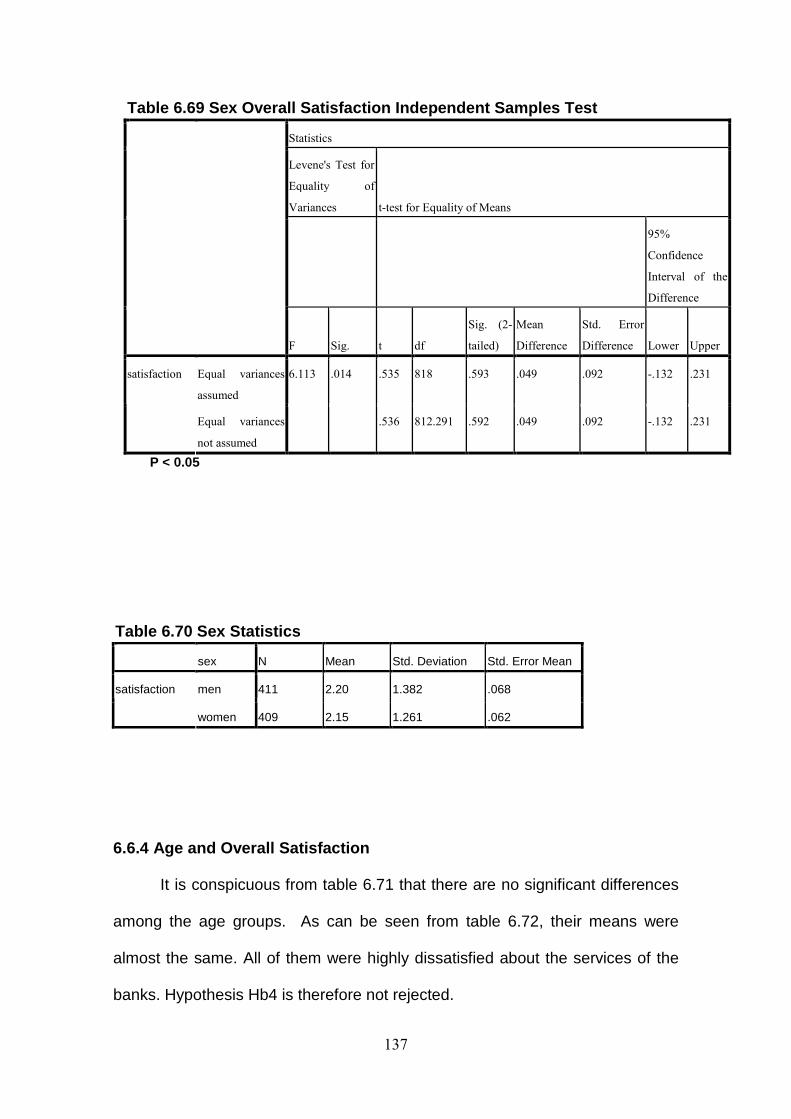
137
Table 6.69 Sex Overall Satisfaction Independent Sam ples Test
Statistics
Levene's Test for
Equality of
Variances t-test for Equality of Means
95%
Confidence
Interval of the
Difference
F Sig. t df
Sig. (2-
tailed)
Mean
Difference
Std. Error
Difference Lower Upper
Equal variances
assumed
6.113 .014 .535 818 .593 .049 .092 -.132 .231 satisfaction
Equal variances
not assumed
.536 812.291 .592 .049 .092 -.132 .231
P < 0.05
Table 6.70 Sex Statistics
sex N Mean Std. Deviation Std. Error Mean
men 411 2.20 1.382 .068 satisfaction
women 409 2.15 1.261 .062
6.6.4 Age and Overall Satisfaction
It is conspicuous from table 6.71 that there are no significant differences
among the age groups. As can be seen from table 6.72, their means were
almost the same. All of them were highly dissatisfied about the services of the
banks. Hypothesis Hb4 is therefore not rejected.
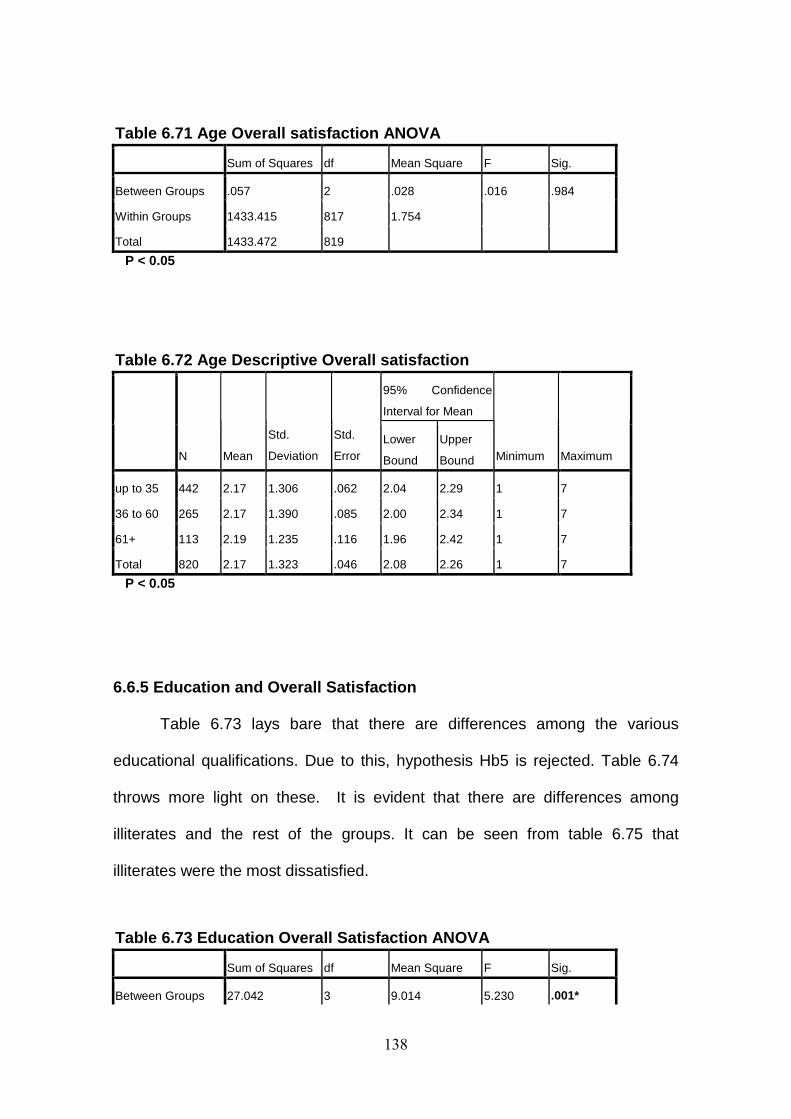
138
Table 6.71 Age Overall satisfaction ANOVA
Sum of Squares df Mean Square F Sig.
Between Groups .057 2 .028 .016 .984
Within Groups 1433.415 817 1.754
Total 1433.472 819
P < 0.05
Table 6.72 Age Descriptive Overall satisfaction
95% Confidence
Interval for Mean
N Mean
Std.
Deviation
Std.
Error Lower
Bound
Upper
Bound Minimum Maximum
up to 35 442 2.17 1.306 .062 2.04 2.29 1 7
36 to 60 265 2.17 1.390 .085 2.00 2.34 1 7
61+ 113 2.19 1.235 .116 1.96 2.42 1 7
Total 820 2.17 1.323 .046 2.08 2.26 1 7
P < 0.05
6.6.5 Education and Overall Satisfaction
Table 6.73 lays bare that there are differences among the various
educational qualifications. Due to this, hypothesis Hb5 is rejected. Table 6.74
throws more light on these. It is evident that there are differences among
illiterates and the rest of the groups. It can be seen from table 6.75 that
illiterates were the most dissatisfied.
Table 6.73 Education Overall Satisfaction ANOVA
Sum of Squares df Mean Square F Sig.
Between Groups 27.042 3 9.014 5.230 .001*
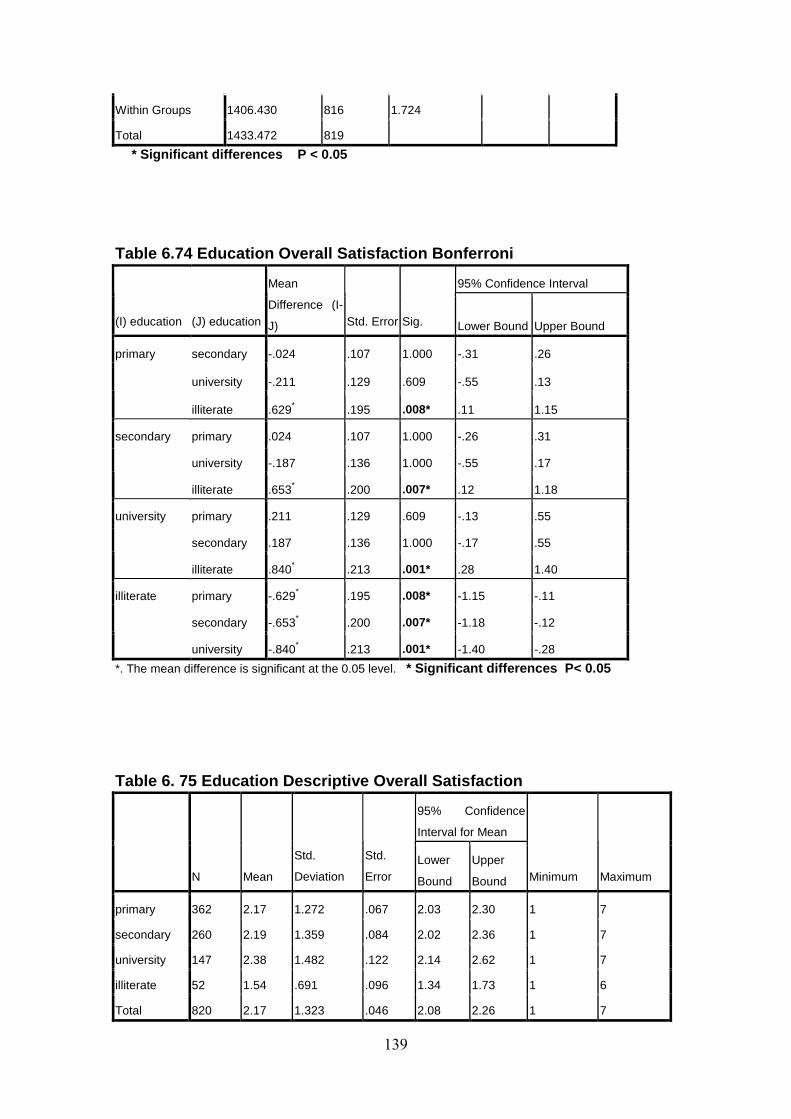
139
Within Groups 1406.430 816 1.724
Total 1433.472 819
* Significant differences P < 0.05
Table 6.74 Education Overall Satisfaction Bonferron i
95% Confidence Interval
(I) education (J) education
Mean
Difference (I-
J) Std. Error Sig. Lower Bound Upper Bound
secondary -.024 .107 1.000 -.31 .26
university -.211 .129 .609 -.55 .13
primary
illiterate .629* .195 .008* .11 1.15
primary .024 .107 1.000 -.26 .31
university -.187 .136 1.000 -.55 .17
secondary
illiterate .653* .200 .007* .12 1.18
primary .211 .129 .609 -.13 .55
secondary .187 .136 1.000 -.17 .55
university
illiterate .840* .213 .001* .28 1.40
primary -.629* .195 .008* -1.15 -.11
secondary -.653* .200 .007* -1.18 -.12
illiterate
university -.840* .213 .001* -1.40 -.28
*. The mean difference is significant at the 0.05 level. * Significant differences P< 0.05
Table 6. 75 Education Descriptive Overall Satisfact ion
95% Confidence
Interval for Mean
N Mean
Std.
Deviation
Std.
Error Lower
Bound
Upper
Bound Minimum Maximum
primary 362 2.17 1.272 .067 2.03 2.30 1 7
secondary 260 2.19 1.359 .084 2.02 2.36 1 7
university 147 2.38 1.482 .122 2.14 2.62 1 7
illiterate 52 1.54 .691 .096 1.34 1.73 1 6
Total 820 2.17 1.323 .046 2.08 2.26 1 7
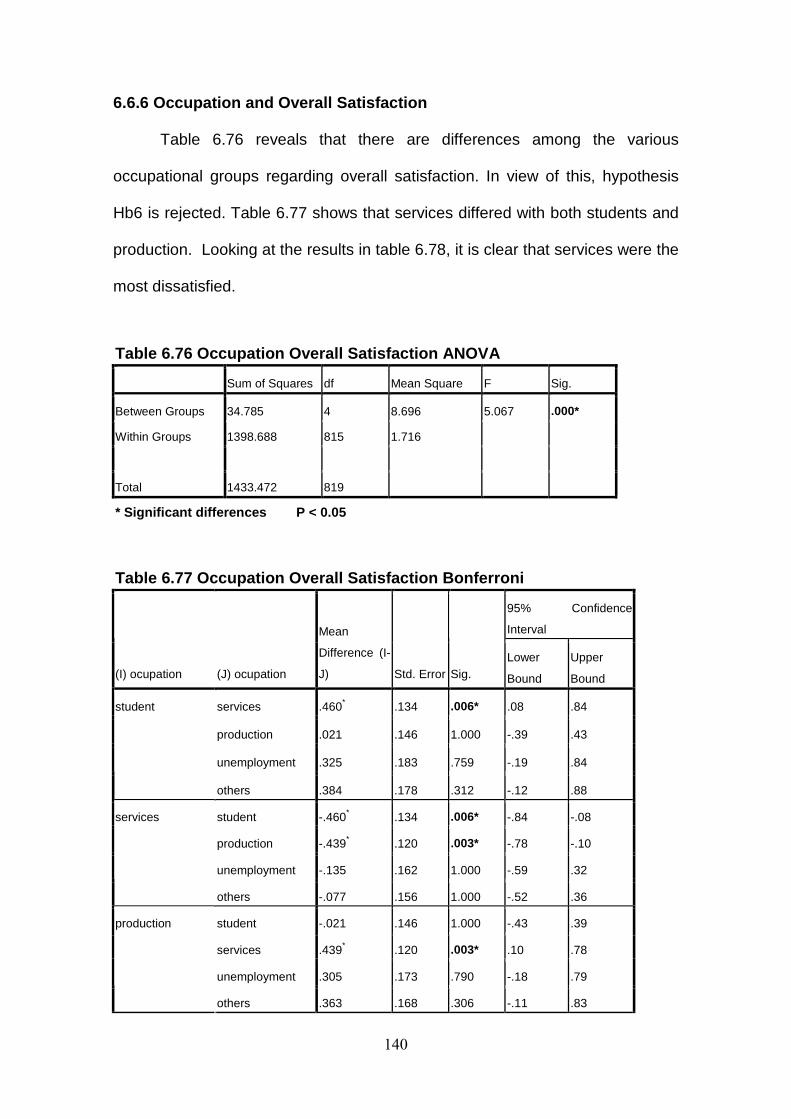
140
6.6.6 Occupation and Overall Satisfaction
Table 6.76 reveals that there are differences among the various
occupational groups regarding overall satisfaction. In view of this, hypothesis
Hb6 is rejected. Table 6.77 shows that services differed with both students and
production. Looking at the results in table 6.78, it is clear that services were the
most dissatisfied.
Table 6.76 Occupation Overall Satisfaction ANOVA
Sum of Squares df Mean Square F Sig.
Between Groups 34.785 4 8.696 5.067 .000*
Within Groups 1398.688 815 1.716
Total 1433.472 819
* Significant differences P < 0.05
Table 6.77 Occupation Overall Satisfaction Bonferro ni
95% Confidence
Interval
(I) ocupation (J) ocupation
Mean
Difference (I-
J) Std. Error Sig. Lower
Bound
Upper
Bound
services .460* .134 .006* .08 .84
production .021 .146 1.000 -.39 .43
unemployment .325 .183 .759 -.19 .84
student
others .384 .178 .312 -.12 .88
student -.460* .134 .006* -.84 -.08
production -.439* .120 .003* -.78 -.10
unemployment -.135 .162 1.000 -.59 .32
services
others -.077 .156 1.000 -.52 .36
student -.021 .146 1.000 -.43 .39
services .439* .120 .003* .10 .78
unemployment .305 .173 .790 -.18 .79
production
others .363 .168 .306 -.11 .83
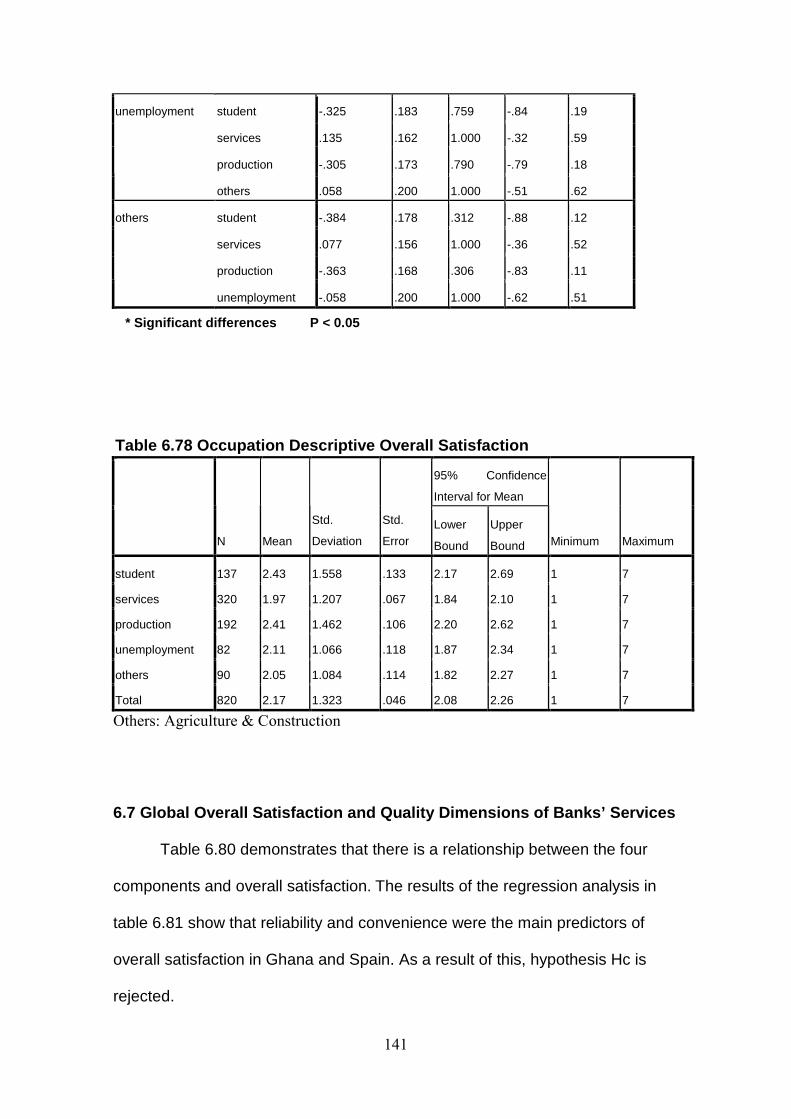
141
student -.325 .183 .759 -.84 .19
services .135 .162 1.000 -.32 .59
production -.305 .173 .790 -.79 .18
unemployment
others .058 .200 1.000 -.51 .62
student -.384 .178 .312 -.88 .12
services .077 .156 1.000 -.36 .52
production -.363 .168 .306 -.83 .11
others
unemployment -.058 .200 1.000 -.62 .51
* Significant differences P < 0.05
Table 6.78 Occupation Descriptive Overall Satisfact ion
95% Confidence
Interval for Mean
N Mean
Std.
Deviation
Std.
Error Lower
Bound
Upper
Bound Minimum Maximum
student 137 2.43 1.558 .133 2.17 2.69 1 7
services 320 1.97 1.207 .067 1.84 2.10 1 7
production 192 2.41 1.462 .106 2.20 2.62 1 7
unemployment 82 2.11 1.066 .118 1.87 2.34 1 7
others 90 2.05 1.084 .114 1.82 2.27 1 7
Total 820 2.17 1.323 .046 2.08 2.26 1 7
Others: Agriculture & Construction
6.7 Global Overall Satisfaction and Quality Dimensi ons of Banks’ Services
Table 6.80 demonstrates that there is a relationship between the four
components and overall satisfaction. The results of the regression analysis in
table 6.81 show that reliability and convenience were the main predictors of
overall satisfaction in Ghana and Spain. As a result of this, hypothesis Hc is
rejected.
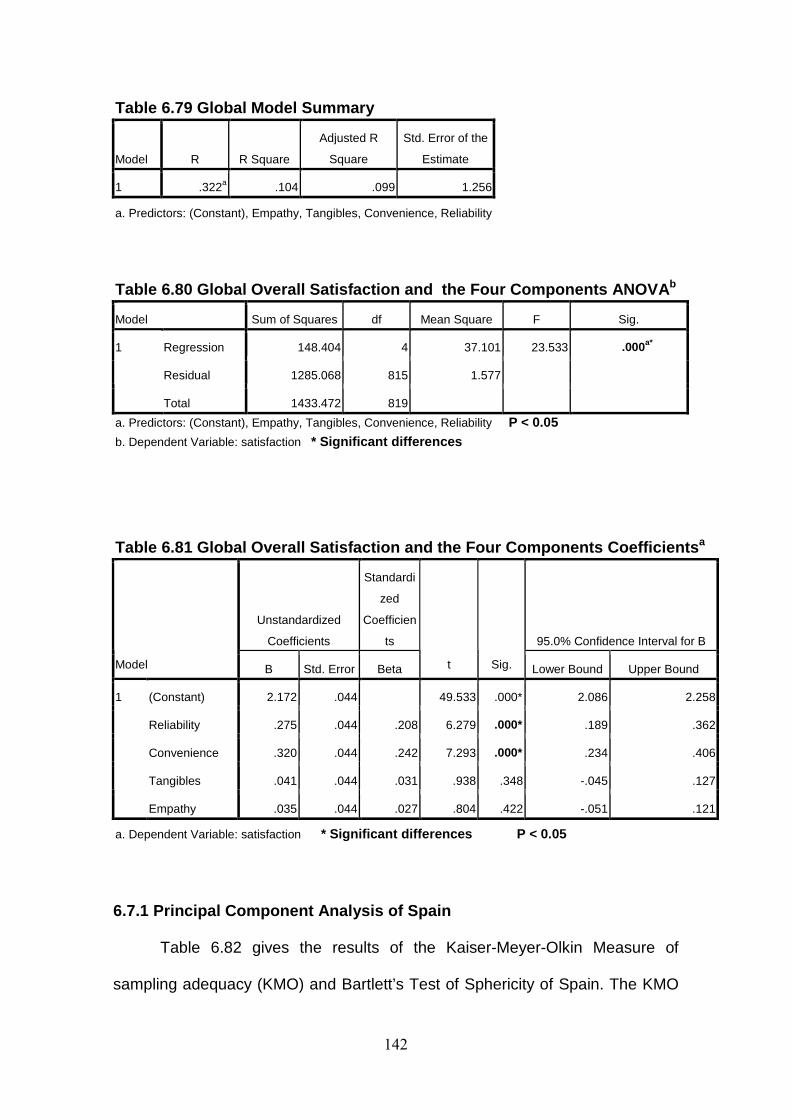
142
Table 6.79 Global Model Summary
Model R R Square
Adjusted R
Square
Std. Error of the
Estimate
1 .322a .104 .099 1.256
a. Predictors: (Constant), Empathy, Tangibles, Convenience, Reliability
Table 6.80 Global Overall Satisfaction and the Fou r Components ANOVA b
Model Sum of Squares df Mean Square F Sig.
Regression 148.404 4 37.101 23.533 .000a*
Residual 1285.068 815 1.577
1
Total 1433.472 819
a. Predictors: (Constant), Empathy, Tangibles, Convenience, Reliability P < 0.05
b. Dependent Variable: satisfaction * Significant differences
Table 6.81 Global Overall Satisfaction and the Four Components Coefficients a
Unstandardized
Coefficients
Standardi
zed
Coefficien
ts 95.0% Confidence Interval for B
Model B Std. Error Beta t Sig. Lower Bound Upper Bound
(Constant) 2.172 .044 49.533 .000* 2.086 2.258
Reliability .275 .044 .208 6.279 .000* .189 .362
Convenience .320 .044 .242 7.293 .000* .234 .406
Tangibles .041 .044 .031 .938 .348 -.045 .127
1
Empathy .035 .044 .027 .804 .422 -.051 .121
a. Dependent Variable: satisfaction * Significant differences P < 0.05
6.7.1 Principal Component Analysis of Spain
Table 6.82 gives the results of the Kaiser-Meyer-Olkin Measure of
sampling adequacy (KMO) and Bartlett’s Test of Sphericity of Spain. The KMO
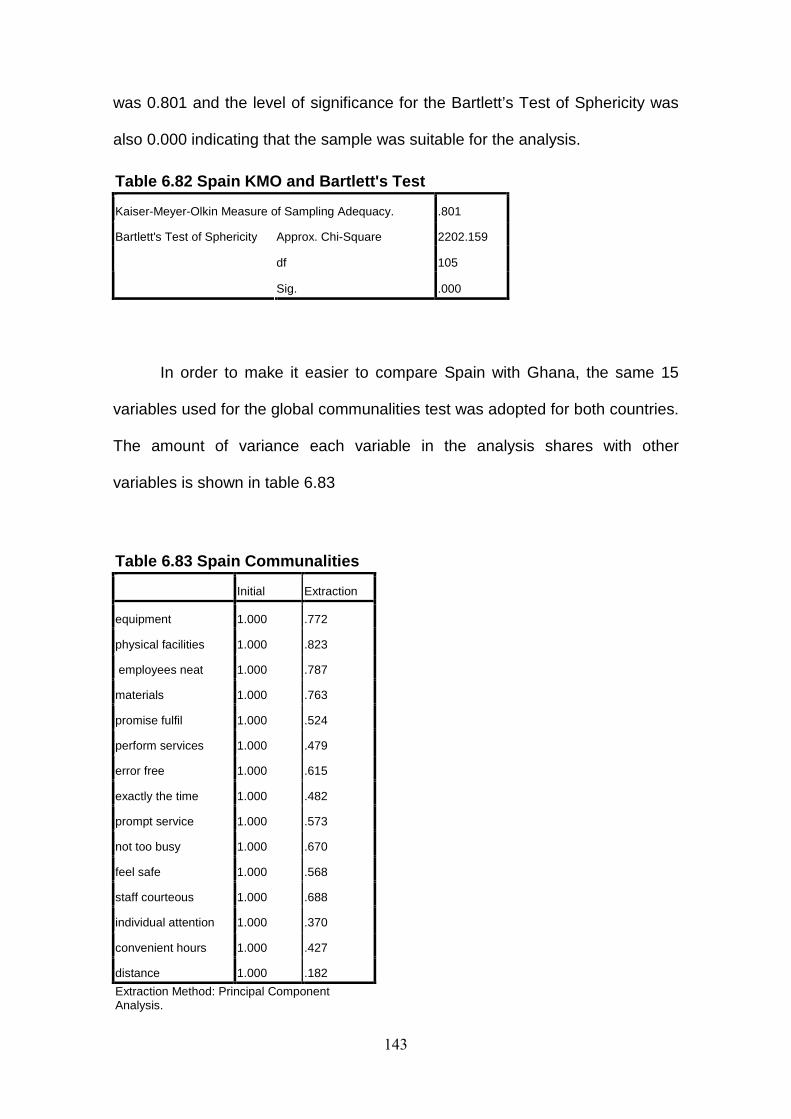
143
was 0.801 and the level of significance for the Bartlett’s Test of Sphericity was
also 0.000 indicating that the sample was suitable for the analysis.
Table 6.82 Spain KMO and Bartlett's Test
Kaiser-Meyer-Olkin Measure of Sampling Adequacy. .801
Approx. Chi-Square 2202.159
df 105
Bartlett's Test of Sphericity
Sig. .000
In order to make it easier to compare Spain with Ghana, the same 15
variables used for the global communalities test was adopted for both countries.
The amount of variance each variable in the analysis shares with other
variables is shown in table 6.83
Table 6.83 Spain Communalities
Initial Extraction
equipment 1.000 .772
physical facilities 1.000 .823
employees neat 1.000 .787
materials 1.000 .763
promise fulfil 1.000 .524
perform services 1.000 .479
error free 1.000 .615
exactly the time 1.000 .482
prompt service 1.000 .573
not too busy 1.000 .670
feel safe 1.000 .568
staff courteous 1.000 .688
individual attention 1.000 .370
convenient hours 1.000 .427
distance 1.000 .182
Extraction Method: Principal Component Analysis.
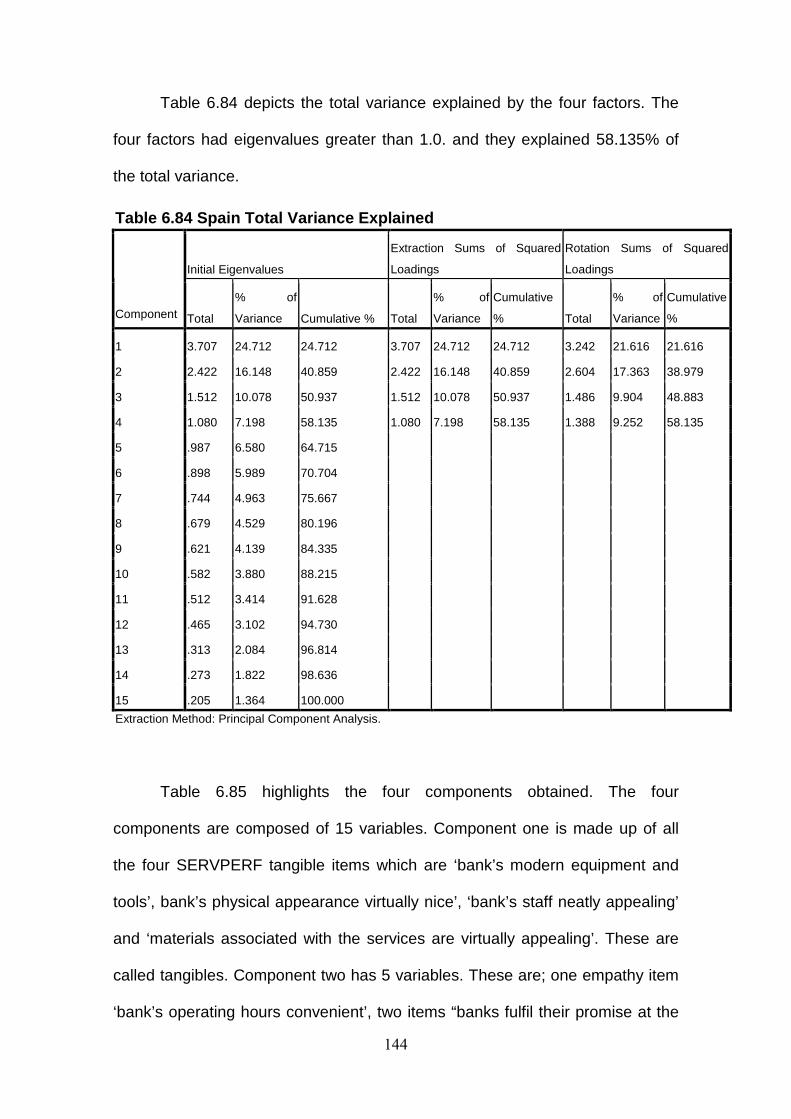
144
Table 6.84 depicts the total variance explained by the four factors. The
four factors had eigenvalues greater than 1.0. and they explained 58.135% of
the total variance.
Table 6.84 Spain Total Variance Explained
Initial Eigenvalues
Extraction Sums of Squared
Loadings
Rotation Sums of Squared
Loadings
Component Total
% of
Variance Cumulative % Total
% of
Variance
Cumulative
% Total
% of
Variance
Cumulative
%
1 3.707 24.712 24.712 3.707 24.712 24.712 3.242 21.616 21.616
2 2.422 16.148 40.859 2.422 16.148 40.859 2.604 17.363 38.979
3 1.512 10.078 50.937 1.512 10.078 50.937 1.486 9.904 48.883
4 1.080 7.198 58.135 1.080 7.198 58.135 1.388 9.252 58.135
5 .987 6.580 64.715
6 .898 5.989 70.704
7 .744 4.963 75.667
8 .679 4.529 80.196
9 .621 4.139 84.335
10 .582 3.880 88.215
11 .512 3.414 91.628
12 .465 3.102 94.730
13 .313 2.084 96.814
14 .273 1.822 98.636
15 .205 1.364 100.000
Extraction Method: Principal Component Analysis.
Table 6.85 highlights the four components obtained. The four
components are composed of 15 variables. Component one is made up of all
the four SERVPERF tangible items which are ‘bank’s modern equipment and
tools’, bank’s physical appearance virtually nice’, ‘bank’s staff neatly appealing’
and ‘materials associated with the services are virtually appealing’. These are
called tangibles. Component two has 5 variables. These are; one empathy item
‘bank’s operating hours convenient’, two items “banks fulfil their promise at the
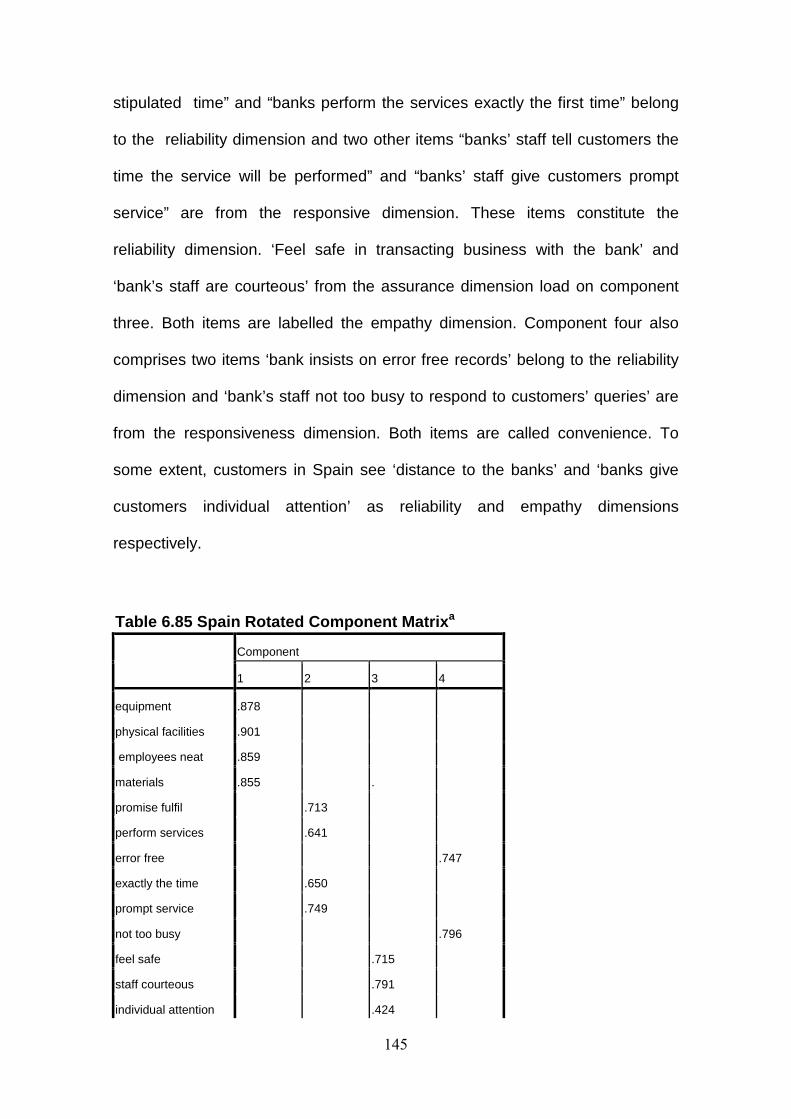
145
stipulated time” and “banks perform the services exactly the first time” belong
to the reliability dimension and two other items “banks’ staff tell customers the
time the service will be performed” and “banks’ staff give customers prompt
service” are from the responsive dimension. These items constitute the
reliability dimension. ‘Feel safe in transacting business with the bank’ and
‘bank’s staff are courteous’ from the assurance dimension load on component
three. Both items are labelled the empathy dimension. Component four also
comprises two items ‘bank insists on error free records’ belong to the reliability
dimension and ‘bank’s staff not too busy to respond to customers’ queries’ are
from the responsiveness dimension. Both items are called convenience. To
some extent, customers in Spain see ‘distance to the banks’ and ‘banks give
customers individual attention’ as reliability and empathy dimensions
respectively.
Table 6.85 Spain Rotated Component Matrix a
Component
1 2 3 4
equipment .878
physical facilities .901
employees neat .859
materials .855 .
promise fulfil .713
perform services .641
error free .747
exactly the time .650
prompt service .749
not too busy .796
feel safe .715
staff courteous .791
individual attention .424
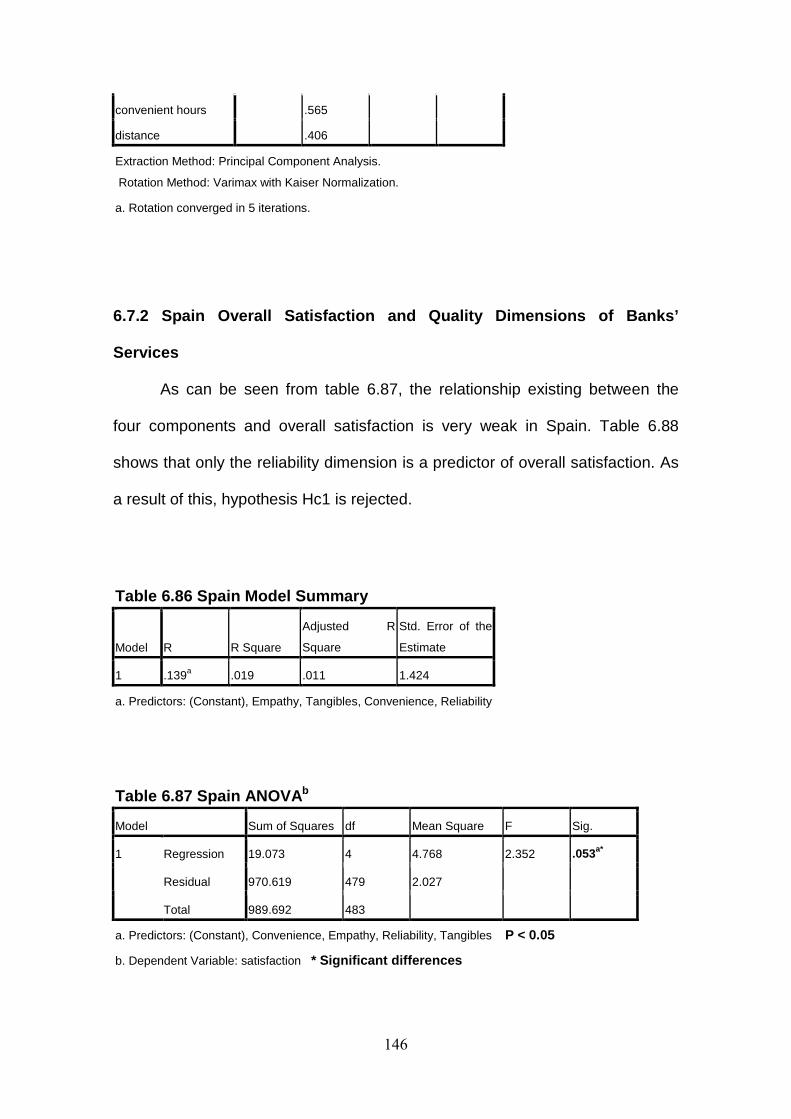
146
convenient hours .565
distance .406
Extraction Method: Principal Component Analysis.
Rotation Method: Varimax with Kaiser Normalization.
a. Rotation converged in 5 iterations.
6.7.2 Spain Overall Satisfaction and Quality Dimens ions of Banks’
Services
As can be seen from table 6.87, the relationship existing between the
four components and overall satisfaction is very weak in Spain. Table 6.88
shows that only the reliability dimension is a predictor of overall satisfaction. As
a result of this, hypothesis Hc1 is rejected.
Table 6.86 Spain Model Summary
Model R R Square
Adjusted R
Square
Std. Error of the
Estimate
1 .139a .019 .011 1.424
a. Predictors: (Constant), Empathy, Tangibles, Convenience, Reliability
Table 6.87 Spain ANOVA b
Model Sum of Squares df Mean Square F Sig.
Regression 19.073 4 4.768 2.352 .053a*
Residual 970.619 479 2.027
1
Total 989.692 483
a. Predictors: (Constant), Convenience, Empathy, Reliability, Tangibles P < 0.05
b. Dependent Variable: satisfaction * Significant differences
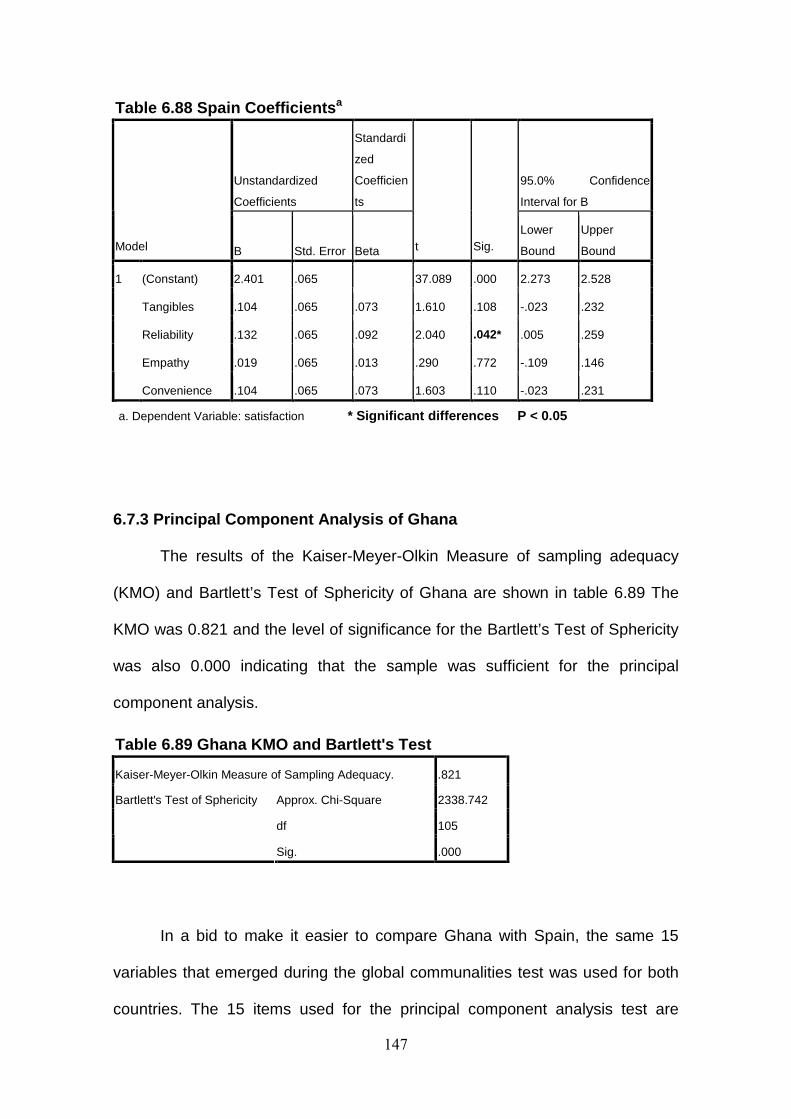
147
Table 6.88 Spain Coefficients a
Unstandardized
Coefficients
Standardi
zed
Coefficien
ts
95.0% Confidence
Interval for B
Model B Std. Error Beta t Sig. Lower
Bound
Upper
Bound
(Constant) 2.401 .065 37.089 .000 2.273 2.528
Tangibles .104 .065 .073 1.610 .108 -.023 .232
Reliability .132 .065 .092 2.040 .042* .005 .259
Empathy .019 .065 .013 .290 .772 -.109 .146
1
Convenience .104 .065 .073 1.603 .110 -.023 .231
a. Dependent Variable: satisfaction * Significant differences P < 0.05
6.7.3 Principal Component Analysis of Ghana
The results of the Kaiser-Meyer-Olkin Measure of sampling adequacy
(KMO) and Bartlett’s Test of Sphericity of Ghana are shown in table 6.89 The
KMO was 0.821 and the level of significance for the Bartlett’s Test of Sphericity
was also 0.000 indicating that the sample was sufficient for the principal
component analysis.
Table 6.89 Ghana KMO and Bartlett's Test
Kaiser-Meyer-Olkin Measure of Sampling Adequacy. .821
Approx. Chi-Square 2338.742
df 105
Bartlett's Test of Sphericity
Sig. .000
In a bid to make it easier to compare Ghana with Spain, the same 15
variables that emerged during the global communalities test was used for both
countries. The 15 items used for the principal component analysis test are
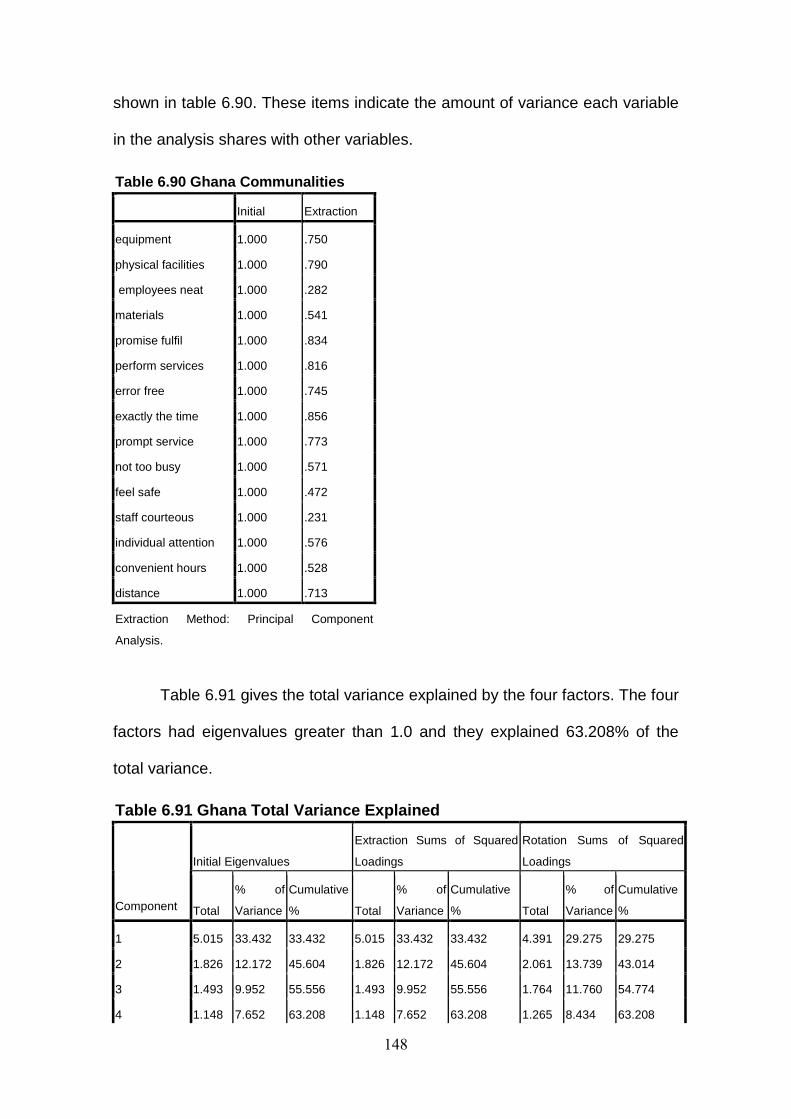
148
shown in table 6.90. These items indicate the amount of variance each variable
in the analysis shares with other variables.
Table 6.90 Ghana Communalities
Initial Extraction
equipment 1.000 .750
physical facilities 1.000 .790
employees neat 1.000 .282
materials 1.000 .541
promise fulfil 1.000 .834
perform services 1.000 .816
error free 1.000 .745
exactly the time 1.000 .856
prompt service 1.000 .773
not too busy 1.000 .571
feel safe 1.000 .472
staff courteous 1.000 .231
individual attention 1.000 .576
convenient hours 1.000 .528
distance 1.000 .713
Extraction Method: Principal Component
Analysis.
Table 6.91 gives the total variance explained by the four factors. The four
factors had eigenvalues greater than 1.0 and they explained 63.208% of the
total variance.
Table 6.91 Ghana Total Variance Explained
Initial Eigenvalues
Extraction Sums of Squared
Loadings
Rotation Sums of Squared
Loadings
Component Total
% of
Variance
Cumulative
% Total
% of
Variance
Cumulative
% Total
% of
Variance
Cumulative
%
1 5.015 33.432 33.432 5.015 33.432 33.432 4.391 29.275 29.275
2 1.826 12.172 45.604 1.826 12.172 45.604 2.061 13.739 43.014
3 1.493 9.952 55.556 1.493 9.952 55.556 1.764 11.760 54.774
4 1.148 7.652 63.208 1.148 7.652 63.208 1.265 8.434 63.208
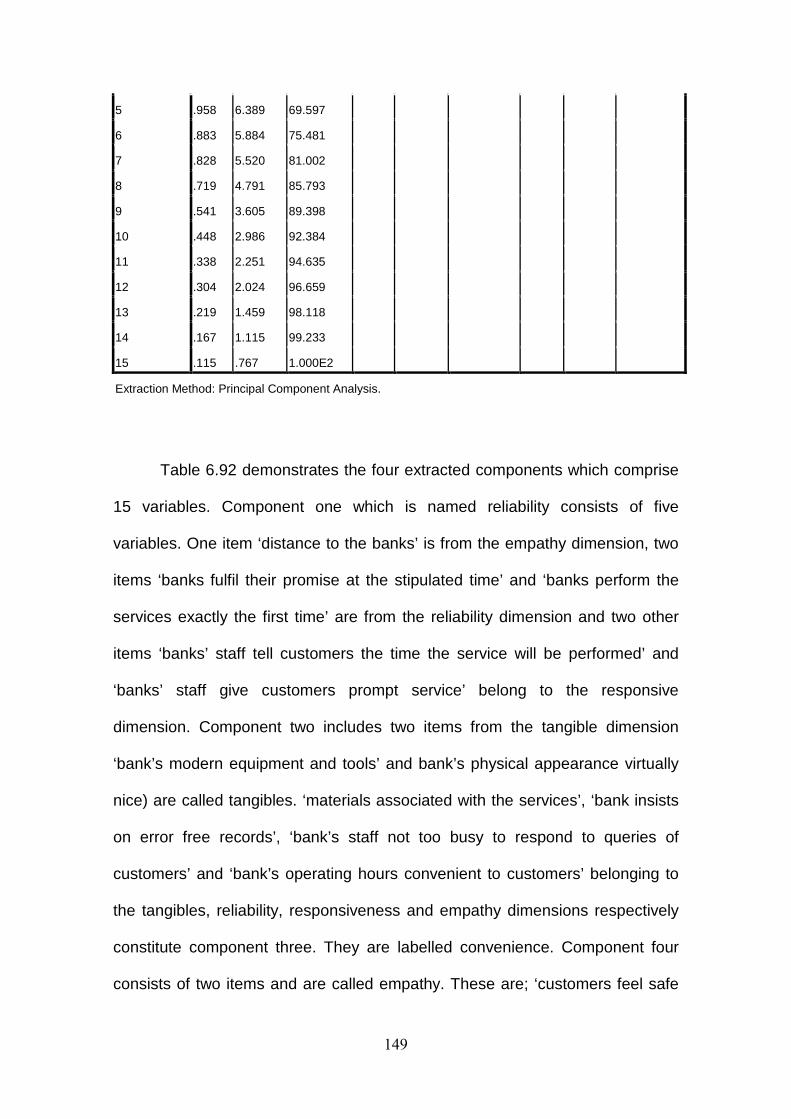
149
5 .958 6.389 69.597
6 .883 5.884 75.481
7 .828 5.520 81.002
8 .719 4.791 85.793
9 .541 3.605 89.398
10 .448 2.986 92.384
11 .338 2.251 94.635
12 .304 2.024 96.659
13 .219 1.459 98.118
14 .167 1.115 99.233
15 .115 .767 1.000E2
Extraction Method: Principal Component Analysis.
Table 6.92 demonstrates the four extracted components which comprise
15 variables. Component one which is named reliability consists of five
variables. One item ‘distance to the banks’ is from the empathy dimension, two
items ‘banks fulfil their promise at the stipulated time’ and ‘banks perform the
services exactly the first time’ are from the reliability dimension and two other
items ‘banks’ staff tell customers the time the service will be performed’ and
‘banks’ staff give customers prompt service’ belong to the responsive
dimension. Component two includes two items from the tangible dimension
‘bank’s modern equipment and tools’ and bank’s physical appearance virtually
nice) are called tangibles. ‘materials associated with the services’, ‘bank insists
on error free records’, ‘bank’s staff not too busy to respond to queries of
customers’ and ‘bank’s operating hours convenient to customers’ belonging to
the tangibles, reliability, responsiveness and empathy dimensions respectively
constitute component three. They are labelled convenience. Component four
consists of two items and are called empathy. These are; ‘customers feel safe
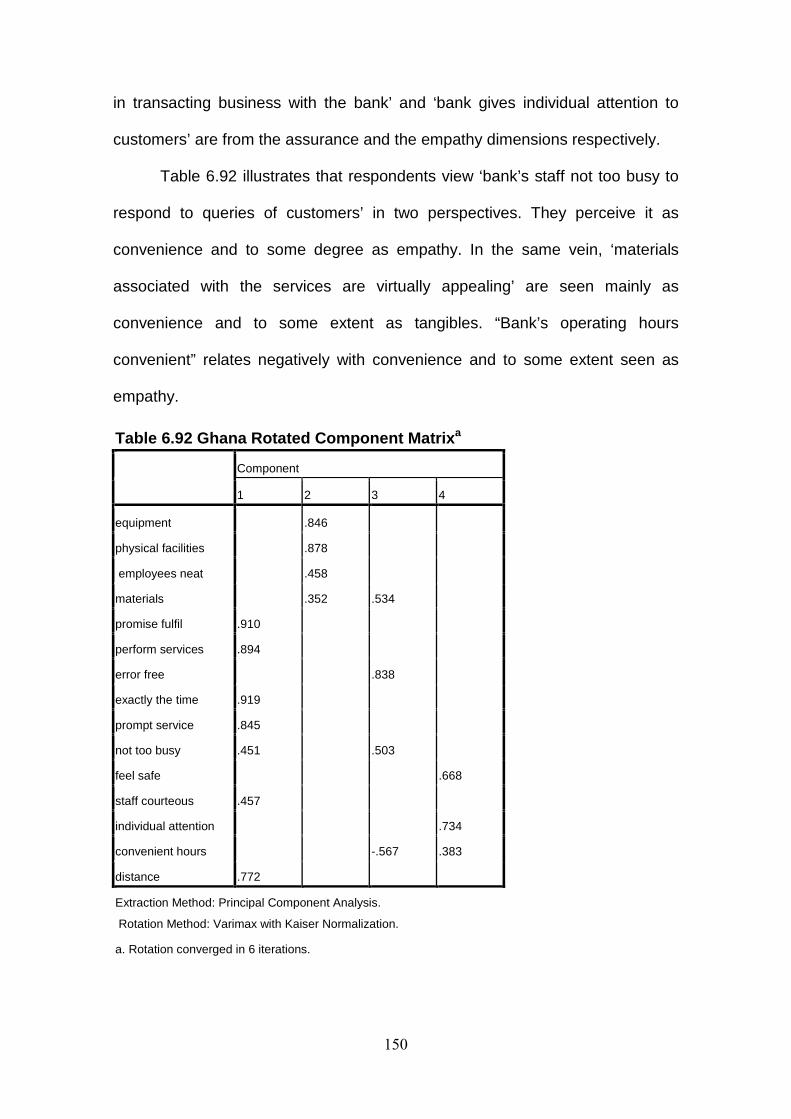
150
in transacting business with the bank’ and ‘bank gives individual attention to
customers’ are from the assurance and the empathy dimensions respectively.
Table 6.92 illustrates that respondents view ‘bank’s staff not too busy to
respond to queries of customers’ in two perspectives. They perceive it as
convenience and to some degree as empathy. In the same vein, ‘materials
associated with the services are virtually appealing’ are seen mainly as
convenience and to some extent as tangibles. “Bank’s operating hours
convenient” relates negatively with convenience and to some extent seen as
empathy.
Table 6.92 Ghana Rotated Component Matrix a
Component
1 2 3 4
equipment .846
physical facilities .878
employees neat .458
materials .352 .534
promise fulfil .910
perform services .894
error free .838
exactly the time .919
prompt service .845
not too busy .451 .503
feel safe .668
staff courteous .457
individual attention .734
convenient hours -.567 .383
distance .772
Extraction Method: Principal Component Analysis.
Rotation Method: Varimax with Kaiser Normalization.
a. Rotation converged in 6 iterations.
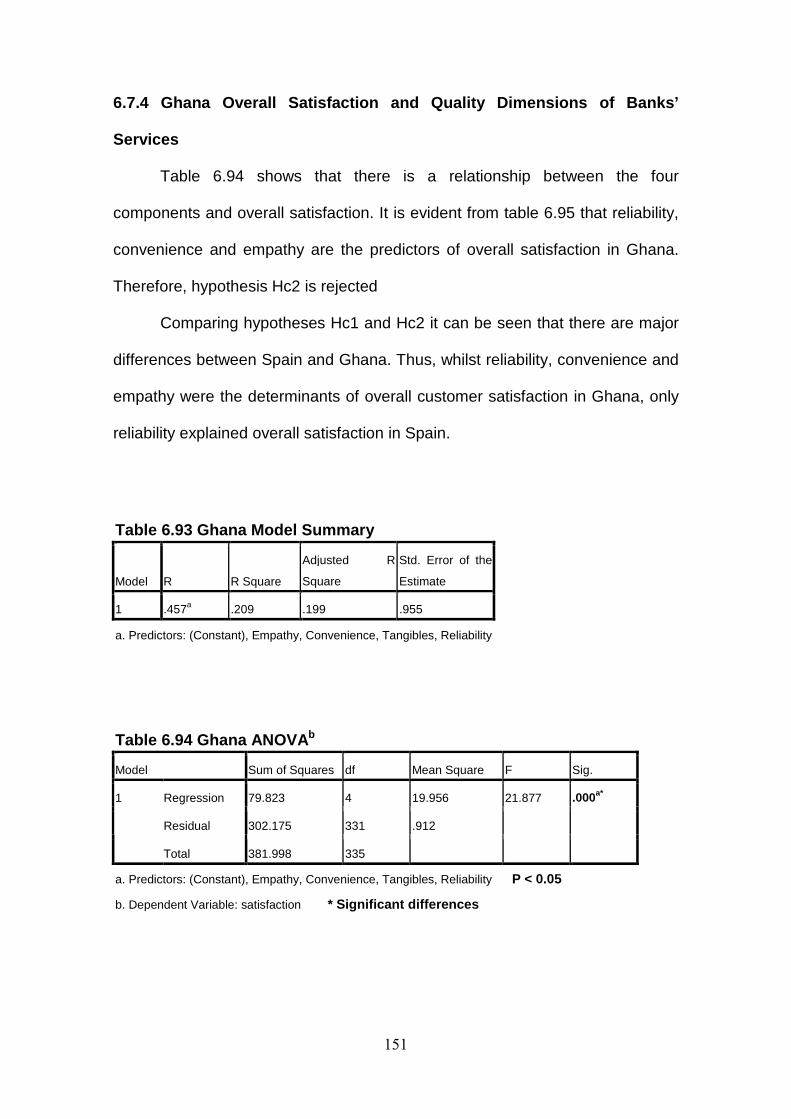
151
6.7.4 Ghana Overall Satisfaction and Quality Dimens ions of Banks’
Services
Table 6.94 shows that there is a relationship between the four
components and overall satisfaction. It is evident from table 6.95 that reliability,
convenience and empathy are the predictors of overall satisfaction in Ghana.
Therefore, hypothesis Hc2 is rejected
Comparing hypotheses Hc1 and Hc2 it can be seen that there are major
differences between Spain and Ghana. Thus, whilst reliability, convenience and
empathy were the determinants of overall customer satisfaction in Ghana, only
reliability explained overall satisfaction in Spain.
Table 6.93 Ghana Model Summary
Model R R Square
Adjusted R
Square
Std. Error of the
Estimate
1 .457a .209 .199 .955
a. Predictors: (Constant), Empathy, Convenience, Tangibles, Reliability
Table 6.94 Ghana ANOVA b
Model Sum of Squares df Mean Square F Sig.
Regression 79.823 4 19.956 21.877 .000a*
Residual 302.175 331 .912
1
Total 381.998 335
a. Predictors: (Constant), Empathy, Convenience, Tangibles, Reliability P < 0.05
b. Dependent Variable: satisfaction * Significant differences
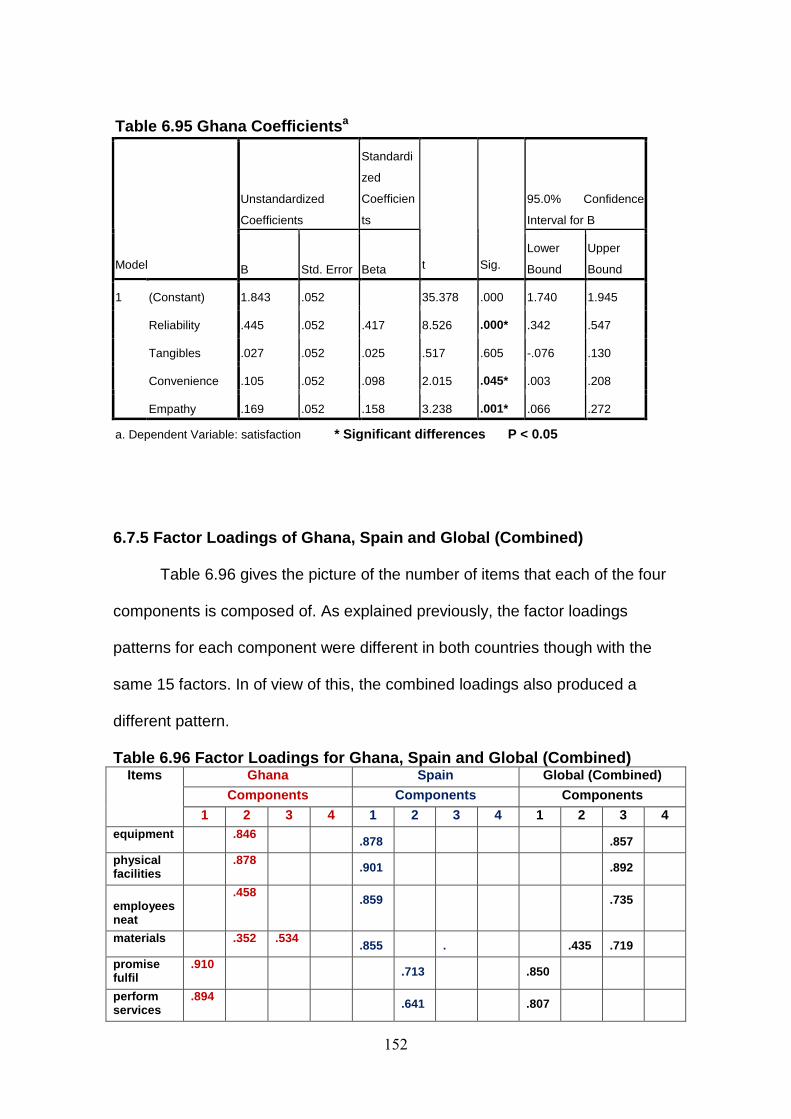
152
Table 6.95 Ghana Coefficients a
Unstandardized
Coefficients
Standardi
zed
Coefficien
ts
95.0% Confidence
Interval for B
Model B Std. Error Beta t Sig. Lower
Bound
Upper
Bound
(Constant) 1.843 .052 35.378 .000 1.740 1.945
Reliability .445 .052 .417 8.526 .000* .342 .547
Tangibles .027 .052 .025 .517 .605 -.076 .130
Convenience .105 .052 .098 2.015 .045* .003 .208
1
Empathy .169 .052 .158 3.238 .001* .066 .272
a. Dependent Variable: satisfaction * Significant differences P < 0.05
6.7.5 Factor Loadings of Ghana, Spain and Global (C ombined)
Table 6.96 gives the picture of the number of items that each of the four
components is composed of. As explained previously, the factor loadings
patterns for each component were different in both countries though with the
same 15 factors. In of view of this, the combined loadings also produced a
different pattern.
Table 6.96 Factor Loadings for Ghana, Spain and Glo bal (Combined) Ghana Spain Global (Combined)
Components Components Components
Items
1 2 3 4 1 2 3 4 1 2 3 4 equipment .846
.878 .857
physical facilities
.878 .901 .892
employees neat
.458 .859 .735
materials .352 .534 .855 . .435 .719
promise fulfil
.910 .713 .850
perform services
.894 .641 .807
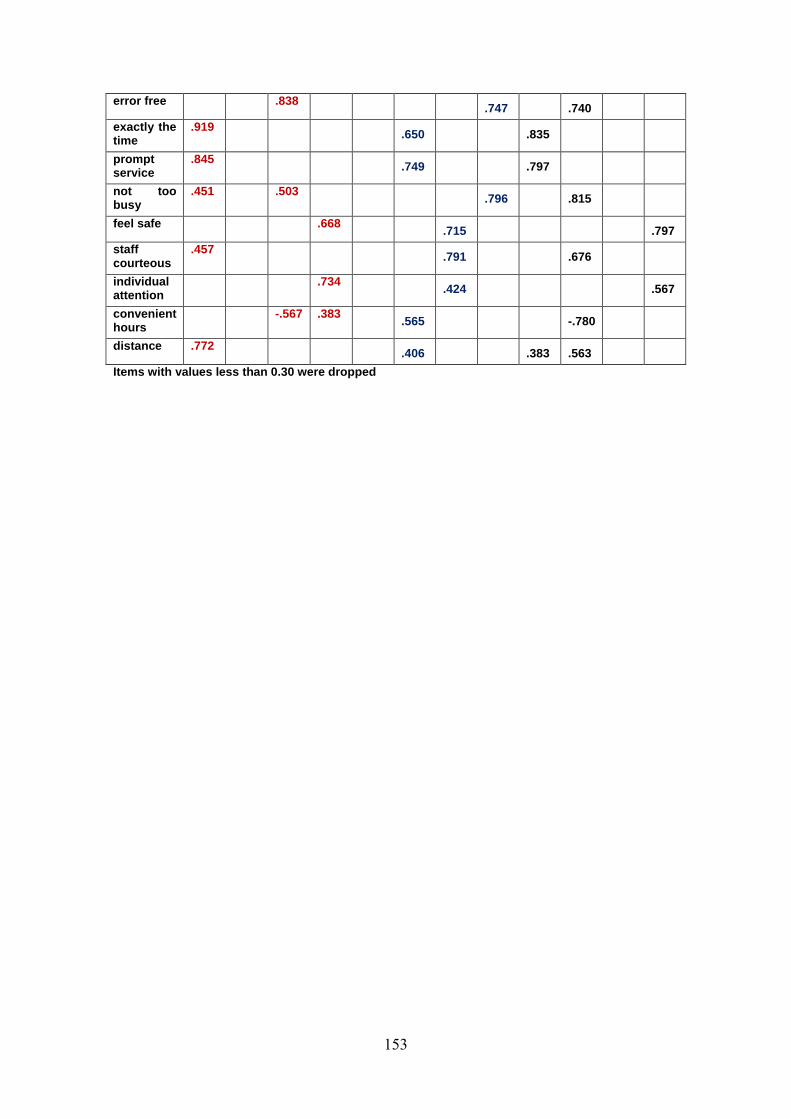
153
error free .838 .747 .740
exactly the time
.919 .650 .835
prompt service
.845 .749 .797
not too busy
.451 .503 .796 .815
feel safe .668 .715 .797
staff courteous
.457 .791 .676
individual attention
.734 .424 .567
convenient hours
-.567 .383 .565 -.780
distance .772 .406 .383 .563
Items with values less than 0.30 were dropped
154
CHAPTER SEVEN
ANALYSIS OF THE HYPOTHESES
7.1 Introduction
The previous chapter dealt with the analysis of the data. This chapter
analyses the hypotheses tested in the previous chapter.
7.2 Hypothesis Ha: There are No Differences Between the Perceptions of
Ghana and Spain Regarding the Quality Dimensions of Banks’ Services
This hypothesis was rejected as both differed in their perceptions in
relation to the convenience, tangibles and the empathy dimension. The p values
of the three dimensions in table 6.44 were less than 0.05 and their means
values in table 6.45 attested to the variations.
(a) Hypothesis Ha1: There are no Differences in the Perceptions of the
Districts Regarding the Quality Dimensions of Banks ’ Services
This hypothesis was rejected because differences existed among the
districts with reference to the four quality dimensions (reliability, convenience,
tangibles and empathy). The p values in table 6.46 were less than 0.05 and the
mean values in table 6.47 also varied.
(b) Hypothesis Ha2: There are No Differences in the Per ceptions of the
Communities Regarding the Quality Dimensions of Ban ks’ Services
This hypothesis was not rejected since all the communities shared the
same views about the four dimensions. All the p values in table 6.49 were
greater than 0.05.
155
(c) Hypothesis Ha3: There is No Difference Between the Perceptions of
Men and Women Regarding the Quality Dimensions of B anks’ Services
This hypothesis was also rejected as both sexes had varying views about
the perceptions of both sexes in terms of the reliability and the tangible
dimensions. Table 6.50 revealed that the p values for both dimensions were
less than 0.05. The means test in table 6.51 however showed that the
differences were small.
(d) Hypothesis: Ha4: There are No Differences in th e Perceptions of the
Age Groups Regarding the Quality Dimensions of Bank s’ Services
The hypothesis was rejected due to the fact that the age groups varied in
their opinions with regard to the reliability and the convenience dimensions. The
p values in both cases in table 6.53 were less than 0.05. The means test in
table 6.54 also confirmed the variations.
(e) Hypothesis Ha5: There are No Differences in the Perceptions of the
Educational Groups Regarding the Quality Dimensions of Banks’ Services
This hypothesis was rejected owing to the fact that the views of the
educational groups did not tally in relation to the reliability, convenience and
empathy dimensions. As illustrated by table 6.56, the p values in the three
cases were less than 0.05. The means analysis in table 6.57 also indicated that
there were differences.
156
(f) Hypothesis Ha6: There are No Differences in the Per ceptions of the
Occupational Groups Regarding the Quality Dimension s of Banks’
Services
The hypothesis was rejected because the occupational groups varied in
their views concerning the reliability and the convenience dimensions. Table
6.59 unveiled that the p values in both instances were less than 0.05. Similarly,
the means values in table 6.60 revealed that there were differences.
7.3 Hypothesis Hb: There is No Difference Between t he Overall
Satisfaction of Ghana and Spain
The hypothesis was rejected because both countries had divergent views
about overall satisfaction. It is evident from table 6.62 that the p value was less
than 0.05. The means values in table 6.63 also elicited the differences.
(a) Hypothesis Hb1: There are No Differences Among the Districts
Regarding Overall Satisfaction
This hypothesis was rejected since there were variations in the
perceptions of the districts regarding overall satisfaction. The p values in tables
6.64 and 6.65 (only in the case of Barcelona and Kumasi) were less than 0.05.
The means test in table 6.66 however elicited that there were differences
among all the districts
157
(b) Hypotheses Hb2: There are No Differences Among the Communities
Regarding Overall Satisfaction
Similarly, this hypothesis was not rejected because the perceptions of the
communities were the same. As can be seen from table 6.67, the p value was
greater than 0.05. The means test in table 6.68 also showed no difference.
(c) Hypothesis Hb3: There is No Difference Between Men and Women
Regarding Overall Satisfaction
This hypothesis was not rejected as both did not vary in their general
views about the quality of banks’ services. The p values in table 6.69 were
greater than 0.05. The mean values in table 6.70 revealed no differences.
(d) Hypothesis Hb4: There are no Differences Among the Age Groups
Regarding Overall Satisfaction
This hypothesis was not rejected because no differences existed among
the age groups. The p value in table 6.71 was greater than 0.05 whilst the
means values in table 6.72 were almost the same.
(e) Hypothesis Hb5: There are No Differences Among the Educational
Groups Regarding Overall Satisfaction
This hypothesis was rejected due to the fact that the educational groups
had divergent views. The p values in tables 6.73 and 6.74 (illiterates and the
158
rest of the groups) were less than 0.05 and the means values in table 6.75 also
confirmed the differences.
(f) Hypothesis Hb6: There are No Differences Among the Occupational
Groups Regarding Overall Satisfaction
This hypothesis was rejected because the occupational groups varied in
their views. The p values in tables 6.76 and 6.77 (students and services,
services and production) were less than 0.05. The means values in table 6.78
however showed differences among all the groups.
7.4 Hypothesis Hc: There is No Relationship Between Ove rall Satisfaction
and the Quality Dimensions of Banks’ Services in Gh ana and Spain
This hypothesis was rejected for the fact that only reliability and
convenience dimensions had relationship with overall satisfaction. The p values
in tables 6.80 and 6.81(reliability and convenience) were less than 0.05.
(a) Hypothesis Hc1: There is No Relationship Between Ov erall Satisfaction
and the Quality Dimensions of Banks’ Services in Sp ain
This hypothesis was rejected because only the reliability dimension had
relationship with overall satisfaction in Spain. The p value in table 6.87 was
0.053 but that of reliability in table 6.88 was 0.042.

159
(b) Hypothesis Hc2: There is No Relationship Between Ov erall Satisfaction
and the Quality Dimensions of Banks’ Services in Gh ana
This hypothesis was rejected because only the reliability, convenience
and empathy dimensions were related to overall satisfaction in Ghana. The p
value in table 6.94 was less than 0.05 but table 6.95 showed that only reliability,
convenience and empathy had values less than 0.05.
7.5 Summary of Tested hypotheses
Table 7.1 presents the tested hypotheses
Table 7.1 Summary of Tested Hypotheses Results Hypotheses
Not Reject
Reject
Ha. There are no differences between the perception s of Ghana and
Spain regarding the quality dimensions of bank s’ services
The sub-hypotheses are;
Ha1. There are no differences in the perceptions of the districts
regarding the quality dimensions of banks’ services
Ha2. There are no differences in the perceptions of the communities
regarding the quality dimensions of banks’ services
Ha3. There is no difference between the perceptions of men and
women regarding the quality dimensions of banks’ services
Ha4. There are no differences in the perceptions of the age groups
regarding the quality dimensions of banks’ services
Ha5. There are no differences in the perceptions of the educational
groups regarding the quality dimensions of banks’ services
Ha6. There are no differences in the perceptions of the occupational
groups regarding the quality dimensions of banks’ services
Yes
Yes
Yes
Yes
Yes
Yes
Yes
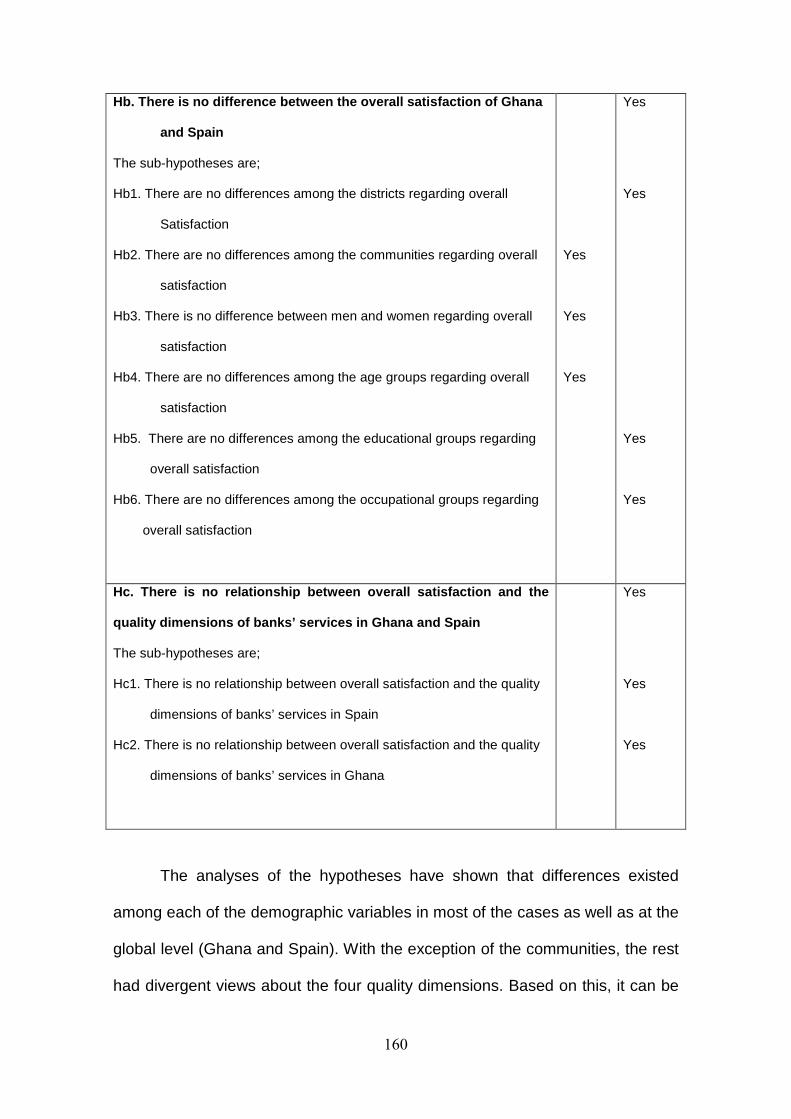
160
Hb. There is no difference between the overall sati sfaction of Ghana
and Spain
The sub-hypotheses are;
Hb1. There are no differences among the districts regarding overall
Satisfaction
Hb2. There are no differences among the communities regarding overall
satisfaction
Hb3. There is no difference between men and women regarding overall
satisfaction
Hb4. There are no differences among the age groups regarding overall
satisfaction
Hb5. There are no differences among the educational groups regarding
overall satisfaction
Hb6. There are no differences among the occupational groups regarding
overall satisfaction
Yes
Yes
Yes
Yes
Yes
Yes
Yes
Hc. There is no relationship between overall satisf action and the
quality dimensions of banks’ services in Ghana and Spain
The sub-hypotheses are;
Hc1. There is no relationship between overall satisfaction and the quality
dimensions of banks’ services in Spain
Hc2. There is no relationship between overall satisfaction and the quality
dimensions of banks’ services in Ghana
Yes
Yes
Yes
The analyses of the hypotheses have shown that differences existed
among each of the demographic variables in most of the cases as well as at the
global level (Ghana and Spain). With the exception of the communities, the rest
had divergent views about the four quality dimensions. Based on this, it can be

161
concluded that perceptions of the quality dimensions of banks’ services by
customers are influenced by sex, age, education occupation and geographical
locations.
162
CHAPTER EIGHT
DISCUSSIONS OF FINDINGS AND CONCLUSIONS
8.1 Discussions of Findings
The previous chapter treated the analysis of the data whilst the current
one discusses the main findings of the study and draws conclusions as well.
8.1.1 Medium of Patronising Banks
Savings and commercial banks were found to be the main banks that
people patronised in Spain and Ghana respectively. Respondents in Spain
intimated that saving banks were relatively flexible in terms of their deposit and
credit requirements. In the case of Ghana, commercial banks were seen to be
relatively accessible since they have many branches throughout the country.
The results also showed that Spaniards patronised the banks more regularly
than their Ghanaian counterparts. Office was also the main medium through
which customers in Ghana adopt in transacting business with the banks. The
respondents put forward that telephone was very expensive and apart from the
fact that they were not computer literates, internet was difficult to come by. In
fact, internet is an ‘urban commodity’ in Ghana. In contrast, office and telephone
were the major means in Spain. This was followed by office, internet and
telephone and then office alone. The trend in Spain can be attributed to the fact
that information and communication technology is well developed, affordable
and easily accessible. The results in Spain support the study of the Banco de
España (2006). The data showed that the number of deposit accounts arranged
via electronic and internet banking was over 2.3 million in 2006. This is however
163
in sharp contrast with the study of Kumar et al (2009). They found that despite
technology advances and with the introduction of internet banking, most
customers still did business with the banks through ATMs and the branches in
Malaysia.
8. 1.2 Quality Dimensions of Banks’ Services
The principal component analyses performed for Ghana and Spain and
the global (combination of both countries) yielded the same four dimensions
namely reliability, convenience, tangibles and empathy in each case. The
tangible dimension came out as the dimension that was identical to that of the
SERVPERF tangibles. The four dimensions were the variables predicting
satisfaction of quality of banks’ services in Ghana and Spain. Though the
dimensions were the same, the loading patterns of the items on each dimension
differed in both countries. This suggests that customers perceived the same
four dimensions differently in both countries, thus making the dimensions highly
subjective even in the banking industry.
The findings of this study support the criticisms levelled against the
SERVQUAL/SERVPERF model by researchers such as Ladhari (2009), Buttle
(1996) and Robbinson (1999) regarding the dimensional structure. They argued
that, the five service quality dimensions were not universal and could not be
applied in all service industries. Even in the same banking industry, studies
conducted by people resulted in different dimensions. For example, the studies
of Arasli et al (2005), Yavas and Benkenstein (2007) and Jabnoun and Al-
Tamimi produced three dimensions each whilst that of Kumar et al (2009), Yab
164
and Sweeney (2007) and Athanassopoulos et al (2001) came out with four, two
and six 6 dimensions respectively.
The findings also confirm the criticisms made by Buttle (1996) that the
five dimensions of SERVQUAL/SERVPERF are highly inter-correlated. From
the three principal component analyses performed in this study, four items
comprising two items each from the reliability and the responsiveness
dimensions loaded on one component in each case. This shows that items of
these two dimensions are highly correlated.
8.1.3 Hypothesis Ha: There are No Differences Betwe en the Perceptions of
Ghana and Spain Regarding the Quality Dimensions of Banks’ Services
This hypothesis showed that both Ghana and Spain had divergent views
about the convenience, tangibles and the empathy dimensions. Ghana was
more dissatisfied with convenience than Spain. Also Spain emerged as more
dissatisfied with tangibles and empathy than Ghana. This hypothesis Hc was
therefore not confirmed. Respondents in Spain explained on the questionnaires
that, general physical appearance of most of the banks were not appealing. The
same reasons were given regarding the convenience and empathy dimensions
for Ghana and Spain respectively as in (8.1.3.a) below. The results support the
studies of Dash et al (2009), Petridou et al (2007) and Athanassopoulos et al
(2001). The study of Dash et al (2009) revealed that Indian consumers attached
higher importance to tangible attributes, whilst Canadian consumers considered
service reliability more important. In the case of Petridou et al (2007), banks’
customers in Greece perceived receiving higher quality services than their
165
Bulgarian counterparts. Similarly, Athanassopoulos et al (2001) found that
customer satisfactions were country specific.
(a) Hypothesis Ha1: There are no Differences in the Perceptions of the
Districts Regarding the Quality Dimensions of Banks ’ Services
The results did not support hypothesis Ha1 as the districts differed in
their opinions about the four components except tangibles. Girona being the
only district satisfied with reliability suggests customers over there might have
had confidence and trust in the banks as they delivered prompt services as well
as keeping their promises. Girona and Barcelona were found to be satisfied with
the convenience dimension. Commenting on this, respondents from both
districts indicated that the banks were easily accessible. This confirms the
assertion of Jimenez et al (2008) that Spain had the largest per capita bank
branch density in Europe. Also the number of bank branches has increased in
the last five years at an annual rate of 4%. In contrast, respondents in Kumasi
and Bekwai revealed that the banks were located far away and this did not
augur well for them. This supports the data of Buchs and Mathisen( 2005). They
uncovered that, the banking penetration ratio in Ghana was one bank branch
office per 54,000 inhabitants whilst formal banking reached only 5% of the
population. The banks were mostly concentrated in the Greater Region with a
share of 35% of bank branches though the region accounted for only 13% of the
total population. With regard to empathy, those in Girona and Barcelona put
forward that the banks did not have their interest at heart. They registered their
displeasure about the high and the frequent increase in their charges and tariffs
166
whilst at the same time interest on savings was very small. The concerns of
Girona and Barcelona confirm the survey conducted by the IPSOS INRA
(2007).
(b) Hypothesis Ha2: There are No Differences in the Perceptions of the
Communities Regarding the Quality Dimensions of Ban ks’ Services
Hypothesis Ha2 was not rejected because the communities had common
views about the four dimensions. The results imply that the quality of banks’
services in the communities was similar in both countries.
(c) Hypothesis Ha3: There is No Difference Between the Perceptions of
Men and Women Regarding the Quality Dimensions of B anks’ Services
The results did not confirm this hypothesis. Both sexes varied slightly in
their views about the reliability and the tangibles dimensions. Therefore, the
findings are consistent with that of Spathis et al (2005) in Greece. They found
that men and women differed in their perceptions about the quality of banks’
services. In contrast, the results did not support the study of Lee and Chen
(2009). In their case, there were no significant differences between the
perceptions of men and women about banks’ service quality in Vietnam.
(d) Hypothesis: Ha4: There are No Differences in th e Perceptions of the
Age Groups Regarding the Quality Dimensions of Bank s’ Services
This hypothesis revealed that there were differences among the age
groups. Owing to this, the hypothesis was rejected. Reliability and convenience
were the dimensions that respondents had divergent views. The age group 61+

167
emerged as the most dissatisfied for both dimensions. The results tally with the
studies of Dimitriades and Maroudas (2007) and Lee and Chen (2009). The
former found that there were significant differences in satisfaction ratings
between the young and the old. Similarly, the findings of the study of the latter
indicated that there were significant differences among the age groups
regarding banks’ service quality in Vietnam. The aged being the only
dissatisfied group suggests that the banks were not giving preferential treatment
to the aged. Also, being dissatisfied with the convenience dimension implies the
opening hours of the banks and the distance to the banks were not suitable for
them as well.
(e) Hypothesis Ha5: There are No Differences in the Perceptions of the
Educational Groups Regarding the Quality Dimensions of Banks’ Services
The results demonstrated that all of the educational groups varied in their
opinions with exception of the tangibles dimension. Therefore, this hypothesis
was rejected. University graduates were the most satisfied in the case of the
reliability dimension. Illiterates surfaced as the most dissatisfied and most
satisfied for convenience and empathy dimensions respectively. The findings
are consistent with the results of Siu and Mou (2007) and Lee and Chen (2009).
The study of Siu and Mou showed that there were differences among the
university, technical/vocational and secondary groups. In the same vein, the
latter found that there were significant differences among the educational
groups regarding the quality of banks’ services in Vietnam. The groups differed
about the reliability dimension. The findings suggest that the highly educated
168
and illiterates were very critical about the quality of services offered by banks in
Ghana and Spain.
(f) Hypothesis Ha6: There are No Differences in the Perceptions of the
Occupational Groups Regarding the Quality Dimension s of Banks’
Services
The results portrayed that the groups varied in their perceptions in
relation to reliability, convenience and to some extent empathy. Students and
others (agriculture and construction) were the most satisfied and the most
dissatisfied regarding the reliability and the convenience dimensions
respectively. As a result, this hypothesis was not confirmed. The findings tally
with the empirical studies of Lee and Chen (2009) and Athanassopoulos et al
(2001). The results of the former unveiled that there were significant differences
among the occupational groups regarding banks’ service quality in Vietnam. In
the case of the latter, they found that customer satisfaction was industry
specific.
8.1.4 Hypothesis Hb: There is No Difference Between the Overall
Satisfaction of Ghana and Spain
The results unveiled that both Ghana and Spain were dissatisfied.
However, Ghana was more dissatisfied than Spain. Hypothesis Hb was
therefore not supported. The findings are consistent with the study of Snee et al
(2000). Their research demonstrated that satisfaction levels of banks services in
the UK were higher than Hungary. The results did not however confirm the
study of Dash et al (2009). They found that there were no differences between
169
Canada and India with regards to overall service quality expectations of
customers.
(a) Hypothesis Hb1: There are No Differences Among the Districts
Regarding Overall Satisfaction
(b) Hypotheses Hb2: There are No Differences Among the Communities
Regarding Overall Satisfaction
(c) Hypothesis Hb3: There is No Difference Between Men and Women
Regarding Overall Satisfaction
(d) Hypothesis Hb4: There are no Differences Among Age Groups
Regarding Overall Satisfaction
(e) Hypothesis Hb5: There are No Differences Among the Educational
Groups Regarding Overall Satisfaction
(f) Hypothesis Hb6: There are No Differences Among the Occupational
Groups Regarding Overall Satisfaction
The results of the hypotheses indicated that generally all the
demographic variables namely sex, districts, age, communities, education and
occupation were highly dissatisfied with the banks’ services. Differences
occurred only in the degree of dissatisfaction among some of the variables.
There were no differences in the level of dissatisfaction among each of these
variables; communities, sex and age. Therefore, hypotheses Hb2, Hb3 and Hb4
respectively were supported. In the case of the districts, Kumasi was the most
dissatisfied. Therefore, hypothesis Hb1 was not confirmed. Similarly, illiterates
varied from the rest of the group as far as education was concerned. They were
170
the most dissatisfied. As a result of this, Hb5 was rejected. Workers from the
service sector also surfaced as the most dissatisfied. Hypothesis Hb6 was
therefore not confirmed. The entire results suggest that banks in Ghana and
Spain offer poor quality services.
8.1.5 Hypothesis Hc There is No Relationship of Bet ween the Overall
Satisfaction and the Quality Dimensions of Banks’ S ervices in Ghana and
Spain
The results of the regression test showed that not all the dimensions had
relationship with overall satisfaction. Only reliability and convenience came out
as the determinants of overall satisfaction in Ghana and Spain. Hypothesis Hc
was therefore not confirmed. The findings mean that when the banks become
more or less reliable and convenient, overall satisfaction levels of customers will
also increase or decrease. The results were not consistent with the studies of
Jabnoun and Khalifa (2005), Arasli et al (2005), Lopez et al (2007), Jamal and
Anastasiadou (2009) and Ravichandran et al (2010). In the case of Jabnoun
and Khalifa (2005), though all the 4 factors were significant determinants of
quality of service in conventional banks, the most important were values and
image.
Whilst the study of Arasli et al (2005) showed that reliability had the
highest impact on overall customer satisfaction, that of Lopez et al (2007)
indicated that reliability, responsiveness, tangibles, access, communication and
credibility positively correlated with satisfaction. In the case of Jamal and
Anastasiadou (2009), reliability, tangibility and empathy positively correlated
with customer satisfaction. Ravichandran et al (2010) also found that
171
responsiveness was the only significant dimension related to overall satisfaction
of banks’ services in India.
(a) Hypothesis Hc1: There is No Relationship Betwee n the Overall
Satisfaction and the Quality Dimensions of Banks’ S ervices in Spain
(b) Hypothesis Hc2: There is No Relationship Betwee n the Overall
Satisfaction and the Quality Dimensions of Banks’ S ervices in Ghana
The two hypotheses revealed that the relationship between overall
satisfaction and the quality dimensions of banks services in Spain was different
from Ghana. The regression analyses showed that whilst reliability,
convenience and empathy were the determinants of overall service satisfaction
in Ghana, only reliability was a predictor in Spain. The results signify that when
customers in Ghana and Spain find the banks more or less reliable, overall
satisfaction levels will rise or fall in both countries. The same situation will hold
in Ghana for the convenient and the empathy dimensions. Hypothesis Hc1 and
Hc2 were therefore not confirmed. It is clear that there was a difference
between the relationship of overall satisfaction and the quality dimensions of
banks’ services in Ghana and Spain.
Since the results of the overall satisfaction (see 8.1.4) showed that both
countries were highly dissatisfied, then the dissatisfaction of customers in
Ghana could be explained in terms of the fact that the banks were found to be
unreliable, inconvenient and non empathetic. In the case of Spain, it can be
attributed to the unreliability of the banks. Respondents registered their
displeasure on the questionnaire that the unreliability of the banks was
manifested in their failure to keep to their promises and to give prompt services.
172
The explanations given for the convenience and the empathy dimensions are
not different from (8.1.3.1a) supra.
From the data analysis and the discussions, it is conspicuous that there
were some major differences between the perceptions of Ghana and Spain.
The next section focuses on the conclusions of the study
8. 2 Conclusions
The main aim of the study was to examine the perceptions of customers
regarding the quality of banks’ services in Ghana and Spain in terms of their
sex, age, education, occupation and geographical locations. Twenty-four
communities were chosen from the Ashanti and the Catalonia regions in Ghana
and Spain for the study. Information was gathered in both countries through a
questionnaire. One thousand and four hundred questionnaires were received. A
modified SERVPERF model with 21 items was adopted for the research. The
principal component analysis was used to reduce the 21 items. In all, three
main hypotheses with 15 sub-hypotheses were tested. The data was subjected
to statistical analysis by using the ANOVA, t-test and the linear regression
approaches. The main limitation of the study was that the total number of
buildings/houses in each community was not broken down into zones except
the cities of Girona and Barcelona. This was corrected by dividing the total
number of buildings/houses in each community by the number of zones.
Savings and commercial banks were found to be the major banks that
people patronised in Spain and Ghana respectively. Whilst office was the main
means used in Ghana by customers in transacting business with the banks,
Spanish customers used a variety of means; notably; office and telephone,
173
followed by office, internet and telephone and then office alone. The results also
demonstrated that Spaniards did business with the banks more regularly than
their Ghanaian counterparts.
The study elicited four quality dimensions namely reliability, convenience,
tangibles and empathy. Also, both the reliability and the responsiveness
dimensions were found to be highly correlated. Thus, the study has raised a
theoretical concern and contributed to the academic debate on the universality
of the dimensions of the SERVQUAL/SERVPERF models and the inter-
relational nature of their items. The four dimensions also exhibited a subjective
character in this study. This is because the factor loading patterns on each
dimension varied in both countries, meaning they were seen differently by
customers though in the same banking industry.
The study has also provided a strong evidence that perceptions of the
quality dimensions of banks’ services vary and depend on a myriad of factors
even within the same country. First, the study has established that perceptions
of the quality dimensions of banks’ services are determined by customers’ sex.
Thus, both men and women had divergent views about the reliability and the
tangible dimensions. In addition, the study has shown that customers’ views
about the quality dimensions of banks’ services vary according to age. The age
groups differed in terms of the reliability and convenience dimensions. Also,
there were differences in the perceptions of the educational groups with
reference to the reliability, convenience and the tangible dimensions. Similarly,
the occupational groups varied in their views pertaining to the reliability and the
convenience dimensions. At the district (provincial/regional) level, differences
occurred in the reliability, convenience and the empathy dimensions. At the
174
global level, both Ghana and Spain varied in their perceptions of the quality
dimensions of banks services with regard to the convenience, tangibles and the
empathy dimensions. Therefore, the study has established that perceptions of
the quality dimensions of banks’ services are determined by customers’ sex,
age, education and occupation as well as geographical locations. The study has
also proved that perceptions of the quality dimensions of banks’ services are
not influenced by the community that customers reside in.
The study has also shown that generally (overall satisfaction), all the
variables namely sex, age, education, occupation and the geographical
locations felt the banks performed poorly. Thus, the banks offered poor quality
services in Ghana and Spain. The study also found that overall satisfaction is
determined by the education, occupation and the geographical locations (district
and country) of customers. The study also revealed that overall satisfaction is
not affected by customers’ sex, age and the community in which they live. Also
the study has shown that not all the quality dimensions are determinants of
overall satisfaction at the global level. Further more, predictors of overall
satisfaction also depend on the country. Thus, the quality dimensions that
predicted overall satisfaction in Ghana differed from that of Spain.
It is recommended that the five dimensions of the
SERVQUAL/SERVPERF must be critically examined. It will be desirable if the
reliability and the responsiveness dimensions are combined since they are
highly correlated. Since customers in Ghana and Spain were dissatisfied about
the reliability dimension banks in both countries should endeavour to be more
reliable by way of fulfilling their promises and delivering prompt services.
Specifically, more attention should be paid to Kumasi and Barcelona, the aged,
175
the primary school graduates and illiterates. Being reliable will not only build the
confidence of existing customers but will also attract new ones as well.
Banks in Spain must have a second thought about their tangibles
especially the general physical appearance of their offices both inside and
outside and the appearance of their staff. Customers were also displeased
with the convenience dimension in Ghana. Banks in Ghana should make it
easier for their customers especially the aged, illiterates and others (agriculture
and construction workers) to access their services and products easily. More
branches must be opened. Also more Automated Teller Machines (ATM) should
be installed at vantage points such as stores and post offices. Internet banking
should be encouraged or be introduced throughout the country. In the case of
the empathy dimension, banks in Ghana and Spain should be sensitive to the
plight of customers in terms of their charges, tariffs and the waiting time,
particularly the unemployed.
As the general feeling (overall satisfaction) was that banks sold poor
quality services and products, banks should spare no efforts to take stock of
their services and products as well as their operations in general to see where
they are found wanting. This can be achieved through periodic customer
satisfaction survey. Emphasis must be placed on the reliability, convenience
and the empathy dimensions which surfaced most often as the ones that
customers were dissatisfied with.
The four quality dimensions extracted were not fully clear because the
loading patterns differed in both countries. It is recommended that the whole 22
items of SERVPERF should be used in future studies to verify if the results will

176
be the same or not. In conducting such studies, different geographical locations
can be chosen from both Ghana and Spain.
177
BIBLIOGRAPHY
Abdullah, D.N.M.A. and Rozario, F. (2009), Influence of Service and Product
Quality Towards Customer Satisfaction: A Case Study at the Staff Cafeteria in
the Hotel Industry, World Academy of Science, Engineering and Technology 53,
185-190
Aldlaigan, A. and Buttle, F. (2005), Beyong Satisfaction: Customer Attachment
to Retail Banks, International Journal of Bank Marketing, 23 (4) 349-359
Allred, A.T. (2001), Employees Evaluations of Service Quality at Banks and
Credit Unions, International Journal of Bank Marketing, 19(4), 179-185
Allred, A.T. and Addams H.L. (2000), Service Quality at Banks and Credit
Unions: What Do Their Customers Say? Managing Service Quality, 10 (1), 52-
60
Anderson, E.W., Fornell, C. and Lehmann, D.R. (1994), Customer Satisfaction,
Market Share, and Profitability: Findings from Sweden, Journal of Marketing, 58
(3), 53-66.
Anderson, E.W. and Sullivan, M. (1993), The Antecedents and Consequences
of Consumer Satisfaction for Firms, Marketing Science, 12 (2), 125-143.
Arasli, H., Mehtap-Smadi, S. and Katircioglu, S.T. (2005), Customer Service
Quality in the Greek Cypriot Banking Industry, Managing Service Quality, 15(1),
41-5
Arasli, H., Katircioglu, S.T.and Mehtap-Smadi, S. (2005), A comparison of
service quality in the banking industry Some evidence from Turkish- and Greek-
speaking areas in Cyprus, International Journal of Bank Marketing, 23(7), 508-
526
178
Assael, H., (1995), Consumer Behaviour and Marketing Action, 5th edition,
Cincinnati, South-Western College Publishing.
Asubonteng, P. McCleary, K.J. and Swan, J. (1996), SERVQUAL Revisited: A
Critical Review of Service Quality, Journal of Service Marketing, 10(6), 62-81
Athanassopoulos, A., Gounaris, S. and Stathakopoulos, V. (2001), Behavioural
Responses to Customers Satisfaction: An Empirical Study, European Journal of
Marketing, 35 (5/6), 687-707
Augur, M. G., Nataraajan, R. and Jahera Jr, J. S. (1999), Service Quality in the
Banking Industry: An Assessment in a Developing Economy, International
Journal of Bank Marketing, 17 (3), 116 -123
Babakus, E. and Boller, G.W. (1992), An Empirical Assessment of the
SERVQUAL Scale, Journal of Business Research, 24(3), 253-68
Baki, B., Basfirinci, C.S., Cilingir, Z. and Ar, I.M. (2009), An Application of
Integrating SERVQUAL and Kano’s Model into QFD for Logistics Services
A Case Study from Turkey, Asia Pacific Journal of Marketing and Logistics
21(1), 106-126
Banco España (2006) Structure and Evolution of The Institutions Under Banco
España’s Supervision 2006
Banco de España (2007), Structure and Evolution of the Institutions Under The
Banco de España’s Supervision in 2006
Banco de España (2009), Registro de Entidades Situation A 01de Julio de 2009
Banco de España (2010), Restructuring of Spanish Savings Banks Situation at
29th June, 2010
Bank of Ghana (2004), Cost of Banking in Ghana: An Empirical Assessment
and Implications, Policy Brief
179
Bank of Ghana (2006), Major Payment Systems in Ghana
Bank of Ghana (2010), Register of Licensed Banks in Ghana as at June 2009
Baumann, C., Burton, S., Elliott, G and Kehr, H.M. (2007), Prediction of Attitude
and Behavioural Intentions in Retail Banking, International Journal of Bank
Marketing, 25 (2), 102-11
Bawumia, M., Belnye, F. and Ofori, M.E. (2005), The Determination of Banks
Interest Spreads in Ghana: An Empirical Analysis of Panel Data, Bank of Ghana
Working Paper No. WP/BOG-2005/09
Beerli, A., Martın, J.D. and Quintana, A. (2004), A Model of Customer Loyalty in
the Retail Banking Market, European Journal of Marketing, 38(1/2), 253-275
Benito, E. (2008), Size, Growth and Banks Dynamics, Banco de España
Working Paper No. 0801
Best, A. and Andreasen, A.R. (1977), Consumer Response to Unsatisfactory
Purchases: A Survey of Perceiving Defects, Voicing Complaints, and Obtaining
Redress, Law & Society 11, 701-42
Bick , G., Brown, A.B. and Abratt (2004) Customer Perceptions of the Value
Delivered by Retail Banks in South Africa, The International Journal of Bank
Marketing , 22( 5), 300-318
Bitner, M.J. (1990), Evaluating Service Encounters: The Effects of Physical
Surrounding and Employee Response, Journal of Marketing, 54 (2), 69-82.
Blanchard, R.F. Galloway, R. L. (1994), Quality in Retail Banking, International
Journal of Service Industry Management, 5(4), 5 - 23
Boulding, W., Kalra, A., Staelin, R. and Zeithaml, V. (1993), A Dynamic Process
Model of Service Quality: From Expectations to Behavioural Intentions, Journal
of Marketing Research, 30 (1), 7-27
180
Bowen, J. and Hedges, R.B. (1993), Increasing Service Quality in Retail
Banking, Journal of Retail Banking 15(3 ), 21-28
Buchs, T. and Mathisen, J. (2005), Competition and Efficiency in Banking:
Behavioural Evidence from Ghana, IMF Working Paper, WP/05/17
Burke, R., J. Graham, J and Smith, F.J. (2005), Putting the Customer Second,
The TQM Magazine 17(1) 85-91
Buttle, F. (1996) SERVQUAL: Review, Critique, Research Agenda, European
Journal of Marketing, 30 (1), 8-32.
Carrillat, F.A., Jaramillo, F. and Mulki, J.P (2007), The Validity of the
SERVQUAL and SERVPERF Scales A Meta-Analytic View of 17 Years of
Research Across Five Continents, International Journal of Service Industry
Management, 18(5), 472-490
Caruana, A. (2002), Service Loyalty. The Effects of Service Quality and The
Mediating Role of Customer Satisfaction, European Journal of Marketing, 36
(7/8). 811-828
Chen, T.Y., Chang, P.L. and Chang, H..S. (2005), Price, Brand Cues and
Banking Customer Value, International Journal of Bank Marketing, 23(3), 273-
291
Cronin, J.J., Brady, M.K. and Hult, G.T. M. (2000), Assessing the Effects of
Quality, Value and Customer Satisfaction on Consumer Behavioural Intentions
in Service Environments, Journal of Retailing, 76 (2), 193-218
Converse, J.M. and Presser, S. (1986), Survey Questions: Handcrafting the
Standardised Questionnaire, Newbury Park, Sage Publications
Cronin, J.J. Jr and Taylor, S.A. (1992), Measuring Service Quality: A Re-
Examination and Extension, Journal of Marketing, 56(3), 55-68
181
Cui, C.C, Lewis, B.R. and Park, W. (2003), Service Quality Measurement in The
Banking Sector in South Korea, International Journal of Bank Marketing, 21(4),
191-201
Curry, A. and Sinclair, E. (2002), Assessing the Quality of Physiotherapy
Services Using SERVQUAL, International Journal of Health Care Quality
Assurance, 15(5), 197-205
Czinkota, M. R. Kotabe, M. And Mercer, D. (1997), Marketing Management,
Massachusetts, Blackwell Publishers Ltd
Dadzie, K. Q., Winston, E. and Afriyie, K. (2003), The Effects of Normative
Social Belief Systems and Customer Satisfaction on Rural Savings Programs in
Ghana, Management Decision, 41(3), 233-240
Dale B. and Bunney, H. (1999), Total Quality Management Blueprint, Oxford,
Blackwell
Publishers Ltd
Dash, S. Bruning, E. and Acharya, M. (2009), The Effect of Power Distance and
Individualism on Service Quality Expectations in Banking. A Two-Country
Individual- and National- Cultural Comparison, International Journal of Bank
Marketing, 27(5), 336-358
Davis, J. J. (1997), Advertising Research Theory and Practice, New Jersey,
Prentice Hall Inc
Day, R., Grabickle, K., Schaetzle, T. and Staubauch, F. (1981), The Hidden
Agenda of Consumer Complaining, Journal of Retailing, 57 (3), 86-106
Delgado, J., Salas, V. and Saurina, J. (2006), The Joint Size and Ownership
Specialisation in Banks’ Lending, Banco de España Working Paper No. 0606
182
DeRuyter, K., Bloemer, J. and Peeters, P. (1997), Merging Service Quality and
Service Satisfaction An Empirical Test of An Integrative Model, Journal of
Economic Psychology, 18 (4), 387-406
Dimitriades, Z.S and Maroudas, T.S. (2007), Demographic Predictors of Service
Satisfaction in Greek public organizations, Journal of Measuring Business
Excellence 11(2), 32-43
Donnelly, M., Wisniewski, M. Dalrymple, J.F. and Curry, A.C. (1995), Measuring
Service Quality in Local Government: the SERVQUAL Approach, International
Journal of Public Sector Management, 8(7), 15-20.
Donnelly, M., Kerr, N. J., Rimmer, R. and Shiu, E. (2006), Assessing the quality
of police services using SERVQUAL, Policing: An International Journal of Police
Strategies and Management, 29 (1), 92-105
Duncan, E. and Elliot, G. (2004), Efficiency, Customer Service and Financial
Performance Among Australian Financial Institutions, The International Journal
of Bank Marketing, 22(5), 319-342
Edvardsson, B. (1998), Service Quality improvement, Managing Service Quality
8 (2), 142-149
Ehigie, B.O. (2006), Correlates of Customer Loyalty to Their Bank: A Case
Study in Nigeria, International Journal of Bank Marketing, 24(7), 494-508
Engel, J.F., Blackwell and Miniard, P.W., (1993), Consumer Behaviour,
Orlando, The Dryden Press
Engelland, B.T., Workman, L. and Singh, M. (2000), Ensuring Service Quality
for Campus Career Services Centers: A Modified SERVQUAL Scale, Journal of
Marketing Education, 22(3), 236-245
Ennew, C.T. and Binks, M.R. (1996), Good and Bad Customers: the Benefits of
183
Participating in The Banking Relationship, International Journal of Bank
Marketing 14(2), 5-13
European Institute of Public Administration (2008), European Primer on
Customer Satisfaction Management
Fecikova, I. (2004), An Index Method for Measurement of Customer
Satisfaction, TMQ Magazine, 16(1), 57-66
Fornell, Claes (2007), The Satisfied Customer: Winners and Losers in the Battle
for Buyer Preference, New York, Palgrave-McMillan
Fox, M.J. (1993), Quality Assurance Management, London, Chapman and Hall
Frei, F. X., Harper, P.T. and Hunter, L.W. (1998), Innovation in Retail Banking,
Working Paper, The Wharton Financial Institutions Centre
Gallego, S., Herrero, G. A. and Saurina, J. (2002), The Asian and European
Banking System: The Case of Spain in the Quest for Development Stability,
Banco de España Working Paper No. 0217
Galloway, R.L & Blanchard, R.F. (1996), Variation in The Perception of Quality
With Lifestage in Retail Banking, International Journal of Bank Marketing 14 (1),
22 - 29
Ghana Statistical Service (2000), 2000 Population and Housing Census
Gilbert, G.R.and Veloutsou, C. (2006) A Cross-Industry Comparison of
Customer Satisfaction, Journal of Services Marketing 20(5), 298-308
Gilmore, A. and McMullan, R. (2009), Scales in Services Marketing Research: A
Critique and Way Forward, European Journal of Marketing, 43(5/6), 640-651
Gounaris, S.P. Stathakopoulos V. and Athanassopoulos A. D. (2003),
Antecedents to Perceived Service Quality: An Exploratory Study in the Banking
Industry, International Journal of Bank Marketing, 21(4), 168-190
184
Guo, X and Duff, A. Hair, M. (2008), Service Quality Measurement in the
Chinese Corporate Banking Market, International Journal of Bank Marketing,
26(5), 305-327
Hansson, D. and Arnetz, B.B. (2005), Validation and Findings Comparing VAS
vs. Likert Scales for Psychosocial Measurements, International Electronic
Journal of Health Education 8, 178-192
Hartl, J. (2006),The Changing Consumer: Demanding but Predictable,
International Food and Agribusiness Management Review 9(2), 88-93
Hauser, J.R. and Urban, G. (1986), The Value Priority Hypothesis for Consumer
Budget Plans, Journal of Consumer Research, 12 (4), 446-462.
He, Y. and Song, H. (2009), A Mediation Model of Tourists’ Repurchase
Intentions for Packaged Tour Services, Journal of Travel Research, 47(3), 317-
31
Heffernan, S. (1996), Modern Banking in Theory and Practice, West Sussex,
John Willey and Sons
Herington, C. And Weaven, S. (2007), Can Banks Improve Customer
Relationships With High Quality Online Services? Managing Service Quality,
17(4), 404-427
Hernando, I. and Pages, J.M. (2001), Is There a Bank Lending Channel of
Monetary Policy in Spain? Banco de España Working Paper No. 0117
Huang, M.H. (2008), The Influence of Selling Behaviors on Customer
Relationships in Financial Services, International Journal of Service Industry
Management, 19 (49), 458-473
185
Huppertz, J.W. (2003), An Effort Model of First-Stage Complaining Behavior,
Journal of Consumer Satisfaction, Dissatisfaction and Complaining Behavior,
16, 132-44
Ibrahim, E.E., Joseph, M. and Ibeh, K.I.N. (2006), Customers’ perception of
electronic service delivery in the UK retail banking sector, International Journal
of Bank Marketing, 24(7), 475-493
Imrie, B.C. Cadonga, J.W and McNaughton, R. (2002), The Service Quality
Construct on A Global Stage, Managing Service Quality, 12(1), 10-18
Instituto Nacional Estadistica, España, (2008), Municipal Register: Official
Population Figures Since 1996
IPSOS INRA (2007), Consumer Satisfaction Survey Final Report for the
European Commission Health and Consumer Protection Directorate-General
ISSER (2008), State of Competition Regime in Ghana, Preliminary Country
Paper
ISO 10002 (2004) Quality management — Customer Satisfaction — Guidelines
for Complaints Handling in Organizations
ISO 9000 (2005), Quality Management Systems- Fundamentals and
Vocabulary
Iwaarden, J. V. and Ton Wiele, F. V. D (2003), Applying SERVQUAL to Web
Sites: An Exploratory Study, International Journal of Quality and Reliability
Management, 20(8), 919-935
Jabnoun, N. and Al-Tamimi, H.A.H. (2003), Measuring Perceived Service
Quality at UAE Commercial Banks, International Journal of Quality and
Reliability Management, 20(4), 458-472
186
Jabnoun, N. and Khalifa, A. (2005), A Customised Measure of Service Quality
in the UAE, Managing Service Quality, 15 (4), 374-388
Jamal, A. and Anastasiadou, K . (2009), Investigating the Effects of Service
Quality Dimensions and Expertise on Loyalty, European Journal of Marketing
43(3/4) 398-420
Jamal, A. and Nazer, K. (2002), Customer Satisfaction and Retail Banking, An
Assessment of Some of the Key Antecedents of Customer Satisfaction in Retail
Banking, International Journal of Bank Marketing, 20(4), 146-160
Jamali, D. (2007), A study of customer Satisfaction in the Context of a Public
Private Partnership, International Journal of Quality and Reliability Management
24 (4), 370-385
Jimenez, J., Salas-Fuma, V. and Saurina, J. (2008), Organisational Distance
and Use of Collateral for Business Loans, Banco de España Working Paper No.
0816
Johns, R. And Perrott, B. (2008), The Impact of Internet Banking on Business-
Customer Relationships (Are You Being Self-Service), International Journal of
Bank Marketing, 25(7), 465-482
Johnson, D.S. (2007), Achieving Customer Value from Electronic Channels
Through Identity Commitment, Calculative Commitment and Trust in
Technology, Journal of Interactive Marketing, 21(4), 2-22
Johnston, R. (1995), The Determinants of Service Quality: Satisfiers and
Dissatisfiers, International Journal of Service Industry Management, 6(5), 53-71
Jones, H. and Farquhar, J.D. (2007), Putting it Right: Service Failure and
Customer Loyalty in U.K Banks, International Journal of Bank Marketing, 25(3),
161-172
187
Jones, T.O. and Sasser, W.E Jr. (1995), Why Satisfied Customers Defect,
Harvard Business Review, 73 (6), 88-99
Joseph, M. McClure, C. and Joseph, B. (1999), Service Quality in the Banking
Sector: The Impact of Technology on Service Delivery, International Journal of
Bank Marketing, 17(4), 182-91
Jun, M. and Cai, S. (2001), The Key Determinants of Internet Banking Service
Quality: A Content Analysis, International Journal of Bank Marketing, 19 (7),
276- 291
Kang, G.D and Jeffrey James, J. (2004), Service Quality Dimensions: An
Examination of Gronroos’s Service Quality Model, Managing Service Quality
14 (4), 266–277.
Kangis, P. and Passa, V. (1997), Awareness of Service Charges and Its
Influence on customer Expectations and Perceptions of Quality in Banking,
Journal of Services Marketing, 11(2), 105 -17
Kangis, P. and Voukelatos, V. (1997), Private and Public Banks: A Comparison
of Customer Expectations and Perceptions, International Journal of Bank
Marketing 15(7), 279-287
Khattak, N.A. and Rehman, K.U. (2010), Customer Satisfaction and Awareness
of Islamic Banking System in Pakistan, African Journal of Business
Management 4(5), 662-671
Kim, J.K., Forseythe, S., Gu, Q. and Moon, J.S. (2002), Cross-Cultural
Consumer Values, Needs and Purchase Behavior, Journal of Consumer
Marketing, 19 (6), 481-501
188
Koksal, M.H. (2007), Consumer Behaviour and Preferences Regarding
Children’s Clothing in Turkey, Journal of Fashion Marketing and Management,
11(1), 69-81
Kotler, P. (2003), 11th ed., Marketing Management, New Jersey, Pearson
Education
Kotler, P. (1991), 7th ed. Marketing Management: Analysis, Planning,
Implementation and Control, Prentice-Hall, Englewood Cliffs, NJ,
Kotler, P., Amrstrong, G. Saunders, J. And Wong, V. (1999), 2nd European ed.,
Principles of Marketing, Prentice Hall Inc.
Kumar, M., Kee, F.T. and Manshor, A.T. (2009), Determining the Relative
Importance of Critical Factors in Delivering Service Quality of Banks. An
Application of Dominance Analysis SERVQUAL Model, Managing Service
Quality, 19 (2), 211-228
Ladhari, R. A (2009), Review of Twenty Years of SERVQUAL Research,
International Journal of Quality and Service Sciences, 1(2), 172-198
Lam, S.S.K. (1997), SERVQUAL: A Tool for Measuring Patients Opinions of
Hospital Service Quality in Hong Kong, Total Quality Management, 8(4), 145-
52.
Lam, S.Y., Shankar, V., Erramilli, K.M. and Murthy, B. (2004), Customer Value,
Satisfaction, Loyalty, and Switching Costs: An Illustration From A Business-to-
Business Service Context, Journal of the Academy of Marketing Science, 32
(3), 293-311.
Lasser, W.M., Manolis, C. and Winsor, R.D. (2000), Service Quality
Perspectives and Satisfaction in Private Banking, Journal of Services
Marketing, 14 (3), 244 - 271.
189
Lee, M. C. and Hwan, I.S. (2005), Relationships among Service Quality,
Customer Satisfaction and Profitability in the Taiwanese Banking Industry,
International Journal of Management, 22(4), 635-648
Lee, Y. P. and Chen, C.Y (2009), Banking Service Quality in Vietnam: A
Comparison of Customers’ and Bank Staff’s Perceptions, The Journal of
International Management Studies, 4(2), 140-146
Lerman, D. (2006), Consumer Politeness and Complaining Behavior, Journal of
Services Marketing 20(2), 92–100
Lewis, B. R., Orledge, J. and Mitchell, V. W. (1994), Service Quality: Students’
Assessment of Banks and Building Societies, International Journal of Bank
Marketing, 12(4), 3-12
Levesque, T. and McDougal, G.H.G. (1996), Determinants of Customer
Satisfaction in Retail Banking, International Journal of Bank Marketing
14(7), 12–20
Liang, C.H. and Wang, W.H. (2007), An Insight Into the Impact of Retailer’s
Relationship Efforts on Customers’ Attitudes and Behavioural Intentions,
International Journal of Bank Marketing 25(5), 336-366
Lloyd-Walker,B. and Cheung, Y. P. (1998) IT to Support Service Quality
Excellence in the Australian Banking Industry, Managing Service Quality
8( 5), 350-358
Lopez, J., Hart, K.L. and Rampersad, A. (2007), Ethnicity and Customer
Satisfaction in the Financial Services Sector, Managing Service Quality, 17(3),
259-274
Malhotra, N.K. (1996), 2nd ed. Marketing Research: An Applied Orientation, New
Jersey, Prince-Hall International, Inc.
190
Malhotra, N.K. and Birks, D.F. (1999), European Ed. Marketing Research: An
Applied Approach, Essex, Prentice Hall
Mathur, A., Moschis, G.P. and Lee, E. (1999), Stress and Consumer Behavior
Coping Strategies of Older Adults, Journal of Marketing Practice: Applied
Marketing Science, 5 (6/7/8), 233-247
Matzler, K., Wurtele, A. and Renzl, B. (2006), Dimensions of Price and
Satisfaction: A study in The Retail Banking Industry, International Journal of
Bank Marketing, 24(4), 216-231
McDougall, G.H.G and Levesque, T.J. (1994), Benefit Segmentation Using
Service Quality Dimensions: An Investigation in Retail Banking, International
Journal of Bank Marketing, 12(2), 15-23
Mels, G., Boshoff, C. and Nel, D. (1997), The Dimensions of Service Quality:
the Original European Perspective Revisited, The Service Industries Journal,
17(1), 173-89
Metawa, S.A. and Almossawi, M. (1998), Banking Behavior of Islamic Bank
Customers: Perspectives and Implications, International Journal of Bank
Marketing 16(7), 299-313
Mukjerjee, A. and Nath, P. (2005), An Empirical Assessment of Comparative
Approaches to Service Quality, Journal of Services Marketing, 19(3), 174–184
Munn, G.G. Garcia, F.L. and Woelfel, C.J. (1991), 9th ed. Encyclopedia of
Banking and Finance, Illinois, Bankers Publishing Company
Newman, K. (2001), Interrogating SERVQUAL: A Critical Assessment of
Service Quality Measurement in a High Street Retail Bank, International Journal
of Bank Marketing, 19 (3), 126-39
191
Newman, K. and Cowling, A. (1996), Service Quality in Retail Banking: The
Experience of Two British Clearing Banks, International Journal of Bank
Marketing, 14 (6), 3-11
Newman, K. Cowling, A. and Leigh, S. (1998), Case Study: Service Quality,
Business Process Re-Engineering and Human Resources: A Case in Point?
International Journal of bank Marketing, 16(6), 225-242
Nguyen, N. and LeBlanc, G.(1998), The Mediating Role of Corporate Image On
Customers’ Retention Decisions: An Investigation in Financial Services,
International Journal of Bank Marketing 16(2), 52-65
Olatokun, W.M. and Igbinedion, L.J. (2009), The Adoption of Automatic Teller
Machines in Nigeria: An Application of the Theory of Diffusion of Innovation,
The Journal of Issues in Informing Science and Information Technology 6, 373-
393
Oliva, T.A., Oliver, R.L. and MacMillan, I.C. (1992), A Catastrophe Model for
Developing Service Satisfaction Strategies, Journal of Marketing, 56 (3), 83-95
Oliver, R. (1997), Satisfaction: A Behavioral Perspective on the Consumer.
New York: McGraw–Hill.
Owusu-Frimpong (1999), Patronage Behaviour of Ghanaian Bank Customers,
International Journal of Bank Marketing, 17(1), 335-341
Parasuraman, A. (2004), Assessing and Improving Service Performance for
Maximum Impact: Insights from a Two-Decade-Long Research Journey,
Performance Measurement and Metrics 5(2), 45-52
Parasuraman, A, Berry, L.L. and Zeithaml, V.A. (1991), Understanding
Customer Expectations of Service, Sloan Management Review, 32(3), 39-48
192
Parasuraman, A., Zeithaml, V.A. and Berry, L.L. (1994), Reassessment of
Expectations as A Comparison Standard in Measuring Service Quality:
Implications for Future Research, Journal of Marketing, 58 (1), 111-124.
Parasuraman, A., Zeithaml, V.A. and Berry, L.L. (1988), SERVQUAL: A Multi-
Item Scale For Measuring Consumer Perception of Service Quality, Journal of
Retailing, 64(1), 12-40
Parasuraman, A., Zeithaml, V. A. and Berry, L. L. (1985), A Conceptual Model
of Service Quality and Its implications for Future Research. Journal of
Marketing, 49 (4), 41-50.
Park, C.H. and Kim, Y.G. (2003), Indentifying Key Factors Affecting Consumer
Purchasing Behaviour in an Online Shopping Context, International Journal of
Retail and Distribution Management, 31(1), 16-29
Peters, V.J. (1999), Total Service Quality Management, Managing Service
Quality 29 (1), 6–12
Petrick, J.F. and Backman, S.J. (2002). An Examination of the Construct
of Perceived Value for the Prediction of Golf Travelers’ Intentions to Revisit,
Journal of Travel Research, 41 (1), 38-45.
Petridou, E., Spathis, C., Glaveli, N.and Liassides, C. (2007), Bank Service
Quality: Empirical Evidence from Greek and Bulgarian Retail customers,
International Journal of Quality & Reliability Management, 24(6), 568-585
Poolthong, Y. and Mandhachitara, R. (2009), Customer Expectations of CSR,
Perceived Service Quality and Brand Effect in Thai Retail Banking, International
Journal of Bank Marketing, 27(6), 408-427
193
Powpaka S. (1996), The Role of Outcome Quality as a Determinant of Overall
Service Quality in Different Categories of Services Industries: An Empirical
Investigation, Journal Services Marketing, 10(6), 5-25.
Rashid, M. and Hassan, M.K. (2009), Customer Demographics Affecting Bank
Selection Criteria, Preference, and Market Segmentation: Study on Domestic
Islamic Banks in Bangladesh, International Journal of Business and
Management, 4(6), 131-146
Ravichandran, K., Mani, B.T., Kumar, S.A. and Prabhakaran, S. (2010),
Influence of Service Quality on Customer Satisfaction, Application of
SERVQUAL Model, International Journal of Business and Management, 5(4),
117-124
Reichheld, F.F. (1993), Loyalty-Based Management, Harvard Business Review,
71(2), 64-73
Reidenbach, R.E. (1995). Value-Driven Bank: Strategies for Total Market
Satisfaction, Burr Ridge, Irwin Professional Publishing
Robinson, S. (1999), Measuring Service Quality: Current Thinking and Future
Requirements, Marketing Intelligence and Planning, 17(1), 21-32.
Roldán, J.M. (2010), The Spanish Banking Sector: Outlook and Perspectives
Rose, P.S. ( 1993), 2nd ed. Commercial Bank Management, Boston, Irwin.
Rullis, H. and Sloka, B. (2010), Marketing Within Internet Banking in Latvia:
Possibilities and Challenges in Commercial Banks, Economic Management 15
Rust, R. and Zahorik, A. (1993), Customer Satisfaction, Customer Retention
and Market Share, Journal of Retailing, 69 (2), 193-215
Saurina Carnals, C. (1997), Measuring Quality in the Service Sector, PhD
Thesis, University of Girona
194
Saurina, C. and Coenders, G. (2002), Predicting Overall Service Quality: A
Structural Equation Modelling Approach, in Ferligoj, A. and Vrar, A. (Eds),
Developments in Social Science Methodology, FDV, Ljubljana, 18, 217-38
Schneider, B. (1980), The Service Organisation: Climate is Crucial,
Organisational Dynamics, 9 (2), 52-65
Schneider, B. and Bowen, D.E. (1985), Employee and Customer Perceptions of
Service in Banks: Replication and Extension, Journal of Applied Psychology, 70
(3), 423-433.
Schewe, C.D. and Hiam, A.W. (1998), 2nd edition, The Portable MBA in
Marketing, New York, John Wiley and Sons, Inc.
Siu, N.Y.M and Mou, J.C.W (2005), Measuring Service Quality in Internet
Banking: The Case of Hong Kong, Journal of International Consumer
Marketing, 17(4), 99 – 116
Sit, W.Y., Ooi, K.B., Lin, B. and Chong, A.Y.L. (2009), TQM and Customer
Satisfaction in Malaysia’s Service Sector, Industrial Management and Data
Systems, 109 (7), 957-75.
Smith, G.T. (2009), Why Do Different Individuals Progress Along Different Life
Trajectories? Perspective on Psychological Science Journal 4(4), 415-421
Snee, H.R., Goode, M.M.H. and Moutinho, L.A. (2000), Predicting Customer
Satisfaction from ATMs: A Cross Country Study, Journal of Professional
Services Marketing, 20(2), 133 - 149
Solomon, M., Bamossy, G., and Askegaard, S. (1999), Consumer Behaviour: A
European Perspective, New Jersey, Prentice Hall Inc.
Spathis, C., Petridou, E. and Glaveli, N. (2004), Managing Service Quality in
Banks: Customers’ Gender Effects, Managing Service Quality, 14(1), 90-102.
195
Stafford, M.R. (1996), Demographic Discriminators of Service Quality in the
Banking Industry, Journal of Services Marketing, 10 (4), 6-22.
Strategic Direction (2007), The Retail Banking Industry in 2015: Trends and
Strategies to Focus on and Develop, Strategic Direction, 23(6), 32-34
Tahir, I.M. and Bakar, N.M.A. (2007), Service Quality Gap and Customer’s
Satisfaction of Commercial Banks in Malaysia, International Review of Business
Research Papers, 3(4), 327-336
Tam, J.L. M. (2000), The Effects of Service Quality, Perceived Value
and Customer Satisfaction on Behavioral Intentions, Journal of Hospitality
and Leisure Marketing, 6 (4), 31-43
Tan, K.C and Pawitra, T.A. (2001), Integrating SERVQUAL and Kano’s Model
Into QFD for Service Excellent Development, Managing Service Quality, 11(6),
418-430
Ting, D.H (2006), Further Probing of Higher Order in Satisfaction Construct
The Case of Banking Institutions in Malaysia, International Journal of Bank
Marketing, 24( 2), 98-111
Ting, D. H. (2004), Service Quality and Satisfaction Perceptions: Curvilinear
and Interaction Effect, The International Journal of Bank Marketing, 22(6), 407-
420
Titko, J. and Lace, N. (2010), Customer Satisfaction and Loyalty in Latvian
Retail Banking, Economics and Management, 15, 1031-1038
Veloutsou, C., Gilbert, G.R. and Moutinho, L.A (2005), Measuring Transaction-
Specific Satisfaction in Services: Are The Measures Transferable Across
Cultures? European Journal of Marketing 39 (5/6), 606-628
196
Wang, T. and Ji P. (2010), Understanding Customer Needs Through
Quantitative Analysis of Kano’s Model, International Journal of Quality and
Reliability Management, 27(2), 173-184
Wang, Y., Lo, H.P. and Hui, Y.V. (2003), The Antecedents of Service Quality
and Product Quality and their Influences on Bank reputation: Evidence from
Banking Industry in China, Managing Service Quality, 13(1), 72-83
Westbrook, R.A. and Oliver, R.L. (1991), The Dimensionality of Consumption
Emotion Patterns and Customer Satisfaction, Journal of Consumer Research,
18(1), 84-91
Wilson, D.F. (2000), Why Divide Consumer and Organizational Buyer
Behaviour? European Journal of Marketing, 34(7), 780-796
Wilson, R. M. S. Gilligan, C. and Pearson, D. (1992), Strategic Marketing
Management, Oxford, Butterworth Heinemann
Wisniewski, W. (2001) Using SERVQUAL to Assess Customer Satisfaction with
Public Sector Services, Managing Service Quality, 11(6), 380-388
Wong, D.H, Rexha, N. and Phau, I. (2008), Re-Examining Traditional Service
Quality in an E-Banking Era, International Journal of Bank Marketing, 26 (7),
526-545
Woodruff, R.B. (1997), Customer Value: the Next Source for Competitive
Advantage, Journal of the Academy of Marketing Science, 25(2), 139-153.
World Bank (2004), Micro and Rural Finance in Ghana: Evolving Industry and
Approaches to Regulation, Findings 234
Yap, K.B and Sweeney, J.C (2007), Zone-Of-Tolerance Moderates The Service
Quality-Outcome Relationship, Journal of Services Marketing 21(2), 137-148
197
Yap, K.B and Wong, D.H, Loh, C and Bak, R. (2010), Offline and Online
Banking-Where to Draw The Line When Building Trust in E-Banking?
International Journal of Bank Marketing, 28(1), 27-46
Yavas, U. Bilgin, Z. and Shemwell, D.J. (1997), Service Quality in the Banking
Sector in An Emerging Economy: A Customer Survey, International Journal of
Bank Marketing, 5(6), 217-223
Yavas, U. and Benkenstein, M. (2007), Service Quality Assessment: A
Comparison of Turkish and & German Bank Customers, Cross Cultural
Management: An International Journal, 14 (2), 161-168
Yeung, M., Ging, L. and Ennew, C. (2002), Customer Satisfaction and
Profitability: a Reappraisal of the Nature of the Relationship, Journal of
Targeting, Measurement and Analysis for Marketing, 11(1), 24-33
Zeithmal, V.A. (1988), Consumer Perceptions of Price, Quality and Value: A
Means-End Model and Synthesis of Evidence, Journal of Marketing 52(3), 2-22
Zeithaml, V.A., Berry, L.L. and Parasuraman, A. (1996), The Behavioral
Consequences of Service Quality, Journal of Marketing, 60(4), 31-46
Zeithaml, V.A., Berry, L.L. and Parasuraman, A. (1993), The Nature and
Determinants of Customer Expectations of Services, Journal of Academy of
Marketing Science, 21(1), 1-12
Zhou, L. (2004), A Dimension-Specific Analysis of Performance Only
Measurement of Service Quality and Satisfaction in China’s Retail Banking,
Journal of Services Marketing, 18(7), 534-546
Zhu, F.X., Wymer, W. and Chen, I, (2002), IT-Based Services & Service Quality
in Consumer Banking, International Journal of Service Industry Management,
13 (1), 69-90
198
Other References
GhanaDistricts.com, A Repository of all Districts in the Republic of Ghana,
Viewd 10th September, 2009, http://www.ghanadistricts.com/home/
Wikipedia, the Free Encyclopedia Ghana, Viewed 2nd October, 2009
http://en.wikipedia.org/wiki/Ghana,
Wikipedia, the Free Encyclopedia, Spain, Viewed 6th October, 2009
http://en.wikipedia.org/wiki/Spain
Wikipedia, the Free Encyclopedia, Barcelona, Viewed 6th October, 2009,
http://en.wikipedia.org/wiki/Barcelona
Wikipedia, the Free Encyclopedia, Girona, Viewed 11th October, 2009,
http://en.wikipedia.org/wiki/Girona
199
APPENDIX A
Definition of Communities
Community
A group of people living in a city, town or village
Urban
A community with a population of 5000 or more (Ghana Statistical Service,
2000)
A community with a population of 10,000 or more (Instituto EStadistica National,
España, 2001)
Semi-Urban
A community with a population of more than 1500 and less than 5000, Ghana
Statistical Institute, 2000)
A community with a population of more than 2000 and less 10,000 (Instituto
Estadistica National, España, 2001)
Rural
A community with a population 1500 or less (Ghana Statistical Service, 2000)
A community with a population of 2000 or less Instituto Estadistica National,
España, 2001)
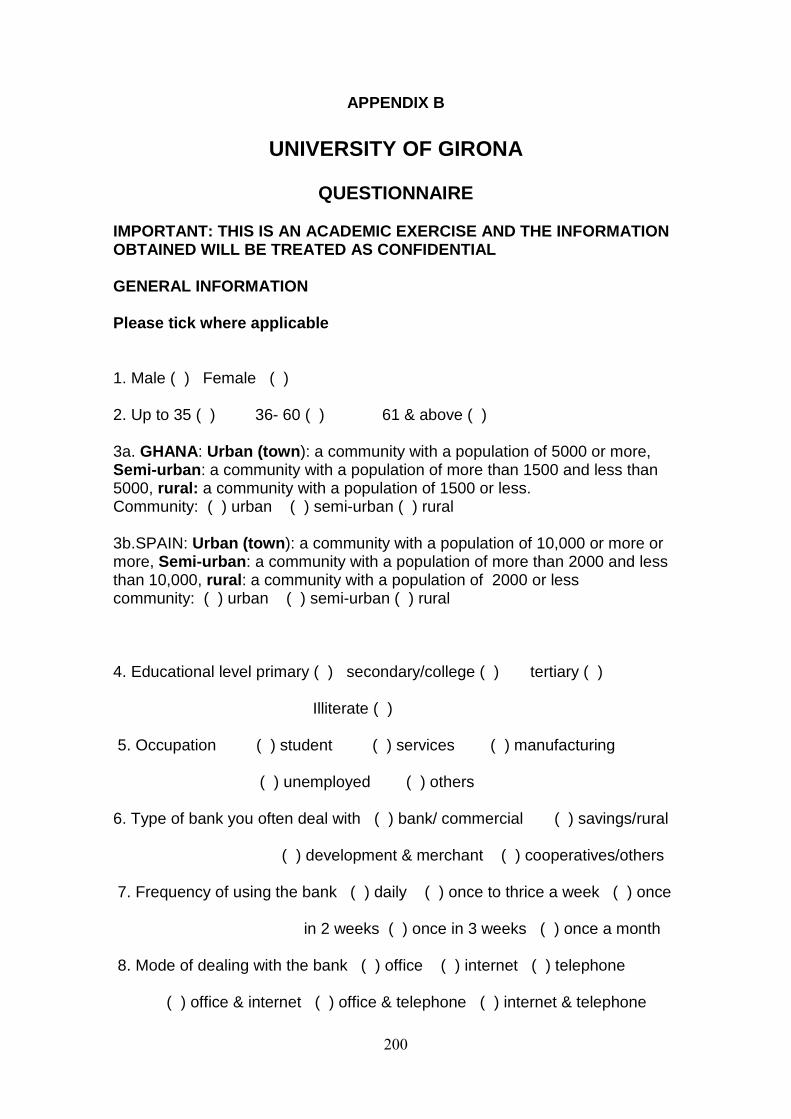
200
APPENDIX B
UNIVERSITY OF GIRONA
QUESTIONNAIRE IMPORTANT: THIS IS AN ACADEMIC EXERCISE AND THE INF ORMATION OBTAINED WILL BE TREATED AS CONFIDENTIAL GENERAL INFORMATION Please tick where applicable 1. Male ( ) Female ( ) 2. Up to 35 ( ) 36- 60 ( ) 61 & above ( ) 3a. GHANA : Urban (town ): a community with a population of 5000 or more, Semi-urban : a community with a population of more than 1500 and less than 5000, rural: a community with a population of 1500 or less. Community: ( ) urban ( ) semi-urban ( ) rural 3b.SPAIN: Urban (town ): a community with a population of 10,000 or more or more, Semi-urban : a community with a population of more than 2000 and less than 10,000, rural : a community with a population of 2000 or less community: ( ) urban ( ) semi-urban ( ) rural 4. Educational level primary ( ) secondary/college ( ) tertiary ( ) Illiterate ( ) 5. Occupation ( ) student ( ) services ( ) manufacturing ( ) unemployed ( ) others 6. Type of bank you often deal with ( ) bank/ commercial ( ) savings/rural ( ) development & merchant ( ) cooperatives/others 7. Frequency of using the bank ( ) daily ( ) once to thrice a week ( ) once in 2 weeks ( ) once in 3 weeks ( ) once a month 8. Mode of dealing with the bank ( ) office ( ) internet ( ) telephone ( ) office & internet ( ) office & telephone ( ) internet & telephone

201
( ) office, internet & telephone CUSTOMER SATISFACTION Please rank your views using the scale 1- 7 on whether you are satisfied or not with the services provided by the bank you deal with often and the general environment under which it operates Scale: 7=Very satisfied 6=satisfied 5 =Somehow satisfied 4=Indifferent 3= Somehow dissatisfied 2=Dissatisfied 1=Very dissatisfied
Scale
Very Dissatisfied Very Satis fied
Items
1
2
3
4
5
6
7
Banks fulfils its promises at the time indicated
Bank’s staff have the knowledge to answer all my questions
Distance to the office (premises) of the bank
Materials associated with the service like pamphlets, statements are virtually appealing at the bank
Bank’s performs the services exactly at the first time
Bank has my interest at heart
Banks gives me individual attention
Bank has modern equipment & tools
Bank’s staff give you prompt service
Bank operating hours convenient to me
Bank show a keen interest in solving your problems
Bank’s staff behaviour instils confidence in me
Bank’s physical facilities virtually nice

202
I feel safe in my transactions with the bank
Bank’s staff are courteous with me
Bank’s staff tell you exactly the time the service will be performed
Bank’s employees are neatly appealing
Bank’s staff always willing to assist you
Bank insists on error free records
Bank’s staff understand my specific needs
Bank staff are not too busy to respond to my requestion
Overall satisfaction with your bank
COMMENTS OR ADDITIONAL INFORMATION Please use the space below for any comment or addit ional information ………………………………………………………………………………………………………………………………………………………………………………………………………………………………………………………………………………………………………………………………………………………………………………………………………………………………………………………………………………………………………………………………………………………………………………………………………………………………………………………………………………………………………………………………………………………………………………………………………………………………………………………………………………………………………………………………………………………………………………………………………………………………………………………………… Please include your postal or e-mail address if you want to receive the results of the study………………………………………………………………… .........................................................................................................................................................................................................................................................................................................................................................................................,,,

203
APPENDIX C
Number of Buildings/Houses in Zones
Table A.1. Number of Buildings/Houses in Zones Community Zone Buildings/
Houses Zone Buildings/
Houses Girona Can Gilbert de Pla 148 Fontajau 234
Torroella de
Mongri
Sobrestany 775 Barri Vell 775
Barcelona Pedrabels 759 Navas 856
Abrera Ca n’Amat 440 Sant Miquel 440
Bantama Abrepo Junction 314 Market 314
Suame Kropo 241 Roman 241
Bekwai Nampasa 187 Zongo 187
Poano North 135 East 135
Llagostera Selva Brava 337 Núcleo Urban 337
Besalú Grup Del Mont 109 Sector 2 109
Cabrera de Mar Les Senies 273 Pla de l’Avelia 273
Sant Esteve
Sesrovires
Vallserrat 272 Masia Bach 272
Appeadu North 113 South 113
Mpatase Police Depot 123 Telecom Area 123
Esumaja Atifi 92 Anaafo 92
Kokofu North 107 East 107
Portbou La Riera 75 Centre Poble 75
St. Feliu de
Pllerols
Pla de Bastons 98 Cases Noves 98
Figaró Montmany Barri de l’Estacio 103 Barri de Dalt 103
Ullastrell Sardia 93 Cal Jep 93
Twumduasi Apue 68 Atoe 68
Anyinam Esoro 79 Efam 79
Asamang East 57 North 57
Amoaful North 48 South 48

204
APPENDIX D
Determination of Sample Size of Buildings/Houses
Since the population was not evenly divisible and to ensure each building/house
was given the chance to be selected, a non-integer was chosen at random as
the interval for all the cases. Each non-integer selected was rounded up to the
next integer.
N/n =k
N= population size
n=sample size
K= the sample interval
Can Gilbert de Pla
148/31 = 4.77
Random starting point was between 0 – 4.8. 3.8 was selected and rounded up
to 4.
Therefore the sample intervals were: 4, 8, 12, 16, 20, 24, 28………124.
Fontajau
234/32 =7.31
Starting point was between 0 –7.3, 4.3 was chosen and rounded up to 5.
Therefore the intervals were: 5, 10, 15, 20, 25, 30, 35….160
Sobrestany
775/31=25
Random starting point was between 0-25. 10 was selected
Therefore the intervals were: 10, 35, 60, 85, 110, 135…..760

205
Barri Vell
775/31=25
Random starting point was between 0 - 25. 2 was picked
Therefore the intervals were, 2, 27,52, 77, 102, 127, 152….752
Pedrabels
759/62=12.24
Random starting point was between 0 -12.2. 7.2 was chosen and rounded up
to 8
Therefore the intervals were: 8, 20, 32, 44, 56, 68, 90….750
Navas
856/63=13.58
Random starting point was between 0 – 13.6. 4.6 was picked and rounded up to
5
Therefore the intervals were: 5, 18, 31, 44, 57, 70, 83, 96, 109, 122…..811
Ca N’Amat
440/62= 7.09
Random starting point was between 0 – 7.09. 2.09 was selected and rounded
up to 3.
Therefore the intervals were: 3, 10, 17, 24, 31, 38, 45, 52, 59, 66, 73….437
Sant Miquel
440/63=6.98
Random starting point was between 0 – 6.9. 1.9 was chosen and rounded up to
2.
Therefore, the intervals were between 2, 8, 14, 20, 26, 32, 38, 44, 50, 56…..382
Aprepo Junction
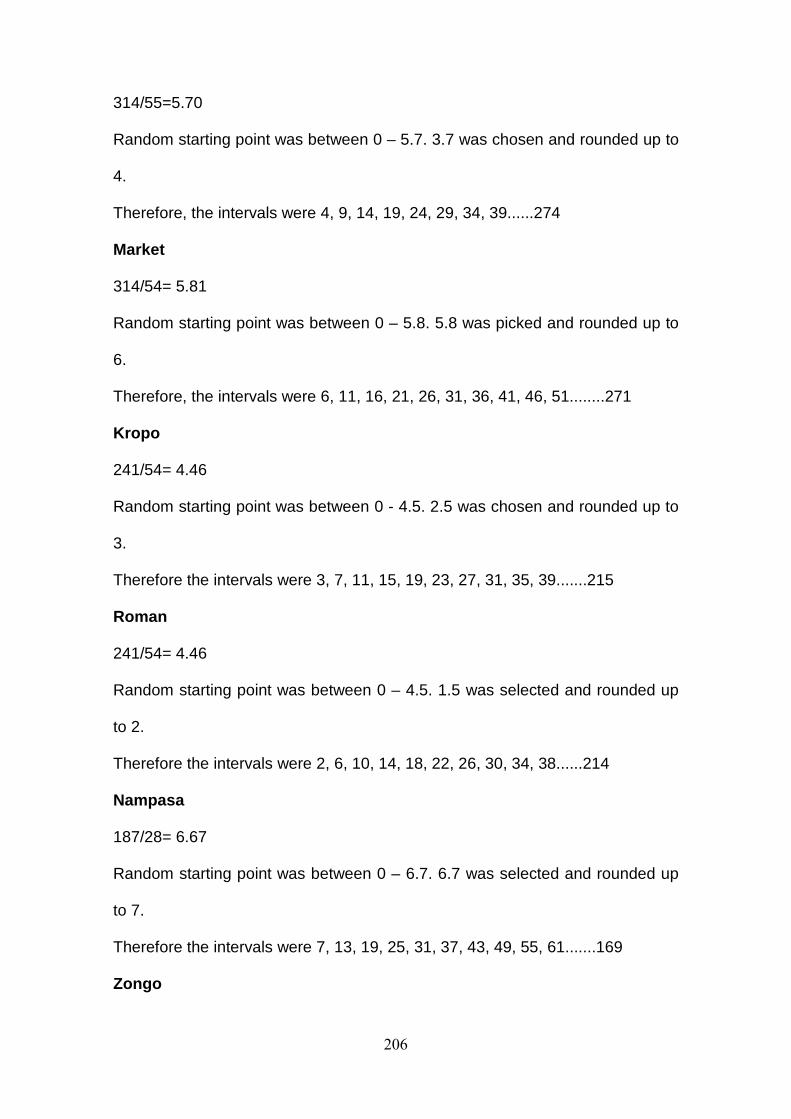
206
314/55=5.70
Random starting point was between 0 – 5.7. 3.7 was chosen and rounded up to
4.
Therefore, the intervals were 4, 9, 14, 19, 24, 29, 34, 39......274
Market
314/54= 5.81
Random starting point was between 0 – 5.8. 5.8 was picked and rounded up to
6.
Therefore, the intervals were 6, 11, 16, 21, 26, 31, 36, 41, 46, 51........271
Kropo
241/54= 4.46
Random starting point was between 0 - 4.5. 2.5 was chosen and rounded up to
3.
Therefore the intervals were 3, 7, 11, 15, 19, 23, 27, 31, 35, 39.......215
Roman
241/54= 4.46
Random starting point was between 0 – 4.5. 1.5 was selected and rounded up
to 2.
Therefore the intervals were 2, 6, 10, 14, 18, 22, 26, 30, 34, 38......214
Nampasa
187/28= 6.67
Random starting point was between 0 – 6.7. 6.7 was selected and rounded up
to 7.
Therefore the intervals were 7, 13, 19, 25, 31, 37, 43, 49, 55, 61.......169
Zongo

207
187/27= 6.92
Random starting point was between 0 – 6.9. 4.9 was picked and rounded up to
5.
Therefore the intervals were 5, 11, 17, 23, 29, 35, 41, 47, 53, 59, 65......159
Poano North
135/27= 5
Random starting point was between 0 – 5. 3 was selected.
Therefore the intervals were 3, 8, 13, 18, 23, 28, 33, 38, 43, 48, 53.....138.
Poano East
135/27=5
Random starting point was between 0 – 5. 1 was chosen.
There the intervals were 1, 6, 11, 16, 21, 26, 31, 36. 41, 46, 51......131
Selva Brava
337/21= 16.04
Random starting point was between 0 – 16.04. 11.04 was chosen and rounded
up to 12.
Therefore the intervals were 12, 28, 44, 60, 76, 92, 108, 124. 140, 156......332
Nucleo Urban
337/21=. 16.04
Random starting point was between 0 – 16.04. 7.04 was chosen and rounded
up to 8
Therefore the intervals point were 8, 24, 40, 56, 72, 88, 104, 120, 136,
152....328
Grup Del mont
109/21= 5.19
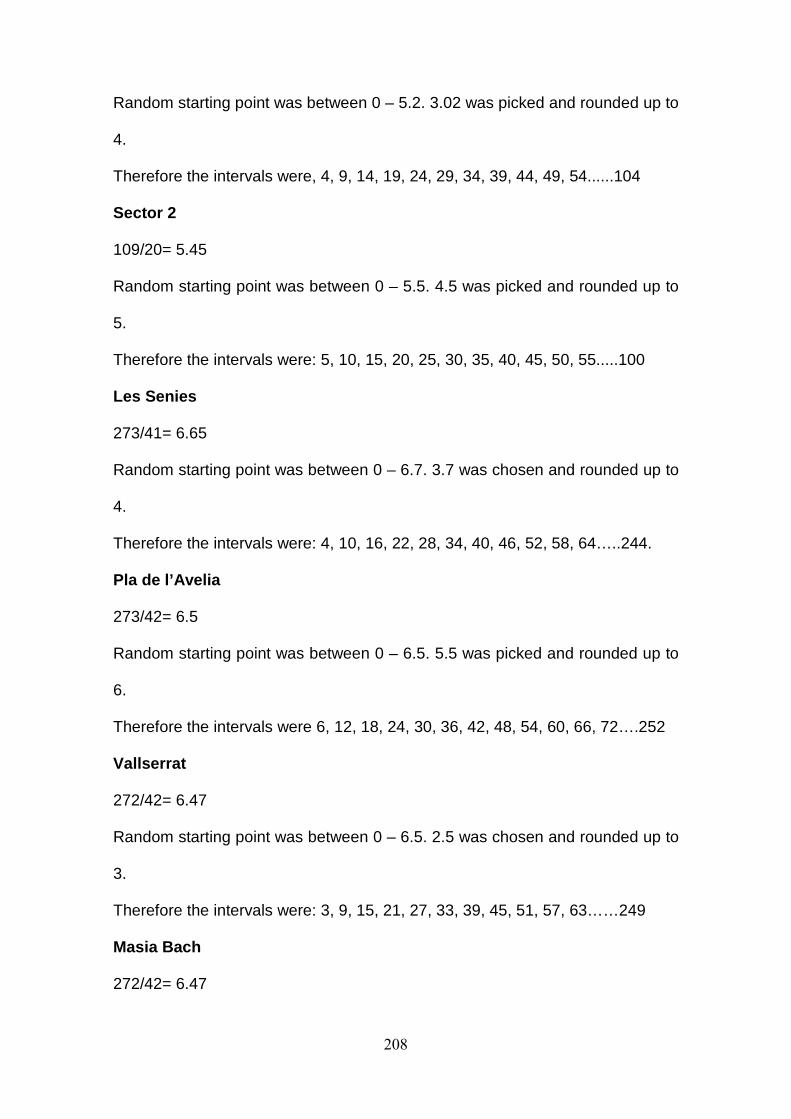
208
Random starting point was between 0 – 5.2. 3.02 was picked and rounded up to
4.
Therefore the intervals were, 4, 9, 14, 19, 24, 29, 34, 39, 44, 49, 54......104
Sector 2
109/20= 5.45
Random starting point was between 0 – 5.5. 4.5 was picked and rounded up to
5.
Therefore the intervals were: 5, 10, 15, 20, 25, 30, 35, 40, 45, 50, 55.....100
Les Senies
273/41= 6.65
Random starting point was between 0 – 6.7. 3.7 was chosen and rounded up to
4.
Therefore the intervals were: 4, 10, 16, 22, 28, 34, 40, 46, 52, 58, 64…..244.
Pla de l’Avelia
273/42= 6.5
Random starting point was between 0 – 6.5. 5.5 was picked and rounded up to
6.
Therefore the intervals were 6, 12, 18, 24, 30, 36, 42, 48, 54, 60, 66, 72….252
Vallserrat
272/42= 6.47
Random starting point was between 0 – 6.5. 2.5 was chosen and rounded up to
3.
Therefore the intervals were: 3, 9, 15, 21, 27, 33, 39, 45, 51, 57, 63……249
Masia Bach
272/42= 6.47
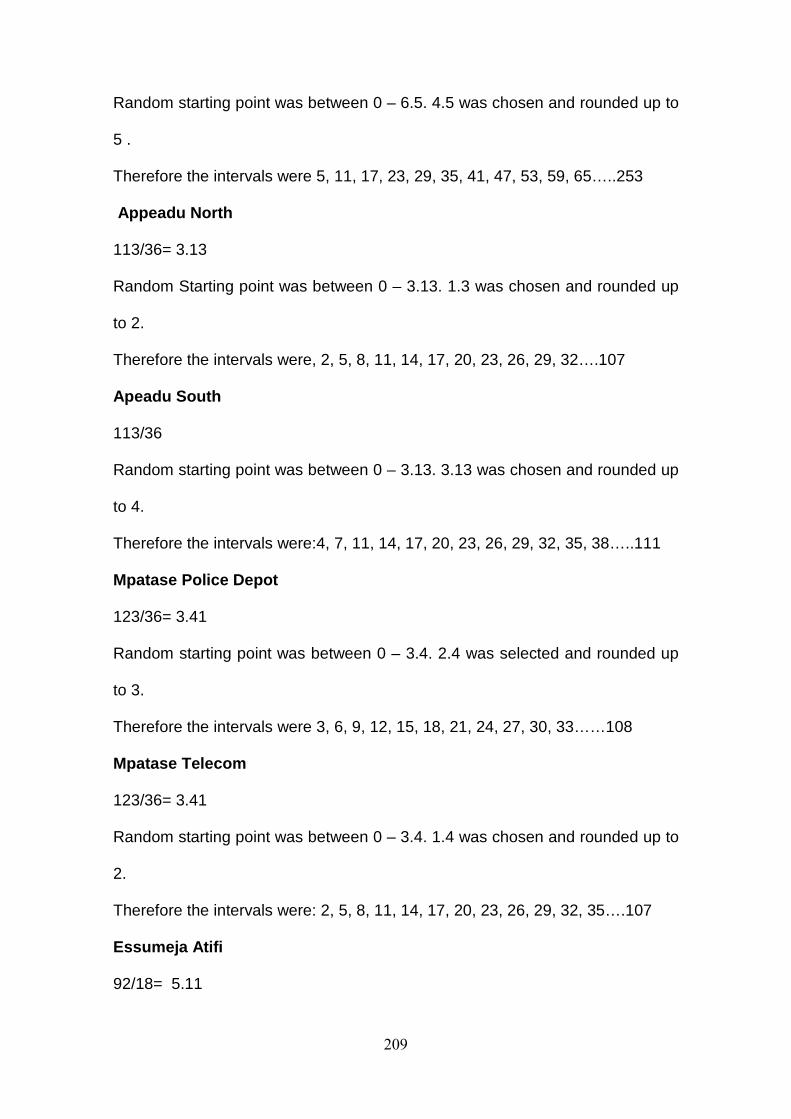
209
Random starting point was between 0 – 6.5. 4.5 was chosen and rounded up to
5 .
Therefore the intervals were 5, 11, 17, 23, 29, 35, 41, 47, 53, 59, 65…..253
Appeadu North
113/36= 3.13
Random Starting point was between 0 – 3.13. 1.3 was chosen and rounded up
to 2.
Therefore the intervals were, 2, 5, 8, 11, 14, 17, 20, 23, 26, 29, 32….107
Apeadu South
113/36
Random starting point was between 0 – 3.13. 3.13 was chosen and rounded up
to 4.
Therefore the intervals were:4, 7, 11, 14, 17, 20, 23, 26, 29, 32, 35, 38…..111
Mpatase Police Depot
123/36= 3.41
Random starting point was between 0 – 3.4. 2.4 was selected and rounded up
to 3.
Therefore the intervals were 3, 6, 9, 12, 15, 18, 21, 24, 27, 30, 33……108
Mpatase Telecom
123/36= 3.41
Random starting point was between 0 – 3.4. 1.4 was chosen and rounded up to
2.
Therefore the intervals were: 2, 5, 8, 11, 14, 17, 20, 23, 26, 29, 32, 35….107
Essumeja Atifi
92/18= 5.11
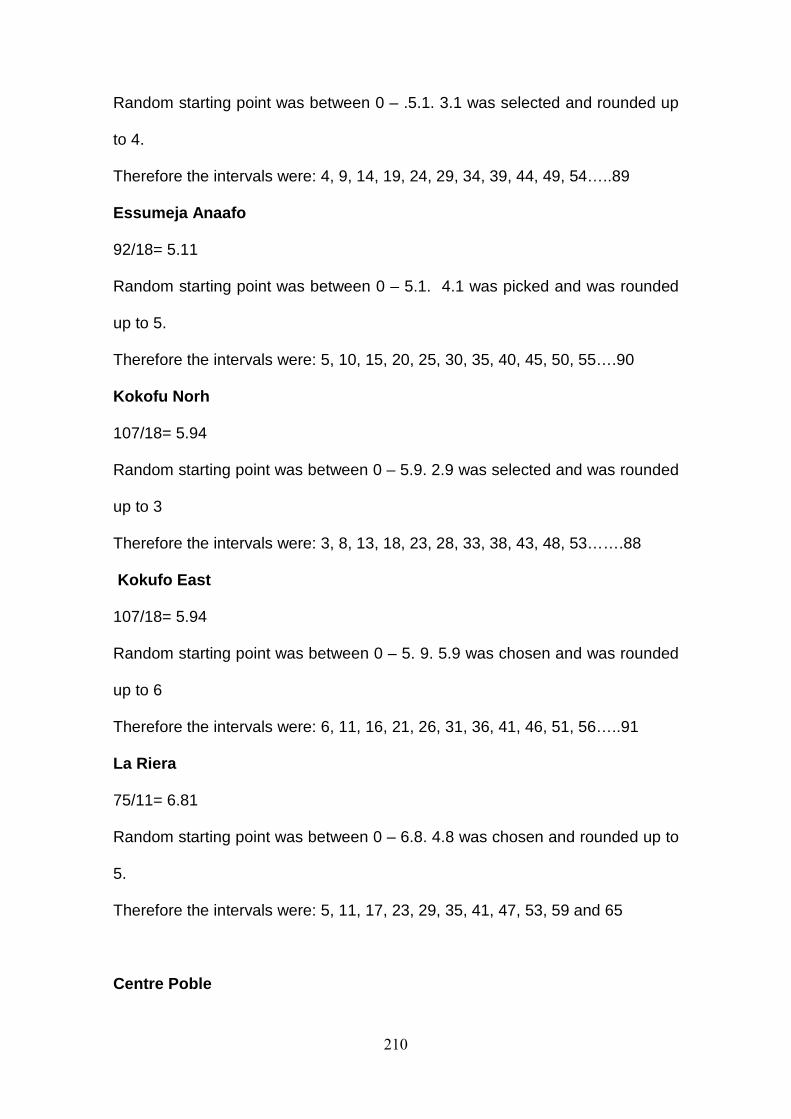
210
Random starting point was between 0 – .5.1. 3.1 was selected and rounded up
to 4.
Therefore the intervals were: 4, 9, 14, 19, 24, 29, 34, 39, 44, 49, 54…..89
Essumeja Anaafo
92/18= 5.11
Random starting point was between 0 – 5.1. 4.1 was picked and was rounded
up to 5.
Therefore the intervals were: 5, 10, 15, 20, 25, 30, 35, 40, 45, 50, 55….90
Kokofu Norh
107/18= 5.94
Random starting point was between 0 – 5.9. 2.9 was selected and was rounded
up to 3
Therefore the intervals were: 3, 8, 13, 18, 23, 28, 33, 38, 43, 48, 53…….88
Kokufo East
107/18= 5.94
Random starting point was between 0 – 5. 9. 5.9 was chosen and was rounded
up to 6
Therefore the intervals were: 6, 11, 16, 21, 26, 31, 36, 41, 46, 51, 56…..91
La Riera
75/11= 6.81
Random starting point was between 0 – 6.8. 4.8 was chosen and rounded up to
5.
Therefore the intervals were: 5, 11, 17, 23, 29, 35, 41, 47, 53, 59 and 65
Centre Poble

211
75/10= 7.5
Random starting point was between 0 – 7.5. 6.5 was chosen and was round
ed up to 7.
Therefore the intervals were: 7, 17, 27, 37, 47, 57, 67, 77, 87 and 97
Pla de Bastons
98/11= 8.90
Random starting point was between 0 – 8.9. 3.9 was selected and was rounded
up to 4.
Therefore the intervals were: 4, 12, 20, 28, 36, 44, 52, 60, 68, 76 and 84
Cases Noves
98/10= 9.8
Random starting point was between 0 – 9.8. 9.8 was picked and rounded up to
10
Therefore the intervals were: 10, 19, 28, 37, 46, 55, 64, 73, 82 and 91
Barri de l’Estacio
103/21= 4.90
Random starting point was between 0 – 4.9. 2.9 was taken and rounded up to
3.
Therefore the intervals were: 3, 7, 11, 15, 19, 23, 27, 31, 35, 39, 43…..83
Barri de Dalt
103/21= 4.90
Random starting point was between 0 – 4.9. 3.9 was chosen and was rounded
up to 4
Therefore the intervals were: 4, 8, 12, 16, 20, 24, 28, 32, 36, 40, 44….84
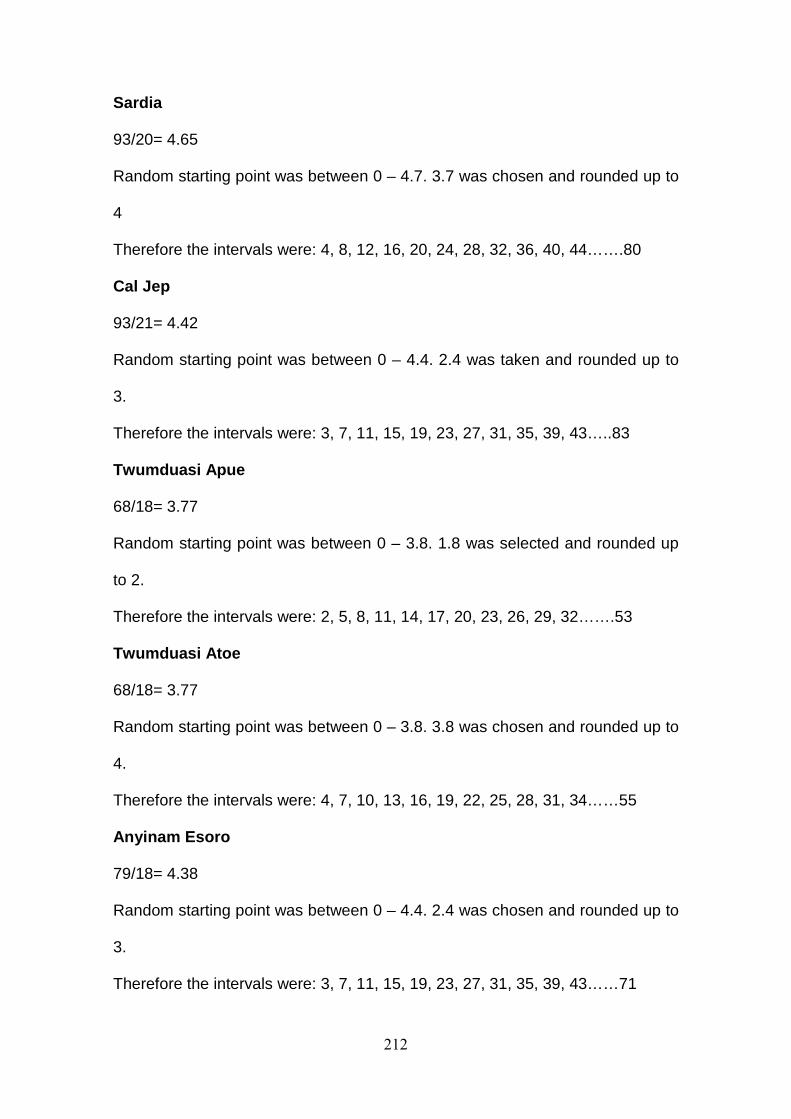
212
Sardia
93/20= 4.65
Random starting point was between 0 – 4.7. 3.7 was chosen and rounded up to
4
Therefore the intervals were: 4, 8, 12, 16, 20, 24, 28, 32, 36, 40, 44…….80
Cal Jep
93/21= 4.42
Random starting point was between 0 – 4.4. 2.4 was taken and rounded up to
3.
Therefore the intervals were: 3, 7, 11, 15, 19, 23, 27, 31, 35, 39, 43…..83
Twumduasi Apue
68/18= 3.77
Random starting point was between 0 – 3.8. 1.8 was selected and rounded up
to 2.
Therefore the intervals were: 2, 5, 8, 11, 14, 17, 20, 23, 26, 29, 32…….53
Twumduasi Atoe
68/18= 3.77
Random starting point was between 0 – 3.8. 3.8 was chosen and rounded up to
4.
Therefore the intervals were: 4, 7, 10, 13, 16, 19, 22, 25, 28, 31, 34……55
Anyinam Esoro
79/18= 4.38
Random starting point was between 0 – 4.4. 2.4 was chosen and rounded up to
3.
Therefore the intervals were: 3, 7, 11, 15, 19, 23, 27, 31, 35, 39, 43……71

213
Anyinam Efam
79/18= 4.38
Random starting point was between 0 – 4.4. 3.4 was picked and was rounded
up to 4.
Therefore the intervals were: 4, 8, 12, 16, 20, 24, 28, 32, 36, 40, 44…….72
Asamang East
57/18= 6.33
Random starting point was between 0 – 6.3. 6.3 was chosen and rounded up to
7.
Therefore the intervals were: 7, 13, 19, 25, 31, 37, 43, 49 and 55
Asamang North
57/18= 6.33
Random starting point was between 0 – 6.3. 4.3 was selected and was rounded
up to 5.
Therefore the intervals were: 5, 11, 17, 23, 29, 35, 41, 47 and 53
Amoaful North
48/9= 5.33
Random starting point was between 0 – 5.3. 2.3 was chosen and rounded up to
3
Therefore the intervals were: 3, 8, 13, 18, 23, 28, 33, 38 and 43
Amoaful South
48/9= 5.33
Random starting point was between 0 – 5.3. 3.3 and was rounded up to 4.
Therefore the intervals were: 4, 9, 14, 19, 24, 29, 34, 39, and 44
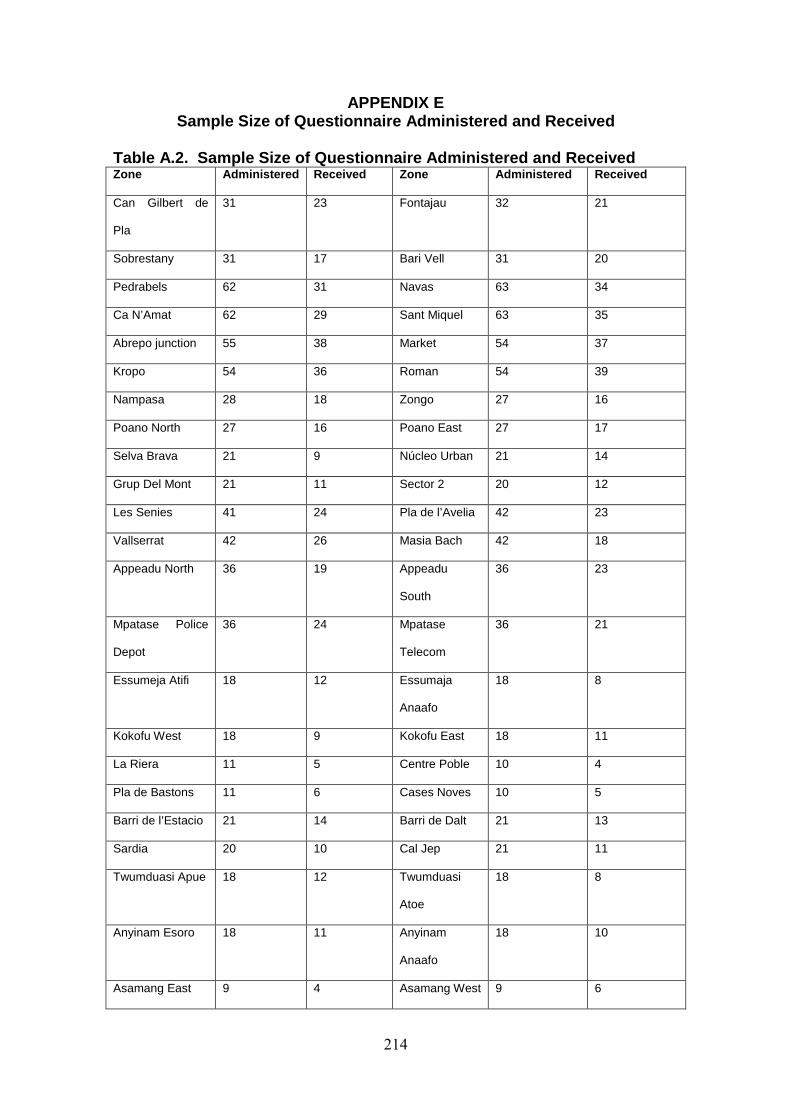
214
APPENDIX E Sample Size of Questionnaire Administered and Recei ved
Table A.2. Sample Size of Questionnaire Administer ed and Received Zone Administered Received Zone Administered Receiv ed
Can Gilbert de
Pla
31 23 Fontajau 32 21
Sobrestany 31 17 Bari Vell 31 20
Pedrabels 62 31 Navas 63 34
Ca N’Amat 62 29 Sant Miquel 63 35
Abrepo junction 55 38 Market 54 37
Kropo 54 36 Roman 54 39
Nampasa 28 18 Zongo 27 16
Poano North 27 16 Poano East 27 17
Selva Brava 21 9 Núcleo Urban 21 14
Grup Del Mont 21 11 Sector 2 20 12
Les Senies 41 24 Pla de l’Avelia 42 23
Vallserrat 42 26 Masia Bach 42 18
Appeadu North 36 19 Appeadu
South
36 23
Mpatase Police
Depot
36 24 Mpatase
Telecom
36 21
Essumeja Atifi 18 12 Essumaja
Anaafo
18 8
Kokofu West 18 9 Kokofu East 18 11
La Riera 11 5 Centre Poble 10 4
Pla de Bastons 11 6 Cases Noves 10 5
Barri de l’Estacio 21 14 Barri de Dalt 21 13
Sardia 20 10 Cal Jep 21 11
Twumduasi Apue 18 12 Twumduasi
Atoe
18 8
Anyinam Esoro 18 11 Anyinam
Anaafo
18 10
Asamang East 9 4 Asamang West 9 6
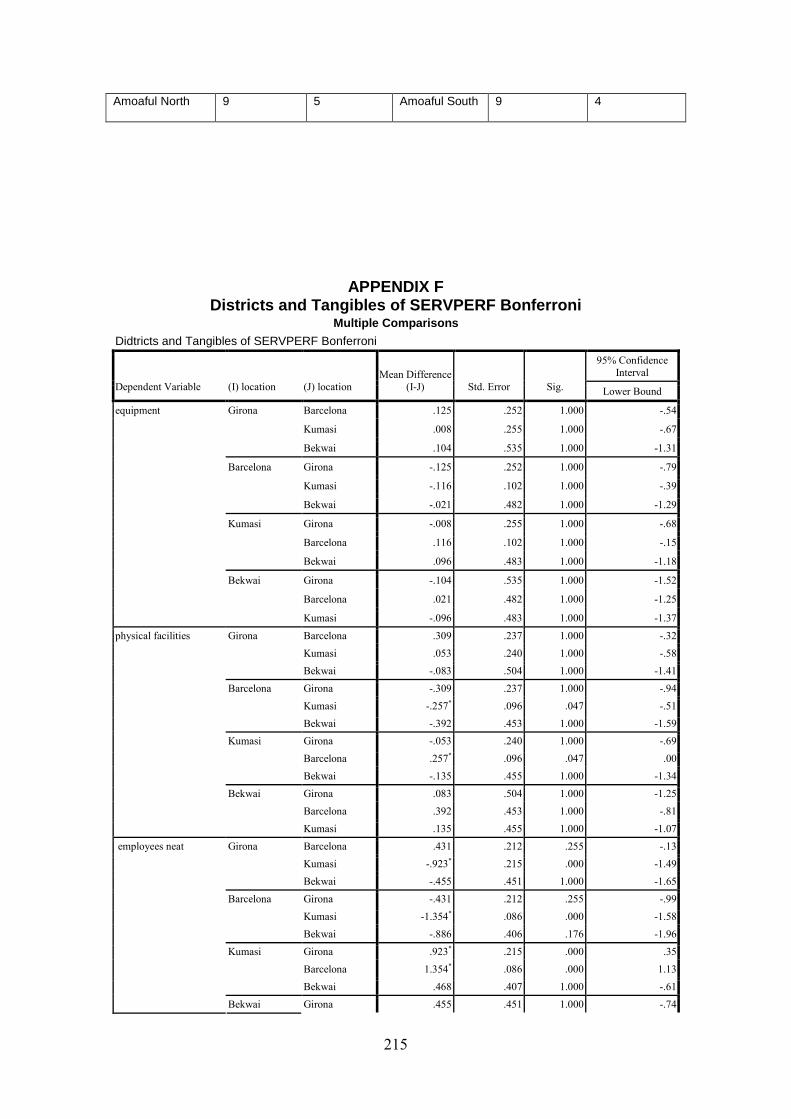
215
Amoaful North 9 5 Amoaful South 9 4
APPENDIX F Districts and Tangibles of SERVPERF Bonferroni
Multiple Comparisons
Didtricts and Tangibles of SERVPERF Bonferroni
95% Confidence
Interval
Dependent Variable (I) location (J) location
Mean Difference
(I-J) Std. Error Sig. Lower Bound
Barcelona .125 .252 1.000 -.54
Kumasi .008 .255 1.000 -.67
Girona
Bekwai .104 .535 1.000 -1.31
Girona -.125 .252 1.000 -.79
Kumasi -.116 .102 1.000 -.39
Barcelona
Bekwai -.021 .482 1.000 -1.29
Girona -.008 .255 1.000 -.68
Barcelona .116 .102 1.000 -.15
Kumasi
Bekwai .096 .483 1.000 -1.18
Girona -.104 .535 1.000 -1.52
Barcelona .021 .482 1.000 -1.25
equipment
Bekwai
Kumasi -.096 .483 1.000 -1.37
Barcelona .309 .237 1.000 -.32
Kumasi .053 .240 1.000 -.58
Girona
Bekwai -.083 .504 1.000 -1.41
Girona -.309 .237 1.000 -.94
Kumasi -.257* .096 .047 -.51
Barcelona
Bekwai -.392 .453 1.000 -1.59
Girona -.053 .240 1.000 -.69
Barcelona .257* .096 .047 .00
Kumasi
Bekwai -.135 .455 1.000 -1.34
Girona .083 .504 1.000 -1.25
Barcelona .392 .453 1.000 -.81
physical facilities
Bekwai
Kumasi .135 .455 1.000 -1.07
Barcelona .431 .212 .255 -.13
Kumasi -.923* .215 .000 -1.49
Girona
Bekwai -.455 .451 1.000 -1.65
Girona -.431 .212 .255 -.99
Kumasi -1.354* .086 .000 -1.58
Barcelona
Bekwai -.886 .406 .176 -1.96
Girona .923* .215 .000 .35
Barcelona 1.354* .086 .000 1.13
Kumasi
Bekwai .468 .407 1.000 -.61
employees neat
Bekwai Girona .455 .451 1.000 -.74
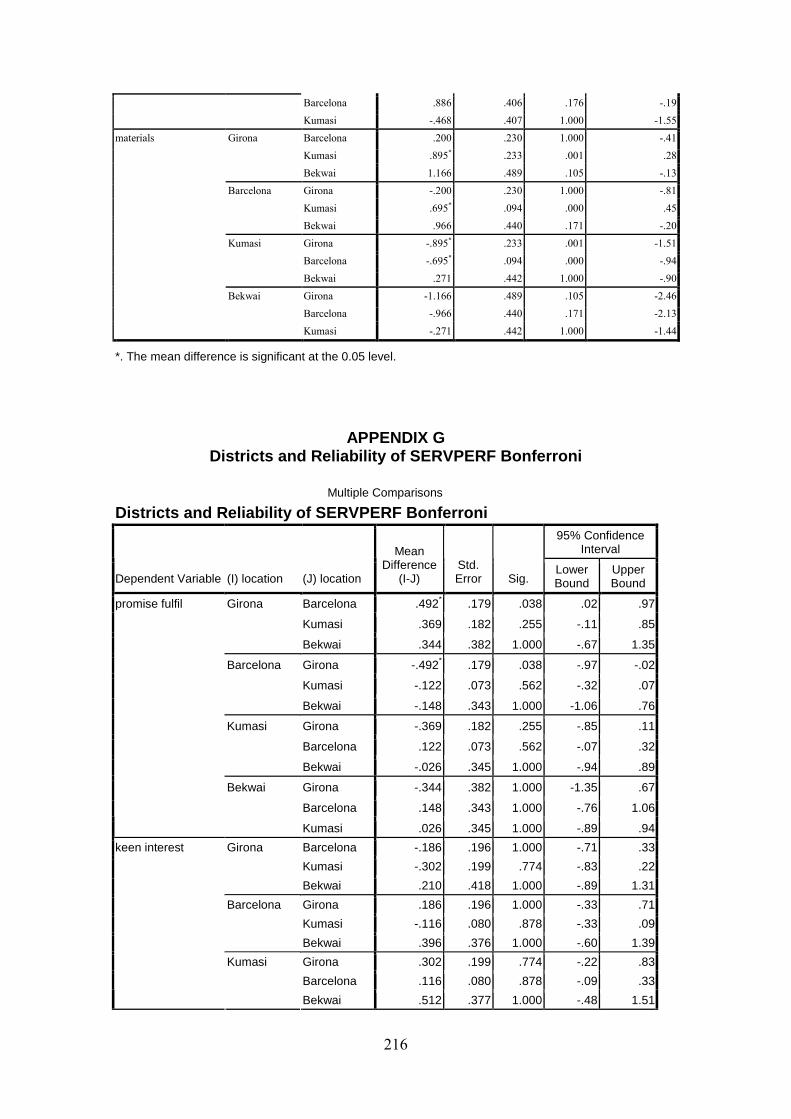
216
Barcelona .886 .406 .176 -.19
Kumasi -.468 .407 1.000 -1.55
Barcelona .200 .230 1.000 -.41
Kumasi .895* .233 .001 .28
Girona
Bekwai 1.166 .489 .105 -.13
Girona -.200 .230 1.000 -.81
Kumasi .695* .094 .000 .45
Barcelona
Bekwai .966 .440 .171 -.20
Girona -.895* .233 .001 -1.51
Barcelona -.695* .094 .000 -.94
Kumasi
Bekwai .271 .442 1.000 -.90
Girona -1.166 .489 .105 -2.46
Barcelona -.966 .440 .171 -2.13
materials
Bekwai
Kumasi -.271 .442 1.000 -1.44
*. The mean difference is significant at the 0.05 level.
APPENDIX G Districts and Reliability of SERVPERF Bonferroni
Multiple Comparisons
Districts and Reliability of SERVPERF Bonferroni 95% Confidence
Interval
Dependent Variable (I) location (J) location
Mean Difference
(I-J) Std. Error Sig.
Lower Bound
Upper Bound
Barcelona .492* .179 .038 .02 .97
Kumasi .369 .182 .255 -.11 .85
Girona
Bekwai .344 .382 1.000 -.67 1.35
Girona -.492* .179 .038 -.97 -.02
Kumasi -.122 .073 .562 -.32 .07
Barcelona
Bekwai -.148 .343 1.000 -1.06 .76
Girona -.369 .182 .255 -.85 .11
Barcelona .122 .073 .562 -.07 .32
Kumasi
Bekwai -.026 .345 1.000 -.94 .89
Girona -.344 .382 1.000 -1.35 .67
Barcelona .148 .343 1.000 -.76 1.06
promise fulfil
Bekwai
Kumasi .026 .345 1.000 -.89 .94
Barcelona -.186 .196 1.000 -.71 .33
Kumasi -.302 .199 .774 -.83 .22
Girona
Bekwai .210 .418 1.000 -.89 1.31
Girona .186 .196 1.000 -.33 .71
Kumasi -.116 .080 .878 -.33 .09
Barcelona
Bekwai .396 .376 1.000 -.60 1.39
Girona .302 .199 .774 -.22 .83
Barcelona .116 .080 .878 -.09 .33
keen interest
Kumasi
Bekwai .512 .377 1.000 -.48 1.51
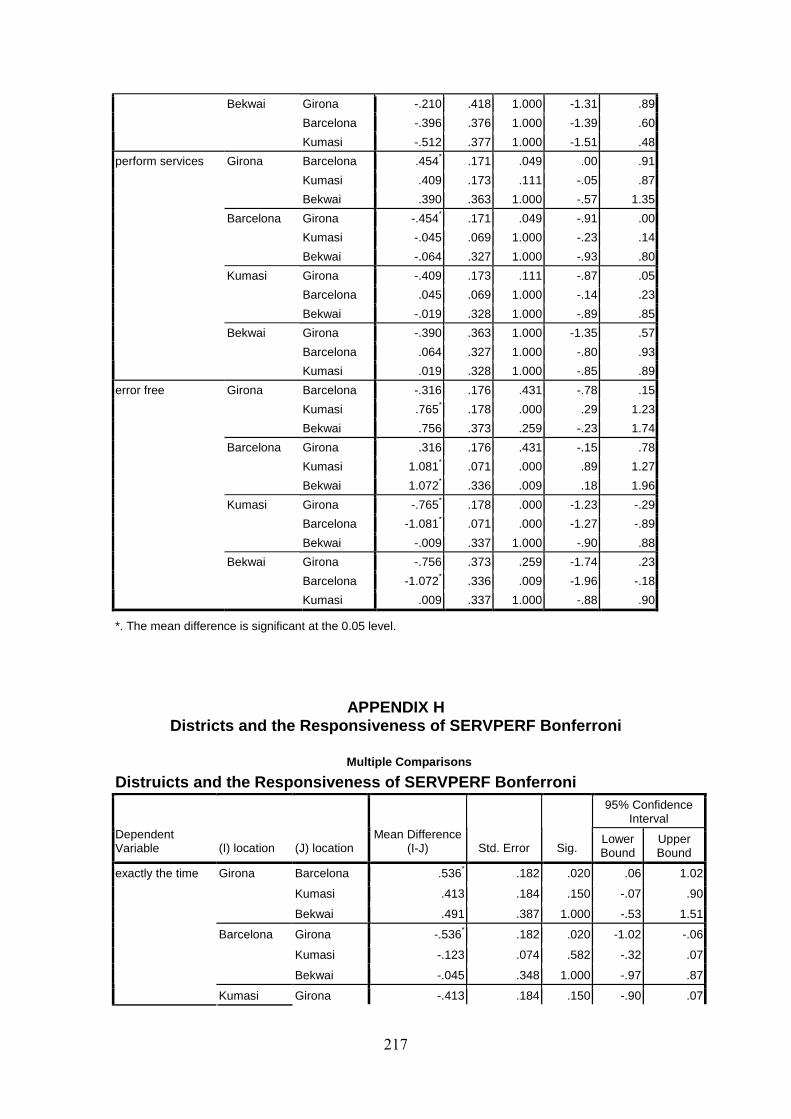
217
Girona -.210 .418 1.000 -1.31 .89
Barcelona -.396 .376 1.000 -1.39 .60
Bekwai
Kumasi -.512 .377 1.000 -1.51 .48
Barcelona .454* .171 .049 .00 .91
Kumasi .409 .173 .111 -.05 .87
Girona
Bekwai .390 .363 1.000 -.57 1.35
Girona -.454* .171 .049 -.91 .00
Kumasi -.045 .069 1.000 -.23 .14
Barcelona
Bekwai -.064 .327 1.000 -.93 .80
Girona -.409 .173 .111 -.87 .05
Barcelona .045 .069 1.000 -.14 .23
Kumasi
Bekwai -.019 .328 1.000 -.89 .85
Girona -.390 .363 1.000 -1.35 .57
Barcelona .064 .327 1.000 -.80 .93
perform services
Bekwai
Kumasi .019 .328 1.000 -.85 .89
Barcelona -.316 .176 .431 -.78 .15
Kumasi .765* .178 .000 .29 1.23
Girona
Bekwai .756 .373 .259 -.23 1.74
Girona .316 .176 .431 -.15 .78
Kumasi 1.081* .071 .000 .89 1.27
Barcelona
Bekwai 1.072* .336 .009 .18 1.96
Girona -.765* .178 .000 -1.23 -.29
Barcelona -1.081* .071 .000 -1.27 -.89
Kumasi
Bekwai -.009 .337 1.000 -.90 .88
Girona -.756 .373 .259 -1.74 .23
Barcelona -1.072* .336 .009 -1.96 -.18
error free
Bekwai
Kumasi .009 .337 1.000 -.88 .90
*. The mean difference is significant at the 0.05 level.
APPENDIX H Districts and the Responsiveness of SERVPERF Bonfer roni
Multiple Comparisons
Distruicts and the Responsiveness of SERVPERF Bonfe rroni 95% Confidence
Interval Dependent Variable (I) location (J) location
Mean Difference (I-J) Std. Error Sig.
Lower Bound
Upper Bound
Barcelona .536* .182 .020 .06 1.02
Kumasi .413 .184 .150 -.07 .90
Girona
Bekwai .491 .387 1.000 -.53 1.51
Girona -.536* .182 .020 -1.02 -.06
Kumasi -.123 .074 .582 -.32 .07
Barcelona
Bekwai -.045 .348 1.000 -.97 .87
exactly the time
Kumasi Girona -.413 .184 .150 -.90 .07
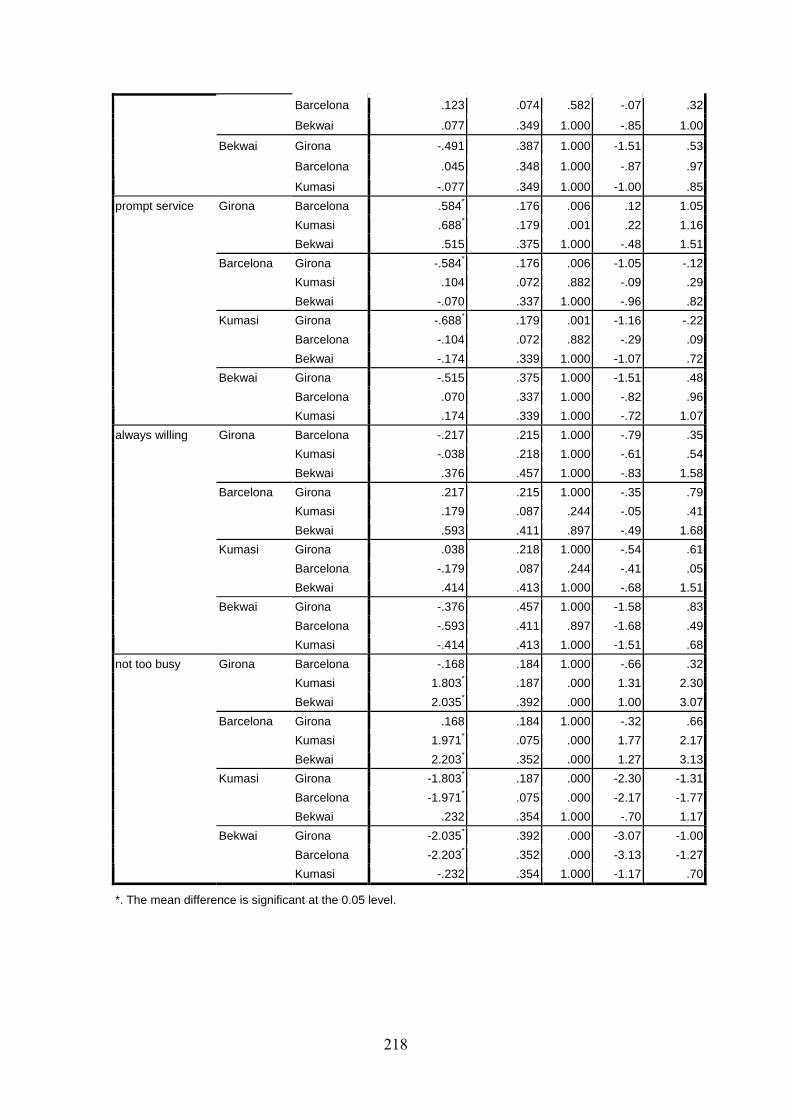
218
Barcelona .123 .074 .582 -.07 .32
Bekwai .077 .349 1.000 -.85 1.00
Girona -.491 .387 1.000 -1.51 .53
Barcelona .045 .348 1.000 -.87 .97
Bekwai
Kumasi -.077 .349 1.000 -1.00 .85
Barcelona .584* .176 .006 .12 1.05
Kumasi .688* .179 .001 .22 1.16
Girona
Bekwai .515 .375 1.000 -.48 1.51
Girona -.584* .176 .006 -1.05 -.12
Kumasi .104 .072 .882 -.09 .29
Barcelona
Bekwai -.070 .337 1.000 -.96 .82
Girona -.688* .179 .001 -1.16 -.22
Barcelona -.104 .072 .882 -.29 .09
Kumasi
Bekwai -.174 .339 1.000 -1.07 .72
Girona -.515 .375 1.000 -1.51 .48
Barcelona .070 .337 1.000 -.82 .96
prompt service
Bekwai
Kumasi .174 .339 1.000 -.72 1.07
Barcelona -.217 .215 1.000 -.79 .35
Kumasi -.038 .218 1.000 -.61 .54
Girona
Bekwai .376 .457 1.000 -.83 1.58
Girona .217 .215 1.000 -.35 .79
Kumasi .179 .087 .244 -.05 .41
Barcelona
Bekwai .593 .411 .897 -.49 1.68
Girona .038 .218 1.000 -.54 .61
Barcelona -.179 .087 .244 -.41 .05
Kumasi
Bekwai .414 .413 1.000 -.68 1.51
Girona -.376 .457 1.000 -1.58 .83
Barcelona -.593 .411 .897 -1.68 .49
always willing
Bekwai
Kumasi -.414 .413 1.000 -1.51 .68
Barcelona -.168 .184 1.000 -.66 .32
Kumasi 1.803* .187 .000 1.31 2.30
Girona
Bekwai 2.035* .392 .000 1.00 3.07
Girona .168 .184 1.000 -.32 .66
Kumasi 1.971* .075 .000 1.77 2.17
Barcelona
Bekwai 2.203* .352 .000 1.27 3.13
Girona -1.803* .187 .000 -2.30 -1.31
Barcelona -1.971* .075 .000 -2.17 -1.77
Kumasi
Bekwai .232 .354 1.000 -.70 1.17
Girona -2.035* .392 .000 -3.07 -1.00
Barcelona -2.203* .352 .000 -3.13 -1.27
not too busy
Bekwai
Kumasi -.232 .354 1.000 -1.17 .70
*. The mean difference is significant at the 0.05 level.
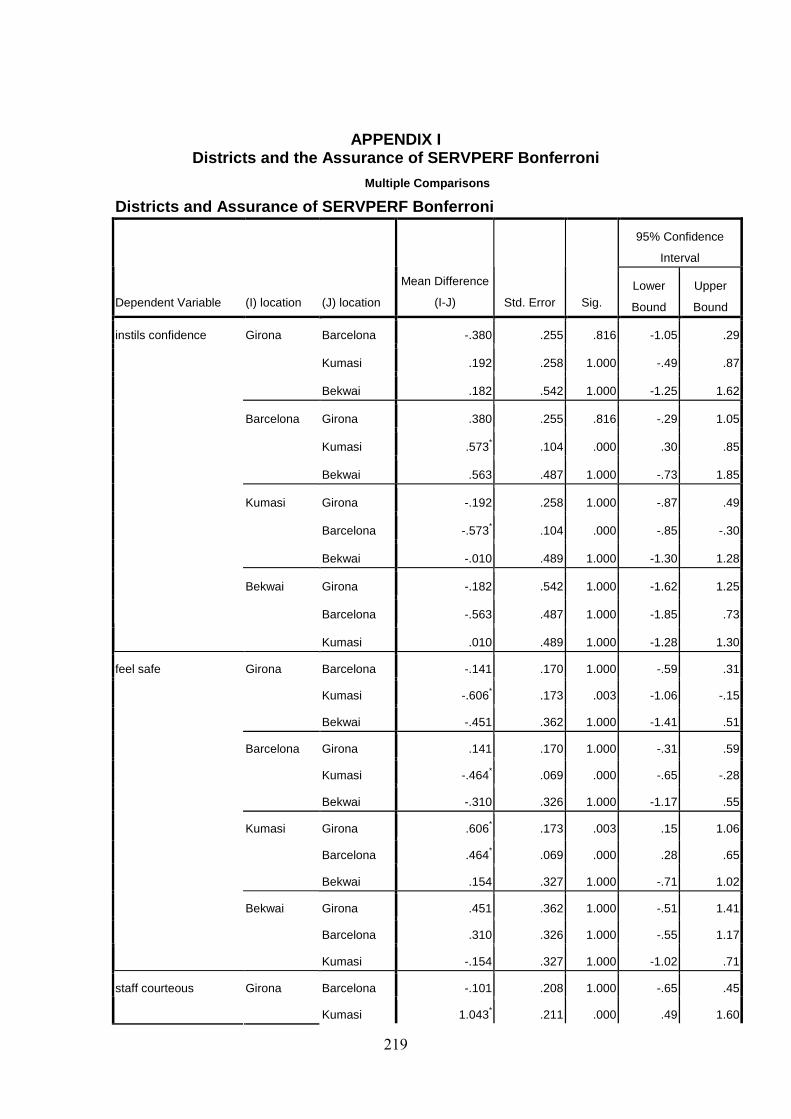
219
APPENDIX I Districts and the Assurance of SERVPERF Bonferroni
Multiple Comparisons
Districts and Assurance of SERVPERF Bonferroni
95% Confidence
Interval
Dependent Variable (I) location (J) location
Mean Difference
(I-J) Std. Error Sig. Lower
Bound
Upper
Bound
Barcelona -.380 .255 .816 -1.05 .29
Kumasi .192 .258 1.000 -.49 .87
Girona
Bekwai .182 .542 1.000 -1.25 1.62
Girona .380 .255 .816 -.29 1.05
Kumasi .573* .104 .000 .30 .85
Barcelona
Bekwai .563 .487 1.000 -.73 1.85
Girona -.192 .258 1.000 -.87 .49
Barcelona -.573* .104 .000 -.85 -.30
Kumasi
Bekwai -.010 .489 1.000 -1.30 1.28
Girona -.182 .542 1.000 -1.62 1.25
Barcelona -.563 .487 1.000 -1.85 .73
instils confidence
Bekwai
Kumasi .010 .489 1.000 -1.28 1.30
Barcelona -.141 .170 1.000 -.59 .31
Kumasi -.606* .173 .003 -1.06 -.15
Girona
Bekwai -.451 .362 1.000 -1.41 .51
Girona .141 .170 1.000 -.31 .59
Kumasi -.464* .069 .000 -.65 -.28
Barcelona
Bekwai -.310 .326 1.000 -1.17 .55
Girona .606* .173 .003 .15 1.06
Barcelona .464* .069 .000 .28 .65
Kumasi
Bekwai .154 .327 1.000 -.71 1.02
Girona .451 .362 1.000 -.51 1.41
Barcelona .310 .326 1.000 -.55 1.17
feel safe
Bekwai
Kumasi -.154 .327 1.000 -1.02 .71
Barcelona -.101 .208 1.000 -.65 .45 staff courteous Girona
Kumasi 1.043* .211 .000 .49 1.60
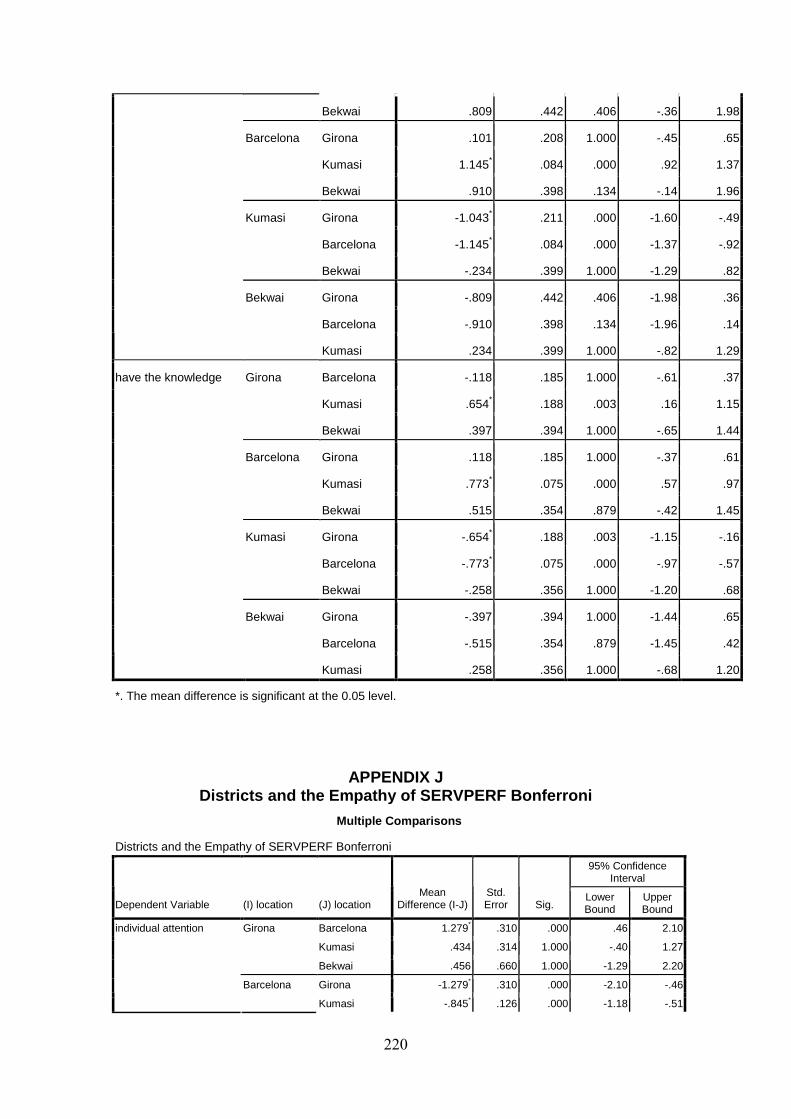
220
Bekwai .809 .442 .406 -.36 1.98
Girona .101 .208 1.000 -.45 .65
Kumasi 1.145* .084 .000 .92 1.37
Barcelona
Bekwai .910 .398 .134 -.14 1.96
Girona -1.043* .211 .000 -1.60 -.49
Barcelona -1.145* .084 .000 -1.37 -.92
Kumasi
Bekwai -.234 .399 1.000 -1.29 .82
Girona -.809 .442 .406 -1.98 .36
Barcelona -.910 .398 .134 -1.96 .14
Bekwai
Kumasi .234 .399 1.000 -.82 1.29
Barcelona -.118 .185 1.000 -.61 .37
Kumasi .654* .188 .003 .16 1.15
Girona
Bekwai .397 .394 1.000 -.65 1.44
Girona .118 .185 1.000 -.37 .61
Kumasi .773* .075 .000 .57 .97
Barcelona
Bekwai .515 .354 .879 -.42 1.45
Girona -.654* .188 .003 -1.15 -.16
Barcelona -.773* .075 .000 -.97 -.57
Kumasi
Bekwai -.258 .356 1.000 -1.20 .68
Girona -.397 .394 1.000 -1.44 .65
Barcelona -.515 .354 .879 -1.45 .42
have the knowledge
Bekwai
Kumasi .258 .356 1.000 -.68 1.20
*. The mean difference is significant at the 0.05 level.
APPENDIX J Districts and the Empathy of SERVPERF Bonferroni
Multiple Comparisons
Districts and the Empathy of SERVPERF Bonferroni
95% Confidence Interval
Dependent Variable (I) location (J) location Mean
Difference (I-J) Std. Error Sig.
Lower Bound
Upper Bound
Barcelona 1.279* .310 .000 .46 2.10
Kumasi .434 .314 1.000 -.40 1.27
Girona
Bekwai .456 .660 1.000 -1.29 2.20
Girona -1.279* .310 .000 -2.10 -.46
individual attention
Barcelona
Kumasi -.845* .126 .000 -1.18 -.51
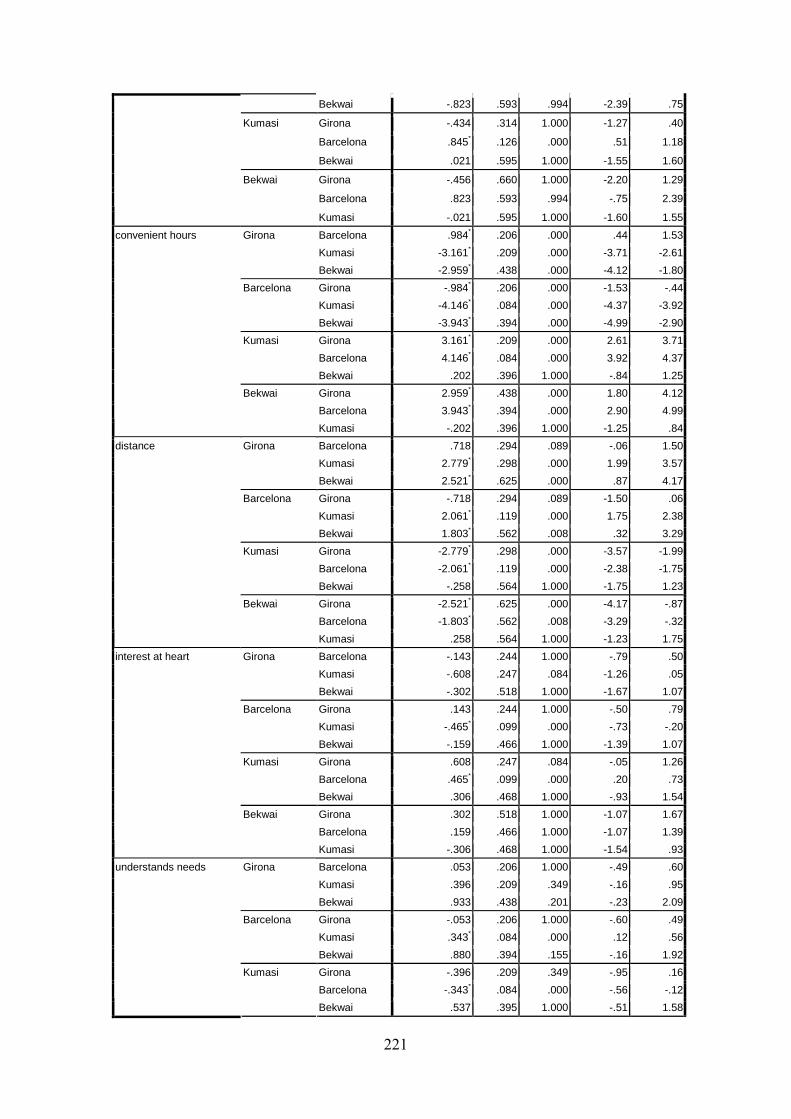
221
Bekwai -.823 .593 .994 -2.39 .75
Girona -.434 .314 1.000 -1.27 .40
Barcelona .845* .126 .000 .51 1.18
Kumasi
Bekwai .021 .595 1.000 -1.55 1.60
Girona -.456 .660 1.000 -2.20 1.29
Barcelona .823 .593 .994 -.75 2.39
Bekwai
Kumasi -.021 .595 1.000 -1.60 1.55
Barcelona .984* .206 .000 .44 1.53
Kumasi -3.161* .209 .000 -3.71 -2.61
Girona
Bekwai -2.959* .438 .000 -4.12 -1.80
Girona -.984* .206 .000 -1.53 -.44
Kumasi -4.146* .084 .000 -4.37 -3.92
Barcelona
Bekwai -3.943* .394 .000 -4.99 -2.90
Girona 3.161* .209 .000 2.61 3.71
Barcelona 4.146* .084 .000 3.92 4.37
Kumasi
Bekwai .202 .396 1.000 -.84 1.25
Girona 2.959* .438 .000 1.80 4.12
Barcelona 3.943* .394 .000 2.90 4.99
convenient hours
Bekwai
Kumasi -.202 .396 1.000 -1.25 .84
Barcelona .718 .294 .089 -.06 1.50
Kumasi 2.779* .298 .000 1.99 3.57
Girona
Bekwai 2.521* .625 .000 .87 4.17
Girona -.718 .294 .089 -1.50 .06
Kumasi 2.061* .119 .000 1.75 2.38
Barcelona
Bekwai 1.803* .562 .008 .32 3.29
Girona -2.779* .298 .000 -3.57 -1.99
Barcelona -2.061* .119 .000 -2.38 -1.75
Kumasi
Bekwai -.258 .564 1.000 -1.75 1.23
Girona -2.521* .625 .000 -4.17 -.87
Barcelona -1.803* .562 .008 -3.29 -.32
distance
Bekwai
Kumasi .258 .564 1.000 -1.23 1.75
Barcelona -.143 .244 1.000 -.79 .50
Kumasi -.608 .247 .084 -1.26 .05
Girona
Bekwai -.302 .518 1.000 -1.67 1.07
Girona .143 .244 1.000 -.50 .79
Kumasi -.465* .099 .000 -.73 -.20
Barcelona
Bekwai -.159 .466 1.000 -1.39 1.07
Girona .608 .247 .084 -.05 1.26
Barcelona .465* .099 .000 .20 .73
Kumasi
Bekwai .306 .468 1.000 -.93 1.54
Girona .302 .518 1.000 -1.07 1.67
Barcelona .159 .466 1.000 -1.07 1.39
interest at heart
Bekwai
Kumasi -.306 .468 1.000 -1.54 .93
Barcelona .053 .206 1.000 -.49 .60
Kumasi .396 .209 .349 -.16 .95
Girona
Bekwai .933 .438 .201 -.23 2.09
Girona -.053 .206 1.000 -.60 .49
Kumasi .343* .084 .000 .12 .56
Barcelona
Bekwai .880 .394 .155 -.16 1.92
Girona -.396 .209 .349 -.95 .16
Barcelona -.343* .084 .000 -.56 -.12
understands needs
Kumasi
Bekwai .537 .395 1.000 -.51 1.58
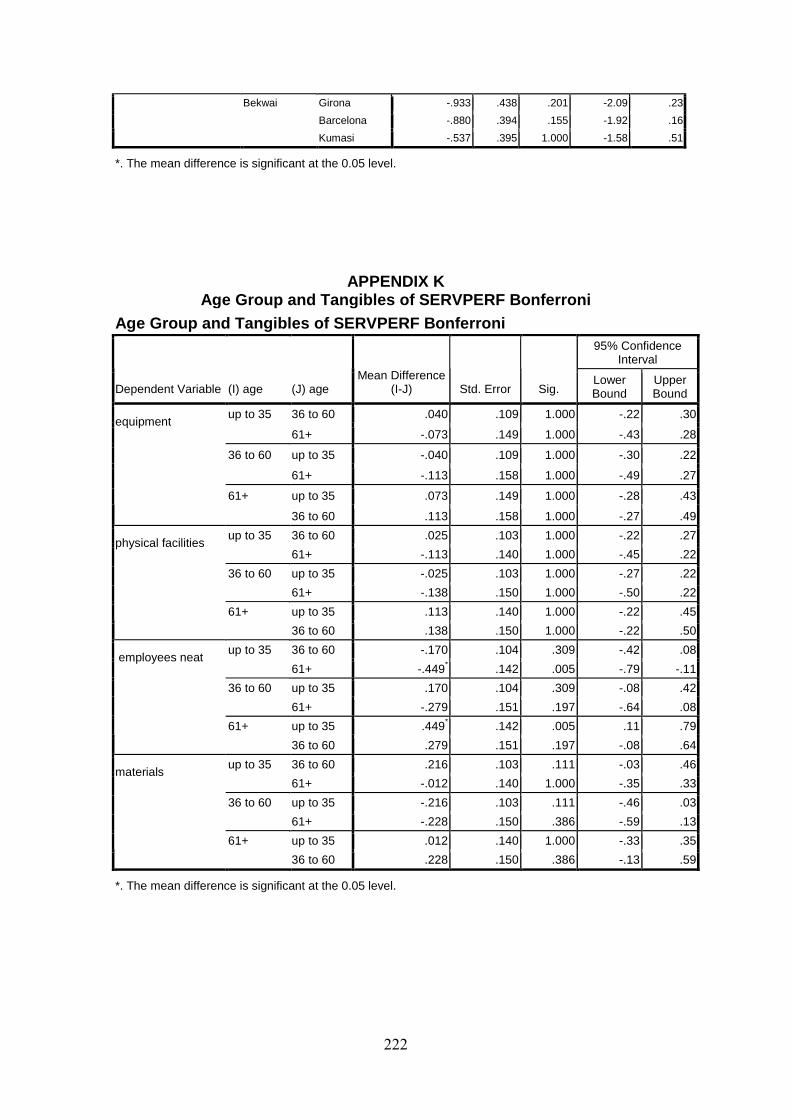
222
Girona -.933 .438 .201 -2.09 .23
Barcelona -.880 .394 .155 -1.92 .16
Bekwai
Kumasi -.537 .395 1.000 -1.58 .51
*. The mean difference is significant at the 0.05 level.
APPENDIX K Age Group and Tangibles of SERVPERF Bonferroni
Age Group and Tangibles of SERVPERF Bonferroni 95% Confidence
Interval
Dependent Variable (I) age (J) age Mean Difference
(I-J) Std. Error Sig. Lower Bound
Upper Bound
36 to 60 .040 .109 1.000 -.22 .30 up to 35
61+ -.073 .149 1.000 -.43 .28
up to 35 -.040 .109 1.000 -.30 .22 36 to 60
61+ -.113 .158 1.000 -.49 .27
up to 35 .073 .149 1.000 -.28 .43
equipment
61+
36 to 60 .113 .158 1.000 -.27 .49
36 to 60 .025 .103 1.000 -.22 .27 up to 35
61+ -.113 .140 1.000 -.45 .22
up to 35 -.025 .103 1.000 -.27 .22 36 to 60
61+ -.138 .150 1.000 -.50 .22
up to 35 .113 .140 1.000 -.22 .45
physical facilities
61+
36 to 60 .138 .150 1.000 -.22 .50
36 to 60 -.170 .104 .309 -.42 .08 up to 35
61+ -.449* .142 .005 -.79 -.11
up to 35 .170 .104 .309 -.08 .42 36 to 60
61+ -.279 .151 .197 -.64 .08
up to 35 .449* .142 .005 .11 .79
employees neat
61+
36 to 60 .279 .151 .197 -.08 .64
36 to 60 .216 .103 .111 -.03 .46 up to 35
61+ -.012 .140 1.000 -.35 .33
up to 35 -.216 .103 .111 -.46 .03 36 to 60
61+ -.228 .150 .386 -.59 .13
up to 35 .012 .140 1.000 -.33 .35
materials
61+
36 to 60 .228 .150 .386 -.13 .59
*. The mean difference is significant at the 0.05 level.
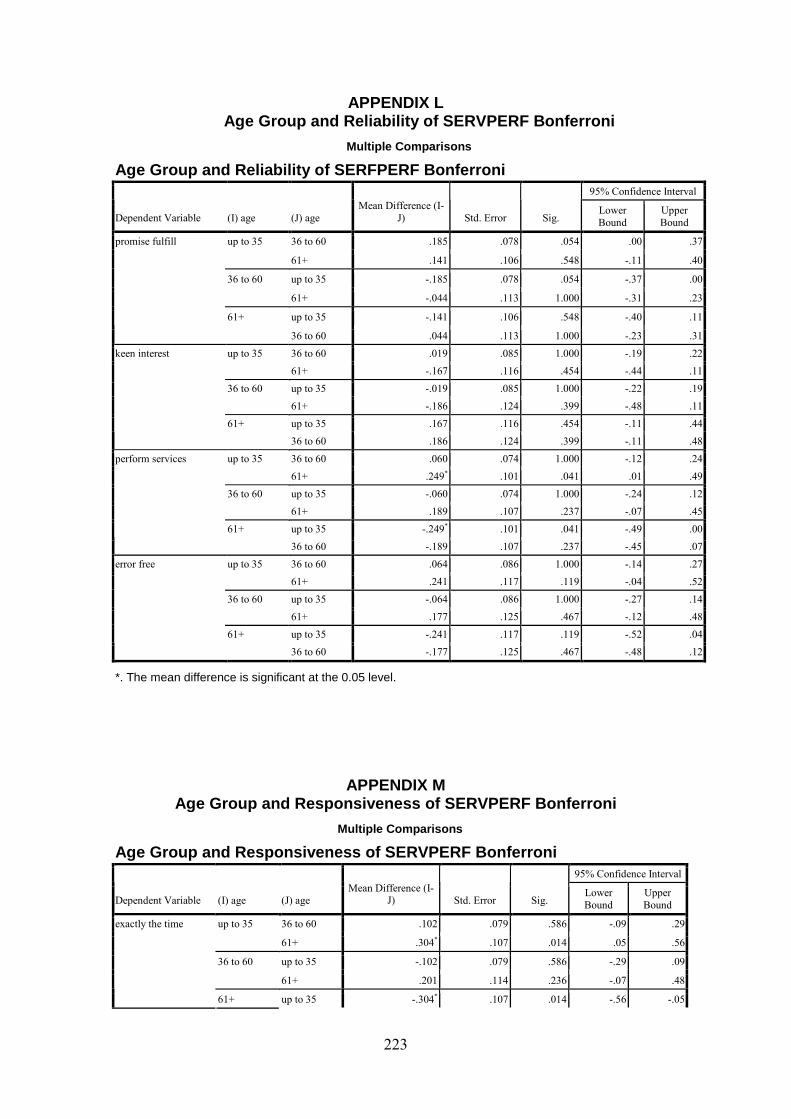
223
APPENDIX L Age Group and Reliability of SERVPERF Bonferroni
Multiple Comparisons
Age Group and Reliability of SERFPERF Bonferroni 95% Confidence Interval
Dependent Variable (I) age (J) age
Mean Difference (I-
J) Std. Error Sig. Lower
Bound
Upper
Bound
36 to 60 .185 .078 .054 .00 .37 up to 35
61+ .141 .106 .548 -.11 .40
up to 35 -.185 .078 .054 -.37 .00 36 to 60
61+ -.044 .113 1.000 -.31 .23
up to 35 -.141 .106 .548 -.40 .11
promise fulfill
61+
36 to 60 .044 .113 1.000 -.23 .31
36 to 60 .019 .085 1.000 -.19 .22 up to 35
61+ -.167 .116 .454 -.44 .11
up to 35 -.019 .085 1.000 -.22 .19 36 to 60
61+ -.186 .124 .399 -.48 .11
up to 35 .167 .116 .454 -.11 .44
keen interest
61+
36 to 60 .186 .124 .399 -.11 .48
36 to 60 .060 .074 1.000 -.12 .24 up to 35
61+ .249* .101 .041 .01 .49
up to 35 -.060 .074 1.000 -.24 .12 36 to 60
61+ .189 .107 .237 -.07 .45
up to 35 -.249* .101 .041 -.49 .00
perform services
61+
36 to 60 -.189 .107 .237 -.45 .07
36 to 60 .064 .086 1.000 -.14 .27 up to 35
61+ .241 .117 .119 -.04 .52
up to 35 -.064 .086 1.000 -.27 .14 36 to 60
61+ .177 .125 .467 -.12 .48
up to 35 -.241 .117 .119 -.52 .04
error free
61+
36 to 60 -.177 .125 .467 -.48 .12
*. The mean difference is significant at the 0.05 level.
APPENDIX M Age Group and Responsiveness of SERVPERF Bonferroni
Multiple Comparisons
Age Group and Responsiveness of SERVPERF Bonferroni 95% Confidence Interval
Dependent Variable (I) age (J) age
Mean Difference (I-J) Std. Error Sig.
Lower
Bound
Upper
Bound
36 to 60 .102 .079 .586 -.09 .29 up to 35
61+ .304* .107 .014 .05 .56
up to 35 -.102 .079 .586 -.29 .09 36 to 60
61+ .201 .114 .236 -.07 .48
exactly the time
61+ up to 35 -.304* .107 .014 -.56 -.05
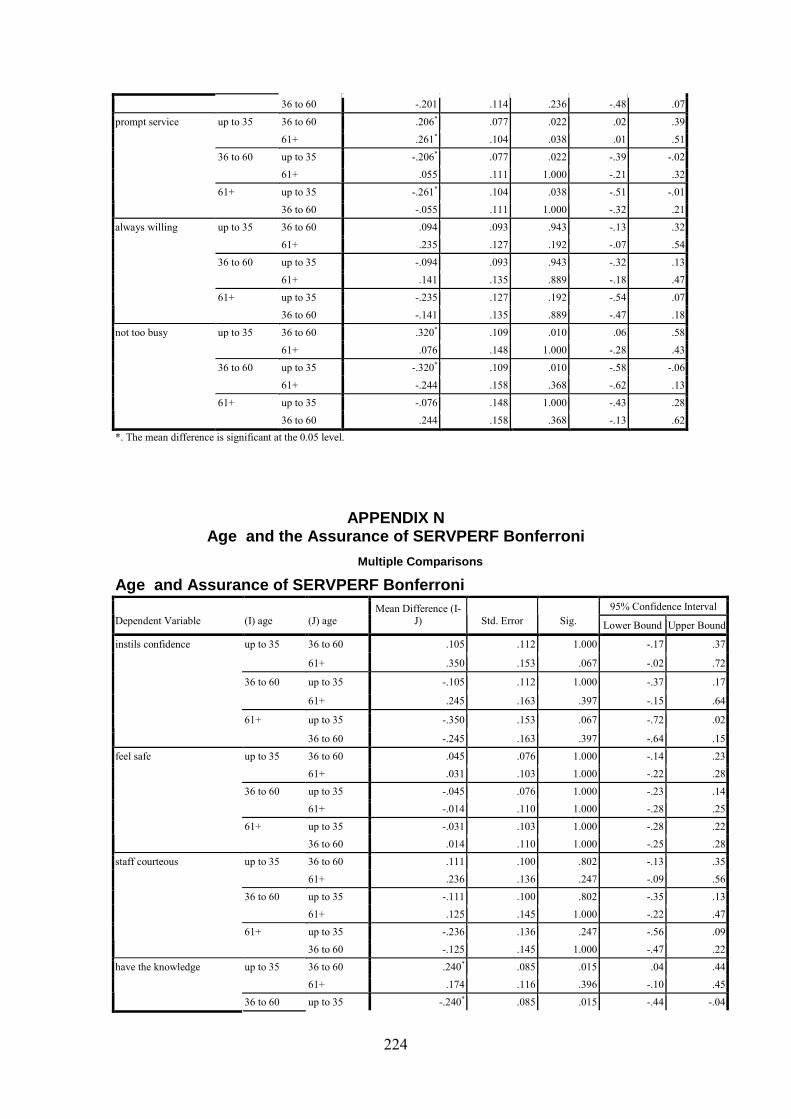
224
36 to 60 -.201 .114 .236 -.48 .07
36 to 60 .206* .077 .022 .02 .39 up to 35
61+ .261* .104 .038 .01 .51
up to 35 -.206* .077 .022 -.39 -.02 36 to 60
61+ .055 .111 1.000 -.21 .32
up to 35 -.261* .104 .038 -.51 -.01
prompt service
61+
36 to 60 -.055 .111 1.000 -.32 .21
36 to 60 .094 .093 .943 -.13 .32 up to 35
61+ .235 .127 .192 -.07 .54
up to 35 -.094 .093 .943 -.32 .13 36 to 60
61+ .141 .135 .889 -.18 .47
up to 35 -.235 .127 .192 -.54 .07
always willing
61+
36 to 60 -.141 .135 .889 -.47 .18
36 to 60 .320* .109 .010 .06 .58 up to 35
61+ .076 .148 1.000 -.28 .43
up to 35 -.320* .109 .010 -.58 -.06 36 to 60
61+ -.244 .158 .368 -.62 .13
up to 35 -.076 .148 1.000 -.43 .28
not too busy
61+
36 to 60 .244 .158 .368 -.13 .62
*. The mean difference is significant at the 0.05 level.
APPENDIX N Age and the Assurance of SERVPERF Bonferroni
Multiple Comparisons
Age and Assurance of SERVPERF Bonferroni 95% Confidence Interval
Dependent Variable (I) age (J) age Mean Difference (I-
J) Std. Error Sig. Lower Bound Upper Bound
36 to 60 .105 .112 1.000 -.17 .37 up to 35
61+ .350 .153 .067 -.02 .72
up to 35 -.105 .112 1.000 -.37 .17 36 to 60
61+ .245 .163 .397 -.15 .64
up to 35 -.350 .153 .067 -.72 .02
instils confidence
61+
36 to 60 -.245 .163 .397 -.64 .15
36 to 60 .045 .076 1.000 -.14 .23 up to 35
61+ .031 .103 1.000 -.22 .28
up to 35 -.045 .076 1.000 -.23 .14 36 to 60
61+ -.014 .110 1.000 -.28 .25
up to 35 -.031 .103 1.000 -.28 .22
feel safe
61+
36 to 60 .014 .110 1.000 -.25 .28
36 to 60 .111 .100 .802 -.13 .35 up to 35
61+ .236 .136 .247 -.09 .56
up to 35 -.111 .100 .802 -.35 .13 36 to 60
61+ .125 .145 1.000 -.22 .47
up to 35 -.236 .136 .247 -.56 .09
staff courteous
61+
36 to 60 -.125 .145 1.000 -.47 .22
36 to 60 .240* .085 .015 .04 .44 up to 35
61+ .174 .116 .396 -.10 .45
have the knowledge
36 to 60 up to 35 -.240* .085 .015 -.44 -.04
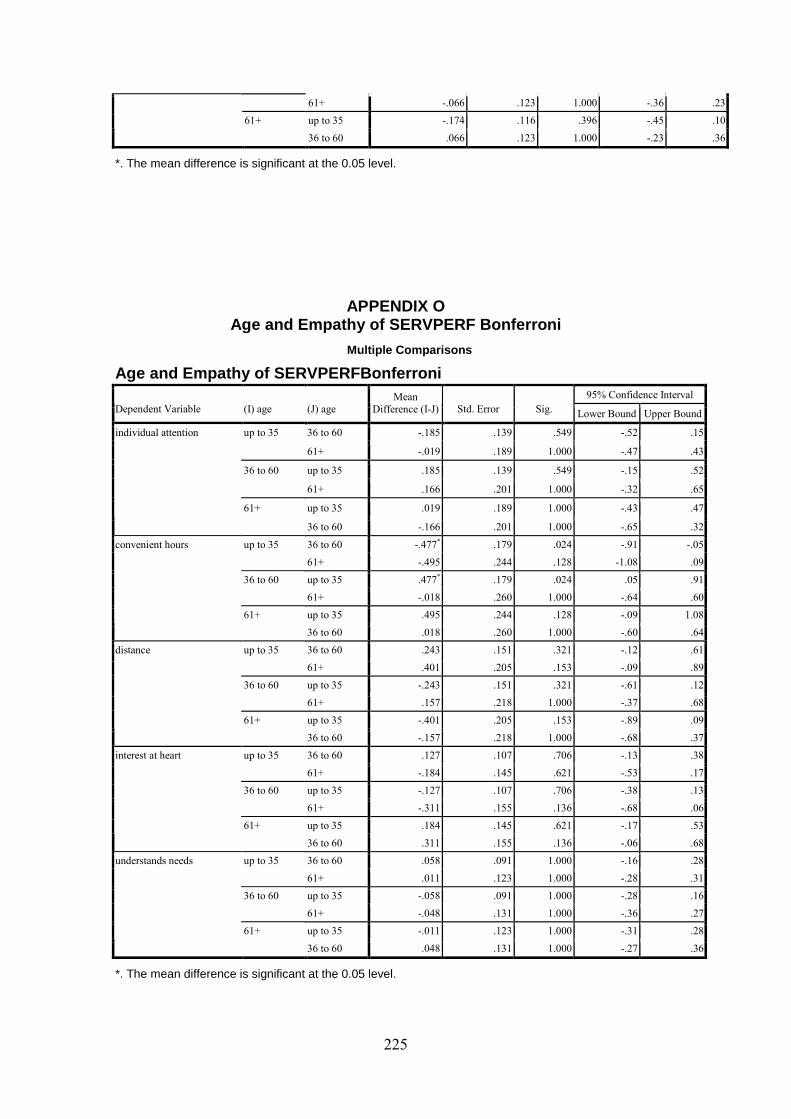
225
61+ -.066 .123 1.000 -.36 .23
up to 35 -.174 .116 .396 -.45 .10 61+
36 to 60 .066 .123 1.000 -.23 .36
*. The mean difference is significant at the 0.05 level.
APPENDIX O
Age and Empathy of SERVPERF Bonferroni
Multiple Comparisons
Age and Empathy of SERVPERFBonferroni 95% Confidence Interval
Dependent Variable (I) age (J) age Mean
Difference (I-J) Std. Error Sig. Lower Bound Upper Bound
36 to 60 -.185 .139 .549 -.52 .15 up to 35
61+ -.019 .189 1.000 -.47 .43
up to 35 .185 .139 .549 -.15 .52 36 to 60
61+ .166 .201 1.000 -.32 .65
up to 35 .019 .189 1.000 -.43 .47
individual attention
61+
36 to 60 -.166 .201 1.000 -.65 .32
36 to 60 -.477* .179 .024 -.91 -.05 up to 35
61+ -.495 .244 .128 -1.08 .09
up to 35 .477* .179 .024 .05 .91 36 to 60
61+ -.018 .260 1.000 -.64 .60
up to 35 .495 .244 .128 -.09 1.08
convenient hours
61+
36 to 60 .018 .260 1.000 -.60 .64
36 to 60 .243 .151 .321 -.12 .61 up to 35
61+ .401 .205 .153 -.09 .89
up to 35 -.243 .151 .321 -.61 .12 36 to 60
61+ .157 .218 1.000 -.37 .68
up to 35 -.401 .205 .153 -.89 .09
distance
61+
36 to 60 -.157 .218 1.000 -.68 .37
36 to 60 .127 .107 .706 -.13 .38 up to 35
61+ -.184 .145 .621 -.53 .17
up to 35 -.127 .107 .706 -.38 .13 36 to 60
61+ -.311 .155 .136 -.68 .06
up to 35 .184 .145 .621 -.17 .53
interest at heart
61+
36 to 60 .311 .155 .136 -.06 .68
36 to 60 .058 .091 1.000 -.16 .28 up to 35
61+ .011 .123 1.000 -.28 .31
up to 35 -.058 .091 1.000 -.28 .16 36 to 60
61+ -.048 .131 1.000 -.36 .27
up to 35 -.011 .123 1.000 -.31 .28
understands needs
61+
36 to 60 .048 .131 1.000 -.27 .36
*. The mean difference is significant at the 0.05 level.
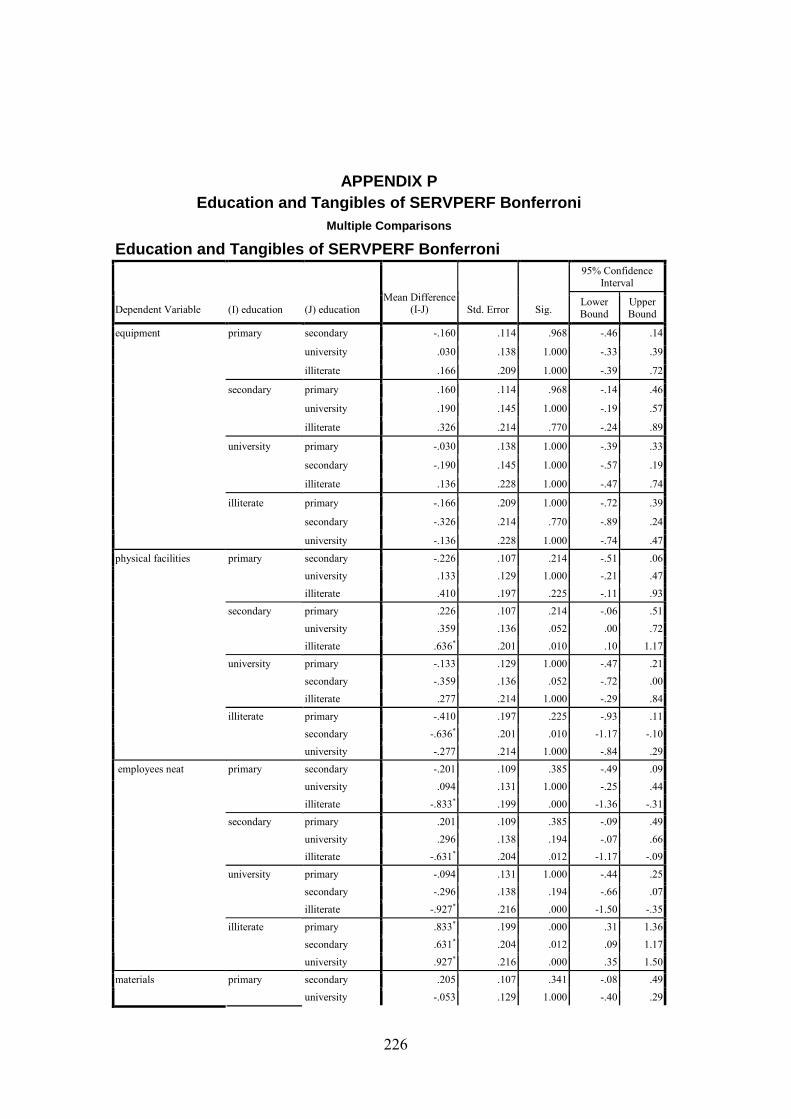
226
APPENDIX P Education and Tangibles of SERVPERF Bonferroni
Multiple Comparisons
Education and Tangibles of SERVPERF Bonferroni 95% Confidence
Interval
Dependent Variable (I) education (J) education
Mean Difference (I-J) Std. Error Sig.
Lower Bound
Upper Bound
secondary -.160 .114 .968 -.46 .14
university .030 .138 1.000 -.33 .39
primary
illiterate .166 .209 1.000 -.39 .72
primary .160 .114 .968 -.14 .46
university .190 .145 1.000 -.19 .57
secondary
illiterate .326 .214 .770 -.24 .89
primary -.030 .138 1.000 -.39 .33
secondary -.190 .145 1.000 -.57 .19
university
illiterate .136 .228 1.000 -.47 .74
primary -.166 .209 1.000 -.72 .39
secondary -.326 .214 .770 -.89 .24
equipment
illiterate
university -.136 .228 1.000 -.74 .47
secondary -.226 .107 .214 -.51 .06
university .133 .129 1.000 -.21 .47
primary
illiterate .410 .197 .225 -.11 .93
primary .226 .107 .214 -.06 .51
university .359 .136 .052 .00 .72
secondary
illiterate .636* .201 .010 .10 1.17
primary -.133 .129 1.000 -.47 .21
secondary -.359 .136 .052 -.72 .00
university
illiterate .277 .214 1.000 -.29 .84
primary -.410 .197 .225 -.93 .11
secondary -.636* .201 .010 -1.17 -.10
physical facilities
illiterate
university -.277 .214 1.000 -.84 .29
secondary -.201 .109 .385 -.49 .09
university .094 .131 1.000 -.25 .44
primary
illiterate -.833* .199 .000 -1.36 -.31
primary .201 .109 .385 -.09 .49
university .296 .138 .194 -.07 .66
secondary
illiterate -.631* .204 .012 -1.17 -.09
primary -.094 .131 1.000 -.44 .25
secondary -.296 .138 .194 -.66 .07
university
illiterate -.927* .216 .000 -1.50 -.35
primary .833* .199 .000 .31 1.36
secondary .631* .204 .012 .09 1.17
employees neat
illiterate
university .927* .216 .000 .35 1.50
secondary .205 .107 .341 -.08 .49 materials primary
university -.053 .129 1.000 -.40 .29
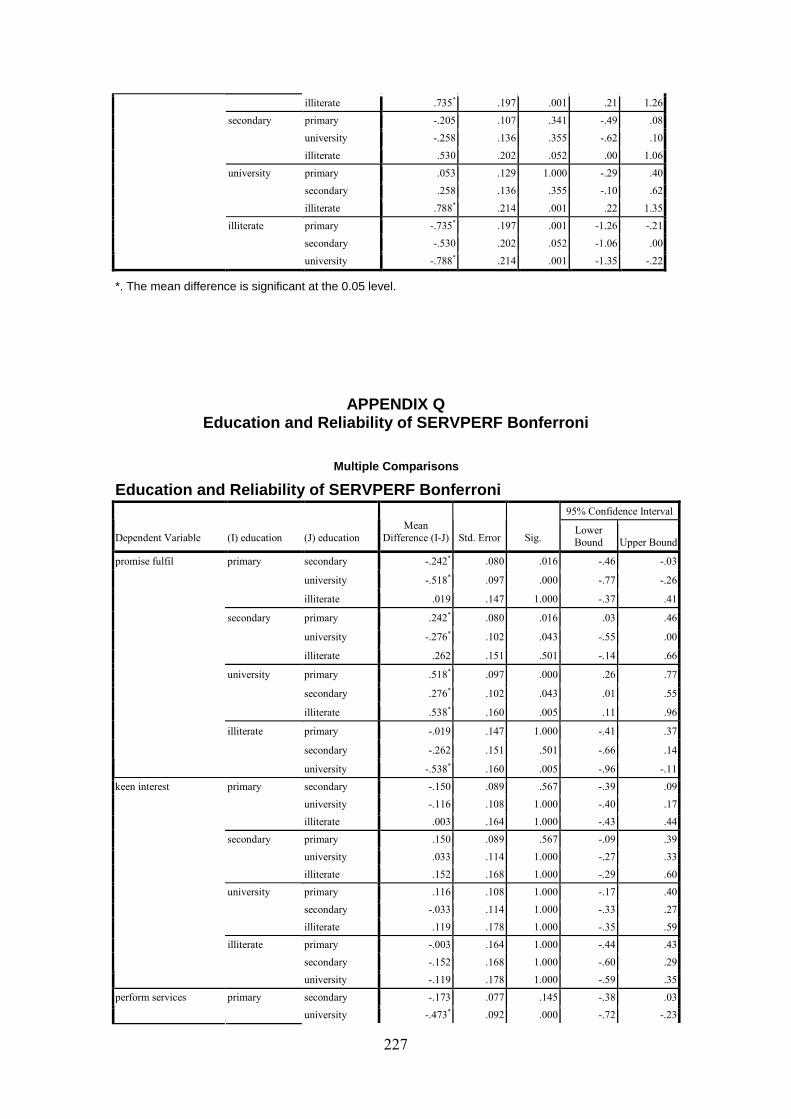
227
illiterate .735* .197 .001 .21 1.26
primary -.205 .107 .341 -.49 .08
university -.258 .136 .355 -.62 .10
secondary
illiterate .530 .202 .052 .00 1.06
primary .053 .129 1.000 -.29 .40
secondary .258 .136 .355 -.10 .62
university
illiterate .788* .214 .001 .22 1.35
primary -.735* .197 .001 -1.26 -.21
secondary -.530 .202 .052 -1.06 .00
illiterate
university -.788* .214 .001 -1.35 -.22
*. The mean difference is significant at the 0.05 level.
APPENDIX Q Education and Reliability of SERVPERF Bonferroni
Multiple Comparisons
Education and Reliability of SERVPERF Bonferroni 95% Confidence Interval
Dependent Variable (I) education (J) education
Mean
Difference (I-J) Std. Error Sig. Lower
Bound Upper Bound
secondary -.242* .080 .016 -.46 -.03
university -.518* .097 .000 -.77 -.26
primary
illiterate .019 .147 1.000 -.37 .41
primary .242* .080 .016 .03 .46
university -.276* .102 .043 -.55 .00
secondary
illiterate .262 .151 .501 -.14 .66
primary .518* .097 .000 .26 .77
secondary .276* .102 .043 .01 .55
university
illiterate .538* .160 .005 .11 .96
primary -.019 .147 1.000 -.41 .37
secondary -.262 .151 .501 -.66 .14
promise fulfil
illiterate
university -.538* .160 .005 -.96 -.11
secondary -.150 .089 .567 -.39 .09
university -.116 .108 1.000 -.40 .17
primary
illiterate .003 .164 1.000 -.43 .44
primary .150 .089 .567 -.09 .39
university .033 .114 1.000 -.27 .33
secondary
illiterate .152 .168 1.000 -.29 .60
primary .116 .108 1.000 -.17 .40
secondary -.033 .114 1.000 -.33 .27
university
illiterate .119 .178 1.000 -.35 .59
primary -.003 .164 1.000 -.44 .43
secondary -.152 .168 1.000 -.60 .29
keen interest
illiterate
university -.119 .178 1.000 -.59 .35
secondary -.173 .077 .145 -.38 .03 perform services primary
university -.473* .092 .000 -.72 -.23
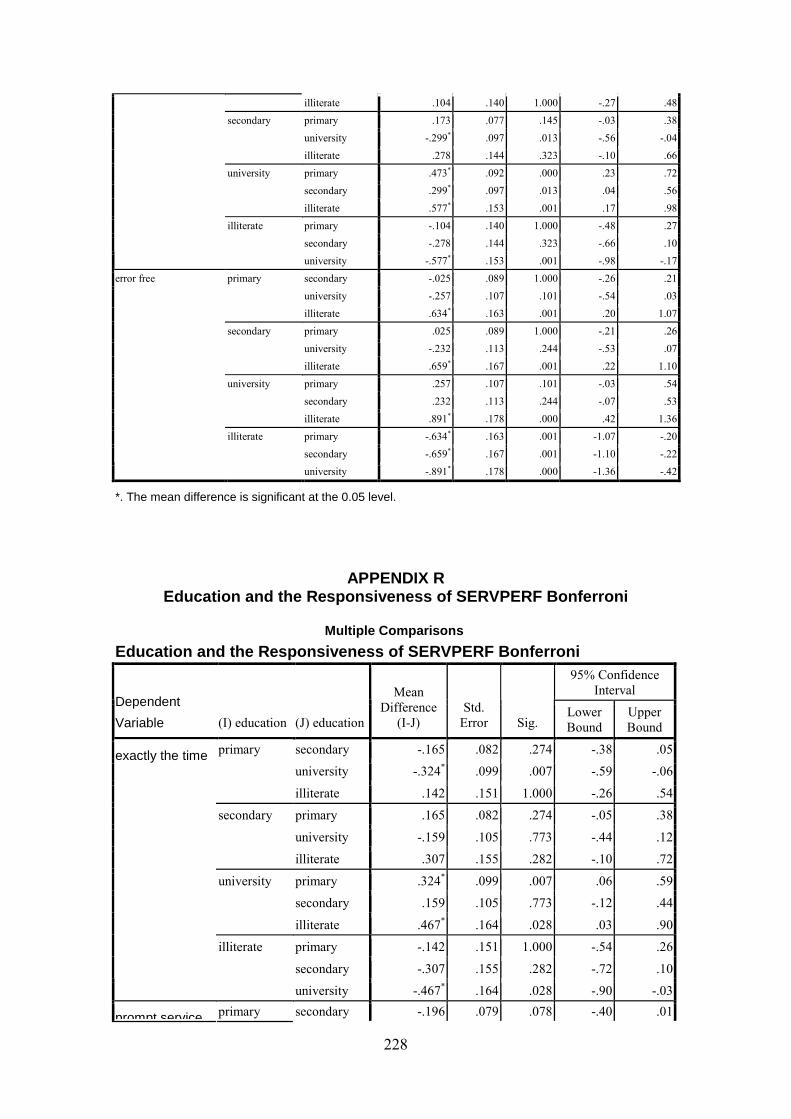
228
illiterate .104 .140 1.000 -.27 .48
primary .173 .077 .145 -.03 .38
university -.299* .097 .013 -.56 -.04
secondary
illiterate .278 .144 .323 -.10 .66
primary .473* .092 .000 .23 .72
secondary .299* .097 .013 .04 .56
university
illiterate .577* .153 .001 .17 .98
primary -.104 .140 1.000 -.48 .27
secondary -.278 .144 .323 -.66 .10
illiterate
university -.577* .153 .001 -.98 -.17
secondary -.025 .089 1.000 -.26 .21
university -.257 .107 .101 -.54 .03
primary
illiterate .634* .163 .001 .20 1.07
primary .025 .089 1.000 -.21 .26
university -.232 .113 .244 -.53 .07
secondary
illiterate .659* .167 .001 .22 1.10
primary .257 .107 .101 -.03 .54
secondary .232 .113 .244 -.07 .53
university
illiterate .891* .178 .000 .42 1.36
primary -.634* .163 .001 -1.07 -.20
secondary -.659* .167 .001 -1.10 -.22
error free
illiterate
university -.891* .178 .000 -1.36 -.42
*. The mean difference is significant at the 0.05 level.
APPENDIX R
Education and the Responsiveness of SERVPERF Bonfer roni
Multiple Comparisons
Education and the Responsiveness of SERVPERF Bonfer roni 95% Confidence
Interval Dependent
Variable (I) education (J) education
Mean
Difference
(I-J)
Std.
Error Sig. Lower
Bound
Upper
Bound
secondary -.165 .082 .274 -.38 .05
university -.324* .099 .007 -.59 -.06
primary
illiterate .142 .151 1.000 -.26 .54
primary .165 .082 .274 -.05 .38
university -.159 .105 .773 -.44 .12
secondary
illiterate .307 .155 .282 -.10 .72
primary .324* .099 .007 .06 .59
secondary .159 .105 .773 -.12 .44
university
illiterate .467* .164 .028 .03 .90
primary -.142 .151 1.000 -.54 .26
secondary -.307 .155 .282 -.72 .10
exactly the time
illiterate
university -.467* .164 .028 -.90 -.03
prompt service primary secondary -.196 .079 .078 -.40 .01
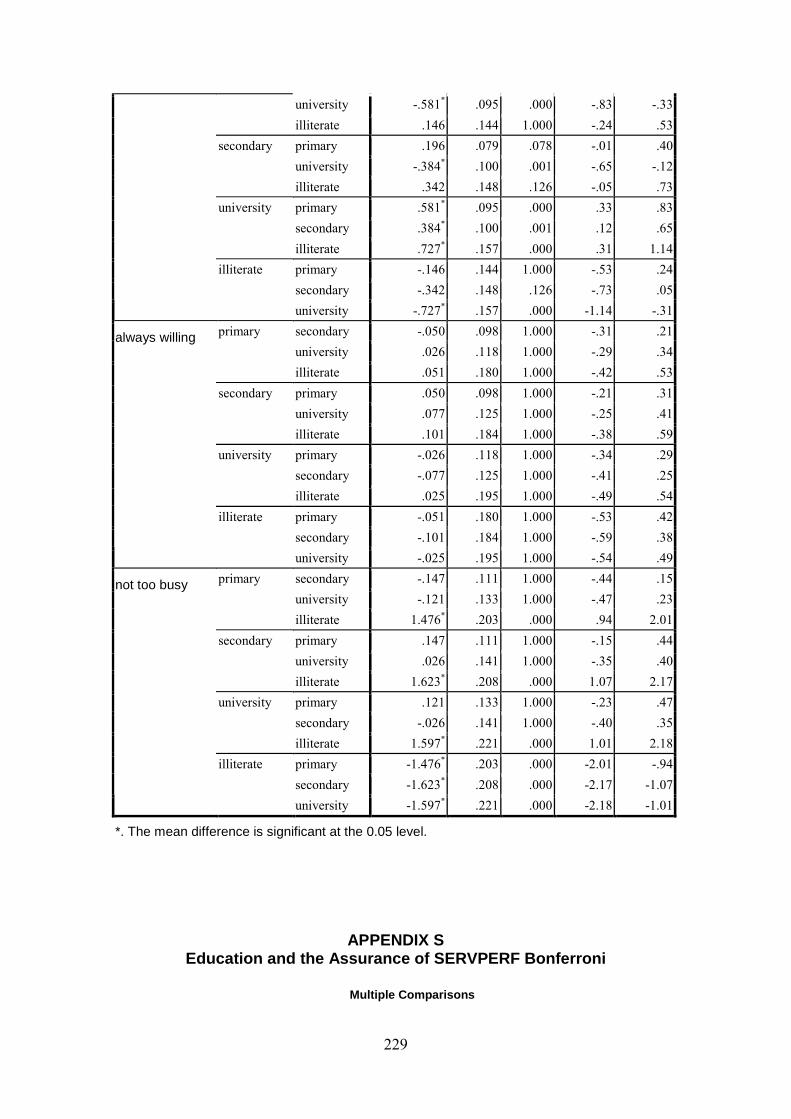
229
university -.581* .095 .000 -.83 -.33
illiterate .146 .144 1.000 -.24 .53
primary .196 .079 .078 -.01 .40
university -.384* .100 .001 -.65 -.12
secondary
illiterate .342 .148 .126 -.05 .73
primary .581* .095 .000 .33 .83
secondary .384* .100 .001 .12 .65
university
illiterate .727* .157 .000 .31 1.14
primary -.146 .144 1.000 -.53 .24
secondary -.342 .148 .126 -.73 .05
illiterate
university -.727* .157 .000 -1.14 -.31
secondary -.050 .098 1.000 -.31 .21
university .026 .118 1.000 -.29 .34
primary
illiterate .051 .180 1.000 -.42 .53
primary .050 .098 1.000 -.21 .31
university .077 .125 1.000 -.25 .41
secondary
illiterate .101 .184 1.000 -.38 .59
primary -.026 .118 1.000 -.34 .29
secondary -.077 .125 1.000 -.41 .25
university
illiterate .025 .195 1.000 -.49 .54
primary -.051 .180 1.000 -.53 .42
secondary -.101 .184 1.000 -.59 .38
always willing
illiterate
university -.025 .195 1.000 -.54 .49
secondary -.147 .111 1.000 -.44 .15
university -.121 .133 1.000 -.47 .23
primary
illiterate 1.476* .203 .000 .94 2.01
primary .147 .111 1.000 -.15 .44
university .026 .141 1.000 -.35 .40
secondary
illiterate 1.623* .208 .000 1.07 2.17
primary .121 .133 1.000 -.23 .47
secondary -.026 .141 1.000 -.40 .35
university
illiterate 1.597* .221 .000 1.01 2.18
primary -1.476* .203 .000 -2.01 -.94
secondary -1.623* .208 .000 -2.17 -1.07
not too busy
illiterate
university -1.597* .221 .000 -2.18 -1.01
*. The mean difference is significant at the 0.05 level.
APPENDIX S Education and the Assurance of SERVPERF Bonferroni
Multiple Comparisons
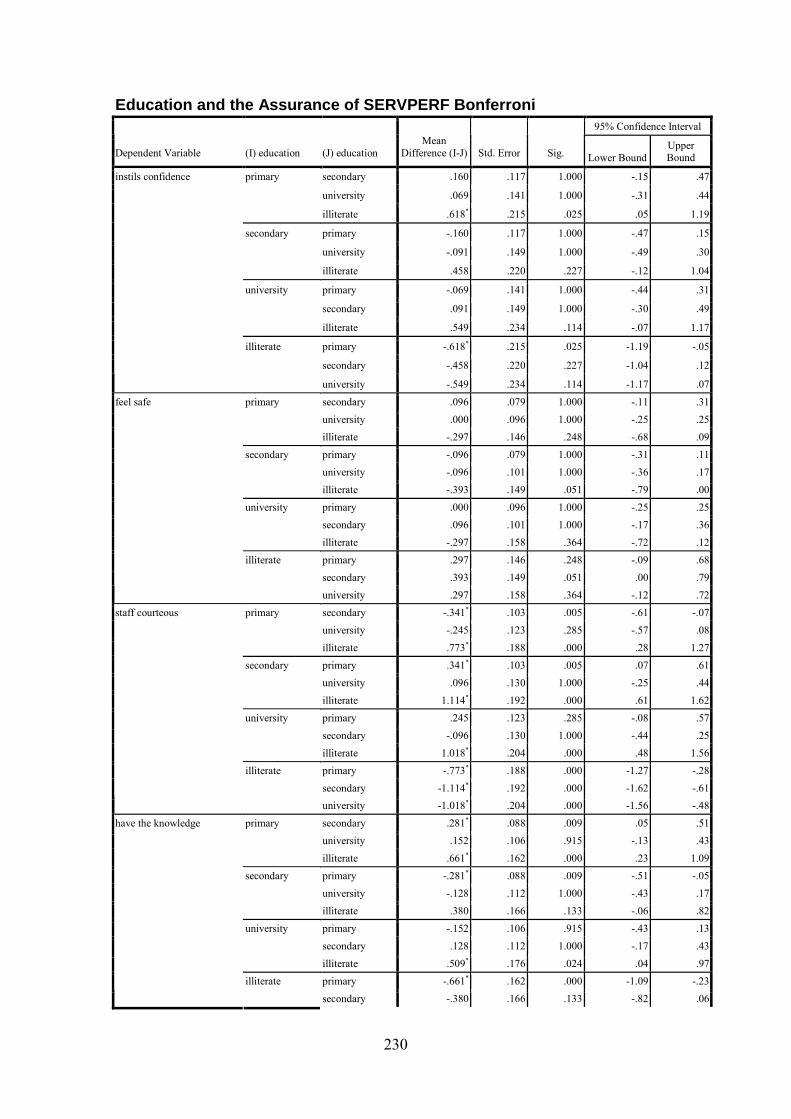
230
Education and the Assurance of SERVPERF Bonferroni 95% Confidence Interval
Dependent Variable (I) education (J) education
Mean
Difference (I-J) Std. Error Sig. Lower Bound
Upper Bound
secondary .160 .117 1.000 -.15 .47
university .069 .141 1.000 -.31 .44
primary
illiterate .618* .215 .025 .05 1.19
primary -.160 .117 1.000 -.47 .15
university -.091 .149 1.000 -.49 .30
secondary
illiterate .458 .220 .227 -.12 1.04
primary -.069 .141 1.000 -.44 .31
secondary .091 .149 1.000 -.30 .49
university
illiterate .549 .234 .114 -.07 1.17
primary -.618* .215 .025 -1.19 -.05
secondary -.458 .220 .227 -1.04 .12
instils confidence
illiterate
university -.549 .234 .114 -1.17 .07
secondary .096 .079 1.000 -.11 .31
university .000 .096 1.000 -.25 .25
primary
illiterate -.297 .146 .248 -.68 .09
primary -.096 .079 1.000 -.31 .11
university -.096 .101 1.000 -.36 .17
secondary
illiterate -.393 .149 .051 -.79 .00
primary .000 .096 1.000 -.25 .25
secondary .096 .101 1.000 -.17 .36
university
illiterate -.297 .158 .364 -.72 .12
primary .297 .146 .248 -.09 .68
secondary .393 .149 .051 .00 .79
feel safe
illiterate
university .297 .158 .364 -.12 .72
secondary -.341* .103 .005 -.61 -.07
university -.245 .123 .285 -.57 .08
primary
illiterate .773* .188 .000 .28 1.27
primary .341* .103 .005 .07 .61
university .096 .130 1.000 -.25 .44
secondary
illiterate 1.114* .192 .000 .61 1.62
primary .245 .123 .285 -.08 .57
secondary -.096 .130 1.000 -.44 .25
university
illiterate 1.018* .204 .000 .48 1.56
primary -.773* .188 .000 -1.27 -.28
secondary -1.114* .192 .000 -1.62 -.61
staff courteous
illiterate
university -1.018* .204 .000 -1.56 -.48
secondary .281* .088 .009 .05 .51
university .152 .106 .915 -.13 .43
primary
illiterate .661* .162 .000 .23 1.09
primary -.281* .088 .009 -.51 -.05
university -.128 .112 1.000 -.43 .17
secondary
illiterate .380 .166 .133 -.06 .82
primary -.152 .106 .915 -.43 .13
secondary .128 .112 1.000 -.17 .43
university
illiterate .509* .176 .024 .04 .97
primary -.661* .162 .000 -1.09 -.23
have the knowledge
illiterate
secondary -.380 .166 .133 -.82 .06
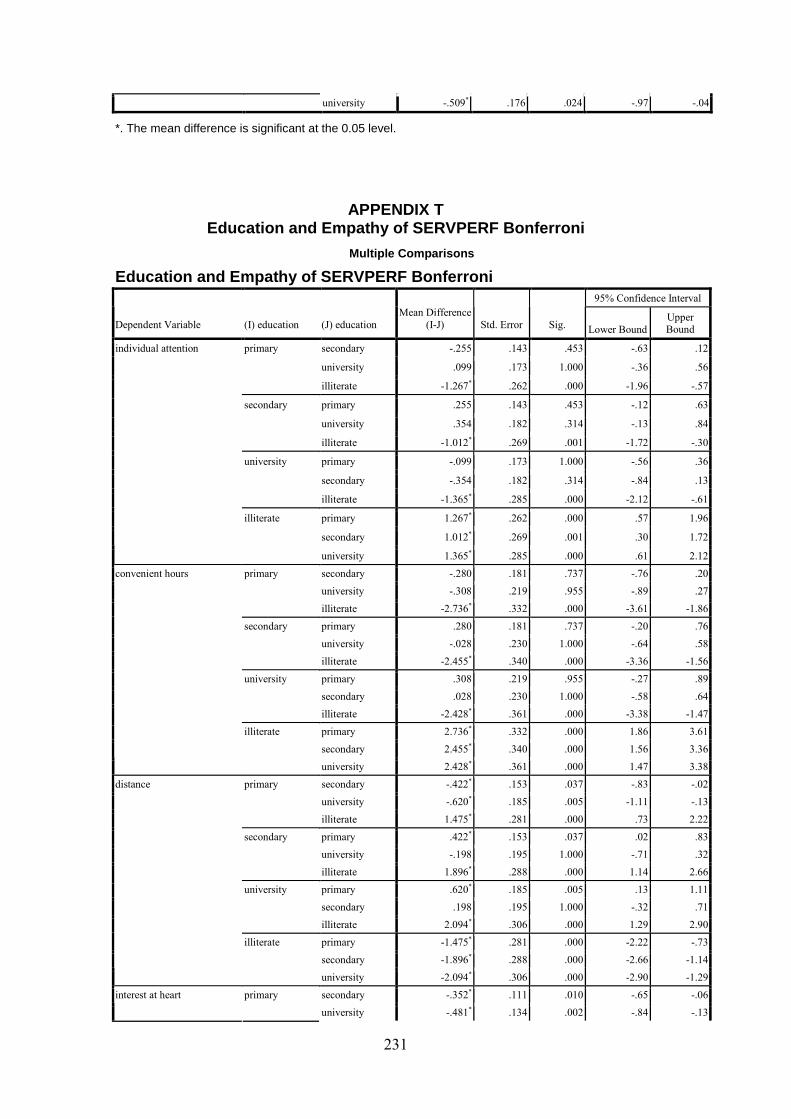
231
university -.509* .176 .024 -.97 -.04
*. The mean difference is significant at the 0.05 level.
APPENDIX T Education and Empathy of SERVPERF Bonferroni
Multiple Comparisons
Education and Empathy of SERVPERF Bonferroni 95% Confidence Interval
Dependent Variable (I) education (J) education
Mean Difference
(I-J) Std. Error Sig. Lower Bound
Upper Bound
secondary -.255 .143 .453 -.63 .12
university .099 .173 1.000 -.36 .56
primary
illiterate -1.267* .262 .000 -1.96 -.57
primary .255 .143 .453 -.12 .63
university .354 .182 .314 -.13 .84
secondary
illiterate -1.012* .269 .001 -1.72 -.30
primary -.099 .173 1.000 -.56 .36
secondary -.354 .182 .314 -.84 .13
university
illiterate -1.365* .285 .000 -2.12 -.61
primary 1.267* .262 .000 .57 1.96
secondary 1.012* .269 .001 .30 1.72
individual attention
illiterate
university 1.365* .285 .000 .61 2.12
secondary -.280 .181 .737 -.76 .20
university -.308 .219 .955 -.89 .27
primary
illiterate -2.736* .332 .000 -3.61 -1.86
primary .280 .181 .737 -.20 .76
university -.028 .230 1.000 -.64 .58
secondary
illiterate -2.455* .340 .000 -3.36 -1.56
primary .308 .219 .955 -.27 .89
secondary .028 .230 1.000 -.58 .64
university
illiterate -2.428* .361 .000 -3.38 -1.47
primary 2.736* .332 .000 1.86 3.61
secondary 2.455* .340 .000 1.56 3.36
convenient hours
illiterate
university 2.428* .361 .000 1.47 3.38
secondary -.422* .153 .037 -.83 -.02
university -.620* .185 .005 -1.11 -.13
primary
illiterate 1.475* .281 .000 .73 2.22
primary .422* .153 .037 .02 .83
university -.198 .195 1.000 -.71 .32
secondary
illiterate 1.896* .288 .000 1.14 2.66
primary .620* .185 .005 .13 1.11
secondary .198 .195 1.000 -.32 .71
university
illiterate 2.094* .306 .000 1.29 2.90
primary -1.475* .281 .000 -2.22 -.73
secondary -1.896* .288 .000 -2.66 -1.14
distance
illiterate
university -2.094* .306 .000 -2.90 -1.29
secondary -.352* .111 .010 -.65 -.06 interest at heart primary
university -.481* .134 .002 -.84 -.13
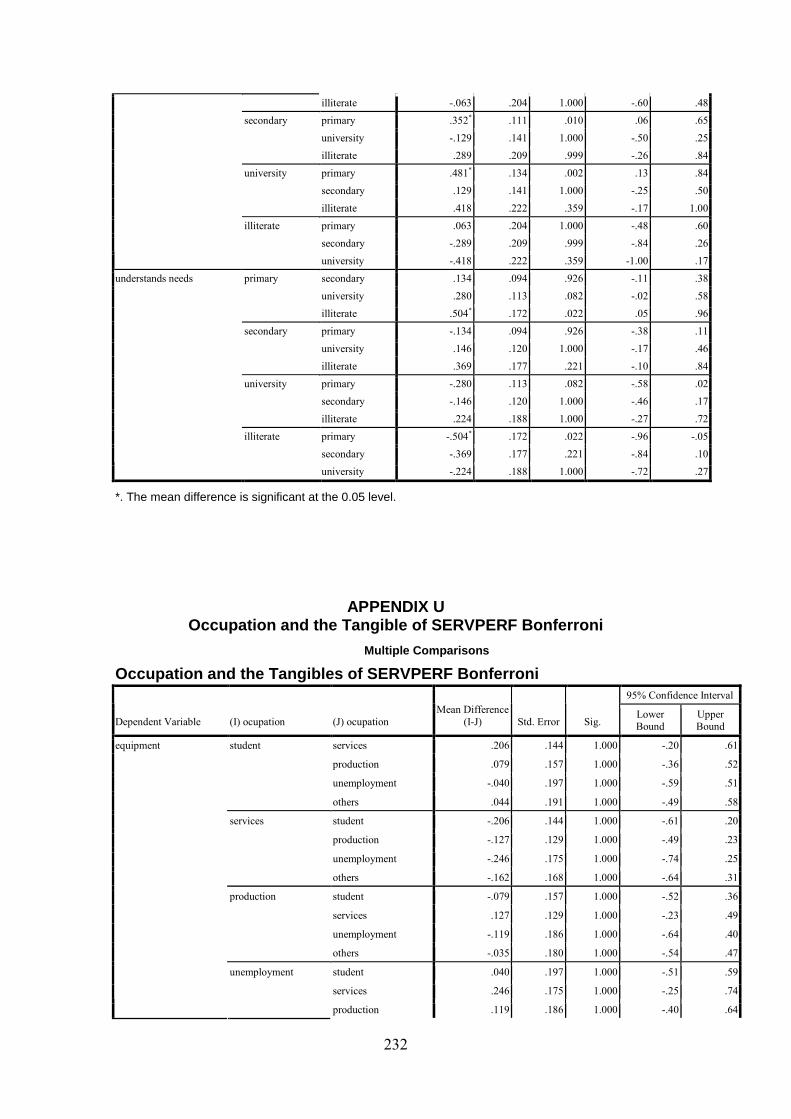
232
illiterate -.063 .204 1.000 -.60 .48
primary .352* .111 .010 .06 .65
university -.129 .141 1.000 -.50 .25
secondary
illiterate .289 .209 .999 -.26 .84
primary .481* .134 .002 .13 .84
secondary .129 .141 1.000 -.25 .50
university
illiterate .418 .222 .359 -.17 1.00
primary .063 .204 1.000 -.48 .60
secondary -.289 .209 .999 -.84 .26
illiterate
university -.418 .222 .359 -1.00 .17
secondary .134 .094 .926 -.11 .38
university .280 .113 .082 -.02 .58
primary
illiterate .504* .172 .022 .05 .96
primary -.134 .094 .926 -.38 .11
university .146 .120 1.000 -.17 .46
secondary
illiterate .369 .177 .221 -.10 .84
primary -.280 .113 .082 -.58 .02
secondary -.146 .120 1.000 -.46 .17
university
illiterate .224 .188 1.000 -.27 .72
primary -.504* .172 .022 -.96 -.05
secondary -.369 .177 .221 -.84 .10
understands needs
illiterate
university -.224 .188 1.000 -.72 .27
*. The mean difference is significant at the 0.05 level.
APPENDIX U Occupation and the Tangible of SERVPERF Bonferroni
Multiple Comparisons
Occupation and the Tangibles of SERVPERF Bonferroni 95% Confidence Interval
Dependent Variable (I) ocupation (J) ocupation
Mean Difference
(I-J) Std. Error Sig. Lower Bound
Upper Bound
services .206 .144 1.000 -.20 .61
production .079 .157 1.000 -.36 .52
unemployment -.040 .197 1.000 -.59 .51
student
others .044 .191 1.000 -.49 .58
student -.206 .144 1.000 -.61 .20
production -.127 .129 1.000 -.49 .23
unemployment -.246 .175 1.000 -.74 .25
services
others -.162 .168 1.000 -.64 .31
student -.079 .157 1.000 -.52 .36
services .127 .129 1.000 -.23 .49
unemployment -.119 .186 1.000 -.64 .40
production
others -.035 .180 1.000 -.54 .47
student .040 .197 1.000 -.51 .59
services .246 .175 1.000 -.25 .74
equipment
unemployment
production .119 .186 1.000 -.40 .64
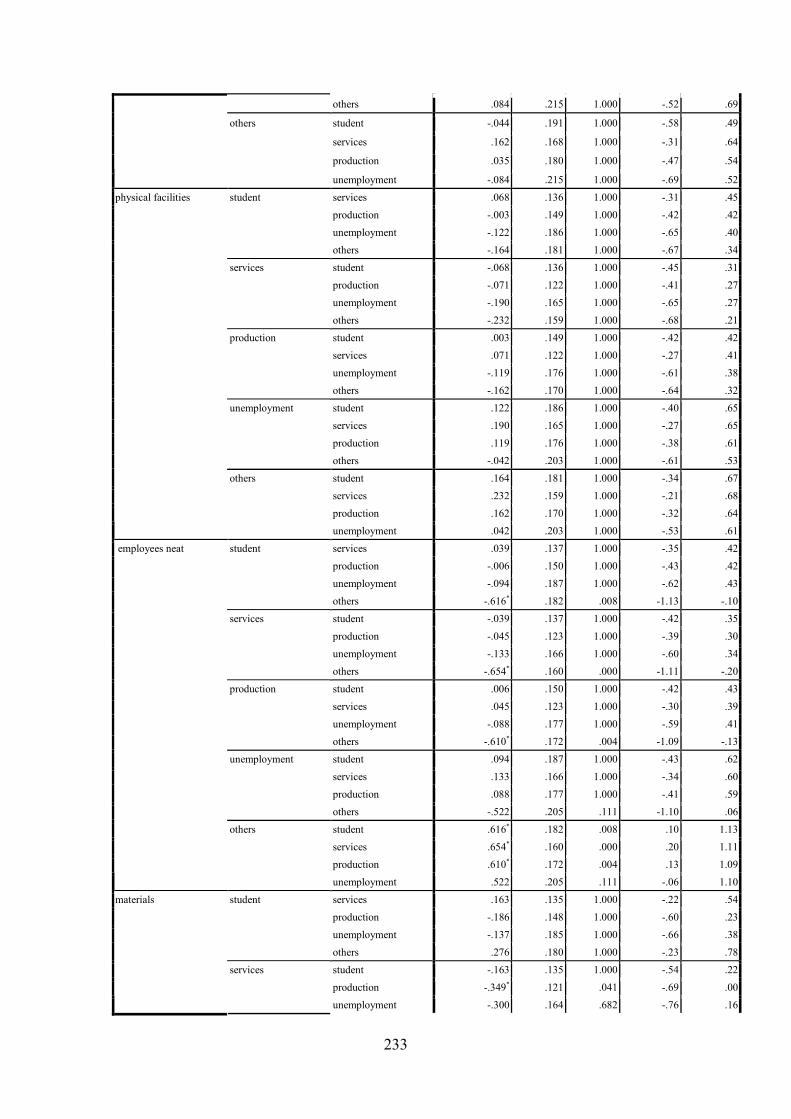
233
others .084 .215 1.000 -.52 .69
student -.044 .191 1.000 -.58 .49
services .162 .168 1.000 -.31 .64
production .035 .180 1.000 -.47 .54
others
unemployment -.084 .215 1.000 -.69 .52
services .068 .136 1.000 -.31 .45
production -.003 .149 1.000 -.42 .42
unemployment -.122 .186 1.000 -.65 .40
student
others -.164 .181 1.000 -.67 .34
student -.068 .136 1.000 -.45 .31
production -.071 .122 1.000 -.41 .27
unemployment -.190 .165 1.000 -.65 .27
services
others -.232 .159 1.000 -.68 .21
student .003 .149 1.000 -.42 .42
services .071 .122 1.000 -.27 .41
unemployment -.119 .176 1.000 -.61 .38
production
others -.162 .170 1.000 -.64 .32
student .122 .186 1.000 -.40 .65
services .190 .165 1.000 -.27 .65
production .119 .176 1.000 -.38 .61
unemployment
others -.042 .203 1.000 -.61 .53
student .164 .181 1.000 -.34 .67
services .232 .159 1.000 -.21 .68
production .162 .170 1.000 -.32 .64
physical facilities
others
unemployment .042 .203 1.000 -.53 .61
services .039 .137 1.000 -.35 .42
production -.006 .150 1.000 -.43 .42
unemployment -.094 .187 1.000 -.62 .43
student
others -.616* .182 .008 -1.13 -.10
student -.039 .137 1.000 -.42 .35
production -.045 .123 1.000 -.39 .30
unemployment -.133 .166 1.000 -.60 .34
services
others -.654* .160 .000 -1.11 -.20
student .006 .150 1.000 -.42 .43
services .045 .123 1.000 -.30 .39
unemployment -.088 .177 1.000 -.59 .41
production
others -.610* .172 .004 -1.09 -.13
student .094 .187 1.000 -.43 .62
services .133 .166 1.000 -.34 .60
production .088 .177 1.000 -.41 .59
unemployment
others -.522 .205 .111 -1.10 .06
student .616* .182 .008 .10 1.13
services .654* .160 .000 .20 1.11
production .610* .172 .004 .13 1.09
employees neat
others
unemployment .522 .205 .111 -.06 1.10
services .163 .135 1.000 -.22 .54
production -.186 .148 1.000 -.60 .23
unemployment -.137 .185 1.000 -.66 .38
student
others .276 .180 1.000 -.23 .78
student -.163 .135 1.000 -.54 .22
production -.349* .121 .041 -.69 .00
materials
services
unemployment -.300 .164 .682 -.76 .16
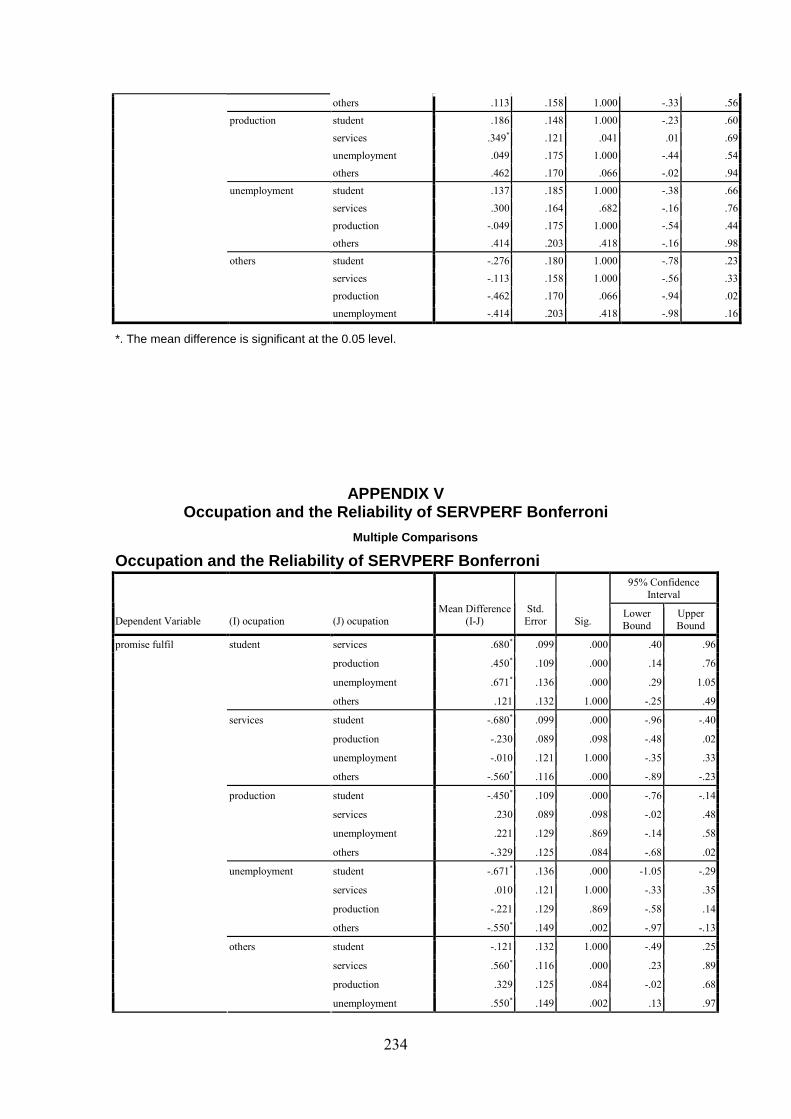
234
others .113 .158 1.000 -.33 .56
student .186 .148 1.000 -.23 .60
services .349* .121 .041 .01 .69
unemployment .049 .175 1.000 -.44 .54
production
others .462 .170 .066 -.02 .94
student .137 .185 1.000 -.38 .66
services .300 .164 .682 -.16 .76
production -.049 .175 1.000 -.54 .44
unemployment
others .414 .203 .418 -.16 .98
student -.276 .180 1.000 -.78 .23
services -.113 .158 1.000 -.56 .33
production -.462 .170 .066 -.94 .02
others
unemployment -.414 .203 .418 -.98 .16
*. The mean difference is significant at the 0.05 level.
APPENDIX V Occupation and the Reliability of SERVPERF Bonferro ni
Multiple Comparisons
Occupation and the Reliability of SERVPERF Bonferro ni 95% Confidence
Interval
Dependent Variable (I) ocupation (J) ocupation
Mean Difference
(I-J)
Std.
Error Sig. Lower
Bound
Upper
Bound
services .680* .099 .000 .40 .96
production .450* .109 .000 .14 .76
unemployment .671* .136 .000 .29 1.05
student
others .121 .132 1.000 -.25 .49
student -.680* .099 .000 -.96 -.40
production -.230 .089 .098 -.48 .02
unemployment -.010 .121 1.000 -.35 .33
services
others -.560* .116 .000 -.89 -.23
student -.450* .109 .000 -.76 -.14
services .230 .089 .098 -.02 .48
unemployment .221 .129 .869 -.14 .58
production
others -.329 .125 .084 -.68 .02
student -.671* .136 .000 -1.05 -.29
services .010 .121 1.000 -.33 .35
production -.221 .129 .869 -.58 .14
unemployment
others -.550* .149 .002 -.97 -.13
student -.121 .132 1.000 -.49 .25
services .560* .116 .000 .23 .89
production .329 .125 .084 -.02 .68
promise fulfil
others
unemployment .550* .149 .002 .13 .97
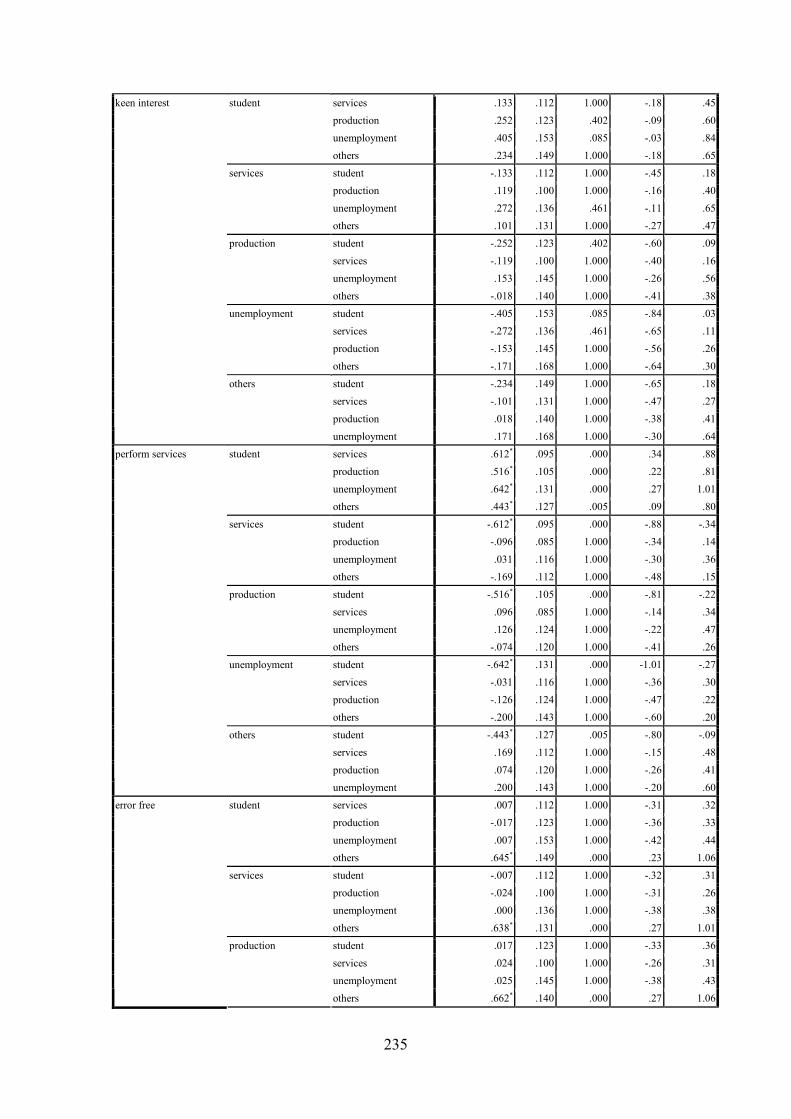
235
services .133 .112 1.000 -.18 .45
production .252 .123 .402 -.09 .60
unemployment .405 .153 .085 -.03 .84
student
others .234 .149 1.000 -.18 .65
student -.133 .112 1.000 -.45 .18
production .119 .100 1.000 -.16 .40
unemployment .272 .136 .461 -.11 .65
services
others .101 .131 1.000 -.27 .47
student -.252 .123 .402 -.60 .09
services -.119 .100 1.000 -.40 .16
unemployment .153 .145 1.000 -.26 .56
production
others -.018 .140 1.000 -.41 .38
student -.405 .153 .085 -.84 .03
services -.272 .136 .461 -.65 .11
production -.153 .145 1.000 -.56 .26
unemployment
others -.171 .168 1.000 -.64 .30
student -.234 .149 1.000 -.65 .18
services -.101 .131 1.000 -.47 .27
production .018 .140 1.000 -.38 .41
keen interest
others
unemployment .171 .168 1.000 -.30 .64
services .612* .095 .000 .34 .88
production .516* .105 .000 .22 .81
unemployment .642* .131 .000 .27 1.01
student
others .443* .127 .005 .09 .80
student -.612* .095 .000 -.88 -.34
production -.096 .085 1.000 -.34 .14
unemployment .031 .116 1.000 -.30 .36
services
others -.169 .112 1.000 -.48 .15
student -.516* .105 .000 -.81 -.22
services .096 .085 1.000 -.14 .34
unemployment .126 .124 1.000 -.22 .47
production
others -.074 .120 1.000 -.41 .26
student -.642* .131 .000 -1.01 -.27
services -.031 .116 1.000 -.36 .30
production -.126 .124 1.000 -.47 .22
unemployment
others -.200 .143 1.000 -.60 .20
student -.443* .127 .005 -.80 -.09
services .169 .112 1.000 -.15 .48
production .074 .120 1.000 -.26 .41
perform services
others
unemployment .200 .143 1.000 -.20 .60
services .007 .112 1.000 -.31 .32
production -.017 .123 1.000 -.36 .33
unemployment .007 .153 1.000 -.42 .44
student
others .645* .149 .000 .23 1.06
student -.007 .112 1.000 -.32 .31
production -.024 .100 1.000 -.31 .26
unemployment .000 .136 1.000 -.38 .38
services
others .638* .131 .000 .27 1.01
student .017 .123 1.000 -.33 .36
services .024 .100 1.000 -.26 .31
unemployment .025 .145 1.000 -.38 .43
error free
production
others .662* .140 .000 .27 1.06
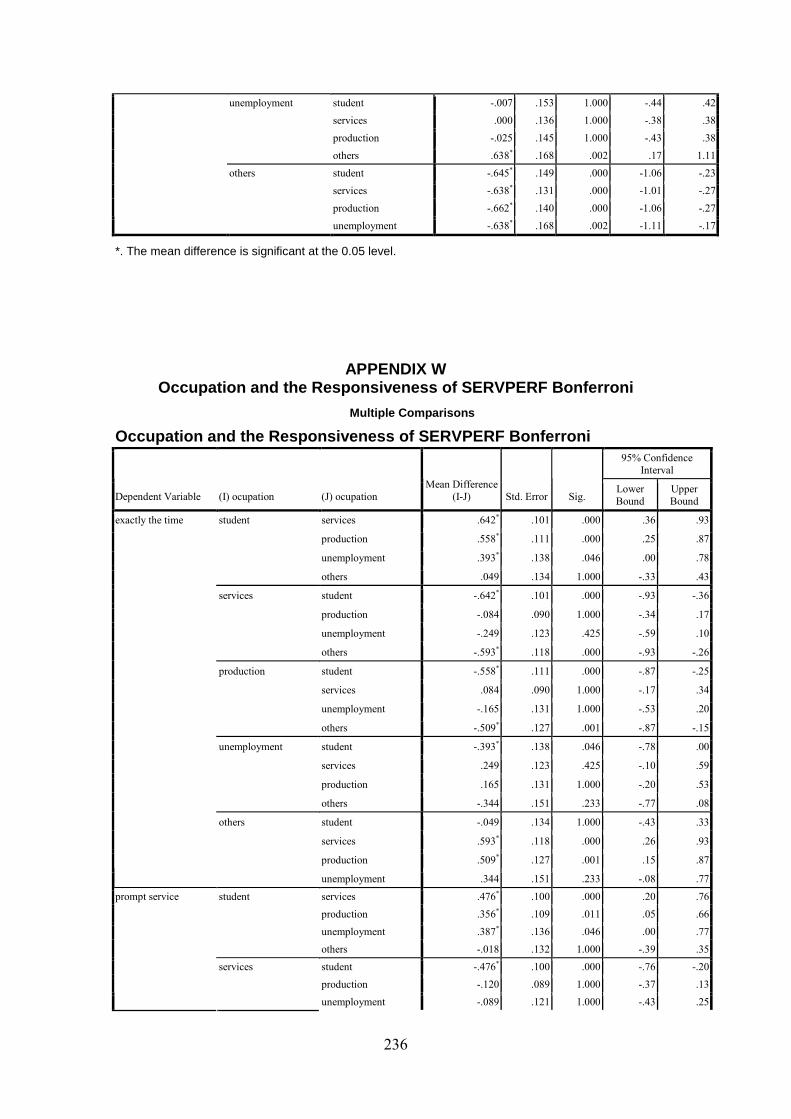
236
student -.007 .153 1.000 -.44 .42
services .000 .136 1.000 -.38 .38
production -.025 .145 1.000 -.43 .38
unemployment
others .638* .168 .002 .17 1.11
student -.645* .149 .000 -1.06 -.23
services -.638* .131 .000 -1.01 -.27
production -.662* .140 .000 -1.06 -.27
others
unemployment -.638* .168 .002 -1.11 -.17
*. The mean difference is significant at the 0.05 level.
APPENDIX W Occupation and the Responsiveness of SERVPERF Bonfe rroni
Multiple Comparisons
Occupation and the Responsiveness of SERVPERF Bonfe rroni 95% Confidence
Interval
Dependent Variable (I) ocupation (J) ocupation
Mean Difference
(I-J) Std. Error Sig. Lower
Bound
Upper
Bound
services .642* .101 .000 .36 .93
production .558* .111 .000 .25 .87
unemployment .393* .138 .046 .00 .78
student
others .049 .134 1.000 -.33 .43
student -.642* .101 .000 -.93 -.36
production -.084 .090 1.000 -.34 .17
unemployment -.249 .123 .425 -.59 .10
services
others -.593* .118 .000 -.93 -.26
student -.558* .111 .000 -.87 -.25
services .084 .090 1.000 -.17 .34
unemployment -.165 .131 1.000 -.53 .20
production
others -.509* .127 .001 -.87 -.15
student -.393* .138 .046 -.78 .00
services .249 .123 .425 -.10 .59
production .165 .131 1.000 -.20 .53
unemployment
others -.344 .151 .233 -.77 .08
student -.049 .134 1.000 -.43 .33
services .593* .118 .000 .26 .93
production .509* .127 .001 .15 .87
exactly the time
others
unemployment .344 .151 .233 -.08 .77
services .476* .100 .000 .20 .76
production .356* .109 .011 .05 .66
unemployment .387* .136 .046 .00 .77
student
others -.018 .132 1.000 -.39 .35
student -.476* .100 .000 -.76 -.20
production -.120 .089 1.000 -.37 .13
prompt service
services
unemployment -.089 .121 1.000 -.43 .25
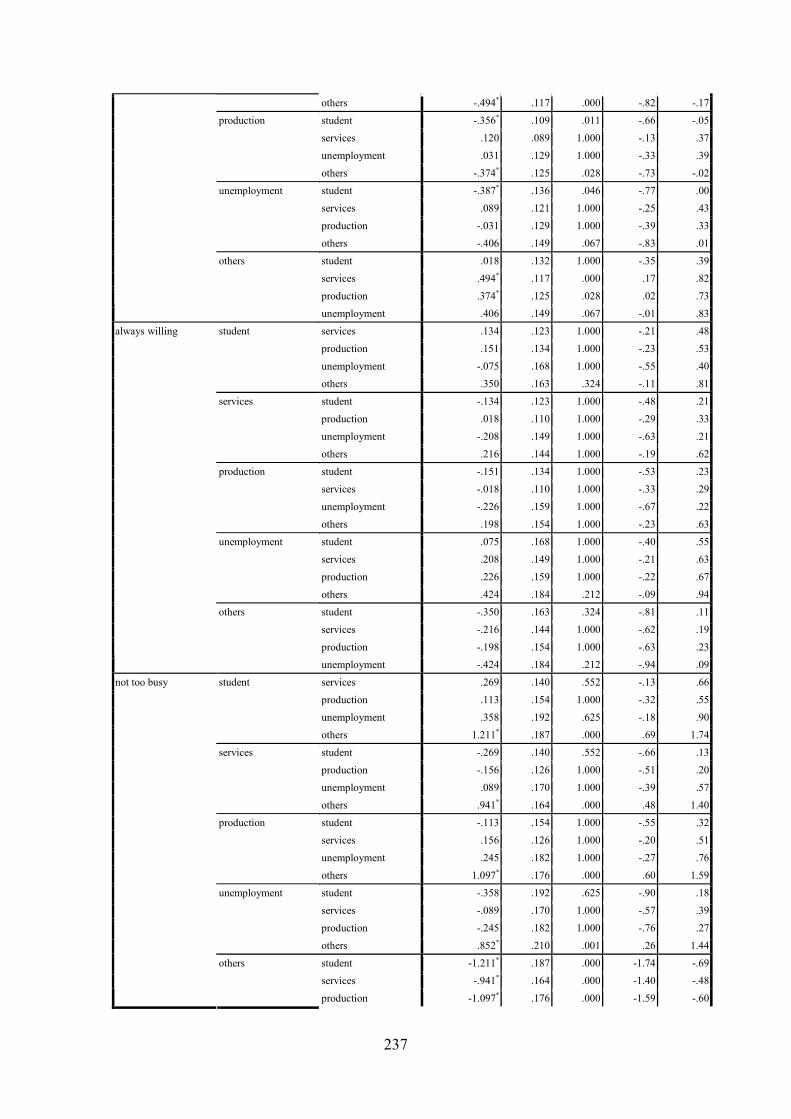
237
others -.494* .117 .000 -.82 -.17
student -.356* .109 .011 -.66 -.05
services .120 .089 1.000 -.13 .37
unemployment .031 .129 1.000 -.33 .39
production
others -.374* .125 .028 -.73 -.02
student -.387* .136 .046 -.77 .00
services .089 .121 1.000 -.25 .43
production -.031 .129 1.000 -.39 .33
unemployment
others -.406 .149 .067 -.83 .01
student .018 .132 1.000 -.35 .39
services .494* .117 .000 .17 .82
production .374* .125 .028 .02 .73
others
unemployment .406 .149 .067 -.01 .83
services .134 .123 1.000 -.21 .48
production .151 .134 1.000 -.23 .53
unemployment -.075 .168 1.000 -.55 .40
student
others .350 .163 .324 -.11 .81
student -.134 .123 1.000 -.48 .21
production .018 .110 1.000 -.29 .33
unemployment -.208 .149 1.000 -.63 .21
services
others .216 .144 1.000 -.19 .62
student -.151 .134 1.000 -.53 .23
services -.018 .110 1.000 -.33 .29
unemployment -.226 .159 1.000 -.67 .22
production
others .198 .154 1.000 -.23 .63
student .075 .168 1.000 -.40 .55
services .208 .149 1.000 -.21 .63
production .226 .159 1.000 -.22 .67
unemployment
others .424 .184 .212 -.09 .94
student -.350 .163 .324 -.81 .11
services -.216 .144 1.000 -.62 .19
production -.198 .154 1.000 -.63 .23
always willing
others
unemployment -.424 .184 .212 -.94 .09
services .269 .140 .552 -.13 .66
production .113 .154 1.000 -.32 .55
unemployment .358 .192 .625 -.18 .90
student
others 1.211* .187 .000 .69 1.74
student -.269 .140 .552 -.66 .13
production -.156 .126 1.000 -.51 .20
unemployment .089 .170 1.000 -.39 .57
services
others .941* .164 .000 .48 1.40
student -.113 .154 1.000 -.55 .32
services .156 .126 1.000 -.20 .51
unemployment .245 .182 1.000 -.27 .76
production
others 1.097* .176 .000 .60 1.59
student -.358 .192 .625 -.90 .18
services -.089 .170 1.000 -.57 .39
production -.245 .182 1.000 -.76 .27
unemployment
others .852* .210 .001 .26 1.44
student -1.211* .187 .000 -1.74 -.69
services -.941* .164 .000 -1.40 -.48
not too busy
others
production -1.097* .176 .000 -1.59 -.60
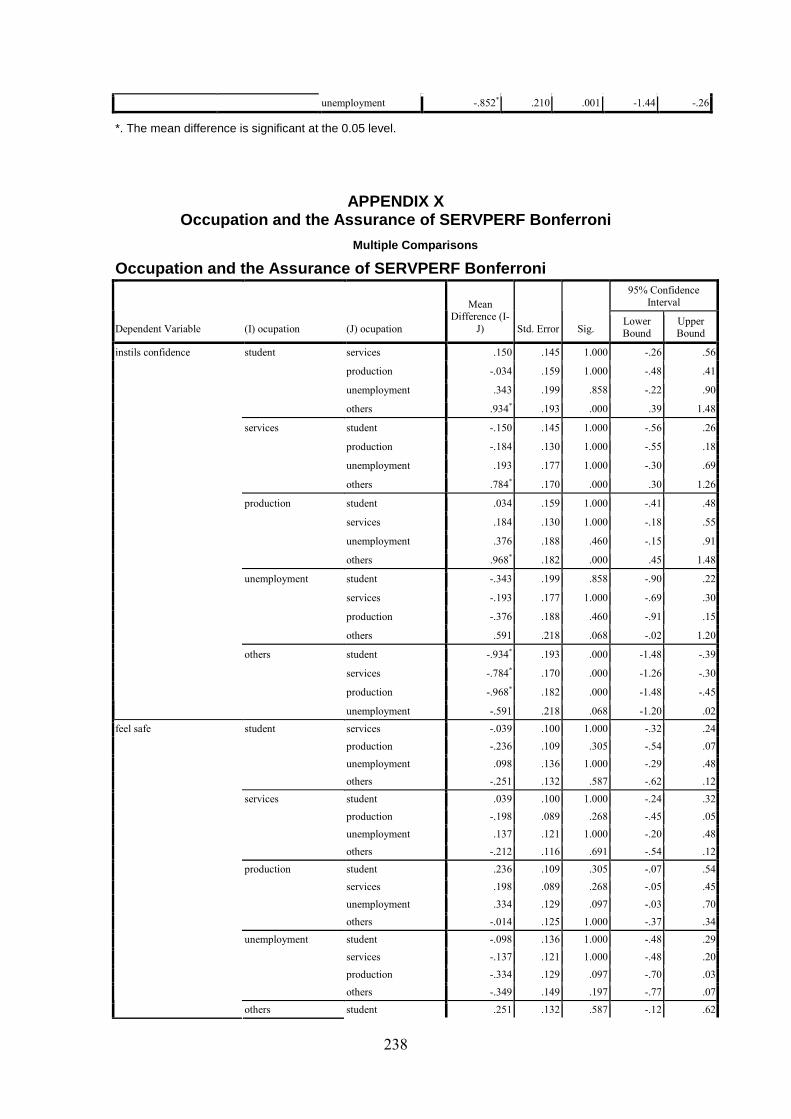
238
unemployment -.852* .210 .001 -1.44 -.26
*. The mean difference is significant at the 0.05 level.
APPENDIX X
Occupation and the Assurance of SERVPERF Bonferroni
Multiple Comparisons
Occupation and the Assurance of SERVPERF Bonferroni 95% Confidence
Interval
Dependent Variable (I) ocupation (J) ocupation
Mean Difference (I-
J) Std. Error Sig. Lower Bound
Upper Bound
services .150 .145 1.000 -.26 .56
production -.034 .159 1.000 -.48 .41
unemployment .343 .199 .858 -.22 .90
student
others .934* .193 .000 .39 1.48
student -.150 .145 1.000 -.56 .26
production -.184 .130 1.000 -.55 .18
unemployment .193 .177 1.000 -.30 .69
services
others .784* .170 .000 .30 1.26
student .034 .159 1.000 -.41 .48
services .184 .130 1.000 -.18 .55
unemployment .376 .188 .460 -.15 .91
production
others .968* .182 .000 .45 1.48
student -.343 .199 .858 -.90 .22
services -.193 .177 1.000 -.69 .30
production -.376 .188 .460 -.91 .15
unemployment
others .591 .218 .068 -.02 1.20
student -.934* .193 .000 -1.48 -.39
services -.784* .170 .000 -1.26 -.30
production -.968* .182 .000 -1.48 -.45
instils confidence
others
unemployment -.591 .218 .068 -1.20 .02
services -.039 .100 1.000 -.32 .24
production -.236 .109 .305 -.54 .07
unemployment .098 .136 1.000 -.29 .48
student
others -.251 .132 .587 -.62 .12
student .039 .100 1.000 -.24 .32
production -.198 .089 .268 -.45 .05
unemployment .137 .121 1.000 -.20 .48
services
others -.212 .116 .691 -.54 .12
student .236 .109 .305 -.07 .54
services .198 .089 .268 -.05 .45
unemployment .334 .129 .097 -.03 .70
production
others -.014 .125 1.000 -.37 .34
student -.098 .136 1.000 -.48 .29
services -.137 .121 1.000 -.48 .20
production -.334 .129 .097 -.70 .03
unemployment
others -.349 .149 .197 -.77 .07
feel safe
others student .251 .132 .587 -.12 .62
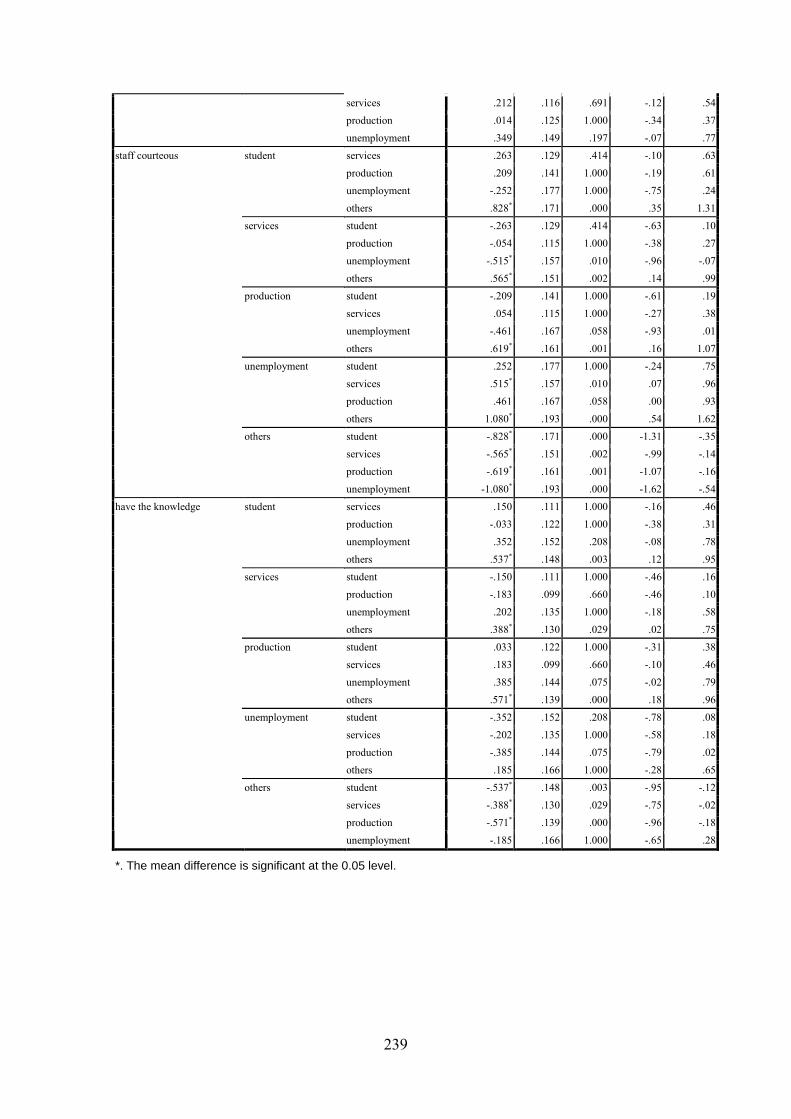
239
services .212 .116 .691 -.12 .54
production .014 .125 1.000 -.34 .37
unemployment .349 .149 .197 -.07 .77
services .263 .129 .414 -.10 .63
production .209 .141 1.000 -.19 .61
unemployment -.252 .177 1.000 -.75 .24
student
others .828* .171 .000 .35 1.31
student -.263 .129 .414 -.63 .10
production -.054 .115 1.000 -.38 .27
unemployment -.515* .157 .010 -.96 -.07
services
others .565* .151 .002 .14 .99
student -.209 .141 1.000 -.61 .19
services .054 .115 1.000 -.27 .38
unemployment -.461 .167 .058 -.93 .01
production
others .619* .161 .001 .16 1.07
student .252 .177 1.000 -.24 .75
services .515* .157 .010 .07 .96
production .461 .167 .058 .00 .93
unemployment
others 1.080* .193 .000 .54 1.62
student -.828* .171 .000 -1.31 -.35
services -.565* .151 .002 -.99 -.14
production -.619* .161 .001 -1.07 -.16
staff courteous
others
unemployment -1.080* .193 .000 -1.62 -.54
services .150 .111 1.000 -.16 .46
production -.033 .122 1.000 -.38 .31
unemployment .352 .152 .208 -.08 .78
student
others .537* .148 .003 .12 .95
student -.150 .111 1.000 -.46 .16
production -.183 .099 .660 -.46 .10
unemployment .202 .135 1.000 -.18 .58
services
others .388* .130 .029 .02 .75
student .033 .122 1.000 -.31 .38
services .183 .099 .660 -.10 .46
unemployment .385 .144 .075 -.02 .79
production
others .571* .139 .000 .18 .96
student -.352 .152 .208 -.78 .08
services -.202 .135 1.000 -.58 .18
production -.385 .144 .075 -.79 .02
unemployment
others .185 .166 1.000 -.28 .65
student -.537* .148 .003 -.95 -.12
services -.388* .130 .029 -.75 -.02
production -.571* .139 .000 -.96 -.18
have the knowledge
others
unemployment -.185 .166 1.000 -.65 .28
*. The mean difference is significant at the 0.05 level.
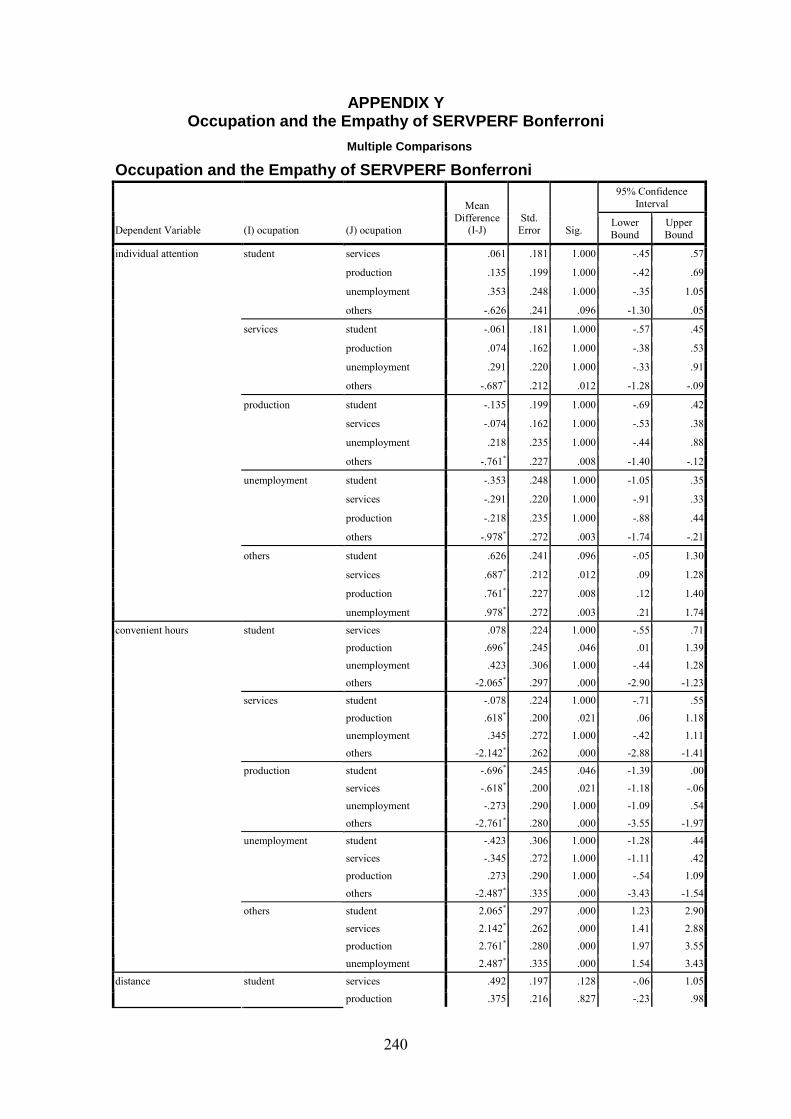
240
APPENDIX Y Occupation and the Empathy of SERVPERF Bonferroni
Multiple Comparisons
Occupation and the Empathy of SERVPERF Bonferroni 95% Confidence
Interval
Dependent Variable (I) ocupation (J) ocupation
Mean
Difference (I-J)
Std.
Error Sig. Lower
Bound
Upper
Bound
services .061 .181 1.000 -.45 .57
production .135 .199 1.000 -.42 .69
unemployment .353 .248 1.000 -.35 1.05
student
others -.626 .241 .096 -1.30 .05
student -.061 .181 1.000 -.57 .45
production .074 .162 1.000 -.38 .53
unemployment .291 .220 1.000 -.33 .91
services
others -.687* .212 .012 -1.28 -.09
student -.135 .199 1.000 -.69 .42
services -.074 .162 1.000 -.53 .38
unemployment .218 .235 1.000 -.44 .88
production
others -.761* .227 .008 -1.40 -.12
student -.353 .248 1.000 -1.05 .35
services -.291 .220 1.000 -.91 .33
production -.218 .235 1.000 -.88 .44
unemployment
others -.978* .272 .003 -1.74 -.21
student .626 .241 .096 -.05 1.30
services .687* .212 .012 .09 1.28
production .761* .227 .008 .12 1.40
individual attention
others
unemployment .978* .272 .003 .21 1.74
services .078 .224 1.000 -.55 .71
production .696* .245 .046 .01 1.39
unemployment .423 .306 1.000 -.44 1.28
student
others -2.065* .297 .000 -2.90 -1.23
student -.078 .224 1.000 -.71 .55
production .618* .200 .021 .06 1.18
unemployment .345 .272 1.000 -.42 1.11
services
others -2.142* .262 .000 -2.88 -1.41
student -.696* .245 .046 -1.39 .00
services -.618* .200 .021 -1.18 -.06
unemployment -.273 .290 1.000 -1.09 .54
production
others -2.761* .280 .000 -3.55 -1.97
student -.423 .306 1.000 -1.28 .44
services -.345 .272 1.000 -1.11 .42
production .273 .290 1.000 -.54 1.09
unemployment
others -2.487* .335 .000 -3.43 -1.54
student 2.065* .297 .000 1.23 2.90
services 2.142* .262 .000 1.41 2.88
production 2.761* .280 .000 1.97 3.55
convenient hours
others
unemployment 2.487* .335 .000 1.54 3.43
services .492 .197 .128 -.06 1.05 distance student
production .375 .216 .827 -.23 .98
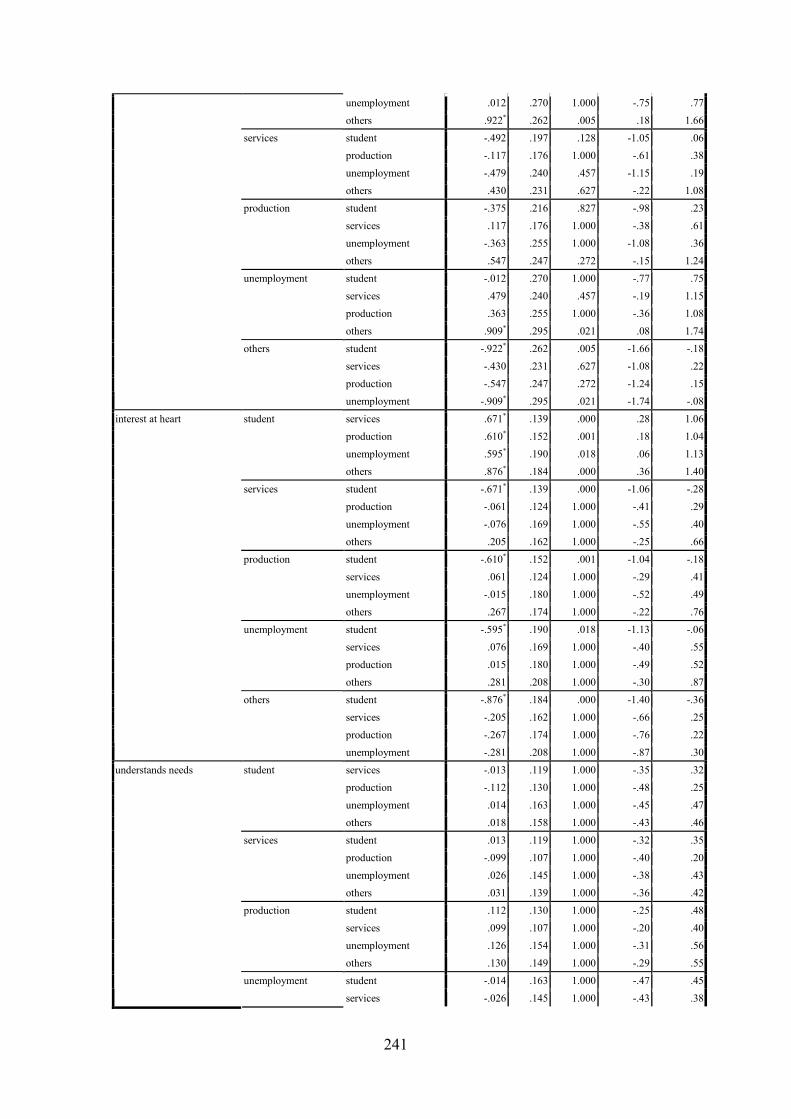
241
unemployment .012 .270 1.000 -.75 .77
others .922* .262 .005 .18 1.66
student -.492 .197 .128 -1.05 .06
production -.117 .176 1.000 -.61 .38
unemployment -.479 .240 .457 -1.15 .19
services
others .430 .231 .627 -.22 1.08
student -.375 .216 .827 -.98 .23
services .117 .176 1.000 -.38 .61
unemployment -.363 .255 1.000 -1.08 .36
production
others .547 .247 .272 -.15 1.24
student -.012 .270 1.000 -.77 .75
services .479 .240 .457 -.19 1.15
production .363 .255 1.000 -.36 1.08
unemployment
others .909* .295 .021 .08 1.74
student -.922* .262 .005 -1.66 -.18
services -.430 .231 .627 -1.08 .22
production -.547 .247 .272 -1.24 .15
others
unemployment -.909* .295 .021 -1.74 -.08
services .671* .139 .000 .28 1.06
production .610* .152 .001 .18 1.04
unemployment .595* .190 .018 .06 1.13
student
others .876* .184 .000 .36 1.40
student -.671* .139 .000 -1.06 -.28
production -.061 .124 1.000 -.41 .29
unemployment -.076 .169 1.000 -.55 .40
services
others .205 .162 1.000 -.25 .66
student -.610* .152 .001 -1.04 -.18
services .061 .124 1.000 -.29 .41
unemployment -.015 .180 1.000 -.52 .49
production
others .267 .174 1.000 -.22 .76
student -.595* .190 .018 -1.13 -.06
services .076 .169 1.000 -.40 .55
production .015 .180 1.000 -.49 .52
unemployment
others .281 .208 1.000 -.30 .87
student -.876* .184 .000 -1.40 -.36
services -.205 .162 1.000 -.66 .25
production -.267 .174 1.000 -.76 .22
interest at heart
others
unemployment -.281 .208 1.000 -.87 .30
services -.013 .119 1.000 -.35 .32
production -.112 .130 1.000 -.48 .25
unemployment .014 .163 1.000 -.45 .47
student
others .018 .158 1.000 -.43 .46
student .013 .119 1.000 -.32 .35
production -.099 .107 1.000 -.40 .20
unemployment .026 .145 1.000 -.38 .43
services
others .031 .139 1.000 -.36 .42
student .112 .130 1.000 -.25 .48
services .099 .107 1.000 -.20 .40
unemployment .126 .154 1.000 -.31 .56
production
others .130 .149 1.000 -.29 .55
student -.014 .163 1.000 -.47 .45
understands needs
unemployment
services -.026 .145 1.000 -.43 .38
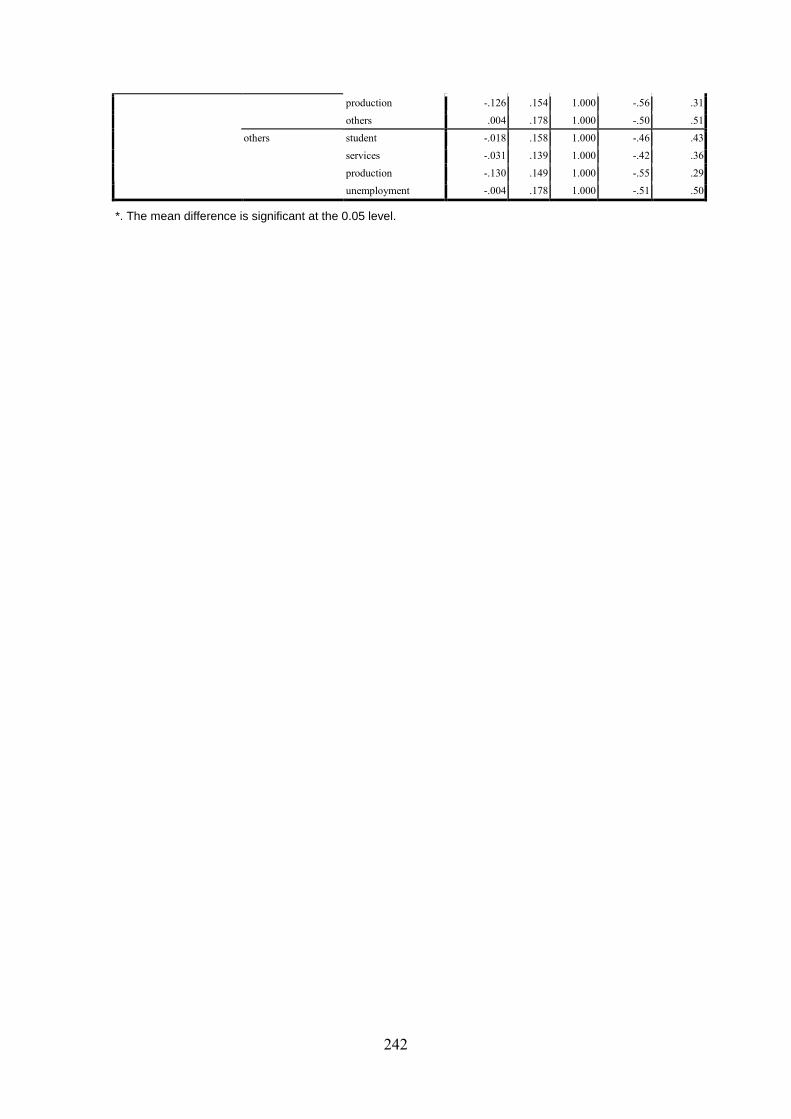
242
production -.126 .154 1.000 -.56 .31
others .004 .178 1.000 -.50 .51
student -.018 .158 1.000 -.46 .43
services -.031 .139 1.000 -.42 .36
production -.130 .149 1.000 -.55 .29
others
unemployment -.004 .178 1.000 -.51 .50
*. The mean difference is significant at the 0.05 level.