


Idiomas
Páginas
Jurídico

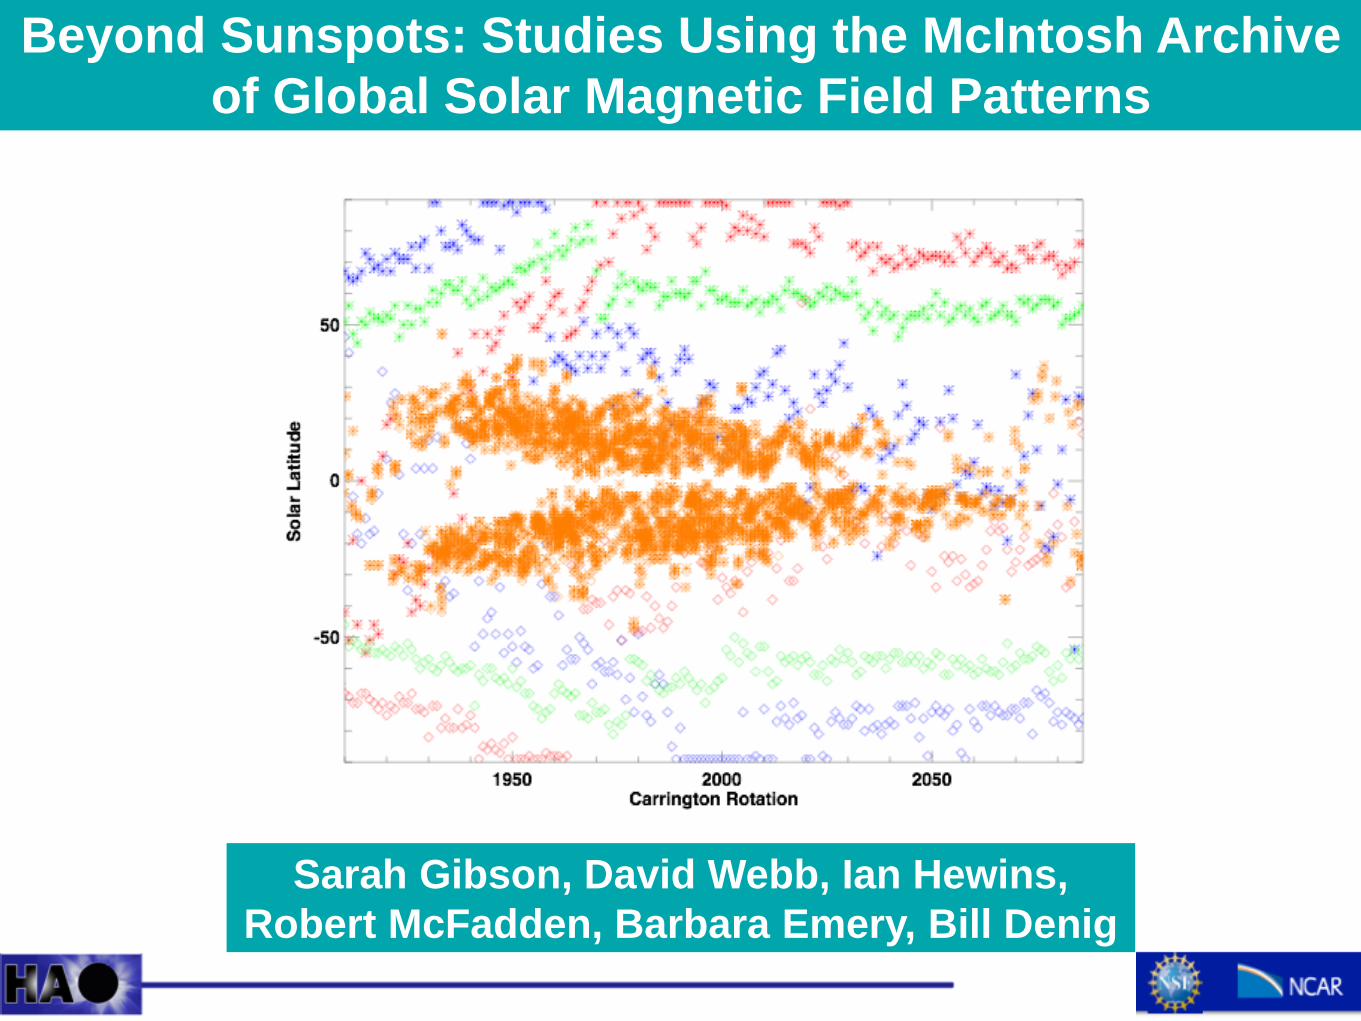
Beyond Sunspots: Studies Using the McIntosh Archive
of Global Solar Magnetic Field Patterns
Sarah Gibson, David Webb, Ian Hewins,
Robert McFadden, Barbara Emery, Bill Denig
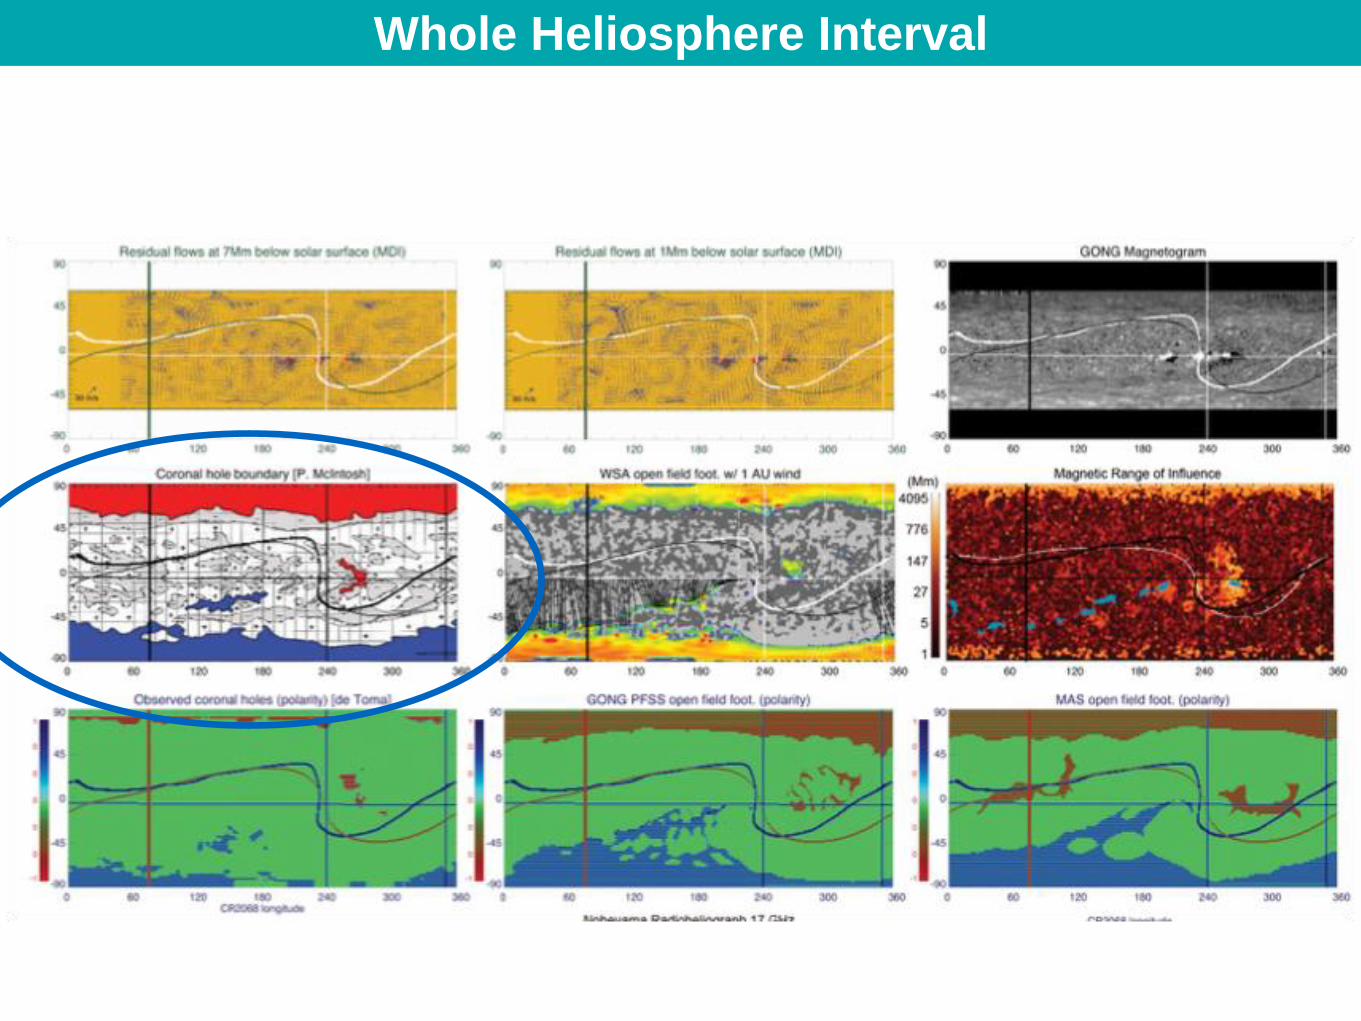
Whole Heliosphere Interval
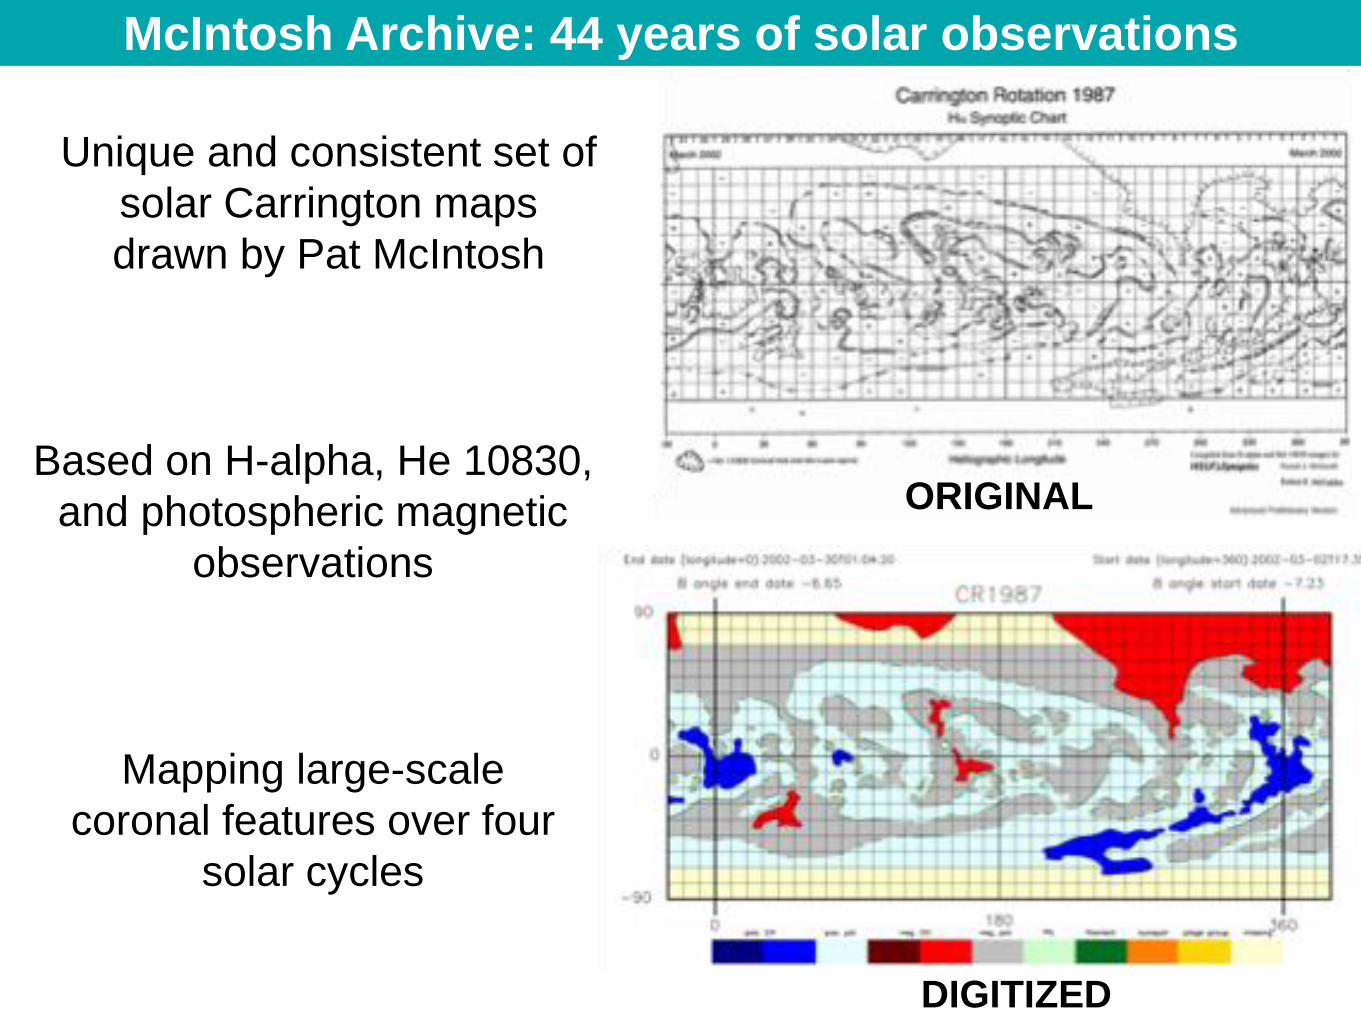
ORIGINAL
DIGITIZED
Unique and consistent set of
solar Carrington maps
drawn by Pat McIntosh
Mapping large-scale
coronal features over four
solar cycles
Based on H-alpha, He 10830,
and photospheric magnetic
observations
McIntosh Archive: 44 years of solar observations
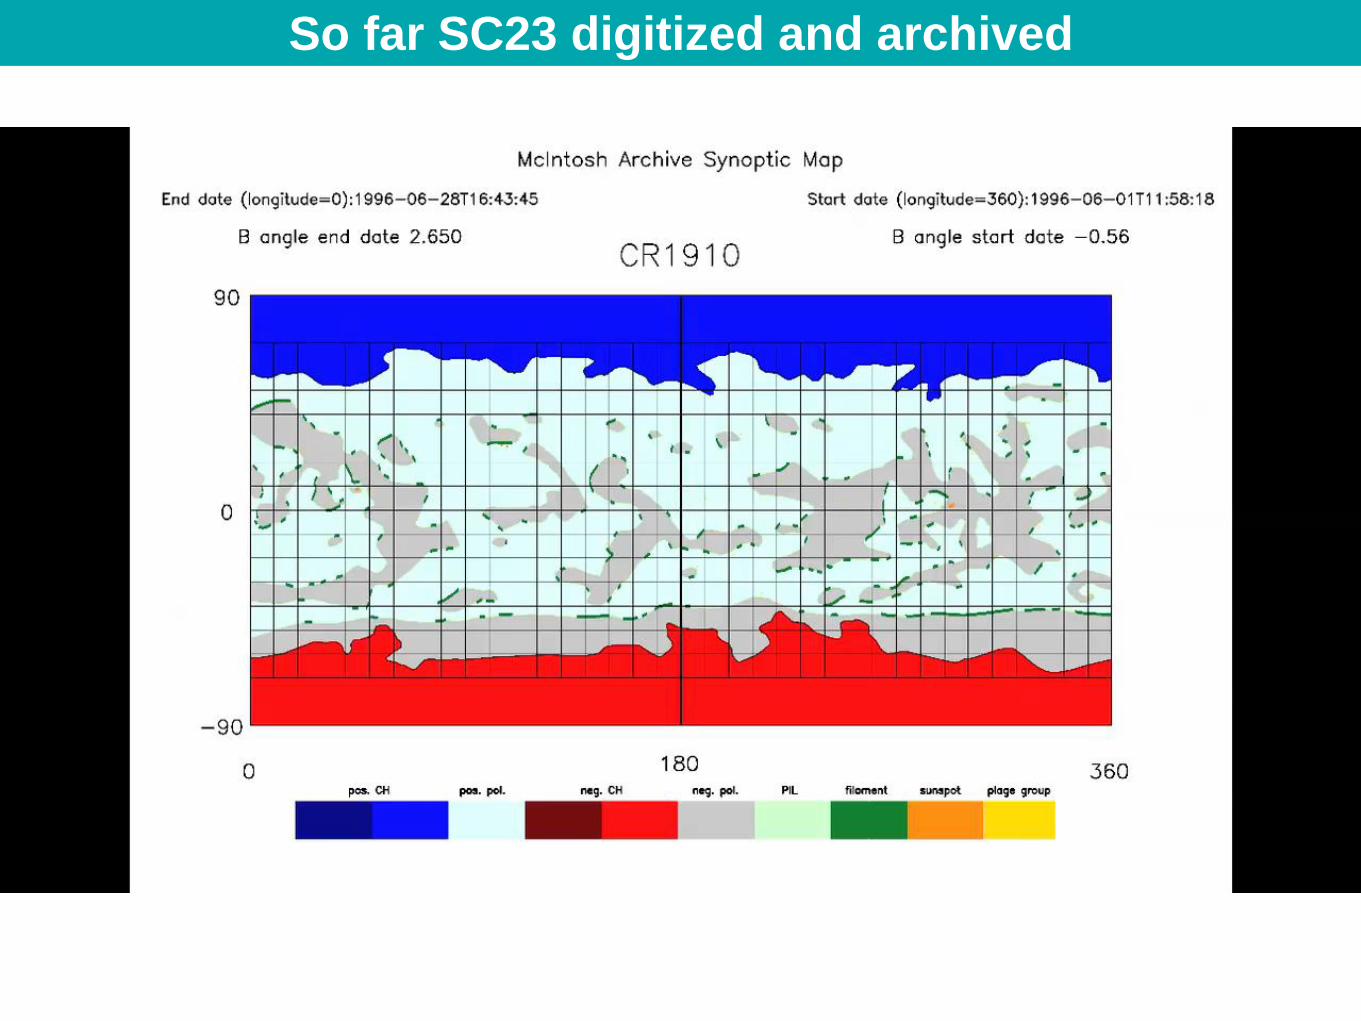
So far SC23 digitized and archived
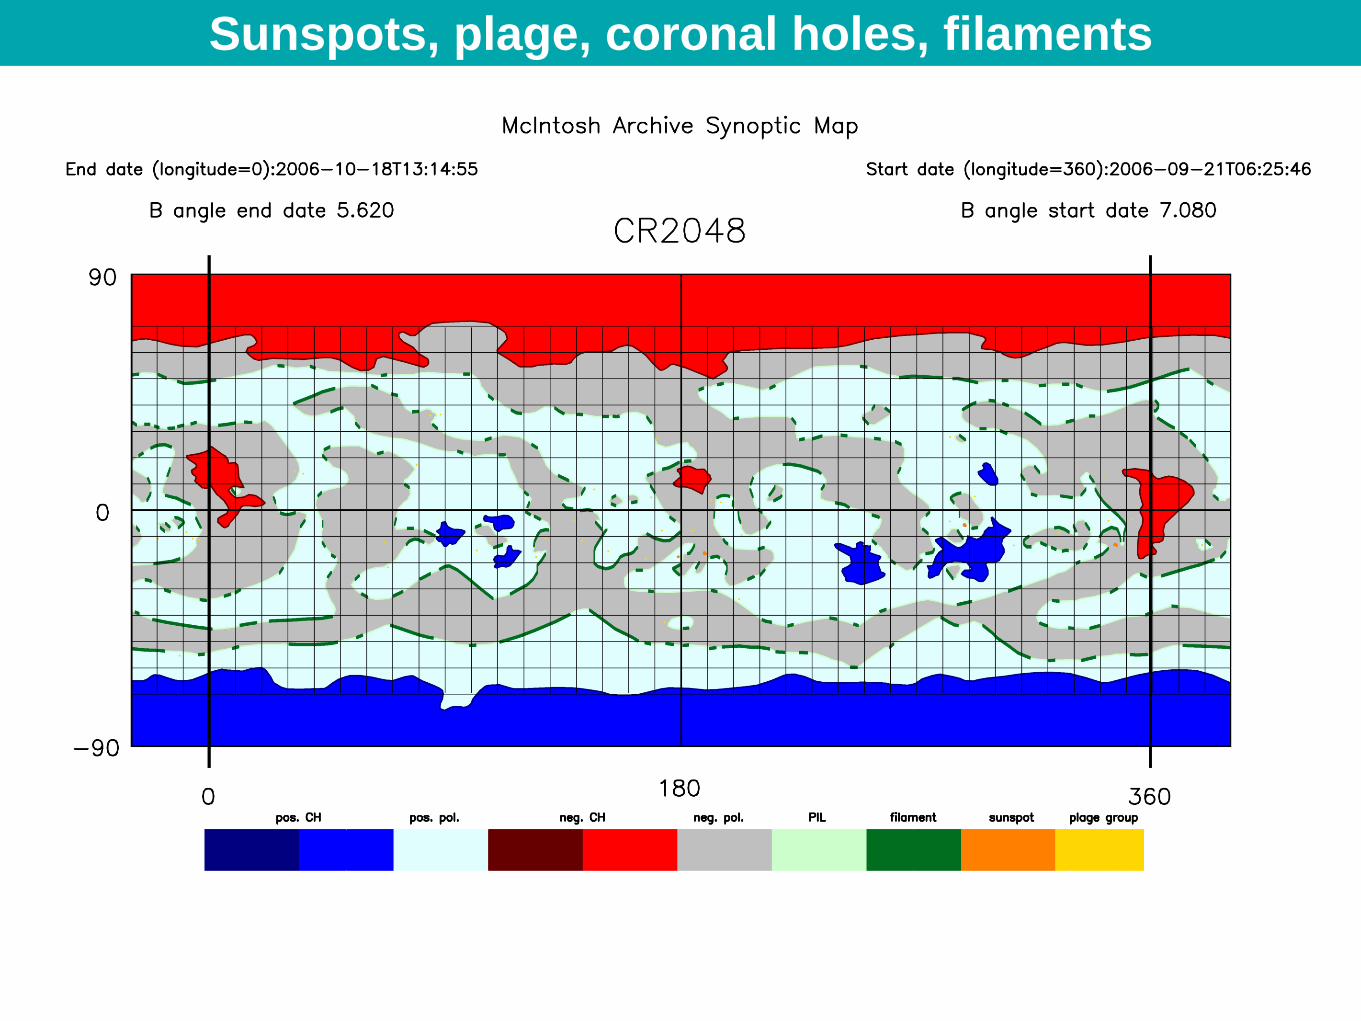
Sunspots, plage, coronal holes, filaments
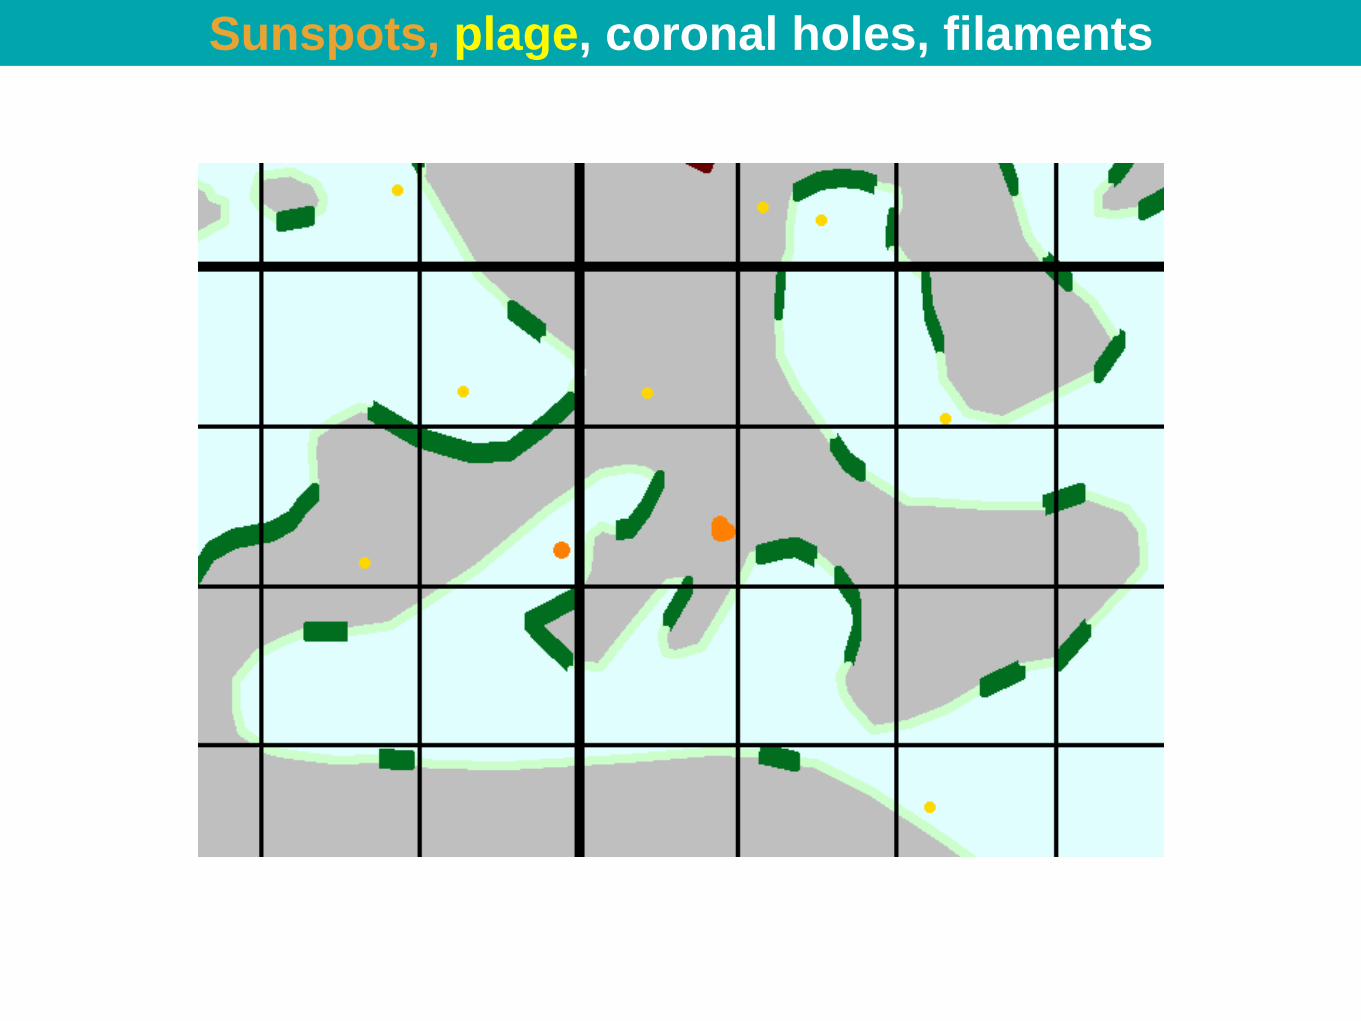
Sunspots, plage, coronal holes, filaments
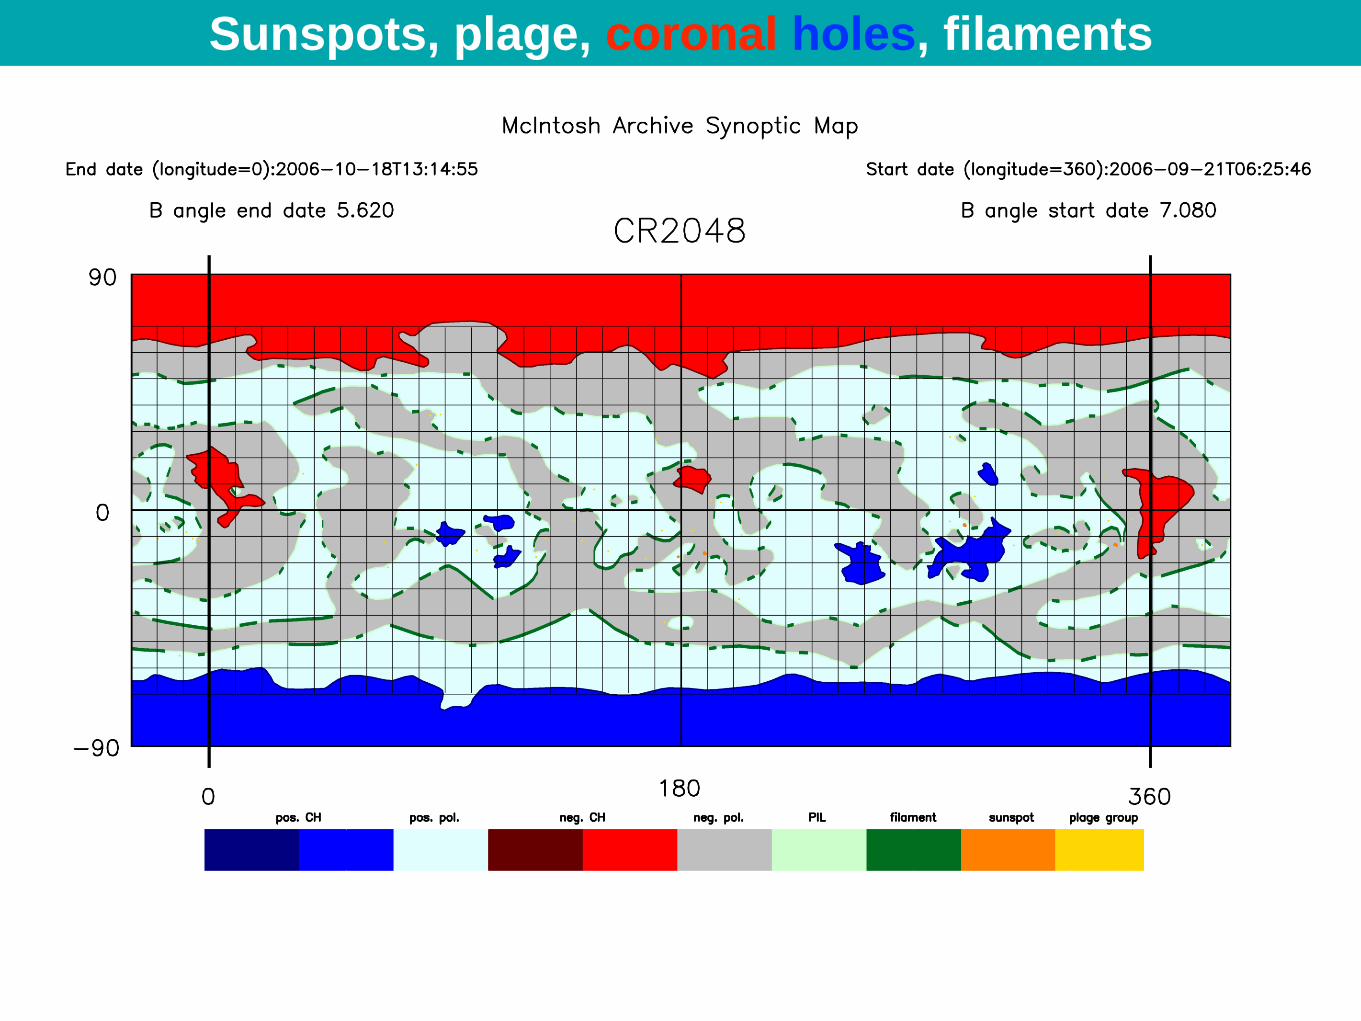
Sunspots, plage, coronal holes, filaments
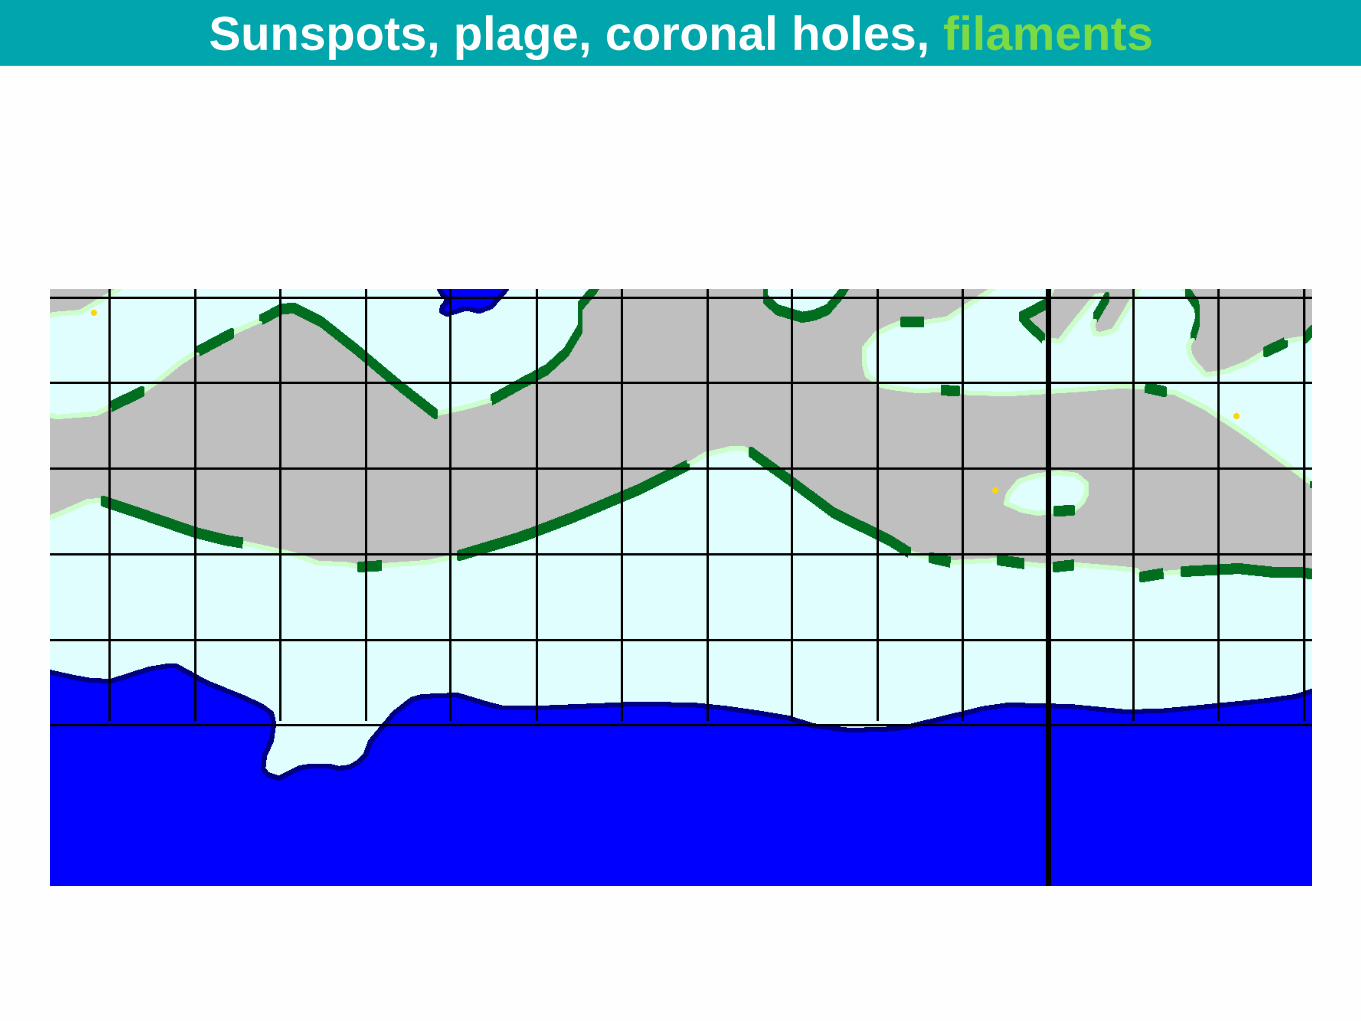
Sunspots, plage, coronal holes, filaments
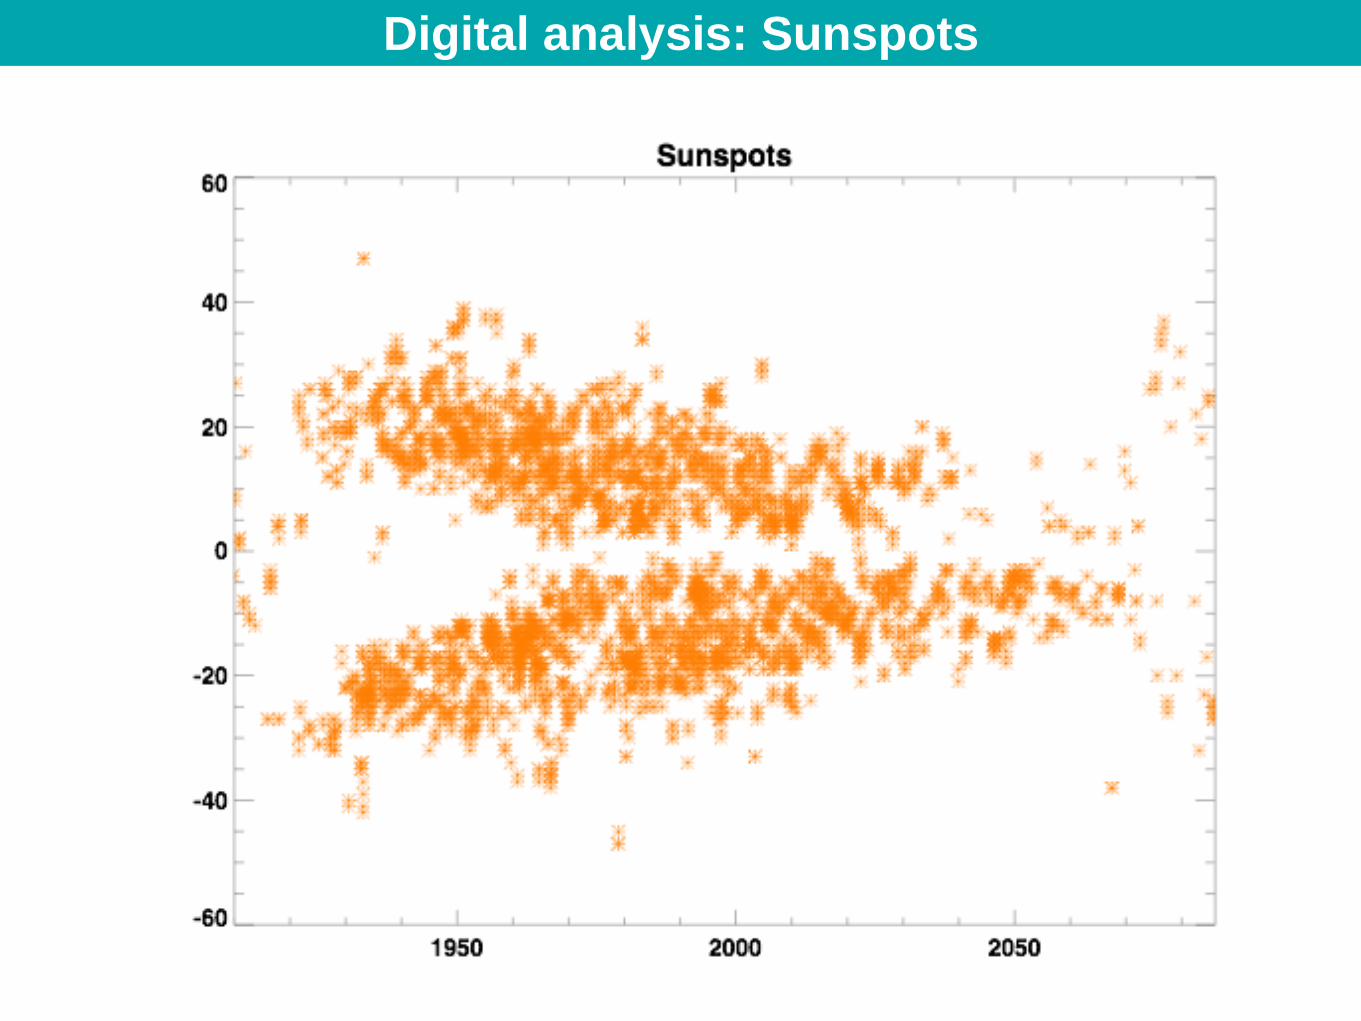
Digital analysis: Sunspots
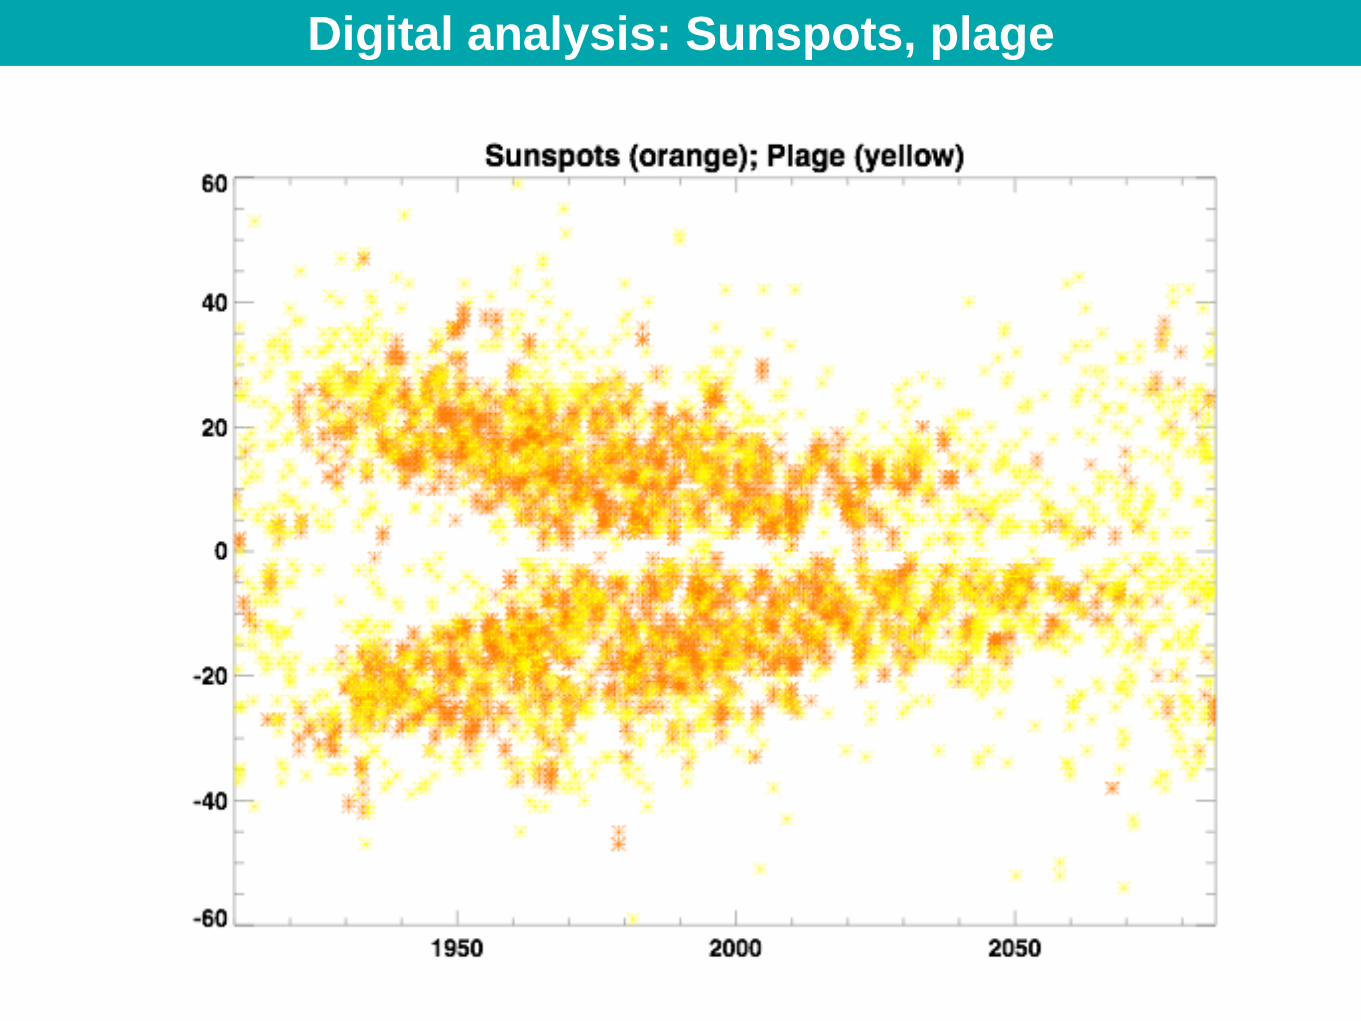
Digital analysis: Sunspots, plage
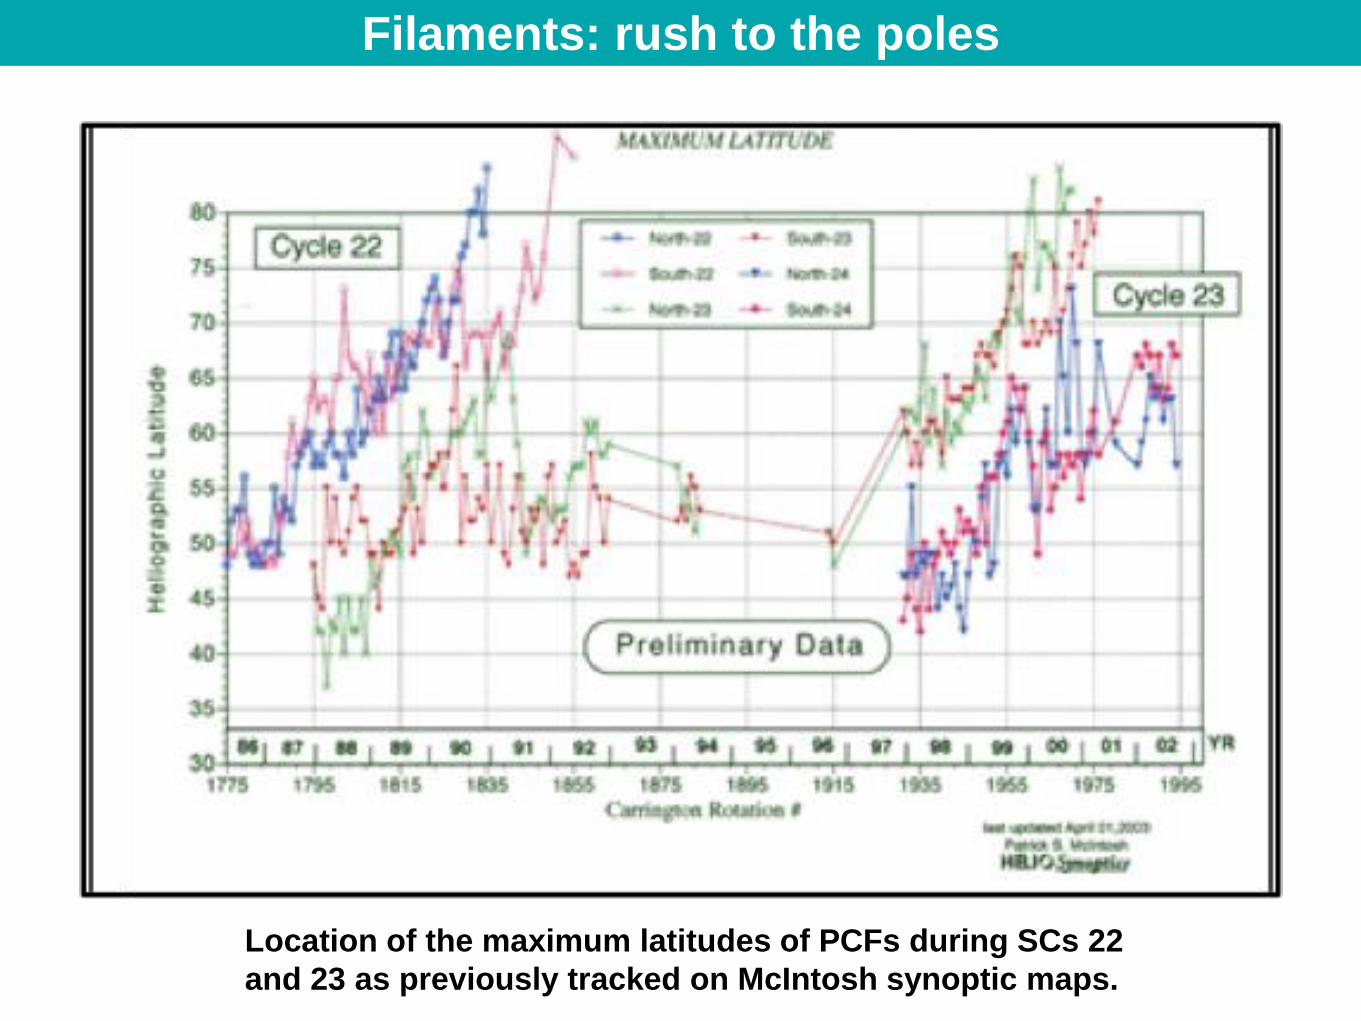
Location of the maximum latitudes of PCFs during SCs 22
and 23 as previously tracked on McIntosh synoptic maps.
Filaments: rush to the poles
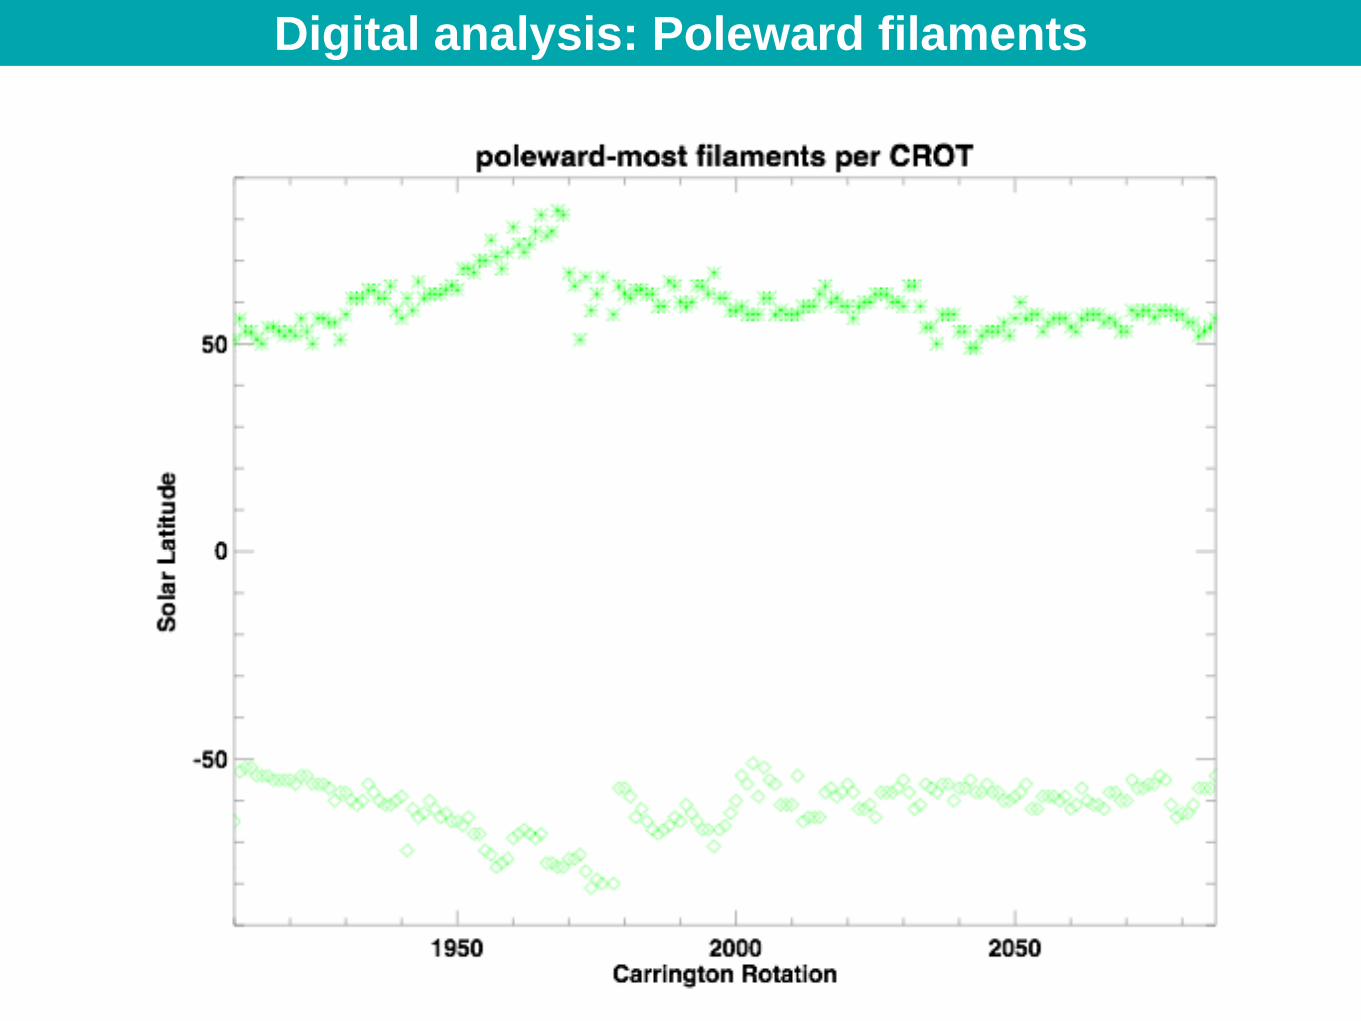
Digital analysis: Poleward filaments
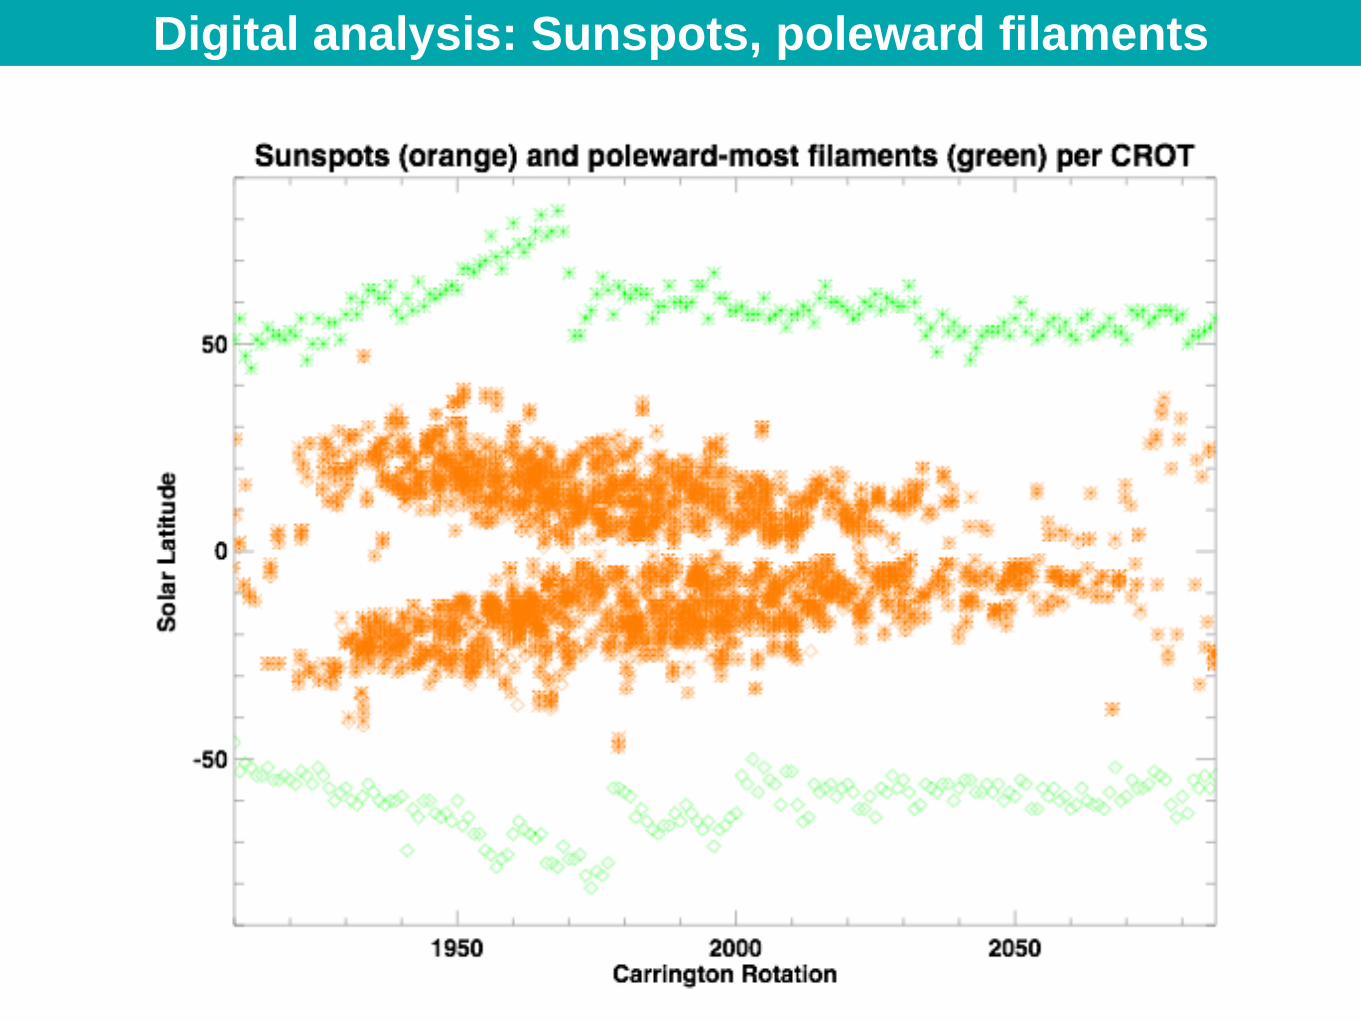
Digital analysis: Sunspots, poleward filaments
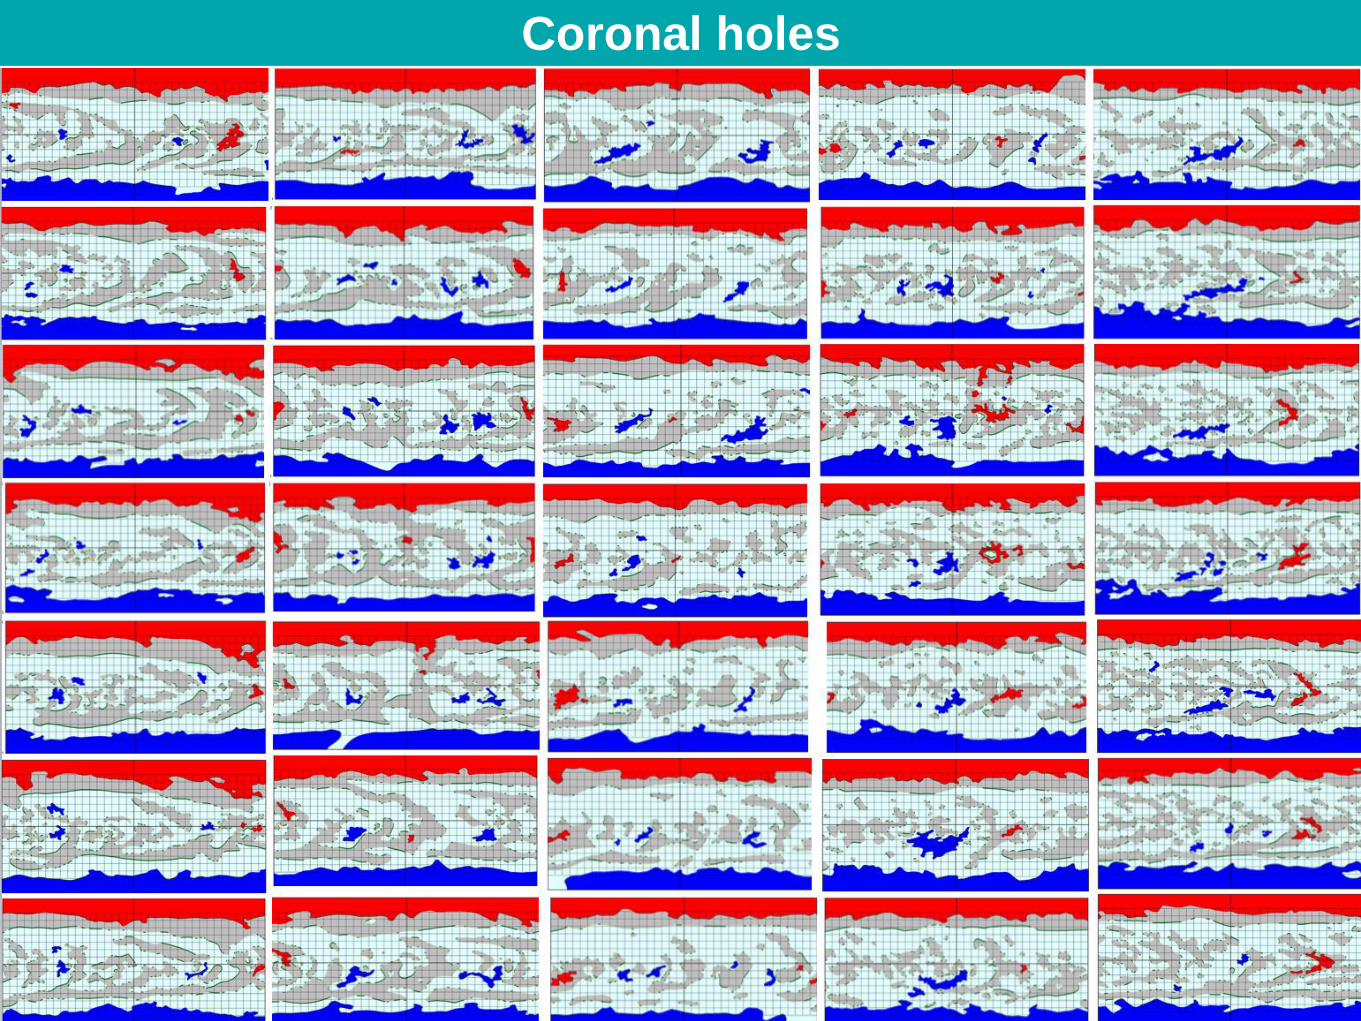
Coronal holes
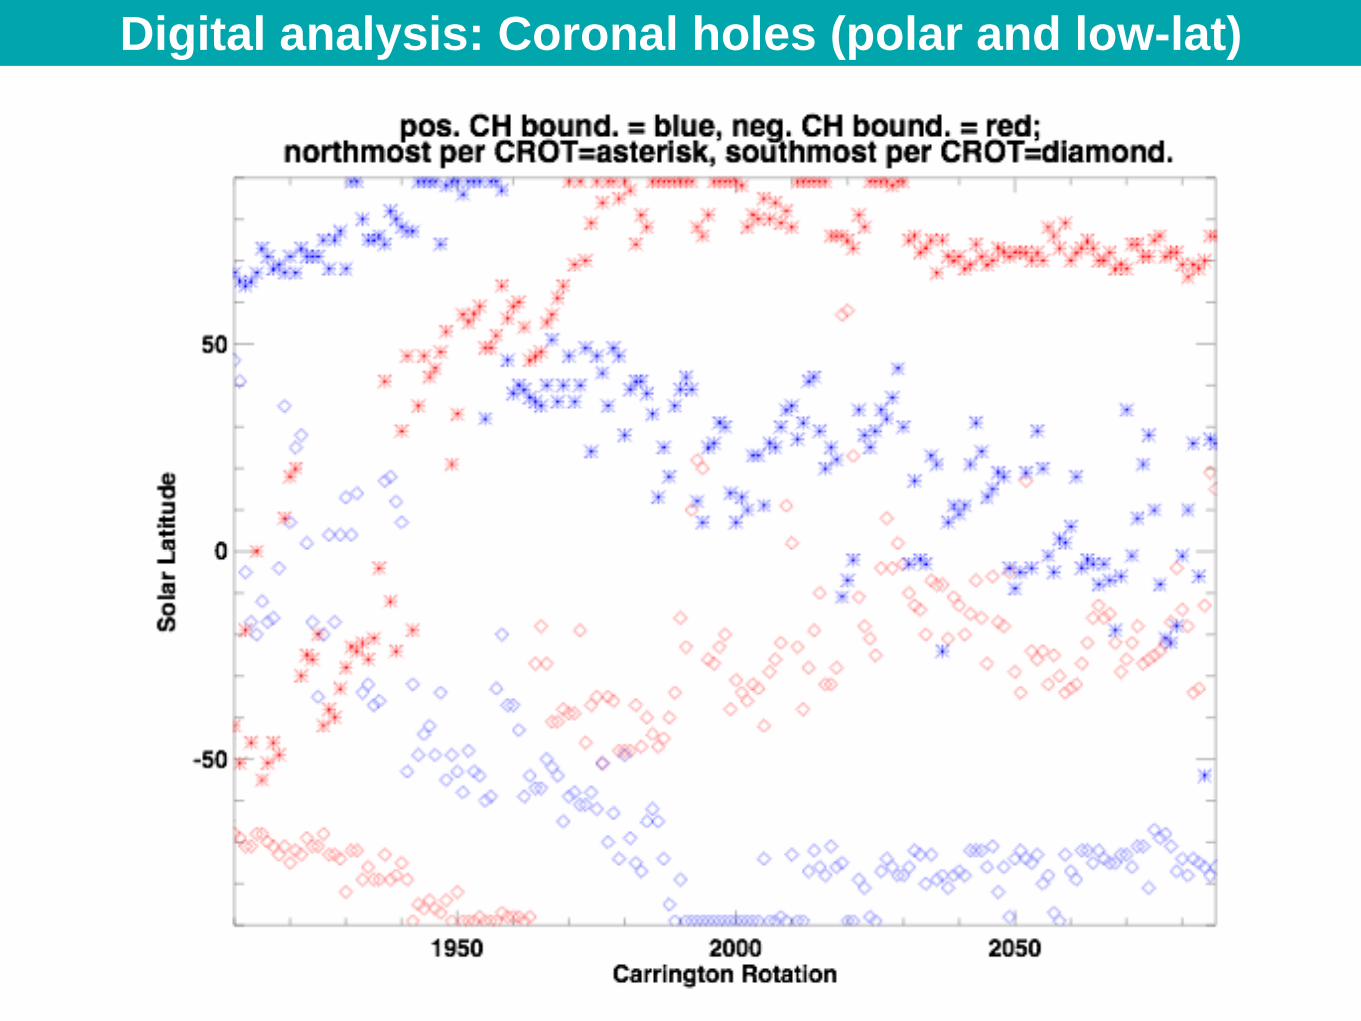
Digital analysis: Coronal holes (polar and low-lat)
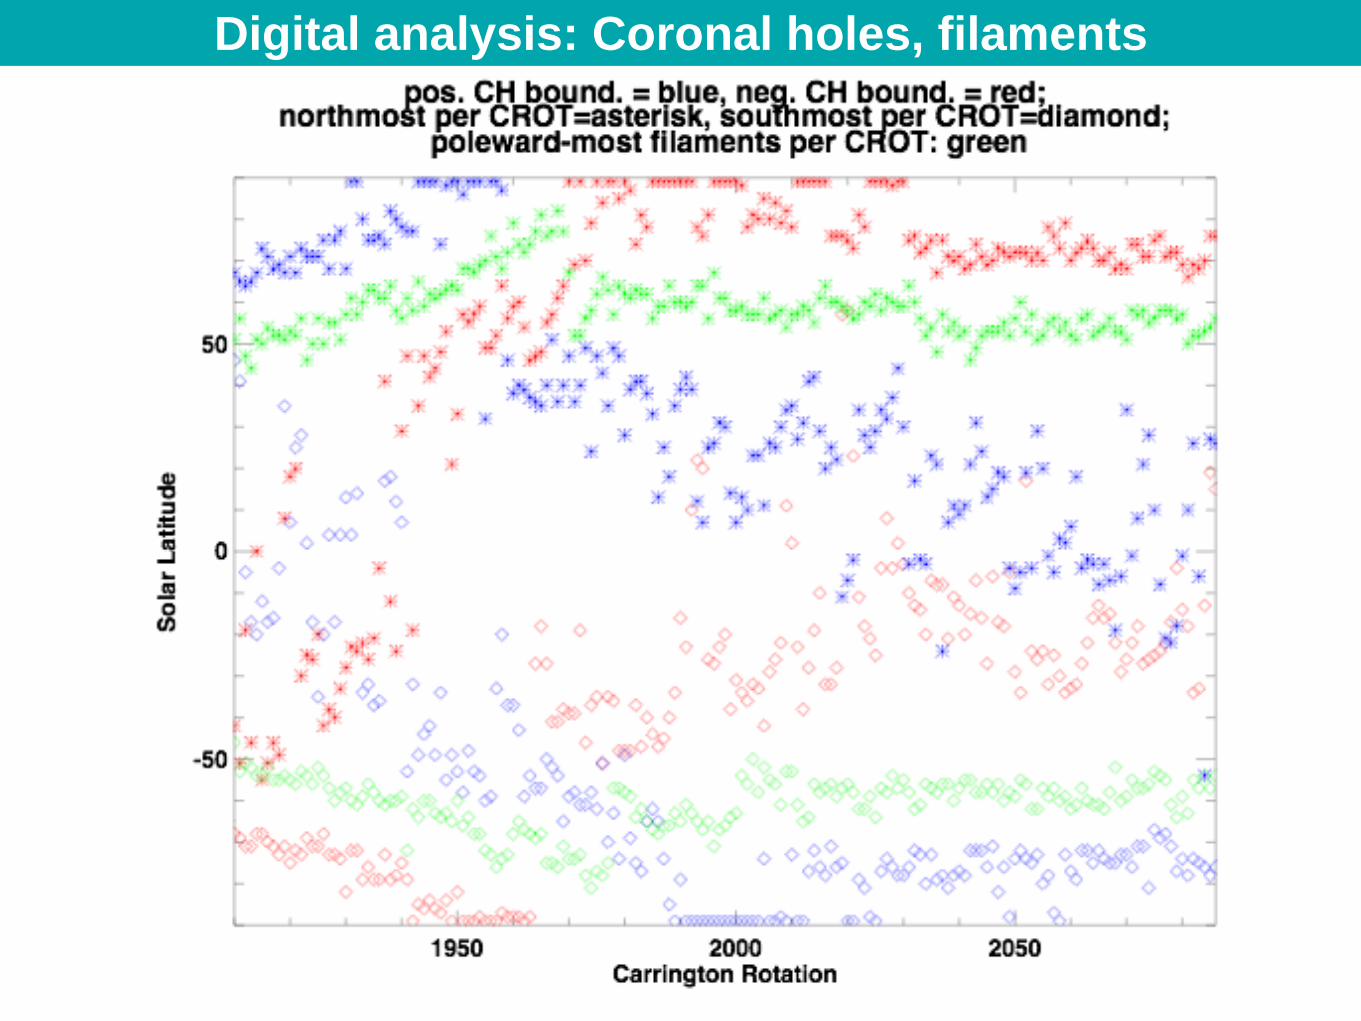
Digital analysis: Coronal holes, filaments
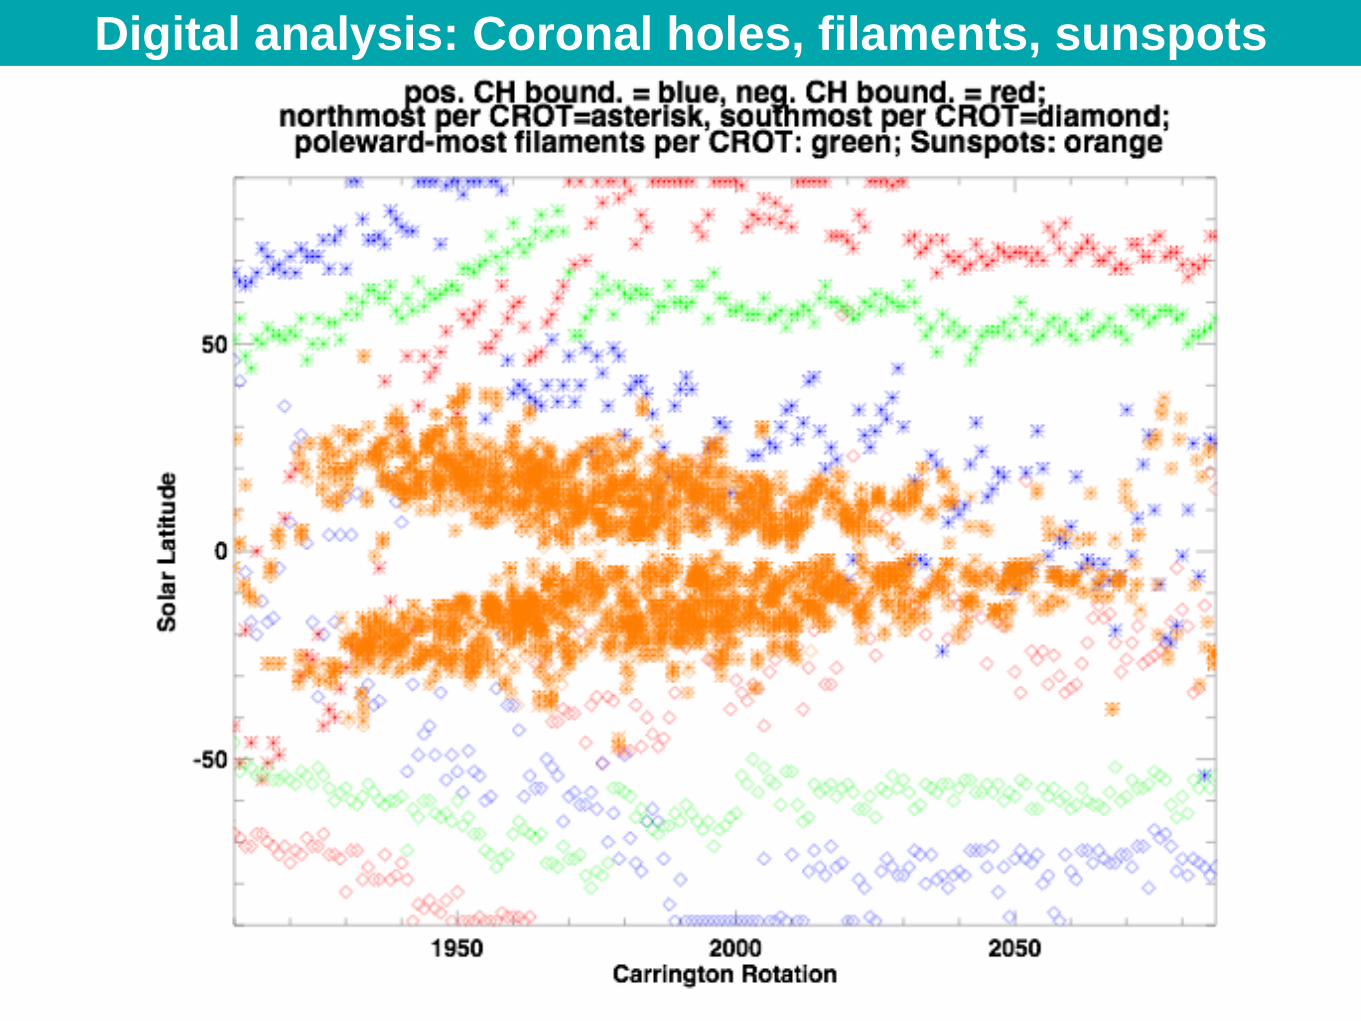
Digital analysis: Coronal holes, filaments, sunspots
CR
OT
2053 -
20
80
——
->
Feb 2
007 -
May 2
009
——
>
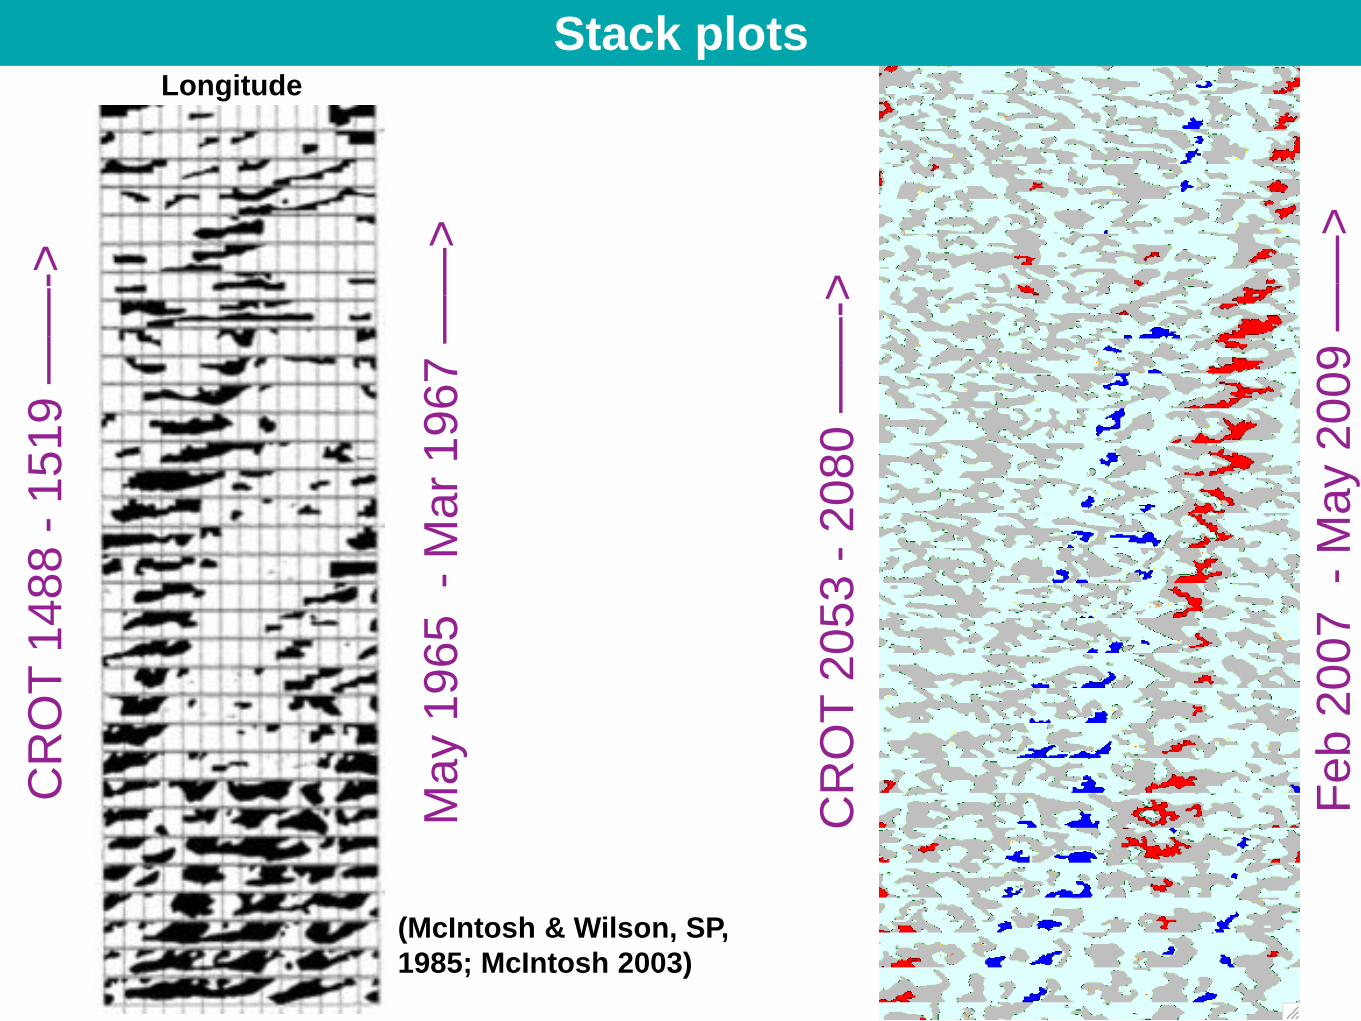
Stack plots C
RO
T 1
48
8 -
15
19
——
->
(McIntosh & Wilson, SP,
1985; McIntosh 2003)
May 1
965 -
Mar
1967 —
—>
Longitude
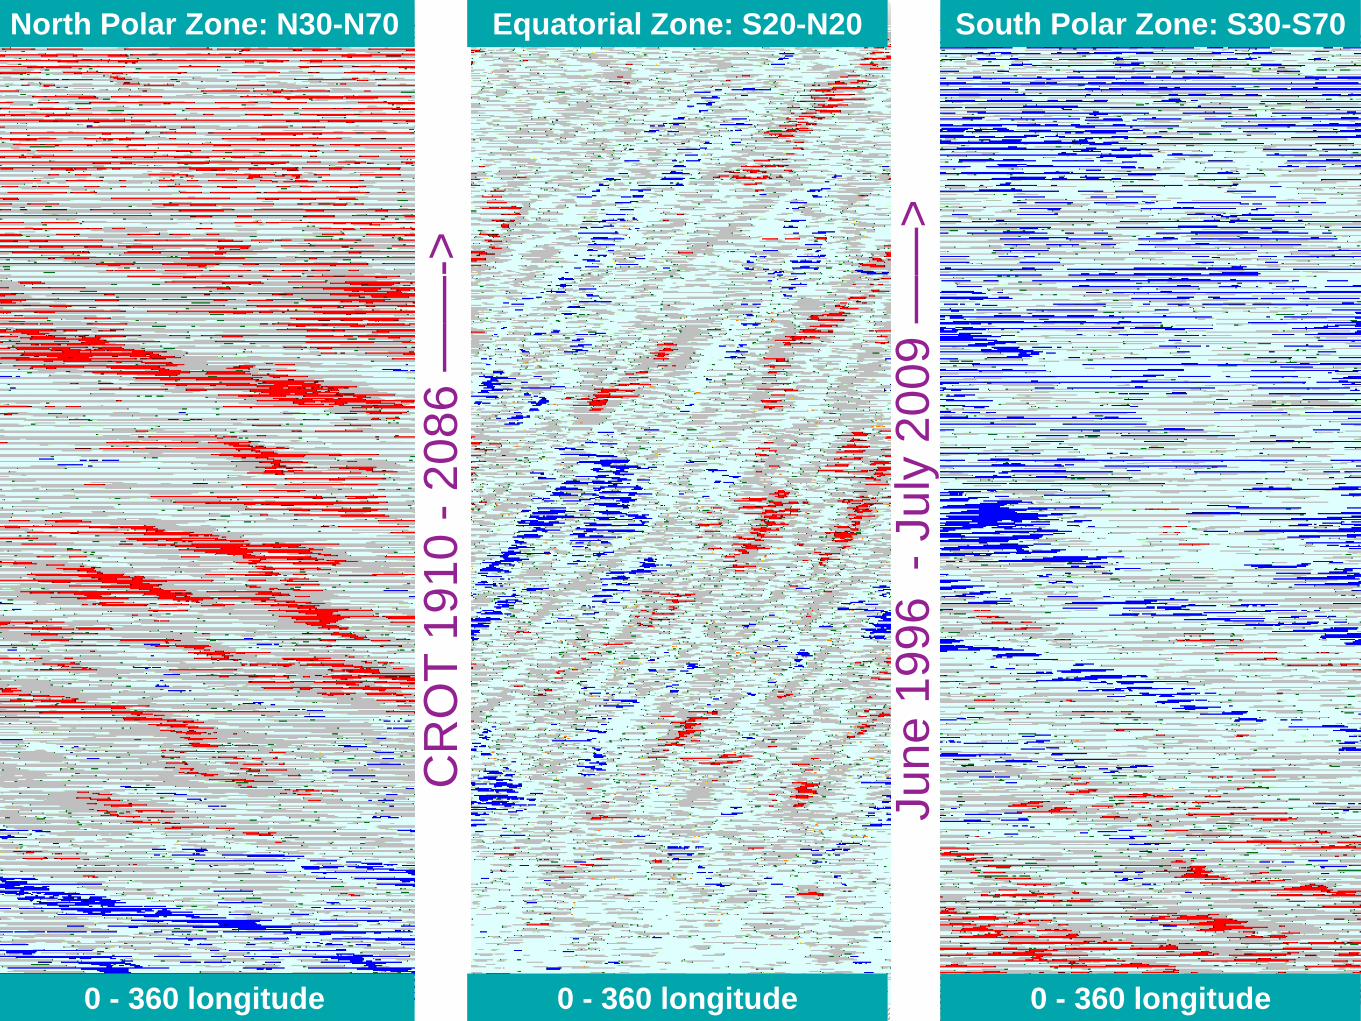
North Polar Zone: N30-N70 South Polar Zone: S30-S70 Equatorial Zone: S20-N20
CR
OT
1910 -
20
86
——
->
June 1
996 -
July
2009
——
>
0 - 360 longitude 0 - 360 longitude 0 - 360 longitude
• Seeking funding to complete the digitization of Cycles 20-22
Conclusions
• Cycle 23 digitized set publicly available by December 2016
(announcement in Solar News)
• Future science applications:
• Coronal hole rotation — where are they rooted?
• Sunspot-filament-coronal hole correlations (evolution study)
• Active longitudes/long-lived low-latitude coronal hole/periodic
solar wind forcing of geospace
• Current status and future plans
• Historical case study context
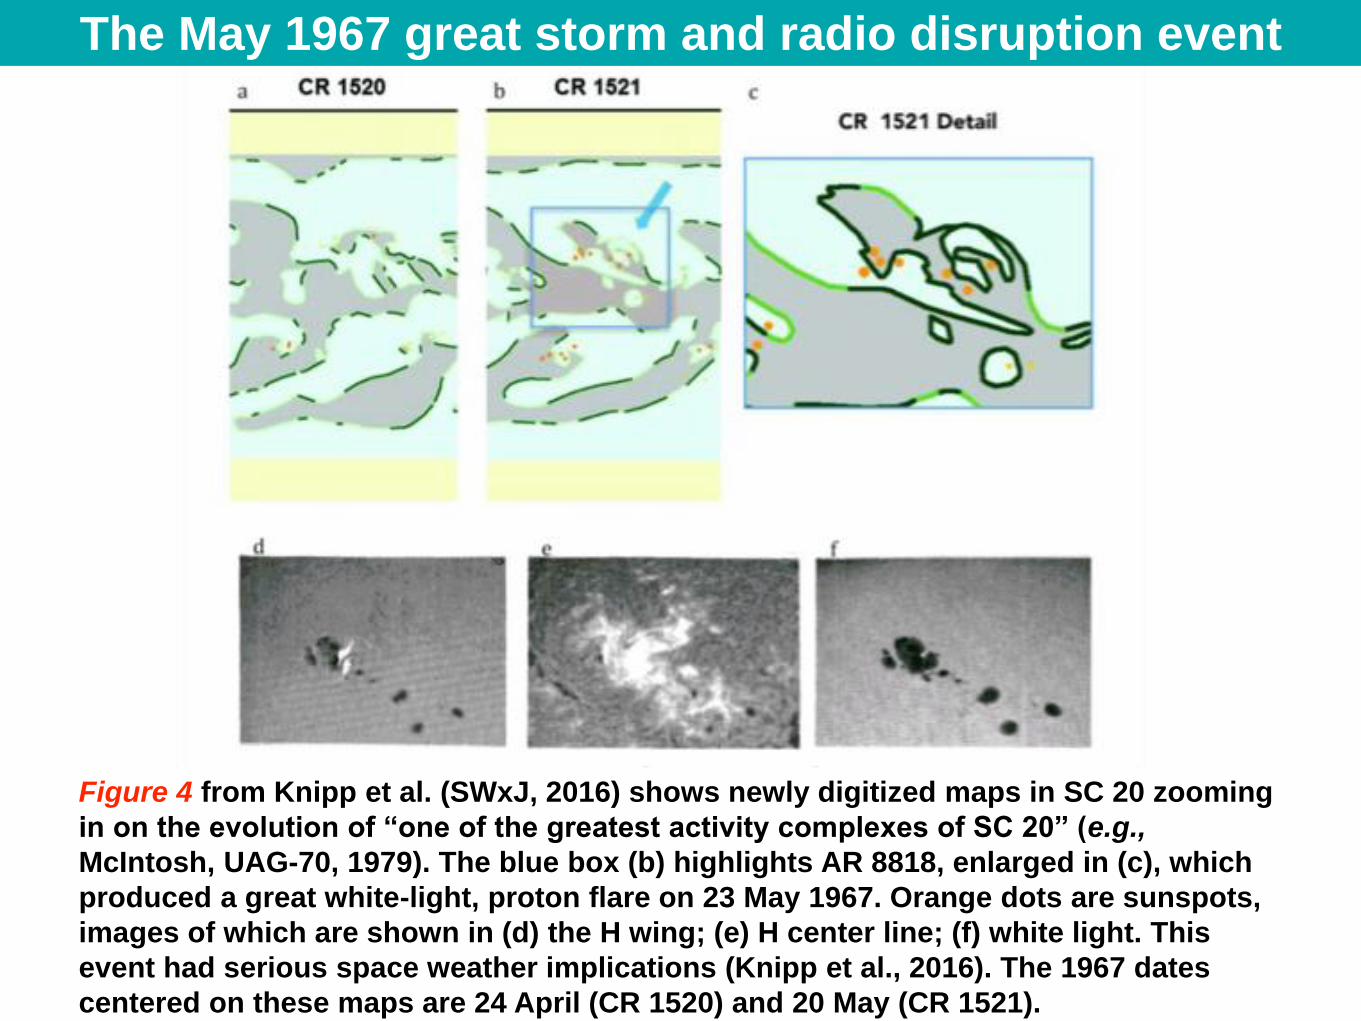
Figure 4 from Knipp et al. (SWxJ, 2016) shows newly digitized maps in SC 20 zooming
in on the evolution of “one of the greatest activity complexes of SC 20” (e.g.,
McIntosh, UAG-70, 1979). The blue box (b) highlights AR 8818, enlarged in (c), which
produced a great white-light, proton flare on 23 May 1967. Orange dots are sunspots,
images of which are shown in (d) the H wing; (e) H center line; (f) white light. This
event had serious space weather implications (Knipp et al., 2016). The 1967 dates
centered on these maps are 24 April (CR 1520) and 20 May (CR 1521).
The May 1967 great storm and radio disruption event