UNIVERSITAT POLITÈCNICA DE CATALUNYA INSTITUT DE...
167
U N I V E R S I T A T P O L I T È C N I C A D E C A T A L U N Y A I N S T I T U T D E C I È N C I E S D E L M A R D E P A R T A M E N T D E B I O L O G I A M A R I N A I O C E A N O G R A F I A EXPRESSIÓ GÈNICA EN MICROORGANISMES MARINS M e m ò r i a p r e s e n t a d a p e r o p t a r a l t í t o l d e D o c t o r e n C i è n c i e s d e l M a r p e r l a U n i v e r s i t a t P o l i t è c n i c a d e C a t a l u n y a p e r Montserrat Coll Lladó Directors de tesi Dr. Carles Pedrós-Alió Dra. Sílvia G. Acinas Barcelona, Juliol de 2013
Transcript of UNIVERSITAT POLITÈCNICA DE CATALUNYA INSTITUT DE...
UNIVERSITAT POLITÈCNICA DE CATALUNYA
INSTITUT DE CIÈNCIES DEL MAR
DEPARTAMENT DE BIOLOGIA MARINA I OCEANOGRAFIA
EXPRESSIÓ GÈNICA EN
MICROORGANISMES MARINS
Memòria presentada per optar a l t í to l de Doctor en Ciències del Mar per la Univers i tat Pol i tècnica de Cata lunya per
Montserrat Coll Lladó
Directors de tesi
Dr. Carles Pedrós-Alió Dra. Sílvia G. Acinas
Barcelona, Juliol de 2013

ÍNDEX DE CONTINGUTS
RESUM ...................................................................................................................................................................... 5
SUMMARY................................................................................................................................................................. 7
INTRODUCCIÓ........................................................................................................................................................ 9
Els microorganismes marins ...................................................................................................................... 9
El procés de l'expressió gènica ................................................................................................................ 10
Estudi de les funcions dels microorganismes a l'oceà.......................................................................... 11
Correspondència dels gens expressats amb l'activitat. ......................................................................... 12
Les tècniques d'empremtes dactilars (fingerprinting) ............................................................................... 13
El picoplàncton eucariota a la costa de Blanes ..................................................................................... 15
Els microorganismes i la llum.................................................................................................................. 17
CHAPTER I. Transcriptome fingerprinting analysis: an approach to explore gene
expression patterns in marine microbial communities .............................................................................. 21
CHAPTER II. Comparison of picoeukaryotic gene expression patterns with
community composition along the seasonal cycle in the NW Mediterranean ........................................45
CHAPTER III. Gene expression patterns and community composition of marine
picoeukaryotes: changes with depth, distance from shore, and along diel cycles...................................73
CHAPTER IV. Transcriptional response of Ruegeria sp. strain TM1040 to light ....................................99
CHAPTER V. Light stimulates growth of proteorhodopsin-containing marine
Flavobacteria ................................................................................................................................................ 127
CONSIDERACIONS FINALS.............................................................................................................................. 147
CONCLUSIONS.................................................................................................................................................... 153
BIBLIOGRAFIA (Introducció i consideracions finals) ........................................................................................ 157
AGRAÏMENTS ...................................................................................................................................................... 165


5
RESUM
Ara que es comença a treure l’entrellat -o si més no a tenir una nova perspectiva- de la diversitat de
microorganismes present als oceans gràcies a la biologia molecular i a la metagenòmica, el següent pas
és esbrinar quines són les noves funcions que aquesta amaga i com són utilitzades i per qui a l’oceà.
La regulació de l’expressió gènica és la base de la versatilitat i l’adaptabilitat de qualsevol organisme al
medi on viu. De l’estudi dels gens expressats d’un organisme es poden deduir correctament moltes de
les característiques del medi on la seva vida es desenvolupa habitualment. En cada situació els organ-
ismes expressen solament una part del seus gens, responent tant a factors interns (per exemple el cicle
cel·lular) com a factors externs (temperatura, llum, aport de nutrients...).
Les tecnologies de seqüenciació massiva també s’han aplicat en l’estudi de l’expressió de les comunitats
microbianes marines (metatranscriptòmica). Tanmateix, aquestes tecnologies encara no estan prou op-
timitzades i sovint proporcionen seqüències que no poden ser assignades a cap gen conegut. En aquesta
tesi ens hem plantejat l’estudi de l’expressió gènica dels microorganismes marins a tres escales diferents:
a escala de comunitat, de genoma, i de gen.
L’esforç més gran ha estat estudiar l’expressió gènica a escala de comunitat, on el nostre repte ha
estat desenvolupar una tècnica equivalent als mètodes “d’empremta dactilar” (fingerprinting) del DNA
que s’usen de forma rutinària –com la DGGE o l’ARISA- per tal d’explorar la dinàmica dels patrons
d’expressió gènica de les comunitats de microbis marins, permetent la comparació d’un gran nombre
de mostres a un preu assequible i sense la necessitat prèvia de saber les seqüències dels RNA missat-
gers. Aquesta tècnica, batejada com a TFA (de “Transcriptome Fingerprinting Analysis”), ens ha permès
estudiar I) les variacions estacionals en els patrons d’expressió gènica dels picoeucariotes marins de
l’Observatori Microbià de la Badia de Blanes durant 4 anys, i II) les variacions dels patrons d’expressió
al llarg d’un gradient espacial horitzontal i vertical i d’un gradient temporal. En ambdós casos, els
canvis d’expressió s’han comparat amb els canvis en l’estructura de la comunitat (mitjançant l’ARISA).
A escala genòmica hem estudiat la resposta transcripcional global d’un microorganisme heteròtrof
a la llum. La llum és responsable d’una gran quantitat de respostes fisiològiques. Una gran part dels
microorganismes del mar que utilitzen la llum ho fan mitjançant la fotosíntesis, però existeixen d’altres
microorganismes que utilitzen la llum de manera diferent, com els fotoheteròtrofs, que la utilitzen
per generar energia però no fixen CO2. En un dels estudis de genòmica ambiental es va descobrir la
presència d’una proteïna fotoactiva, la proteorodopsina, associada a un grup de bacteris marins no cul-
tivats. Les proteorodopsines són responsables d’un nou mecanisme de fototrofia als oceans; funcionen
com a bombes de protons accionades per la llum que generen un gradient de protons a la membrana
per tal de sintetitzar ATP.
A escala de gen, en aquesta tesi hem estudiat mitjançant RT-PCR l’expressió del gen de la proteoro-
dopsina en un cultiu d’una flavobacteria marina i hem vist que la llum augmentava els seus nivells
d’expressió.

7
SUMMARY
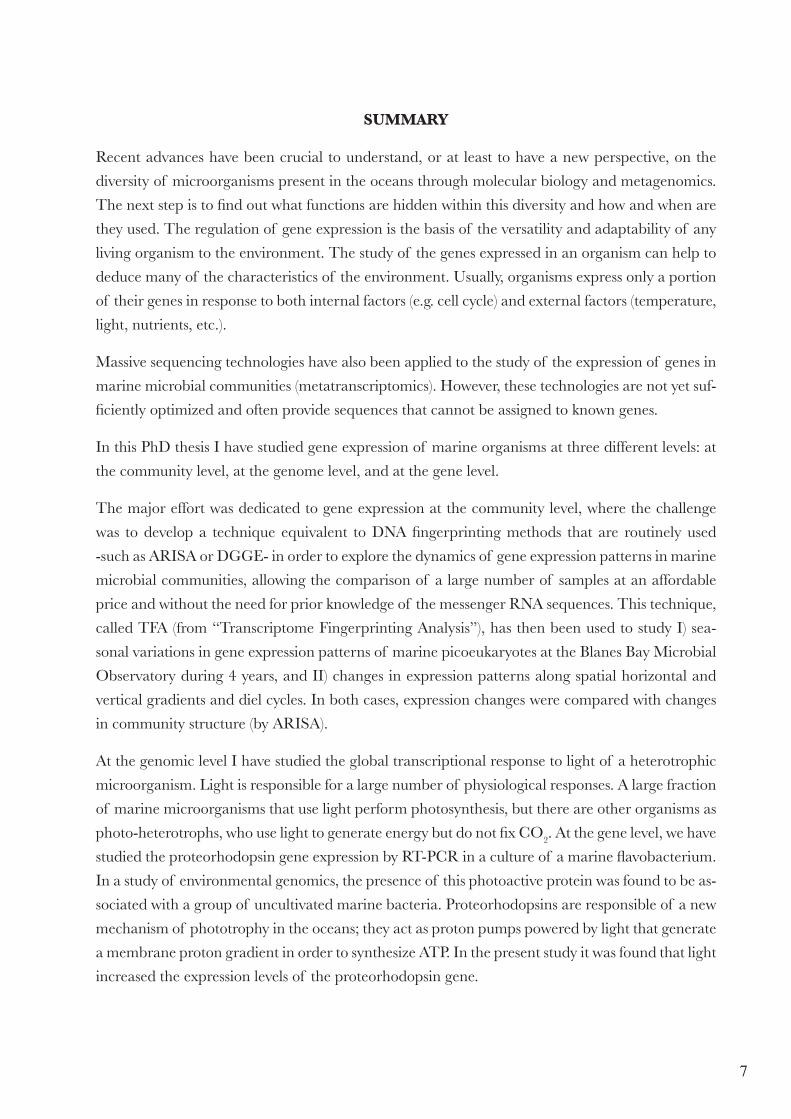
Recent advances have been crucial to understand, or at least to have a new perspective, on the
diversity of microorganisms present in the oceans through molecular biology and metagenomics.
The next step is to find out what functions are hidden within this diversity and how and when are
they used. The regulation of gene expression is the basis of the versatility and adaptability of any
living organism to the environment. The study of the genes expressed in an organism can help to
deduce many of the characteristics of the environment. Usually, organisms express only a portion
of their genes in response to both internal factors (e.g. cell cycle) and external factors (temperature,
light, nutrients, etc.).
Massive sequencing technologies have also been applied to the study of the expression of genes in
marine microbial communities (metatranscriptomics). However, these technologies are not yet suf-
ficiently optimized and often provide sequences that cannot be assigned to known genes.
In this PhD thesis I have studied gene expression of marine organisms at three different levels: at
the community level, at the genome level, and at the gene level.
The major effort was dedicated to gene expression at the community level, where the challenge
was to develop a technique equivalent to DNA fingerprinting methods that are routinely used
-such as ARISA or DGGE- in order to explore the dynamics of gene expression patterns in marine
microbial communities, allowing the comparison of a large number of samples at an affordable
price and without the need for prior knowledge of the messenger RNA sequences. This technique,
called TFA (from “Transcriptome Fingerprinting Analysis”), has then been used to study I) sea-
sonal variations in gene expression patterns of marine picoeukaryotes at the Blanes Bay Microbial
Observatory during 4 years, and II) changes in expression patterns along spatial horizontal and
vertical gradients and diel cycles. In both cases, expression changes were compared with changes
in community structure (by ARISA).
At the genomic level I have studied the global transcriptional response to light of a heterotrophic
microorganism. Light is responsible for a large number of physiological responses. A large fraction
of marine microorganisms that use light perform photosynthesis, but there are other organisms as
photo-heterotrophs, who use light to generate energy but do not fix CO2. At the gene level, we have
studied the proteorhodopsin gene expression by RT-PCR in a culture of a marine flavobacterium.
In a study of environmental genomics, the presence of this photoactive protein was found to be as-
sociated with a group of uncultivated marine bacteria. Proteorhodopsins are responsible of a new
mechanism of phototrophy in the oceans; they act as proton pumps powered by light that generate
a membrane proton gradient in order to synthesize ATP. In the present study it was found that light
increased the expression levels of the proteorhodopsin gene.

9
Introducció
Elsmicroorganismes són els éssers viusmés abundants i diversos quehi ha a laTerra
(Baldauf,2008;Whitman,Coleman,&Wiebe,1998)iabarquentotselsprocessosdelsqualsles
cèl·lulesvivessóncapaces.Solamentelsmicrobis,especialmentelsbacteris,conservenlamajor
part,sinototes,delesdiversespotencialitatsdelavida.Ladiversitatprocariota,bacterisiarqueus,
esmanifestasobretotenelseumetabolisme,encanvi,totiqueelseucariotestambétenencerta
diversitatmetabòlica,manifestenunventallmoltmésgrandediversitatmorfològicaidecompor-
tament.
ELS MICROORGANISMES MARINS
Mésdel90%delabiomassad’éssersviusal’oceàsónmicroorganismes(Whitmanetal.,
1998).L’activitatd’aquestsmicroorganismesésessencialpelmetabolismedelsistemamarí,tant
pelciclebiogeoquímicdelcarboni(produccióirespiració)compelsaltrescicles.Sónresponsables
del50%delaproduccióprimàriadelplaneta(Field,Behrenfeld,Randerson,&Falkowski,1998)
ilamajorpartdelarespiracióalesaigüesmarineséstambédegudaaells(delGiorgio&Duarte,
2002).Aitalproducciópotfluiratravésdelacadenad’herbívors(zooplànctonipeixos),circular
perlaxarxatròficamicrobiana(bacterisiprotistes)osedimentarcapalesprofunditats.Laim-
portànciarelativadecadascunad’aquestestresviestégransrepercussionsperalsrecursospesqu-
ers,labombabiològicadelcarboniilaregulaciódelclima.Pertant,sónuncomponentessencial
delesxarxestròfiquesdelsecosistemesmarins.

Expressió gènica en microorganismes marins
10
Lamajoriad’aquestsmicroorganismes encarano sóncultivablesperògràcies a les tèc-
niquesmolecularsialesúltimestecnologiesdeseqüenciaciópodemdirquetenimunaideaaproxi-
madadequinssónelsmembresqueformenlescomunitats.L’amplificacióperPCRdemolècules
filogenèticamentinformativescoml’rRNA16Siel18Shaproporcionatunanovaperspectivade
labiodiversitat(Massana&Pedrós-Alió,2008;Pace,Stahl,Lane,&Olsen,1986).Podemdirque
l’estatdelconeixementde ladiversitatmicrobianaalsoceansestàenunafasedescriptivaforça
avançada(sobretotrespectepocsanysenrere)iencanvicontinudegutal’aplicaciódetècniques
cadavegadaméspotents(Soginetal.,2006).Peròperaquestmotiuitambéperlacontrovèrsiaa
l’horadedefinirles“espècies”microbianesencaraesfaforçadifícilferunaestimacióconcretade
ladiversitat(Pedrós-Alió,2006).
Ambeldescobrimentdetantadiversitat“inesperada”sorgeix lanecessitatparal·lelad’esbrinar
elpaperque tenena lacomunitataquestsnousmicroorganismes,explorarel reservoride fun-
cionsqueaquestaamagaicomaquestesfuncionssónutilitzadesiperquial’oceà.Unamanera
d’aproximar-nosal’estudidelafuncióésatravésdel’expressiógènica.
EL PROCÉS DE L’EXPRESSIÓ GÈNICA
L’expressiógènicaésunprocés complexquedeterminaquinsgens seranexpressats com
aproteïnesenunmomentdeterminat,aixícomelsnivellsrelatiusd’abundànciad’aquestespro-
teïnes.Elprocésd’expressiógènica implicaunasèried’etapes: (i) sínteside l’RNA,otranscrip-
ció,(ii)processamentdel’mRNA(solseneucariotesgeneralment.Desprésdelseuprocessament,
l’RNAesconsideramRNA),(iii)transportdel’mRNAdesdelnuclialcitoplasma(eneucariotes),
(iv)síntesiproteica,otraducció(l’mRNAésusatcomamotlleperferlatraduccióaproteïnes,la
seqüènciad’aminoàcidsdelesqualsestàrelacionadaamblaseqüèncianucleotídicadel’mRNA),
(v)degradaciódel’mRNA,i(vi)modificacionspost-traduccionals(incloentdegradació)delespro-
teïnes.Hihagensquenocodifiquenperproteïnes,comperexempleelsquecodifiquenperl’RNA
ribosòmicil’RNAdetransferència.
ElsmRNAbacteriansgeneralmentnosónprocessatsdesprésdelatranscripció.ElsmRNA
d’eucariontssónsintetitzatsalnucliihandeserexportatsalcitoplasmapertaldesertraduïtsa
proteïna.Lamajoriademissatgerseucariotestenenunaseqüènciapoliadenílicaalazona3’,la
cuapoliA(aquestacaracterísticadelsmissatgerseucariotesensseràmoltútilal’horadelplanteja-
mentmetodològic).Lafunciód’aquestacuaencaranoésdeltotconeguda,peròpotteniraveure
ambl’exportaciódel’mRNAmadurcapalcitoplasmaopotactuarcomaestabilitzadordeles
molèculesd’mRNAretardantlasevadegradacióalcitoplasma(Dreyfus&Régnier,2002).

Introducció
11
Laregulaciódel’expressiógènicaéslabasedelaversatilitatiadaptabilitatdequalsevolor-
ganismealmedionviu.Encadasituacióconcretaelsorganismesexpressensolamentunapartdels
seusgens.Elconjuntdegensques’expressenresponafactorsinterns(perexempleelciclecel·lular)
iafactorsexterns(temperatura,aportdenutrients,llum...).Ésevidentqueperentendrel’ecologia
dequalsevolmediseriamoltútilsaberquinssónelsgensques’estanexpressantacadamoment.
ESTUDI DE LES FUNCIONS DELS MICROORGANISMES A L’OCEÀ:
LA METATRANSCRIPTÒMICA
Elsintentsperrelacionardiversitatifuncióhanestatpresentsdesdelsprimersestudisdediversitat
microbiana.Anteriorment a la revolucióde la genòmica/metatranscriptòmica, la funcionalitat
delsorganismesquehabitenl’oceàhaestatabordadadeformesdiverses.Perexemple(Brock&
Brock, 1996) van introduir lamicroautoradiografia (MA) comuna eina per estudiar l’activitat
d’organismesaquatics individualsdemostresnaturals.Aquesta tècnicaconsisteixen incubar la
comunitatnaturalambunprecursormetabòlicmarcat radioactivament idesprésesdetermina
quinapoblaciól’incorporamitjançantelrevelatd’unaemulsiófotogràfica.Amésamés,espot
determinar la identitat de les cèl·lules amb sondesmoleculars específiques. Per exemple, amb
aquestatècnicas’haestablertqueelsalfa-proteobacterisconsumeixenaminoàcidsmentrequeles
citòfaguesprefereixenlesproteïnes(Cottrell&Kirchman,2000).
Comhemvist,l’expressiógènicaésunbonindicadordelsprocessosques’estanduenta
terme,jaquedel’estudidelsgensexpressatsd’unorganismeespodendeduircorrectamentmoltes
delescaracterístiquesdelmedionlasevavidaesdesenvolupahabitualment.Existeixendiversos
mètodesperdetectarl’expressiódelsgens,perexemple:I)Ladeteccióin situdel’RNAmitjançant
sondes(Pernthaler&Amann,2004),aquestatècnicaperòencaraestàllunydeseraplicadadefor-
marutinària,sobretotperlainestabilitatdel’mRNA.II)Finsfapoc,elmètodeescollitperdetectar
l’expressiódegensfuncionalshaestatlaRT-PCR:latranscripcióreversa(RT)delsmRNAambla
sevaposterioramplificacióperPCR(he usat aquesta tècnica en el capítol 5 per a la detecció de l’expressió del
gen de la proteorodopsina),iIII)unaltremètodeforçautilitzatfinsquevaaparèixerlagenòmicaiels
seusderivatshanestatelsmicroarrays-oxipsdeDNA-(Schena,Shalon,Davis,&Brown,1995). Elsmicroarrayssónunacol·lecciódefragmentsdeDNAmicroscòpicsancoratsindividualmenten
diferentscel·lesperenllaçoscovalentsaunasuperfíciesòlida(comunportaobjectes).Elsmicroar-
rayspermetenmonitoritzarelsnivellsd’expressiódemilersdegensdeformasimultània(en el capítol
4 he usat els microarrays per detectar la resposta transcripcional global d’un microorganisme a la llum).

Expressió gènica en microorganismes marins
12
Seguint l’onada del desenvolupament de la genòmica, l’any 2008 va irrompre la seqüenciació
del’RNA(RNA-seq),queconsisteixenlaseqüenciacióenprofunditatdelDNAcomplementari
(cDNA)generatapartirdemostresd’RNA(Wang,Gerstein,&Snyder,2009).Tanmateix,lameta-
transcriptòmica(igualquelarestad’òmiques)encaranohaassolitunnivellòptimd’estandarització
iromanendiversosaspectespermillorarquevanadreçant-semicaenmica(Behnkeetal.,2011;
Huse,Huber,Morrison,Sogin,&Welch,2007;Levinetal.,2010;Quinceetal.,2009;VanVliet,
2010).
Elsmetatranscriptomesespodenobtenira travésdediferentsmetodologiesdeseqüenciacióde
novageneració(NextGen):Roche454,IlluminaiABISOLiD.L’aplicaciód’aquestestècniques
dónainformaciódetalladadeladiversitattaxonòmicaifuncionaldelacomunitattranscripcional-
mentactiva,jaqueescaracteritzentantelsRNAmissatgerscomelsribosòmics.
Perunabanda,elfetquetambéescaracteritzil’RNAribosomalésunavantatgejaqueaixís’obté
unaideadelacomposiciótaxonòmicadelacomunitat,peròalmateixtempsésuninconvenient
jaque,comhemditabans,s’obtégràciesaunatècnicaencaranoprouoptimitzadaincapaçde
recuperar només elsmRNA.Per exemple, les preparacions d’RNAbacterià normalment con-
tenenfinsaun80%d’rRNAi tRNA(Condon,2007).Amésamés,elsmRNAbacterians so-
vint tenenunavidamitjanamoltcurta i sónaltament inestables (Deutscher,2006).Lamajoria
d’estudisdetranscriptòmicaeliminenparcialmentlesseqüènciesd’rRNAitRNA(Passalacquaet
al.,2009).Existeixendiferentsestudisdemetatranscriptòmicamicrobianaons’adreçaelproblema
del’eliminaciódepartdel’RNAribosòmic(Heetal.,2010;Stewart,Ottesen,&DeLong,2010).
L’altregran inconvenientde lametatranscriptòmicaésquefadianaaseqüènciesquesónalta-
mentexpressadesiquemoltsovintsónnoves.Lainterpretaciód’aquestesdadesestàsubjecteala
informacióprèviacontingudaalesbasesdedadesialsmicroorganismesalsqualsse’lsdestinamés
estudi.Laproporciódeseqüènciesdesconegudespotarribarasermésqueconsiderable,enmolts
delsestudisinclúspotarribaraserfinsel90%delesseqüènciesobtingudes!(Gilbertetal.,2008).
Pertant,elucidarlesfuncionsdefamíliessenceresdegensésundelsgransreptesactuals.
CORRESPONDÈNCIA DELS GENS EXPRESSATS AMB L’ACTIVITAT.
ACOBLAMENT TRANSCRIPCIÓ-FUNCIÓ
S’havistqueelnivelld’activitatd’unafuncióbioquímicaconcretade lacomunitatmicrobiana
potserpreditaapartirde l’abundànciadelcorresponent trànscritdelmetatranscriptomade la
comunitat(Helbling,Ackermann,Fenner,Kohler,&Johnson,2012).Existeixenvarisestudisque

Introducció
13
demostrenquebonapartdelaregulaciógènicatanteneucariotescomenprocariotesesprodueix
anivelltranscripcional(Lu,Vogel,Wang,Yao,&Marcotte,2007).Enaquestestudivanveureque
el73%delavariànciaenl’abundànciadeproteïnesd’unllevatiel47%enE. colis’explicavaper
l’abundànciadelsmRNAs.Tanmateix,tambéhihaestudisquemostrenquenosempreelscanvis
produïtseneltranscriptomaestanenconcordànciaambelscanvistraduccionals(LeRochetal.,
2004;Smithetal.,2010).
LES TÈCNIQUES D’EMPREMTES DACTILARS (FINGERPRINTING)
Enmoltsdelsestudisdemetatranscriptòmica,sobretotenelsinicials,lamajoriadegensseqüen-
ciatscorresponenamaquinàriabàsicaquelacèl·lulautilitzapersobreviure,laqualcosafadifícil
veurequinssónelsgensrellevantsdonatsperunasituacióambiental.Peraixò,elsestudisones
comparensituacionsdiferentssónmésinformatius.Unamaneradedetectarfàcilmentcomsónde
diferentsduesomésmostresentresíabansdecomençaraferelsmetatranscriptomesdetotplegat
ésaplicanttècniquesdefingerprintingd’RNAoDNA.Lestècniquesdefingerprinting,comlaDGGE
o l’ARISA, tenen l’avantatgequepermetencomparar simultàniamentmoltesmostresdiferents
deformaràpidaiaunpreurelativamentbarat.Alataula1escomparaelnombreaproximatde
bandesproduïdesperalgunesd’aquestestècniques.
En aquesta tesi he desenvolupat una tècnica de fingerprinting d’mRNA que pot ser útil a l’hora de determinar
prèviament quines mostres són les més apropiades per l’obtenció dels seus metatranscriptomes (capítol 1).
Taula 1. Mètodes de fingerprinting i número aproximat de bandes
obtingudes amb cadascun d’ells.
Tècnica de fingerprinting Nº de bandes
DGGE ∼35
T-RFLP ∼200
ARISA ∼500
TFA ∼100-500

Expressió gènica en microorganismes marins
14
D’aquílaimportànciadelestècniquesdefingerprinting,comladesenvolupadaenaquestatesi,el
Transcriptome Fingerprinting Analysis(TFA),queenspermetencaptarunasignaturafilogenèticaifun-
cionalquefaràquepoguemseparariidentificardiferentstransicionsespacialsitemporalsenel
medimarí.
Del Differential Display al Transcriptome Fingerprinting Analysis
L’any1992esvadescriureunnoumètodeperidentificargensexpressatsdiferencialment(Liang&
Pardee,1992);l’anomenatdifferential display (Figura1).Latècnicadeldifferential displayconsisteixen
obtenirpatronsd’expressióglobalsdediferentssituacions(posteriorment,ambunnotableesforç
extraespodenidentificarelsgensexpressatsdiferencialment).Peraixò,calextreurel’RNApresent
enlesmostresd’interès,sintetitzarelscDNAscomplementarisambencebadorsoligodT(s’uneixen
alazona3’delsmissatgersdelseucariotes-cuapoliA-),idesprésferlaPCRcombinantelsenceba-
dorsoligodT(enaquestpasmarcatsambunfluoròfor)ambdiferentsencebadorsarbitraris.
Figura 1. Esquema dels principals passos del protocol de differential display.
RNA mostra 1 RNA mostra 2 Extracció RNA total lliure de DNA • Mostres de condicions diferents
Electroforesi i visualització de les bandes
Primers mostres RNA
Differential display dels productes de PCR
Differential display dels productes de PCR
Differential Display PCR • Vàries parelles de primers arbitraris • Polimerasa
Motlle cDNA Motlle cDNA Síntesis del cDNA de l’RNA missatger • Primers oligo(dT) • Transcriptasa reversa
Perfils globals d’expressió utilitzant anàlisis de fragments
F1/R1 F2/R1 F3/R1 F1/R2 F2/R2 F3/R2 1 2 1 2 1 2 1 2 1 2 1 2

Introducció
15
ElsproductesdePCResseparenenunanalitzadorgenèticperobtenirunpatródepics,oncada
piccorresponaunRNAmissatgerdiferent(tambéespodriensepararmitjançantelectroforesisen
gel).Comparantelspatronsdebandesdecadamostraespodenidentificarlesbandesqueapa-
reixenenunasituacióoenunaaltra,ifinalmentespodrientallariseqüenciarperidentificarels
gensexpressatscaracterísticsdecadasituació.
En aquesta tesi he adaptat aquesta tècnica per tal d’explorar la dinàmica dels patrons d’expressió gènica de les
comunitats de microorganismes marins, permetent la comparació d’un gran nombre de mostres a un preu assequible
i sense la necessitat prèvia de saber les seqüències dels missatgers.
UnpuntbàsicenelTFAésquenorequereixelconeixementprevidelesseqüènciesdelsmRNAs
ques’handedetectartalcompassaenelsmicroarrays,iaixòésmoltútilensistemesonnohihao
hihapocainformaciógenòmica.Pertant,enelTFAdetectemindistintamentpatronstantdegens
conegutscomdedesconeguts.
EnelTFAs’hadetenirencompteunasèriedepunts importants: laquantitatd’RNAinicial,
l’absènciadeDNAgenòmica lamostrad’RNA, la selecciódelsencebadors, lescondicionsde
PCR,elmètodedemarcatgedelsamplicons(radioactivitat,fluorescència),etc.Lesdecisionsque
s’hanpresalllargdetotelprocésiquedeterminaranelresultatfinalsónexplicadesambdetallal
capítol1d’aquestatesi.
EL PICOPLÀNCTON EUCARIOTA A LA COSTA DE BLANES
Unagranpartd’aquestatesis’harealitzatestudiantelspicoeucariotesdelaBadiadeBlanes.Els
picoeucariotessónuncomponentmenor-entermesdenúmerodecèl·lules-delpicoplàncton(<2-
3µm)comparatambelsprocariotes,peròmoltimportantsentermesdebiomassa.Llunydeser
unamenadebackgroundalsoceans,ensónuncomponentdestacat(Marañónetal.,2001).Aquests
organismes,comamínimaquellsquesónfotosintètitcs,juguenunpapermoltimportantenlapro-
duccióprimària,sobretotenàreesoligotròfiques,onpodenrepresentarfinsel80%delabiomassa
autotròfica(Worden,Nolan,&Palenik,2004).Mentrequeelsheteròtrofsimixòtrofsconsumeixen
imineralitzend’altresmicrobis(Sherr&Sherr,2002).
Expressió gènica en microorganismes marins
16
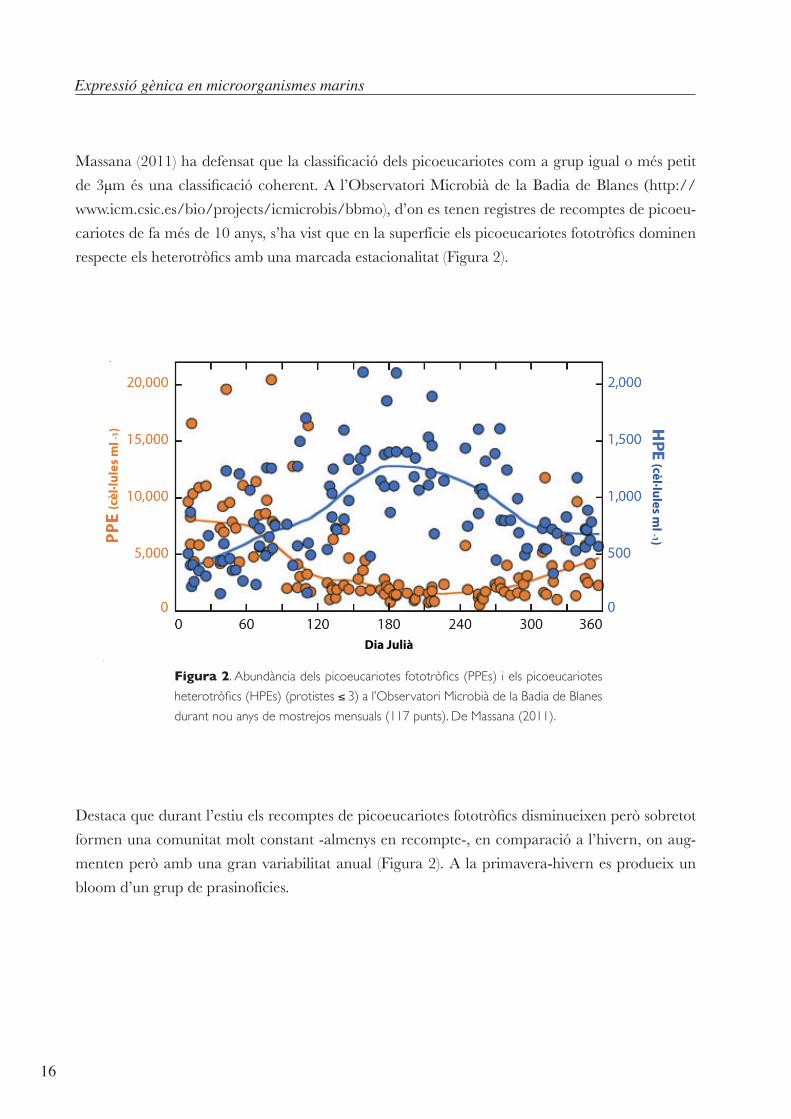
Massana(2011)hadefensatquelaclassificaciódelspicoeucariotescomagrupigualoméspetit
de3µmésunaclassificaciócoherent.A l’ObservatoriMicrobiàde laBadiadeBlanes (http://www.icm.csic.es/bio/projects/icmicrobis/bbmo),d’onestenenregistresderecomptesdepicoeu-
cariotesdefamésde10anys,s’havistqueenlasuperfícieelspicoeucariotesfototròficsdominen
respecteelsheterotròficsambunamarcadaestacionalitat(Figura2).
Dia Julià
(cèl
·lule
s m
l -1)
(cèl·lules ml -1)
Figura 2. Abundància dels picoeucariotes fototròfics (PPEs) i els picoeucariotes
heterotròfics (HPEs) (protistes ≤ 3) a l’Observatori Microbià de la Badia de Blanes
durant nou anys de mostrejos mensuals (117 punts). De Massana (2011).
Destacaquedurantl’estiuelsrecomptesdepicoeucariotesfototròficsdisminueixenperòsobretot
formenunacomunitatmoltconstant-almenysenrecompte-,encomparacióal’hivern,onaug-
mentenperòambunagranvariabilitatanual (Figura2).Alaprimavera-hivernesprodueixun
bloomd’ungrupdeprasinofícies.
Introducció
17
ELS MICROORGANISMES I LA LLUM
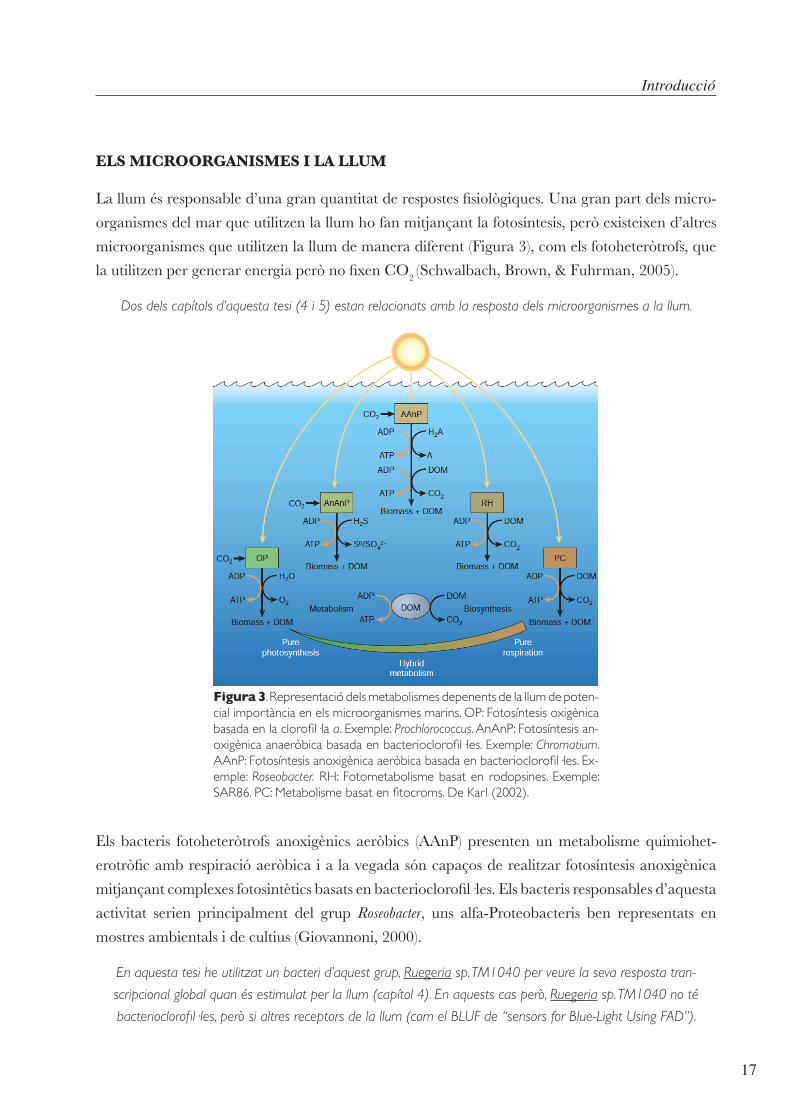
Lallumésresponsabled’unagranquantitatderespostesfisiològiques.Unagranpartdelsmicro-
organismesdelmarqueutilitzenlallumhofanmitjançantlafotosíntesis,peròexisteixend’altres
microorganismesqueutilitzenlallumdemaneradiferent(Figura3),comelsfotoheteròtrofs,que
lautilitzenpergenerarenergiaperònofixenCO2(Schwalbach,Brown,&Fuhrman,2005).
Dos dels capítols d’aquesta tesi (4 i 5) estan relacionats amb la resposta dels microorganismes a la llum.
Figura 3. Representació dels metabolismes depenents de la llum de poten-cial importància en els microorganismes marins. OP: Fotosíntesis oxigènica basada en la clorofil·la a. Exemple: Prochlorococcus. AnAnP: Fotosíntesis an-oxigènica anaeròbica basada en bacterioclorofil·les. Exemple: Chromatium. AAnP: Fotosíntesis anoxigènica aeròbica basada en bacterioclorofil·les. Ex-emple: Roseobacter. RH: Fotometabolisme basat en rodopsines. Exemple: SAR86. PC: Metabolisme basat en fitocroms. De Karl (2002).
Els bacteris fotoheteròtrofs anoxigènics aeròbics (AAnP) presentenunmetabolismequimiohet-
erotròficambrespiracióaeròbicaialavegadasóncapaçosderealitzarfotosíntesisanoxigènica
mitjançantcomplexesfotosintèticsbasatsenbacterioclorofil·les.Elsbacterisresponsablesd’aquesta
activitat serien principalment del grupRoseobacter, uns alfa-Proteobacteris ben representats en
mostresambientalsidecultius(Giovannoni,2000).
En aquesta tesi he utilitzat un bacteri d’aquest grup, Ruegeria sp. TM1040 per veure la seva resposta tran-
scripcional global quan és estimulat per la llum (capítol 4). En aquests cas però, Ruegeria sp. TM1040 no té
bacterioclorofil·les, però si altres receptors de la llum (com el BLUF de “sensors for Blue-Light Using FAD”).

Expressió gènica en microorganismes marins
18
Enundelsestudisdegenòmicaambientalesvadescobrirlapresènciad’unpigmentrelacionat
amblesrodopsines(proteorodopsines)associataungrupdebacterismarinsnocultivats, elSAR86dinsdelsgamma-Proteobacteria(Béjàetal.,2000).Lesproteorodopsinesfuncionencomabombes
deprotonsfotoactivesquegenerenungradientdeprotonsalamembranapertaldegenerarATP
(Figura4).
Méstardesvaveurequelesproteorodopsinesestanàmpliamentdistribuïdesalesaigüesmarines
superficialsiquesónpresentsalsgenomesdemoltesespèciesnocultivades(delaTorreetal.,2003;
Sabehietal.,2003;Venteretal.,2004).
Figura 4. Les proteorodopsines són bombes de
protons bacterianes (1) que amb l’energia de la llum
generen un gradient de protons a través de la mem-
brana (2). A través d’una ATPasa (3), aquest gradient és
utilitzat per generar ATP (5) a partir d’ADP i fósfor (4).
La molècula de retinal (cromòfor) canvia de confor-
mació quan absorbeix un fotó, i aquest canvi produeix
també un canvi conformacional de la proteïna i llavors
és quan es produeix l’acció de bombejar protons cap
a l’exterior. De DeLong i Béjà (2010). Il·lustració de
Kirsten Carlson.
Hihadiferentstipusdeproteorodopsinesqueabsorbeixenméseficientmentsegonslalon-
gitudd’ona.El fetqueabsorbeixinaunaoaltra longituddepèn solsde la identitatd’unami-
noàciddelasevaseqüència(esdiuqueestansintonitzadesperabsorbiradeterminadalongitud
d’ona-spectral tuning-).N’hihadedostipus:lesqueabsorbeixenenelverd(525nm,ipodentenir
l’aminoàcidleucinaometionina)ilesqueabsorbeixenenelblau(490nm,ambl’aminoàcidglu-
tamina).Aquestesvariantsdelgendelaproteorodopsinanoestandistribuïdesal’atzar.Defet,el
seumàximd’absorciótédiferentsdistribucionsalllargdegradientsdeprofunditatidegradients
horitzontals(Manetal.,2003;Sabehietal.,2003).

Introducció
19
Elgende laproteorodopsinava serdetectat en el genoma seqüenciat completdeDokdonia sp.
MED134,unaFlavobacteriaaïlladadel’ObservatoriMicrobiàdelaBadiadeBlanes.
És per això que es van utilitzar cultius d’aquesta soca per veure com podia influenciar el fet de tenir aquesta proteïna
en el creixement del bacteri i es va estudiar mitjançant RT-PCR l’expressió del gen de la proteorodopsina, responsable
d’un nou mecanisme de fototrofia als oceans (capítol 5).
En resum, en el primer capítol de la tesi descric la posada a punt del mètode de fingerprinting de l’mRNA (el
Transcriptome Fingerprinting Analysis) i en els capítols 2 i 3 aplico aquest mètode per tal de veure les variacions
estacionals (capítol 2) i les variacions espacials i temporals (capítol 3) dels patrons d’expressió gènica de les
comunitats de picoeucariotes marins. En el capítol 4 utilizo un microarray amb el genoma complet de Ruegeria
sp. TM1040, un membre del grup dels Roseobacter, per tal de veure la seva resposta transcripcional global a la
llum. I en el capítol 5 utilitzo la tècnica de RT-PCR per detectar l’expressió de la proteorodopsina en un cultiu
d’una Flavobacteria marina (Dokdonia sp. MED134).


Chapter 1
Transcriptome Fingerprinting Analysis: An Approach to Explore Gene Expression Patterns
in Marine Microbial Communities

Chapter I
23
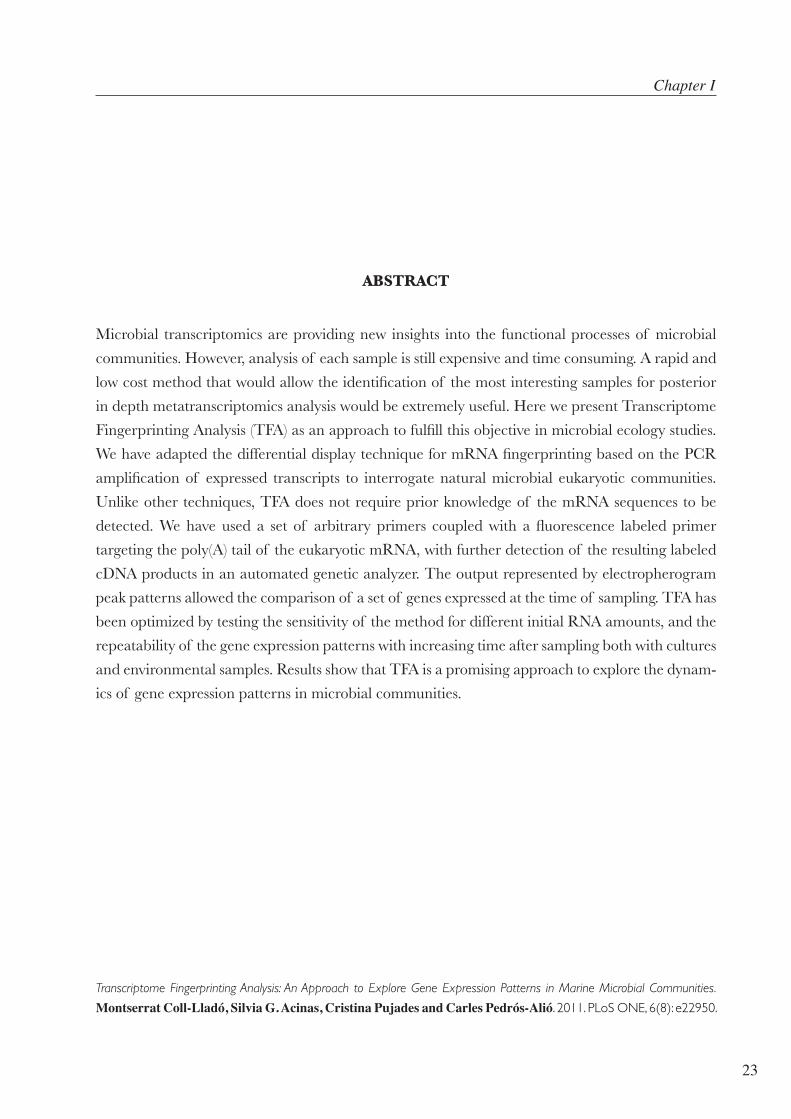
ABSTRACT
Microbial transcriptomics are providing new insights into the functional processes of microbial
communities. However, analysis of each sample is still expensive and time consuming. A rapid and
low cost method that would allow the identification of the most interesting samples for posterior
in depth metatranscriptomics analysis would be extremely useful. Here we present Transcriptome
Fingerprinting Analysis (TFA) as an approach to fulfill this objective in microbial ecology studies.
We have adapted the differential display technique for mRNA fingerprinting based on the PCR
amplification of expressed transcripts to interrogate natural microbial eukaryotic communities.
Unlike other techniques, TFA does not require prior knowledge of the mRNA sequences to be
detected. We have used a set of arbitrary primers coupled with a fluorescence labeled primer
targeting the poly(A) tail of the eukaryotic mRNA, with further detection of the resulting labeled
cDNA products in an automated genetic analyzer. The output represented by electropherogram
peak patterns allowed the comparison of a set of genes expressed at the time of sampling. TFA has
been optimized by testing the sensitivity of the method for different initial RNA amounts, and the
repeatability of the gene expression patterns with increasing time after sampling both with cultures
and environmental samples. Results show that TFA is a promising approach to explore the dynam-
ics of gene expression patterns in microbial communities.
Transcriptome Fingerprinting Analysis: An Approach to Explore Gene Expression Patterns in Marine Microbial Communities. Montserrat Coll-Lladó, Silvia G. Acinas, Cristina Pujades and Carles Pedrós-Alió. 2011. PLoS ONE, 6(8): e22950.
24
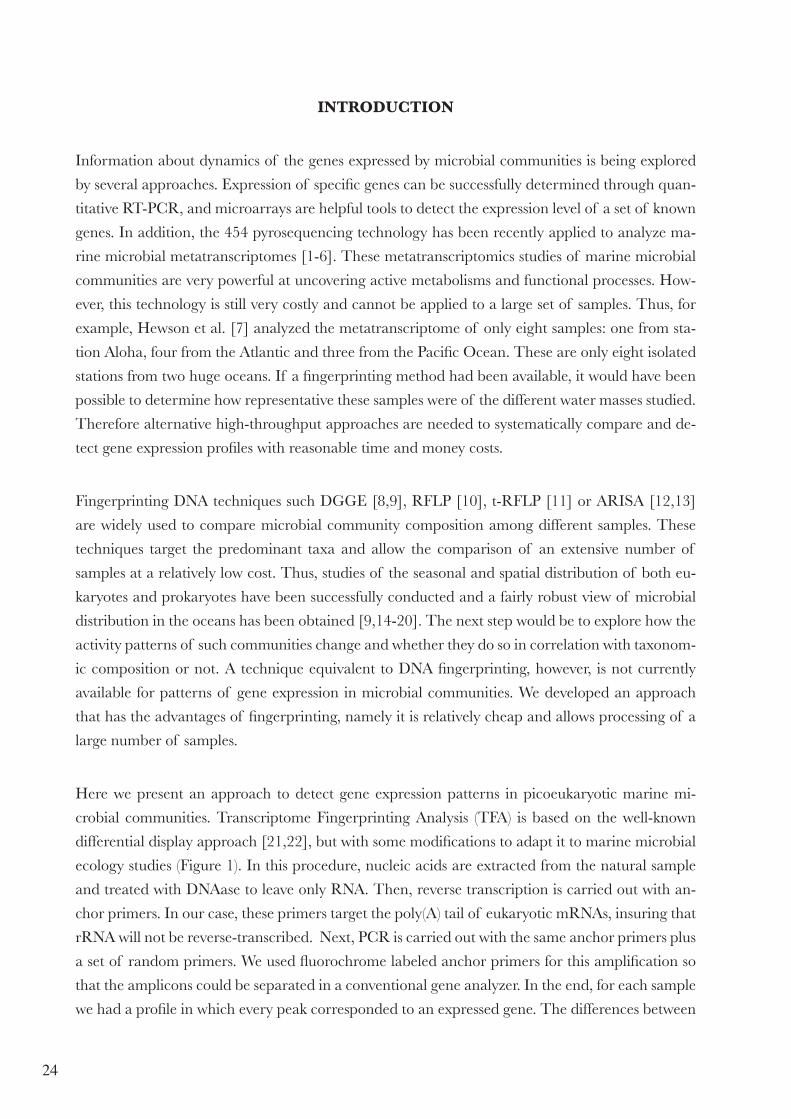
INTRODUCTION
Information about dynamics of the genes expressed by microbial communities is being explored
by several approaches. Expression of specific genes can be successfully determined through quan-
titative RT-PCR, and microarrays are helpful tools to detect the expression level of a set of known
genes. In addition, the 454 pyrosequencing technology has been recently applied to analyze ma-
rine microbial metatranscriptomes [1-6]. These metatranscriptomics studies of marine microbial
communities are very powerful at uncovering active metabolisms and functional processes. How-
ever, this technology is still very costly and cannot be applied to a large set of samples. Thus, for
example, Hewson et al. [7] analyzed the metatranscriptome of only eight samples: one from sta-
tion Aloha, four from the Atlantic and three from the Pacific Ocean. These are only eight isolated
stations from two huge oceans. If a fingerprinting method had been available, it would have been
possible to determine how representative these samples were of the different water masses studied.
Therefore alternative high-throughput approaches are needed to systematically compare and de-
tect gene expression profiles with reasonable time and money costs.
Fingerprinting DNA techniques such DGGE [8,9], RFLP [10], t-RFLP [11] or ARISA [12,13]
are widely used to compare microbial community composition among different samples. These
techniques target the predominant taxa and allow the comparison of an extensive number of
samples at a relatively low cost. Thus, studies of the seasonal and spatial distribution of both eu-
karyotes and prokaryotes have been successfully conducted and a fairly robust view of microbial
distribution in the oceans has been obtained [9,14-20]. The next step would be to explore how the
activity patterns of such communities change and whether they do so in correlation with taxonom-
ic composition or not. A technique equivalent to DNA fingerprinting, however, is not currently
available for patterns of gene expression in microbial communities. We developed an approach
that has the advantages of fingerprinting, namely it is relatively cheap and allows processing of a
large number of samples.
Here we present an approach to detect gene expression patterns in picoeukaryotic marine mi-
crobial communities. Transcriptome Fingerprinting Analysis (TFA) is based on the well-known
differential display approach [21,22], but with some modifications to adapt it to marine microbial
ecology studies (Figure 1). In this procedure, nucleic acids are extracted from the natural sample
and treated with DNAase to leave only RNA. Then, reverse transcription is carried out with an-
chor primers. In our case, these primers target the poly(A) tail of eukaryotic mRNAs, insuring that
rRNA will not be reverse-transcribed. Next, PCR is carried out with the same anchor primers plus
a set of random primers. We used fluorochrome labeled anchor primers for this amplification so
that the amplicons could be separated in a conventional gene analyzer. In the end, for each sample
we had a profile in which every peak corresponded to an expressed gene. The differences between

Chapter I
25
the expression profiles in two different environments could then be easily explored. Allegedly, each
sample should show peaks that were unique to that environment and peaks that were common
for a specific set of conditions. The differences are presumably the result of different parameters
associated with the specific environment. We determined the sensitivity and repeatability of the
method using both cultures of the prasinophyte Micromonas pusilla, and natural marine picoeukary-
otic communities from the Mediterranean Sea.
Figure 1. Scheme of the different steps in Transcriptome
Fingerprinting Analysis (TFA). Note that in step 4 there is a
mixture of ribosomal, transfer, and messenger RNAs. By us-
ing primers against the poly(A) tail, step 5 reverse-transcribe
mRNAs only.
1. Sample collection
2. Filtration
3. Freezing
4. RNA extraction (and DNA digestion)
5. Reverse Transcription
6. PCR amplification
7. Separation of amplicons with gene analyzer
mRNAs
cDNA
amplicons
RT anchor primers: H-T11G; H-T11A; H-T11CdNTPsReverse trasncriptase (SuperScript III)
GAAAAAAAAAAA
UAAAAAAAAAAACAAAAAAAAAAA
CAAAAAAAAAAAGTTTTTTTTTTT
Fluorochrome-labeled anchor primers: NH-T11G; NH-T11A; NH-T11CRandom primers (AP1, AP2...)dNTPsTaq DNA polymerase
GTTTTTTTTTTTprimer AP1
H-T11G
NH-T11G

Transcriptome fingerprinting in marine communities
26
MATERIALS AND METHODS
Sampling and collection of biomass. Sea surface samples were obtained from the tip of the
Gas pier in the Barceloneta beach (Barcelona) in 8 liter carboys. In experiment 1 (see Table 1), car-
ried out on October 3, 2007, samples were kept on ice and in experiment 2 (Table 1), carried out
on September 25, 2008, samples were either kept on ice (ICE samples) or at room temperature (RT
samples) until the end of the filtration process. Water was prefiltered through a 200-mm mesh net.
Additional water samples were collected during the MODIVUS cruise (17-27 September 2007)
on board R/V García del Cid at three stations from coastal to open sea. Seawater (8 liters) was col-
lected using Niskin bottles and was also prefiltered through 200-mm mesh net. A piece of 20-mm
Nylon mesh was attached to the entrance tube cap of the filtration system and all environmental
water samples were filtered first through a 3-mm pore-size polycarbonate filter (Poretics) and then
through a 0.2-mm polycarbonate filter (Poretics) using a peristaltic pump (MasterFlex 7553-89
with cartridges Easy Load II 77200-62, Cole-Parmer Instrument Company) to collect the bacteria
and picoeukaryotes. Filters were flash-frozen in liquid nitrogen and then stored at -80ºC until pro-
cessed. Total RNA was extracted from the 0.2-mm polycarbonate filters.
Micromonas experiments. Axenic cultures of the prasinophyte Micromonas pusilla CCMP
1545 obtained from the Provasoli–Guillard National Center for Culture of Marine Phytoplank-
ton (CCMP; https://ccmp.bigelow.org/) were grown in f/2 medium [23] at 19ºC under a daily
regime consisting of 12h of light and 12h of darkness. Growth of M. pusilla was followed by flow
cytometry (procedure described in [24]) to be sure that the cultures were in exponential growth
phase. Experiment 3 (Table 1) was initiated when cultures reached sufficient biomass after 6 days
of growth and triplicates of a time zero control were taken. Half of the bottles were kept at 4ºC
and half at 19ºC. After temperature equilibration (about five minutes) all bottles were transferred
to the dark. 4ºC and 19ºC cultures were sampled in triplicate after 15 min, 30 min, 1h, 2h and
4h of incubation. At each sampling point 10 ml of culture were filtered through 0.8-µm-pore-size
Durapore Filters and the filters were flash-frozen in liquid nitrogen and kept at -80º until RNA ex-
traction. In experiment 4 (Table 1), a M. pusilla culture was growing at 19ºC under a 12 h light/ 12
h dark cycle also until late exponential phase. Then, part of the culture was incubated separately
in the dark for 24 hours while the other remained under the light/dark regime. M. pusilla cultures
were sampled in triplicate under light and dark conditions 24 hours after splitting conditions.

Chapter I
27
RNA extraction and purification. The procedure was adapted from [25]. For RNA extrac-
tion, filters were transferred to 2 ml screw-cap microcentrifuge tubes containing 200-ml of 0.1-mm-
diameter zirconia-silica beads (BioSpec Products, Inc.) and 100-ml of 0.5 mm glass beads (BioSpec
Products, Inc.) mixed with 450-ml RLT lysis buffer (provided by the RNeasy® Mini Kit Qiagen,
Inc.) plus b-mercaptoethanol (Fluka). Samples were mechanically disrupted in a Mini-beadbeater-
8TM cell disrupter (BioSpec Products, Inc., Bartlesville, OK) for 10 min. After disruption, samples
were incubated on ice for 5 min and the beads were allowed to settle out of the lysis mixture.
Samples underwent centrifugation (in an Eppendorf centrifuge at 2100 rcf 1min). The lysate was
transferred to a new tube. 300 ml of lysis solution was added to the vials with beads to increase
the final yield. The tubes were shaken vigorously and the supernatant was also recovered. The
same volume of 70% ethanol was added to the lysate and samples were purified according to the
RNeasy® Mini Kit (Qiagen, Inc.). The isolated total RNA was treated with TurboDNase I (Am-
bion) to remove contaminating genomic DNA according to the manufacturer’s instructions. RNA
was aliquoted and quantified by absorbance at 260 nm with a NanoDrop 1000 (Thermo Fisher
Scientific Inc., Wilmington, DE).
Reverse transcription and PCR amplification. First-strand cDNA synthesis was conducted
with 20 or 40ng of total RNA as starting material. mRNAs were reverse-transcribed to single-strand-
ed complementary DNA using the SuperScript III reverse transcriptase (Invitrogen) and three dif-
ferent primers, H-T11G (5’-AAGCTTTTTTTTTTTG-3’), H-T11A (5’-AAGCTTTTTTTTTT-
TA-3’) and H-T11C (5’-AAGCTTTTTTTTTTTC-3’). To denature any secondary structure, an
aliquot of each of the RNA extracts plus the oligo(dT) primer were heated for 5 min at 65 ºC and
immediately placed on ice before mixing with the final reaction solution (20ml): 5X First-Strand
buffer, 0.1M DTT, 40U RNaseOUT, 10mM dNTPs and 200U SuperScript III RT. Reaction
mixtures were incubated at 50ºC during 50 min, and inactivated by heating 70ºC for 15 min. 2 ml
of the RT reaction product was used in a subsequent PCR. PCR reactions were carried out using
Taq polymerase (Qiagen) in a final reaction volume of 20 µl. Arbitrary primers coupled with the
same primers used in the RT reaction but labeled with a fluorescence tag (NED) were used for
the amplification of cDNA. Primers targeting the poly(A) tail and arbitrary primers for PCR were
Experiment Sample Variables tested
1 Natural sample Primer combinations, time since sampling
2 Natural sample Time since sampling at two temperatures
3 Micromonas Time elapsed at two temperatures
4 Micromonas Light and dark conditions
Table 1. Key to the different experiments showing the sample used and the variables tested in each case.

Transcriptome fingerprinting in marine communities
28
from RNAspectra Yellow kit 1 of GenHunter Corporation. These primer sequences are given in
Table 2. The PCR cycle was 40 cycles of 94 ºC for 30 s, annealing at 40 ºC for 2 min, 72 ºC for
60 s followed by 1 cycle of 72 ºC for 5 min in a Techne thermal cycler (Techne, Ltd., Cambridge).
A negative control was run for each primer combination to assess the background levels (usually
very low, below 20 relative fluorescence units -rfu-) and to ensure that there was no amplification
of genomic DNA an aliquot of the RNA extracts was added directly to the PCR.
Primer Sequence (5'-3')
RT anchor primers H-T11G 5’-AAGCTTTTTTTTTTTG-3’ H-T11A 5’-AAGCTTTTTTTTTTTA-3’ H-T11C 5’-AAGCTTTTTTTTTTTC-3’ Fluorescently-labeled PCR anchor primers NH-T11G 5’-AAGCTTTTTTTTTTTG-3’ NH-T11A 5’-AAGCTTTTTTTTTTTA-3’ NH-T11C 5’-AAGCTTTTTTTTTTTC-3’ Arbitrary primers H-AP1 5’-AAGCTTGATTGCC-3’ H-AP2 5’-AAGCTTCGACTGT-3’ H-AP3 5’-AAGCTTTGGTCAG-3’ H-AP4 5’-AAGCTTCTCAACG-3’ H-AP5 5’-AAGCTTAGTAGGC-3’ H-AP6 5’-AAGCTTGCACCAT-3’ H-AP7 5’-AAGCTTAACGAGG-3’ H-AP8 5’-AAGCTTTTACCGC-3’
Table 2. Primers used in the present study (from a commercial primer kit: RNAspec-
tra kit of GenHunter). One anchor primer was used in the RT reaction, and the same
primer but fluorescently-labeled was combined with one of the arbitrary primers in
the subsequent PCR.
Detection and analysis of peaks. 1µl of PCR product from each sample was mixed with 9
µl of Hi-Di Formamide (Applied Biosystems). 0.5 µl of size standard (ROX 500, Applied Biosys-
tems) was added to every reaction to define the standard curve between 25 and 500bp. The cDNA
peaks obtained ranged in length from 30 to 500 bp, according to the internal size standard used.
The mixtures were run on an ABI automated sequencer operating as a fragment analyzer (ABI
3130XL). The sequencer electropherograms were then analyzed using the GeneMarker software,
version 1.90 (SoftGenetics, LLC). Raw data were treated with some filters activated according
to GeneMarker instructions: baseline substraction, spike removal, auto pull up removal, smooth.
The cubic spline algorithm was used to calculate bp lengths of identified fluorescence peaks. The
following peak detection thresholds were applied: I) An intensity cutoff of 150 rfu was chosen,

Chapter I
29
although the use of this cutoff may have reduced the diversity of the communities (some peaks
larger than background were present below that cutoff. II) The stutter peak filter with a 5% left and
right percentage and a peak score between 5 and 7. In addition, the peaks were visually inspected
for sporadic inconsistencies in the binning, basically for those peaks with high intensity (larger than
500 rfu) that could make a big difference in the community pattern. Once the peaks were selected,
peak areas were used as output from GeneMarker software and were transferred to Microsoft Ex-
cel (Seattle, WA) for subsequent analysis.
Statistical analysis. The peak area data from GeneMarker were standardized (the relative peak
heights within a profile were calculated by dividing the height of an individual peak by the total
peak height -sum of the heights of all peaks in a pattern-). TFA was evaluated by comparing the
number and area of peaks (bands) between electropherograms (profiles). The similarity of TFA
profiles derived from different communities was assessed computing Bray-Curtis distances to con-
struct the similarity matrices. Patterns were explored using nonmetric multidimensional scaling
(NMDS) and clustering analysis. Primer-E version 6 was used for these analyses [26].
RESULTS
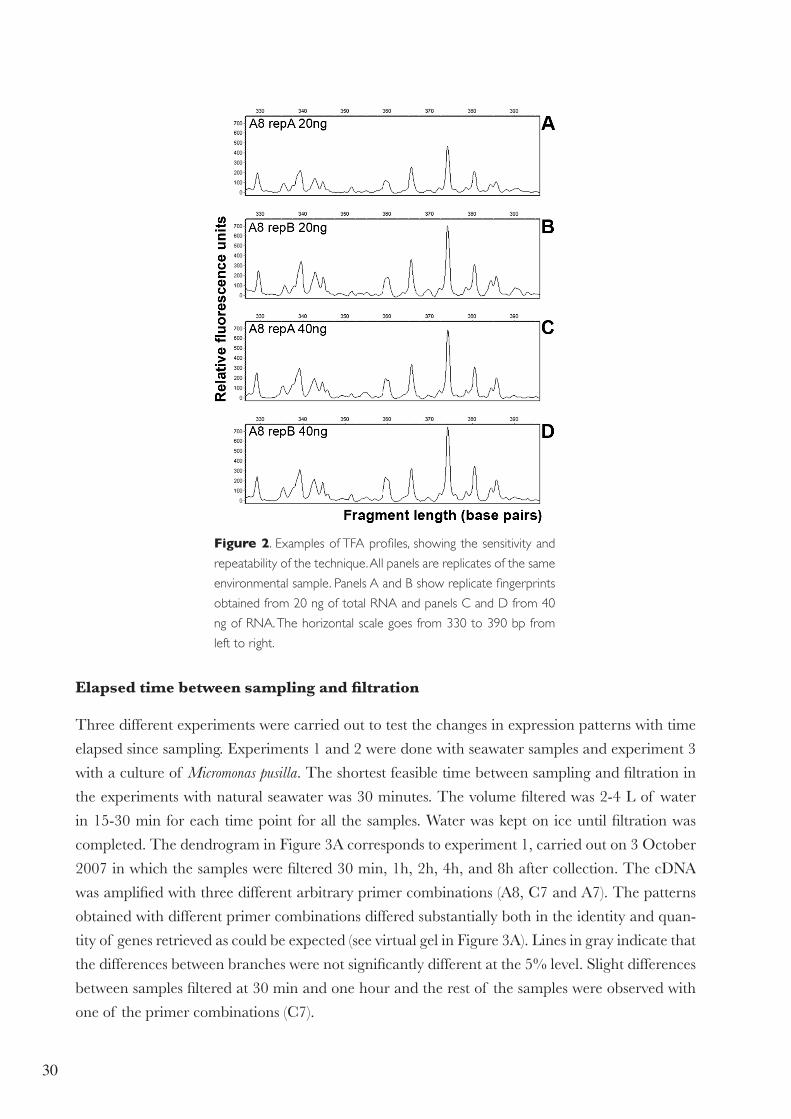
Sensitivity and repeatability of TFA
The amount of total RNA usually obtained from 8 L of seawater from oligotrophic Blanes Bay
was approximately 90 ng. Experiments showed that around 10-20 ng were optimal for good qual-
ity patterns. Higher RNA concentrations, such as 80 ng, resulted in lower signal (data not shown).
Although TFA was found to be very sensitive, it failed to produce repeatable patterns under the ini-
tially assayed conditions with the RNAspectra Yellow Kit 1 (GeneHunter). This kit is based on the
MMLV reverse transcriptase (operating at 37 °C). Different reverse transcription enzymes were
tested and the SuperScript-III enzyme (Invitrogen) produced the desired results. This is an engi-
neered version of the former enzyme active at 50 ºC. With this enzyme the repeatability was very
high, as evidenced by the fact that the electropherograms representing four replicates were identi-
cal, both with 20 and 40 ng of RNA (Figure 2). Finally, different times for the reverse transcription
reaction were tested and no differences were found between 30 and 60 min (data not shown).
30
Figure 2. Examples of TFA profiles, showing the sensitivity and
repeatability of the technique. All panels are replicates of the same
environmental sample. Panels A and B show replicate fingerprints
obtained from 20 ng of total RNA and panels C and D from 40
ng of RNA. The horizontal scale goes from 330 to 390 bp from
left to right.
Elapsed time between sampling and filtration
Three different experiments were carried out to test the changes in expression patterns with time
elapsed since sampling. Experiments 1 and 2 were done with seawater samples and experiment 3
with a culture of Micromonas pusilla. The shortest feasible time between sampling and filtration in
the experiments with natural seawater was 30 minutes. The volume filtered was 2-4 L of water
in 15-30 min for each time point for all the samples. Water was kept on ice until filtration was
completed. The dendrogram in Figure 3A corresponds to experiment 1, carried out on 3 October
2007 in which the samples were filtered 30 min, 1h, 2h, 4h, and 8h after collection. The cDNA
was amplified with three different arbitrary primer combinations (A8, C7 and A7). The patterns
obtained with different primer combinations differed substantially both in the identity and quan-
tity of genes retrieved as could be expected (see virtual gel in Figure 3A). Lines in gray indicate that
the differences between branches were not significantly different at the 5% level. Slight differences
between samples filtered at 30 min and one hour and the rest of the samples were observed with
one of the primer combinations (C7).

31
Samples treated with the primer combination A8 were run with two different initial amounts of
RNA (20 and 40 ng). The similarities among the treatments were explored with a NMDS dia-
gram (Figure 3B). A gradual change in the patterns from 30 min to 8h was observed in both sets
of samples. The amount of RNA had a small influence on the resulting pattern. However, all the
samples showed a similarity higher than 90% among them. In conclusion, keeping the samples on
ice was enough to guarantee that profiles did not differ significantly, even after 8 hours, with two
of the three primer combinations tested.
Figure 3. Comparison of TFA profiles from environmental samples filtered at progressively longer times after collection.
The shortest practical time was 30 minutes. A) and B) experiment carried out on October 3, 2007 with samples kept on
ice; and C) timing experiment carried out on September 25, 2008. A) Cluster analysis from a Bray-Curtis similarity matrix
of TFA done with three different primer combinations (A8, C7, and A7) from the same sample filtered at different times
between 30 min and 8 h. Gray lines indicate differences were not significant at the 5% level. The lane next to each sample
corresponds to the peak pattern (in a base pairs scale) of each sample in a virtual gel. B) NMDS diagram comparing
fingerprints obtained using two initial RNA amounts with the A8 primer combination. C) NMDS comparison of samples
kept on ice or at room temperature filtered at different times between 30 min and 20 h. Patterns were obtained with
the A8 primer combination. Missing replicates are due to low quality electropherograms.
20ng 40ngSimilarity 90
2D Stress: 0,0630min
30min
2h
1h
8h
4h
2h
1h
4h8h
8h4h1h2h30min8h4h2h1h30min8h4h2h1h30min
100806040200Similarity
Primer combination A8 C7 A7
100 200 300 400
IceRT
Similarity50
Ice_1h_a
Ice_1h_b
Ice_20h_b
Ice_2h_aIce_2h_b
RT_30m_a
RT_30m_b
Ice_4h_b
Ice_8h_a
Ice_8h_b
RT_2h_a
RT_2h_b
RT_4h_b
Ice_30m_a
Ice_30m_b
RT_20h_b
RT_8h_b
RT_8h_a
RT_20h_a
2D Stress: 0,08
A
B C
(bp)
Transcriptome fingerprinting in marine communities
32
In experiment 2 the effect of keeping samples either on ice or at room temperature was tested
(Figure 3C). Duplicates were done for each time point and only one set of primers was used (A8).
As expected, samples kept at room temperature during 20 hours differed the most from the initial
samples. Samples kept on ice were more similar to the initial ones than their room temperature
counterparts for the same sampling times.
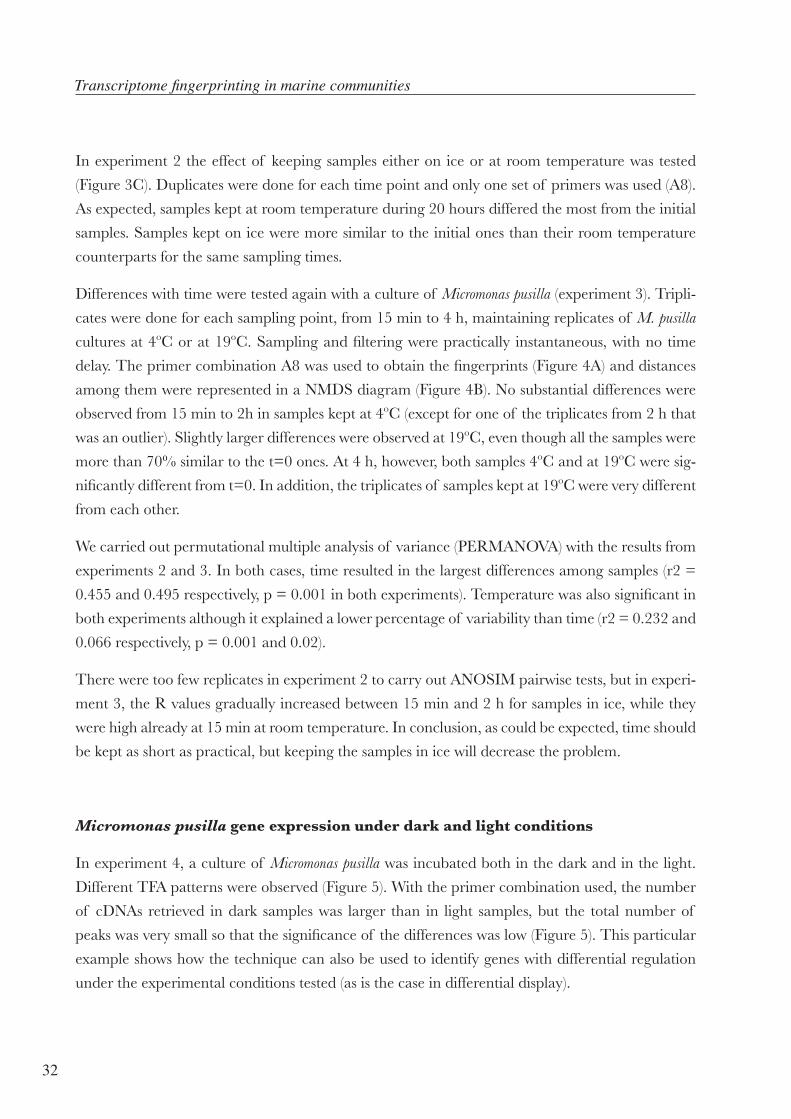
Differences with time were tested again with a culture of Micromonas pusilla (experiment 3). Tripli-
cates were done for each sampling point, from 15 min to 4 h, maintaining replicates of M. pusilla
cultures at 4ºC or at 19ºC. Sampling and filtering were practically instantaneous, with no time
delay. The primer combination A8 was used to obtain the fingerprints (Figure 4A) and distances
among them were represented in a NMDS diagram (Figure 4B). No substantial differences were
observed from 15 min to 2h in samples kept at 4ºC (except for one of the triplicates from 2 h that
was an outlier). Slightly larger differences were observed at 19ºC, even though all the samples were
more than 70% similar to the t=0 ones. At 4 h, however, both samples 4ºC and at 19ºC were sig-
nificantly different from t=0. In addition, the triplicates of samples kept at 19ºC were very different
from each other.
We carried out permutational multiple analysis of variance (PERMANOVA) with the results from
experiments 2 and 3. In both cases, time resulted in the largest differences among samples (r2 =
0.455 and 0.495 respectively, p = 0.001 in both experiments). Temperature was also significant in
both experiments although it explained a lower percentage of variability than time (r2 = 0.232 and
0.066 respectively, p = 0.001 and 0.02).
There were too few replicates in experiment 2 to carry out ANOSIM pairwise tests, but in experi-
ment 3, the R values gradually increased between 15 min and 2 h for samples in ice, while they
were high already at 15 min at room temperature. In conclusion, as could be expected, time should
be kept as short as practical, but keeping the samples in ice will decrease the problem.
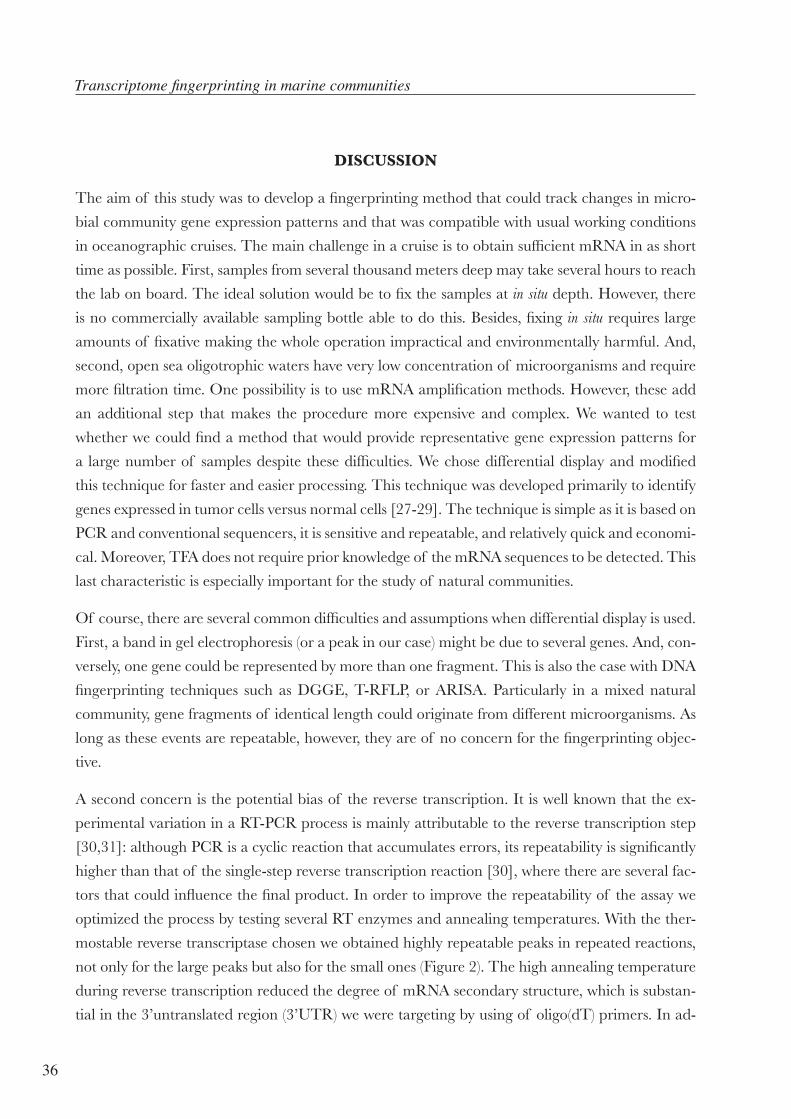
Micromonas pusilla gene expression under dark and light conditions
In experiment 4, a culture of Micromonas pusilla was incubated both in the dark and in the light.
Different TFA patterns were observed (Figure 5). With the primer combination used, the number
of cDNAs retrieved in dark samples was larger than in light samples, but the total number of
peaks was very small so that the significance of the differences was low (Figure 5). This particular
example shows how the technique can also be used to identify genes with differential regulation
under the experimental conditions tested (as is the case in differential display).

Chapter I
33
Ctrl-
4ºC
19ºC
70%
01
012 1
C
0E
E
B
43
D
2
A
4 3 BD
3
D
4
2B
A
C
E
C
A
55
5
2D Stress: 0,09
A
B
T0
(bp)
15min
4h
30min
2h
1h
15min
4h
30min
2h
1h
Figure 4. Elapsed time between sampling and filtration in a Micromonas pusilla
culture. A) Virtual gel of Micromonas pusilla fingerprints of triplicate samples filtered
at different times between 15 min and 4 h after splitting conditions: 4ºC or 19ºC
samples. Patterns obtained with the A8 primer combination. The horizontal scale
shows fragment size, from 80 to 570 bp (left to right).. Each time is represented by
three replicates. B) NMDS diagram for the same experiment showing samples kept
at 4ºC (numbers, following increasing times from 15 min to 4 hours) or at 19ºC
(letters, following alphabetical order from 15 min to 4 hours). Times correspond to
15, 30 min, 1, 2, or 4 hours.

Transcriptome fingerprinting in marine communities
34
Figure 5. Micromonas pusilla gene expression under dark and light condi-
tions. A) Virtual gel of the TFA patterns for experiment 4. The horizontal scale
shows fragment size, from 80 to 570 bp (left to right). D: dark samples, L: light
samples. Numbers are replicates for each condition. B) Dendrogram showing
the clustering of light and dark samples for the same experiment.
L 1 L 2 L 3 D 3 D 1 D 2Samples
100
95
90
85
80
75
70
Sim
ilari
ty
D1
D2
D3
L1
L2
L3
A
B(bp)

35
Relationship of TFA patterns with different primer combinations
To check whether different primer combinations would cluster samples similarly, samples from
three vertical profiles (from stations CM, MD and D) were selected (see location of samples in
Table 3) and the procedure was run with three different primer combinations (A8, C6 and G6).
The NMDS diagram in Figure 6 presents the ordination of TFAs from all these runs. TFAs ob-
tained with A8 showed that samples separated along the depth gradient, the largest distances
appearing between intermediate and deep samples. Near-surface samples obtained with the A8
primer combination clustered together. With the C6 combination deep samples were also sepa-
rated from the rest of the samples but the distance between all the samples was much less com-
pared to the separation obtained with the other combinations. The G6 combination also resolved
the vertical profile but the intermediate depths were not as well separated as with the A8 primer
combination.
Station Latitude N Longitude E Depths sampled (m)
CM 41º24' 2º48' 5/30/44
MD 40º54' 2º50' 4 / 140
D 40º39' 2º51' 5 / 65 / 500 / 2000 1
Table 3. Location and depths of samples analyzed in Figure 6.
Altogether the surface samples of the horizontal transect clustered together for each primer set
and largest differences were observed along the depth profile. This was very clear with primer
combinations A8 and G6. In contrast, the C6 primer combination was not as good at resolving
the vertical gradient. The A8 primer combination was chosen for all our analyses for its resolution
and repeatability.
Figure 6. Relationship of TFA patterns with
different primer combinations. NMDS diagram
comparing fingerprints obtained with three dif-
ferent primer combinations from the MODIVUS
transect from the coast to offshore in the NW
Mediterranean Sea. Samples are labeled accord-
ing to station (CM, MD, and D) and depth (4 to
2000m). The number added after the name of
the station indicates depth. The primer combina-
tions used were A8, C6 and G6. Sample MD140
analyzed with the A8 primer combination was
very distant from all the others and has not been
represented for clarity.C6 G6 A8
CM30CM5
D2000D500
D65
MD140MD4/CM44/D5
CM5/D5
D2000
D500
D65
MD140
MD4/CM44/CM30
CM30
CM44
CM5
D2000
D500MD4
D5D65
2D Stress: 0,04
Transcriptome fingerprinting in marine communities
36
DISCUSSION
The aim of this study was to develop a fingerprinting method that could track changes in micro-
bial community gene expression patterns and that was compatible with usual working conditions
in oceanographic cruises. The main challenge in a cruise is to obtain sufficient mRNA in as short
time as possible. First, samples from several thousand meters deep may take several hours to reach
the lab on board. The ideal solution would be to fix the samples at in situ depth. However, there
is no commercially available sampling bottle able to do this. Besides, fixing in situ requires large
amounts of fixative making the whole operation impractical and environmentally harmful. And,
second, open sea oligotrophic waters have very low concentration of microorganisms and require
more filtration time. One possibility is to use mRNA amplification methods. However, these add
an additional step that makes the procedure more expensive and complex. We wanted to test
whether we could find a method that would provide representative gene expression patterns for
a large number of samples despite these difficulties. We chose differential display and modified
this technique for faster and easier processing. This technique was developed primarily to identify
genes expressed in tumor cells versus normal cells [27-29]. The technique is simple as it is based on
PCR and conventional sequencers, it is sensitive and repeatable, and relatively quick and economi-
cal. Moreover, TFA does not require prior knowledge of the mRNA sequences to be detected. This
last characteristic is especially important for the study of natural communities.
Of course, there are several common difficulties and assumptions when differential display is used.
First, a band in gel electrophoresis (or a peak in our case) might be due to several genes. And, con-
versely, one gene could be represented by more than one fragment. This is also the case with DNA
fingerprinting techniques such as DGGE, T-RFLP, or ARISA. Particularly in a mixed natural
community, gene fragments of identical length could originate from different microorganisms. As
long as these events are repeatable, however, they are of no concern for the fingerprinting objec-
tive.
A second concern is the potential bias of the reverse transcription. It is well known that the ex-
perimental variation in a RT-PCR process is mainly attributable to the reverse transcription step
[30,31]: although PCR is a cyclic reaction that accumulates errors, its repeatability is significantly
higher than that of the single-step reverse transcription reaction [30], where there are several fac-
tors that could influence the final product. In order to improve the repeatability of the assay we
optimized the process by testing several RT enzymes and annealing temperatures. With the ther-
mostable reverse transcriptase chosen we obtained highly repeatable peaks in repeated reactions,
not only for the large peaks but also for the small ones (Figure 2). The high annealing temperature
during reverse transcription reduced the degree of mRNA secondary structure, which is substan-
tial in the 3’untranslated region (3’UTR) we were targeting by using of oligo(dT) primers. In ad-

Chapter I
37
dition, the RT might preferentially amplify some mRNAs, thus altering the relative proportions
of the genes being expressed. In particular, shorter mRNAs might be preferentially used as targets
[32]. We did not find any significant differences in this respect when we tested different reaction
times or when we compared peaks corresponding to different sizes.
And third, the final PCR step is subject to the usual PCR biases, and some cDNAs might be dif-
ferentially amplified. As a result of the two latter caveats, the relative proportions of the expressed
genes in the final fingerprint may not be exactly as they were in the natural sample. Because of the
clearly delimited purpose of the approach, however, this would not be a problem either as long as
the biases were repeatable.
As shown in the Results section, the expression patterns found were always highly repeatable under
the conditions used. Moreover, for the approach to be useful as a fingerprint it was not necessary to
be able to identify the genes being expressed, to determine how many genes were being expressed
at a particular moment, or to quantify the expression of the different genes.
Here, TFA was developed and applied to picoeukaryotic communities taking advantage of the
poly(A) tail of mRNA in eukaryotes. However, TFA can be easily modified to be used with pro-
karyotes by previously removing rRNA and subsequent polyadenilation of the RNA of the bacte-
rial fraction as described in [1].
According to the manufacturer of the kit (www.genhunter.com), the use of three oligo(dT) primers
(for the reverse transcription reaction) plus eighty random primers (for the subsequent PCR) will
retrieve 96% of the genes in any given eukaryotic cell. Since only one of three oligo(dT)s and only
one of eighty random primers were used in the present work, the fingerprints corresponded to a
very small fraction of all the genes being expressed at any one time. In effect, when the technique
was applied to a pure culture of M. pusilla the number of peaks was very low in one of the experi-
ments (Figure 5). This number of peaks would not be enough for a proper classification of samples.
However, when the same technique was used with natural samples, in which a mixture of cell
populations is present, the number of peaks was sufficient. Economy of resources and reactions
being essential for a convenient fingerprinting technique, we decided that the use of one random
primer and one anchor primer was the most efficient alternative.
Since the primer combinations are arbitrary, the transcripts retrieved with each set should be a ran-
dom representation of the genes being expressed at the time of sampling. Therefore, most primer
combinations should result in similar clustering of samples. However, the resulting clustering will
be more robust if there are more peaks and there is a range of peak heights. Since this will change
at random with the primer sets and the particular communities being analyzed, optimization re-
quires testing different primer combinations for each type of environment studied. In the case of
Transcriptome fingerprinting in marine communities
38
the Mediterranean waters analyzed the primer combination A8 was the best at discriminating
samples from the vertical profile (Figure 6) and was, thus, chosen as our preferential combination
for subsequent reactions. Likely, the primer combination will have to be optimized for each type of
sampling. Once this has been done, the procedure is relatively cheap and quick.
In order to have a positive control, replicate cultures of Micromonas pusilla were incubated in the
light and in the dark. It is well known that transcripts of algae change dramatically between day
and night [33]. Obviously, if the technique is to work in nature it should be able to detect differ-
ences between light and dark incubations in a phototrophic protist. The patterns were clearly
different, revealing more transcriptional activity in the dark than in the light with the primer
combination used. This can be expected since phototrophs tend to concentrate on carrying out
photosynthesis during the light hours, while the dark is used for biosynthesis of all the different
cell components plus all the regulation involved in nucleus and cell division. As mentioned earlier,
the TFA is proposed here only as a fingerprinting technique. Despite this, in some cases it may be
of interest to identify some of the genes observed. If a gene turned out to be relevant, the sample
could be run in a polyacrylamide gel and the corresponding band could be cloned and sequenced.
The main challenge in a cruise is to obtain sufficient mRNA in as short a time as possible to pre-
vent major changes in the transcript composition from the fresh sample (this is due to the labile
nature and relatively short half-lives of mRNAs). Unfortunately this is not always possible: as ex-
plained, samples from lower depths take hours to reach the lab on board, and oligotrophic waters
have very little material and require more filtering time. Therefore, another important concern
was to assess to which extent the time delay between sampling and filtering affected gene expres-
sion. The two timing experiments with natural marine communities supported the idea that time
did not significantly alter the patterns of gene expression as long as samples were kept on ice, for
the picoeukaryotic transcripts retrieved at least up to two hours after sampling with several specific
primer combinations.
In summary, TFA is a compromise among the different requirements that provides a repeatable
gene expression pattern in a relatively simple and inexpensive way and that will be practical to
use in oceanographic cruises. Results suggest that TFA is a useful technique when a large number
of conditions or treatments have to be compared side by side, by assessing a portion of the genes
expressed by such communities. TFA is an indicator of the extent of changes caused by different
environmental conditions. This previous analysis would then help in deciding which samples to use
for more powerful, but time-intensive (and costly) methods for estimating gene expression patterns.

Chapter I
39
ACKNOWLEDGMENTS
We thank Dr. Hugo Sarmento (ICM, CSIC) for help with the cultures of Micromonas pusilla and
helpful comments on the manuscript. MCL acknowledges the members of the Marine Microbial
Ecology Lab at ICM, the Developmental Biology Group at the Universitat Pompeu Fabra, and
M.A. Moran’s lab at the University of Georgia for a great learning experience.

Transcriptome fingerprinting in marine communities
40
REFERENCES
1. Frías-López J, Shi Y, Tyson GW, Coleman ML, Schuster SC, et al. (2008) Microbial community
gene expression in ocean surface waters. Proc Natl Acad Sci U S A 105: 3805-3810.
2. Gilbert JA, Field D, Huang Y, Edwards R, Li W, et al. (2008) Detection of large numbers of
novel sequences in the metatranscriptomes of complex marine microbial communities.
PLoS ONE 3: e3042.
3. Poretsky RS, Hewson I, Sun S, Allen AE, Zehr JP, et al. (2009) Comparative day/night meta-
transcriptomic analysis of microbial communities in the North Pacific subtropical gyre.
Environ Microbiol 11: 1358-1375.
4. Poretsky RS, Sun S, Mou X, Moran MA (2010) Transporter genes expressed by coastal bacte-
rioplankton in response to dissolved organic carbon. Environ Microbiol 12: 616-627.
5. Stewart FJ, Ulloa O, DeLong EF (2011) Microbial metatranscriptomics in a permanent marine
oxygen minimum zone. Environ Microbiol doi:10.1111/j.1462-2920.2010.02400.x
6. Gifford SM, Sharma S, Rinta-Kanto JM, Moran MA (2011) Quantitative analysis of a deeply
sequenced marine microbial metatranscriptome. ISME J 5: 461-472.
7. Hewson I, Poretsky RS, Tripp HJ, Montoya JP, Zehr JP (2010) Spatial patterns and light-driven
variation of microbial population gene expression in surface waters of the oligotrophic
open ocean. Environ Microbiol 12: 1940-1956.
8. Muyzer G, de Waal EC, Uitterlinden AG (1993) Profiling of complex microbial populations by
denaturing gradient gel electrophoresis analysis of polymerase chain reaction-amplified
genes coding for 16S rRNA. Appl Environ Microbiol 59: 695-700.
9. Murray A, Hollibaugh J, Orrego C (1996) Phylogenetic compositions of bacterioplankton from
two California estuaries compared by denaturing gradient gel electrophoresis of 16S rDNA
fragments. Appl Environ Microbiol 62: 2676-2680.
10. Acinas SG, Rodríguez-Valera F, Pedrós-Alió C (1997) Spatial and temporal variation in marine
bacterioplankton diversity as shown by RFLP fingerprinting of PCR amplified 16S rDNA.
FEMS Microbiol Ecol 24: 27-40.
11. Liu WT, Marsh TL, Cheng H, Forney LJ (1997) Characterization of microbial diversity by
determining terminal restriction fragment length polymorphisms of genes encoding 16S
rRNA. Appl Environ Microbiol 63: 4516-4522.

Chapter I
41
12. Brown MV, Schwalbach MS, Hewson I, Fuhrman JA (2005) Coupling 16S-ITS rDNA clone
libraries and automated ribosomal intergenic spacer analysis to show marine microbial
diversity: development and application to a time series. Environ Microbiol 7: 1466-1479.
13. Fisher MM, Triplett EW (1999) Automated Approach for Ribosomal Intergenic Spacer Analy-
sis of Microbial Diversity and Its Application to Freshwater Bacterial Communities. Appl
Environ Microbiol 65: 4630-4636.
14. Van Hannen EJ, Van Agterveld MP, Gons HJ, Laanbroek HJ (1998) Revealing genetic diversity
of eukaryotic microorganisms in aquatic environments by denaturing gradient gel electro-
phoresis J Phycol 34: 206-213.
15. Riemann L, Steward GF, Fandino LB, Campbell L, Landry MR, et al. (1999) Bacterial com-
munity composition during two consecutive NE Monsoon periods in the Arabian Sea stud-
ied by denaturing gradient gel electrophoresis (DGGE) of rRNA genes. Deep-Sea Re-
search Part II-Topical Studies in Oceanography 46: 1791-1811.
16. Schauer M, Massana R, Pedrós-Alió C (2000) Spatial differences in bacterioplankton compo-
sition along the Catalan coast (NW Mediterranean) assessed by molecular fingerprinting.
FEMS Microbiol Ecol 33: 51-59.
17. Díez B, Pedrós-Alió C, Marsh TL, Massana R (2001) Application of Denaturing Gradient Gel
Electrophoresis (DGGE) To Study the Diversity of Marine Picoeukaryotic Assemblages
and Comparison of DGGE with Other Molecular Techniques. Appl Environ Microbiol
67: 2942-2951.
18. Díez B, Ramon M, Estrada M, Pedrós-Alió C (2004) Distribution of Eukaryotic Picoplankton
Assemblages across Hydrographic Fronts in the Southern Ocean, Studied by Denaturing
Gradient Gel Electrophoresis. Limnol Oceanogr 49: 1022-1034.
19. Fuhrman JA, Hewson I, Schwalbach MS, Steele JA, Brown MV, et al. (2006) Annually reoc-
curring bacterial communities are predictable from ocean conditions. Proc Natl Acad Sci
U S A 103: 13104-13109.
20. Fuhrman JA, Steele JA, Hewson I, Schwalbach MS, Brown MV, et al. (2008) A latitudinal di-
versity gradient in planktonic marine bacteria. Proc Natl Acad Sci U S A 105: 7774-7778.
21. Liang P, Averboukh L, Pardee AB (1993) Distribution and cloning of eukaryotic mRNAs by
means of differential display: refinements and optimization. Nucleic Acids Res 21: 3269-
3275.

Transcriptome fingerprinting in marine communities
42
22. Liang P, Pardee AB (1992) Differential display of eukaryotic messenger RNA by means of the
polymerase chain reaction. Science 257: 967-971.
23. Guillard RRL (1975) Culture of phytoplankton for feeding marine invertebrates. In: Smith
WL, Chanley MH, editors. Culture of marine invertebrate animals. New York, NY: Ple-
num Press. pp. 29–66.
24. Olson RJ, Zettler ER, DuRand MD (1993) Phytoplankton analysis using flow cytometry. In:
Kemp PF, Sherr BF, Sherr EB, Cole JJ, editors. Handbook of Methods in Aquatic Micro-
bial Ecology. Boca Raton, FL: Lewis Publishers. pp. 175-186.
25. Poretsky RS, Gifford S, Rinta-Kanto J, Vila-Costa M, Moran MA (2009) Analyzing gene ex-
pression from marine microbial communities using environmental transcriptomics. J Vis
Exp http://www.jove.com/details.stp?id=1086
26. Clarke KR (1993) A method of linking multivariate community structure to environmental
variables. Marine ecology progress series 92: 205.
27. Tanaka H, Arakawa H, Yamaguchi T, Shiraishi K, Fukuda S, et al. (2000) A ribonucleotide re-
ductase gene involved in a p53-dependent cell-cycle checkpoint for DNA damage. Nature
404: 42-49.
28. Lo P-K, Chen J-Y, Lo W-C, Chen B-F, Hsin J-P, et al. (1999) Identification of a novel mouse
p53 target gene DDA3. Oncogene 18: 7765-7774.
29. Okamoto K, Beach D (1994) Cyclin G is a transcriptional target of the p53 tumor suppressor
protein. EMBO J 13: 4816-4822.
30. Stahlberg A, Hakansson J, Xian X, Semb H, Kubista M (2004) Properties of the reverse tran-
scription reaction in mRNA quantification. Clin Chem 50: 509-515.
31. Brooks EM, Sheflin LG, Spaulding SW (1995) Secondary structure in the 3’ UTR of EGF and
the choice of reverse transcriptases affect the detection of message diversity by RT-PCR.
Biotechniques 19: 806-812, 814-805.
32. Tan SS, Weis JH (1992) Development of a Sensitive Reverse Transcriptase PCR Assay, RT-
RPCR, Utilizing Rapid Cycle Times. Genome Res 2: 137-143.
33. Monnier A, Liverani S, Bouvet R, Jesson B, Smith J, et al. (2010) Orchestrated transcription
of biological processes in the marine picoeukaryote Ostreococcus exposed to light/dark
cycles. BMC Genomics 11: 192.


Chapter 2
Comparison of Picoeukaryotic Gene Expression Patterns with Community Composition along the Seasonal Cycle in the NW Mediterranean


Chapter II
47
ABSTRACT
Coupled analyses of microbial community composition and gene expression are almost inexistent
for temporal series and even more so for picoeukaryotic assemblages. In this study, we compared
marine picoeukaryotic gene expression patterns (assessed by Transcriptome Fingerprinting Analy-
sis - TFA) with picoeukaryotic community composition (assessed using Automated Ribosomal In-
tergenic Spacer Analysis -ARISA) over four years in Blanes Bay Microbial Observatory (BBMO),
an oligotrophic coastal site of the northwestern Mediterranean Sea. At large scale, regular annual
periodicity was detectable with both approaches for the four years analyzed, implying that picoeu-
karyotic composition and expression dynamics were recurrent. At smaller scale, within a year, the
largest differences occurred between winter and summer samples in correlation with distinct envi-
ronmental and biological variables. During the winter, community composition was less variable
than gene expression patterns. During the summer, however, community composition was more
variable than gene expression, suggesting functional redundancy in the summer picoeukaryotic
assemblage.
Comparison of picoeukaryotic gene expression patterns with community composition along the seasonal cycle in the NW Medi-
terranean. Montserrat Coll-Lladó, Guillem Salazar, Hugo Sarmento, Silvia G. Acinas and Carles Pedrós-Alió.
Article submitted to Environmental Microbiology.
Seasonal gene expression patterns in marine picoeukaryotes
48
INTRODUCTION
Studies on microbial community composition using molecular techniques at different temporal
scales has uncovered seasonal changes of bacterioplankton in both freshwater (Casamayor et al.,
2002; Newton et al., 2006; Pinhassi & Hagström, 2000; Shade et al., 2007) and marine systems
(Fuhrman et al., 2006; Gilbert et al., 2012; Schauer et al., 2003; Treusch et al., 2009). Growing
evidence suggest that microbial communities are structured by the environment, following the
seasonal cycle, with reoccurring microbial assemblages in specific periods of the year. The number
of studies with other members of the picoplankton is extremely small. Chow and Fuhrman (2012)
studied viruses. Murray et al. (1999), Auguet et al. (2011) and Robidart et al. (2012) are some of the
few seasonal studies of archaea. In studies dealing with this issue, picoeukaryotes have received less
attention than other compartments of the microbial food web (McDonald et al., 2007), although,
it is reasonable to assume that marine picoeukaryotes will also follow seasonal cycles.
Presumably, changes in composition should also result in changes in the gene expression patterns
of the different assemblages. Although many metatranscriptomics studies have been carried out
to analyze gene expression in situ (Moran et al., 2012; Ottesen et al., 2013), seasonal studies are
still lacking. Likely, the expense and effort needed to construct and analyze a metatranscriptome is
one of the reasons for this lack of data. Fingerprinting methods provide a snapshot of the entire
microbial community at once and allow relatively cheap and fast comparison of a large number
of samples. We have recently developed a novel approach, Transcriptome Fingerprinting Analysis
(TFA), a fingerprinting technique to analyze gene expression patterns of picoeukaryotic assem-
blages (Coll-Lladó et al., 2011). The technique is relatively quick and cheap, and allows the analysis
of many samples simultaneously. In the present study we combined two molecular fingerprinting
techniques: ARISA (Brown et al., 2005; Fisher & Triplett, 1999) to assess picoeukaryotic com-
munity structure and TFA to analyze gene expression patterns within the same community. We
analyzed these changes in a monthly sampling basis during four consecutive years at the Blanes
Bay Microbial Observatory (BBMO).
The seasonal changes in bacterioplankton community composition (Schauer et al., 2003) and pi-
coeukaryotes (Díez, B. Ph.D. Thesis, Autonomous University of Barcelona, 2001) had been fol-
lowed by DGGE at the BBMO. The seasonal succession of archaea was also analyzed via clone
libraries and qPCR (Galand et al., 2010). In all these cases, the community composition showed
a clear seasonal pattern (Gasol et al., 2012). In principle, we would expect faster changes in gene
expression patterns than in community composition. However, the studies available do not allow
discarding two other hypotheses: simultaneous changes in composition and gene expression, and
faster changes in composition than in expression patterns (functional redundancy).
Chapter II
49
The objective of this study was to compare the picoeukaryote community structure at DNA and
RNA level based on ARISA and TFA respectively along a 4-year temporal series with monthly
sampling and to determine which one of the three hypotheses mentioned above prevails at the
different times of the year cycle: 1) simultaneous changes in community composition and in gene
expression patterns, 2) faster changes in gene expression patterns than in community composition,
or 3) faster changes in community composition than in gene expression patterns.
EXPERIMENTAL PROCEDURES
Blanes Bay Microbial Observatory and sampling
The Blanes Bay Microbial Observatory (BBMO, www.icm.csic.es/bio/projects/icmicrobis/bbmo)
is located on the Catalan coast (NW Mediterranean, 41º 40’ N, 2º 48’ E). The site is 800 m offshore
and is a relatively nutrient-poor ecosystem. The site has been studied for several decades and a
fairly complete data set exists about its microbial community (Gasol et al., 2012).
Sea sub-surface samples were collected monthly from June 2007 to February 2011 at BBMO in
eight liter carboys, one for DNA extraction and another for RNA extraction. Water was prefiltered
through a 200-µm mesh net and, once in the lab, prefiltered through 20-µm Nylon mesh. Samples
for RNA extraction were kept on ice until the end of the filtration process. Elapsed time between
sampling and filtration was less than two hours. In a previous study, we shown that TFA patterns
in ice-preserved samples were closer to the patterns of the samples at the time of collection of the
samples than samples kept at room temperature (Coll-Lladó et al., 2011).
Temperature, salinity, size-fractionated chlorophyll a, and inorganic and organic nutrients were
determined in a similar way as described in Alonso-Sáez et al. (2008). Abundance of phototrophic
and heterotrophic picoeukaryotes, heterotrophic bacteria and Synechococcus like cells was deter-
mined by epifluorescence microscopy from samples fixed with 1% paraformaldehyde + 0.05%
glutaraldehyde (final concentration) filtered through 0.6 (eukaryotes) or 0.2 µm (prokaryotes) poly-
carbonate filters, stained with 4,6 diamidino-2-phenylindole (DAPI) at 10 µg mL-1 final concen-
tration (Porter & Feig, 1980), and examined with an Olympus BX61 epifluorescence microscope
under blue and UV wavelength excitation.

Seasonal gene expression patterns in marine picoeukaryotes
50
Picoeukaryote community fingerprinting (ARISA)
Microbial biomass was collected by a serial filtration of eight liters of seawater through a 3-µm
pore-size polycarbonate prefilter (Poretics) and a 0.2-µm Sterivex filter (Durapore, Millipore) using
a peristaltic pump. The Sterivex units were filled with 1.8 mL of lysis buffer (40 mM EDTA pH
8.0, 50 mM Tris-HCl pH 8.3, 0.75 M sucrose) and stored at -20°C. Nucleic acids were extracted
as described in (Massana et al., 1997).
Specific primers were used to amplify the internal transcribed spacer 1 (ITS1) (Massana et al.,
2008). The sequence of forward primer (EUK RR) was labeled with a fluorescence tag (FAM)
and matched the end of the SSU and was: 5’-GTAGGTGAACCTGCAGAAGGATCA-3’. The
reverse primer, ITS2, matched the beginning of the 5.8S. The sequence of ITS2 was 5’-GCTGC-
GTTCTTCATCGATGC -3’. The PCR mixture (40 µl) contained: 10 ng of DNA template, 250
nM of each primer, 250 nM dNTPs, 2.5 mM Mg Cl2, 3 U Taq DNA polymerase, and the enzyme
buffer. PCR cycling, carried out in a DNA Engine® thermal cycler (Bio-Rad Laboratories, Inc.),
comprised an initial denaturation step at 94 ˚C for 2 min followed by 32 cycles of denaturation
at 94 ˚C for 15 s, annealing at 55 ˚C for 30 s and extension at 72 ˚C for 3 min followed by a final
extension step at 72 ˚C for 9 min. A negative control was run for each set of reactions to assess the
background levels. We used the same TFA pipeline (see details bellow) to discriminate the ARISA
amplicons with gene analyzer, the only difference was that ARISA fragments were detected in a
different channel because of the nature of the fluorescent tag.
Transcriptome fingerprinting analysis (TFA)
All environmental water samples for TFA were filtered first through a 3-µm pore-size polycarbonate
filter (Poretics) and then through a 0.2-µm polycarbonate filter (Poretics) using a peristaltic pump
(MasterFlex 7553-89 with cartridges Easy Load II 77200-62, Cole-Parmer Instrument Company)
to collect the bacteria and picoeukaryotes. Filters were flash-frozen in liquid nitrogen and then
stored at -80 ˚C until processed. Total RNA was extracted from the 0.2-µm polycarbonate filters.
RNA extraction and purification. The procedure was adapted from (Poretsky et al., 2009). Filters
were transferred to 2 ml screw-cap microcentrifuge tubes containing 200-µl of 0.1 mm- diameter
zirconia-silica beads (BioSpec Products, Inc.) and 100-µl of 0.5 mm glass beads (BioSpec Products,
Inc.) mixed with 450-µl RLT lysis buffer (provided by the RNeasy Mini Kit Qiagen, Inc.) plus ß-
mercaptoethanol (Fluka). Samples were mechanically disrupted in a Mini-beadbeater-8TM cell
disrupter (BioSpec Products, Inc., Bartlesville, OK) for 10 min. After disruption, samples were
incubated on ice for 5 min and the beads were allowed to settle out of the lysis mixture. Samples
underwent centrifugation (in an Eppendorf centrifuge at 2100 rcf 1 min). The lysate was trans-
Chapter II
51
ferred to a new tube. 300 µl of lysis solution was added to the vials with beads to increase the final
yield. The tubes were shaken vigorously and the supernatant was also recovered. The same volume
of 70% ethanol was added to the lysate and samples were purified according to the RNeasy Mini
Kit (Qiagen, Inc.). The isolated total RNA was treated with TurboDNase I (Ambion) to remove
contaminating genomic DNA according to the manufacturer’s instructions. RNA was aliquoted
and quantified by absorbance at 260 nm with a NanoDrop 1000 (Thermo Fisher Scientific Inc.,
Wilmington, DE).
Reverse transcription and PCR amplification. First-strand cDNA synthesis was conducted with 30
ng of total RNA as starting material. mRNAs were reverse-transcribed to single-stranded comple-
mentary DNA using the SuperScript III reverse transcriptase (Invitrogen) and the primer H-T11A
(5’-AAGCTTTTTTTTTTTA-3’). To denature any secondary structure, an aliquot of each of the
RNA extracts plus the oligo(dT) primer were heated for 5 min at 65ºC and immediately placed on
ice before mixing with the final reaction solution (20 µl): 5X First-Strand buffer, 0.1 M DTT, 40 U
RNaseOUT, 10 mM dNTPs and 200 U SuperScript III RT. Reaction mixtures were incubated at
50ºC during 50 min, and inactivated by heating 70 ˚C for 15 min. 2 µl of the RT reaction product
was used in a subsequent PCR. PCR reactions were carried out using Taq polymerase (Qiagen) in
a final reaction volume of 20 µl. The arbitrary primer H-AP8 (5’-AAGCTTTTACCGC-3’) and
the same primer used in the RT reaction but labeled with a fluorescence tag (NED) were used for
the amplification of cDNA. The primer targeting the poly(A) tail and the arbitrary primer for PCR
were from RNAspectra Yellow kit 1 of GenHunter Corporation. The PCR cycle was 40 cycles of
94 ˚C for 30 s, annealing at 40 ˚C for 2 min, 72 ˚C for 60 s followed by 1 cycle of 72 ˚C for 5 min
in a DNA Engine® thermal cycler (Bio-Rad Laboratories, Inc.). A negative control was run for
each set of reactions to assess the background levels. To ensure that there was no amplification of
genomic DNA a control was run with an aliquot of the RNA extracts added directly to the PCR
reaction.
Separation of amplicons with gene analyzer. 1 µl of PCR product from each sample was mixed
with 9 µl of Hi-Di Formamide (Applied Biosystems). 0.5 µl of size standard (ROX 500, Applied
Biosystems) was added to every reaction to define the standard curve between 25 and 500 bp. The
cDNA peaks obtained ranged in length from 30 to 500 bp, according to the internal size standard
used. The mixtures were run on an ABI automated sequencer operating as a fragment analyzer
(ABI 3130XL). The sequencer electropherograms were then analyzed using the GeneMarker soft-
ware, version 1.90 (SoftGenetics, LLC). Raw data were treated with some filters activated ac-
cording to GeneMarker instructions: baseline substraction, spike removal, auto pull up removal,
smooth. The cubic spline algorithm was used to calculate bp lengths of identified fluorescence
peaks. The different peak detection thresholds applied are detailed below. Once the peaks were

Seasonal gene expression patterns in marine picoeukaryotes
52
selected, peak areas were used as output from GeneMarker software and were transferred to Mi-
crosoft Excel (Seattle, WA) for subsequent analysis.
Peak detection in ARISA and TFA
Two different cutoff thresholds were used to select peaks in both ARISA and TFA electrophero-
grams. In the first case, only the largest peaks were selected (see example in Figure 1).
The threshold for these peaks was set at 200 relative fluorescence units (rfus) for ARISA and at
100 rfus for TFA. These TFA peaks are supposed to correspond to highly expressed genes. From
now on we will refer to these as HighP (for high peaks). Settings and filters were applied as previ-
ously described (Coll-Lladó et al., 2011). In the second case, all the peaks that could be discerned
above the background by the instrument, including the high peaks, were used for the analyses (see
example in Figure 1). The threshold for these peaks was set at 30 rfus for ARISA and at 10 rfus for
TFA. We will refer to these as AllP (for all peaks). This low intensity was the only criterion to detect
these peaks. All the other filters used in the HighP settings were shut off. The fragments considered
in the analyses were those between 150 and 500 bp for ARISA and between 90 and 530 bp for
TFA. Peaks were visually inspected as a quality control (Coll-Lladó et al., 2011).
340 360355350345
Fragment length (base pairs)
All PHigh P
Rela
tive
�uor
esce
nce
units
2000
1800
1600
1400
1200
1000
800
600
400
200
0
Figure 1. Effect of different cutoffs on the selection of peaks in a TFA elec-
tropherogram. The dotted line shows the relative fluorescence units threshold
of peak height (intensity) used for detection of highly expressed genes and the
empty triangles indicate the resultant peaks (HighP) selected under this cor-
responding cutoff. Solid black line and filled triangles correspond to the low
threshold cutoff where all peaks above background (AllP) were selected.

Chapter II
53
Statistical analysis
The peak area data from GeneMarker were standardized (the relative peak heights within a profile
were calculated by dividing the height of an individual peak by the total peak height (i.e.: sum of
the heights of all peaks in an electropherogram). The similarity of patterns derived from different
communities was assessed computing Bray-Curtis distances to construct the similarity matrices.
Mantel tests between dissimilarity matrices and Mantel correlograms were performed with the
Pearson correlation. Patterns were explored using Nonmetric Multidimensional Scaling (NMDS)
and Constrained Analysis of Principal Coordinates (CAP). We have used CAP rather than Re-
dundancy Analysis (RDA) because it allows the use of non-Euclidean dissimilarity indices, such
as Bray–Curtis distance. Primer-E version 6 (Clarke, 1993) and R software (R development Core
Team, 2005) were used for these analyses.
RESULTS
Comparison between HighP and AllP patterns
Electropherograms show a series of peaks with different areas (Figure 1). In principle, large peaks
correspond to abundant taxa in the case of ARISA, and to highly expressed genes for TFA. Decid-
ing how many peaks to include in the analysis is a subjective decision and we analyzed the effect
on the results of considering two different thresholds. First, in one analysis we considered the larg-
est peaks only (HighP) and secondly, we considered all the peaks above the background (AllP, see
Experimental Procedures). We then carried out comparative analyses with both data sets to test
the agreement between them.
Sample distance matrices for ARISA (DNA fingerprints) and TFA (mRNA fingerprints)
were constructed with both thresholds (HighP and AllP) and were compared with Mantel tests
(Figure 2A-B). The distances calculated with the two thresholds were significantly correlated for
both DNA (Mantel statistic r = 0.748, p<0.001) and mRNA (r = 0.810, p<0.001). However, the
slope of the regression lines were significantly lower than 1, indicating that, when distances were
short in the AllP matrix, distances in the HighP matrix were longer than expected. On the contrary,
when distances in the HighP matrix were long, distances in AllP matrix were shorter. Addition of
the small peaks in the electropherograms reduced the range of distance values found with the large
peaks only. Subsequent analyses were performed with data generated with the two thresholds.
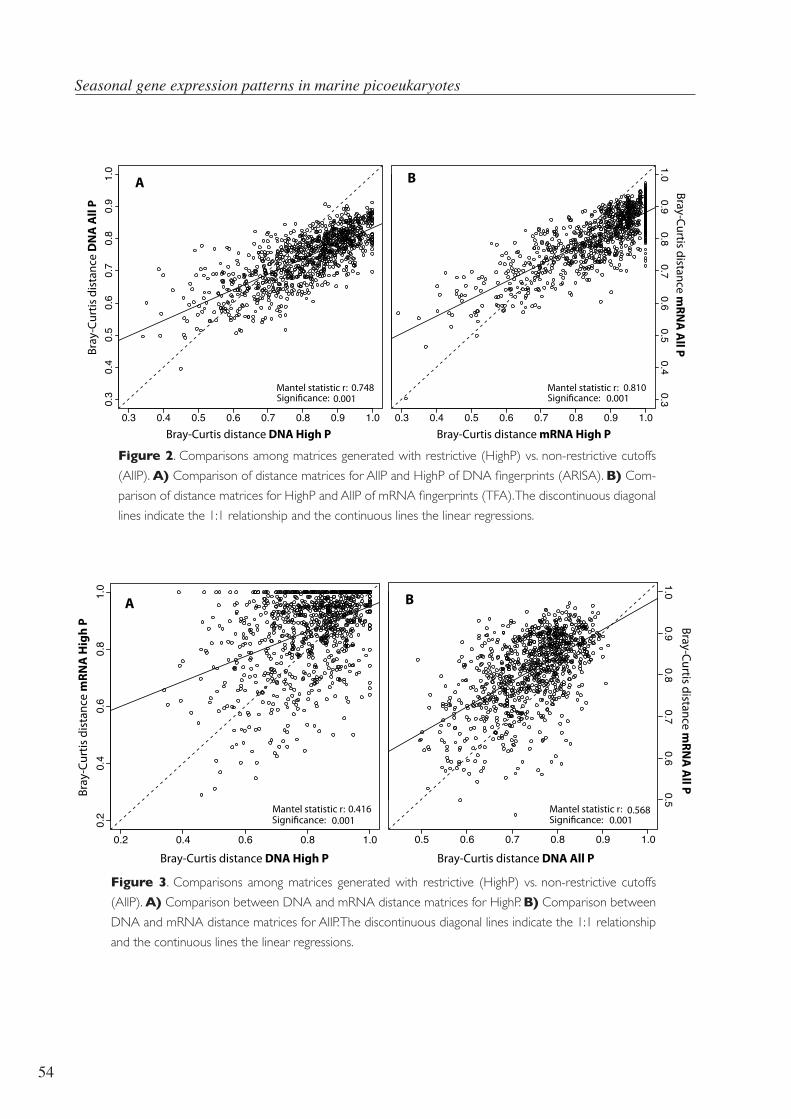
Seasonal gene expression patterns in marine picoeukaryotes
54
0.3
0.4
0.5
0.6
0.7
0.8
0.9
1.0
Mantel statistic r: 0.748Signi�cance: 0.001
0.30.4
0.50.6
0.70.8
0.91.0
0.3 0.4 0.5 0.6 0.7 0.8 0.9 1.0 Bray-Curtis distance DNA High P
0.3 0.4 0.5 0.6 0.7 0.8 0.9 1.0 Bray-Curtis distance mRNA High P
Bray-Curtis distance mRN
A A
ll P
Mantel statistic r: 0.810Signi�cance: 0.001
A B
Br
ay-C
urtis
dis
tanc
e D
NA
All
P
Figure 2. Comparisons among matrices generated with restrictive (HighP) vs. non-restrictive cutoffs
(AllP). A) Comparison of distance matrices for AllP and HighP of DNA fingerprints (ARISA). B) Com-
parison of distance matrices for HighP and AllP of mRNA fingerprints (TFA). The discontinuous diagonal
lines indicate the 1:1 relationship and the continuous lines the linear regressions.
Figure 3. Comparisons among matrices generated with restrictive (HighP) vs. non-restrictive cutoffs
(AllP). A) Comparison between DNA and mRNA distance matrices for HighP. B) Comparison between
DNA and mRNA distance matrices for AllP. The discontinuous diagonal lines indicate the 1:1 relationship
and the continuous lines the linear regressions.
0.2 0.4 0.6 0.8 1.0
0.2
0.4
0.6
0.8
1.0
Bray
-Cur
tis d
ista
nce
mRN
A H
igh
P
Mantel statistic r: 0.416Signi�cance: 0.001
A
0.5 0.6 0.7 0.8 0.9 1.0
0.50.6
0.70.8
0.91.0
Bray-Curtis distance DNA All P
Mantel statistic r: 0.568Signi�cance: 0.001
B
Bray-Curtis distance DNA High P
Bray-Curtis distance mRN
A A
ll P

Chapter II
55
Comparison between ARISA (DNA) and TFA (mRNA) distances
Distances calculated from DNA and mRNA matrices were significantly correlated according to
the Mantel test results (Figure 3A-B). However, the regression coefficients were rather low. The ad-
justed r2 values of the regressions were 0.173 and 0.322 for the HighP matrix and the AllP matrix,
respectively. This indicates that, as could be expected, similarity in composition was only one of
several factors determining the similarities in gene expression patterns.
Seasonal patterns in community composition and expression.
Similar seasonal patterns were observed in ARISA and TFA, as showed by the NMDS ordination
(Figures 4A-B and 5A-B). Samples generally clustered into two groups roughly corresponding to
winter (cold water, <16ºC) and summer (warm water, >16ºC). This was the case for both ARISA
and TFA and for both threshold levels. The composition of picoeukaryotic assemblages in the
winter samples were closer among themselves when only the HighP were considered than when
AllP were taken into account (Figures 4A and B). This was not the case for the expression patterns
(Figures 5A and B). Some “summer” samples were within the “winter” cluster and vice-versa, but
in all cases these samples corresponded to the transition months between summer and winter and
point to weather variability among years.
Figure 4C shows the distances among picoeukaryotic community composition from different years
for each month when only the HighP were considered. Thus, the samples from the winter months
January, February and March were relatively similar from one year to the next (Figure 4C). On the
other hand, samples from the summer months, particularly July and August, were more variable
from year to year (Figure 4C). When AllP were considered, all the months showed similar differ-
ences among years (Figure 4D). The equivalent graph for mRNA showed larger variability from
year to year for winter months (Figure 5C) and the same smoothing in variability when AllP were
included in the analysis (Figure 5D).
Considering the HighP alone, the ARISA patterns were less variable than the TFA patterns in
winter (Figures 4C and 5C). In contrast, the summer ARISA patterns were more variable than
the TFA patterns. This second situation might point to functional redundancy in the summer. The
former situation, on the other hand, suggests a similar community changing its expression patterns
from year to year.

Seasonal gene expression patterns in marine picoeukaryotes
56
Figure 4. Upper panels: NMDS diagrams compar-
ing DNA fingerprints (ARISA) from samples collected
monthly between June 2007 and February 2011 from
Blanes Bay Microbial Observatory. Samples are color-
labeled according to the month. The light-blue cloud
includes the winter assemblage and the light-yellow
cloud includes the summer assemblage. Lower panels:
Boxplots showing within month variability of ARISA
fingerprints (Bray-Curtis dissimilarity) along the year.
The red line indicates the mean of within month vari-
ability along the year. A and C) NMDS and boxplot
for HighP. B and D) NMDS and boxplot for AllP.
A B 2D Stress: 0,22D Stress: 0,18
0.3
0.4
0.5
0.6
0.7
0.8
0.9
1.0 DC
DNA High P DNA All P
J F M A M J J A S O N D
0.30.4
0.50.6
0.70.8
0.91.0
J F M A M J J A S O N D
Bray
-Cur
tis d
ista
nce Bray-Curtis distance
monthsmonths
Summer assemblageMayJuneJulyAugustSeptemberOctober
Winter assemblage
April
NovemberDecemberJanuaryFebruaryMarch

Chapter II
57
Figure 5. Upper panels: NMDS diagrams compar-
ing RNA fingerprints (TFA) from samples collected
monthly between June 2007 and February 2011 from
Blanes Bay Microbial Observatory. Samples are color-
labeled according to the month. The light-blue cloud
includes the winter assemblage and the light-yellow
cloud includes the summer assemblage. Lower panels:
Boxplots showing within month variability of TFA fin-
gerprints (Bray-Curtis dissimilarity) along the year. The
red line indicates the mean of within month variability
along the year. A and C) NMDS and boxplot for
HighP. B and D) NMDS and boxplot for AllP.
A B 2D Stress: 0,172D Stress: 0,19
0.3
0.4
0.5
0.6
0.7
0.8
0.9
1.0
mRNA High P mRNA All P
0.30.4
0.50.6
0.70.8
0.91.0DC
J F M A M J J A S O N D J F M A M J J A S O N D
Bray
-Cur
tis d
ista
nce Bray-Curtis distance
monthsmonths
Summer assemblageMayJuneJulyAugustSeptemberOctober
Winter assemblage
April
NovemberDecemberJanuaryFebruaryMarch
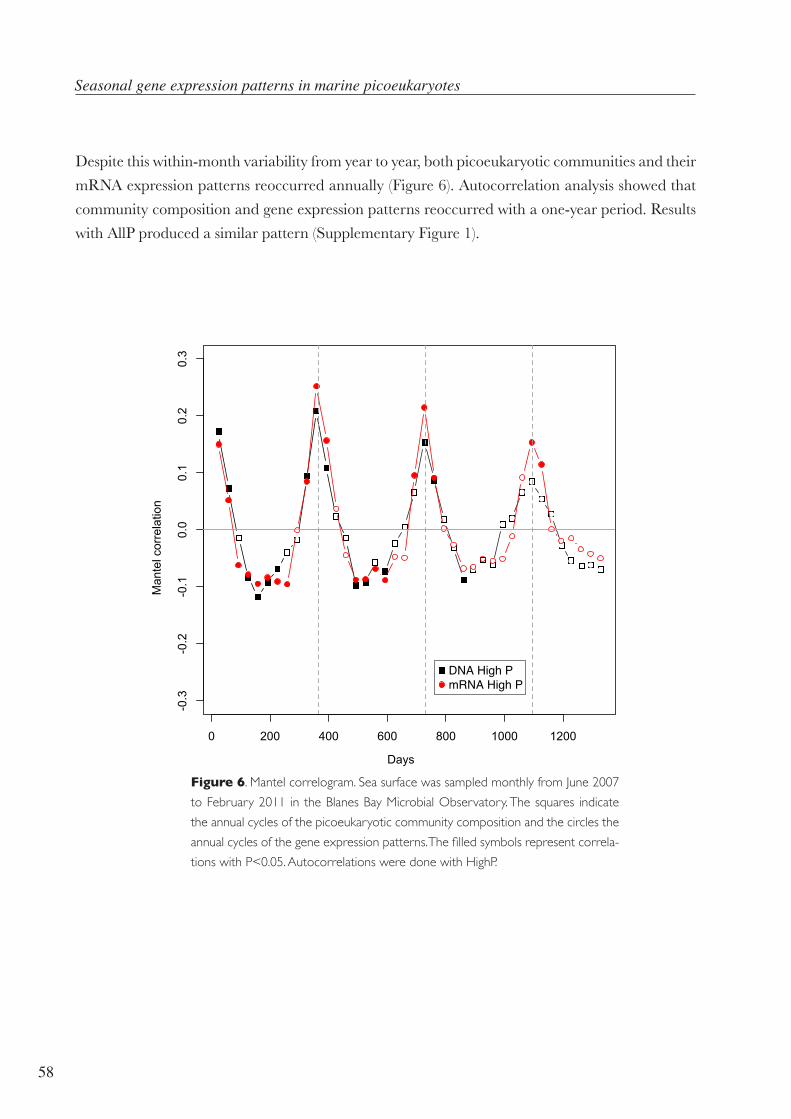
Seasonal gene expression patterns in marine picoeukaryotes
58
Despite this within-month variability from year to year, both picoeukaryotic communities and their
mRNA expression patterns reoccurred annually (Figure 6). Autocorrelation analysis showed that
community composition and gene expression patterns reoccurred with a one-year period. Results
with AllP produced a similar pattern (Supplementary Figure 1).
0 200 400 600 800 1000 1200
-0.3
-0.2
-0.1
0.0
0.1
0.2
0.3
Days
Man
tel c
orre
latio
n
●
DNA High PmRNA High P
Figure 6. Mantel correlogram. Sea surface was sampled monthly from June 2007
to February 2011 in the Blanes Bay Microbial Observatory. The squares indicate
the annual cycles of the picoeukaryotic community composition and the circles the
annual cycles of the gene expression patterns. The filled symbols represent correla-
tions with P<0.05. Autocorrelations were done with HighP.
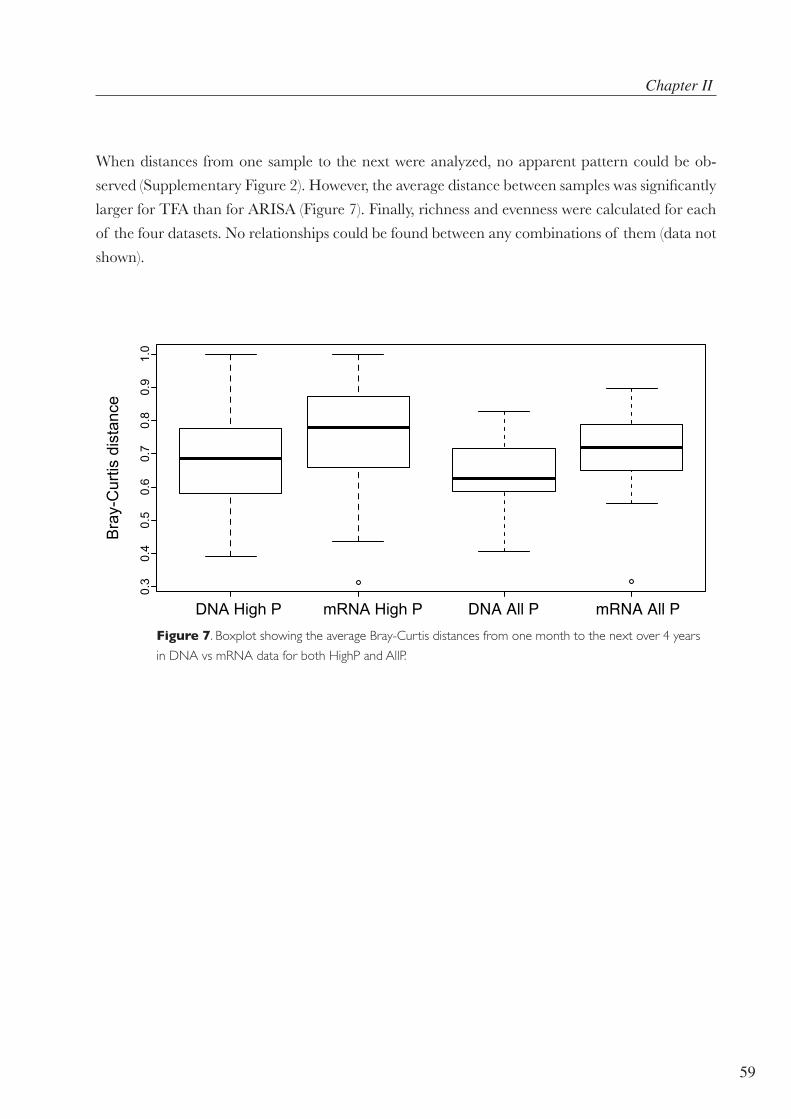
Chapter II
59
When distances from one sample to the next were analyzed, no apparent pattern could be ob-
served (Supplementary Figure 2). However, the average distance between samples was significantly
larger for TFA than for ARISA (Figure 7). Finally, richness and evenness were calculated for each
of the four datasets. No relationships could be found between any combinations of them (data not
shown).
DNA High P mRNA High P
0.3
0.4
0.5
0.6
0.7
0.8
0.9
1.0
DNA All P mRNA All P
Bra
y-C
urtis
dis
tanc
e
Figure 7. Boxplot showing the average Bray-Curtis distances from one month to the next over 4 years
in DNA vs mRNA data for both HighP and AllP.
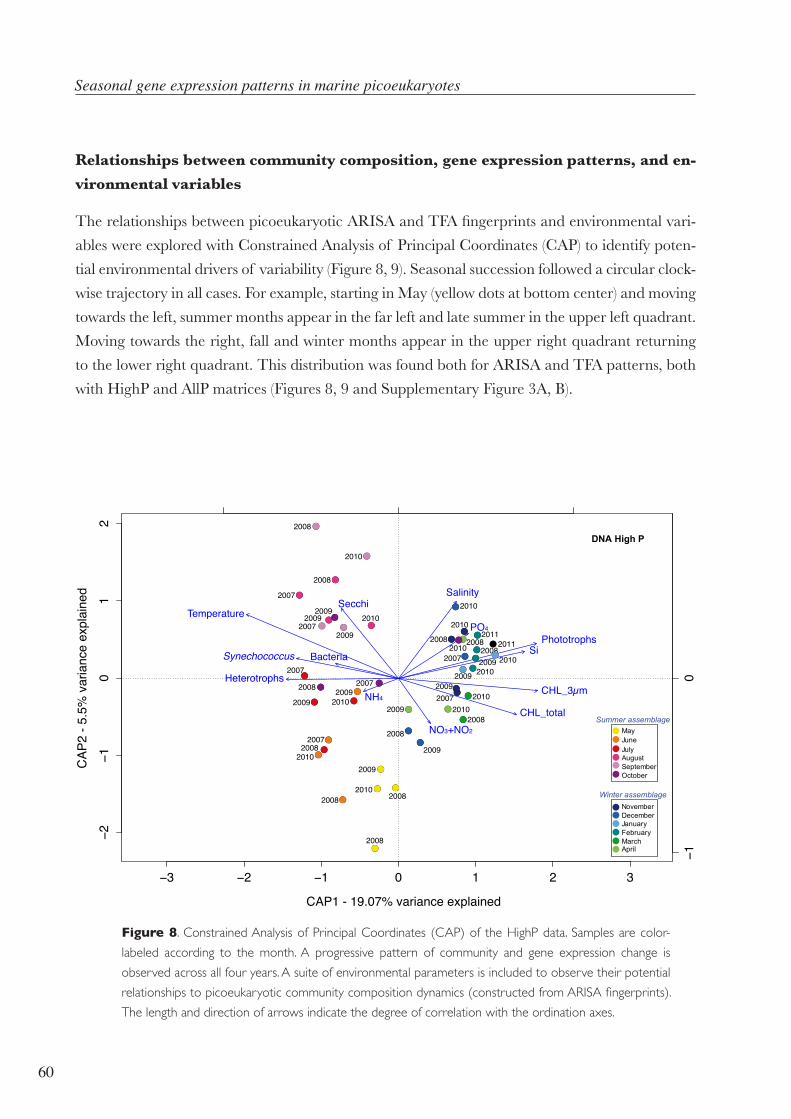
Seasonal gene expression patterns in marine picoeukaryotes
60
Figure 8. Constrained Analysis of Principal Coordinates (CAP) of the HighP data. Samples are color-
labeled according to the month. A progressive pattern of community and gene expression change is
observed across all four years. A suite of environmental parameters is included to observe their potential
relationships to picoeukaryotic community composition dynamics (constructed from ARISA fingerprints).
The length and direction of arrows indicate the degree of correlation with the ordination axes.
−3 −2 −1 0 1 2 3
−2−1
01
2
CAP1 - 19.07% variance explained
CAP
2 - 5
.5%
var
ianc
e ex
plai
ned
2007
2007
2007
2007
2007
2007
2007
2008
2008
2008
2008
2008
2008
2008
2008
2008
2008
2008
20092009
2009
2009
20092009
2009
2009
2009
2009
2009
20102010
20102010
2010
2010
2010
2010
2010
2010
2010
2010
20112011
2008
−10
CHL_total
CHL_3µm
Phototrophs
Heterotrophs
BacteriaSynechococcus
TemperatureSecchi
Salinity
PO4
NH4
NO3+NO2
Si
Summer assemblage
Winter assemblage
April
NovemberDecemberJanuaryFebruaryMarch
MayJuneJulyAugustSeptemberOctober
●
●●
●
●
●
●●
●●
●
●
DNA High P
●●
●●
●●
●●
●●●●
●●●●
●●
●●
●●
●●
●●
●●
●●
●●
●●
●●
●●
●●●●
●●
●●
●●●●
●●●●
●●
●●
●●
●●
●●
●●
●●
●●
●●
●●
●●
●●
●●●●
●●●
●●
●
Relationships between community composition, gene expression patterns, and en-
vironmental variables
The relationships between picoeukaryotic ARISA and TFA fingerprints and environmental vari-
ables were explored with Constrained Analysis of Principal Coordinates (CAP) to identify poten-
tial environmental drivers of variability (Figure 8, 9). Seasonal succession followed a circular clock-
wise trajectory in all cases. For example, starting in May (yellow dots at bottom center) and moving
towards the left, summer months appear in the far left and late summer in the upper left quadrant.
Moving towards the right, fall and winter months appear in the upper right quadrant returning
to the lower right quadrant. This distribution was found both for ARISA and TFA patterns, both
with HighP and AllP matrices (Figures 8, 9 and Supplementary Figure 3A, B).
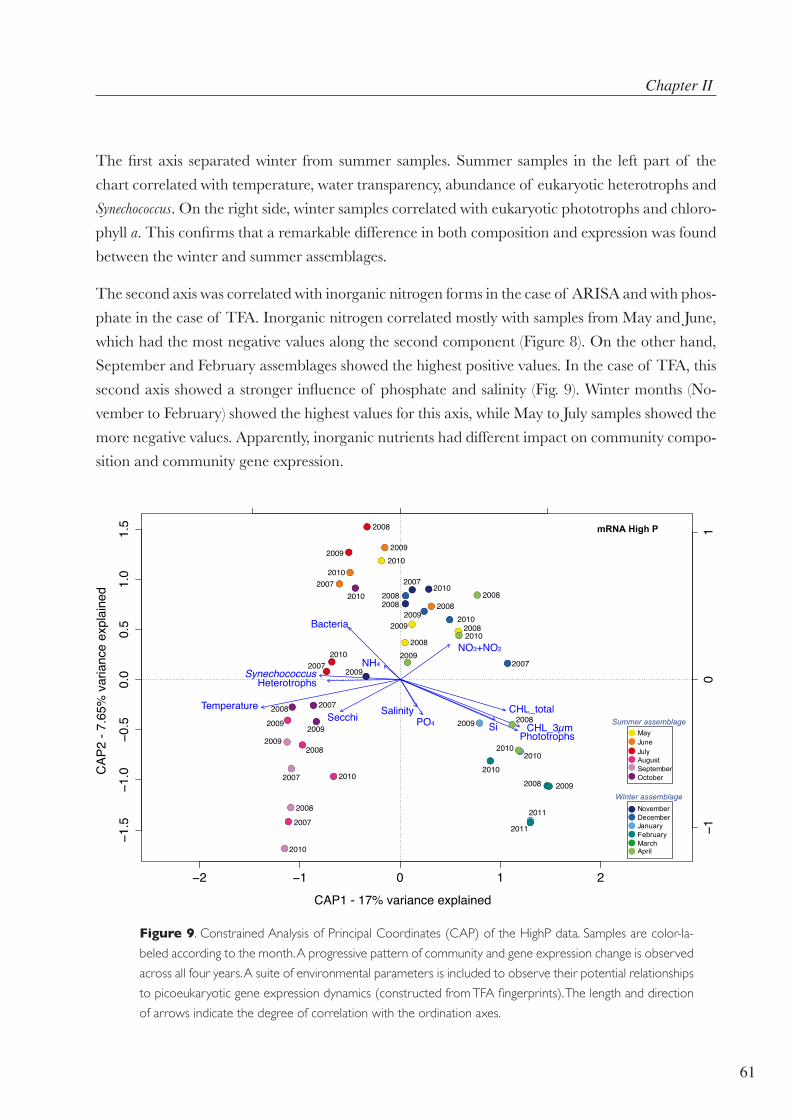
Chapter II
61
The first axis separated winter from summer samples. Summer samples in the left part of the
chart correlated with temperature, water transparency, abundance of eukaryotic heterotrophs and
Synechococcus. On the right side, winter samples correlated with eukaryotic phototrophs and chloro-
phyll a. This confirms that a remarkable difference in both composition and expression was found
between the winter and summer assemblages.
The second axis was correlated with inorganic nitrogen forms in the case of ARISA and with phos-
phate in the case of TFA. Inorganic nitrogen correlated mostly with samples from May and June,
which had the most negative values along the second component (Figure 8). On the other hand,
September and February assemblages showed the highest positive values. In the case of TFA, this
second axis showed a stronger influence of phosphate and salinity (Fig. 9). Winter months (No-
vember to February) showed the highest values for this axis, while May to July samples showed the
more negative values. Apparently, inorganic nutrients had different impact on community compo-
sition and community gene expression.
Figure 9. Constrained Analysis of Principal Coordinates (CAP) of the HighP data. Samples are color-la-
beled according to the month. A progressive pattern of community and gene expression change is observed
across all four years. A suite of environmental parameters is included to observe their potential relationships
to picoeukaryotic gene expression dynamics (constructed from TFA fingerprints). The length and direction
of arrows indicate the degree of correlation with the ordination axes.
−2 −1 0 1 2
−1.5
−1.0
−0.5
0.0
0.5
1.0
1.5
CAP1 - 17% variance explained
CAP
2 - 7
.65%
var
ianc
e ex
plai
ned 2007
2007
2007
2007
2007
2007
2007
2008
2008
2008
2008
2008
2008
2008
2008
2008
2008
20082008
2009
2009
2009
2009
20092009
2009
20092009
2009
2009
20102010
2010
2010
20102010
2010
2010
2010
20102010
2010
2011
2011 −10
1CHL_total
CHL_3µmPhototrophs
Heterotrophs
Bacteria
Synechococcus
TemperatureSecchi Salinity
PO4
NH4
NO3+NO2
Si Summer assemblage
Winter assemblage
April
NovemberDecemberJanuaryFebruaryMarch
MayJuneJulyAugustSeptemberOctober
●
●●
●
●
●
●●
●●
●
●
mRNA High P
●●
●●
●●
●●
●●
●●
●●
●●
●●
●●
●●
●●
●●
●●
●●
●●
●●
●●
●●
●●
●●
●●
●●
●●●●
●●
●●
●●
●●
●●
●●
●●
●●
●●
●●
●●
●●
●●
●●
●● ●●
●●
●●●●
●●
●●
●●
●●
●●
●●
●●
●●
●●
●●
●●●●
●●
●●
●●
●●
●●
●●●●
●●
●●
●●
●●
●●●●
●●
●●
●●
●●
●●
●●●●
●●
●●
●●●●
●●
●●
●●
●● ●●
●●
●●●●
Seasonal gene expression patterns in marine picoeukaryotes
62
DISCUSSION
A very important technical issue for all studies exploring changes in microbial gene expression in
environmental samples is to take into account the mRNA longevity. It is known that mRNAs are
generally unstable and that gene expression may change in minutes (Moran et al., 2012). Further,
a recent study comparing bacteria collected with a normal CTD with bacteria fixed in situ (at the
depth of collection), revealed that some of the highly expressed genes in the unfixed bacteria were
stress response genes, while expression of important genes in situ, for example the genes for am-
monia oxidation, was severely reduced in the unfixed samples (Feike et al., 2012). It is true that
the ecosystem sampled in that study was the anaerobic section of the Baltic Sea and that the an-
aerobic or microaerophylic bacteria living at those depths would be particularly prone to stress by
being pulled through the aerobic water column. However, this study brings attention to one of the
main problems in analyzing mRNAs from natural communities. In a previous study (Coll-Lladó
et al., 2011), we showed that despite these caveats, with our technique we could obtain repeatable
gene expression patterns. Moreover, the patterns were consistent with the spatial distribution of
the samples. In the present study we also obtained a robust seasonal pattern of gene expression in
BBMO. This indicates that the seasonal signal was strong enough to be retrieved despite the short
lifetimes of many mRNAs.
Another interesting comparison was checking how the inclusion of all peaks of the electrophe-
rogram in the analysis would affect the results. In principle, large peaks correspond to highly
expressed genes only, while small peaks added in the AllP analysis include a variety of expression
intensities. Comparing the distance matrices from both methods (Figure 2A-B) it seems that ad-
dition of AllP “buffers” the differences among samples. Thus, the highly expressed genes are the
ones generating the largest differences among samples, while the other peaks form a background
of genes that are almost always being expressed at lower intensities. This same behavior could be
observed in the DNA dataset.
Three hypotheses arise when comparing community composition and gene expression patterns.
First, both patterns could change in unison. This would mean that every particular assemblage had
its own specific gene expression pattern. Second, gene expression patterns could change faster than
community composition. This is actually what we would expect a priory, since gene expression is
very dynamic and has the potential to change in few seconds/minutes. Community composition,
on the other hand, requires cell division and death of some taxa and under natural conditions this
may take days to weeks. The interpretation of this possibility is that a certain species assemblage
is capable to adapt partially to environmental changes by expressing a different set of genes. How-
ever, if environmental changes were sufficiently strong that some species would no longer be within
their survival range (temperature, nutrients, etc…), the composition would also change.
Chapter II
63
Third, changes in composition could be faster than changes in gene expression. This possibility
seems counterintuitive at a first glance. However, it could be possible that the main genes expressed
are the same in all situations. Core metabolism genes, such as certain cytochromes, ATPase or
ribulose biphosphate carboxylase should be always abundantly expressed, regardless of the spe-
cies present. Since our fingerprinting technique only retrieves the highly expressed genes, this
functional redundancy is certainly a conceivable possibility. It has to be remembered that all our
samples were collected at approximately the same time of the day (between 10-12am) and, thus,
the obvious diel changes in gene expression patterns were not an issue.
Both community composition and gene expression patterns followed a very clear seasonal cycle
as shown in Figure 6. These changes were driven by temperature and other environmental fac-
tors, which explained around 45% of the variability (Figure 8). The main differences were found
between summer and winter. This pattern had also been found in previous studies of community
composition (Shade et al., 2007). In general, gene expression patterns showed the same contrast
between summer and winter.
Picoeukaryotes in Blanes Bay follow a cycle in which phototrophic organisms are more abundant
in winter than in summer. Heterotrophic flagellates, on the other hand, show very little changes
throughout the year (Massana, 2011). Thus, the relative importance of phototrophs is larger in
winter and that of heterotrophs in summer. This can be seen in Figure 8, where phototrophs cor-
relate with chlorophyll and low temperatures, while heterotrophs correlate with high temperature,
water transparency, and Synechococcus abundance (also more abundant in summer). Thus, the big
picture is what we could expect: gene expression patterns change along seasons and the more
contrasted differences occur between summer and winter, roughly following changes in commu-
nity composition. These observations support hypothesis 1: each community shows its own gene
expression pattern and, therefore, community composition and gene expression change in parallel.
If individual months are considered, however, subtler relationships appear. In the case of com-
munity composition, winter months tended to be rather similar to each other when different years
were compared. Summer months, on the other hand, tended to be less similar to each other from
one year to another (Figure 4C). In the case of gene expression, both winter and summer months
were rather different from year to year (Figure 5C). Thus, in winter, gene expression patterns were
more variable than community composition. This corresponds to hypothesis 2: gene expression
patterns are more variable than community composition. During summer months, the variability
was higher for community composition than for gene expression, suggesting that hypothesis 3 pre-
vailed: there was functional redundancy. Thus, the three hypotheses envisioned initially occurred
at some time of the year or at some time scale.

Seasonal gene expression patterns in marine picoeukaryotes
64
In summary, the TFA technique proved adequate to follow gene expression patterns in a large
number of samples in a relatively cheap and quick way. As expected, seasonal changes clearly
appeared and these were concomitant with changes in community composition. At shorter time
scales, however, both community adaptation and gene redundancy were seen at particular times of
the year, when the most abundant OTUs and the highly expressed genes were considered. Inclu-
sion of all the peaks in the ARISA and TFA electropherograms reduced substantially the differen-
tiation between samples, thus acting as a buffer of both composition and gene expression patterns.
ACKNOWLEDGEMENTS
We thank Ramon Massana for epifluorescence microscope counts, Vanessa Balagué for the DNA
extractions and Josep M. Gasol for curation of the Blanes Bay Microbial Observatory dataset.
This work was supported by grant GEMMA (CTM2007-63753-C02-01/MAR) and PANGE-
NOMICS (CGL2011-26848/BOS) from the Spanish Ministry of Science and Innovation. HS
benefited from fellowships from the Spanish Ministry of Science and Innovation (JCI-2008-2727)
and Brazilian “Ciências sem Fronteiras” Program from CAPES (BJT 013/2012).
Chapter II
65
REFERENCES
Alonso-Sáez, L., Vázquez-Domínguez, E., Cardelús, C., Pinhassi, J., Sala, M. M., Lekunberri, I.
et al. 2008. Factors controlling the year-round variability in carbon flux through bacteria
in a coastal marine system. Ecosystems, 11(3): 397-409.
Auguet, J-C., Nomokonova, N., Camarero, L., & Casamayor, E. O. 2011. Seasonal Changes of
Freshwater Ammonia-Oxidizing Archaeal Assemblages and Nitrogen Species in Oligotro-
phic Alpine Lakes. Appl Environ Microbiol, 77(6): 1937-1945.
Brown, M. V., Schwalbach, M. S., Hewson, I., & Fuhrman, J. A. 2005. Coupling 16S-ITS rDNA
clone libraries and automated ribosomal intergenic spacer analysis to show marine micro-
bial diversity: development and application to a time series. Environ Microbiol, 7(9): 1466-
1479.
Casamayor, E. O., Pedrós-Alió, C., Muyzer, G., & Amann, R. 2002. Microheterogeneity in 16S
Ribosomal DNA-Defined Bacterial Populations from a Stratified Planktonic Environment
Is Related to Temporal Changes and to Ecological Adaptations. Appl Environ Microbiol,
68(4): 1706-1714.
Chow, C-E. T., & Fuhrman, J. A. 2012. Seasonality and monthly dynamics of marine myovirus
communities. Environ Microbiol, 14(8): 2171-2183.
Clarke, K. R. 1993. A method of linking multivariate community structure to environmental vari-
ables. Marine ecology progress series, 92: 205.
Coll-Lladó, M., Acinas, S. G., Pujades, C., & Pedrós-Alió, C. 2011. Transcriptome Fingerprinting
Analysis: An Approach to Explore Gene Expression Patterns in Marine Microbial Com-
munities. PLoS ONE, 6(8): e22950.
Feike, J., Jurgens, K., Hollibaugh, J. T., Kruger, S., Jost, G., & Labrenz, M. 2012. Measuring un-
biased metatranscriptomics in suboxic waters of the central Baltic Sea using a new in situ
fixation system. ISME J, 6(2): 461-470.
Fisher, M. M., & Triplett, E. W. 1999. Automated Approach for Ribosomal Intergenic Spacer
Analysis of Microbial Diversity and Its Application to Freshwater Bacterial Communities.
Appl. Environ. Microbiol., 65(10): 4630-4636.
Fuhrman, J. A., Hewson, I., Schwalbach, M. S., Steele, J. A., Brown, M. V., & Naeem, S. 2006.
Annually reoccurring bacterial communities are predictable from ocean conditions. Proc
Natl Acad Sci U S A, 103(35): 13104-13109.
Seasonal gene expression patterns in marine picoeukaryotes
66
Galand, P. E., Gutiérrez-Provecho, C., Massana, R., Gasol, J. M., & Casamayor, E. O. 2010. Inter-
annual recurrence of archaeal assemblages in the coastal NW Mediterranean Sea (Blanes
Bay Microbial Observatory). Limnology and Oceanography, 55: 2117-2125.
Gasol, J. M., Massana, R., Simó, R., Marrasé, C., Acinas, S. G., Pedrós-Alió, C. et al. 2012.
Blanes Bay (site 55). Phytoplankton and Microbial Plankton Status Report 2009/2010. In
O’Brien, T. D., Li, W. K. W., and Morán, X. A. G. (Eds), ICES Cooperative Research Report No.
313: 138-141.
Gilbert, J. A., Steele, J. A., Caporaso, J. G., Steinbruck, L., Reeder, J., Temperton, B. et al. 2012.
Defining seasonal marine microbial community dynamics. ISME J, 6(2): 298-308.
Massana, R. 2011. Eukaryotic Picoplankton in Surface Oceans. Annual Review of Microbiology, 65(1):
91-110.
Massana, R., Karniol, B., Pommier, T., Bodaker, I., & Béjà, O. 2008. Metagenomic retrieval of a
ribosomal DNA repeat array from an uncultured marine alveolate. Environ Microbiol, 10(5):
1335-1343.
Massana, R., Murray, A. E., Preston, C. M., & DeLong, E. F. 1997. Vertical distribution and phy-
logenetic characterization of marine planktonic Archaea in the Santa Barbara Channel.
Appl Environ Microbiol, 63(1): 50-56.
McDonald, S., Sarno, D., Scanlan, D., & Zingone, A. 2007. Genetic diversity of eukaryotic ultrap-
hytoplankton in the Gulf of Naples during an annual cycle. Aquatic Microbial Ecology, 50(1):
75-89.
Moran, M. A., Satinsky, B., Gifford, S. M., Luo, H., Rivers, A., Chan, L-K. et al. 2012. Sizing up
metatranscriptomics. ISME J.
Murray, A. E., Blakis, A., Massana, R., Strawzewski, S., Passow, U., Alldredge, A., & DeLong, E.
F. 1999. A time series assessment of planktonic archaeal variability in the Santa Barbara
Channel. Aquatic Microbial Ecology, 20(2): 129-145.
Newton, R. J., Kent, A. D., Triplett, E. W., & McMahon, K. D. 2006. Microbial community dy-
namics in a humic lake: differential persistence of common freshwater phylotypes. Environ
Microbiol, 8(6): 956-970.
Ottesen, E. A., Young, C. R., Eppley, J. M., Ryan, J. P., Chavez, F. P., Scholin, C. A., & DeLong,
E. F. 2013. Pattern and synchrony of gene expression among sympatric marine microbial
populations. Proceedings of the National Academy of Sciences, 110(6): E488-E497.
Chapter II
67
Pinhassi, J., & Hagström, Å. 2000. Seasonal succession in marine bacterioplankton. Aquatic Micro-
bial Ecology, 21(3): 245-256.
Poretsky, R. S., Gifford, S., Rinta-Kanto, J., Vila-Costa, M., & Moran, M. A. 2009. Analyzing gene
expression from marine microbial communities using environmental transcriptomics. J Vis
Exp(24).
Porter, K. S., & Feig, Y. S. 1980. The Use of DAPI for Identifying and Counting Aquatic Micro-
flora. Limnology and Oceanography, 25(5): 943-948.
R development Core Team. 2005. R: A language and environment for statistical computing. Vi-
enna, Austria: R Foundation for Statistical Computing.
Robidart, J. C., Preston, C. M., Paerl, R. W., Turk, K. A., Mosier, A. C., Francis, C. A. et al. 2012.
Seasonal Synechococcus and Thaumarchaeal population dynamics examined with high
resolution with remote in situ instrumentation. ISME J, 6(3): 513-523.
Schauer, M., Balagué, V., Pedrós-Alió, C., & Massana, R. 2003. Seasonal changes in the taxo-
nomic composition of bacterioplankton in a coastal oligotrophic system. Aquatic Microbial
Ecology, 31(2): 163-174.
Shade, A., Kent, A. D., Jones, S. E., Newton, R. J., Triplett, E. W., & McMahon, K. D. 2007. In-
terannual dynamics and phenology of bacterial communities in a eutrophic lake. Limnology
and Oceanography, 52(2): 487-494.
Treusch, A. H., Vergin, K. L., Finlay, L. A., Donatz, M. G., Burton, R. M., Carlson, C. A., &
Giovannoni, S. J. 2009. Seasonality and vertical structure of microbial communities in an
ocean gyre. ISME J, 3(10): 1148-1163.

Seasonal gene expression patterns in marine picoeukaryotes
68
●
0 200 400 600 800 1000 1200
−0.3
−0.2
−0.1
0.0
0.1
0.2
0.3
Days
Man
tel c
orre
latio
n
●
●
●
●
● ● ●
●
●
●
●●
● ●
●
●
●
●
●●
● ●
●
DNA All PmRNA All P
Figure 1. Mantel correlogram. Sea surface was sampled monthly from June 2007 to Febru-
ary 2011 in the Blanes Bay Microbial Observatory. The blue line indicates the annual repeating
patterns of the picoeukaryotic community composition and the red line the annual cycle of the
gene expression patterns. The filled symbols indicate correlations with P<0.05. Autocorrela-
tions were carried out with AllP.
SUPPLEMENTARY INFORMATION

Chapter II
69
Figure 2. Bray-Curtis distances from one month to the next over 4 years. The blue line are distances in
DNA fingerprints and the red line in RNA fingerprints (analysis performed from low treshold settings).
●
● ●●
● ● ●●
●
●
●●
●
●
● ● ●●
●●
●
●
●
●
●
●●
●
●
●
●
●
●
●
●●
●●
●
●
●
●
● ●
0 10 20 30 40
0.0
0.4
0.8
months
Bray
-Cur
tis d
ista
nce
● ●
●
● ● ●
● ●●
●
●
● ●
●
●
●
●
●
●
●
●
●●
●
●●
●●
●●
● ●● ●
● ●
●
●
●
●
●
●
●
●
●
●
DNA All PmRNA All P

Seasonal gene expression patterns in marine picoeukaryotes
70
Figure 3. Constrained Analysis of Principal Coordinates (CAP) of the AllP data. Samples are color-
labeled according to the month. A suite of environmental parameters is included to observe their po-
tential relationships to A) picoeukaryotic community composition dynamics (constructed from ARISA
fingerprints, and B) picoeukaryotic gene expression dynamics (constructed from TFA fingerprints). The
length and direction of arrows indicate the degree of correlation with the ordination axes.
−2 −1 0 1 2
−1.5
−1.0
−0.5
0.0
0.5
1.0
1.5
CAP1 - 15.37% variance explained
CAP
2 - 5
.96%
var
ianc
e ex
plai
ned
2007
2007
2007
2007
2007
2007
20072008
2008
2008
2008
2008
2008
2008
2008
2008
20082008
2008
2009
2009
2009
2009
2009
2009
2009
2009
2009
20092009
2010
2010
2010
2010
2010
2010
2010
2010
2010
2010
2010
2010
2011
2011 0
CHL_totalCHL_3µm
Phototrophs
Heterotrophs BacteriaSynechococcus
Temperature Secchi SalinityPO4
NH4
NO3+NO2
Si
Summer assemblage
Winter assemblage
April
NovemberDecemberJanuaryFebruaryMarch
MayJuneJulyAugustSeptemberOctober
●
●●
●
●
●
●●
●●
●
●
DNA All P
●●
●●
●●
●●
●●
●●
●●
●●
●●
●●
●●
●●
●●
●●
●●
●●
●●●●
●●
●●
●●
●●
●●
●●
●●
●●
●●
●●
●●●●
●●
●●
●●
●●
●●
●●
●●
●●
●●
●●
●●
●●
●●
●●
●●
●●
●●
●●
●●
●●
●●
●●
●●
●●
●●
●●
●●
●●
●●
●●
●●●●
●●
●●
●●
●●
●●
●●
●●
●●
●●
●●
●●●●
●●
●●
●●
●●
●●
●●
●●
●●
●●
●●
●●
●●
●●
●●
A

Chapter II
71
−3 −2 −1 0 1 2 3
−2−1
01
CAP1 - 14.67% variance explained
CAP
2 - 5
.3%
var
ianc
e ex
plai
ned
2007
2007
2007
2007
2007
2007
2007
2008
2008
2008
2008
2008
2008
2008
2008
20082008
2008
20082009
2009
2009
2009
2009
2009
2009
2009
2009
20092009
2010
2010
20102010
2010
2010
2010
2010
2010
2010
2010
2010
2011
2011
−10CHL_total
CHL_3µmPhototrophs
Heterotrophs
Bacteria
SynechococcusTemperature
Secchi
Salinity
PO4
NH4NO3+NO2
Si
Summer assemblage
Winter assemblage
April
NovemberDecemberJanuaryFebruaryMarch
MayJuneJulyAugustSeptemberOctober
●
●●
●
●
●
●●
●●
●
●
mRNA All P
●●
●●
●●
●●
●●
●●
●●
●●
●●
●●
●●
●●
●●
●●
●●
●●
●●
●●
●●
●●
●●
●●
●●
●●
●●
●●
●●
●●
●●
●●
●●
●●
●●●●
●●
●●
●●
●●
●●
●●
●●
●●
●●
●●
●●
●●
●●
●●
●●
●●
●●
●●
●●
●●
●●
●●
●●
●●
●●
●●
●●
●●
●●
●●
●●
●●
●●
●●
●●
●●
●●
●●
●●●●
●●
●●
●●●●
●●
●●
●●
●●
●●
●●
●●
●●
●●
●●
B


Chapter 3
Gene Expression Patterns and Community Composition of Marine
Picoeukaryotes: Changes with Depth, Distance from Shore, and along Diel Cycles

Chapter III
75
ABSTRACT
Understanding structure-function relationships of microbial communities is a central topic of mi-
crobial ecology. In fact, studies on microbial composition and expression changes in marine envi-
ronments across oceanographic features, at distinct depths or along temporal changes are scarce.
In this study, the picoeukaryotic gene expression patterns (TFA) were compared with community
DNA composition (ARISA) along a horizontal transect and a depth profile in the northwestern
Mediterranean Sea. TFA was also used during two diel cycles at two depths both in coastal and
open sea waters. Similarities of the picoeukaryotic communities across a 100 km transect were
observed in the surface waters using both mRNA and DNA-based fingerprints, the community
composition being more stable than its expression patterns. The stable communities on the surface
could indicate the influence of the hydrography on the picoeukaryotic assemblages. Analyses of
community structure composition and gene expression provided comprehensive relationships to
disentangle structure-function relationships of microbial communities.
Coupled gene expression patterns and community composition of marine picoeukaryotes: changes with depth, distance from
shore, and along diel cycles. Montserrat Coll-Lladó, Guillem Salazar, Silvia G. Acinas and Carles Pedrós-Alió.
Manuscript.

Comparison of expression and community patterns at different time and space scales
76
INTRODUCTION
Studies analyzing the dynamics of microbial composition with gene expression patterns along
environmental gradients, such as depth in the water column, across oceanographic features, or
through time, are scarce (Hewson et al., 2010; Ottesen et al., 2013; Poretsky et al., 2009b; Coll-Lladó
et al., 2013 submitted). Two of the former studies addressed day-night cycles in bacterial communi-
ties. Many microbial processes are expected to be differentially active over a day/night cycle, such
as photosynthesis or oxidative phosphorylation (Poretsky et al., 2009b). For example, Poretsky et al.
(2009b) examined the transcriptional profiles over a pair of day/night cycle samples of a bacterial
community in the oligotrophic North Pacific Ocean and found that, as expected, gene transcripts
of photosynthetic eukaryotes were more abundant during the day than during the night. Among
the most highly expressed genes detected from phototrophic organisms were those encoding chlo-
rophyll binding proteins, light harvesting reactions and photosynthetic machinery.
Overall these authors showed that bacterial community investment was skewed towards energy
acquisition and metabolism during the day, while biosynthesis (specifically of membranes, amino
acids and vitamins) received relatively greater investments at night (Poretsky et al., 2009b). Ottesen
et al. analyzed surface Pacific Ocean waters in a Lagrangian study for two days and found diel cy-
cles in the expression patterns of Prochlorococcus and Synechococcus, but not in those of chemotrophic
organisms such as SAR11, SAR86 and marine archaea group II (Ottesen et al., 2013).
Hewson et al. (2010) compared bacterial community composition and expression patterns in eight
samples from different oceanic regions. In addition, they compared expression patterns at night
and day. They found that gene expression patterns were very similar across space and between
day and night, despite differences in community composition but that subtle differences could be
observed.
Obviously, disentangling patterns of gene expression at different time and space scales in microbial
communities remains difficult and, thus, there are very few studies available. Moreover, no studies
have addressed these questions for picoeukaryotic plankton. In a previous work (Coll-Lladó et al.,
2013 submitted) we analyzed seasonal changes at one coastal site with a fingerprinting technique
to detect picoeukaryotic gene expression patterns. We found a yearly repetition of both composi-
tion and expression patterns. However, at some times of the year changes were faster in commu-
nity composition than in gene expression while the opposite was true at other times.
In the present work we examined the spatial variability of the picoeukaryotic community structure
and its gene expression patterns across a transect in the Northwestern (NW) Mediterranean Sea.

Chapter III
77
Spatial changes were examined in surface samples collected over a 100 km transect from shore to
open sea. Changes were also analyzed through a vertical profile at the deepest station (2000 m).
Finally, diel cycles were studied at the two stations at both ends of the transect.
Marine picoeukaryotes (which are between 0.2 and 2 to 3 μm in diameter) are probably the most
abundant eukaryotes on Earth (Marañón et al., 2001; Massana, 2011) and are found throughout
the water column. While autotrophic picoeukaryotes are restricted to the photic zone (upper 100–
200 m), heterotrophic groups are found at greater depths (Brown et al., 2009; Edgcomb et al., 2002;
López-García et al., 2001; Moreira & López-García, 2002) even in the abyssal sea floor at depths
near 6,000 m in the southern Atlantic Ocean (Scheckenbach et al., 2010).
Members of the picoplankton are important contributors to both photosynthetic biomass and pro-
duction (Marañón et al., 2001), particularly in oligotrophic regions such as around Hawaii in which
80% of the chlorophyll a biomass could be due to cells <3 µm in waters (Bienfang et al., 1984). The
waters from the northwestern Mediterranean Sea are also oligotrophic and their picoeukaryotic
diversity has been studied extensively using molecular surveys of the 18S ribosomal DNA gene
revealing a large diversity (Massana et al., 2004). Also, fingerprinting techniques such as denatur-
ing gradient gel electrophoresis (DGGE) have been applied to quickly compare the composition of
planktonic eukaryotic assemblages (Díez et al., 2001).
Here, picoeukaryotic communitiy composition was followed by ITS1 ribosomal RNA gene-based
fingerprints using Automated Ribosomal Intergenic Spacer Analysis (ARISA) and gene expression
patterns were examined through Transcriptome Fingerprinting Analysis (TFA) as described in
(Coll-Lladó et al., 2011). The main goal was to study the relationship between changes in composi-
tion (ARISA) and expression patterns (TFA) of picoeukaryotes along environmental gradients and
day-night cycles.

Comparison of expression and community patterns at different time and space scales
78
MATERIALS AND METHODS
Sampling and collection of biomass
Samples were collected during cruise MODIVUS (17-27th September 2007) on board R/V García
del Cid at five stations from coastal to open sea in the NW Mediterranean Sea (Table 1A). This tran-
sect has been studied repeatedly from different perspectives including microbial processes (Estrada
et al., 1993; Pedrós-Alió et al., 1999; Sala et al., 2002) and diversity of microorganisms (Crespo et
al., 2013; Pommier et al., 2010). Samples were collected with Niskin bottles mounted on a rosette
with a CTD. Five stations were occupied and vertical profiles sampled at each station. Water was
prefiltered through a 200 µm and 20 µm Nylon mesh in succession and immediately processed on
board. Water for RNA was kept on ice throughout the filtration process.
Table 1. A) Geographical location and description of the sampling points of the
MODIVUS oceanographic cruise. Samples are numbered according to the respective
sampling depth. B) General description of the diel cycle studies.
Station Date
(dd/mm/yy) Latitude
N Longitude
E Sampling
depths (m)
Bottom depth
(m)
Surface chlorophyll a
(µg L-1)
C 18-20/09/07 41°39'5.6" 2°48'1.3" 5 30 0.09
CM 21/09/07 41°24'5.9" 2°48'4.9" 5, 30, 44, 60, 100, 600
660 0.07
M 21/09/07 41°9'1.3" 2°49'3.3" 5, 48, 400, 1400 1430 0.08
MD 22/09/07 40°54'52.78" 2°50'43.8" 4, 60, 77, 140, 400, 2000
1972 0.10
D 23-25/09/07 40°39'4.7" 2°51'1.6" 5, 25, 44, 65, 500, 2000
2226 0.08
Station Date Position Type Bottom depth
(m)
Experiment duration
(h)
Sample depth (m)
C_4m 18–20 Sep07
41˚39’5.6" N, 2˚48’1.3" E
coastal 30 56 4
C_15m 18–20 Sep07
41˚39’5.6" N, 2˚48’1.3" E
coastal 30 56 15
D_5m 23–25 Sep07
40˚39’4.7" N, 2˚51’1.6" E
open sea
2226 44 5
D_65m 23–25 Sep07
40˚39’4.7" N, 2˚51’1.6" E
open sea
2226 44 65
A
B
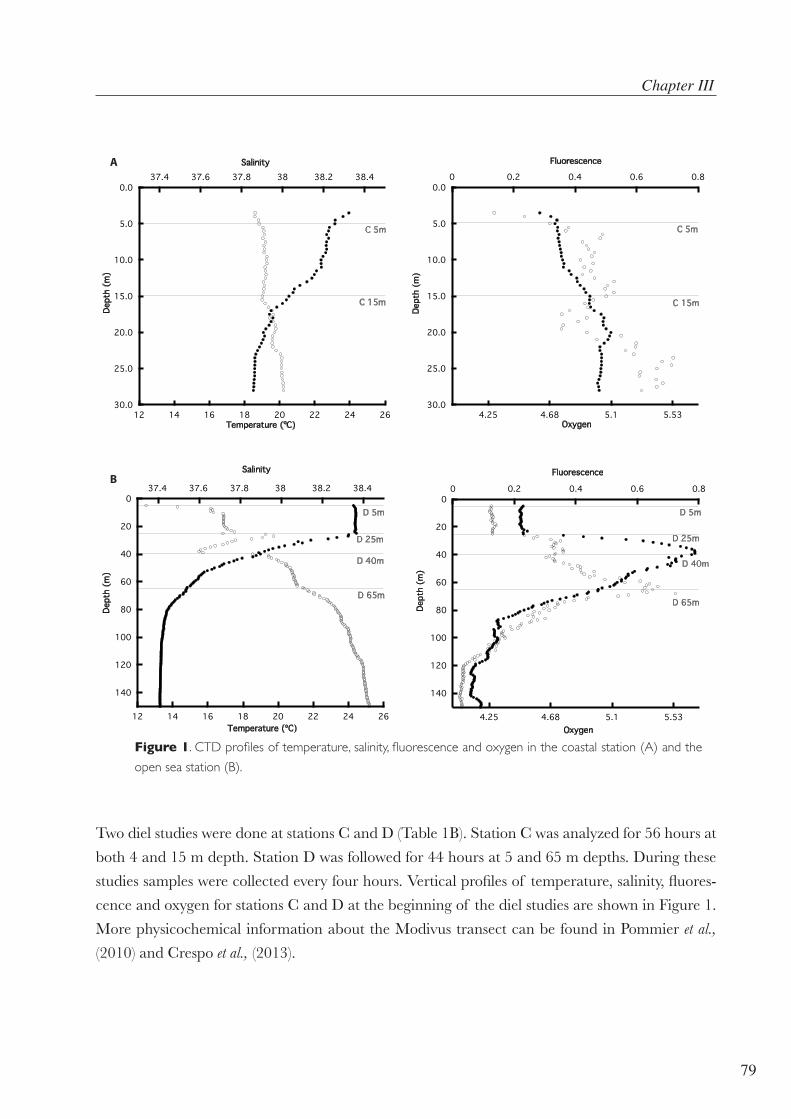
Chapter III
79
Two diel studies were done at stations C and D (Table 1B). Station C was analyzed for 56 hours at
both 4 and 15 m depth. Station D was followed for 44 hours at 5 and 65 m depths. During these
studies samples were collected every four hours. Vertical profiles of temperature, salinity, fluores-
cence and oxygen for stations C and D at the beginning of the diel studies are shown in Figure 1.
More physicochemical information about the Modivus transect can be found in Pommier et al.,
(2010) and Crespo et al., (2013).
0
20
40
60
80
100
120
140
12 14 16 18 20 22 24 26
37.4 37.6 37.8 38 38.2 38.4
Dept
h (m
)
Temperature (ºC)
Salinity
D 5m
D 40m
D 25m
D 65m
B
0
20
40
60
80
100
120
140
4.25 4.68 5.1 5.53
0 0.2 0.4 0.6 0.8
Dept
h (m
)
Oxygen
Fluorescence
D 5m
D 40m
D 25m
D 65m
0.0
5.0
10.0
15.0
20.0
25.0
30.012 14 16 18 20 22 24 26
37.4 37.6 37.8 38 38.2 38.4
Temperature (ºC)
Salinity
C 5m
C 15m
A
0.0
5.0
10.0
15.0
20.0
25.0
30.04.25 4.68 5.1 5.53
0 0.2 0.4 0.6 0.8
Dept
h (m
)Oxygen
C 5m
C 15m
Fluorescence
Dept
h (m
)
Figure 1. CTD profiles of temperature, salinity, fluorescence and oxygen in the coastal station (A) and the
open sea station (B).

Comparison of expression and community patterns at different time and space scales
80
Picoeukaryote community DNA fingerprinting (ARISA)
Microbial biomass was collected by a serial filtration of eight liters of seawater through a 3-µm
pore-size polycarbonate prefilter (Poretics) and a 0.2-µm Sterivex filter (Durapore, Millipore) using
a peristaltic pump. The Sterivex units were filled with 1.8 mL of lysis buffer (40 mM EDTA pH
8.0, 50 mM Tris-HCl pH 8.3, 0.75 M sucrose) and stored at -20°C. Nucleic acids were extracted
as described in (Massana et al., 1997).
Specific primers were used to amplify the internal transcribed spacer 1 (ITS1) (Massana et al.,
2008). The sequence of forward primer (EUK RR) was labeled with a fluorescence tag (FAM)
and matched the end of the SSU and was: 5’-GTAGGTGAACCTGCAGAAGGATCA-3’. The
reverse primer, ITS2, matched the beginning of the 5.8S. The sequence of ITS2 was 5’-GCTGC-
GTTCTTCATCGATGC -3’. The PCR mixture (40 µl) contained: 10 ng of DNA template, 250
nM of each primer, 250 nM dNTPs, 2.5 mM Mg Cl2, 3 U Taq DNA polymerase, and the enzyme
buffer. PCR cycling, carried out in a DNA Engine® thermal cycler (Bio-Rad Laboratories, Inc.),
comprised an initial denaturation step at 94 ˚C for 2 min followed by 32 cycles of denaturation
at 94 ˚C for 15 s, annealing at 55 ˚C for 30 s and extension at 72 ˚C for 3 min followed by a final
extension step at 72 ˚C for 9 min. A negative control was run for each set of reactions to assess the
background levels. We used the same TFA pipeline (see details below) to discriminate the ARISA
amplicons with gene analyzer, the only difference was that ARISA fragments were detected in a
different channel because of the nature of the fluorescent tag.
Transcriptome fingerprinting analysis (TFA)
Seawater samples for TFA were filtered first through a 3-µm pore-size polycarbonate filter (Poret-
ics) and then through a 0.2-µm polycarbonate filter (Poretics) using a peristaltic pump (MasterFlex
7553-89 with cartridges Easy Load II 77200-62, Cole-Parmer Instrument Company) to collect
the bacteria and picoeukaryotes. Filters were flash-frozen in liquid nitrogen and keep it on it until
processed. Total RNA was extracted from the 0.2-µm polycarbonate filters.
RNA extraction and purification. The procedure was adapted from (Poretsky et al., 2009a). Filters
were transferred to 2 ml screw-cap microcentrifuge tubes containing 200-µl of 0.1 mm- diameter
zirconia-silica beads (BioSpec Products, Inc.) and 100-µl of 0.5 mm glass beads (BioSpec Products,
Inc.) mixed with 450-µl RLT lysis buffer (provided by the RNeasy Mini Kit Qiagen, Inc.) plus ß-
mercaptoethanol (Fluka). Samples were mechanically disrupted in a Mini-beadbeater-8TM cell
disrupter (BioSpec Products, Inc., Bartlesville, OK) for 10 min. After disruption, samples were
incubated on ice for 5 min and the beads were allowed to settle out of the lysis mixture. Samples
underwent centrifugation (in an Eppendorf centrifuge at 2100 rcf 1 min). The lysate was trans-

Chapter III
81
ferred to a new tube. 300 µl of lysis solution was added to the vials with beads to increase the final
yield. The tubes were shaken vigorously and the supernatant was also recovered. The same volume
of 70% ethanol was added to the lysate and samples were purified according to the RNeasy Mini
Kit (Qiagen, Inc.). The isolated total RNA was treated with TurboDNase I (Ambion) to remove
contaminating genomic DNA according to the manufacturer’s instructions. RNA was aliquoted
and quantified by absorbance at 260 nm with a NanoDrop 1000 (Thermo Fisher Scientific Inc.,
Wilmington, DE).
Reverse transcription and PCR amplification. First-strand cDNA synthesis was conducted with 30
ng of total RNA as starting material. mRNAs were reverse-transcribed to single-stranded comple-
mentary DNA using the SuperScript III reverse transcriptase (Invitrogen) and the primer H-T11A
(5’-AAGCTTTTTTTTTTTA-3’). To denature any secondary structure, an aliquot of each of the
RNA extracts plus the oligo(dT) primer were heated for 5 min at 65ºC and immediately placed on
ice before mixing with the final reaction solution (20 µl): 5X First-Strand buffer, 0.1 M DTT, 40 U
RNaseOUT, 10 mM dNTPs and 200 U SuperScript III RT. Reaction mixtures were incubated at
50ºC during 50 min, and inactivated by heating 70 ˚C for 15 min. 2 µl of the RT reaction product
was used in a subsequent PCR. PCR reactions were carried out using Taq polymerase (Qiagen) in
a final reaction volume of 20 µl. The arbitrary primer H-AP8 (5’-AAGCTTTTACCGC-3’) and
the same primer used in the RT reaction but labeled with a fluorescence tag (NED) were used for
the amplification of cDNA. The primer targeting the poly(A) tail and the arbitrary primer for PCR
were from RNAspectra Yellow kit 1 of GenHunter Corporation. The PCR cycle was 40 cycles of
94 ˚C for 30 s, annealing at 40 ˚C for 2 min, 72 ˚C for 60 s followed by 1 cycle of 72 ˚C for 5 min
in a DNA Engine® thermal cycler (Bio-Rad Laboratories, Inc.). A negative control was run for
each set of reactions to assess the background levels. To ensure that there was no amplification of
genomic DNA a control was run with an aliquot of the RNA extracts added directly to the PCR
reaction.
Separation of amplicons with gene analyzer. 1 µl of PCR product from each sample was mixed
with 9 µl of Hi-Di Formamide (Applied Biosystems). 0.5 µl of size standard (ROX 500, Applied
Biosystems) was added to every reaction to define the standard curve between 25 and 500 bp. The
cDNA peaks obtained ranged in length from 30 to 500 bp, according to the internal size standard
used. The mixtures were run on an ABI automated sequencer operating as a fragment analyzer
(ABI 3130XL). The sequencer electropherograms were then analyzed using the GeneMarker soft-
ware, version 1.90 (SoftGenetics, LLC). Raw data were treated with some filters activated ac-
cording to GeneMarker instructions: baseline subtraction, spike removal, auto pull up removal,
smooth. The cubic spline algorithm was used to calculate bp lengths of identified fluorescence
peaks. The different peak detection thresholds applied are detailed below. Once the peaks were
Comparison of expression and community patterns at different time and space scales
82
selected, peak areas were used as output from GeneMarker software and were transferred to Mi-
crosoft Excel (Seattle, WA) for subsequent analysis.
Peak detection in ARISA and TFA
Two different cutoff thresholds were used to select peaks in both ARISA and TFA electrophero-
grams. In the first case, only the largest peaks were selected. The threshold for these peaks was set
at 200 relative fluorescence units (rfus) for ARISA and at 100 rfus for TFA. These TFA peaks are
supposed to correspond to highly expressed genes. From now on we will refer to these as HighP
(for high peaks). Settings and filters were as previously described (Coll-Lladó et al., 2011). In the
second case, all the peaks that could be discerned above the background by the instrument, includ-
ing the high peaks, were included in the analyses. The threshold for these peaks was set at 30 rfus
for ARISA at 10 rfus for TFA. We will refer to these as AllP (for all peaks). This low intensity was
the only criterion to detect these peaks. All the other filters used in the HighP settings were shut
off. The fragments considered in the analyses were those between 150 and 500 bp for ARISA and
between 90 and 530 bp for TFA. Peaks were visually inspected as a quality control (Coll-Lladó et
al., 2011).
Statistical analysis
The peak area data retrieved from GeneMarker were standardized (the relative peak heights with-
in a profile were calculated by dividing the height of an individual peak by the total peak height
(i.e.: sum of the heights of all peaks in an electropherogram). The similarity of patterns derived
from different communities was assessed computing Bray-Curtis distances to construct the similar-
ity matrices. Mantel tests between dissimilarity matrices and Mantel correlograms were performed
with the Pearson correlation. Patterns were explored using Nonmetric Multidimensional Scaling
(NMDS) and Constrained Analysis of Principal Coordinates (CAP). Primer-E version 6 (Clarke,
1993) and R software (R development Core Team, 2005) were used for these analyses.
RESULTS AND DISCUSSION
Comparison between HighP and AllP patterns
Electropherograms show a series of peaks of different areas. In principle, the large peaks corre-
spond to abundant taxa in the case of ARISA and to highly expressed genes in the case of TFA.
Deciding how many peaks to include in the analysis is a subjective decision and we analyzed the
effect of considering two different thresholds on the results (Coll-Lladó et al., 2013 submitted). In
one option we considered the largest peaks only (HighP) and in the other case we considered all
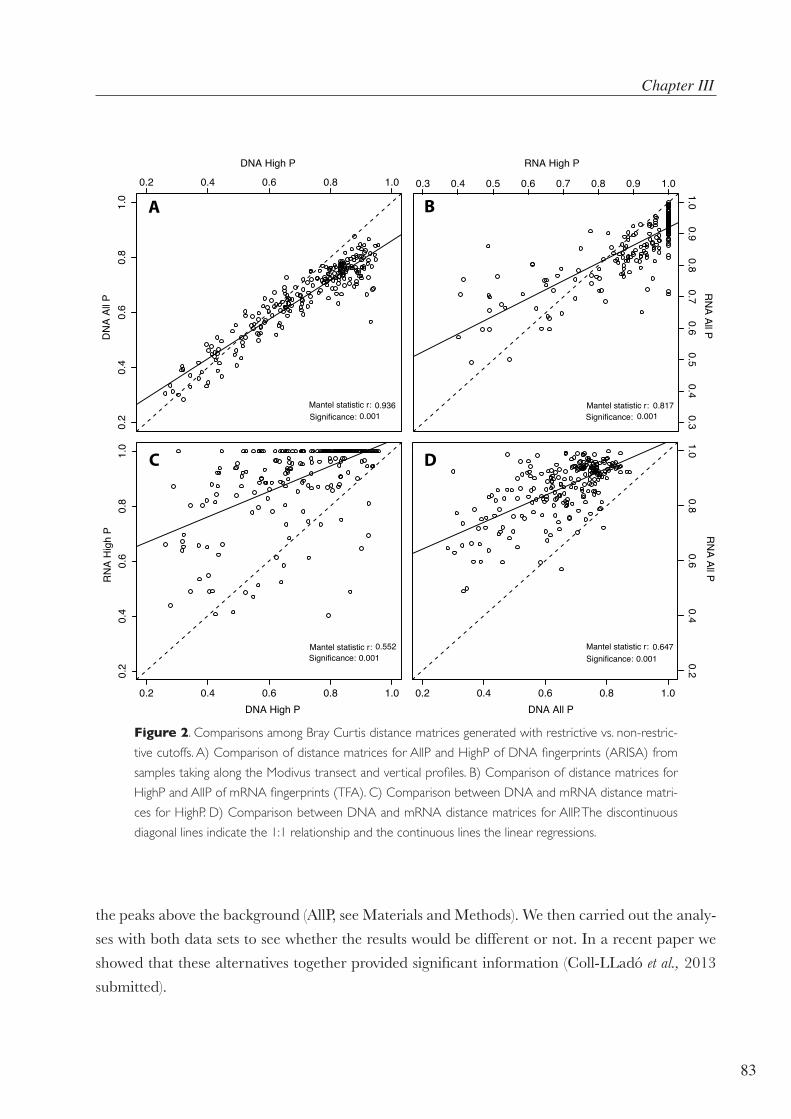
Chapter III
83
the peaks above the background (AllP, see Materials and Methods). We then carried out the analy-
ses with both data sets to see whether the results would be different or not. In a recent paper we
showed that these alternatives together provided significant information (Coll-LLadó et al., 2013
submitted).
0.2 0.4 0.6 0.8 1.0
0.2
0.4
0.6
0.8
1.0
DNA High P
DN
A Al
l P
Mantel statistic r: 0.936Significance: 0.001
0.2 0.4 0.6 0.8 1.0
0.2
0.4
0.6
0.8
1.0
DNA High P
RN
A H
igh
P
Mantel statistic r: 0.552Significance: 0.001
0.2 0.4 0.6 0.8 1.0
0.20.4
0.60.8
1.0
DNA All P
RN
A All P
Mantel statistic r: 0.647Significance: 0.001
A0.3 0.4 0.5 0.6 0.7 0.8 0.9 1.0
0.30.4
0.50.6
0.70.8
0.91.0
RNA High P
RN
A All P
Mantel statistic r: 0.817Significance: 0.001
B
C D
Figure 2. Comparisons among Bray Curtis distance matrices generated with restrictive vs. non-restric-
tive cutoffs. A) Comparison of distance matrices for AllP and HighP of DNA fingerprints (ARISA) from
samples taking along the Modivus transect and vertical profiles. B) Comparison of distance matrices for
HighP and AllP of mRNA fingerprints (TFA). C) Comparison between DNA and mRNA distance matri-
ces for HighP. D) Comparison between DNA and mRNA distance matrices for AllP. The discontinuous
diagonal lines indicate the 1:1 relationship and the continuous lines the linear regressions.
Comparison of expression and community patterns at different time and space scales
84
Matrices with distances among spatial samples (surface transect and vertical profile) were con-
structed with both thresholds and were compared with Mantel tests (Figure 2A-B). The distances
calculated with the two thresholds were highly correlated for both DNA (Mantel statistic r = 0.936,
p<0.001) and mRNA (r = 0.817, p<0.001). The slope of the regression lines, however, were signifi-
cantly lower than 1. Thus, addition of the small peaks in the electropherograms reduced the range
of distance values found with the large peaks only. Subsequent analyses were performed with data
generated with the two thresholds.
Distances calculated from DNA and mRNA were significantly correlated according to Mantel tests
(Figure 2C-D). Most comparisons showed that mRNA produced longer distances among samples
than DNA. As before, considering AllP reduced the distances between samples in mRNA and
DNA fingerprint comparisons.
Spatial patterns in community composition and gene expression
NMDS analysis showed similar separation of samples by depth, both in ARISA and TFA fin-
gerprints (Figure 3). In general, the horizontal axis in the diagram separated deep samples from
the rest, while the vertical axis separated surface from intermediate depth samples. Deep samples
(below 400 m) were clearly separated from all the rest and showed considerable distances among
themselves. Surface samples, on the other hand, were closely clustered despite the 120 km between
the two ends of the transect. Samples from intermediate depths (between 25 and 140 m) were
fairly dispersed and usually occupied a position intermediate between surface and deep samples,
although the separation was better resolved with TFA than with ARISA profiles.
There were particular samples that did not follow this general pattern in both ARISA and TFA
analyses. In the ARISA (Figure 3A) sample CM44 was very different from all the other samples.
This sample coincided with the most marked peak of deep chlorophyll maximum (DCM) of the
whole transect. Chlorophyll a (Chla) reached 0.6 µg L-1. Although this is a low concentration, it
was the highest in the whole transect, where most values were under 0.3 µg L-1 (Lefort et al., in
preparation). The Chla peak could be explained by a coincident peak in phototrophic picoeukary-
otes that reached a concentration of 3500 cells ml-1 compared to the 500 cell ml-1 in most of the
other samples. Interestingly, the TFA for this sample did not show significant differences with the
samples around it. This finding pointed out to the functional redundancy in the gene expression of
the picoeukaryotic assemblages.

Chapter III
85
In the TFA (Figure 3B), all stations but MD followed a similar “smooth” trajectory from surface
samples in the upper right corner of the NMDS space down to the lower left corner for the bot-
tom samples. Samples MD77 and MD140, however, deviated from this pattern. Station MD was
the only one in which an upwelling could be detected: the 27 Kg m-3 isopycnal, that generally
marked the depth of the DCM in the other stations (at 45 m), was found close to the surface at this
station (at 15 m). It appears that similar picoeukaryotic assemblages had reacted to the upwelling
by changing their gene expression patterns, but had not had time yet to change the community
composition at 77 m, although the composition was certainly different at 140 m.
CM60
MD60
D65
CM100
MD77
D500
CM600
MD140
D2000M5
MD400 C5
M48
MD2000
CM5
M400
D5
CM30
M1400
D25
CM44
MD4
D40
2D Stress: 0,12
deep samplesmid-layer samplessurface samples
DNA High P
C5CM5
CM30
CM44
CM60
CM600
M5
M48
M400
M1400
MD4
MD60
MD77
MD140
MD400
MD2000
D5
D25D40
D65
D500
D2000
2D Stress: 0,08
RNA High P
A
B
Figure 3. A) NMDS diagrams comparing DNA fingerprints (ARISA) from samples
collected during Modivus cruise. B) NMDS diagrams comparing mRNA fingerprints
(TFA) from samples collected during Modivus cruise. Samples are labeled according to
the depth of the sample. Results with AllP are not shown.

Comparison of expression and community patterns at different time and space scales
86
These patterns can be analyzed more quantitatively looking at the average similarities among
samples from the three depth groups (Table 2). If we look at the values for DNA AllP the average
similarity among surface samples was 62.6%, and decreased for intermediate (40.6%) and deep
samples (37%). These values did not change much when DNA HighP was considered. This shows
that surface samples were closer among them than bottom samples in community composition.
In the case of the RNA, however, the values of similarity were much lower: 33 – 38%, 15 – 21%,
and 25 -27% for surface, intermediate and bottom samples respectively. This shows that samples
differed more in gene expression patterns than in community composition, as could be expected
although in deeper samples such differences seemed to be attenuated (DNA 37% vs. RNA 27%)
Table 2. Average similarities (Bray-Curtis distance) among samples and number of peaks necessary to explain 50 and
90% of the differences among samples, from the surface, intermediate, and bottom samples.
Following the community structure and gene expression patterns along the hori-
zontal transect and at vertical profile
Bray-Curtis distances between transect samples are plotted in Fig 4A in two different ways. Lines
show the distance between each sample and the first sample (sample C5) along the transect, while
vertical bars show distance between a sample and the previous sample in the transect. Since the
distance between the first sample and itself is zero, sample C5 is not shown. For the next sample
(CM5) both the line and the bar have exactly the same value by definition. But, for the remaining
samples, we would expect that the distance to the previous sample would be smaller or equal than
the distance to the first sample, since samples farther away can be expected to differ more than
contiguous samples. Figure 4B shows the same information for the vertical profile at station D from
surface down to 2000 m depth. With one exception (sample MD in the transect) the expectation
was fulfilled both along the transect and the vertical profile. As explained earlier, there was an up-
welling in station MD and this, presumably, increased the distance of this sample with respect to
its neighbors relative to the distance to sample C5.
Surface samples Intermediate depths Deep samples
Average similarity (%)
50% 90% Average similarity (%)
50% 90% Average similarity (%)
50% 90%
DNA AllP 62.6 17 60 40.6 15 68 37.0 11 51
DNA High 62.4 10 26 38.3 7 28 32.1 5 17
RNA AllP 32.9 5 33 21.2 18 88 24.7 9 46
RNA High 38.5 3 6 15.4 3 18 27.1 2 5
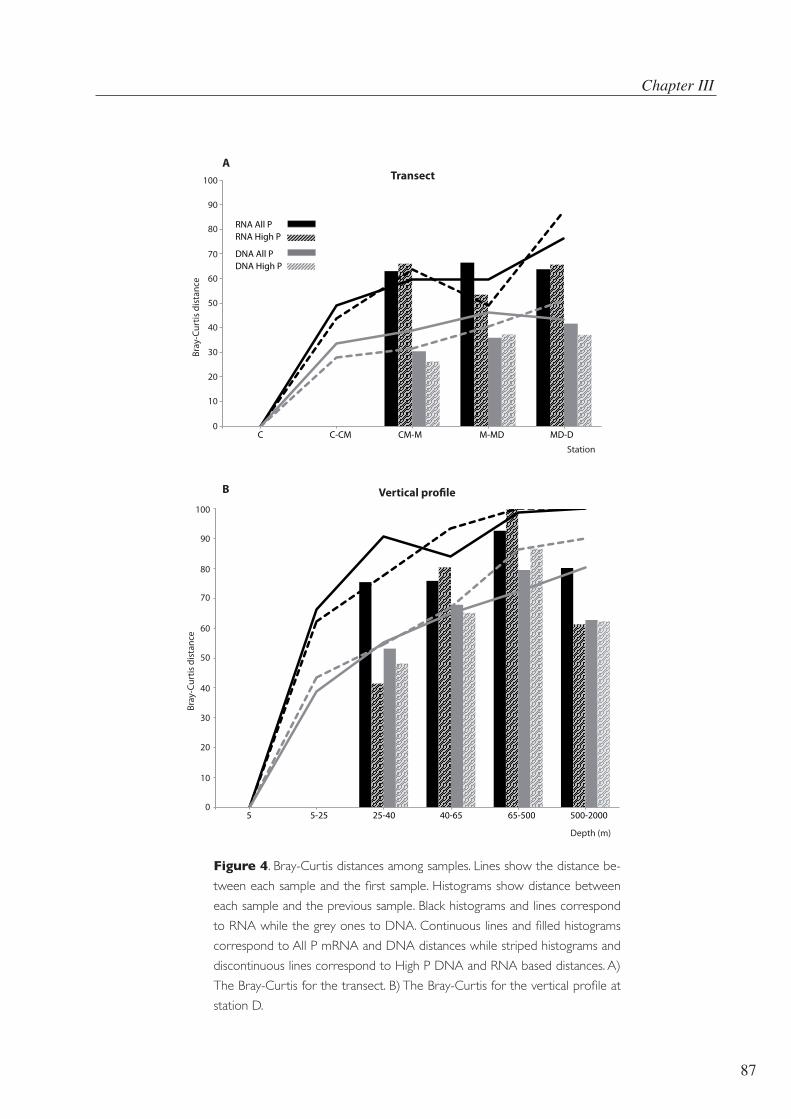
Chapter III
87
Transect
Vertical pro�le
0
10
20
30
40
50
60
70
80
90
100
0
10
20
30
40
50
60
70
80
90
100
Bray
-Cur
tis d
ista
nce
Bray
-Cur
tis d
ista
nce
Depth (m)
C C-CM CM-M M-MD MD-D
5 5-25 25-40 40-65 65-500 500-2000
RNA All PRNA High P
DNA All PDNA High P
Station
A
B
Figure 4. Bray-Curtis distances among samples. Lines show the distance be-
tween each sample and the first sample. Histograms show distance between
each sample and the previous sample. Black histograms and lines correspond
to RNA while the grey ones to DNA. Continuous lines and filled histograms
correspond to All P mRNA and DNA distances while striped histograms and
discontinuous lines correspond to High P DNA and RNA based distances. A)
The Bray-Curtis for the transect. B) The Bray-Curtis for the vertical profile at
station D.

Comparison of expression and community patterns at different time and space scales
88
Next we will compare RNA and DNA based distances for the horizontal transect (Figure 4A). The
two bars for RNA were always higher than those for DNA indicating that, as expected, contiguous
communities differed more in their gene expression patterns than in their taxonomic composition.
If we look at the lines, again the values for RNA were always higher than those for DNA. Thus,
communities differed from C5 more in gene expression patterns (45 to 85% distance) than in com-
position (30 to 50% distance). This was the case with both HighP and AllP. Finally, the samples
differed more along the vertical profile (up to 100%) than along the transect (35% for DNA and
55% for RNA).
It is well known that taxonomic composition of microbial communities change more markedly
with depth than with horizontal distance (Acinas et al., 1997; DeLong et al., 2006; Díez et al., 2004).
The ARISA data presented here confirm this observation. The spatial scales at which gene expres-
sion patterns change, however, have not been analyzed. As could be expected, expression patterns
changed more rapidly than community composition both at spatial and the vertical profile. More-
over, changes were much more marked with depth than with horizontal distance from the coast in
parallel to changes in composition.
Trends in richness
The number of peaks was considered as a rough estimate of richness of taxa or of expressed
genes. In general, DNA peaks richness decreased from the coast to offshore transect (Fig. 1 SM)
in accordance with previous observations from the same stations based on 16S tags sequencing
(Pommier et al., 2010). However, transcripts richness was higher at station M and decreased both
towards the coast and the open sea. These patterns were similar both with HighP and AllP (Fig.
1SM). In the vertical profile, richness of DNA peaks decreased with depth at station D. This was
opposite to the trend found for bacteria (Pommier et al., 2010). The latter study analyzed bacterial
composition through pyrosequencing and, thus, it included many rare taxa. The fingerprinting
method used here, on the other hand, only detects the most abundant taxa. It is known that most
species are rare in any environment (Pedrós-Alió, 2012; Sogin et al., 2006) and this may explain the
discrepancy. In the case of RNA peaks, there was a maximal richness at intermediate depths (D40
and D65) and lower values were found at the surface and bottom waters.

Chapter III
89
Figure 5. Temperature and salinity values and their changes during
the diel cycles in station C and D.
37.4
37.5
37.6
37.7
37.8
37.9
38.0
38.1
38.214 16 18 20 22 24 26
C_4mC_15mD_5mD_65m
Salin
ity
Temperature (ºC)
Diel cycles
The two more distant stations of the transect were selected to analyze the effect of day/night
cycles on community composition and gene expression. Specifically, the two diel studies were done
at stations C and D at two depths in each station. Station C was analyzed for 56 hours at both 4
and 15 m depth while station D was followed for 44 hours at 5 and 65 m depths (Table 1B). During
this time, the ship was allowed to drift with the surface currents. In order to check how close this
was to a Lagrangian drift, we plotted salinity and temperature for the different samples (Figure 5).
From the close clustering of the data points, it can be concluded that the cycles at 4 m in station
C and at 65 m at station D did follow the same water mass. That was not the case for the 15 m
data points in station C that corresponded to different water masses. Finally, in the cycle at 5 m
in station D, temperature was constant but salinity decreased due to rain. This freshening of the
water could have affected gene expression significantly, although probably not at the community
structure composition level.
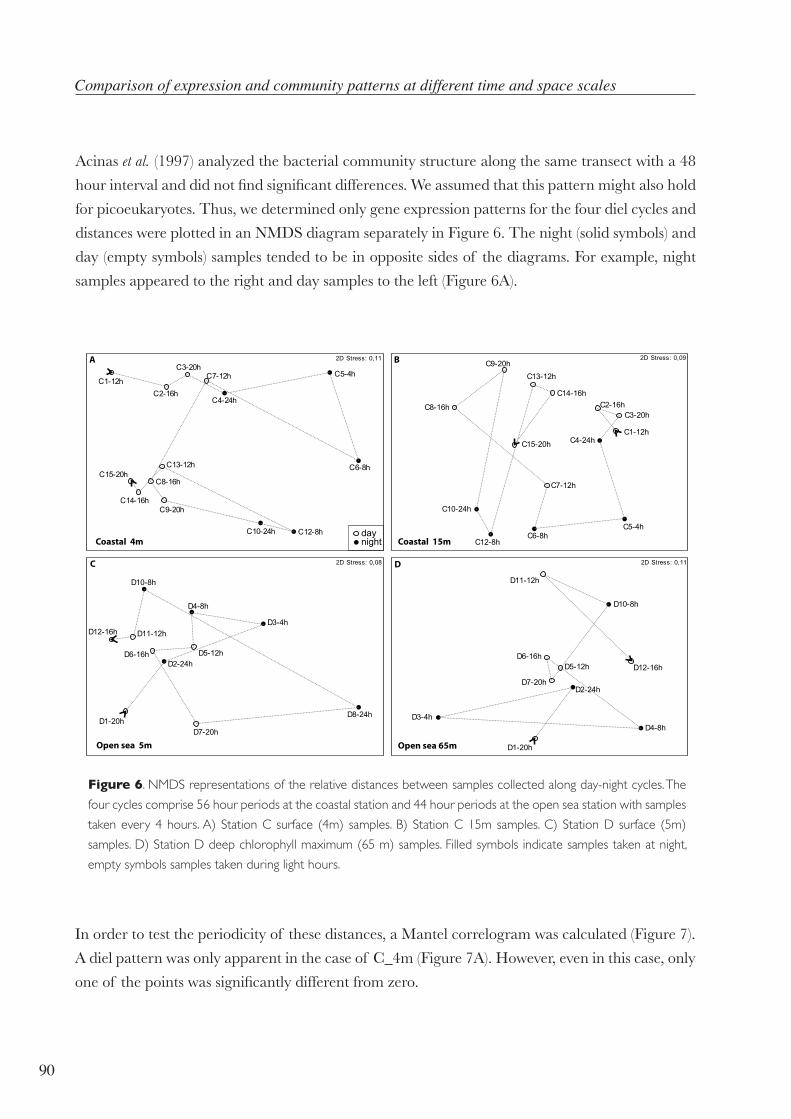
Comparison of expression and community patterns at different time and space scales
90
Acinas et al. (1997) analyzed the bacterial community structure along the same transect with a 48
hour interval and did not find significant differences. We assumed that this pattern might also hold
for picoeukaryotes. Thus, we determined only gene expression patterns for the four diel cycles and
distances were plotted in an NMDS diagram separately in Figure 6. The night (solid symbols) and
day (empty symbols) samples tended to be in opposite sides of the diagrams. For example, night
samples appeared to the right and day samples to the left (Figure 6A).
In order to test the periodicity of these distances, a Mantel correlogram was calculated (Figure 7).
A diel pattern was only apparent in the case of C_4m (Figure 7A). However, even in this case, only
one of the points was significantly different from zero.
C8-16h
C1-12h
C9-20h
C2-16h
C10-24h
C3-20h
C4-24h
C12-8h
C5-4h
C13-12h C6-8h
C14-16h
C7-12h
C15-20h
2D Stress: 0,11
C2-16h
C9-20h
C10-24h
C3-20h
C4-24h
C12-8h
C5-4h
C13-12h
C6-8h
C14-16h
C15-20h
C7-12h
C1-12h
C8-16h
2D Stress: 0,09
daynight
D3-4h
D10-8h
D4-8h
D11-12h
D5-12hD6-16h
D12-16h
D7-20hD1-20h
D8-24h
D2-24h
2D Stress: 0,08
D4-8h
D5-12h
D10-8h
D6-16h
D7-20h
D11-12h
D1-20h
D12-16h
D2-24h
D3-4h
2D Stress: 0,11
Coastal 4m Coastal 15m
Open sea 65mOpen sea 5m
A B
C D
Figure 6. NMDS representations of the relative distances between samples collected along day-night cycles. The
four cycles comprise 56 hour periods at the coastal station and 44 hour periods at the open sea station with samples
taken every 4 hours. A) Station C surface (4m) samples. B) Station C 15m samples. C) Station D surface (5m)
samples. D) Station D deep chlorophyll maximum (65 m) samples. Filled symbols indicate samples taken at night,
empty symbols samples taken during light hours.

Chapter III
91
Figure 7. Mantel correlogram of the diel cycles. A) Diel cycle at the coastal site, with two depths 4 and 15m.
B) Diel cycle at the open sea station at 5 and 65m.
●●
10 20 30 40 50
−0.3
−0.2
−0.1
0.0
0.1
0.2
0.3
Hours
Man
tel c
orre
latio
n
15 m4m
Coastal station
10 20 30 40
−0.3
−0.2
−0.1
0.0
0.1
0.2
0.3
Hours
Man
tel c
orre
latio
n
Open sea station 65 m5 m
A B
Obviously, even though some genes did show diel patterns in expression (Figure 8), the diel signal
of the whole assemblage was not strong enough to be detected statistically above the background
of other changes.
0
50
100
150
200
250
300
350
400
D1_20h
D2_24h
D3_4h
D4_8h
D5_12h
D6_16h
D7_20h
D8_24h
D9_4h
D10_8h
D11_12h
D12_16h
Fluore
scen
ce inte
nsi
ty
Sampling time
peak 303
peak 318
peak 336
Figure 8. Examples of trancripts that follow circadian rhytms.
Comparison of expression and community patterns at different time and space scales
92
A previous study along a very similar transect in which bacterial abundance and heterotrophic
production were analyzed at three stations, diel changes in production (but not in abundance)
were found at station D, but not at station C (Gasol et al., 1998). Therefore, initially, we expected
some changes at least at the offshore station. The first possible explanation for the lack of a diel
cycle is that the sampling was not strictly Lagrangian and different water masses could confound
the cycles. As already mentioned, this was certainly the case in cycle C_15m, where an initial deep
water intrusion was followed by a North wind burst completely altering the conditions of the first
16 hours of the cycle (Galí et al., in preparation). In cycle D_5m, rainfall altered surface salinity at
two different time points (Galí et al., in preparation). In this case the lack of periodicity may be at-
tributed to a non-cyclical perturbation in gene expression after the rainfall confounding the regular
diel cycle. The two other cycles, however, did not show any signs of lack of Lagrangianity in the
T_S diagrams (Figure 5). In cycle C_4m, as explained, there was diel periodicity, although barely
strong enough to show significant differences in the Mantel correlogram (Figure 7A) while cycle
D_65m did not show any evidence of periodicity (Figure 7B). Periodicity in the expression of the
genes of phototrophic microorganisms in the Pacific was detected by metatranscriptomic analyses
but this pattern was not found for heterotrophs (Ottesen et al., 2013). The ratio of autotrophs to
heterotrophs in Blanes Bay was low in September (Massana, 2011) and this might also have con-
tributed to masking the periodicity at the two coastal studies.
In conclusion, we did not find clear diel cycles in gene expression patterns in the present study.
However, in a previous study we found marked seasonal cycles with the same approach and tech-
niques (Coll-Lladó et al., 2013 submitted), so we believe that the lack of periodicity here is not due
to the lack of sensitivity of the TFA. However, we cannot discard that such periodicity is contrib-
uted by a high diversity of transcripts present at low abundance overlooked by our method and in
this case metatranscriptomic analyses would be desirable. More diel studies at different times of
the year will have to be carried out to clarify this issue.
ACKNOWLEDGMENTS
We thank Beatriz Fernández-Gómez and Thomas Pommier for DNA extractions. M.C was sup-
ported by FPI fellowship from the Spanish Ministry of Science and Innovation (MICINN) and
MicroB3 (FP7-OCEAN-2011) supported SGA. This work was supported by grant GEMMA
(CTM2007-63753-C02-01/MAR) and PANGENOMICS (CGL2011-26848/BOS) to S.G.A
from the MICINN.

Chapter III
93
REFERENCES
Acinas, S. G., Rodríguez-Valera, F., & Pedrós-Alió, C. 1997. Spatial and temporal variation in
marine bacterioplankton diversity as shown by RFLP fingerprinting of PCR amplified 16S
rDNA. FEMS Microbiology Ecology, 24(1): 27-40.
Bienfang, P. K., Szyper, J. P., Okamoto, M. Y., & Noda, E. K. 1984. Temporal and Spatial Vari-
ability of Phytoplankton in a Subtropical Ecosystem. Limnology and Oceanography,
29(3): 527-539.
Brown, M. V., Philip, G. K., Bunge, J. A., Smith, M. C., Bissett, A., Lauro, F. M., Fuhrman, J. A.,
& Donachie, S. P. 2009. Microbial community structure in the North Pacific ocean. ISME
J, 3(12): 1374-1386.
Clarke, K. R. 1993. A method of linking multivariate community structure to environmental vari-
ables. Marine ecology progress series, 92: 205.
Coll-Lladó, M., Acinas, S. G., Pujades, C., & Pedrós-Alió, C. 2011. Transcriptome Fingerprinting
Analysis: An Approach to Explore Gene Expression Patterns in Marine Microbial Com-
munities. PLoS ONE, 6(8): e22950.
Crespo, B. G., Pommier, T., Fernández-Gómez, B., & Pedrós-Alió, C. 2013. Taxonomic composi-
tion of the particle-attached and free-living bacterial assemblages in the Northwest Medi-
terranean Sea analyzed by pyrosequencing of the 16S rRNA. MicrobiologyOpen.
DeLong, E. F., Preston, C. M., Mincer, T., Rich, V., Hallam, S. J., Frigaard, N.-U., Martinez, A.,
Sullivan, M. B., Edwards, R., Brito, B. R., Chisholm, S. W., & Karl, D. M. 2006. Commu-
nity Genomics Among Stratified Microbial Assemblages in the Ocean’s Interior. Science,
311(5760): 496-503.
Díez, B., Massana, R., Estrada, M., & Pedrós-Alió, C. 2004. Distribution of Eukaryotic Picoplank-
ton Assemblages across Hydrographic Fronts in the Southern Ocean, Studied by Denatur-
ing Gradient Gel Electrophoresis. Limnology and Oceanography, 49(4): 1022-1034.
Díez, B., Pedrós-Alió, C., Marsh, T. L., & Massana, R. 2001. Application of Denaturing Gradient
Gel Electrophoresis (DGGE) To Study the Diversity of Marine Picoeukaryotic Assem-
blages and Comparison of DGGE with Other Molecular Techniques. Appl. Environ.
Microbiol., 67(7): 2942-2951.

Comparison of expression and community patterns at different time and space scales
94
Edgcomb, V. P., Kysela, D. T., Teske, A., de Vera Gomez, A., & Sogin, M. L. 2002. Benthic eukary-
otic diversity in the Guaymas Basin hydrothermal vent environment. Proceedings of the
National Academy of Sciences, 99(11): 7658-7662.
Estrada, M., Marrasé, C., Latasa, M., Berdalet, E., Delgado, M., & Riera, T. 1993. Variability of
deep chlorophyll maximum characteristics in the Northwestern Mediterranean. Marine
ecology progress series, 92: 289-300.
Gasol, J. M., Doval, M. D., Pinhassi, J., Calderón-Paz, J. I., Guixa-Boixareu, N., Vaqué, D., &
Pedrós-Alió, C. 1998. Diel variations in bacterial heterotrophic activity and growth in the
northwestern Mediterranean Sea. Marine ecology progress series, 164: 107-124.
Hewson, I., Poretsky, R. S., Tripp, H. J., Montoya, J. P., & Zehr, J. P. 2010. Spatial patterns and
light-driven variation of microbial population gene expression in surface waters of the oli-
gotrophic open ocean. Environ Microbiol, 12(7): 1940-1956.
López-García, P., Rodríguez-Valera, F., Pedrós-Alió, C., & Moreira, D. 2001. Unexpected diver-
sity of small eukaryotes in deep-sea Antarctic plankton. Nature, 409(6820): 603-607.
Marañón, E., Holligan, P. M., Barciela, R., González, N., Mouriño, B., Pazó, M. J., & Varela, M.
2001. Patterns of phytoplankton size structure and productivity in contrasting open-ocean
environments. Marine ecology progress series, 216: 43-56.
Massana, R. 2011. Eukaryotic Picoplankton in Surface Oceans. Annual Review of Microbiol-
ogy, 65(1): 91-110.
Massana, R., Balagué, V., Guillou, L., & Pedrós-Alió, C. 2004. Picoeukaryotic diversity in an oligo-
trophic coastal site studied by molecular and culturing approaches. FEMS Microbiology
Ecology, 50(3): 231-243.
Massana, R., Karniol, B., Pommier, T., Bodaker, I., & Béjà, O. 2008. Metagenomic retrieval of a
ribosomal DNA repeat array from an uncultured marine alveolate. Environ Microbiol,
10(5): 1335-1343.
Massana, R., Murray, A. E., Preston, C. M., & DeLong, E. F. 1997. Vertical distribution and phy-
logenetic characterization of marine planktonic Archaea in the Santa Barbara Channel.
Appl Environ Microbiol, 63(1): 50-56.
Moreira, D., & López-García, P. 2002. The molecular ecology of microbial eukaryotes unveils a
hidden world. Trends Microbiol, 10(1): 31-38.

Chapter III
95
Ottesen, E. A., Young, C. R., Eppley, J. M., Ryan, J. P., Chavez, F. P., Scholin, C. A., & DeLong,
E. F. 2013. Pattern and synchrony of gene expression among sympatric marine microbial
populations. Proceedings of the National Academy of Sciences, 110(6): E488-E497.
Pedrós-Alió, C. 2012. The Rare Bacterial Biosphere. Annual Review of Marine Science, 4(1):
449-466.
Pedrós-Alió, C., Calderón-Paz, J.-I., Guixa-Boixereu, N., Estrada, M., & Gasol, J. M. 1999. Bac-
terioplankton and phytoplankton biomass and production during summer stratification
in the northwestern Mediterranean Sea. Deep Sea Research Part I: Oceanographic
Research Papers, 46(6): 985-1019.
Pommier, T., Neal, P., Gasol, J., Coll, M., Acinas, S., & Pedrós-Alió, C. 2010. Spatial patterns of
bacterial richness and evenness in the NW Mediterranean Sea explored by pyrosequencing
of the 16S rRNA. Aquatic Microbial Ecology, 61(3): 221-233.
Poretsky, R. S., Gifford, S., Rinta-Kanto, J., Vila-Costa, M., & Moran, M. A. 2009a. Analyzing
gene expression from marine microbial communities using environmental transcriptomics.
J Vis Exp(24).
Poretsky, R. S., Hewson, I., Sun, S., Allen, A. E., Zehr, J. P., & Moran, M. A. 2009b. Compara-
tive day/night metatranscriptomic analysis of microbial communities in the North Pacific
subtropical gyre. Environ Microbiol, 11(6): 1358-1375.
R development Core Team. 2005. R: A language and environment for statistical computing. Vi-
enna, Austria: R Foundation for Statistical Computing.
Sala, M. M., Peters, F., Gasol, J. M., Pedrós-Alió, C., Marrasé, C., & Vaqué, D. 2002. Seasonal and
spatial variations in the nutrient limitation of bacterioplankton growth in the northwestern
Mediterranean. Aquatic Microbial Ecology, 27(1): 47-56.
Scheckenbach, F., Hausmann, K., Wylezich, C., Weitere, M., & Arndt, H. 2010. Large-scale pat-
terns in biodiversity of microbial eukaryotes from the abyssal sea floor. Proceedings of
the National Academy of Sciences, 107(1): 115-120.
Sogin, M. L., Morrison, H. G., Huber, J. A., Welch, D. M., Huse, S. M., Neal, P. R., Arrieta, J. M.,
& Herndl, G. J. 2006. Microbial diversity in the deep sea and the underexplored “rare bio-
sphere”. Proceedings of the National Academy of Sciences, 103(32): 12115-12120.

Comparison of expression and community patterns at different time and space scales
96
HORIZONTAL TRANSECT VERTICAL PROFILE
SUPPLEMENTARY INFORMATION
Supplementary Figure I. Peaks richness along the horizontal transect and the vertical
profile at station D.


Chapter 4
Transcriptional Response of Ruegeria sp. strain TM1040 to Light

Chapter IV
101
Transcriptional response of Ruegeria sp. strain TM1040 to light. Montserrat Coll-Lladó, Ryan J. Newton, Wenying Ye, Shulei Sun, Carles Pedrós-Alió, Mary Ann Moran. Manuscript.
ABSTRACT
Microorganisms have evolved a variety of different receptors to sense light, and the availability
of the complete genome of many strains now allows access to the physiological and ecological
strategies linked to light reception. The main objective of this study was to investigate how marine
Roseobacter strain Ruegeria sp. TM1040, an organism whose genome contains genes for several
putative light receptor proteins, responds to experimental light manipulations. A microarray based
on the annotated genome of this strain was used to study the transcriptional response of cultures
incubated in the light under two different nutritional conditions. A reverse transcription qPCR
with selected genes confirmed and refined the results observed in the microarray study: a stress
response was observed upon blue light illumination. A gene encoding a protein with high similar-
ity to fasciclin, a molecule involved in attachment, was also upregulated by blue light and by UV
radiation. Overall, the results indicate that light triggers a series of genes involved in protecting
the cell from photooxidative damage and in a possible coupling with a dinoflagellate with which
TM1040 is usually associated.

Transcriptional response of Ruegeria sp. strain TM1040 to light
102
INTRODUCTION
Members of the Roseobacter group (in the Alphaproteobacteria) account for 10% of bacterial
cells in surface waters of the ocean, reaching 20% of the bacterial assemblage in coastal waters
(González & Moran, 1997). They can represent a large percentage of the bacteria associated with
planktonic algae, mainly dinoflagellates (Buchan et al., 2005).
Light sensing seems a useful property of microorganisms inhabiting surface oceans. In many mi-
croorganisms, light triggers photobiological responses such as circadian rhythms and synchroniza-
tion, phototrophy, bacterial phototaxis, and many others. Indeed, 13 of 32 sequenced Roseobacter
genomes have genes for photoheterotrophy (10 aerobic anoxygenic phototrophs -AAnPs-, 3 rho-
dopsin phototrophs), while another genome contains RuBisCO (Newton et al., 2010). The remain-
ing 18 (including Ruegeria sp. TM1040) are strict chemotrophs using organic matter, although some
may obtain energy from inorganic compounds such as CO and H2S.
Ruegeria sp. strain TM1040, formerly Silicibacter (Yi et al., 2007), is a member of the Roseobacter
clade originally isolated from a culture of the marine dinoflagellate Pfiesteria piscicida (Alavi et al.,
2001; Miller & Belas, 2006; Miller et al., 2004). Strain TM1040 is found within the phycosphere
or physically attached to the surface of the dinoflagellate cell. P. piscicida is a heterotrophic dinofla-
gellate that feeds on algae and other eukaryotic cells. It can also retain chloroplasts from the prey
algae and use them to increase growth efficiency in the light, and can act cannibalistically under
starvation conditions (Feinstein et al., 2002). The dinoflagellate grows poorly in the absence of the
symbiotic Ruegeria sp. TM1040, although the exact workings of this association are not well known.
TM1040 forms tight physical and physiological associations with its dinoflagellate host cell, in part
through behavioral responses to dinoflagellate products (Miller & Belas, 2004).
The genome sequence of Ruegeria sp. TM1040 suggested that it can sense light, since it contained
several types of photoreceptor genes in its genome (Moran et al., 2007). One of these receptors
was BLUF (for “sensor of Blue-Light Using FAD”), which senses blue light based on a conforma-
tional change following photon absorption (Gomelsky & Klug, 2002; Jung et al., 2005; Zeller et
al., 2005). Ruegeria TM1040 also contains a phytochrome gene that is likely involved in detection
of far-red light. The objective of the present study was to investigate how Ruegeria sp. TM1040 re-
sponds to light using an oligonucleotide-based microarray designed from the annotated genome of
this strain (Moran et al., 2007). The array was used to study the transcriptional response of Ruegeria
cultures incubated in the light under two different nutritional conditions.
Chapter IV
103
MATERIALS AND METHODS
A. Microarray study
Culture conditions
Ruegeria sp. TM1040 was grown in 250 ml Erlenmeyer flasks containing 100 ml of marine basal
medium (Baumann & Baumann, 1981) supplemented with a vitamin solution. Cultures were in-
oculated with 1 ml of bacterial culture (OD600 = 0.7) previously grown in liquid YTSS medium (4
g yeast extract, 2.5 g tryptone, 20 g sea salts per l). Since it has been shown that members of the
Roseobacter clade can use glucose at low substrate concentrations in coastal pelagic environments
(Alonso & Pernthaler, 2006), glucose was used as the carbon source.
Two different nutritional conditions were tested. In the lower organic matter (lowOM) conditions,
cultures were amended with 5 mM glucose, and in the higher OM (highOM) conditions, they
were amended with 10 mM glucose. In batch cultures, this should not make any difference at the
beginning of the experiments, since substrate concentrations are above saturation in both cases.
However, our intention was to sample both cultures at the time when the lowOM cultures entered
the stationary phase while the high OM culture would still be growing exponentially. At this point,
both cultures would have approximately the same biomass but different physiological conditions.
Six parallel cultures were run for each condition.
Bacteria were incubated at 30 ºC in Erlenmeyer flasks covered with aluminum foil to eliminate
light, shaken horizontally at 200 rpm (Innova Shaker, New Brunswick Scientific Inc.). After 18.5
h of incubation, three cultures from each physiological condition were exposed to light (Figure
1). Cells from both light and dark treatments were sampled after another 50 min. The time of
response was chosen based on previous studies with related Roseobacter strains that assessed tran-
scriptional activities (Braatsch et al., 2004; Bürgmann et al., 2007).
10,000 K fluorescent lamps (Coralife) that emit blue-white light with high-intensity lumen output
were used to simulate marine conditions under midday sun. Intensity was measured at different
levels of the incubator in order to place the cultures in the position that approximated annual av-
erage light intensity at 32˚ North latitude. Layers of Poly(methyl methacrylate) were used in order
to block UV radiation.
Dissolved oxygen was measured with a portable YSI 50B dissolved oxygen meter (YSI incorpo-
rated) using the YSI 5739 sensor. A 0% dissolved oxygen value was set by sparging with nitrogen
gas, and a 100% dissolved oxygen value was set by sparging in the liquid-air interface.

Transcriptional response of Ruegeria sp. strain TM1040 to light
104
Array design
The array design was based on the complete genome sequence of Ruegeria sp. strain TM1040
[NCBI reference NC_008044.1 (chromosome), NC_008043.1 (megaplasmid), and NC_008042.1
(small plasmid)]. Probes were designed for all predicted genes by Combimatrix Inc. using propri-
etary software. The final microarray contained 12,000 spots representing two independent probes
for each TM1040 gene except for 109 genes for which only one probe or no probe could be de-
signed. For three genes, both probes were replicated 5 times on the microarray for quality check-
ing, and probes for 16S and 23S rRNA genes were included as reference spots.
Total RNA extraction, amplification and array hybridization
Bacteria were harvested by pipetting 9 ml of liquid culture into sterile 15 ml tubes containing 1
ml of stop solution (95% absolute ethanol plus 5% saturated phenol pH 6.6 ± 0.2). Samples were
mixed and centrifuged (5000 g, 10 min, 4 ºC). Supernatant was discarded and cell pellets were
stored at –80 ºC until processing. Samples were thawed on ice and cell pellets were resuspended
with 1.4 ml of TRI reagent (Ambion, Austin, TX) and transferred to Eppendorf tubes. Samples
were bead-beaten with 0.5 ml of 0.1 mm zirconia-silica beads for 10 min at top speed on a
vortex adapter (Vortex-Genie 2, MoBio Laboratories, Inc., Carlsbad, CA) in order to mechani-
cally disrupt the cells. After disruption, the lysate was clarified by centrifugation and the aqueous
phase was transferred to a new tube. Total RNA extraction was carried out using phase separa-
tion and precipitated with ethanol as explained in (Bürgmann et al., 2007).
Digestion of DNA was carried out with the DNA-free kit (Ambion). RNA was purified using the
MEGAclear kit (Ambion) and ribosomal RNA was removed enzymatically using the mRNA-ON-
LY kit (Epicentre, Madison, WI). After each step RNA quantity and quality were checked with a
NanoDrop spectrophotometer (NanoDrop technologies, Wilmington, DE) and with an Experion
chip (Bio-Rad Laboratories, Inc., Hercules, CA).
The mRNA was amplified using the MessageAmp Bacteria kit (Ambion), which uses polyadenyl-
ation followed by T7 in vitro transcription to amplify RNA. The protocol was modified to accom-
modate indirect labeling by substituting one quarter of the UTP in the T7 reaction with amino–
allyl labeled UTP (Ambion).
A competitive hybridization scheme was used where light and dark treatments were labeled with
different dyes and hybridized to the same array (for example one array would include samples
from both light and dark conditions from the lowOM cultures). Each light replicate was randomly
paired with one of the three dark replicates. The dyes used for light and dark samples were alter-
nated with each sample to minimize potential dye bias in the dataset. AlexaFluor dyes 555 and

Chapter IV
105
647 (Invitrogen, Carlsbad, CA) were used to directly label amino allyl-antisense RNA (aa-aRNA).
Labelling of the aa-aRNA samples was done as described by Bürgmann et al. (2007). Labeled
aa-aRNA was purified using the MEGAclear kit and concentrated by precipitation with ethanol.
Resuspension was done in 10 µl of RNAse free water. A 1 µl subsample was used to determine the
concentration and dye incorporation using the NanoDrop.
Prior to hybridization, the labeled and purified aa-aRNA was fragmented using fragmentation
reagents (Ambion) according to the manufacturer’s instructions. A 10 µl aliquot of each labeled
and fractionated aa-aRNA sample was hybridized to the Ruegeria CombiMatrix Custom Array
for 16 h at 45°C following instructions provided by the manufacturer. Chips were stripped for re-
hybridization after analysis according to CombiMatrix.
Image acquisition and microarray analysis
The arrays were scanned using an Axon GenePix 4000B microarray scanner (Molecular Devices
Corporation, Sunnyvale, CA), and the images were analyzed using the GenePix Pro 6.0 software.
Background correction was achieved by subtracting the mean of pixel intensities of the five clos-
est empty spots on the array. Bad spots were located by inspecting the images visually as well as
using the criteria specified by Bürgmann et al. (2007). Data processing and analysis were carried
out with Acuity 4.0 software. The detection limit per array and changes in transcription criteria
were defined as in Bürgmann et al. (2007). The results were interpreted based on the fluorescence
ratio calculated for each probe by dividing the mean fluorescence of replicated probes from one
condition by the mean fluorescence of replicated probes from the other. Lists of genes fulfilling fold
change criteria based on Bürgmann et al. (2007) were created, indicating a two-fold change relative
to the control sample. Data for all microarrays was exported to Excel and Significance Analysis of
Microarrays (SAM) was done with the program SAM version 2.11 (Tusher et al., 2001).
B. Reverse transcription quantitative PCR (RT qPCR) study
Light Setup
A solar simulator was used to reproduce average wavelength intensities in the surface ocean ap-
proximately at 32˚ N (the latitude of Georgia). The light conditions are shown in Supplementary
Figure 1 together with average radiation conditions in July and January for comparison. To ex-
clude specific wavelengths, glass filters were fit to an opening in the bottom of the solar simulator.

Transcriptional response of Ruegeria sp. strain TM1040 to light
106
Growth conditions
Strain TM1040 was streaked from a frozen stock on 0.5x YTSS medium. A single colony from
this streake plate was inoculated into Marine Basal Medium supplemented with 5 mM glucose (the
lowOM condition in the microarray experiments). Three colonies were inoculated into separate
flasks containing liquid medium and incubated with shaking until each reached an OD of 0.2.
To initiate the light experiment, these three flasks were emptied into a shallow sterile dish contain-
ing a stir bar. The cells in each dish were stirred throughout the experiment. Oxygen concentration
was monitored, and found to remain relatively high (30-70% saturation, with the lower values at
the beginning of the experiment). Separate experiments were run for each of the different time
points collected (5 min, 15 min, 50 min). A fan was placed in the solar simulator to reduce the tem-
perature to acceptable levels (never higher than 30 ºC, during the red light experiment; typically
24-28 ºC during the other light experiments).
After the appropriate light exposure, stop solution was added and the samples were stored at -80 ºC
until RNA extraction. The RNA was extracted and the DNA was digested enzymatically. Samples
were then used in RT qPCR using the Bio-Rad one-step reaction. Genes selected for reverse tran-
scription qPCR, and the primers used, are listed in Table 2.
RESULTS AND DISCUSSION
Microarray experiment
After 50 min of exposure to light, highOM samples were in mid-exponential phase while lowOM
samples were at the beginning of stationary phase (Figure 1). In accordance with the cell abundance
data, the gene encoding the chromosomal replication initiator protein (dnaA; TM1040_0001) was
downregulated in lowOM samples (Supplementary Table 2).
Differences in substrate concentration resulted in some differences in the growth of Ruegeria. Cul-
tures growing in the 5 mM glucose treatment grew faster, reached a maximal OD600 of 0.6, and
stabilized in stationary phase at an OD of 0.4-0.5. Cultures growing at 10 mM glucose reached a
maximal OD600 of ~1 and stabilized at an OD600 of 0.7-0.8 (Figure 1). The slower initial growth
rate of the highOM samples at the beginning of the time course was surprising, and suggests the
10 mM glucose was slightly inhibitory to TM1040. In effect, oxygen consumption was faster at the
lowOM than at the highOM at 15 hours (Supplementary Figure 2).

Chapter IV
107
After this time the highOM cultures increased their growth rate and reached, as expected, much
higher yields. When the light was turned on, the lowOM cultures were entering stationary phase,
while the highOM cultures were continuing to grow at the same rate, showing that the light condi-
tions used were not impairing growth.
Dissolved oxygen decreased as bacteria grew (see Supplementary Figure 2). When lights were ini-
tially turned on, the oxygen level for the lowOM samples was 18% of saturation while that for the
highOM samples was 4.9% (microarray time point T0). At the next time point (microarray time
point T50’), oxygen saturation was 34% for the lowOM and 3% for the highOM. Thus, oxygen
concentrations were well below saturation and particularly low in the highOM treatments when
samples for microarray analysis were collected. This may have been a second factor affecting the
expression of genes during light manipulations.
0
0.2
0.4
0.6
0.8
1
0 5 10 15 20 25 30 35 40
Growth Ruegeria sp. TM1040
LowOMHighOM
Time (hours)
OD 6
00
Light on (t0)
50’ sample (t50’)
Figure 1. Growth of Ruegeria TM1040 in batch cultures with two different glucose concentrations.
The times of exposure to light and of sample collections are shown by arrows. Error bars show stan-
dard error of triplicates.

Transcriptional response of Ruegeria sp. strain TM1040 to light
108
Ruegeria sp. TM1040 has 3,863 potential coding sequences in its genome. A total of 109 ORFs
were differentially regulated during light exposure. Of these, 79 were upregulated and 30 were
downregulated (see lists in Supplementary Tables 1 and 2, respectively), considering both lowOM
and highOM conditions. The number of genes with significant expression changes in response to
light was lower in the highOM condition (only 14 genes) than in the lowOM condition (97 genes),
although many of the same genes differentially regulated in the lowOM cultures just missed the
significance threshold in the highOM cultures, suggesting that the responses were more similar
than gene numbers suggest.
For example, the higher growth in highOM cultures at the T50’ collection point could have resulted
in higher transcript levels for transcription, translation, and other growth-related processes that
masked light-driven transcript changes. Some genes, however, clearly showed different responses
in the lowOM and highOM conditions. For example, ureE (urease accessory-like gene) was sub-
stantially upregulated under light only in highOM samples, while carbon-monoxide dehydroge-
nase was downregulated under the light only in lowOM samples.
Neither the BLUF nor phytochrome genes were differentially expressed after exposure to light.
However, two ORFs in the neighborhood of the two BLUF domain proteins were upregulated
in the lowOM cultures (Figure 2). These encoded a hypothetical protein (TM1040_2023) and an
FMN-dependent alpha-hydroxy acid dehydrogenase (TM1040_2026). Another gene that might
be involved in light response was TM1040_0414, a FAD dependent oxidoreductase that was up-
regulated under the light at lowOM, although this protein could be involved in other metabolic
functions as well.
Figure 2. Gene context for the two BLUF domains in Ruegeria TM1040. Gray arrows indicate hypothetical proteins.
The two genes upregulated under light are indicated by yellow circles.
BLUF BLUF FMN dehydrogenase Pyruvate carboxylase ATP dependent
DNA helicase
2025 20262024 202820272023 2029
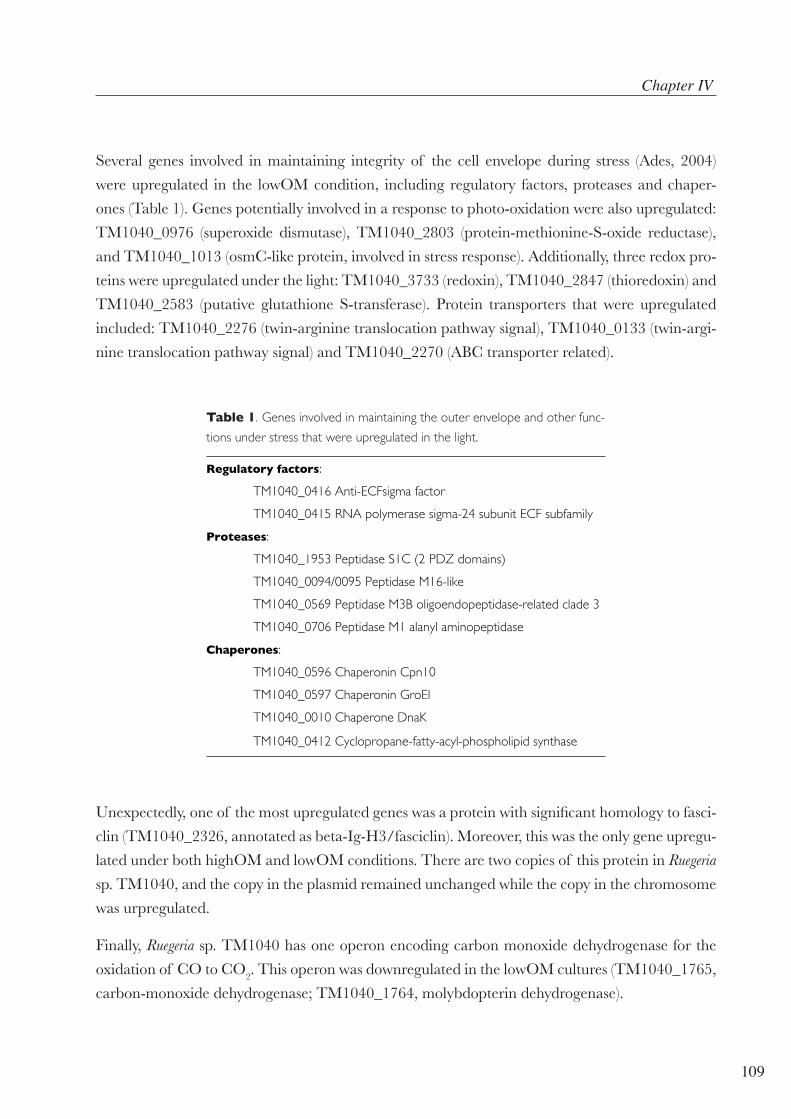
Chapter IV
109
Several genes involved in maintaining integrity of the cell envelope during stress (Ades, 2004)
were upregulated in the lowOM condition, including regulatory factors, proteases and chaper-
ones (Table 1). Genes potentially involved in a response to photo-oxidation were also upregulated:
TM1040_0976 (superoxide dismutase), TM1040_2803 (protein-methionine-S-oxide reductase),
and TM1040_1013 (osmC-like protein, involved in stress response). Additionally, three redox pro-
teins were upregulated under the light: TM1040_3733 (redoxin), TM1040_2847 (thioredoxin) and
TM1040_2583 (putative glutathione S-transferase). Protein transporters that were upregulated
included: TM1040_2276 (twin-arginine translocation pathway signal), TM1040_0133 (twin-argi-
nine translocation pathway signal) and TM1040_2270 (ABC transporter related).
Regulatory factors:
TM1040_0416 Anti-ECFsigma factor
TM1040_0415 RNA polymerase sigma-24 subunit ECF subfamily
Proteases:
TM1040_1953 Peptidase S1C (2 PDZ domains)
TM1040_0094/0095 Peptidase M16-like
TM1040_0569 Peptidase M3B oligoendopeptidase-related clade 3
TM1040_0706 Peptidase M1 alanyl aminopeptidase
Chaperones:
TM1040_0596 Chaperonin Cpn10
TM1040_0597 Chaperonin GroEl
TM1040_0010 Chaperone DnaK
TM1040_0412 Cyclopropane-fatty-acyl-phospholipid synthase
Table 1. Genes involved in maintaining the outer envelope and other func-
tions under stress that were upregulated in the light.
Unexpectedly, one of the most upregulated genes was a protein with significant homology to fasci-
clin (TM1040_2326, annotated as beta-Ig-H3/fasciclin). Moreover, this was the only gene upregu-
lated under both highOM and lowOM conditions. There are two copies of this protein in Ruegeria
sp. TM1040, and the copy in the plasmid remained unchanged while the copy in the chromosome
was urpregulated.
Finally, Ruegeria sp. TM1040 has one operon encoding carbon monoxide dehydrogenase for the
oxidation of CO to CO2. This operon was downregulated in the lowOM cultures (TM1040_1765,
carbon-monoxide dehydrogenase; TM1040_1764, molybdopterin dehydrogenase).
Transcriptional response of Ruegeria sp. strain TM1040 to light
110
Reverse transcription quantitative PCR
In the previous experiment, there turned out to be two factors that varied at the same time in the
design of the microarray experiment. One treatment (‘lowOM’) had higher oxygen levels and was
in early stationary phase. The other (‘highOM’) had almost no oxygen and was in exponential
phase. Therefore we could not tell if the differences between the effect of light on gene expression
in these treatments was related to carbon sufficiency or to oxygen, the latter mediated through
reactive oxygen species (ROS), especially since several of the upregulated genes in the lowOM
looked like ROS protection genes. Therefore, we addressed the ROS stress concern.
Under plenty of oxygen, and while eliminating any starvation factors, we looked at wavelength-
specific effects on gene expression. The question was whether UV radiation, which is responsible
for ROS generation, or blue light, which is implicated in BLUF expression, or red light, which
is implicated in neither, had different effects on gene expression. We focused on genes that we
thought were most likely to be controlled by ROS/UV and genes that we thought might be con-
trolled by BLUF (such as fasciclin and the gene right next to the BLUF domain protein) to see if we
could distinguish between these two explanations. The key issue was to first see if we were actually
observing a direct effect of light on gene regulation or if instead we were seeing an indirect effect
of light on gene expression that was mediated through ROS formation.
We wanted to make sure that the different oxygen levels in the highOM vs lowOM cultures was
not what was actually affecting gene regulation, in which case carbon levels had nothing to do
with it. So we took away the starvation factor, and addressed the oxygen/ROS issue. If the gene
expression effects were due to ROS, then we would expect to see the microarray gene expression
pattern in the UV treatment, independent of starvation status. If the gene expression effects were
not due to ROS, then the UV treatment would not affect regulation of any of the stress-like genes
upregulated in the microarray experiment and the blue light would catch some of the genes, like
fasciclin, that were upregulated regardless of carbon status.
Several genes were targeted for RT qPCR in this second series of light-based experiments with
TM1040 designed to follow up on the microarray results (Table 2). In these studies, filters were
used to isolate the effects of different wavelength ranges of the solar spectrum (see Supplementary
Figure 1). Three genes involved in the oxidative stress response were chosen for an RT qPCR study
under the same culture conditions: superoxide dismutase, osmC, and methionine sulfoxide reduc-
tase. Superoxide dismutase is an enzyme that catalyses the conversion of superoxide (a free radical)
into oxygen and hydrogen peroxide.
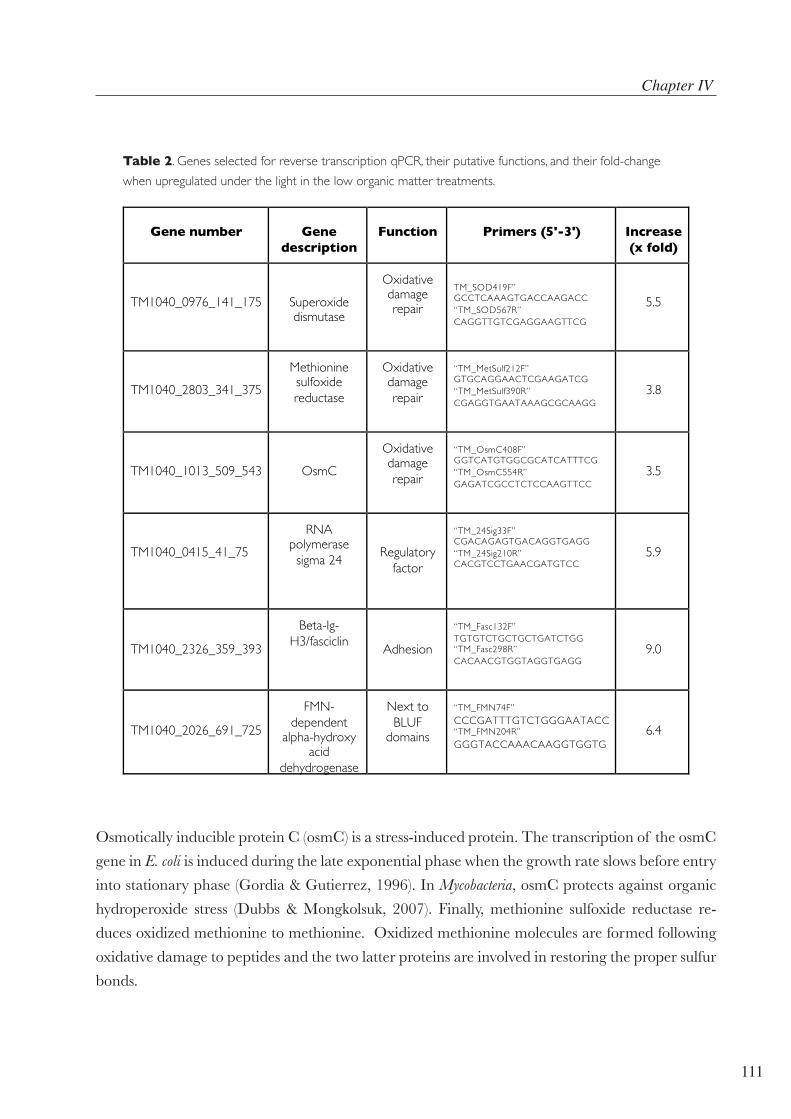
Chapter IV
111
Gene number Gene description
Function Primers (5'-3') Increase (x fold)
TM1040_0976_141_175
Superoxide dismutase
Oxidative damage repair
TM_SOD419F” GCCTCAAAGTGACCAAGACC “TM_SOD567R” CAGGTTGTCGAGGAAGTTCG
5.5
TM1040_2803_341_375
Methionine sulfoxide reductase
Oxidative damage repair
“TM_MetSulf212F” GTGCAGGAACTCGAAGATCG “TM_MetSulf390R” CGAGGTGAATAAAGCGCAAGG
3.8
TM1040_1013_509_543
OsmC
Oxidative damage repair
“TM_OsmC408F” GGTCATGTGGCGCATCATTTCG “TM_OsmC554R” GAGATCGCCTCTCCAAGTTCC
3.5
TM1040_0415_41_75
RNA polymerase sigma 24
Regulatory factor
“TM_24Sig33F” CGACAGAGTGACAGGTGAGG “TM_24Sig210R” CACGTCCTGAACGATGTCC
5.9
TM1040_2326_359_393
Beta-Ig-H3/fasciclin
Adhesion
“TM_Fasc132F” TGTGTCTGCTGCTGATCTGG “TM_Fasc298R” CACAACGTGGTAGGTGAGG
9.0
TM1040_2026_691_725
FMN-dependent
alpha-hydroxy acid
dehydrogenase
Next to BLUF
domains
“TM_FMN74F” CCCGATTTGTCTGGGAATACC “TM_FMN204R” GGGTACCAAACAAGGTGGTG
6.4
Table 2. Genes selected for reverse transcription qPCR, their putative functions, and their fold-change
when upregulated under the light in the low organic matter treatments.
Osmotically inducible protein C (osmC) is a stress-induced protein. The transcription of the osmC
gene in E. coli is induced during the late exponential phase when the growth rate slows before entry
into stationary phase (Gordia & Gutierrez, 1996). In Mycobacteria, osmC protects against organic
hydroperoxide stress (Dubbs & Mongkolsuk, 2007). Finally, methionine sulfoxide reductase re-
duces oxidized methionine to methionine. Oxidized methionine molecules are formed following
oxidative damage to peptides and the two latter proteins are involved in restoring the proper sulfur
bonds.
Transcriptional response of Ruegeria sp. strain TM1040 to light
112
The genes assayed by RT qPCR exhibited three different types of responses. The three genes
involved in oxidative stress response were clearly upregulated by blue light and only by blue light
(Figure 3, A-C). Fasciclin and the sigma 24 factor were stimulated by both blue and UV radiation,
but this response was transitory, being intense after 15 min but non-significant by 50 min (Figure
3 D-E). Finally, FMN-dependent alpha-hydroxy acid dehydrogenase did not show a very clear
pattern (Figure 3 F), with blue light upregulating expression after 5 min of exposure but not later,
while UV radiation upregulated at 15 min but not later.
We showed that the regulation of this response was due to blue light and not to red light or UV ra-
diation, as the three genes tested showed increased upregulation under blue light only. Therefore,
we hypothesize that the BLUF protein is responsible for the observed response, even though the
BLUF genes are not upregulated themselves. This makes sense for genes acting as sensors, since
they need to be turned on all the time at the same level so they can detect photons. Intriguingly,
there were two ORFs in the vicinity of the two BLUF domains that were significantly upregulated
in connection with the oxidative stress response. One of these codes for a hypothetical protein and
the other for a FMN-dependent alpha-hydroxy acid dehydrogenase. The latter enzyme might be
involved in the synthesis of the BLUF cofactor itself. But the present experiments cannot clarify
the issue. The RT qPCR study of this gene did not show a very clear pattern, since the gene was
upregulated after 5 min of exposure to blue light, after which expression levels decreased to those
in the dark. On the other hand, there was a slight increase under UV radiation, although the vari-
ability among replicates precludes a firm conclusion.
The other clear response to light exposure was the upregulation of fasciclin, which took place
under both culture conditions. Fasciclin is involved in attachment to other cells of the same spe-
cies or to symbionts. Ruegeria TM1040 is known to form rosettes of cells when grown without
shaking (Bruhn et al., 2007) and its mode of life requires attachment to Pfiesteria piscicida. In ad-
dition TM1040 would want to regulate its adhesion proteins when phytoplankton were present.
Phytoplankton is found primarily in the photic zone, so when TM1040 detected light it might be
beneficial to ramp up its adhesion proteins in case that it was near phytoplankton. Obviously, this
response would be advantageous under both nutritional conditions tested: exponentially growing
cells could access additional resources to continue growth, while stationary phase cells would be
able to resume growth. However, fasciclin appeared to be the only gene related to adhesion (or
other phytoplankton association related genes) that was affected in these light experiments. Also,
why this upregulation was stimulated by both UV radiation and blue light remains intriguing.
Maybe the filter cutoffs were such that small amounts of blue light came through, or maybe the
BLUF proteins detect a range of wavelengths near blue light, even if most efficient with blue.
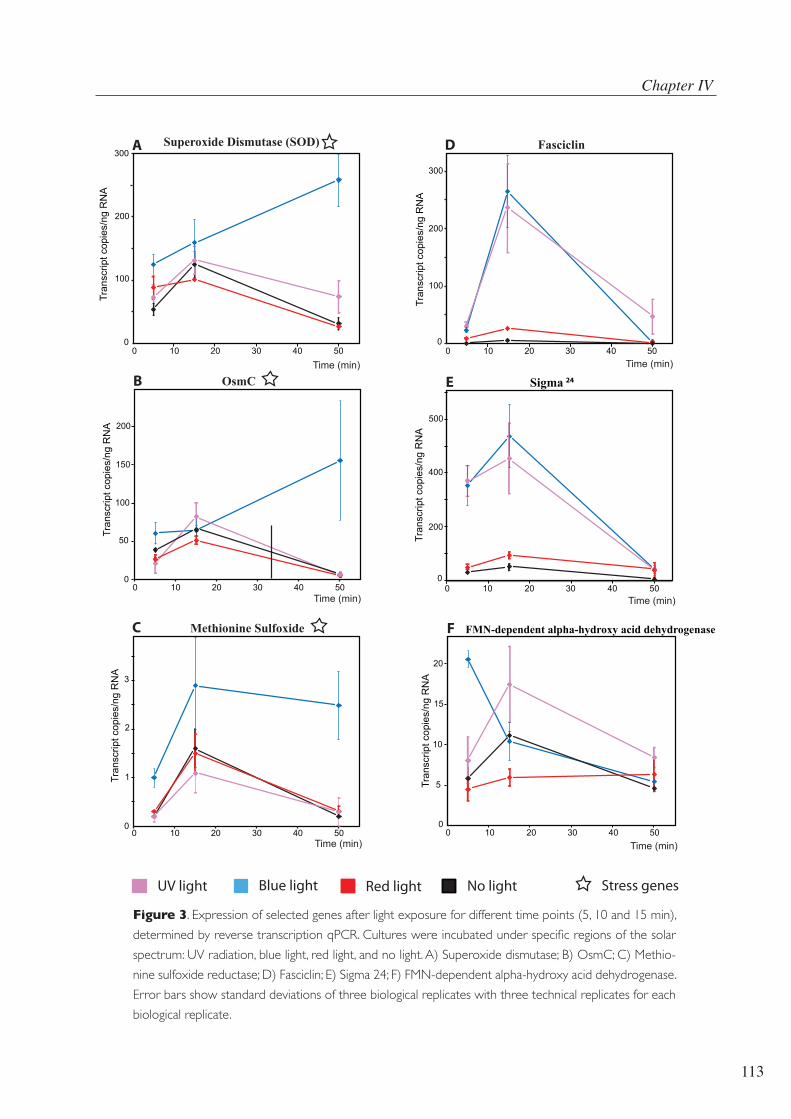
Chapter IV
113
0
100
200
0 10 20 30 40 50
0
100
150
0 10 20 30 40 50
0
100
200
300
0 10 20 30 40 50
0
5
10
15
20
0 10 20 30 40 50
0
200
400
500
0 10 20 30 40 50
0
1
2
3
0 10 20 30 40 50
50
200
Stress genes
Superoxide Dismutase (SOD) Fasciclin
Methionine Sulfoxide
OsmC
FMN-dependent alpha-hydroxy acid dehydrogenase
Sigma 24
Tran
scrip
t cop
ies/
ng R
NA
300
Time (min)
Tran
scrip
t cop
ies/
ng R
NA
Tran
scrip
t cop
ies/
ng R
NA
Tran
scrip
t cop
ies/
ng R
NA
Tran
scrip
t cop
ies/
ng R
NA
Tran
scrip
t cop
ies/
ng R
NA
Time (min) Time (min)
Time (min)
Time (min)
Time (min)
A
F
E
D
C
B
Blue lightUV light Red light No light
Figure 3. Expression of selected genes after light exposure for different time points (5, 10 and 15 min),
determined by reverse transcription qPCR. Cultures were incubated under specific regions of the solar
spectrum: UV radiation, blue light, red light, and no light. A) Superoxide dismutase; B) OsmC; C) Methio-
nine sulfoxide reductase; D) Fasciclin; E) Sigma 24; F) FMN-dependent alpha-hydroxy acid dehydrogenase.
Error bars show standard deviations of three biological replicates with three technical replicates for each
biological replicate.

Transcriptional response of Ruegeria sp. strain TM1040 to light
114
Another gene that was clearly upregulated under both UV radiation and blue light was RNA
polymerase sigma 24. This gene was chosen for a more detailed study because it is known as the
“environmental” sigma factor for its frequent role in regulation of environment sensing mecha-
nisms in the cell. Light can be one of the “environmental signals” in which sigma 24 is frequently
involved. Further, it was one of the two genes with increased expression in both the low and high
organic matter conditions. Since the upregulation pattern was the same as that for fasciclin, the
sigma factor is likely related to a response involving attachment.
Overall, the results indicate that the regulation of gene expression in this heterotroph when light is
present triggers a series of genes involved in protecting the cell from photooxidative damage and
in a possible coupling with a dinoflagellate to access resources produced by the dinoflagellate when
light is present.
ACKNOWLEDGEMENTS
We thank Dr. José M. González (Universidad de La Laguna) for helpful comments on the manu-
script. Work at the University of Georgia was supported by a grant from the Gordon and Betty
Moore Foundation, and work in Barcelona by grant GEMMA (CTM2007-63753-C02-01/MAR)
from the Spanish Ministry of Science and Innovation.

Chapter IV
115
REFERENCES
Ades, S. E. 2004. Control of the alternative sigma factor sigmaE in Escherichia coli. Curr Opin
Microbiol, 7(2): 157-162.
Alavi, M., Miller, T., Erlandson, K., Schneider, R., & Belas, R. 2001. Bacterial community associ-
ated with Pfiesteria-like dinoflagellate cultures. Environ Microbiol, 3(6): 380-396.
Alonso, C., & Pernthaler, J. 2006. Roseobacter and SAR11 dominate microbial glucose uptake in
coastal North Sea waters. Environ Microbiol, 8(11): 2022-2030.
Baumann, P., & Baumann, L. 1981. The marine Gram-negative eubacteria: genera Photobacte-
rium, Beneckea, Alteromonas, Pseudomonas, and Alcaligenes. In H. S. Edited by M. P.
Starr, H. G. Trüper, A. Balows & H. G. Schlegel. Berlin: Springer-Verlag. (Ed.), The Pro-
karyotes: 1302–1331.
Braatsch, S., Moskvin, O. V., Klug, G., & Gomelsky, M. 2004. Responses of the Rhodobacter sphaer-
oides transcriptome to blue light under semiaerobic conditions. J Bacteriol, 186(22): 7726-
7735.
Bruhn, J. B., Gram, L., & Belas, R. 2007. Production of antibacterial compounds and biofilm
formation by Roseobacter species are influenced by culture conditions. Appl Environ
Microbiol, 73(2): 442-450.
Buchan, A., González, J. M., & Moran, M. A. 2005. Overview of the marine roseobacter lineage.
Appl Environ Microbiol, 71(10): 5665-5677.
Bürgmann, H., Howard, E. C., Ye, W., Sun, F., Sun, S., Napierala, S., & Moran, M. A. 2007. Tran-
scriptional response of Silicibacter pomeroyi DSS-3 to dimethylsulfoniopropionate (DMSP).
Environ Microbiol, 9(11): 2742-2755.
Dubbs, J., & Mongkolsuk, S. 2007. Peroxiredoxins in bacterial antioxidant defense. Subcell Bio-
chem, 44: 143-193.
Feinstein, T. N., Traslavina, R., Sun, M.-Y., & Lin, S. 2002. Effects of light on photosynthesis,
grazing, and population dynamics of the heterotrophic dinoflagellate Pfiesteria piscicida (Di-
nophyceae). Journal of Phycology, 38(4): 659-669.
Gomelsky, M., & Klug, G. 2002. BLUF: a novel FAD-binding domain involved in sensory trans-
duction in microorganisms. Trends Biochem Sci, 27(10): 497-500.

Transcriptional response of Ruegeria sp. strain TM1040 to light
116
González, J. M., & Moran, M. A. 1997. Numerical dominance of a group of marine bacteria in
the alpha-subclass of the class Proteobacteria in coastal seawater. Appl Environ Micro-
biol, 63(11): 4237-4242.
Gordia, S., & Gutierrez, C. 1996. Growth-phase-dependent expression of the osmotically induc-
ible gene osmC of Escherichia coli K-12. Mol Microbiol, 19(4): 729-736.
Jung, A., Domratcheva, T., Tarutina, M., Wu, Q., Ko, W. H., Shoeman, R. L., Gomelsky, M.,
Gardner, K. H., & Schlichting, I. 2005. Structure of a bacterial BLUF photoreceptor: in-
sights into blue light-mediated signal transduction. Proc Natl Acad Sci U S A, 102(35):
12350-12355.
Miller, T. R., & Belas, R. 2004. Dimethylsulfoniopropionate Metabolism by Pfiesteria-Associated
Roseobacter spp. Appl Environ Microbiol, 70(6): 3383-3391.
Miller, T. R., & Belas, R. 2006. Motility is involved in Silicibacter sp. TM1040 interaction with di-
noflagellates. Environ Microbiol, 8(9): 1648-1659.
Miller, T. R., Hnilicka, K., Dziedzic, A., Desplats, P., & Belas, R. 2004. Chemotaxis of Silici-
bacter sp. strain TM1040 toward dinoflagellate products. Appl Environ Microbiol, 70(8):
4692-4701.
Moran, M. A., Belas, R., Schell, M. A., Gonzalez, J. M., Sun, F., Sun, S., Binder, B. J., Edmonds, J.,
Ye, W., Orcutt, B., Howard, E. C., Meile, C., Palefsky, W., Goesmann, A., Ren, Q., Paulsen,
I., Ulrich, L. E., Thompson, L. S., Saunders, E., & Buchan, A. 2007. Ecological genomics
of marine roseobacters. Appl Environ Microbiol, 73(14): 4559-4569.
Newton, R. J., Griffin, L. E., Bowles, K. M., Meile, C., Gifford, S., Givens, C. E., Howard, E. C.,
King, E., Oakley, C. A., Reisch, C. R., Rinta-Kanto, J. M., Sharma, S., Sun, S., Varaljay,
V., Vila-Costa, M., Westrich, J. R., & Moran, M. A. 2010. Genome characteristics of a
generalist marine bacterial lineage. ISME J, 4(6): 784-798.
Tusher, V. G., Tibshirani, R., & Chu, G. 2001. Significance analysis of microarrays applied to
the ionizing radiation response. Proceedings of the National Academy of Sciences,
98(9): 5116-5121.
Yi, H., Lim, Y. W., & Chun, J. 2007. Taxonomic evaluation of the genera Ruegeria and Silicibacter: a
proposal to transfer the genus Silicibacter Petursdottir and Kristjansson 1999 to the genus
Ruegeria Uchino et al. 1999. International Journal of Systematic and Evolution-
ary Microbiology, 57(4): 815-819.

Chapter IV
117
Zeller, T., Moskvin, O. V., Li, K., Klug, G., & Gomelsky, M. 2005. Transcriptome and physiologi-
cal responses to hydrogen peroxide of the facultatively phototrophic bacterium Rhodobacter
sphaeroides. J Bacteriol, 187(21): 7232-7242.
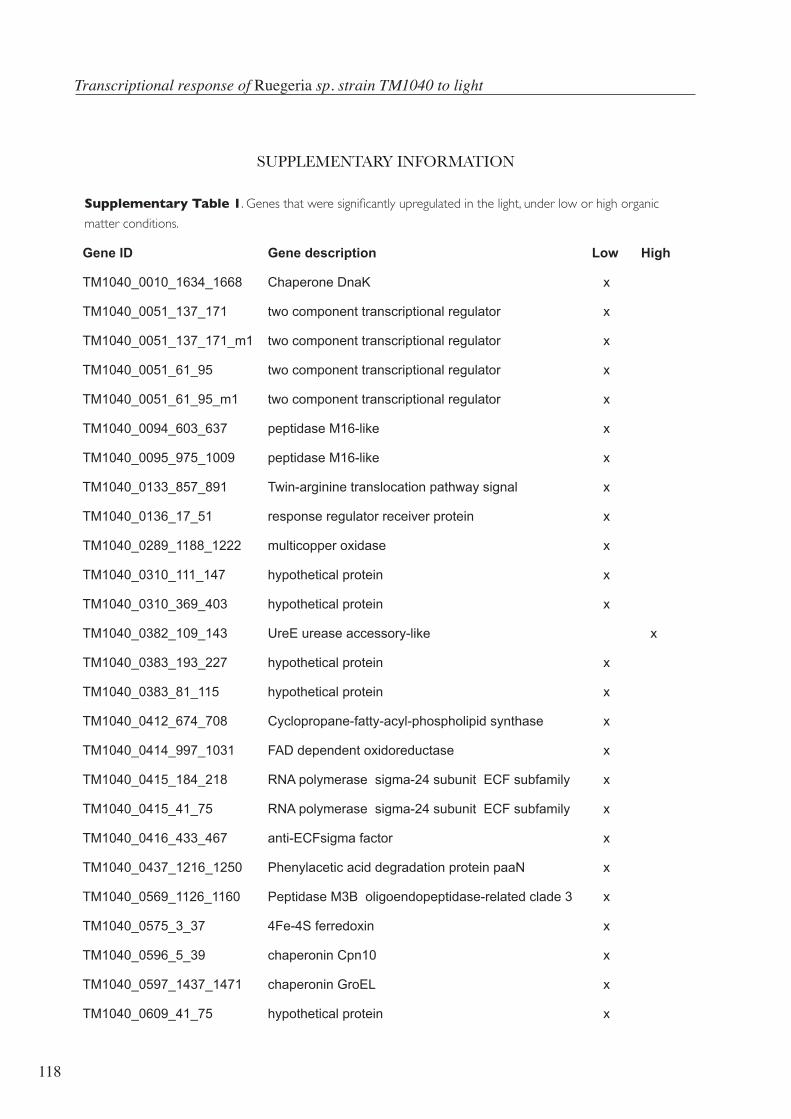
Transcriptional response of Ruegeria sp. strain TM1040 to light
118
SUPPLEMENTARY INFORMATION
Supplementary Table 1. Genes that were significantly upregulated in the light, under low or high organic
matter conditions.
Gene ID Gene description Low High
TM1040_0010_1634_1668 Chaperone DnaK x
TM1040_0051_137_171 two component transcriptional regulator x
TM1040_0051_137_171_m1 two component transcriptional regulator x
TM1040_0051_61_95 two component transcriptional regulator x
TM1040_0051_61_95_m1 two component transcriptional regulator x
TM1040_0094_603_637 peptidase M16-like x
TM1040_0095_975_1009 peptidase M16-like x
TM1040_0133_857_891 Twin-arginine translocation pathway signal x
TM1040_0136_17_51 response regulator receiver protein x
TM1040_0289_1188_1222 multicopper oxidase x
TM1040_0310_111_147 hypothetical protein x
TM1040_0310_369_403 hypothetical protein x
TM1040_0382_109_143 UreE urease accessory-like x
TM1040_0383_193_227 hypothetical protein x
TM1040_0383_81_115 hypothetical protein x
TM1040_0412_674_708 Cyclopropane-fatty-acyl-phospholipid synthase x
TM1040_0414_997_1031 FAD dependent oxidoreductase x
TM1040_0415_184_218 RNA polymerase sigma-24 subunit ECF subfamily x
TM1040_0415_41_75 RNA polymerase sigma-24 subunit ECF subfamily x
TM1040_0416_433_467 anti-ECFsigma factor x
TM1040_0437_1216_1250 Phenylacetic acid degradation protein paaN x
TM1040_0569_1126_1160 Peptidase M3B oligoendopeptidase-related clade 3 x
TM1040_0575_3_37 4Fe-4S ferredoxin x
TM1040_0596_5_39 chaperonin Cpn10 x
TM1040_0597_1437_1471 chaperonin GroEL x
TM1040_0609_41_75 hypothetical protein x

Chapter IV
119
TM1040_0621_116_150 protein of unknown function DUF526 x
TM1040_0621_37_71 protein of unknown function DUF526 x
TM1040_0706_2166_2200 Peptidase M1 alanyl aminopeptidase x
TM1040_0761_649_683 Biotin--acetyl-CoA-carboxylase ligase x
TM1040_0765_233_267 HesB/YadR/YfhF x
TM1040_0862_391_425 1-hydroxy-2-methyl-2-(E)-butenyl 4-diphosphate
synthase x
TM1040_0952_161_195 hypothetical protein x
TM1040_0976_141_175 Superoxide dismutase x
TM1040_1013_509_543 OsmC-like protein x
TM1040_1032_683_717 hypothetical protein x
TM1040_1170_657_691 AMP-dependent synthetase and ligase x
TM1040_1379_289_323 Homoserine O-succinyltransferase x
TM1040_1395_189_223 hypothetical protein x
TM1040_1461_1115_1149 two component sigma54 specific transcriptional
regulator Fis family x
TM1040_1523_113_147 Glyoxalase/bleomycin resistance
protein/dioxygenase x
TM1040_1544_2128_2162 AIR synthase related protein-like x
TM1040_1702_102_136 hypothetical protein x
TM1040_1703_241_275 GCN5-related N-acetyltransferase x
TM1040_1757_93_127 hypothetical protein x
TM1040_1761_780_814 Ferredoxin--NADP(+) reductase x
TM1040_1912_124_158 protein of unknown function DUF1127 x
TM1040_1953_645_679 Peptidase S1C x
TM1040_1953_709_743 Peptidase S1C x
TM1040_1988_3_37 hypothetical protein x
TM1040_2023_2_36 protein of unknown function DUF1127 x
TM1040_2026_691_725 L-lactate dehydrogenase (cytochrome) x
TM1040_2050_293_327 hypothetical protein x

Transcriptional response of Ruegeria sp. strain TM1040 to light
120
TM1040_2139_57_93 hypothetical protein x
TM1040_2177_202_236 RNA polymerase sigma-24 ECF subfamily x
TM1040_2178_417_451 hypothetical protein x
TM1040_2178_97_131 hypothetical protein x
TM1040_2262_315_350 hypothetical protein x
TM1040_2270_35_69 ABC transporter related x
TM1040_2276_325_359 Twin-arginine translocation pathway signal x
TM1040_2276_651_685 Twin-arginine translocation pathway signal x
TM1040_2326_359_393 beta-Ig-H3/fasciclin x
TM1040_2326_359_393 beta-Ig-H3/fasciclin x
TM1040_2326_431_465 beta-Ig-H3/fasciclin x
TM1040_2326_431_465 beta-Ig-H3/fasciclin x
TM1040_2439_425_459 HPr kinase x
TM1040_2534_29_63 ATP-dependent Clp protease adaptor protein ClpS x
TM1040_2583_449_483 putative glutathione S-transferase x
TM1040_2720_43_77 protein of unknown function DUF1328 x
TM1040_2766_225_259 protein of unknown function DUF1285 x
TM1040_2803_341_375 Protein-methionine-S-oxide reductase x
TM1040_2805_2839_m3 23S ribosomal RNA x
TM1040_2847_233_267 thioredoxin x
TM1040_2848_57_91 protein of unknown function DUF1127 x
TM1040_2848_85_119 protein of unknown function DUF1127 x
TM1040_2890_57_91 NUDIX hydrolase x
TM1040_3065_647_681 secretion protein HlyD x
TM1040_3074_193_227 hypothetical protein x
TM1040_3458_1008_1042 hypothetical protein x
TM1040_3733_110_144 Redoxin x
TM1040_3733_357_391 Redoxin x
TM1040_3796_455_489 hypothetical protein x
TM1040_728_762_m2 16S ribosomal RNA x
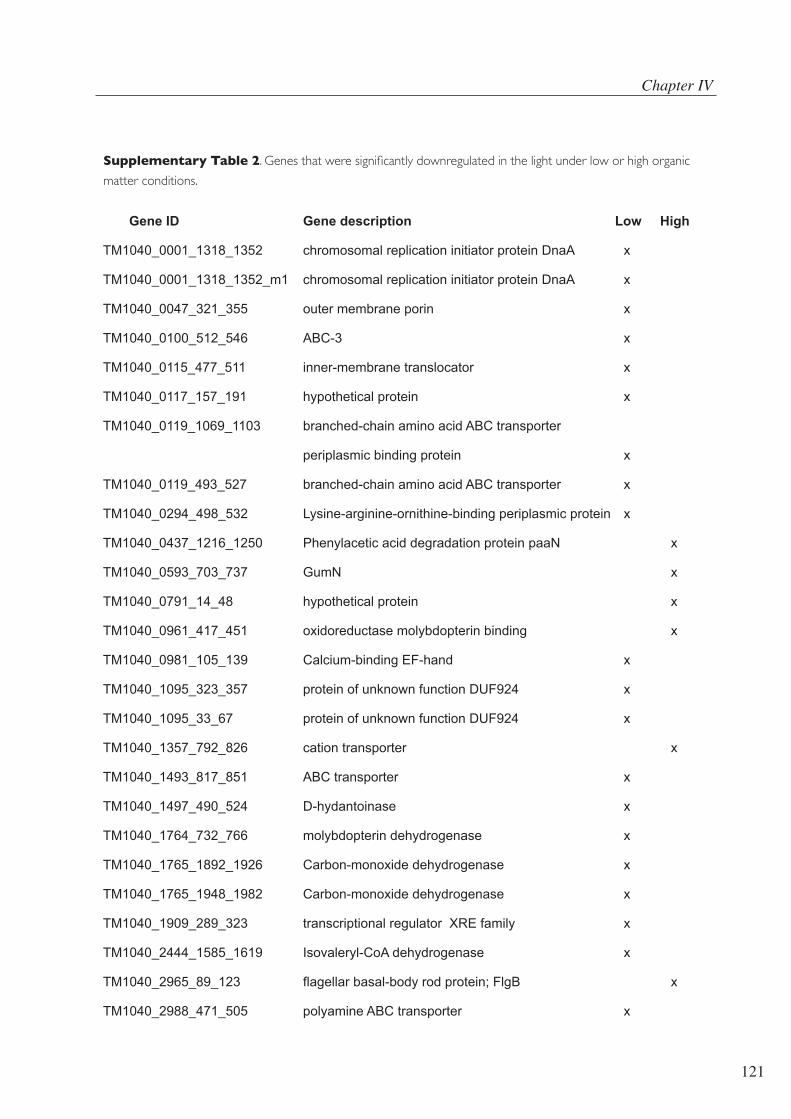
Chapter IV
121
Supplementary Table 2. Genes that were significantly downregulated in the light under low or high organic
matter conditions.
Gene ID Gene description Low High
TM1040_0001_1318_1352 chromosomal replication initiator protein DnaA x
TM1040_0001_1318_1352_m1 chromosomal replication initiator protein DnaA x
TM1040_0047_321_355 outer membrane porin x
TM1040_0100_512_546 ABC-3 x
TM1040_0115_477_511 inner-membrane translocator x
TM1040_0117_157_191 hypothetical protein x
TM1040_0119_1069_1103 branched-chain amino acid ABC transporter
periplasmic binding protein x
TM1040_0119_493_527 branched-chain amino acid ABC transporter x
TM1040_0294_498_532 Lysine-arginine-ornithine-binding periplasmic protein x
TM1040_0437_1216_1250 Phenylacetic acid degradation protein paaN x
TM1040_0593_703_737 GumN x
TM1040_0791_14_48 hypothetical protein x
TM1040_0961_417_451 oxidoreductase molybdopterin binding x
TM1040_0981_105_139 Calcium-binding EF-hand x
TM1040_1095_323_357 protein of unknown function DUF924 x
TM1040_1095_33_67 protein of unknown function DUF924 x
TM1040_1357_792_826 cation transporter x
TM1040_1493_817_851 ABC transporter x
TM1040_1497_490_524 D-hydantoinase x
TM1040_1764_732_766 molybdopterin dehydrogenase x
TM1040_1765_1892_1926 Carbon-monoxide dehydrogenase x
TM1040_1765_1948_1982 Carbon-monoxide dehydrogenase x
TM1040_1909_289_323 transcriptional regulator XRE family x
TM1040_2444_1585_1619 Isovaleryl-CoA dehydrogenase x
TM1040_2965_89_123 flagellar basal-body rod protein; FlgB x
TM1040_2988_471_505 polyamine ABC transporter x
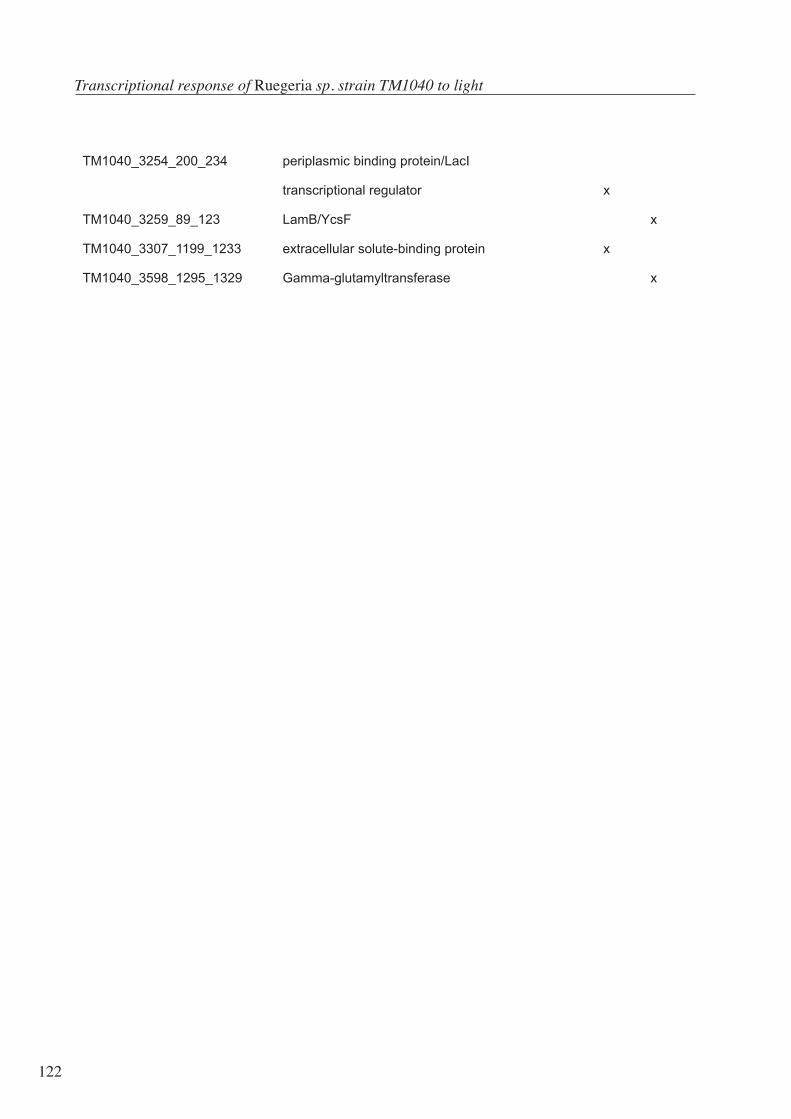
Transcriptional response of Ruegeria sp. strain TM1040 to light
122
TM1040_3254_200_234 periplasmic binding protein/LacI
transcriptional regulator x
TM1040_3259_89_123 LamB/YcsF x
TM1040_3307_1199_1233 extracellular solute-binding protein x
TM1040_3598_1295_1329 Gamma-glutamyltransferase x

Chapter IV
123
Supplementary Figure 1. Characteristics of the radiation spectra obtained with different filters and ideal condi-
tions in situ in July and January. We used a solar simulator to simulate annual average wavelength intensities in the surface
waters off the coast of Georgia. To generate modified spectra, we fit glass filters to an opening in the bottom of the solar
simulator. The light conditions are compared to average ocean conditions for the mixed layer during winter and summer
(station GOS014).

Transcriptional response of Ruegeria sp. strain TM1040 to light
124
Supplementary Figure 2. Growth of Ruegeria TM1040 and changes in dissolved oxygen
concentrations in batch cultures with two different glucose concentrations. The times of exposure
to light and of sample collection are shown by vertical lines.
0
20
40
60
80
100
oxygen lowOMoxygen highOM
0
0.1
0.2
0.3
0.4
0.5
0.6
0.7
0.8
0 10 20 30 40 50
growth lowOMgrowth highOM
% D
issolved oxygen in the media
Time (hours)
Growth of Ruegeria while measuring oxygen
OD
600
T0 T50’


Chapter 5
Light Stimulates Growth of Proteorhodopsin-Containing Marine Flavobacteria


Chapter 5
129
ABSTRACT
Proteorhodopsins are bacterial light-dependent proton pumps. Their discovery within genomic
material from uncultivated marine bacterioplankton caused considerable excitement because it
indicated a potential phototrophic function within these organisms, which had previously been
considered strictly chemotrophic1. Subsequent studies established that sequences encoding pro-
teorhodopsin are broadly distributed throughout the world’s oceans2–5. Nevertheless, the role of
proteorhodopsins in native marine bacteria is still unknown6. Here we show, from an analysis of
the complete genomes of three marine Flavobacteria, that cultivated bacteria in the phylum Bacte-
roidetes, one of the principal components of marine bacterioplankton, contain proteorhodopsin.
Moreover, growth experiments in both natural and artificial seawater (low in labile organic matter,
which is typical of the world’s oceans) establish that exposure to light results in a marked increase
in the cell yield of one such bacterium (Dokdonia sp. strain MED134) when compared with cells
grown in darkness. Thus, our results show that the phototrophy conferred by proteorhodopsin can
provide critical amounts of energy, not only for respiration and maintenance but also for active
growth of marine bacterioplankton in their natural environment.
Light stimulates growth of proteorhodopsin-containing marine Flavobacteria. Laura Gómez-Consarnau, José M. González, Montserrat Coll-Lladó*, Pontus Gourdon, Torbjörn Pascher, Richard Neutze, Carlos Pedrós-Alió & Jarone Pinhassi. 2007. Nature, 445: 210-213.
* I contributed to this article doing the expression analysis of the proteorhodopsin gene

Light stimulates growth of proteorhodopsin-containing marine Flavobacteria
130
LETTER
Rhodopsins are found in the domains Archaea, Bacteria and Eukarya. Rhodopsins in Archaea
function as energy-transducing light-driven proton or chloride pumps, or as phototactic sensory
proteins. In Eukarya, rhodopsins function primarily as sensory proteins and, for example, account
for colour vision in the human retina. The recent discovery of rhodopsins in Bacteria (proteorho-
dopsin; PR) came after the sequence analysis of a cloned genome region from a marine bacterium
of the uncultivated SAR86 clade1. Subsequent screening of DNA from different oceans revealed
a very large diversity of PR in bacteria belonging to divergent clades of the Alphaproteobacteria
and Gammaproteobacteria classes3–8. Studies on reconstituted PR overproduced in Escherichia coli
have established that it functions as a light-driven proton pump with the potential to generate en-
ergy for cell growth or maintenance1,6. However, the physiological role and benefits of PR in native
Bacteria in the marine environment have not been demonstrated.
Alphaproteobacteria and Gammaproteobacteria, together with members of the Bacteroidetes
phylum, are the most abundant groups of heterotrophic bacteria in the sea9–12. In the present study
we examined whole-genome sequences of three bacteria belonging to the class Flavobacteria, phy-
lum Bacteroidetes (Dokdonia sp. strain MED134, Polaribacter sp. strain MED152 and Leeuwenhoekiella
blandensis strain MED217T). These bacteria were isolated from surface water from the Mediterra-
nean Sea and were successfully cultured (Fig. 1).
Genome analysis revealed the presence of genes encoding PR in MED134 and MED152 but not
in MED217T. Furthermore, these bacteria lacked genes for bacteriochlorophyll synthesis, reaction
centres or light-harvesting complexes necessary to perform photosynthesis. This indicates that, if
present, phototrophy in MED134 and MED152 must be due to the activity of PR.
Proteorhodopsin genes from MED134 and MED152 encoded peptides of 247 and 243 amino acid
residues, respectively, sharing a sequence similarity of 83%. They are predicted to be heptahelical
integral membrane proteins, as are PRs from other marine bacteria such as the SAR86 clade and
‘Pelagibacter ubique’, the first cultivated member of the abundant SAR11 clade13 (Supplementary
Fig. S1). Phylogenetic analysis showed that PRs from MED134 and MED152 formed a distinct
cluster with two unpublished PR orthologues from Flavobacteria isolates reported in GenBank and
previously unclassified environmental sequences from the North Atlantic and the Sargasso Sea5,8
(Fig. 2). The similarity between PR sequences within this putative Bacteroidetes cluster ranged
from 57% to 85%, whereas the similarity to sequences outside this cluster ranged from 43% to
49%. Our results therefore substantiate a previous suggestion5 that some PR sequences from un-
cultivated bacteria belong to the phylum Bacteroidetes.

Chapter 5
131
Figure 1. Images of Flavobacteria isolates. a–c, Colony morphol-
ogy of Dokdonia sp. MED134 (a), Polaribacter sp. MED152 (b) and L.
blandensis MED217T (c) growing on marine agar (Difco). d, e, Epi-
fluorescence microscopy images of MED134 growing in the dark
(d) and in the light (e), showing differences in cell morphology.
Scale bars, 1 mm.

Light stimulates growth of proteorhodopsin-containing marine Flavobacteria
132
Several key amino acid positions necessary for energy generation are conserved among rhodopsins
functioning as proton or ion pumps (Supplementary Fig. S1). Lys 216, which binds retinal to helix
G through a protonated Schiff base in bacteriorhodopsin, was conserved as Lys 230 in MED134
and MED152. Asp 85, the proton acceptor from the Schiff base, was conserved as Asp 97. In PR
from marine bacteria Glu 108 replaces Asp 96, which facilitates Schiff-base reprotonation during
the latter half of the bacteriorhodopsin photocycle14,15. Nevertheless, experiments with SAR86
and P. ubique PRs have demonstrated that they also function as proton pumps1,6.
Figure 2. Phylogenetic tree of PR amino acid sequences. The position
of MED134 and MED152 (bold type) in relation to selected sequences
of tentative Bacteroidetes PRs from the Sargasso Sea and the North
Atlantic as well as Alphaproteobacteria (α) and Gammaproteobacteria
(γ). Squares and circles denote sequences aligned in Supplementary Fig.
S1 and included in the gene arrangement in Supplementary Fig. S3, re-
spectively. The numbers at nodes are bootstrap values more than 50%
after 100 replicates. The scale bar represents substitutions per site.

Chapter 5
133
Thus, the essential mechanism of light-driven proton pumping by bacteriorhodopsin16 seems also
to apply for PR. Furthermore, laser flash (532 nm)-induced absorbance changes (probed at 500
nm) in membrane extracts from MED134 showed reaction times less than 50 ms, consistent with
the presence of PR functioning as a proton pump (Supplementary Fig. S2).
A phototrophic role for PR implies that its absorption maximum would be tuned to optimize the
overlap with environmental light2,7. Thus, PRs in near-surface seawater typically have leucine at
amino acid position 105 (eBAC31A08 numbering) and show absorption maxima near 530nm
(green light), whereas PRs from deeper water have glutamine at this position and absorb near 490
nm (blue light)2,7,15. Consistent with these findings is the observation that the near-surface Bacte-
roidetes PRs contained a hydrophobic side-chain Met 105 (similar to Leu; Supplementary Fig. S1)
and showed an absorption maximum at 535nm (Fig. 3b, inset).
Functional PR requires the covalent binding of retinal, which is synthesized from ß-carotene.
MED134 and MED152 contained the predicted genes crtEBIY (for gene arrangement see Supple-
mentary Fig. S3) encoding enzymes needed to synthesize ß-carotene from farnesyl diphosphate
and isopentenyl diphosphate17. A gene encoding a candidate for Blh, an enzyme that converts
ß-carotene to retinal8, was found next to the gene encoding PR in the Bacteroidetes, whereas in
Proteobacteria the blh gene is next to putative genes in the pathway for retinal synthesis6,8 (Supple-
mentary Fig. S3).
Since its discovery in the sea by cloning environmental DNA, the lack of cultivated bacteria that
have and express PR has hampered the determination of its physiological relevance to marine
bacteria in situ. The gene encoding PR was recently found in cultivated P. ubique, and mass spectros-
copy indicated that Pelagibacter PR is abundant in the surface ocean6. Laboratory experiments with
P. ubique, however, showed no differences in cell yield when growing in light or darkness despite the
fact that PR was present in cell membranes. The authors therefore speculated that the benefits of
PR might be more pronounced when bacterial growth is limited by organic matter availability. We
monitored the growth of MED134 in experiments with natural seawater exposed to light or dark-
ness. Bacteria growing in moderate light reached a maximal abundance of 3x10⁵ cells ml-1 after
100 h (Fig. 3a). In contrast, bacteria remained below 0.5x10⁵ cells ml-1 in the dark. When dark cul-
tures were exposed to light after 120 h, growth was initiated and bacteria reached 2x10⁵ cells ml-1
within 100 h, whereas bacteria in the cultures remaining in darkness slowly decreased in numbers.
This is the first confirmation in vivo that light has a definite positive impact on the growth of marine
bacteria possessing the gene encoding PR.
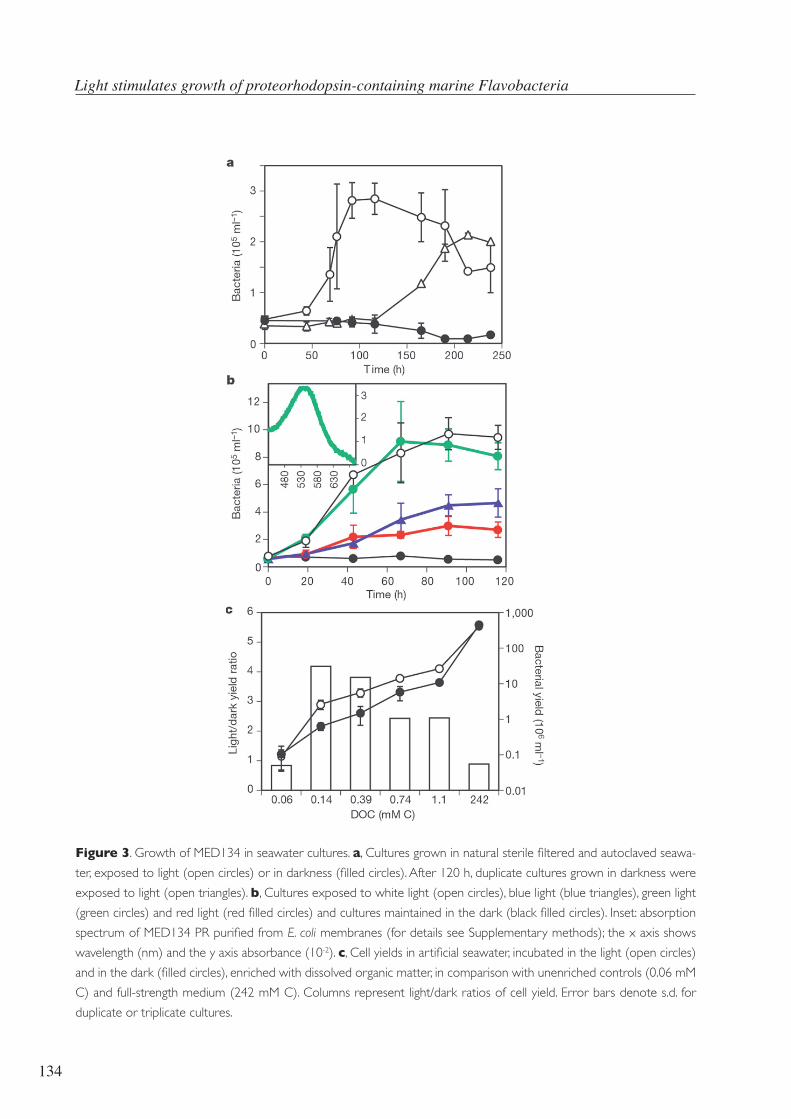
Light stimulates growth of proteorhodopsin-containing marine Flavobacteria
134
Figure 3. Growth of MED134 in seawater cultures. a, Cultures grown in natural sterile filtered and autoclaved seawa-
ter, exposed to light (open circles) or in darkness (filled circles). After 120 h, duplicate cultures grown in darkness were
exposed to light (open triangles). b, Cultures exposed to white light (open circles), blue light (blue triangles), green light
(green circles) and red light (red filled circles) and cultures maintained in the dark (black filled circles). Inset: absorption
spectrum of MED134 PR purified from E. coli membranes (for details see Supplementary methods); the x axis shows
wavelength (nm) and the y axis absorbance (10-2). c, Cell yields in artificial seawater, incubated in the light (open circles)
and in the dark (filled circles), enriched with dissolved organic matter, in comparison with unenriched controls (0.06 mM
C) and full-strength medium (242 mM C). Columns represent light/dark ratios of cell yield. Error bars denote s.d. for
duplicate or triplicate cultures.
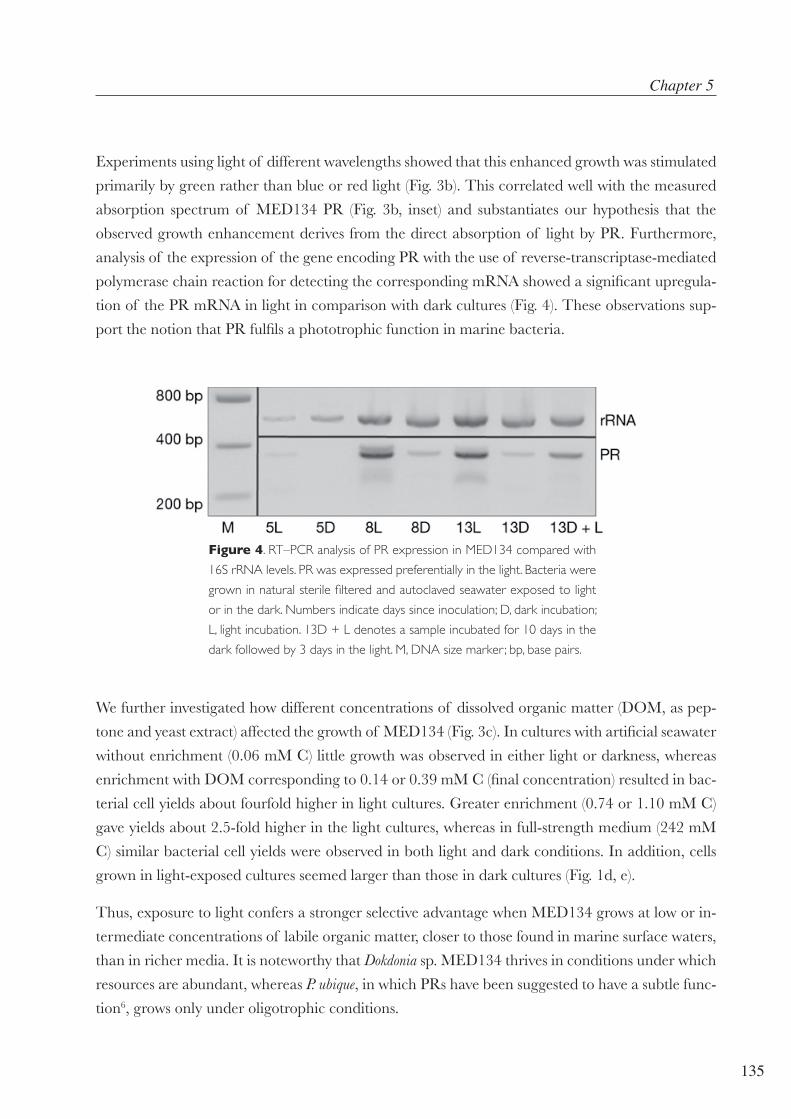
Chapter 5
135
Experiments using light of different wavelengths showed that this enhanced growth was stimulated
primarily by green rather than blue or red light (Fig. 3b). This correlated well with the measured
absorption spectrum of MED134 PR (Fig. 3b, inset) and substantiates our hypothesis that the
observed growth enhancement derives from the direct absorption of light by PR. Furthermore,
analysis of the expression of the gene encoding PR with the use of reverse-transcriptase-mediated
polymerase chain reaction for detecting the corresponding mRNA showed a significant upregula-
tion of the PR mRNA in light in comparison with dark cultures (Fig. 4). These observations sup-
port the notion that PR fulfils a phototrophic function in marine bacteria.
Figure 4. RT–PCR analysis of PR expression in MED134 compared with
16S rRNA levels. PR was expressed preferentially in the light. Bacteria were
grown in natural sterile filtered and autoclaved seawater exposed to light
or in the dark. Numbers indicate days since inoculation; D, dark incubation;
L, light incubation. 13D + L denotes a sample incubated for 10 days in the
dark followed by 3 days in the light. M, DNA size marker; bp, base pairs.
We further investigated how different concentrations of dissolved organic matter (DOM, as pep-
tone and yeast extract) affected the growth of MED134 (Fig. 3c). In cultures with artificial seawater
without enrichment (0.06 mM C) little growth was observed in either light or darkness, whereas
enrichment with DOM corresponding to 0.14 or 0.39 mM C (final concentration) resulted in bac-
terial cell yields about fourfold higher in light cultures. Greater enrichment (0.74 or 1.10 mM C)
gave yields about 2.5-fold higher in the light cultures, whereas in full-strength medium (242 mM
C) similar bacterial cell yields were observed in both light and dark conditions. In addition, cells
grown in light-exposed cultures seemed larger than those in dark cultures (Fig. 1d, e).
Thus, exposure to light confers a stronger selective advantage when MED134 grows at low or in-
termediate concentrations of labile organic matter, closer to those found in marine surface waters,
than in richer media. It is noteworthy that Dokdonia sp. MED134 thrives in conditions under which
resources are abundant, whereas P. ubique, in which PRs have been suggested to have a subtle func-
tion6, grows only under oligotrophic conditions.

Light stimulates growth of proteorhodopsin-containing marine Flavobacteria
136
Factors limiting its growth have yet to be identified6. These findings emphasize the need to clarify
the intricate relationships between a PR-mediated light response, and the availability and composi-
tion of organic matter for typically oligotrophic bacteria, in comparison with bacteria adapted to
eutrophic environments.
Members of the Bacteroidetes phylum in general, and Flavobacteria in particular, are important
in the degradation of organic matter during and after algal blooms in the sea18–20. Our findings
indicate that phototrophy may allow these organisms to maintain net growth during periods when
concentrations of organic matter are declining. If this were true for other PR-bearing bacterio-
plankton, PR-mediated photoheterotrophy would increase their growth efficiency. An interesting
consequence is that, for a given amount of DOM, bacterial assemblages dominated by species
expressing genes encoding PR would produce more biomass than assemblages of bacteria lacking
PR, making it available to higher trophic levels in the marine microbial food web.
Phototrophism has now been found in all main microbial groups in the sea. These include eukary-
otic algae and cyanobacteria performing chlorophyll a-driven photosynthesis, Proteobacteria using
bacteriochlorophylls for generating energy21–23, and Proteobacteria1,3 -and now also Bacteroidetes-
using PR. The phylogenetic diversification and wide geographic distribution of genes for PR in the
world’s oceans indicate that evolution has favoured organisms with the potential to complement
their chemotrophic life style by phototrophy3,24–26. Surface and near-surface marine microorgan-
isms are bathed in light and it is therefore not surprising that diverse strategies have evolved to
exploit such an abundant energy source.

Chapter 5
137
METHODS
Isolation of Flavobacteria strains. Bacteria were isolated from Northwest Mediterranean
Sea surface water (0.5 m depth) collected 1 km off the Catalan coast at the Blanes Bay Microbial
Observatory (41º 40’ N, 2º 48’ E, Spain). Strains MED134 and MED152 were isolated from Zo-
Bell agar plates inoculated on 20 March 2001, and strain MED217T on 23 May 2001.
Sequencing, annotation and phylogenetic analysis. Whole-genome sequencing was per-
formed by the J. Craig Venter Institute through the Gordon and Betty Moore Foundation initia-
tive in Marine Microbiology (https://research.venterinstitute.org/moore/). PR sequences were
aligned by using ClustalW, and a Neigbour-Joining phylogenetic tree was constructed (see Supple-
mentary Methods).
Seawater culture experiments. For the natural seawater experiment, water from the North
Sea was mixed with aged seawater from the North Atlantic. For the DOM gradient experiment,
artificial seawater (35 practical salinity units, prepared from Sea Salts; Sigma) was enriched with
peptone and yeast extract. All cultures were enriched with N and P to avoid inorganic nutrient
limitation. Cultures were incubated under continuous light (180 µmol photons m-2 s-1) or in the
dark at 20 ºC. Dissolved organic carbon was measured with a high-temperature carbon analyser.
Bacteria were counted by epifluorescence microscopy. For details see Supplementary Methods.
Expression analysis. RNA were extracted and purified from cell pellets with RNAqueous-
4PCR Kit (Ambion Inc.). mRNA was reverse transcribed with the two-step protocol of RETRO-
script Kit (Ambion Inc.) and a MED134 PR-specific primer set. For details see Supplementary
Methods.
Author Information. The genomes of strains MED134, MED152 and MED217 are deposited
in GenBank under accession numbers AAMZ00000000, AANA00000000 and AANC00000000,
and their 16S rRNA gene sequences under accession numbers DQ481462, DQ481463 and
DQ294290, respectively. The amino acid sequences of MED134 and MED152 PR are deposited
in GenBank under accession numbers ZP_01049273 and ZP_01054176.
ACKNOWLEDGEMENTS
We thank S. Arnautovic, J. O. Ekström, M. Widell, E. Lundberg and E. Lindehoff for help with
growth experiments, ultracentrifugation, cloning, dissolved organic carbon and nutrient analysis,
respectively, and T. Berman for helpful comments on the manuscript. We thank the Swedish Sci-
ence Council, the Spanish Ministerio de Educación y Ciencia, Swegene, EMEP, and SSF for sup-
porting this research.

Light stimulates growth of proteorhodopsin-containing marine Flavobacteria
138
REFERENCES
1. Béjà, O. et al. Bacterial rhodopsin: evidence for a new type of phototrophy in the sea. Science
289, 1902–1906 (2000).
2. Béjà, O., Spudich, E. N., Spudich, J. L., Leclerc, M. & DeLong, E. F. Proteorhodopsin photot-
rophy in the ocean. Nature 411, 786–789 (2001).
3. de la Torre, J. R. et al. Proteorhodopsin genes are distributed among divergent marine bacterial
taxa. Proc. Natl Acad. Sci. USA 100, 12830–12835 (2003).
4. Sabehi, G. et al. Novel proteorhodopsin variants from the Mediterranean and Red Seas. Envi-
ron. Microbiol. 5, 842–849 (2003).
5. Venter, J. C. et al. Environmental genome shotgun sequencing of the Sargasso Sea. Science 304,
66–74 (2004).
6. Giovannoni, S. J. et al. Proteorhodopsin in the ubiquitous marine bacterium SAR11. Nature
438, 82–85 (2005).
7. Man, D. et al. Diversification and spectral tuning in marine proteorhodopsins. EMBO J. 22,
1725–1731 (2003).
8. Sabehi, G. et al. New insights into metabolic properties of marine bacteria encoding proteorho-
dopsins. PLoS Biol. 3, e273 (2005).
9. Giovannoni, S. & Rappé, M. in Microbial Ecology of the Oceans (ed. Kirchman, D.) 47–84
(Wiley-Liss, New York, 2000).
10. Glöckner, F. O., Fuchs, B. M. & Amann, R. Bacterioplankton composition of lakes and oceans:
a first comparison based on fluorescence in situ hybridization. Appl. Environ. Microbiol. 65,
3721–3726 (1999).
11. Hagström, A°. et al. Use of 16S ribosomal DNA for delineation of marine bacterioplankton
species. Appl. Environ. Microbiol. 68, 3628–3633 (2002).
12. Kirchman, D. L. The ecology of Cytophaga–Flavobacteria in aquatic environments. FEMS
Microbiol. Ecol. 39, 91–100 (2002).
13. Rappé, M. S., Connon, S. A., Vergin, K. L. & Giovannoni, S. J. Cultivation of the ubiquitous
SAR11 marine bacterioplankton clade. Nature 418, 630–633 (2002).

Chapter 5
139
14. Dioumaev, A. K. et al. Proton transfers in the photochemical reaction cycle of proteorhodop-
sin. Biochemistry 41, 5348–5358 (2002).
15. Wang, W.-W., Sineshchekov, O. A., Spudich, E. N. & Spudich, J. L. Spectroscopic and pho-
tochemical characterization of a deep ocean proteorhodopsin. J. Biol. Chem. 278, 33985–33991
(2003).
16. Neutze, R. et al. Bacteriorhodopsin: a high-resolution structural view of vectorial proton trans-
port. Biochim. Biophys. Acta 1565, 144–167 (2002).
17. Teramoto, M., Takaichi, S., Inomata, Y., Ikenaga, H. & Misawa, N. Structural and functional
analysis of a lycopene L-monocyclase gene isolated from a unique marine bacterium that produces
myxol. FEBS Lett. 545, 120–126 (2003).
18. Abell, G. C. J. & Bowman, J. P. Ecological and biogeographic relationships of class Flavobac-
teria in the Southern Ocean. FEMS Microbiol. Ecol. 51, 265–277 (2005).
19. Pinhassi, J. et al. Changes in bacterioplankton composition under different phytoplankton regi-
mens. Appl. Environ. Microbiol. 70, 6753–6766 (2004).
20. Riemann, L., Steward, G. F. & Azam, F. Dynamics of bacterial community composition and
activity during a mesocosm diatom bloom. Appl. Environ. Microbiol. 66, 578–587 (2000).
21. Shiba, T., Simidu, U. & Taga, N. Distribution of aerobic bacteria which contain bacteriochlo-
rophyll a. Appl. Environ. Microbiol. 38, 43–48 (1979).
22. Kolber, Z. S., Van Dover, C. L., Niederman, R. A. & Falkowski, P. G. Bacterial photosynthesis
in surface waters of the open ocean. Nature 407, 177–179 (2000).
23. Béjà, O. et al. Unsuspected diversity among marine aerobic anoxygenic phototrophs. Nature
415, 630–633 (2002).
24. Bielawski, J. P., Dunn, K. A., Sabehi, G. & Béjà, O. Darwinian adaptation of proteorhodopsin
to different light intensities in the marine environment. Proc. Natl. Acad. Sci. USA 101, 14824–
14829 (2004).
25. Frigaard, N.-U., Martinez, A., Mincer, T. J. & DeLong, E. F. Proteorhodopsin lateral gene
transfer between marine planktonic Bacteria and Archaea. Nature 439, 847–850 (2006).
26. Sabehi, G., Béjà, O., Suzuki, M. T., Preston, C. M. & DeLong, E. F. Different SAR86 sub-
groups harbour divergent proteorhodopsins. Environ. Microbiol. 6, 903–910 (2004).

Light stimulates growth of proteorhodopsin-containing marine Flavobacteria
140
Supplementary Figure 1. Proteorhodopsin amino acid sequence alignment. Multiple alignment of the predicted
amino acid sequences of PR in Dokdonia sp. MED134 and Polaribacter sp. MED152 compared to tentative Bacteroidetes
orthologs and SAR86 and P. ubique sequences. Predicted transmembrane regions are marked by boxes with solid lines.
Gray shading indicates conserved amino acid positions. Key amino acids for PR functionality are marked by colours:
Asp97 and Glu108 in yellow, Met, Leu or Gln at position 105 in red, and Lys230 in light blue (SAR86 eBAC31A08
numbering). Amino acid positions predicted to be part of the retinal binding pocket are marked by arrows. Accession
numbers and phylogenetic relationships of the sequences are presented in Fig. 2. Amino acid sequences were aligned
using Clustal W. Predicted transmembrane regions were identified using TMpred, based on a statistical analysis of TMbase.
SUPPLEMENTARY INFORMATION
Supplementary figures
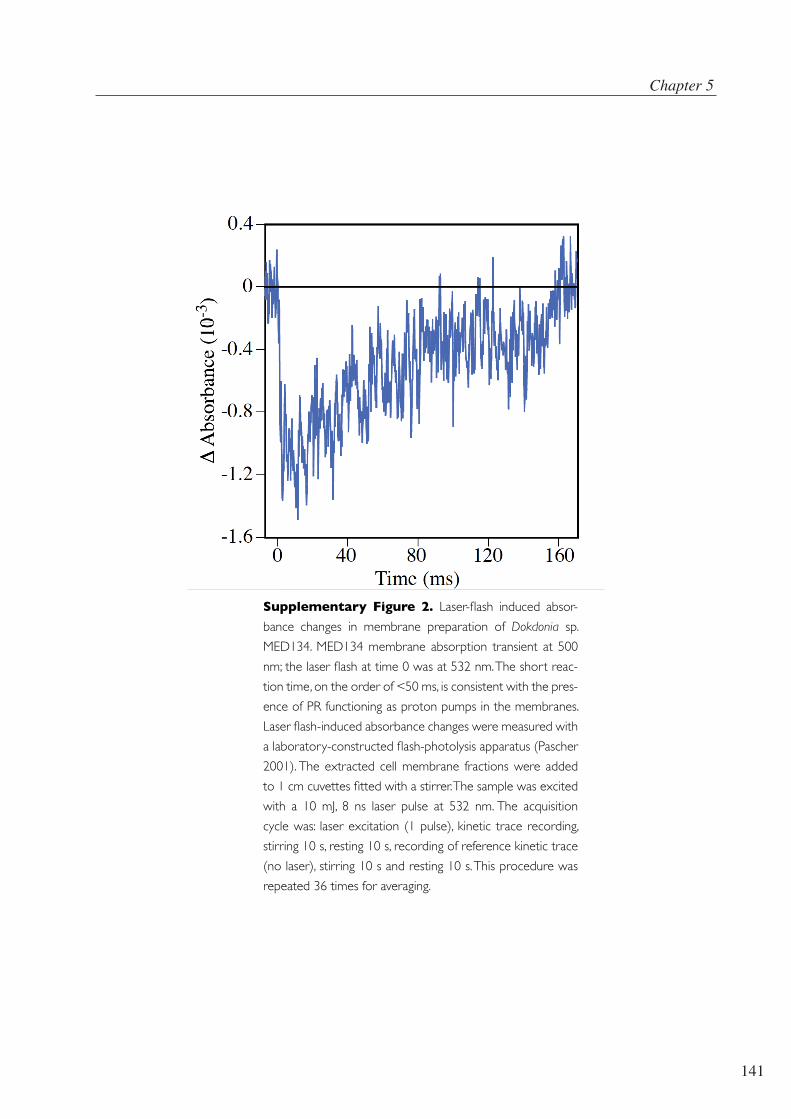
Chapter 5
141
Supplementary Figure 2. Laser-flash induced absor-
bance changes in membrane preparation of Dokdonia sp.
MED134. MED134 membrane absorption transient at 500
nm; the laser flash at time 0 was at 532 nm. The short reac-
tion time, on the order of <50 ms, is consistent with the pres-
ence of PR functioning as proton pumps in the membranes.
Laser flash-induced absorbance changes were measured with
a laboratory-constructed flash-photolysis apparatus (Pascher
2001). The extracted cell membrane fractions were added
to 1 cm cuvettes fitted with a stirrer. The sample was excited
with a 10 mJ, 8 ns laser pulse at 532 nm. The acquisition
cycle was: laser excitation (1 pulse), kinetic trace recording,
stirring 10 s, resting 10 s, recording of reference kinetic trace
(no laser), stirring 10 s and resting 10 s. This procedure was
repeated 36 times for averaging.

Light stimulates growth of proteorhodopsin-containing marine Flavobacteria
142
Supplementary Figure 3. Arrangement of proteorhodopsin, ß-carotene and retinal synthesis genes. Position of
proteorhodopsin (PR) genes and the putative blh homologs in Flavobacteria strains MED134 and MED152 compared to
other marine bacteria. Genes marked in red denote crtEBIY, predicted to code for geranylgeranyl diphosphate synthase,
phytoene synthase, phytoene desaturase and lycopene β-cyclase, respectively, needed to synthetize β-carotene from
farnesyl diphosphate (FPP) and isopentenyl diphosphate (IPP). crtZ codes for a putative carotene hydroxylase probably
involved in the synthesis of zeaxanthin. Furthermore, MED152 contains crtD (methoxyneurosporene dehydrogenase)
and crtA (spheroidene monooxygenase) homologs. Strains MED134 and MED152 both contain a putative transcriptional
regulator (MerR family, marked in yellow) in front of crtI. The genes dxs, IPP isomerase and lytB are involved in the synthe-
sis of FPP and IPP precursors. Strain MED217T, used as control in the present study, also contained the genes crtEBIYZ,
but lacked PR and blh homologs. Interestingly, among the Bacteroidetes, the PR and blh genes are located next to each
other but are transcribed divergently. Among other bacteria these genes are found separately and are transcribed in the
same direction. Scale bar denotes 1400 base pairs.

Chapter 5
143
Supplementary methods
Annotation and phylogenetic analysis. Open reading frames were predicted and autoanno-
tated using GenDB (Meyer et al. 2003). In addition, all relevant genes discussed here were manu-
ally annotated. For the phylogenetic analysis of PR, amino acid sequences were aligned using
Clustal W, and a tree was constructed based on a Kimura’s distance matrix and the Neighbour-
Joining method using the PHYLIP package (Version 3.2) (Felsenstein 1989). For the phylogenetic
tree, the Halobacterium salinarum S9 bacteriorhodopsin was used as outgroup (not shown in Fig. 2).
Seawater culture experiments. For the experiment with natural seawater, water collected in
the North Sea was mixed with an equal volume of aged seawater from the North Atlantic. For each
culture, 1.5 litres of seawater, used as growth medium, was filter-sterilized through a 0.2 μm-pore-
size filter (Sterivex; Millipore) and autoclaved. For the DOM gradient experiment, an artificial
seawater medium (Sea Salts; Sigma: salinity 35 psu) was filter-sterilized through 0.2 μm-pore-size
filters (Sterivex; Millipore) and autoclaved. Cultures of 520 ml each were enriched with 0, 0.23,
0.74, 1.48 and 2.25 ml of full strength medium (5 g peptone [Bacto Peptone; BD] and 1 g yeast ex-
tract [Bacto Yeast Extract; Difco] in 1 l artificial seawater). For the coloured light experiment, cul-
tures were grown in artificial seawater at a DOC concentration of 0.14 mM C. Blue (400-500 nm),
green (490-570 nm) and red (600-800 nm) light were obtained using coloured filters (HQ Power).
Cultures were maintained in polycarbonate bottles (Nalgene). The natural seawater cultures re-
ceived final concentrations of 2.1 μM NH4Cl and 0.3 μM Na2HPO4 to avoid inorganic nutrient
limitation. In the DOM gradient experiment, N and P were further supplied by the added me-
dium (36-285 μM N and 0.6-3.4 μM P). Cultures were inoculated with bacteria previously grown
in seawater. Light cultures were incubated under an artificial light source (180 μmol photons m-2
s-1) at 20°C. All material in contact with the samples was rinsed with 1 M hydrochloric acid and
extensively washed with MilliQ-water prior to use.
Dissolved organic carbon (DOC) was measured with a high temperature carbon analyzer (Shi-
madzu TOC 5000) on samples filtered through 0.2 μm-pore-size polycarbonate filters (Supor-200;
Gelman Sciences) and acidified with 16 mM HCl (final concentration).
For bacterial counts, samples were fixed with 0.2 μm-pore-size filtered formaldehyde (4%, final
concentration), stained with SYBR Gold (1:100 dilution, Molecular Probes), filtered onto black
0.2 μm-pore-size polycarbonate filters (Poretics, Osmonics Inc.) and counted by epifluorescence
microscopy within 48 hours.
Light stimulates growth of proteorhodopsin-containing marine Flavobacteria
144
Cloning, production and determination of the absorption spectrum of proteorho-
dopsin from Dokdonia sp. MED134. The PR gene was cloned from MED134 cells using
PCR, incorporating a C-terminal 6xHis-tag. The amplified fragment was inserted into the pBAD-
TOPO vector (Invitrogen) and subsequently transformed into the E. coli outer membrane pro-
tease-deficient strain UT5600. PR was over-produced in cells grown at 37°C and induced at an
optical density (600 nm) of 2 with 1.25 g l-1 L(+)-arabinose and 1.5 mg l-1 all trans-retinal for 16
hours. The cells were disrupted with a French Press (Thermo Spectronic) at 1,500 psi, additional
all trans-retinal was added (1 mg retinal per gram of cells), and the membrane fractions were
collected by centrifugation at 150,000 g for 90 min. Membranes were then solubilised in n-octyl-
β-d-glucopyranoside (Anatrace). Extracted histidine-tagged PR was purified with affinity column
chromatography using Chelating Sepharose Fast Flow (GE Healthcare) immobilized with Ni2+.
The column with bound PR was washed using 35 mM imidazole and PR was subsequently eluted
using 150 mM imidazole. Subsequent ion exchange chromatography resulted in a peak contain-
ing PR from which the absorption spectrum could be determined after the fractions had been
concentrated in Vivaspin concentration tubes (Sartorius) to 100 μl. The absorption spectrum was
measured in a Shimadzu UV-1601 spectrophotometer, using the same buffer as in the last purifica-
tion step as a baseline.
RNA extraction and purification. Cells were harvested from seawater cultures by pipetting
10 ml samples into 15-ml tubes on ice. Samples were centrifuged and the pellets were stored
with 0.5 ml RNAlater® (Ambion Inc., Austin, TX) at –80 ºC. For RNA extraction, samples were
thawed on ice. The RNAlater was discarded and the pellet was washed in PBS 1X. A total of 500
μl of lysis/binding solution provided by the RNAqueous®-4PCR kit (Ambion, Inc.) were added
to the cells. The samples were transferred to 2 ml screw-cap microcentrifuge tubes containing 1.2
g of 100-μm-diameter zirconia-silica beads (BioSpec Products, Inc.). Samples were mechanically
disrupted in a Mini-beadbeater-8TM cell disrupter (BioSpec Products Inc., Bartlesville, OK). After
disruption, samples were incubated on ice for 5 min and the beads were allowed to settle out of
the lysis mixture. The lysate was clarified by centrifugation and the aqueous phase was transferred
to a new tube. An equal volume of 64% ethanol was added to the lysate and samples were puri-
fied according to the RNAqueous®- 4PCR Kit. The isolated total RNA was treated with DNase
I - RNase-free (Ambion Inc.). RNA preparations were checked for DNA contamination with PCR
using primers 358F and 907RM for the 16S rRNA gene. Total RNA was quantified by spectro-
photometry at 260 nm.
Chapter 5
145
Reverse transcriptase-PCR. A proteorhodopsin primer set was designed to amplify a 349-
bp fragment of the Dokdonia sp. MED134 PR gene. The sequence of forward primer 238F was
5’-GCAAGCAAATGCTGAGTCAC-3’ and the sequence of reverse primer 548R was 5’- AATT-
GCCCATCCCACAAGTA-3’. This primer set was designed to amplify a 349-bp fragment of
the MED134 proteorhodopsin gene. Total RNA was used to reverse-transcribe proteorhodopsin
mRNA into cDNA using primer 548R and the two-step protocol of the RETROscript® Kit (Am-
bion Inc.). To denature any secondary structures, aliquots of each of the RNA extracts and primer
548R were heated for 3 min at 75 ºC and immediately placed on ice before they were mixed with
the final reaction solution (20 μl). 2 μl of the RT reaction product were used in a subsequent PCR.
The PCR amplification conditions were as follows: 94 ºC for 2 min, and then 40 cycles of 94 ºC
for 30 s, 55 ºC for 30 s, and 72 ºC for 40 s and finally 1 cycle of 72 ºC for 5 min. As positive RNA
controls, 16S ribosomal RNA was reverse transcribed and thereafter amplified with bacterial 16S
rRNA gene-specific primers 358F (5’-CCTACGGGAGGCAGCAG-3’) and 907RM (5’-CCGT-
CAATTCA/CTTTGAGTTT-3’). The same amplification protocol as for the PR reaction was
used, except that the number of cycles was reduced to 25. PCR products were analyzed by agarose
gel electrophoresis (Fig. 4).
Supplementary notes.
Felsenstein, J. PHYLIP-Phylogeny Inference Package. Cladistics 5, 164-166 (1989).
Meyer, F. et al. GenDB – an open source genome annotation system for prokaryote genomes. Nucl.
Acids Res. 31, 2187-2195 (2003).
Pascher, T. Temperature and driving force dependence of the folding rate of reduced horse heart
cytochrome c. Biochemistry 40, 5812-5820 (2001).

147
CONSIDERACIONS FINALS
L’eix central d’aquesta tesi és el desenvolupament i aplicació del mètode de fingerprinting dels RNA
missatgers, el Transcriptome Fingerprinting Analysis (TFA) en comunitats de microorganismes marins.
L’estudi de l’expressió gènica en comunitats marines es va iniciar encara no fa 10 anys i aquesta
tesi s’iniciava en les primeres hores de l’albada de la metatranscriptòmica. En concret, aquesta tesi
queda emmarcada pel tret de sortida de l’article de Poretsky et al. (Poretsky et al., 2005) publicat
l’any 2005 i els nous mètodes de recollida de mostres que suposen un canvi substancial a l’hora
de superar el principal repte que ha tingut fins ara qualsevol dels estudis que tractaven amb RNA
missatger en comunitats marines.
Poretsky et al. va realitzar el primer estudi d’anàlisi de l’expressió gènica del bacterioplàncton marí
i d’aigua dolça. Va recuperar els RNA missatgers, els va convertir en el seu corresponent DNA
complementari a través de la transcripció reversa, va fer una biblioteca de clons i després els va se-
qüenciar. Va determinar els gens actius in situ sense fer suposicions prèvies sobre quins gens podrien
ser els més expressats. A partir de llavors, els avenços en les tecnologies de seqüenciació de nova
generació van anar en augment i darrere d’aquests avenços van sorgir un seguit d’estudis a remolc
de les últimes novetats tecnològiques.
Els primers estudis de metatranscriptòmica van ser majoritàriament descriptius. Examinaven les
diferències en transicions temporals o espacials en diferents tipus d’hàbitats (Frías-López et al.,
2008; Gilbert et al., 2010; Hewson et al., 2010; Poretsky et al., 2009; Stewart et al., 2012). Alguns
d’aquests estudis van anar més enllà del fet purament descriptiu per analitzar les diferències d’ex-
pressió en diverses manipulacions experimentals (Gilbert et al., 2008; Poretsky et al., 2010; Vila-
Costa et al., 2010).
El factor clau que marca totes les decisions i resultats posteriors en tot estudi d’expressió gènica
d’una comunitat és el temps de mostreig i la biomassa que es recull durant aquest temps. És vital
minimitzar el temps entre la recollida de les mostres i la filtració (en el cas que es filtri i no es fixi
directament) fins a tenir els filtres congelats o en tampó de lisi, degut a la rapidesa amb què l’RNA
missatger es pot degradar o simplement canviar degut a les variacions dels estímuls externs.
Recentment, per tal de solventar aquest problema, s’han enginyat diferents artilugis de mostreig.
El primer que es va idear i aplicar va ser el descrit en l’article de Feike et al. (Feike et al., 2012).
L’aparell permet la fixació in situ de les mostres d’aigua al precís moment del seu mostreig. Per una
mostra generen un volum de 3L d’aigua contaminada o bé amb fenol o bé amb cloroform.
148
El problema d’aquest invent és que si es necessiten grans volums d’aigua o s’han de processar
moltes mostres, el volum de residus generat és insostenible. Però per masses d’aigua amb abun-
dants biomasses potser sí que el balanç pot sortir a compte.
Un altre aparell que s’ha utilitzat per estudiar l’expressió gènica del bacterioplàncton marí és el
Processador de Mostres Ambiental (ESP, de Environmental Sample Processor). L’ESP (Scholin et al.,
2009) consisteix en un sistema electromecànic/fluídic dissenyat per recollir mostres d’aigua, con-
centrar els microorganismes, i automatitzar l’aplicació de tecnologies moleculars in situ. Ottesen et
al. (Ottesen et al., 2011) va utilitzar aquest aparell preservant les mostres amb RNA later i va veure
que era una bon mètode per caracteritzar els gens expressats. Ottesen et al. (Ottesen et al., 2013)
també va usar aquesta plataforma robòtica per descriure l’expressió gènica del plàncton microbià
durant un període de 2 dies, i van veure que els diferents grups microbians del plàncton coordi-
naven la seva expressió al llarg del temps. Per una banda, el picoplàncton fotosintètic exhibia forts
ritmes circadians coordinant l’expressió de milers de trànscrits expressats en sincronia. D’altra
banda, els trànscrits dels organismes heteròtrofs no ciclaven circadiàriament, però també mos-
traven una expressió sincrònica entre espècies de molts dels seus gens a través del temps, sobretot
d’aquells gens associats al creixement i a l’adquisició de nutrients.
Per acabar amb el ventall d’invents de mostreig, el grup de Grossart va idear l’anomenat “in situ fil-
tration and fixation sampler” (IFFS) (Wurzbacher et al., 2012). Aquest instrument permet mostre-
jar a totes les profunditats i disposa d’un sistema ràpid de filtració in situ que permet reduir enorme-
ment el volum de fixador, així només cal fixar el cartutx del filtre i no cal generar un volum ingent
d’aigua contaminada. Aquest aparell, per tant, és ideal per mantenir les condicions in situ de la
mostra i a més a més no és car i pot ser construït amb els plànols proporcionats pels autors.
Fins i tot, amb aquests nous artilugis s’han arribat a realitzar PCRs i d’altres tècniques de biologia
molecular in situ. En l’estudi de Preston (Preston et al., 2011) utilitzen l’anteriorment esmentat Pro-Pro-
cessador de Mostres Ambiental (ESP) per assignar abundàncies de gens de forma autonòma, sota
l’aigua i gairebé en temps real.
Amb totes aquestes eines a l’abast, en aquests darrers anys els protocols per veure l’expressió gèni-
ca de comunitats de microorganismes marins s’han anat perfilant i optimitzant pas a pas i podem
dir que actualment disposant de tots els mitjans a l’abast, es pot fer un mostreig i anàlisi tal com
Déu mana (cosa que no es podia dir fa escassos anys).

149
Nosaltres vam iniciar la posada a punt del protocol de fingerprinting de l’mRNA en paral·lel a
l’adveniment de la metatrascriptòmica. Moltes de les decisions que es van prendre en el seu mo-
ment (com quin tipus de filtre utilitzar, temps de filtració, volum filtrat, mètodes per preservar les
mostres, protocols d’extracció, trencament de les cèl·lules, tipus de transcriptasa reversa, mètode
de detecció dels productes de PCR, i un llarg etc.) per posar a punt l’extracció d’RNA total i el
TFA en un camp que tot just s’estava desplegant han acabat resultant majoritàriament encertades
i d’aplicació comuna en els protocols d’expressió gènica de les comunitats marines. L’únic que
considerem com a francament millorable és el mètode de mostreig, que es podria solventar amb
un d’aquests artilugis descrits anteriorment.
Diverses van ser les provatines a l’hora de desenvolupar el TFA abans d’arribar a un protocol
estandaritzat. Comentaré breument algunes de les proves metodològiques que no consten en cap
dels articles i que poden respondre a alguna de les preguntes de tot aquell que s’inicïi en el món de
l’RNA missatger.
Maneres de preservar l’RNA, com, i quina funciona millor
L’obtenció d’RNA de bona qualitat és un dels passos més crítics per tal de realitzar la resta
d’experiments. L’RNA missatger és aproximadament un 5% de l’RNA total d’una cèl·lula i és
molt sensible als canvis i a la degradació, per això és de vital importància treballar en condicions
lliures d’RNases, uns enzims presents a tot arreu que degraden l’RNA.
Es van provar diferents maneres de preservar els filtres un cop filtrades les mostres: I) Amb tampó
de lisi de diferents kits, II) Amb TRI reagent/TRIZOL, III) Flash-freeze directe amb nitrogen líquid
i posterior emmagatzematge a -80ºC i finalment IV) RNA later.
De les diferents proves, la que ha donat més bons resultats en mostres marines és quan es preserva
el filtre amb tampó de lisi (el que va donar més rendiment és el tampó de lisi del Qiagen RNeasy
Mini kit). L’ús de TRI reagent o TRIZOL funciona molt bé quan disposes de grans biomasses (per
exemple de teixits), les quals són gairebé impossibles d’aconseguir en les mostres de picoplàncton
marí. Aplicar un protocol d’extracció en fases en aquest tipus de mostra és molt delicat. L’opció de
congelació directa també funciona molt bé (tot i que amb un xic menys de rendiment que preser-
vant els filtres amb tampó de lisi) i és més pràctica a l’hora de recollir mostres, sobretot si estàs en
una campanya oceanogràfica (en aquesta tesi s’ha acabat optant per aquesta opció en la majoria
de mostres). Tot i els grans avantatges que té l’RNA later hem pogut comprovar en vàries ocasions
que el rendiment que se n’obté és bastant més baix i és més tediós, ja que la mostra necessita de
varis rentats previs abans de procedir amb el protocol d’extracció. Tot i així és una bona opció

150
per preservar les mostres d’RNA, i si després t’és possible amplificar l’RNA de forma lineal no té
perquè ser un problema el rendiment més baix que se n’obté.
La ruptura completa de les cèl·lules per tal d’alliberar els àcids nucleics és un pas fonamental. Es
va comprovar experimentalment que la quantitat d’RNA obtinguda és major quan sotmetem les
cèl·lules a una ruptura mecànica. Per això afegim una quantitat concreta de boles de zirconi/silica
o vidre (depenent del tipus de cèl·lula a lisar) juntament amb un volum de tampó de lisi i s’agita
la mescla vigorosament durant uns minuts amb un Vortex. Un altre punt bàsic a l’hora de fer RT-
PCR és degradar completament el DNA genòmic de la preparació total d’RNA. La presència de
petites quantitats de DNA pot generar posteriors falsos positius durant la PCR. Per assegurar-nos
que no queda cap traça de DNA genòmic després de cada extracció d’RNA s’ha digerit la mostra
amb una DNasa.
Reacció de transcripció reversa
La reacció de transcripció reversa la podem fer de vàries maneres depenent del que ens interessi
amplificar després. En el cas del protocol de TFA, com que ens interessa retrotranscriure el màxim
d’RNA missatgers possibles, s’han utilitzat encebadors oligo(dT) que s’uneixen a la zona 3’ dels
missatgers dels eucariotes (cua poliA). En el cas de la detecció específica d’un gen, en aquest cas el
de la proteorodopsina, es va dissenyar una parella d’encebadors específics (vegeu el protocol detal-
lat al capítol V) i es va utilitzar l’encebador invers per portar a terme la retrotranscripció de l’RNA
missatger del gen de la proteorodopsina.
El pas de la RT afegeix molta més variabilitat que no pas la PCR, és doncs en aquest pas on es
va intentar millorar la reproductibilitat del TFA. Un dels factors que vam veure que va ser clau a
l’hora de millorar la reproductibilitat dels patrons va ser el tipus de transcriptasa reversa utilitzada.
Vam provar tres transcriptases reverses diferents, cadascuna amb unes propietats característiques.
De totes les proves fetes, es va veure que utilitzant la transcriptasa reversa termoestable Super-
scriptTM, el patró obtingut amb la mateixa mostra a diferents concentracions i la mateixa combi-
nació d’encebadors passava de ser no reproduïble a reproduïble (al portar a terme la reacció a una
temperatura més elevada augmenta l’especificitat).
Valoració del Transcriptome Fingerprinting Analysis
El TFA és una tècnica sensible, ja que es necessiten quantitats inicials molt petites d’RNA total.
És reproduïble, i molt versàtil; permet aconseguir una ampla representació de fragments de gens
expressats diferencialment en múltiples condicions.

151
Ara bé, si el que es vol és identificar els gens expressats diferencialment això ja són figues d’un
altre paner. La identificació i confirmació dels gens expressats diferencialment requereix de dife-
rents passos: primer cal córrer un gel desnaturalitzant de poliacrilamida per visualitzar les bandes
i després tallar les d’interès. Aquest mateix pas, ja no és tan senzill, de fet es van fer varis intents
infructuosos. Després cal reamplificar els amplicons i finalment confirmar els gens expressats dife-
rencialment, preferencialment amb RT qPCR (es podria fer també per Northern blot o reverse
Northern).
Un altre inconvenient a l’hora d’identificar els amplicons és el tamany mateix de l’amplicó (fins
a 500bp). Com que l’encebador reverse usat en el TFA s’uneix al costat de la cua poliA, la majoria
de productes corresponen a la regió 3’ no traduïda del gen (3’UTRs, de l’anglès “untranslated
region”). Aquestes regions normalment no són molt útils a l’hora de comparar seqüències contra
gens coneguts de les bases de dades, ja que les bases de dates normalment no contenen la infor-
mació de les regions 3’UTR i també perquè els gens homòlegs difereixen força en la seva regió
3’UTR.
Tot això ens porta a la següent conclusió: El TFA com a mètode per identificar gens expressats
diferencialment pot arribar a ser força complicat però és una bona eina a l’hora d’obtenir patrons
globals d’expressió per comparar múltiples condicions.
La robustesa del mètode es basa en què permet comparar un conjunt força nombrós de gens ex-
pressats en situacions molt diverses i això permet delimitar diferents tipus de transicions. Per tant,
el TFA pot ser especialment útil en aquests últims temps de febre seqüenciadora per tal de destriar
les mostres que més diferències presenten entre elles (un exemple de megaprojecte de sequenciació
és el Earth Microbiome Project http://earthmicrobiome.org en el qual estant portant a terme un
estudi pilot on hi ha previst seqüenciar els metagenomes de 200.000 mostres ambientals!). Donat
l’allau d’informació per cada mostra seqüenciada és de vital importància escollir d’entrada les
mostres més representatives.
Donat que en el món microbià és gairebé impossible assignar un microorganisme a una espècie
determinada (perquè una espècie tradicional sigui ben definida, cal que els seus gens flueixin ver-
ticalment, i aquest no és el cas), a més a més d’investigar la distribució dels components de les co-
munitats, una bona alternativa a l’hora de classificar els microbis és mirar la distribució en l’espai
i el temps dels seus trets funcionals, és a dir, la similitud en el seu estil de vida (Green, Bohannan,
& Whitaker, 2008). Les unitats taxonòmiques individuals evolucionen i s’extingeixen, però les mà-Les unitats taxonòmiques individuals evolucionen i s’extingeixen, però les mà-
quines responsables de les funcions principals per sobreviure i adaptar-se a un determinat medi
romanen sorprenentment impertorbables (Falkowski, Fenchel, & Delong, 2008).

153
CONCLUSIONS
Les conclusions generals d’aquesta tesi són:
1) Hem demostrat que el mètode de fingerprinting d’RNA missatger desenvolupat en aquesta
tesi (el Transcriptome Fingerprinting Analysis) és eficient a l’hora d’explorar la dinàmica dels patrons
d’expressió gènica en comunitats naturals de microorganismes marins i també en cultius sotmesos
a diferents condicions. El mètode és especialment útil quan s’han de comparar un gran nombre de
condicions o tractaments.
2) Incloure tots els pics en els electroferogrames de TFA i ARISA redueix substancialment la dife-
renciació entre les mostres. Els pics de baixa intensitat actuen com un tampó tant en la composició
de les comunitats com en els patrons d’expressió gènica.
Amb l’aplicació d’aquest mètode i comparant-lo amb els patrons obtinguts amb ARISA del DNA de
la comunitat hem pogut veure que:
3) Les comunitats naturals de picoplàncton eucariota i els seus patrons d’expressió reocorren de
forma estacional, produïnt-se les principals diferències entre estiu i hivern.
4) Durant l’hivern, els patrons d’expressió gènica són més variables que la composició de la co-
munitat. En canvi, durant l’estiu la composició de la comunitat varia més que no pas els patrons
d’expressió, la qual cosa suggereix redundància funcional en les comunitats estivals de picoeucari-
otes.
5) Les comunitats de picoeucariotes de superfície i els seus patrons d’expressió són similars al llarg
d’un transecte de 100 km, però canvien radicalment al llarg dels perfils verticals. L’estructura de la
comunitat és més estable que els seus patrons d’expressió.
En aquesta tesi també s’ha explorat la manera com la llum interacciona amb els microorganismes de dues
maneres diferents: i) veient el canvi transcripcional global d’un microorganisme del grup dels Roseobacter a la
llum i ii) monitoritzant l’expressió de proteorodopsina en una Flavobacteria. Hem conclòs que:
6) Els receptors de la llum de l’heteròtrof Ruegeria promouen l’activació d’una sèrie de gens in-
volucrats en protegir la cèl·lula del dany oxidatiu en resposta a l’estrés generat per la llum, en
concret la llum blava. La llum blava i la UV també activen l’expressió d’un gen involucrat en ad-
hesió cel·lular, segurament important perquè el bacteri pugui associar-se amb el seu dinoflagel·lat
preferit i pugui accedir als recursos que aquest genera en presència de llum.

154
7) L’expressió de proteorodopsina va ser estimulada en condicions de llum i no en condicions
de fosca. La transferència d’un cultiu incubat a la fosca cap a condicions de llum va estimular
l’expressió de proteorodopsina a nivells similars als dels cultius incubats a la llum. Aquestes dades
reforcen la idea que les proteorodopsines medien l’entrada d’energia lumínica a les xarxes trò-
fiques microbianes que habiten la superfície dels oceans.


157
BIBLIOGRAFIA
Baldauf, S. L. 2008. An overview of the phylogeny and diversity of eukaryotes. Journal of Sys-
tematics and Evolution, 46(3): 263-273.
Behnke, A., Engel, M., Christen, R., Nebel, M., Klein, R. R., & Stoeck, T. 2011. Depicting more
accurate pictures of protistan community complexity using pyrosequencing of hypervari-
able SSU rRNA gene regions. Environ Microbiol, 13(2): 340-349.
Béjà, O., Aravind, L., Koonin, E. V., Suzuki, M. T., Hadd, A., Nguyen, L. P., Jovanovich, S. B.,
Gates, C. M., Feldman, R. A., Spudich, J. L., Spudich, E. N., & DeLong, E. F. 2000. Bac-
terial rhodopsin: evidence for a new type of phototrophy in the sea. Science, 289(5486):
1902-1906.
Brock, T. D., & Brock, M. L. 1996. Autoradiography as a tool in microbial ecology. Nature,
209(5024): 734-736.
Condon, C. 2007. Maturation and degradation of RNA in bacteria. Current Opinion in Mi-
crobiology, 10(3): 271-278.
Cottrell, M. T., & Kirchman, D. L. 2000. Natural assemblages of marine Proteobacteria and mem-
bers of the Cytophaga-Flavobacter cluster consuming low- and high-molecular-weight dis-
solved organic matter. Appl Environ Microbiol, 66(4): 1692-1697.
de la Torre, J. R., Christianson, L. M., Beja, O., Suzuki, M. T., Karl, D. M., Heidelberg, J., & De-
Long, E. F. 2003. Proteorhodopsin genes are distributed among divergent marine bacterial
taxa. Proc Natl Acad Sci U S A, 100(22): 12830-12835.
del Giorgio, P. A., & Duarte, C. M. 2002. Respiration in the open ocean. Nature, 420(6914): 379-
384.
DeLong, E. F., & Béjà, O. 2010. The Light-Driven Proton Pump Proteorhodopsin Enhances Bac-
terial Survival during Tough Times. PLoS Biol, 8(4): e1000359.
Deutscher, M. P. 2006. Degradation of RNA in bacteria: comparison of mRNA and stable RNA.
Nucl. Acids Res., 34(2): 659-666.
Dreyfus, M., & Régnier, P. 2002. The poly(A) tail of mRNAs: bodyguard in eukaryotes, scavenger
in bacteria. Cell, 111(5): 611-613.

158
Falkowski, P. G., Fenchel, T., & Delong, E. F. 2008. The microbial engines that drive Earth’s bio-
geochemical cycles. Science, 320(5879): 1034-1039.
Feike, J., Jurgens, K., Hollibaugh, J. T., Kruger, S., Jost, G., & Labrenz, M. 2012. Measuring un-
biased metatranscriptomics in suboxic waters of the central Baltic Sea using a new in situ
fixation system. ISME J, 6(2):461-470.
Field, C. B., Behrenfeld, M. J., Randerson, J. T., & Falkowski, P. 1998. Primary production of the
biosphere: integrating terrestrial and oceanic components. Science, 281(5374): 237-240.
Frías-López, J., Shi, Y., Tyson, G. W., Coleman, M. L., Schuster, S. C., Chisholm, S. W., & Delong,
E. F. 2008. Microbial community gene expression in ocean surface waters. Proc Natl
Acad Sci U S A, 105(10): 3805-3810.
Gilbert, J. A., Field, D., Huang, Y., Edwards, R., Li, W., Gilna, P., & Joint, I. 2008. Detection of
large numbers of novel sequences in the metatranscriptomes of complex marine microbial
communities. PLoS ONE, 3(8): e3042.
Gilbert, J. A., Field, D., Swift, P., Thomas, S., Cummings, D., Temperton, B., Weynberg, K., Huse,
S., Hughes, M., Joint, I., Somerfield, P. J., & Mühling, M. 2010. The Taxonomic and
Functional Diversity of Microbes at a Temperate Coastal Site: A ‘Multi-Omic’ Study of
Seasonal and Diel Temporal Variation. PLoS ONE, 5(11): e15545.
Giovannoni, S. a. R., M. . 2000. Evolution, Diversity, and Molecular Ecology of Marine Prokary-
otes. D.L. Kirchman (ed.), Microbial Ecology of the Oceans: 47-84.
Green, J. L., Bohannan, B. J. M., & Whitaker, R. J. 2008. Microbial Biogeography: From Tax-
onomy to Traits. Science, 320(5879): 1039-1043.
He, S., Wurtzel, O., Singh, K., Froula, J. L., Yilmaz, S., Tringe, S. G., Wang, Z., Chen, F., Lindquist,
E. A., Sorek, R., & Hugenholtz, P. 2010. Validation of two ribosomal RNA removal meth-
ods for microbial metatranscriptomics. Nat Meth, 7(10): 807-812.
Helbling, D. E., Ackermann, M., Fenner, K., Kohler, H.-P. E., & Johnson, D. R. 2012. The activ-
ity level of a microbial community function can be predicted from its metatranscriptome.
ISME J, 6(4): 902-904.
Hewson, I., Poretsky, R. S., Tripp, H. J., Montoya, J. P., & Zehr, J. P. 2010. Spatial patterns and
light-driven variation of microbial population gene expression in surface waters of the oli-
gotrophic open ocean. Environ Microbiol, 12(7): 1940-1956.

159
Huse, S., Huber, J., Morrison, H., Sogin, M., & Welch, D. 2007. Accuracy and quality of massively
parallel DNA pyrosequencing. Genome Biology, 8(7): R143.
Karl, D. M. 2002. Hidden in a sea of microbes. Nature, 415: 590-591.
Le Roch, K. G., Johnson, J. R., Florens, L., Zhou, Y., Santrosyan, A., Grainger, M., Yan, S. F., Wil-
liamson, K. C., Holder, A. A., Carucci, D. J., Yates, J. R., & Winzeler, E. A. 2004. Global
analysis of transcript and protein levels across the Plasmodium falciparum life cycle. Ge-
nome Res, 14(11): 2308-2318.
Levin, J. Z., Yassour, M., Adiconis, X., Nusbaum, C., Thompson, D. A., Friedman, N., Gnirke, A.,
& Regev, A. 2010. Comprehensive comparative analysis of strand-specific RNA sequenc-
ing methods. Nat Meth, 7(9): 709-715.
Liang, P., & Pardee, A. B. 1992. Differential display of eukaryotic messenger RNA by means of the
polymerase chain reaction. Science, 257(5072): 967-971.
Lu, P., Vogel, C., Wang, R., Yao, X., & Marcotte, E. M. 2007. Absolute protein expression profil-
ing estimates the relative contributions of transcriptional and translational regulation. Nat
Biotechnol, 25(1): 117-124.
Man, D., Wang, W., Sabehi, G., Aravind, L., Post, A. F., Massana, R., Spudich, E. N., Spudich,
J. L., & Beja, O. 2003. Diversification and spectral tuning in marine proteorhodopsins.
Embo J, 22(8): 1725-1731.
Marañón, E., Holligan, P. M., Barciela, R., González, N., Mouriño, B., Pazó, M. J., & Varela, M.
2001. Patterns of phytoplankton size structure and productivity in contrasting open-ocean
environments. Marine ecology progress series, 216: 43-56.
Massana, R. 2011. Eukaryotic Picoplankton in Surface Oceans. Annual Review of Microbiol-
ogy, 65(1): 91-110.
Massana, R., & Pedrós-Alió, C. 2008. Unveiling new microbial eukaryotes in the surface ocean.
Current Opinion in Microbiology, 11(3): 213-218.
Ottesen, E. A., Marin, R., III, Preston, C. M., Young, C. R., Ryan, J. P., Scholin, C. A., & DeLong,
E. F. 2011. Metatranscriptomic analysis of autonomously collected and preserved marine
bacterioplankton. ISME J, 5(12): 1881-1895.

160
Ottesen, E. A., Young, C. R., Eppley, J. M., Ryan, J. P., Chavez, F. P., Scholin, C. A., & DeLong,
E. F. 2013. Pattern and synchrony of gene expression among sympatric marine microbial
populations. Proceedings of the National Academy of Sciences, 110(6): E488-E497.
Pace, N., Stahl, D., Lane, D., & Olsen, G. 1986. The analysis of natural microbial populations by
rRNA sequences. Adv Microb Ecol, 9: 1-55.
Passalacqua, K. D., Varadarajan, A., Ondov, B. D., Okou, D. T., Zwick, M. E., & Bergman, N.
H. 2009. Structure and Complexity of a Bacterial Transcriptome. J Bacteriol, 191(10):
3203-3211.
Pedrós-Alió, C. 2006. Marine microbial diversity: can it be determined? Trends Microbiol,
14(6): 257-263.
Pernthaler, A., & Amann, R. 2004. Simultaneous Fluorescence In Situ Hybridization of mRNA
and rRNA in Environmental Bacteria. Appl. Environ. Microbiol., 70(9): 5426-5433.
Poretsky, R. S., Bano, N., Buchan, A., LeCleir, G., Kleikemper, J., Pickering, M., Pate, W. M.,
Moran, M. A., & Hollibaugh, J. T. 2005. Analysis of microbial gene transcripts in environ-
mental samples. Appl Environ Microbiol, 71(7): 4121-4126.
Poretsky, R. S., Hewson, I., Sun, S., Allen, A. E., Zehr, J. P., & Moran, M. A. 2009. Comparative
day/night metatranscriptomic analysis of microbial communities in the North Pacific sub-
tropical gyre. Environ Microbiol, 11(6): 1358-1375.
Poretsky, R. S., Sun, S., Mou, X., & Moran, M. A. 2010. Transporter genes expressed by coastal
bacterioplankton in response to dissolved organic carbon. Environ Microbiol, 12(3):
616-627.
Preston, C. M., Harris, A., Ryan, J. P., Roman, B., Marin, R., III, Jensen, S., Everlove, C., Birch, J.,
Dzenitis, J. M., Pargett, D., Adachi, M., Turk, K., Zehr, J. P., & Scholin, C. A. 2011. Under-
water Application of Quantitative PCR on an Ocean Mooring. PLoS ONE, 6(8): e22522.
Quince, C., Lanzen, A., Curtis, T. P., Davenport, R. J., Hall, N., Head, I. M., Read, L. F., & Sloan,
W. T. 2009. Accurate determination of microbial diversity from 454 pyrosequencing data.
Nat Meth, 6(9): 639-641.
Sabehi, G., Massana, R., Bielawski, J. P., Rosenberg, M., Delong, E. F., & Beja, O. 2003. Novel
Proteorhodopsin variants from the Mediterranean and Red Seas. Environ Microbiol,
5(10): 842-849.

161
Schena, M., Shalon, D., Davis, R. W., & Brown, P. O. 1995. Quantitative Monitoring of Gene Ex-
pression Patterns with a Complementary DNA Microarray. Science, 270(5235): 467-470.
Scholin, C., Doucette, G., Jensen, S., Roman, B., Pargett, D., Marin III, R., Preston, C., Jones,
W., Feldman, J., Everlove, C., Harris, A., Alvarado, N., Massion, E., Birch, J., Greenfield,
D., Vrijenhoek, R., Mikulski, C., & Jones, K. 2009. Remote detection of marine microbes,
small invertebrates, harmful algae, and biotoxins using the Environmental Sample Proces-
sor (ESP). Oceanography, 22(2): 158-167.
Schwalbach, M. S., Brown, M., & Fuhrman, J. A. 2005. Impact of light on marine bacterioplank-
ton community structure. Aquatic Microbial Ecology, 39(3): 235-245.
Sherr, E., & Sherr, B. 2002. Significance of predation by protists in aquatic microbial food webs.
Antonie Van Leeuwenhoek, 81(1-4): 293-308.
Smith, D. P., Kitner, J. B., Norbeck, A. D., Clauss, T. R., Lipton, M. S., Schwalbach, M. S.,
Steindler, L., Nicora, C. D., Smith, R. D., & Giovannoni, S. J. 2010. Transcriptional and
Translational Regulatory Responses to Iron Limitation in the Globally Distributed Marine
Bacterium Candidatus Pelagibacter ubique. PLoS ONE, 5(5): e10487.
Sogin, M. L., Morrison, H. G., Huber, J. A., Welch, D. M., Huse, S. M., Neal, P. R., Arrieta, J. M.,
& Herndl, G. J. 2006. Microbial diversity in the deep sea and the underexplored “rare bio-
sphere”. Proceedings of the National Academy of Sciences, 103(32): 12115-12120.
Stewart, F. J., Ottesen, E. A., & DeLong, E. F. 2010. Development and quantitative analyses of
a universal rRNA-subtraction protocol for microbial metatranscriptomics. ISME J, 4(7):
896-907.
Stewart, F. J., Ulloa, O., & DeLong, E. F. 2012. Microbial metatranscriptomics in a permanent
marine oxygen minimum zone. Environ Microbiol, 14(1):23-40.
Van Vliet, A. H. 2010. Next generation sequencing of microbial transcriptomes: challenges and
opportunities. FEMS Microbiology Letters, 302(1): 1-7.
Venter, J. C., Remington, K., Heidelberg, J. F., Halpern, A. L., Rusch, D., Eisen, J. A., Wu, D.,
Paulsen, I., Nelson, K. E., Nelson, W., Fouts, D. E., Levy, S., Knap, A. H., Lomas, M.
W., Nealson, K., White, O., Peterson, J., Hoffman, J., Parsons, R., Baden-Tillson, H.,
Pfannkoch, C., Rogers, Y. H., & Smith, H. O. 2004. Environmental genome shotgun se-
quencing of the Sargasso Sea. Science, 304(5667): 66-74.

162
Vila-Costa, M., Rinta-Kanto, J. M., Sun, S., Sharma, S., Poretsky, R., & Moran, M. A. 2010.
Transcriptomic analysis of a marine bacterial community enriched with dimethylsulfonio-
propionate. ISME J, 4(11): 1410-1420.
Wang, Z., Gerstein, M., & Snyder, M. 2009. RNA-Seq: a revolutionary tool for transcriptomics.
Nat Rev Genet, 10(1): 57-63.
Whitman, W. B., Coleman, D. C., & Wiebe, W. J. 1998. Prokaryotes: the unseen majority. Proc
Natl Acad Sci U S A, 95(12): 6578-6583.
Worden, A. Z., Nolan, J. K., & Palenik, B. 2004. Assessing the dynamics and ecology of ma-
rine picophytoplankton: The importance of the eukaryotic component. Limnology and
Oceanography, 49(1): 168-179.
Wurzbacher, C., Salka, I., & Grossart, H.-P. 2012. Environmental actinorhodopsin expression re-
vealed by a new in situ filtration and fixation sampler. Environmental Microbiology
Reports, 4(5):491-497.


165
“...La llarga tarda miro, amb pauses d’or i somni...” Salvador Espriu
AGRAÏMENTS
El pas del temps modula el pes dels records. A causa d’això molts em són borrosos, però hi ha petits moments, segons d’or, que m’han quedat gravats amb foc.
El camí que m’ha portat fins aquí va començar ara fa 18 anys a bord de l’Adela Ylla, amb la també grumet Mariona i el capità i mestre Toni Curto. El meu primer agraïment és per en Toni Curto, sense el qual segurament mai s’hagués encès aquesta inesperada guspira per les Ciències del Mar i per la ciència en general.
Als companys del laboratori del BD-CEXS, especialment a en Fernando i a la Cristina. Molts records ja em queden desdibuixats pel temps. Però sí recordo hores precioses, varis d’aquests mo-ments gravats amb foc, sota la lupa, sota el microscopi, disseccionant miracles d’embrions i obser-vant tincions púrpures revelant-nos patrons, fronteres i organització. Vaig gaudir i aprendre d’allò més al vostre laboratori.
El doctorat és un camí personal a vegades difícil, on et trobes amb el millor i el pitjor de tu mateix; he patit i he fet patir. Fer un doctorat no és només fer experiments i escriure articles. És trobar-te amb les pròpies deficiències, acceptar-les, corregir-les, superar-les. Algunes persones, sovint les més properes, han patit amb més intensitat aquesta lluita. A primera línia de foc, Ero, Raquel, Eli, Bea, Lorena.
Adolfo, amb tu l’espai-temps s’expandeix ple de bons moments compartits. Sempre queda un fil, i el nostre és un fil blindat d’afecte.
Darrere les paraules d’una oportuna cançó, i de tantes i tantes coses dolces més, caro Massimo. Gràcies per tot, per escoltar-me, per aconsellar-me, per fer-me riure amb les teves sortides ines-perades.
Àlex, sempre he trobat la porta del teu despatx oberta a una bona picaresca. Gràcies per aguantar-me en hores altes i baixes. I sobretot, pel teu carinyo incondicional.
Hugo, Isabel, Marta, Ramiro, Ivo, grans postdocs on emmirallar-nos. Bibiana, has desencallat gairebé sense voler barreres que em tenien molt aturada, moltes gràcies!
Irene, Clara, Vanessa! Gràcies per fer que tot flueixi tan bé i per tanta generositat. Guillem, pel teu saber fer en R. Gràcies!
Al meu jefe Carles per la confiança i la llibertat. Gràcies per ajudar-me tant durant l’últim tram. A la meva jefa, la Sílvia, motor incombustible de generositat i entusiasme. Gràcies per donar-me l’oportunitat de viatjar en el TARA. A la Mary Ann Moran per ensenyar-me tantes coses durant la meva estada a Georgia.
Als investigadors de la casa, en especial els del departament de biologia marina i oceanografia, per aquest ambient tan únic: Pep, Ramon, Cèlia, Rafel, Dolors, Montse.

166
Núria G, Mercè B, Montse P, l’amistat que la Pompeu va unir ha quedat segellada pels segles dels segles.
Arenys, el temps s’encalma de nou. Carol, Ariadna, Mariona, Gerard (gràcies pels consells tan útils d’il·lustració!) Núria, Irma, Begonya, Francis, Agus. Per les bones vetllades junts dissabte rera dissabte d’ençà que vam deixar l’EGB. Vosaltres sou el meu gran tresor.
Als meus pares, per la seva enorme paciència, per haver-me acollit de nou. Tiet Jordi, que en el moment clau m’ha donat un lloc on viure. Clara, des de la llunyania has sigut la persona on pun-tualment he desfermat la tragicomèdia de tot plegat.
A tu Joan, que m’has carregat d’il·lusió i ganes de compartir moltes coses junts, ets l’autèntic catalitzador d’aquest final...o principi!
A tots vosaltres, que teniu un lloc ben endins en el meu cor: salut, pau, ciència i llibertat!