
UNIVERSIDAD SAN FRANCISCO DE QUITO Colegio de...
50
UNIVERSIDAD SAN FRANCISCO DE QUITO Colegio de Ciencias e Ingeniería Politécnico Measurements of ultrasound Fields inside a cylindrical vessel using a Scanning Vibrometer Francisco Hernández Proyecto de titulación presentada como requisito para la obtención del título de Licenciatura en Física
Transcript of UNIVERSIDAD SAN FRANCISCO DE QUITO Colegio de...

i
UNIVERSIDAD SAN FRANCISCO DE QUITO
Colegio de Ciencias e Ingeniería Politécnico
Measurements of ultrasound Fields inside a cylindrical vessel using
a Scanning Vibrometer
Francisco Hernández
Proyecto de titulación presentada como requisito para la obtención del título de
Licenciatura en Física

ii
Universidad San Francisco de Quito
Colegio de Ciencias e Ingeniería Politécnico
HOJA DE APROBACIÓN DE PROYECTO
Measurements of ultrasound Fields inside a cylindrical vessel using
a Scanning Vibrometer
Francisco Hernández
Darío Niebieskikwiat, PH.D. Revisión de Proyecto ………………………… Santiago Gangotena, PH.D Decano del Colegio de Ciencias e Ingeniería Politécnico …………………………
Quito, 22 de Mayo del 2012
iii
© Derechos de autor: Según la actual Ley de Propiedad Intelectual, Art. 5:
“el derecho de autor nace y se protege por el solo hecho de la creación
de la obra, independientemente de su mérito, destino o modo de
expresión... El reconocimiento de los derechos de autor y de los
derechos conexos no está sometido a registro, depósito, ni al
cumplimiento de formalidad alguna.” (Ecuador. Ley de Propiedad
Intelectual, Art. 5)
Francisco Hernández
2012
iv
Resumen
Se hace un estudio sobre los distintos modos de vibración debido a campos de
sonido en un contenedor cilíndrico lleno de agua. Se proponen distintos métodos
para medir experimentalmente estos campos de sonido con el objetivo de que los
errores experimentales sean mínimos. Los resultados obtenidos se comparan con los
resultados teóricos y se observa la exactitud de los métodos propuestos
v
Abstract
A study of different mode shapes inside a cylindrical vessel filled with water caused
by a sound field is done. Some experimental methods to measure these sound fields
are proposed in order to avoid experimental mistakes. The results obtained are
compared with theoretical simulations and the effectiveness of each method is
observed.

vi
Table of Contents 1 Introduction ..................................................................................................................................... 1
1.1 Doopler shift due to moving reflector ..................................................................................... 1
1.2 Description of the set up studied by Zipser (Zipser, 2007) ...................................................... 3
1.3 Set up using a cylindrical vessel ............................................................................................... 5
2 Theoretical research ......................................................................................................................... 6
3 Measurements, experimental work ............................................................................................... 13
3.1 First Measurements ............................................................................................................... 13
3.1.1 Vessel filled with water with glass bottom inside a rectangular glass: .......................... 14
3.1.2 Vessel filled with water with glass bottom: ................................................................... 16
3.1.3 Vessel filled with water with metallic bottom, inside a rectangular glass ..................... 18
3.1.4 Vessel filled with water with metallic bottom inside a cylindrical vessel filled with water
20
3.1.5 Vessel filled with water with glass bottom, inside a rectangular glass filled with water
(measurements are done outside the vessel) ................................................................................ 22
3.1.6 Vessel filled with water with metallic bottom, inside a rectangular glass filled with
water (measurements are done outside the vessel) ..................................................................... 24
3.1.7 Complete metallic vessel filled with water, inside a rectangular glass filled with water
26
3.1.8 Teflon inside a rectangular glass filled with water ......................................................... 29
3.1.9 Complete metallic vessel with Teflon inside a rectangular glass filled with water ....... 30
3.1.10 Metallic cylindrical vessel filled with water ................................................................... 32
3.1.11 Teflon vessel filled with water ....................................................................................... 34
3.2 Very precise measurements ................................................................................................... 36
3.2.1 Metal bottom ................................................................................................................. 37
3.2.2 Glass bottom .................................................................................................................. 38
4 Conclusions and Recommendations .............................................................................................. 40
5 Bibliography ................................................................................................................................... 43

vii
Table of Figures
Figure 1 Principle of Classic Vibrometry ................................................................................................... 1
Figure 2. Scheme of Mach-Zehnder-Doppler Interferometer (Zipser, 2007) .......................................... 2
Figure 3. Principle of refracto-vibrometry (Zipser, 2007) ........................................................................ 4
Figure 4. Cylindrical vessel with transducer and water (Bornmann P. , 2011) ........................................ 5
Figure 5. Beam path ................................................................................................................................. 7
Figure 6. Plot of firing angle versus angle inside the vessel ..................................................................... 8
Figure 7. Plot of firing angle versus height ............................................................................................... 9
Figure 8. Plot of firing angle versus height and angle inside the vessel................................................. 10
Figure 9. Corrected Beam Path .............................................................................................................. 13
Figure 10. Vessel filled with water with glass bottom inside a rectangular glass .................................. 15
Figure 11. FFT ......................................................................................................................................... 15
Figure 12. Vessel filled with water with glass bottom, inside a rectangular glass filled with water ..... 17
Figure 13. FFT ......................................................................................................................................... 17
Figure 14. Vessel filled with water with metallic bottom, inside a rectangular glass ............................ 19
Figure 15. FFT ......................................................................................................................................... 20
Figure 16. Vessel filled with water with metallic bottom, inside a rectangular glass filled with water 21
Figure 17. FFT ......................................................................................................................................... 22
Figure 18. Vessel filled with water with glass bottom, inside a rectangular glass filled with water ..... 23
Figure 19. FFT ......................................................................................................................................... 24
Figure 20. Vessel filled with water with metallic bottom, inside a rectangular glass filled with water 25
Figure 21. FFT ......................................................................................................................................... 26
Figure 22. Complete metallic vessel filled with water, inside a rectangular glass filled with water ..... 27
Figure 23. FFT ......................................................................................................................................... 28
Figure 24. Teflon inside a rectangular glass filled with water ................................................................ 29
Figure 25. FFT ......................................................................................................................................... 30
Figure 26. Complete metallic vessel with Teflon inside a rectangular glass filled with water............... 31
Figure 27. FFT ......................................................................................................................................... 32
Figure 28. Metallic cylindrical vessel filled with water .......................................................................... 33
Figure 29. FFT ......................................................................................................................................... 33
Figure 30. Teflon vessel filled with water .............................................................................................. 35
Figure 31. FFT ......................................................................................................................................... 36
Figure 32. Metal bottom ........................................................................................................................ 37
Figure 33. FFT ......................................................................................................................................... 38
Figure 34. Glass Bottom ......................................................................................................................... 39
Figure 35. FFT ......................................................................................................................................... 40
1
1 Introduction
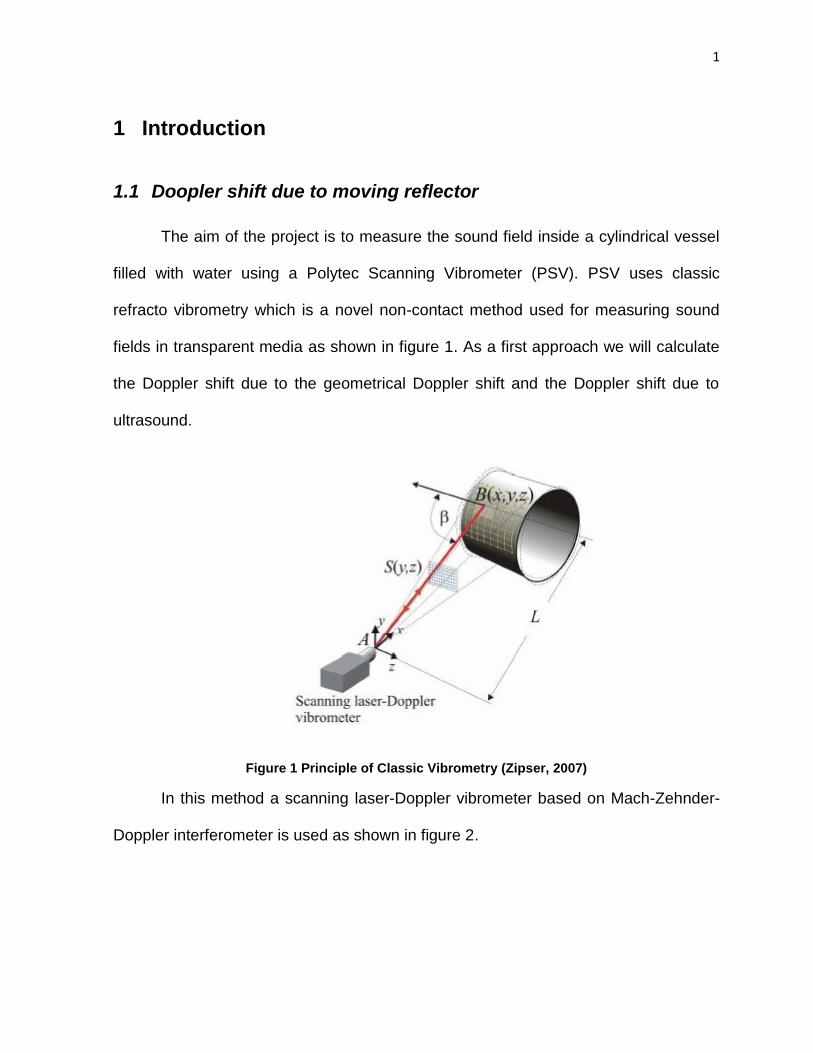
1.1 Doopler shift due to moving reflector
The aim of the project is to measure the sound field inside a cylindrical vessel
filled with water using a Polytec Scanning Vibrometer (PSV). PSV uses classic
refracto vibrometry which is a novel non-contact method used for measuring sound
fields in transparent media as shown in figure 1. As a first approach we will calculate
the Doppler shift due to the geometrical Doppler shift and the Doppler shift due to
ultrasound.
Figure 1 Principle of Classic Vibrometry (Zipser, 2007)
In this method a scanning laser-Doppler vibrometer based on Mach-Zehnder-
Doppler interferometer is used as shown in figure 2.
2
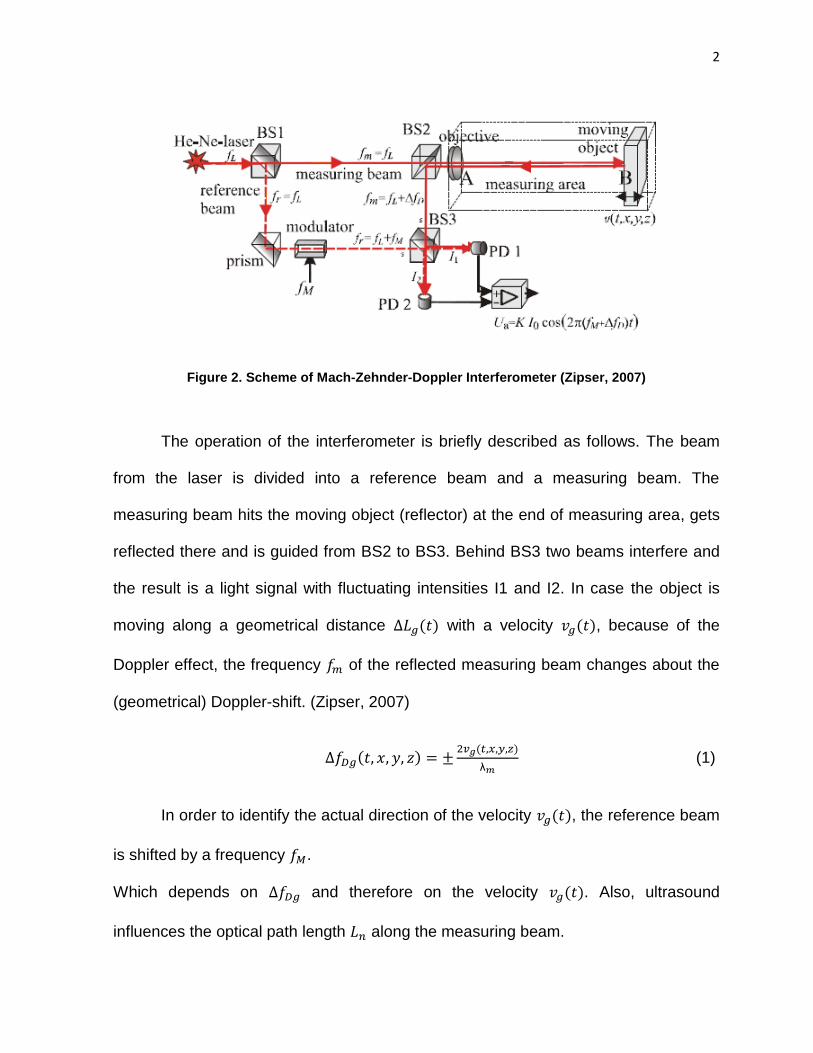
Figure 2. Scheme of Mach-Zehnder-Doppler Interferometer (Zipser, 2007)
The operation of the interferometer is briefly described as follows. The beam
from the laser is divided into a reference beam and a measuring beam. The
measuring beam hits the moving object (reflector) at the end of measuring area, gets
reflected there and is guided from BS2 to BS3. Behind BS3 two beams interfere and
the result is a light signal with fluctuating intensities I1 and I2. In case the object is
moving along a geometrical distance with a velocity , because of the
Doppler effect, the frequency of the reflected measuring beam changes about the
(geometrical) Doppler-shift. (Zipser, 2007)
(1)
In order to identify the actual direction of the velocity , the reference beam
is shifted by a frequency .
Which depends on and therefore on the velocity . Also, ultrasound
influences the optical path length along the measuring beam.

3
(2)
Where n is the optical refractive index of the medium. Sound pressure cause
variations of the optical refractive index.
(3)
The relationship is given by a constant, which is called piezo-optic coefficient
, the index S indicates adiabatic phase changes.
Consequently, the total Doppler shift results from the superposition of the
geometrical and the refractive shares
(4)
.
Finally, the intensity signal is
(5)
The fast Fourier transform of equation (5) is done, and by doing this the
frequency shift due to ultrasound is obtained
1.2 Description of the set up studied by Zipser (Zipser, 2007)
First the set up shown in figure 3 is analyzed.
4
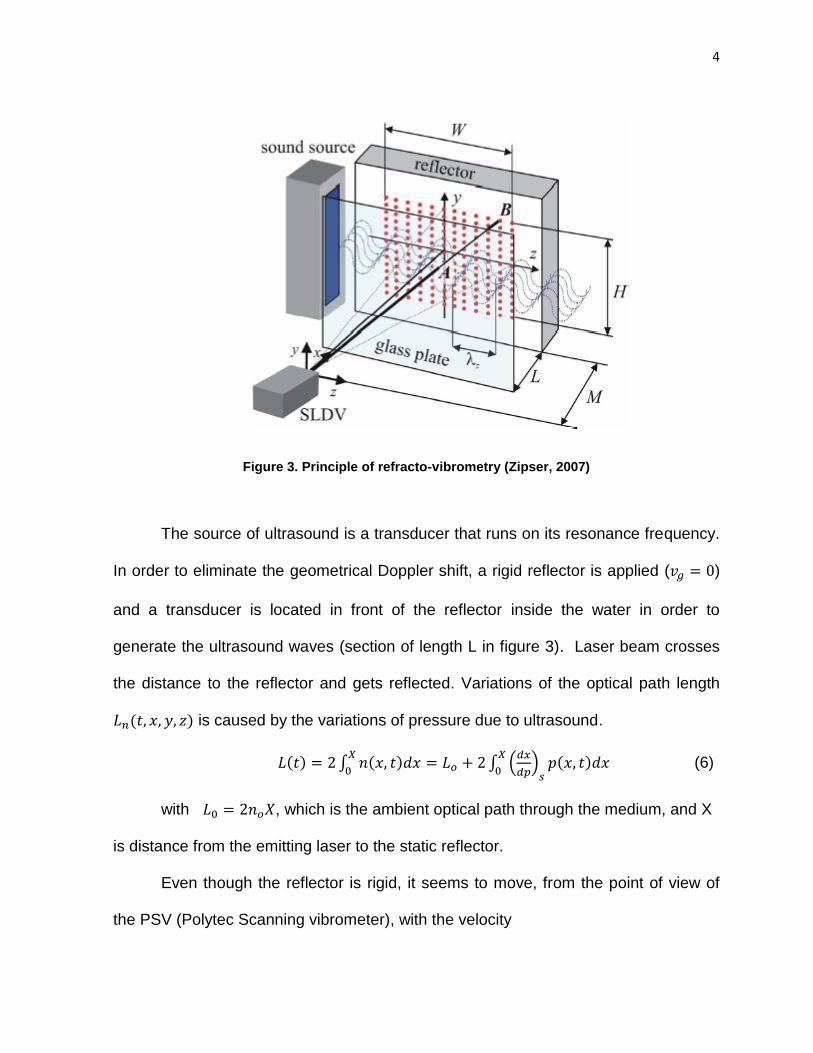
Figure 3. Principle of refracto-vibrometry (Zipser, 2007)
The source of ultrasound is a transducer that runs on its resonance frequency.
In order to eliminate the geometrical Doppler shift, a rigid reflector is applied ( )
and a transducer is located in front of the reflector inside the water in order to
generate the ultrasound waves (section of length L in figure 3). Laser beam crosses
the distance to the reflector and gets reflected. Variations of the optical path length
is caused by the variations of pressure due to ultrasound.
(6)
with , which is the ambient optical path through the medium, and X
is distance from the emitting laser to the static reflector.
Even though the reflector is rigid, it seems to move, from the point of view of
the PSV (Polytec Scanning vibrometer), with the velocity
5
(7)
This indeed recovers the second term in equation (4). The measured virtual velocity is
the integral value of the velocities along the measuring beam, because the laser
beam goes through all sound field with high and low velocities values.
1.3 Set up using a cylindrical vessel
The set up studied by Zipser (Zipser, 2007) is the base of our study, but it is
not useful for our purposes. The set up that will be studied is similar as in figure 3, but
instead of locating the sound field in front of the reflector, a cylindrical vessel filled
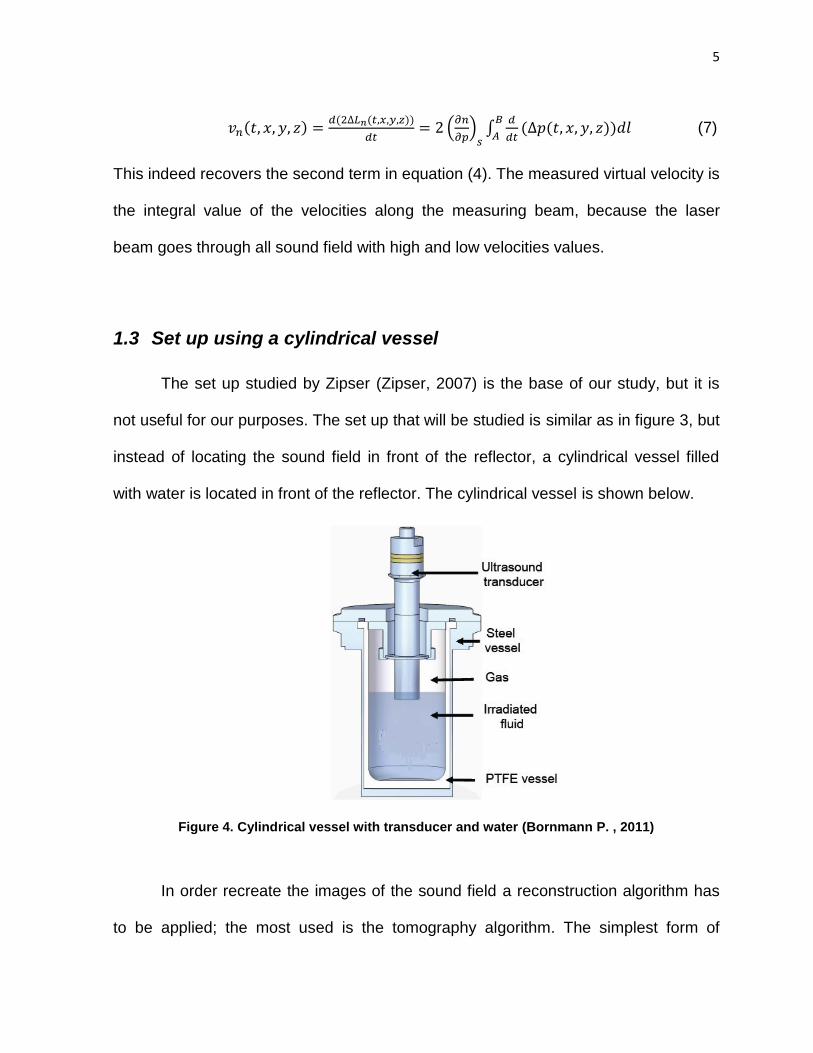
with water is located in front of the reflector. The cylindrical vessel is shown below.
Figure 4. Cylindrical vessel with transducer and water (Bornmann P. , 2011)
In order recreate the images of the sound field a reconstruction algorithm has
to be applied; the most used is the tomography algorithm. The simplest form of

6
tomography, sometimes referred to as ‘step and shoot’ tomography, is based on the
creation of parallel projections (Harvey, 2004).
In this algorithm, the problem is that in a cylindrical vessel, the parallel
projections are damaged and therefore, the algorithm applied fail. The work done in
this report is about the research on the correction of this problem and the
experimental analysis of the sound field inside a cylindrical vessel with glass and
metal bottoms.
2 Theoretical research
The first task was to develop a method to make the laser beams parallel inside
a cylindrical vessel, in order to minimize errors of the measurements of ultrasound
waves inside the vessel.
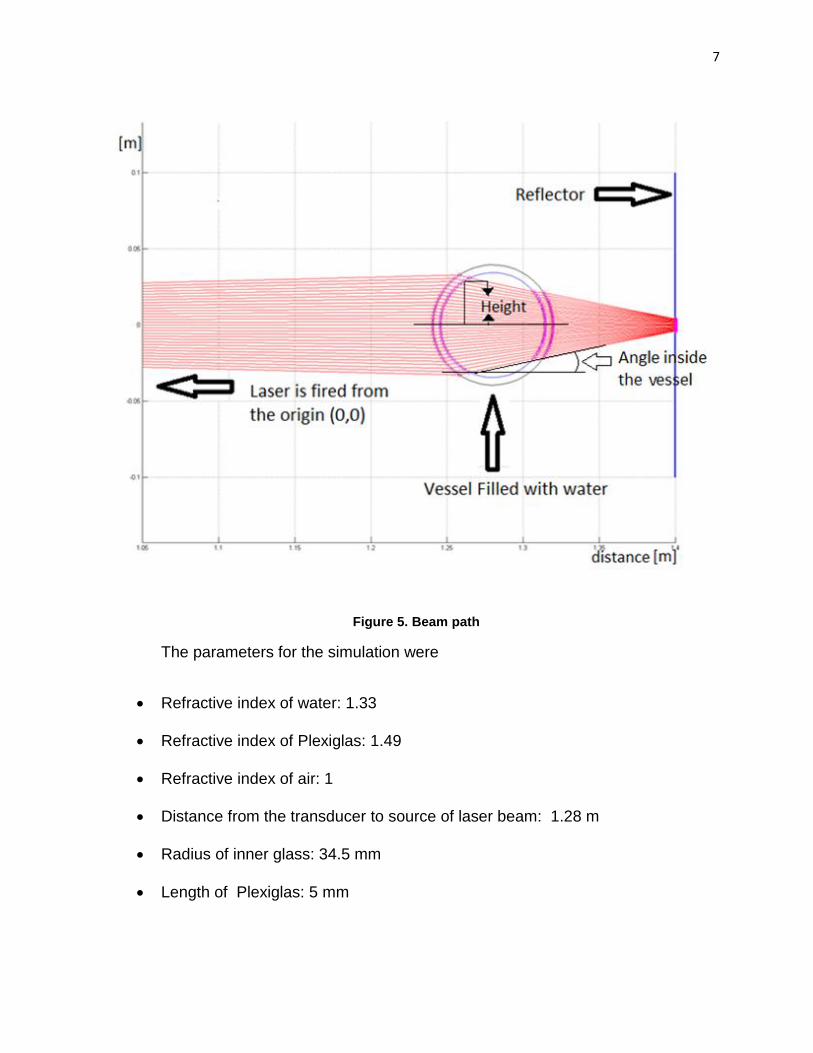
A simulation was made in order to see the path taken by a laser beam that
goes through a cylindrical Plexiglas filled with water.
The result of the beam path was simulated in Matlab using the program written
by Martin Klubal (Klubal, Laser beam Path, 2011). A view from above the Bessel is
shown in figure five. The blue bar is the reflector and the laser is located in the
opposite side of the reflector. Figure 5 describes the path of the laser beam when
going through different mediums, in this case, air-glass-water-glass-air.
7
Figure 5. Beam path
The parameters for the simulation were
Refractive index of water: 1.33
Refractive index of Plexiglas: 1.49
Refractive index of air: 1
Distance from the transducer to source of laser beam: 1.28 m
Radius of inner glass: 34.5 mm
Length of Plexiglas: 5 mm
8
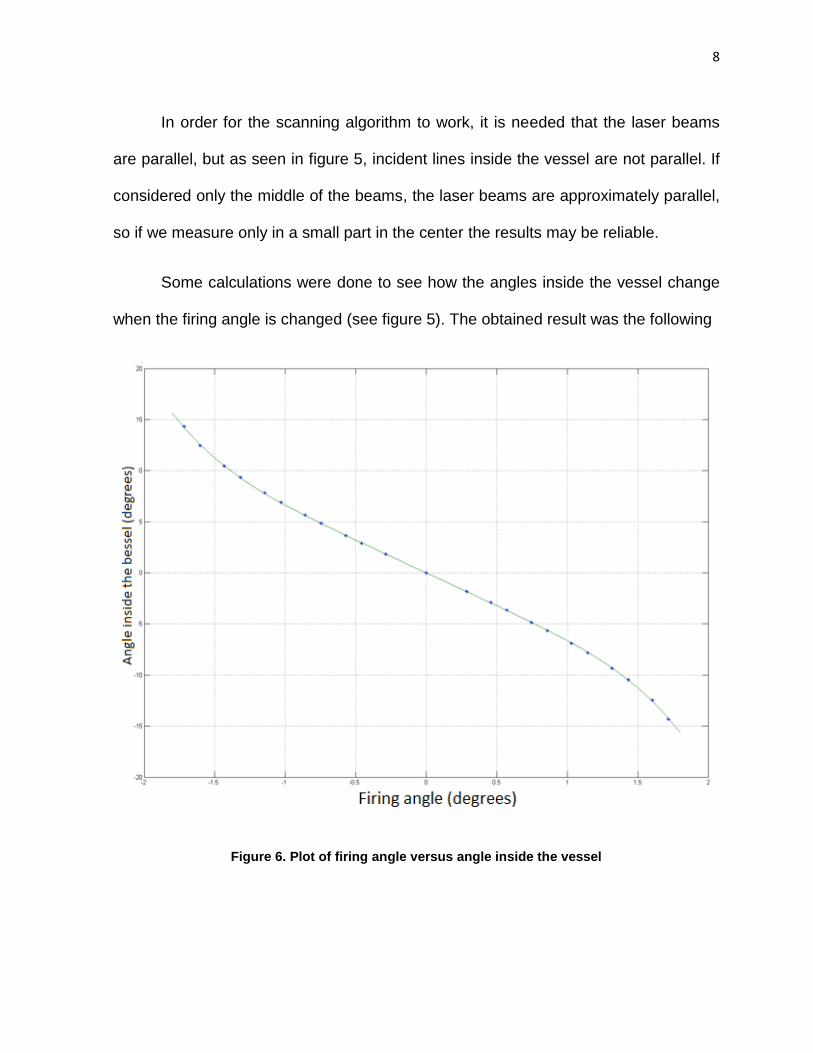
In order for the scanning algorithm to work, it is needed that the laser beams
are parallel, but as seen in figure 5, incident lines inside the vessel are not parallel. If
considered only the middle of the beams, the laser beams are approximately parallel,
so if we measure only in a small part in the center the results may be reliable.
Some calculations were done to see how the angles inside the vessel change
when the firing angle is changed (see figure 5). The obtained result was the following
Figure 6. Plot of firing angle versus angle inside the vessel
9
It can be seen that when one approaches the border of the glass (or when the
firing angle increases), the angles become less parallel. It can be seen that the worst
angle obtained could be almost 17 degrees.
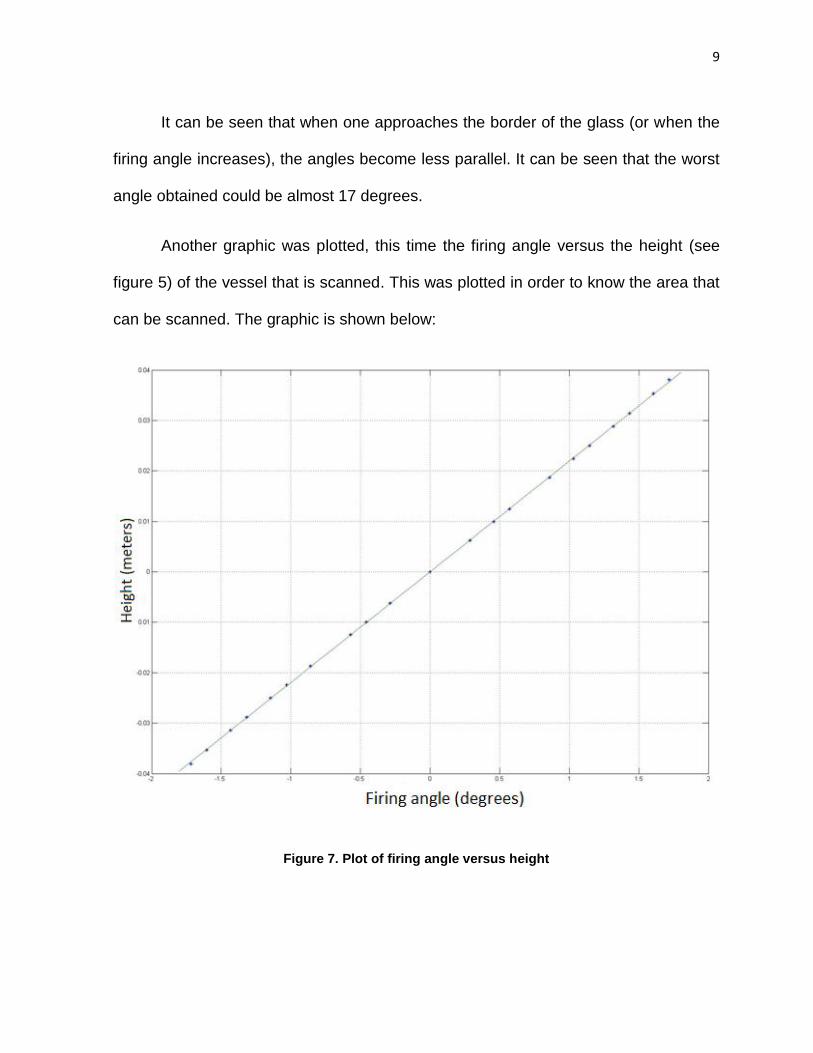
Another graphic was plotted, this time the firing angle versus the height (see
figure 5) of the vessel that is scanned. This was plotted in order to know the area that
can be scanned. The graphic is shown below:
Figure 7. Plot of firing angle versus height

10
The relation is linear. Now we are interested in which is the area that we can
scan, so that we can consider that the lines are almost parallel. The problem here is
to determine the limit in which we can say the lines are almost parallel.
The following graphic was plotted to analyze the dependence of the firing
angle with the angles inside the vessel and the height.
Figure 8. Plot of firing angle versus height and angle inside the vessel
From figure 8 it is concluded that we can scan 2 centimeters of the vessel with
a maximum variation of the angle of 4 degrees. But again, the problem is that we

11
can’t say whether if four degrees contribute to a big or a small error. Maybe if we
knew which maximum angle we can tolerate, we could know for sure which area is
the one we can scan.
Other ideas were proposed to fix the problem of “not parallel lines”. The ideas
are briefly described as follows:
The first option was to have the same medium both inside and outside the
cylindrical vessel. That means having the vessel inside a rectangular container
filled with water. By this way the refractive index would be the same, outside
and inside, and the results obtained would be that the lines are “pseudo”
parallel.
The second option was to modify the method described before by changing
the firing angle at which the laser beam is fired. By doing so, exact parallel
lines may be obtained, though this may take a lot of time and changing the
firing angle every time is really a problem and it couldn’t be done with exact
precision.
The third method was to put a lens in front of the laser beam. The lens will
cause the light to deviate in a way that when it arrives to the vessel’s interior
part, the beams are parallel. By doing this, there is no need to modify the firing
angle of the laser beam because the lens will be able to do it. With this
method, the only thing that has to be found is the distance at which the lens is

12
located. It has to be located in the exact position so that the main objective is
obtained.
The last method described was chosen because it was the most achievable of
all. In order to make this method work, the specifications of the lens would have to be
found. To find the specifications of the lens, the program used to simulate the laser
beam path written by Martin Klubal (Klubal, Laser beam Path, 2011) had to be
modified, and that’s what I did.
Once the program was modified I put a lens in the middle of the beam path in
order to change the direction. At the end it wasn’t exactly a lens that was chosen for
the experiment, instead it was another Plexiglas cylindrical vessel that was used for
the simulation in order to simplify the code that had to be written. The parameters that
were used for the simulation were:
Refractive index of water: 1.33
Refractive index of Plexiglas: 1.49
Refractive index of air: 1
Distance from the source of the laser beams to center of the first Plexiglas
(lens): 0.63 m
Distance from the first Plexiglas (lens), to the Plexiglas were the measurement
is supposed to be done: 0.32 m
Radius of both inner glasses: 34.5 mm
Length of both Plexiglas: 5 mm

13
With these parameters the obtained result is the following:
Figure 9. Corrected Beam Path
It can be clearly seen in figure 2 that by doing this modification the laser beams
are parallel.
3 Measurements, experimental work
3.1 First Measurements
Some experimental results are shown with different set up arrangements. Below each
figure the fast Fourier transform (FFT) of the pressure wave is shown. In the FFT it is

14
seen that a clear peak near 23 kHz is formed. This is consistent since the pressure
waves are being excited by the transducer near this frequency, which is clearly
ultrasound. Also it should be noted that the pressure waves are traveling vertically.
3.1.1 Vessel filled with water with glass bottom inside a rectangular
glass:
Distance from bottom to transducer is 65 mm
Distance from the source of laser beam to transducer is 1.28 m
The water filled above the end of the transducer is 16 mm

15
Figure 10. Vessel filled with water with glass bottom inside a rectangular glass
FFT
Figure 11. FFT

16
Comments:
With this arrangement a standing wave is formed inside the vessel. The
maximum speed of the wave is 100 mm/s.
This maximum speed is comparably high if compared with the measurements
done with a metallic vessel or Teflon; therefore I may conclude that the
measurements done in this arrangement are from the vibrations inside the vessel. In
measurements 3.1.10. and 3.1.11. (see below) it is seen that the maximum speed is 5
or 10 mm/s, which is almost 10 to 20 times lower than the velocity in this
measurements.
This measurement is consistent with the simulations done by (Bornmann P. ,
2011)
3.1.2 Vessel filled with water with glass bottom:
Distance from bottom to transducer is 65 mm
Distance from the source of laser beam to transducer is 1.28 m
The water filled above the end of the transducer is 16 mm

17
Figure 12. Vessel filled with water with glass bottom, inside a rectangular glass filled with water
FFT
Figure 13. FFT
18
Comments:
With this set up it can be concluded that the vibrations of the transducer are
going through out the cylindrical vessel and therefore the water outside the vessel is
affected. It looks like if the measurements are from the vibrations of the water outside
the cylindrical vessel because the results obtained are similar to the results obtained
by Elena’s measurements (Figure 2.1 in Hemsel’s report) (Hemsel, E. 2011)
3.1.3 Vessel filled with water with metallic bottom, inside a rectangular glass
Distance from bottom to transducer is 65 mm
Distance from the source of laser beam to transducer is 1.28 m
The water filled above the end of the transducer is 16 mm

19
Figure 14. Vessel filled with water with metallic bottom, inside a rectangular glass
FFT graphic
20
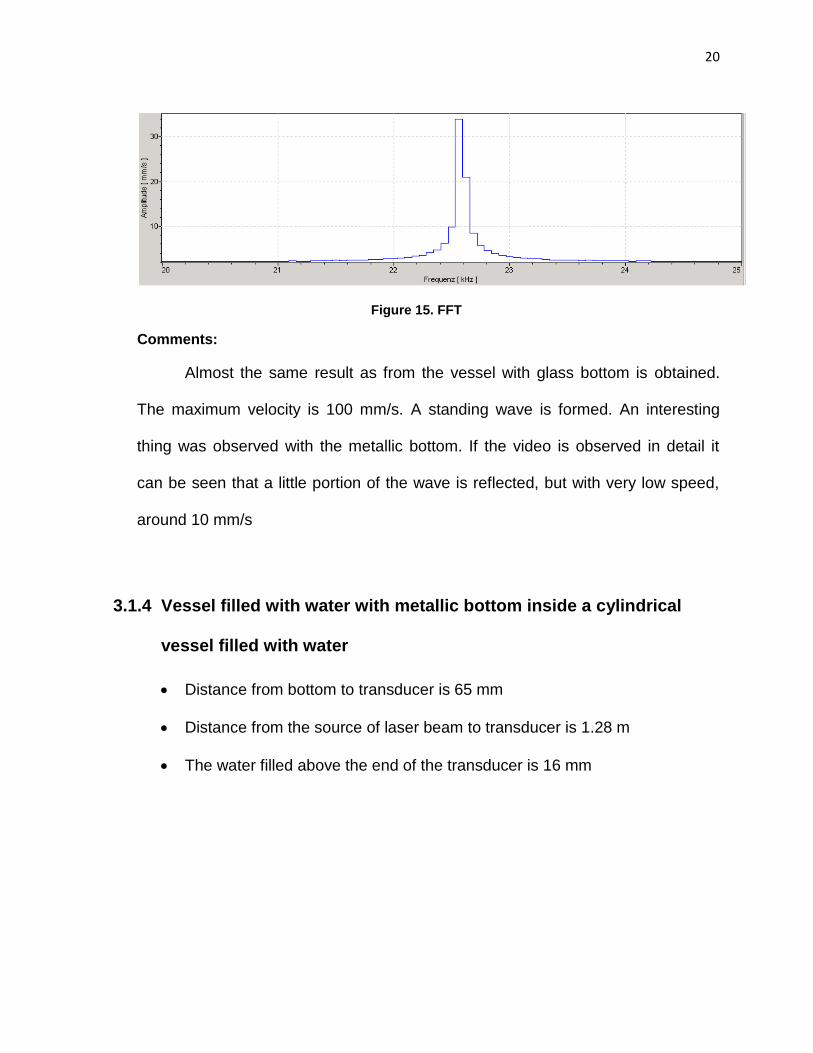
Figure 15. FFT
Comments:
Almost the same result as from the vessel with glass bottom is obtained.
The maximum velocity is 100 mm/s. A standing wave is formed. An interesting
thing was observed with the metallic bottom. If the video is observed in detail it
can be seen that a little portion of the wave is reflected, but with very low speed,
around 10 mm/s
3.1.4 Vessel filled with water with metallic bottom inside a cylindrical
vessel filled with water
Distance from bottom to transducer is 65 mm
Distance from the source of laser beam to transducer is 1.28 m
The water filled above the end of the transducer is 16 mm

21
Figure 16. Vessel filled with water with metallic bottom
FFT graphic
22
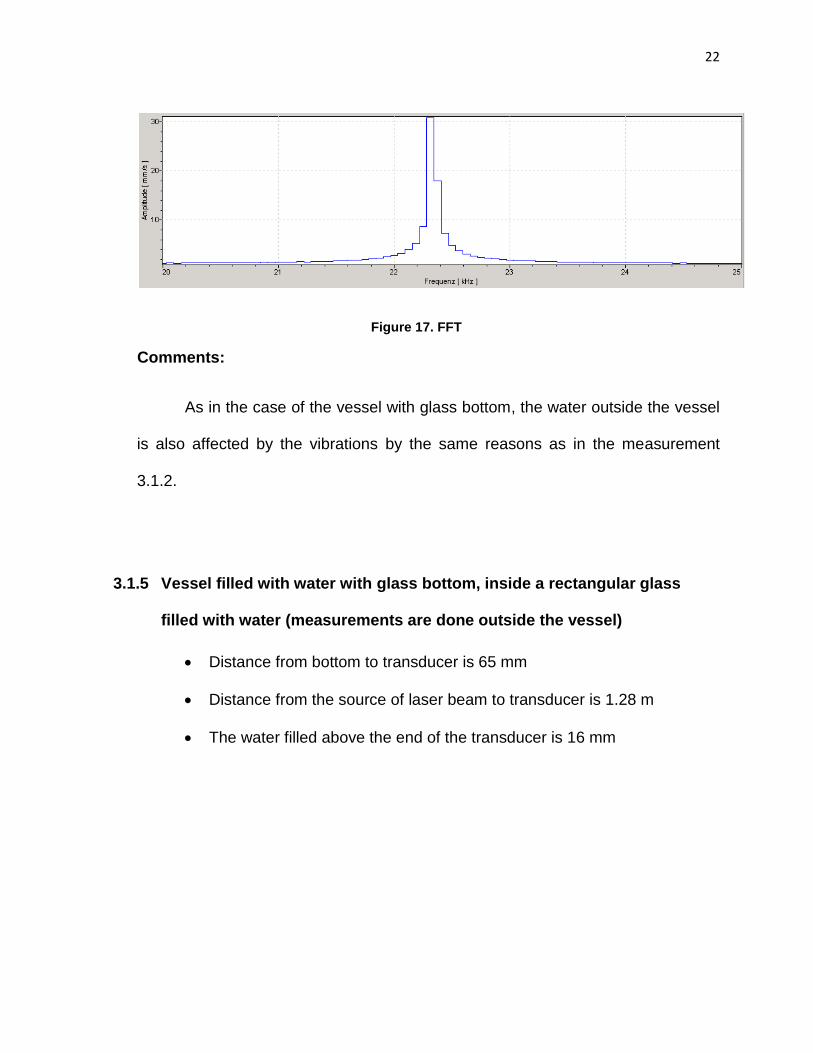
Figure 17. FFT
Comments:
As in the case of the vessel with glass bottom, the water outside the vessel
is also affected by the vibrations by the same reasons as in the measurement
3.1.2.
3.1.5 Vessel filled with water with glass bottom, inside a rectangular glass
filled with water (measurements are done outside the vessel)
Distance from bottom to transducer is 65 mm
Distance from the source of laser beam to transducer is 1.28 m
The water filled above the end of the transducer is 16 mm

23
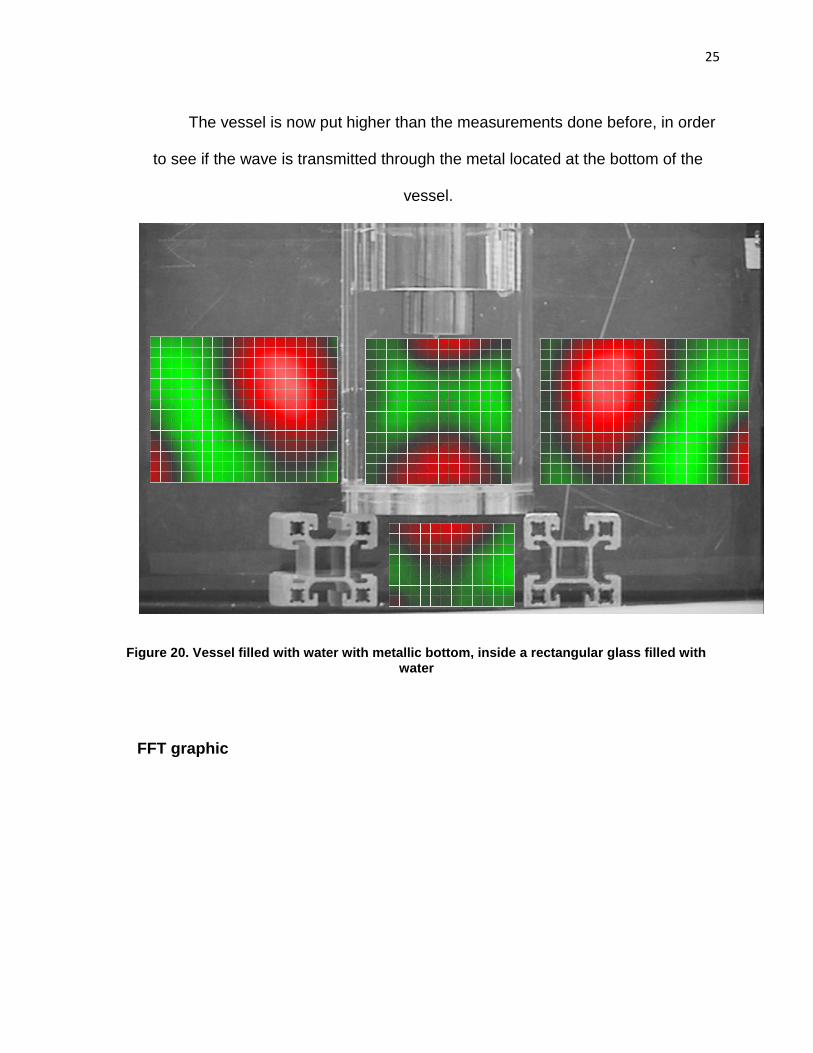
The vessel is now put higher than the measurements done before, in order
to see if the wave is transmitted through the glass in the bottom of the vessel. The
distance from the bottom of the vessel to the transducer is 65 mm
F
F
FFT graphic
Figure 18. Vessel filled with water with glass bottom, inside a rectangular glass filled with water
24
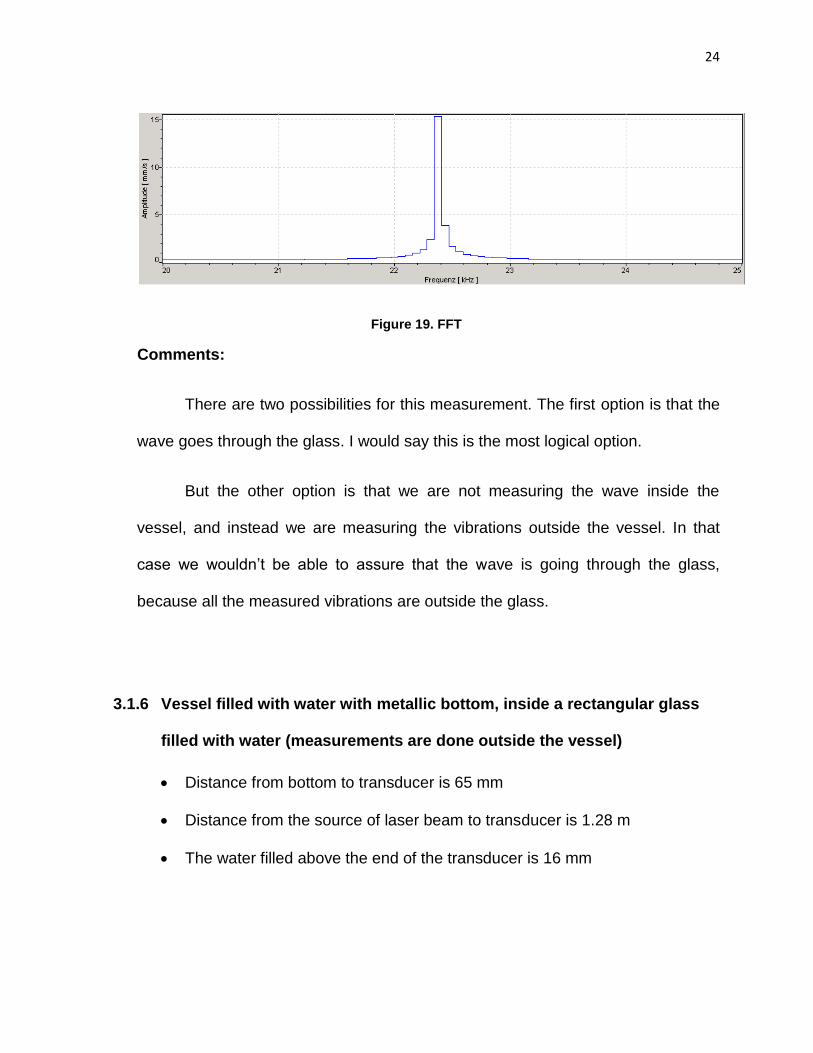
Figure 19. FFT
Comments:
There are two possibilities for this measurement. The first option is that the
wave goes through the glass. I would say this is the most logical option.
But the other option is that we are not measuring the wave inside the
vessel, and instead we are measuring the vibrations outside the vessel. In that
case we wouldn’t be able to assure that the wave is going through the glass,
because all the measured vibrations are outside the glass.
3.1.6 Vessel filled with water with metallic bottom, inside a rectangular glass
filled with water (measurements are done outside the vessel)
Distance from bottom to transducer is 65 mm
Distance from the source of laser beam to transducer is 1.28 m
The water filled above the end of the transducer is 16 mm
25
The vessel is now put higher than the measurements done before, in order
to see if the wave is transmitted through the metal located at the bottom of the
vessel.
Figure 20. Vessel filled with water with metallic bottom, inside a rectangular glass filled with water
FFT graphic

26
Figure 21. FFT
Comments:
The same conclusion as the measurement in 3.1.5.
3.1.7 Complete metallic vessel filled with water, inside a rectangular glass
filled with water
Distance from bottom to transducer is 65 mm
Distance from the source of laser beam to transducer is 1.28 m
The water filled above the end of the transducer is 16 mm

27
The vessel is put higher than the measurements done before, in order to
see if he wave is transmitted through the metal located at the bottom of the vessel.
Figure 22. Complete metallic vessel filled with water, inside a rectangular glass filled with water
FFT graphic

28
Figure 23. FFT
Comments:
Something unexpected seems to happen in this experiment. Under the
bottom of the vessel the wave is travelling horizontally. I would have expected
that, if the wave is going through the bottom of the cylindrical vessel, the wave
measured under this vessel would have to travel vertically, but this is not seen in
the experiment. Because of this reason, it can be concluded that the wave doesn’t
go through the bottom of the metallic vessel, but it does go through the sides of
the vessel.
A reasonable conclusion of why the wave is travelling horizontally under the
metallic vessel is because the water that has been excited in the right and left side
of the vessel affects all the water in the rectangular container, and therefore the
area under the metallic vessel also vibrates.
The maximum velocity is 20 mm/s
29
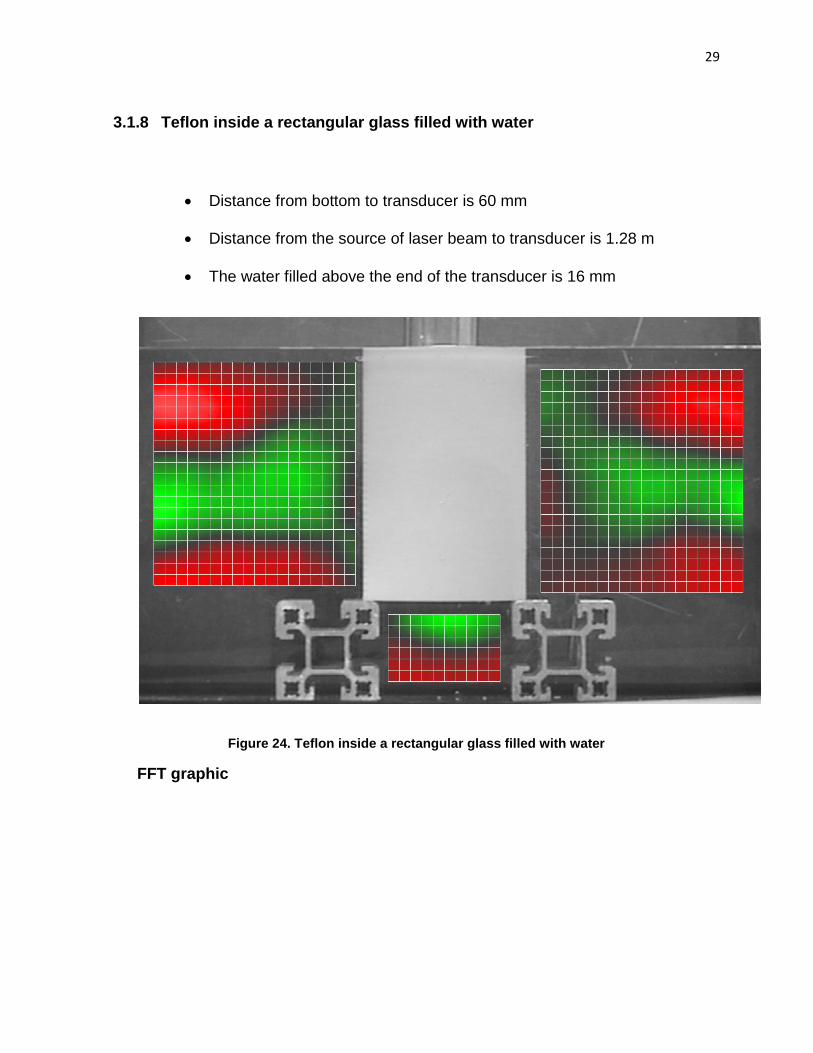
3.1.8 Teflon inside a rectangular glass filled with water
Distance from bottom to transducer is 60 mm
Distance from the source of laser beam to transducer is 1.28 m
The water filled above the end of the transducer is 16 mm
Figure 24. Teflon inside a rectangular glass filled with water
FFT graphic
30
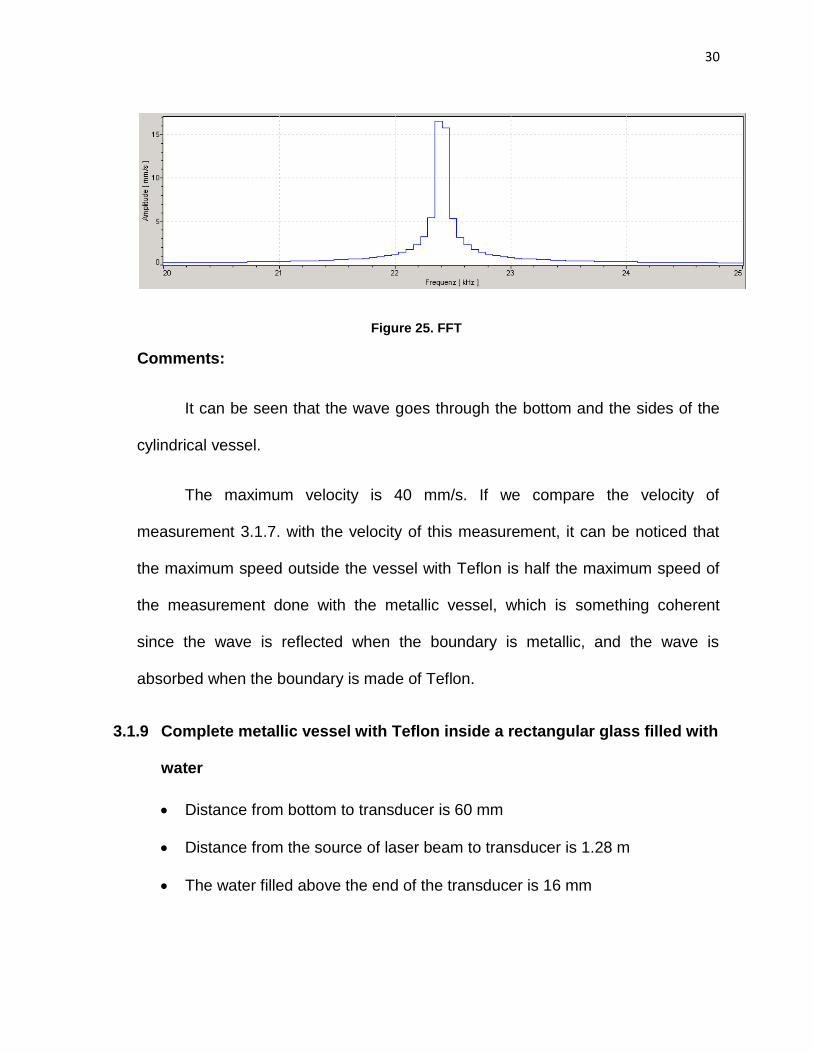
Figure 25. FFT
Comments:
It can be seen that the wave goes through the bottom and the sides of the
cylindrical vessel.
The maximum velocity is 40 mm/s. If we compare the velocity of
measurement 3.1.7. with the velocity of this measurement, it can be noticed that
the maximum speed outside the vessel with Teflon is half the maximum speed of
the measurement done with the metallic vessel, which is something coherent
since the wave is reflected when the boundary is metallic, and the wave is
absorbed when the boundary is made of Teflon.
3.1.9 Complete metallic vessel with Teflon inside a rectangular glass filled with
water
Distance from bottom to transducer is 60 mm
Distance from the source of laser beam to transducer is 1.28 m
The water filled above the end of the transducer is 16 mm

31
The vessel is put higher, in order to see if the wave is transmitted through
the metal located at the bottom of the vessel.
Figure 26. Complete metallic vessel with Teflon inside a rectangular glass filled with water
FFT graphic

32
Figure 27. FFT
Comments:
It is very strange to see that below the cylindrical vessel it looks like the
wave is going from the bottom to the top outside the vessel. Again, this
experiment demonstrates that the wave is not transmitted through the bottom of
the cylindrical vessel, like the measurement 3.1.7. and the reason why the wave is
going from the bottom to the top under the metallic vessel is because that wave is
only a consequence of the vibrations of the water that has been excited on the left
and right of the cylindrical vessel.
3.1.10 Metallic cylindrical vessel filled with water
Distance from bottom to transducer is 60 mm
Distance from the source of laser beam to transducer is 1.28 m
The water filled above the end of the transducer is near 16 mm. The 16 mm
distance is not very precise since the measurement of that distance was
difficult to achieve.
A reflective tape was used in order to improve the laser signal.
The maximum velocity is 4mm/s
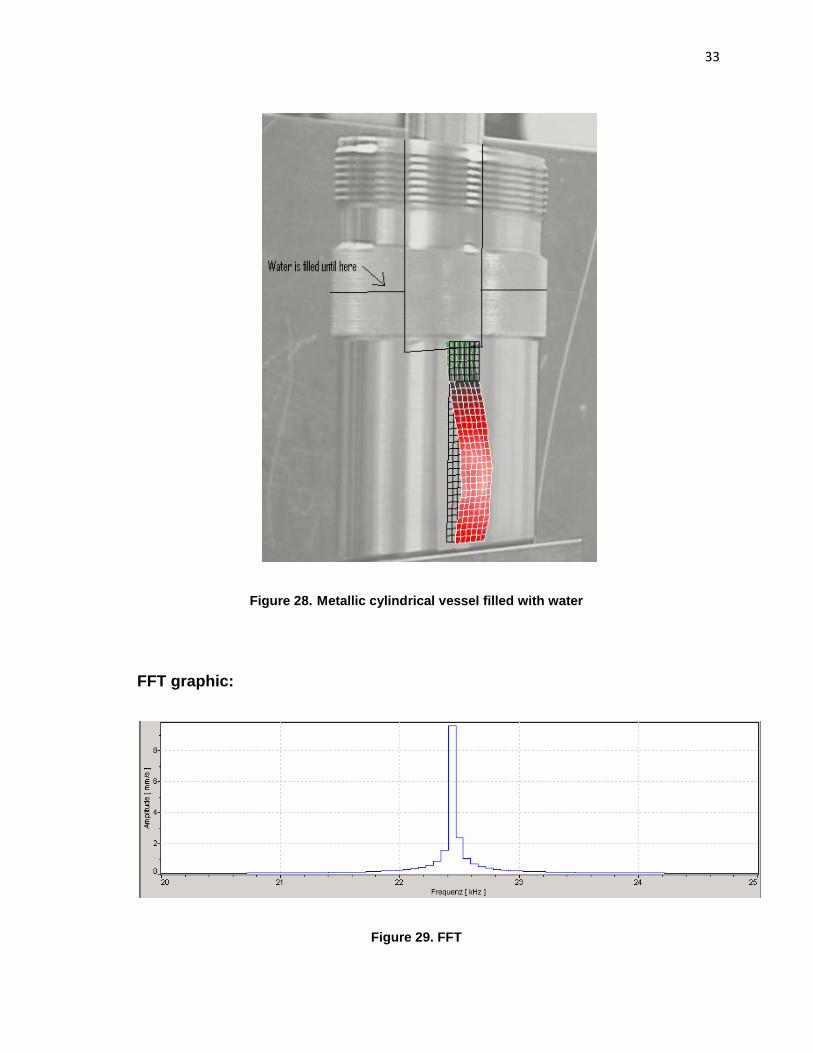
33
Figure 28. Metallic cylindrical vessel filled with water
FFT graphic:
Figure 29. FFT
34
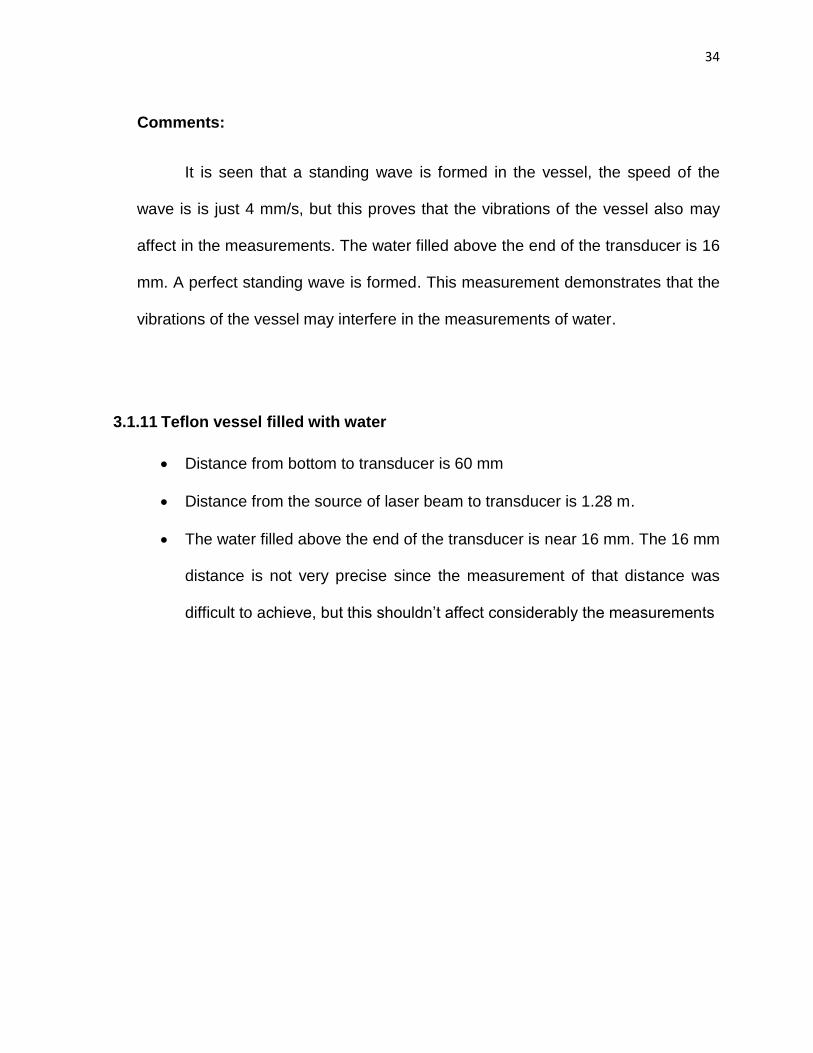
Comments:
It is seen that a standing wave is formed in the vessel, the speed of the
wave is is just 4 mm/s, but this proves that the vibrations of the vessel also may
affect in the measurements. The water filled above the end of the transducer is 16
mm. A perfect standing wave is formed. This measurement demonstrates that the
vibrations of the vessel may interfere in the measurements of water.
3.1.11 Teflon vessel filled with water
Distance from bottom to transducer is 60 mm
Distance from the source of laser beam to transducer is 1.28 m.
The water filled above the end of the transducer is near 16 mm. The 16 mm
distance is not very precise since the measurement of that distance was
difficult to achieve, but this shouldn’t affect considerably the measurements

35
Figure 30. Teflon vessel filled with water
FFT graphic:
36
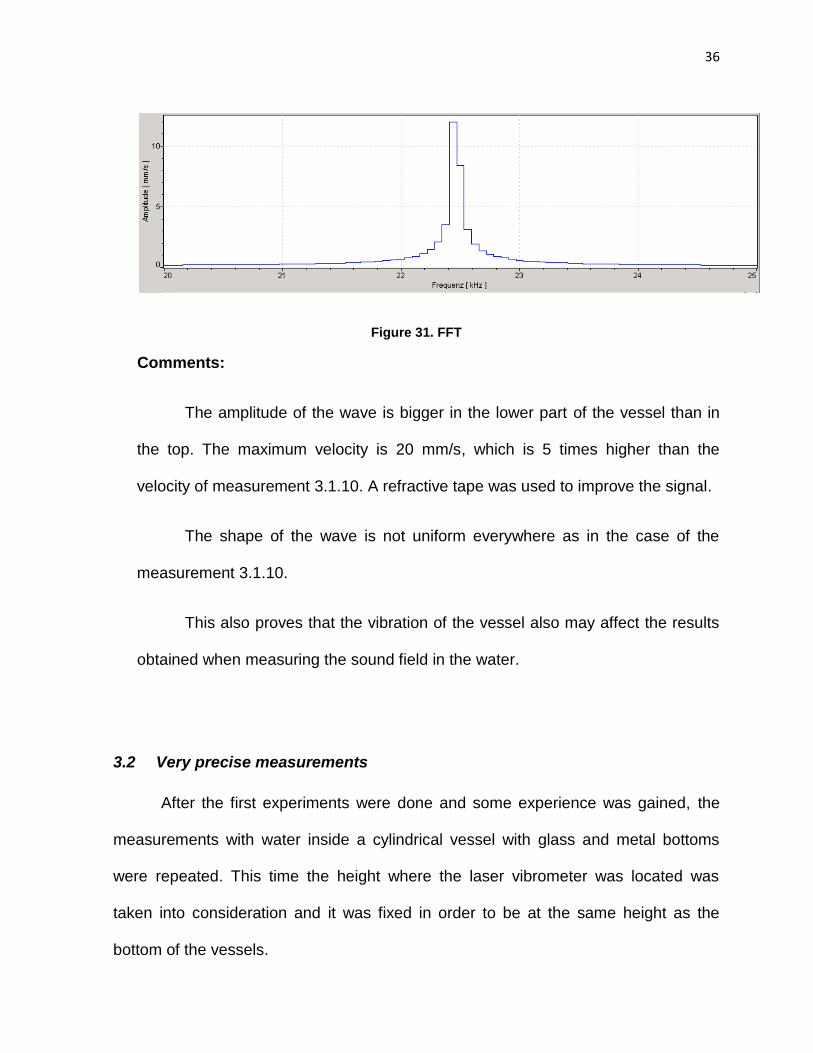
Figure 31. FFT
Comments:
The amplitude of the wave is bigger in the lower part of the vessel than in
the top. The maximum velocity is 20 mm/s, which is 5 times higher than the
velocity of measurement 3.1.10. A refractive tape was used to improve the signal.
The shape of the wave is not uniform everywhere as in the case of the
measurement 3.1.10.
This also proves that the vibration of the vessel also may affect the results
obtained when measuring the sound field in the water.
3.2 Very precise measurements
After the first experiments were done and some experience was gained, the
measurements with water inside a cylindrical vessel with glass and metal bottoms
were repeated. This time the height where the laser vibrometer was located was
taken into consideration and it was fixed in order to be at the same height as the
bottom of the vessels.
37
Also, the distance from the laser vibrometer to the transducer was larger than
the first measurements, this time the distance was 2.26 m. The reason why we
increased the distance was to have less variation of the angle than the
measurements done with 1.28 m.
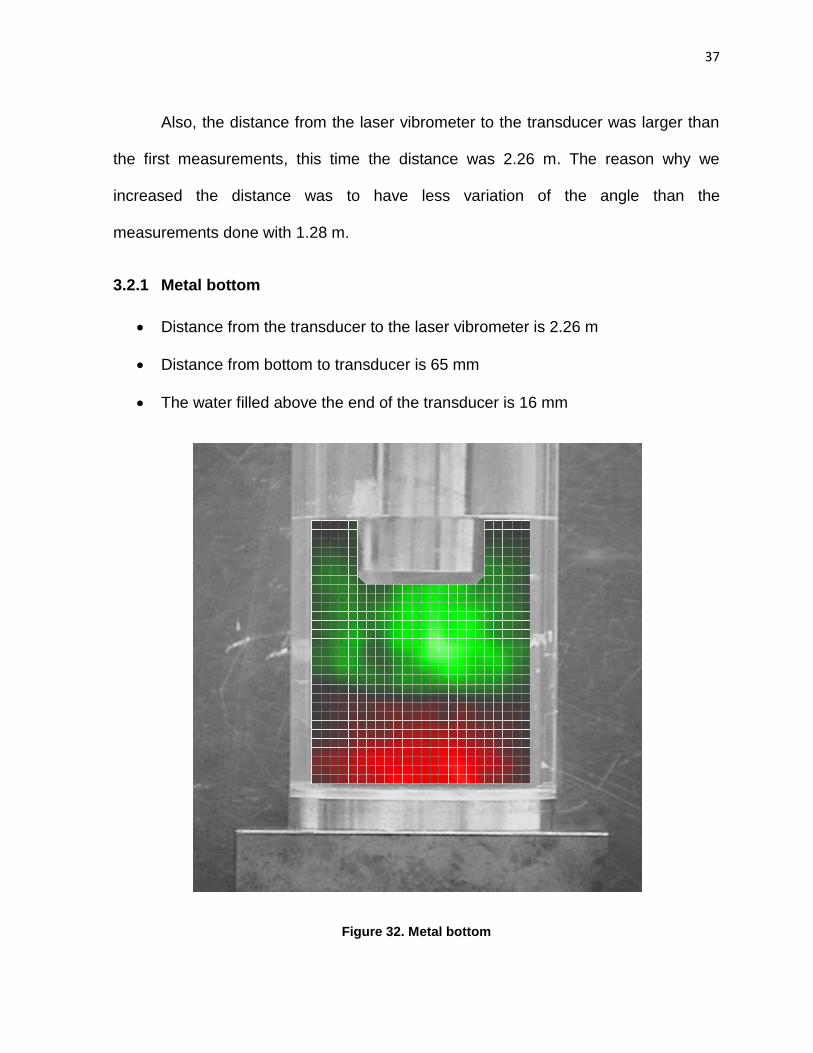
3.2.1 Metal bottom
Distance from the transducer to the laser vibrometer is 2.26 m
Distance from bottom to transducer is 65 mm
The water filled above the end of the transducer is 16 mm
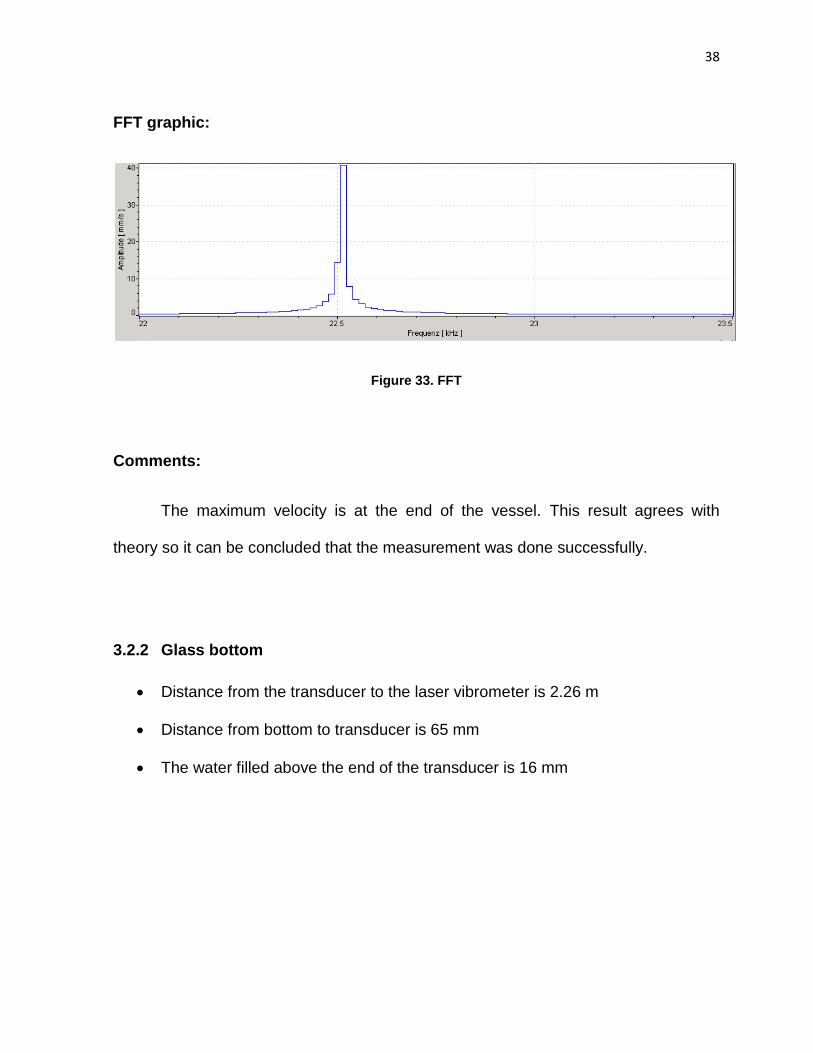
Figure 32. Metal bottom
38
FFT graphic:
Figure 33. FFT
Comments:
The maximum velocity is at the end of the vessel. This result agrees with
theory so it can be concluded that the measurement was done successfully.
3.2.2 Glass bottom
Distance from the transducer to the laser vibrometer is 2.26 m
Distance from bottom to transducer is 65 mm
The water filled above the end of the transducer is 16 mm

39
Figure 34. Glass Bottom
FFT graphic:

40
Figure 35. FFT
Comments:
This measurement looks really similar to the measurement in figure 6. It can be
concluded that the distance from the transducer to the laser vibrometer didn’t affect
this measurement.
4 Conclusions and Recommendations
The conclusions that can be done are:
In the theoretical analysis the main goal of having parallel lines was
achieved by putting a cylindrical vessel, but because of the experimental
limitations that idea was not carried out. If the divergence of the laser beam
is corrected, then the problem would be solved, but that is not an easy task
to do.
In the figures 6, 7 and 8, it could be seen the dependence of the firing angle
and the variation of the angles inside the vessel filled with water. If we knew
what the maximum angle we can tolerate is, then this data could be used.
41
Further calculations will have to be done to determine what the value of this
tolerance is.
In all the experimental work that had been done, one clear parameter
appears. It is observed that under the transducer there is always higher
amplitude than in the top. This pattern is observed even in the
measurements 3.1.7 and 3.1.8, which are the measurements done in the
water outside the cylindrical vessel.
It can be seen that when using the metallic vessel, the sound wave doesn’t
go through the bottom of the vessel
In the FFT graphic there is always a clear peak in the resonance
frequency.
It is seen that there is a reflected wave in the bottom of the vessel,
especially in the measurement with the glass with the metal bottom.
The vibrations of the vessels can affect the measurements of the sound
fields in water.
The recommendations I can give are:
Align the positions on the live video image with the position of the laser in the
cylindrical vessel, otherwise the laser won’t move the way you expect. Always
be aware of checking this in order to obtain good results!
Use a refractive tape if the signal of the laser is not good enough for the
measurements.

42
Always try to get the best resolution by adding more scanning points in order
to get the best results. It might take a little bit more time but the results may
change if the scanning points are not enough
To get other mode shapes, the distance from the bottom to the transducer
should be changed. Further experiments must be done to prove this.

43
5 Bibliography
Hemsel, E. (2011). Measurements of Ultrasound.
Bornmann, P. (2011). Transducer design for ultrasound applications. Germany.
Harvey, G. (2004). Ultrasonic Field Measurement in test cells combining the acousto-
optic effect, laser interferometry & tomography. IEEE Ultrasonic Symposium .
Klubal, M. (2011). Laser beam Path.
Matar, O. (2000). Characterization of airborne transducers by optical tomography.
Ultrasonics .
Zipser, L. (2007). Refracto-Vobrometry for visualazing ultrasound in gases, fluids and
condensed matter. IEEE Ultrasonic Symposium .