Treball Final de Grau - UBdiposit.ub.edu/dspace/bitstream/2445/138019/1/TFG_QU Serra Ventura,...
57
Tutor/s Dr. José F. García Departament d’Enginyeria Química i Química Analítica Dr. Alex Tarancón Departament d’Enginyeria Química i Química Analítica Treball Final de Grau Determination of the radioactive potassium content in bananas. Determinació del contingut de potassi radioactiu dels plàtans. Joan Serra Ventura June 2019
Transcript of Treball Final de Grau - UBdiposit.ub.edu/dspace/bitstream/2445/138019/1/TFG_QU Serra Ventura,...

Tutor/s
Dr. José F. García Departament d’Enginyeria Química i
Química Analítica
Dr. Alex Tarancón Departament d’Enginyeria Química i
Química Analítica
Treball Final de Grau
Determination of the radioactive potassium content in bananas.
Determinació del contingut de potassi radioactiu dels plàtans.
Joan Serra Ventura June 2019


Aquesta obra esta subjecta a la llicència de: Reconeixement–NoComercial-SenseObraDerivada
http://creativecommons.org/licenses/by-nc-nd/3.0/es/

I am among those who think that science has great beauty.
Marie Curie
Després d’aquests quatre mesos d’intensa feina i plenament integrat en el món de la
recerca, m’agradaria agrair a totes aquelles persones que han fet possible tirar endavant
aquest treball.
Primerament, agrair els meus tutors, José F. García i Alex Tarancón, per la seva valuosa
ajuda, paciència i per haver-me proporcionat totes les eines i coneixements necessaris per
poder dur a terme aquest treball. També agrair a l’Héctor Bagán per la seva gran implicació i
hores dedicades durant aquest temps.
Agrair també el suport incondicional que m’ha donat la meva mare, el meu pare i la meva
germana durant tots aquests anys, els seus consells i la seva comprensió en els moments més
difícils.
També voldria agrair els companys del grup QÜESTRAM R, tant estudiants de TFG com de
Màster, per totes aquelles tardes amenes que hem passat al laboratori.
Finalment, agrair tots els bons amics que he fet durant el grau, i que de ben segur seran per
tota la vida, per tots els moments i experiències viscudes que han fet d’aquests quatre anys una
de les millors etapes de la meva vida.
A tots vosaltres,
Moltes gràcies.


REPORT

Determination of the radioactive potassium content in bananas. 1
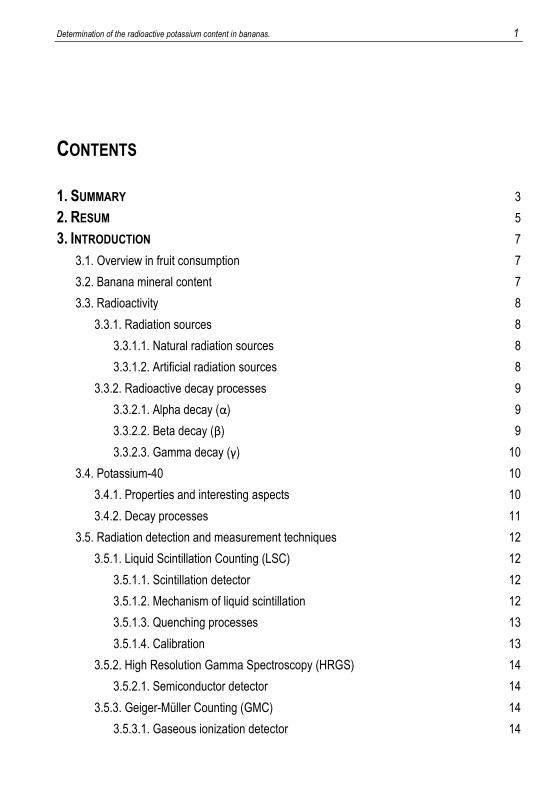
CONTENTS
1. SUMMARY 3
2. RESUM 5
3. INTRODUCTION 7
3.1. Overview in fruit consumption 7
3.2. Banana mineral content 7
3.3. Radioactivity 8
3.3.1. Radiation sources 8
3.3.1.1. Natural radiation sources 8
3.3.1.2. Artificial radiation sources 8
3.3.2. Radioactive decay processes 9
3.3.2.1. Alpha decay (α) 9
3.3.2.2. Beta decay (β) 9
3.3.2.3. Gamma decay (γ) 10
3.4. Potassium-40 10
3.4.1. Properties and interesting aspects 10
3.4.2. Decay processes 11
3.5. Radiation detection and measurement techniques 12
3.5.1. Liquid Scintillation Counting (LSC) 12
3.5.1.1. Scintillation detector 12
3.5.1.2. Mechanism of liquid scintillation 12
3.5.1.3. Quenching processes 13
3.5.1.4. Calibration 13
3.5.2. High Resolution Gamma Spectroscopy (HRGS) 14
3.5.2.1. Semiconductor detector 14
3.5.3. Geiger-Müller Counting (GMC) 14
3.5.3.1. Gaseous ionization detector 14
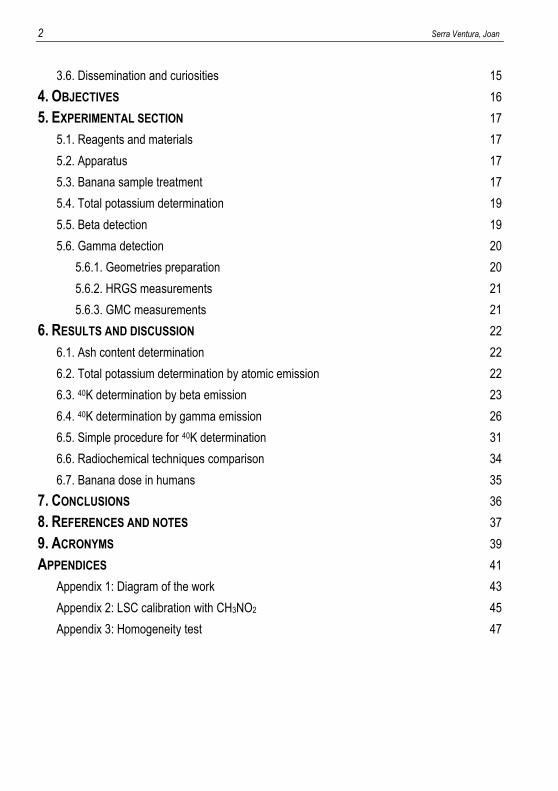
2 Serra Ventura, Joan
3.6. Dissemination and curiosities 15
4. OBJECTIVES 16
5. EXPERIMENTAL SECTION 17
5.1. Reagents and materials 17
5.2. Apparatus 17
5.3. Banana sample treatment 17
5.4. Total potassium determination 19
5.5. Beta detection 19
5.6. Gamma detection 20
5.6.1. Geometries preparation 20
5.6.2. HRGS measurements 21
5.6.3. GMC measurements 21
6. RESULTS AND DISCUSSION 22
6.1. Ash content determination 22
6.2. Total potassium determination by atomic emission 22
6.3. 40K determination by beta emission 23
6.4. 40K determination by gamma emission 26
6.5. Simple procedure for 40K determination 31
6.6. Radiochemical techniques comparison 34
6.7. Banana dose in humans 35
7. CONCLUSIONS 36
8. REFERENCES AND NOTES 37
9. ACRONYMS 39
APPENDICES 41
Appendix 1: Diagram of the work 43
Appendix 2: LSC calibration with CH3NO2 45
Appendix 3: Homogeneity test 47

Determination of the radioactive potassium content in bananas. 3
1. SUMMARY
Bananas are known to be a great source of potassium. One of the natural isotopes of
potassium, potassium-40, turns out to be radioactive. This isotope is classified as a beta and
gamma emitter and even though it only represents a 0.0117% of the total natural potassium, its
presence in bananas makes this fruit to be classified as a radioactive food.
For the determination of bananas potassium-40 content different radiochemical techniques
have been used depending on the nature of the radioactive emission that is desired to measure.
In one hand, the liquid scintillation technique for the beta particles emission and in the other
hand the high resolution gamma spectrometry for the gamma rays emission. Furthermore, it has
been used a Geiger-Müller counter, whose typical use is to quickly detect radiation in working
surfaces with the aim of establishing a simple 40K determination method in bananas to apply in
teaching environments.
The determination of 40K via high resolution gamma spectrometry in a banana ashes matrix
and a reduced size geometry has provided the most exact results among all the others
radiochemical techniques that have been used in this work. The design and application of a
simple procedure for the same determination have been successfully achieved, having been
banana ashes measurements with a Geiger-Müller counter the best option.
The determination has led to the establishment of the banana activity and the radiation dose
received when this fruit is ingested. In the same way, such data have been used for the
comparison of daily or extreme scenarios, such as tobacco use or a nuclear plant accident, with
the emitted radiation by a single banana for the purpose of raise awareness of the continuous
radiation that our bodies are subjected.
Keywords: Bananas, Radioactivity, Potassium, 40K.

Determination of the radioactive potassium content in bananas. 5
2. RESUM
Els plàtans són coneguts per ser una fruita rica en potassi. Un dels isòtops naturals del
potassi, el potassi-40, resulta ser radioactiu. Aquest isòtop és classificat com un emissor de
partícules beta i gamma i, tot i que la seva abundància sigui només del 0.0117%, la seva
presència en el plàtan és la causa de que aquest sigui denominat com a un aliment radioactiu.
Per a la determinació del contingut de potassi-40 en plàtans s’han emprat diverses
tècniques radioquímiques depenent del tipus d’emissió radioactiva que s’ha volgut mesurar. Per
una banda, la tècnica del centelleig líquid per a l’emissió de partícules beta i, per l’altra banda,
l’espectrometria gamma d’alta resolució per a l’emissió de raigs gamma. També s’ha utilitzat un
altre tipus de comptador anomenat Geiger-Müller, comunament utilitzat per a una ràpida
detecció de radiació en superfícies de treball, amb el propòsit d’establir un mètode simple de
determinació de 40K en plàtans per a la seva futura implementació en entorns docents.
La determinació de 40K mitjançant la tècnica d’espectrometria gamma d’alta resolució en
una matriu de cendres de plàtan i en una geometria de mida reduïda ha proporcionat els
resultats més exactes d’entre totes les tècniques radioquímiques que s’han emprat en aquest
treball. La posada a punt d’un mètode simple per a la mateixa determinació s’ha dut a terme
satisfactòriament, havent sigut la millor opció les mesures de cendres de plàtan amb un
comptador Geiger-Müller.
Aquesta determinació ha portat a l’establiment de l’activitat del plàtan i la dosi de radiació
que rep un ésser humà al ingerir-lo. Tanmateix, també s’ha utilitzat aquesta dada per a la
comparació d’escenaris tan quotidians, per exemple el consum de tabac, com extrems, com ara
un accident nuclear, amb la radiació que emet un plàtan per tal de conscienciar a la població
sobre la contínua exposició a la radiació a la que els nostres cossos estan sotmesos.
Paraules clau: Plàtans, Radioactivitat, Potassi, 40K.


Determination of the radioactive potassium content in bananas. 7
3. INTRODUCTION
It’s worthwhile to start this work with a preliminary contextualization of the topic at different
levels: the day-to-day presence of the paper main protagonist, banana; its role and standing in
our nutrition, its close relationship with radioactivity and how to measure it and finally certain
curiosities that may be of interest for the reader.
3.1. OVERVIEW IN FRUIT CONSUMPTION
Fruits and vegetables are essential components in a healthy diet, also an enough daily
consumption could contribute in the prevention of important diseases such as diabetes, certain
types of cancer and cardiovascular diseases. Approximately 3.9 million of deaths worldwide in
2017 could be connected to a low fruit and vegetable consumption, as announced by World
Health Organization (WHO) and Food and Agriculture Organization of the United Nations
(FAO)(1).
It is well known the recommendation of health
professionals and organizations about the consumption of 5
pieces of fruit or the equivalent of, at least, 400 g of fruit per
day. A large number of reports and surveys about the Spanish
population fruit consumption(2) reveal that fruit predominates
above lactic products and sweets as desserts in daily meals,
resulting that Canarias banana is almost always the most
cheered fruit (Figure 1).
3.2. BANANA MINERAL CONTENT
The mineral composition of Canarias banana may vary according to different factors
referred to all the stages between cultivation and consumption of the fruit: from the geography of
the crops zone, including soil type or altitude; the agriculture techniques used and the
transporting and storage of the product(3). All this parameters could be subject of chemometrics
studies with the aim of classifying unknown banana samples into concrete defined groups.
Figure 1. Canarias banana.
8 Serra Ventura, Joan
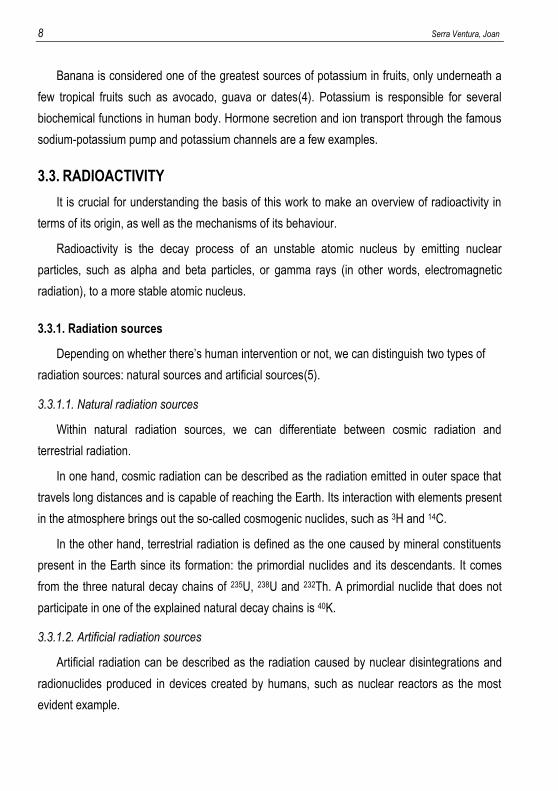
Banana is considered one of the greatest sources of potassium in fruits, only underneath a
few tropical fruits such as avocado, guava or dates(4). Potassium is responsible for several
biochemical functions in human body. Hormone secretion and ion transport through the famous
sodium-potassium pump and potassium channels are a few examples.
3.3. RADIOACTIVITY
It is crucial for understanding the basis of this work to make an overview of radioactivity in
terms of its origin, as well as the mechanisms of its behaviour.
Radioactivity is the decay process of an unstable atomic nucleus by emitting nuclear
particles, such as alpha and beta particles, or gamma rays (in other words, electromagnetic
radiation), to a more stable atomic nucleus.
3.3.1. Radiation sources
Depending on whether there’s human intervention or not, we can distinguish two types of
radiation sources: natural sources and artificial sources(5).
3.3.1.1. Natural radiation sources
Within natural radiation sources, we can differentiate between cosmic radiation and
terrestrial radiation.
In one hand, cosmic radiation can be described as the radiation emitted in outer space that
travels long distances and is capable of reaching the Earth. Its interaction with elements present
in the atmosphere brings out the so-called cosmogenic nuclides, such as 3H and 14C.
In the other hand, terrestrial radiation is defined as the one caused by mineral constituents
present in the Earth since its formation: the primordial nuclides and its descendants. It comes
from the three natural decay chains of 235U, 238U and 232Th. A primordial nuclide that does not
participate in one of the explained natural decay chains is 40K.
3.3.1.2. Artificial radiation sources
Artificial radiation can be described as the radiation caused by nuclear disintegrations and
radionuclides produced in devices created by humans, such as nuclear reactors as the most
evident example.

Determination of the radioactive potassium content in bananas. 9
Some common products of this activities that can end up in the nature by leakages or
controlled releases are: 238U, 235U and 90Sr, ordered from most to least half-life.
3.3.2. Radioactive decay processes
The decay process undergone by a particular nuclide depends on whether exists a
proton/neutron excess or deficit, as well as the mass-energy relation of the initial and final
nuclide.
It can be distinguished three types of radioactive decays: alpha decay, beta decay (positive
or negative), and gamma decay(5).
3.3.2.1. Alpha decay (α)
A nuclide disintegrates emitting an helium-4 particle ( 𝐻𝑒2+)24 of a characteristic energy that
depends on the initial nuclide. The decay can be represented as:
𝑋 → 𝑌 + 𝐻𝑒2+24
𝑍−2𝐴−4
𝑍𝐴
It is common in nuclides with a mass number (A) bigger than 150. Among its characteristics,
it can be highlighted its high ionization power but low penetration effect. Thus, alpha radiation
can be stopped by a simple sheet of paper.
3.3.2.2. Beta decay (β)
A nuclide disintegrates emitting either an electron (beta negative, β-) or a positron (beta
positive, β+). The decays can be represented as:
𝛽−: 𝑋 → 𝑌 + 𝑒− + �̅�𝑍+1𝐴
𝑍𝐴
𝛽+: 𝑋 → 𝑌′ +𝑍−1𝐴
𝑍𝐴 𝑒+ + 𝑣
where �̅� is an antineutrino and 𝑣 a neutrino. These particles were postulated by Wolfgang E.
Pauli in 1927 in order to comply the conservation law of linear momentum and the total kinetic
moment. Because of the null presence of e- or e+ in a nucleus, these processes can be
explained as the transformation of a neutron into a proton emitting an electron and the
antineutrino (in β- radioactivity) or the transformation of a proton into a neutron emitting a
positron and the corresponding neutrino (in β+ radioactivity).
In a much lower probability, a nuclide can also undergo a process of electron capture (EC),
where a nucleus proton captures an atomic orbital electron emitting a neutron and a neutrino.
The decay proceeds as following:

10 Serra Ventura, Joan
𝑋 + 𝑒− → 𝑌′ + 𝑣 𝑍−1𝐴
𝑍𝐴
This process is in competence with β+ decay, although the difficulties of an innermost K
shell electron of being in close contact with a proton.
The beta decay process can be undergone by any type of nuclide, including a single proton
or neutron and results in a continuous energy spectrum characteristic of every nuclide. It has a
medium ionization power and penetration effect compared to α radioactivity. As a result, a few
millimetres of lead are needed to stop β radioactivity.
3.3.2.3. Gamma decay (γ)
As a consequence of one of the radioactive decay processes explained above, a nuclide
can be left in an excited state. This nuclide can return to the ground state or a lower excited
state by photon emission (γ-ray, electromagnetic radiation) as shown hereunder:
𝑋∗ → 𝑋 + 𝛾𝑍𝐴
𝑍𝐴
The photons energy will depend in the state the nuclide returns. Since the energy states of a
nuclide are discrete (quantized) and characteristic of itself, each nuclide will emit monoenergetic
photons corresponding to its specific energetic transitions.
Finally, these photons are low ionizing but have a high penetration power and many
centimetres of lead are required to stop them.
3.4. POTASSIUM-40
As previously announced, 40K and its content in Canarias banana is the centre of this work,
so it is of interest to know about the nuclide, its radioactive properties and the different decay
processes that can undergo.
3.4.1. Properties and interesting aspects
40K is one of the three natural isotopes (along with 39K with a 93.26% abundance and 41K
with a 6.73% abundance) from a total of 24 potassium isotopes that are currently known(6). It
can be found mostly in the earth crust or forming part of minerals, in addition to its high
presence in oceans water.

Determination of the radioactive potassium content in bananas. 11
It is a radioactive (unstable) isotope that only represents a 0.0117% of the total natural
potassium. With one more neutron but the same atomic number (Z=19) in comparison with the
common potassium, it results in an atomic weight of 39.96 u(6).
A half-life of 1.25·109 years (1.3 billion years, in the order of the age of the universe) makes
40K a source of concern in terms of environmental care and radioactive pollution. One must take
into account that it is not the only radioactive isotope of potassium, but short half-lives (ranging
from milliseconds to less than a day) of these other nuclides and their artificial origin make them
not considered in a study of bananas radiation.
3.4.2. Decay processes
The two types of decay processes that 40K can undergo with a high probability are beta
negative decay and electron capture (Figure 2).
With a 89.25% of probability,
potassium-40 disintegrates by a
β- process emitting a beta
negative particle (electron) with
a maximum energy of 1.311
MeV and an antineutrino. As a
result, 40K decays to the ground
state of calcium-40 (40Ca)(7).
With a 10.55% of probability,
40K disintegrates by electron
capture emitting a neutrino and
followed by gamma emission
(photon) of 1.460 MeV. As a
result, 40K decays to an excited state of 40Ar(7).
In a very small probability, 40K can also disintegrate by electron capture to the ground state
of 40Ar (0.20%) and by beta positive emission (0.001%)(7).
Figure 2. Potassium-40 decay chain.
(Image extracted from M.-M. Bé et al. Table of Radionuclides, 2010, 5, 7-12)
12 Serra Ventura, Joan
3.5. RADIATION DETECTION AND MEASUREMENT TECHNIQUES
The radiochemical techniques used in this work for the determination of 40K and its
theoretical background are explained hereunder.
3.5.1. Liquid Scintillation Counting (LSC)
Developed in the late 40’s, nowadays liquid scintillation counting (LSC) is the baseline
technique for beta emitters measure, as in 40K case.
3.5.1.1. Scintillation detector
The LSC is based in a scintillation detector, which measures the induced luminescence in a
given compound caused by the electronic transitions to excited states and the subsequent de-
excitation by photon emission.
The scintillating substances used must comply the following requirements: to be transparent
in front of its own light flashes, in order to enable them to reach the photomultipliers; to emit light
with a similar spectrum of that corresponding to the photomultiplier spectral sensitivity curve
(typically between UV and IR zones, with a 400 nm maximum) and finally to emit a light flash
that quickly decays in order to not letting detection pulses to stack, so half-life of excited states
have to be short(5).
It can be distinguished two types of scintillating substances: inorganic and organic, the latter
being the one used in this work.
Organic scintillating substances are able in solid and liquid state (the last ones, usually
formed by dissolution of a solid scintillator in an organic aromatic solvent). Radiation excites the
organic scintillator with subsequent photons emission, which reach the detector.
3.5.1.2. Mechanism of liquid scintillation
Radiation excites organic aromatic solvent molecules, transferring the energy through them,
until scintillating substances (primary scintillators) are reached: the primary scintillator de-
excitation is followed by photon emission, particularly in the UV zone. Usually there are another
scintillating substances (secondary scintillators) that capture the emitted light and re-emit it in a
higher wavelength, which is more appropriate for the photomultiplier spectral sensitivity
curve(8).

Determination of the radioactive potassium content in bananas. 13
The photon avalanches reach the photomultipliers where are amplified, collected and
converted into electric signals. Later, they are converted into tension pulses and lastly counted
and classified into a multichannel according to their amplitudes which in turn is directly related
with the energy of the particle emitted in one nuclide disintegration (Figure 3).
Figure 3. Detection scheme of a nuclear particle in LSC and the corresponding quench processes that can
occur.
(Image extracted from Bagán H. Doctoral thesis, 2011, 28)
3.5.1.3. Quenching processes
During the energy transmission through the solvent, the scintillator and the photomultiplier it
can take place a reduction or inhibition of light emission due to an interference process:
quenching(9). When this phenomenon occurs, it can be expected a reduction in the detection
efficiency of the method. Hereafter are explained a few quenching processes to take into
consideration.
In a colour quenching process, a substance absorbs emitted photons preventing them from
reaching the photomultiplier.
In a chemical quenching process, a substance affects the energy transfer from the organic
aromatic solvent to the scintillator, capturing π electrons from the solvent.
3.5.1.4. Calibration
One of the most important parameters in liquid scintillation is detection efficiency (EffD),
EffD=Net cpm
Act×100
the fraction of photon avalanches counted by the detection system in relation to the total
number of disintegrations produced, where “Net cpm” is the difference between the registered
and the background counts and “Act” corresponds to the activity of the substance.

14 Serra Ventura, Joan
The most common calibration in LSC is the external calibration curve method, where
detection efficiency is correlated with a parameter, the quenching parameter, obtained either
from the sample spectrum or an external source.
The quenching parameters of an external source is obtained from the sample irradiation by
a radioactive source (the most common is 152Eu). The most used is the Spectral Quench
Parameter of the External Standard, or SQP(E), which is an indicator of the uppermost channel
number that comprises the integration of the 99.5% of the counts produced by the external
source when it irradiates a particular sample(10).
3.5.2. High Resolution Gamma Spectroscopy (HRGS)
In the spectroscopy field of gamma radiation semiconductor detectors are typically used at
the expense of inorganic scintillator detectors such as sodium iodide doped with thallium.
3.5.2.1. Semiconductor detector
In semiconductor detectors, the passage of radiation produces electron-hole pairs with their
subsequent movement, which generates an electric current proportional to the deposited energy
by the nuclear particle.
They are preferred for providing a high resolution that enables the interpretation of complex
gamma spectrum containing various peaks. However, they offer a lower detection efficiency
compared to an inorganic scintillator detector(5).
For its calibration, it has to be taken into consideration that detection efficiency will strongly
depend on the geometry of the sample recipient and the sample matrix.
3.5.3. Geiger-Müller Counting (GMC)
Geiger-Müller detectors are gaseous ionization detectors that work in a particular zone of
polarization.
For a better understanding of these detectors behavior, and concretely the Geiger-Müller
detector, it will be done a short overview of the most important theoretical concepts.
3.5.3.1. Gaseous ionization detector
Gaseous ionization detector measures the ionization produced by a radioactive source to a
gas enclosed in a chamber, which contains two electrodes working as a condenser when a
Determination of the radioactive potassium content in bananas. 15
voltage is applied. The constant voltage will experiment a slight fall, that will later be measured,
due to the electron-ion pairs formed during the ionization process(5).
Depending on the magnitude of the electric field intensity, the detector can work in several
different ways. The Geiger-Müller detector works in the so-called Geiger zone, where the
electric field intensity is such that it produces an electron avalanche due to a massive formation
of electron-ion pairs. As a result, Geiger-Müller detectors cannot distinguish between charged
particles or different energies.
As in the case of HRGS, for GMC calibration has to be taken into consideration that
detection efficiency will strongly depend on the sample matrix and geometry used.
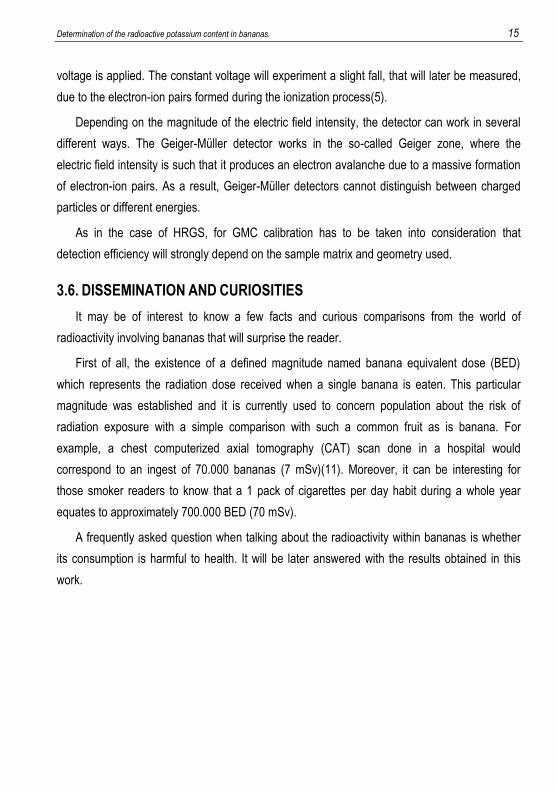
3.6. DISSEMINATION AND CURIOSITIES
It may be of interest to know a few facts and curious comparisons from the world of
radioactivity involving bananas that will surprise the reader.
First of all, the existence of a defined magnitude named banana equivalent dose (BED)
which represents the radiation dose received when a single banana is eaten. This particular
magnitude was established and it is currently used to concern population about the risk of
radiation exposure with a simple comparison with such a common fruit as is banana. For
example, a chest computerized axial tomography (CAT) scan done in a hospital would
correspond to an ingest of 70.000 bananas (7 mSv)(11). Moreover, it can be interesting for
those smoker readers to know that a 1 pack of cigarettes per day habit during a whole year
equates to approximately 700.000 BED (70 mSv).
A frequently asked question when talking about the radioactivity within bananas is whether
its consumption is harmful to health. It will be later answered with the results obtained in this
work.

16 Serra Ventura, Joan
4. OBJECTIVES
The main objective of this work is the development of a procedure to determine 40K in
bananas by radiochemical techniques. To achieve it, the following points are proposed.
First of all, the elaboration of a sample treatment plan with the aim of eliminate the
interfering substances in bananas to obtain a suitable matrix to work on the further
determinations.
Secondly, the total potassium determination of bananas by a spectroscopic technique such
as flame emission. The following results will be referenced to the value obtained in this stage of
the work.
Next, the design and application of a procedure for the 40K determination of bananas by its
beta and gamma emissions.
The comparison of 40K activities obtained by the different radiochemical techniques to
discuss possible differences obtained.
Finally, the design and application of a simple procedure for the 40K determination to
implement in a learning environment.

Determination of the radioactive potassium content in bananas. 17
5. EXPERIMENTAL SECTION
5.1. REAGENTS AND MATERIALS
All the reagents used are of analytical grade. Hydrochloric acid fuming 37% by Merck KGaA
(Darmstadt, Germany) and nitric acid 65% by Fisher Scientific (Loughborough, England) have
been used to prepare the acid solution for ashes attack. Nitric acid and nitromethane (by Merck
KGaA) have been used as chemical quenching agents.
For LS measurements, the scintillation cocktail Optiphase HiSafe 3 by PerkinElmer has
been used.
5.2. APPARATUS
An atomic absorption/emission spectrometer AAnalyst 200 AA
(by PerkinElmer) has been used for total K measurements.
A 1220 Quantulus liquid scintillation detector (by EG&G Wallac)
with logarithmic amplification and a multichannel analyser of 4096
channels has been used for LS measurements (Figure 4).
A high resolution gamma spectrometer with an intrinsic
germanium detector (by Canberra) has been used for gamma
emissions measurements.
A LB 124 Geiger-Müller counter (by Berthold Technologies) has
been used for β/γ measurements.
5.3. BANANA SAMPLE TREATMENT
A representative sampling of bananas and its treatment by crushing and dry ashes
method(12) previously designed (Table 1) has been done for the later determinations of total K
and 40K. The sample used during all the work has been the edible parts of Canarias banana
from Plátano de Canarias brand, Cavendish variety with a minimum size of 16 cm.
Figure 4. 1220 Quantulus liquid scintillation detector by
EG&G Wallac.

18 Serra Ventura, Joan
Stage Image Description
Raw material
Banana edible part
Crushed
Homogeneous paste after crushing
Carbonized
Dark brown residue after 200ºC sand bath
Calcined
White ashes after 500ºC calcination
Acid attack
Ashes dissolution. Yellow coloration is due to HNO3 thermal
decomposition
Table 1. Sample treatment stages.

Determination of the radioactive potassium content in bananas. 19
Bananas have been crushed in a closed blender until achieving an homogeneous paste. 30
g of the result have been transferred into porcelain capsules. The replicates have been first
heated in a sand bath at approximately 200ºC and later calcined at 500ºC, performing a ramp of
temperatures to avoid sample inflammation. During the process temperature has not been
increased beyond 500ºC to prevent potassium loss(3)(13). The obtained ashes have been
dissolved with 25 mL of a HCl 1:1/HNO3 1:1 solution and an additional 5 mL of concentrated
HNO3. To ensure the full dissolution, capsules have been heated to approximately 100ºC in a
sand bath.
5.4. TOTAL POTASSIUM DETERMINATION
Total potassium determination of bananas has been done by Flame Atomic Emission
Spectroscopy (FAES) with few additional sample treatment steps.
Capsule contents have been filtered with ashless 110-mm filter papers (Whatman,
Buckinghamshire, UK) and transferred into 250 mL flasks filled up with double deionized
water(14). A volume of 2.5 mL of the solutions has been diluted to 25 mL flasks in order to
reach the concentration of the technique calibration range. A concentration of 1000 ppm Na has
been introduced into the measuring 25 mL flasks acting as a ionization suppressor(15).
Standards have been prepared by consecutive dilutions from a 1000 ppm K solution into a
10-80 ppm K range, containing a 1000 ppm Na concentration(15).
Blank solutions have been prepared with 2.5 mL of HCl 1:1/HNO3 1:1 solution, a 1000 ppm
Na concentration and filled up with double deionized water.
Measurements have been performed at the emission wavelength of 776.5 nm(15)(16).
5.5. BETA DETECTION
For 40K determination by beta emissions, LSC with a calibration method by chemical
quenching, using HNO3 and CH3NO2, has been descripted and tested for banana ashes
solution matrix.
LS sample vials have been prepared by adding 6 mL of 250 mL flasks prepared in Section
5.4. and filled up with 14 mL of scintillation cocktail(17) (Figure 5). Each sample vial has been
measured for 5 h with 20 min of SQP(E).

20 Serra Ventura, Joan
LS standard vials for chemical quenching calibration have been prepared with increasing
amounts of HNO3 or CH3NO2 (0-1000 μL and 0-25 μL ranges, respectively), 1 mL of a 0.3 g
KCl/mL solution, 14 mL of scintillation cocktail and
filled up with double deionized water to 20 mL.
Each standard vial has been measured for 2 h with
20 min of SQP(E).
LS blank vials have been prepared by adding
increasing amounts of HNO3 or CH3NO2 (same
ranges than standard vials), 14 mL of scintillation
cocktail and filled up with double deionized water.
Each blank vial has been measured for 5 h with 20 min of SQP(E).
5.6. GAMMA DETECTION
HRGS and GM measurements for 40K determination have been done for crushed banana
and ashes matrices.
5.6.1. Geometries preparation
A sample geometry and a sample geometry spiked with KCl have been prepared for
detection efficiency calibration of the techniques.
For crushed banana geometries (GA1 and GB1), two 500 mL
geometries (Figure 6) have been filled achieving the same weight
and height of sample inside the recipient. GA1 only contained
crushed banana and GB1 has been prepared by adding
consecutive layers of crushed banana and dried KCl (a total of
approximately 30 g) with the aim of obtaining an
homogeneous sample.
For the preparation of banana ashes geometries (GA2
and GB2), previous geometry contents have been treated
as indicated in Section 5.3. and ashes obtained have been
disposed in optimised geometries (100 mL geometry
covers, Figure 7), achieving the same weight and height,
Figure 6. On the left, GA1. On the right, GB1.
Figure 7. On the left, GA2 geometry. On the right, GB2 geometry.
Figure 5. LS measured vials and 250 mL flasks prepared in Section 5.4.
Determination of the radioactive potassium content in bananas. 21
which have been covered with parafilm. GA2 and GB2 have been prepared from GA1 and GB1,
respectively (Appendix 1).
5.6.2. HRGS measurements
GA1 and GA2 geometries have been measured for 3 days. GB1 and GB2 geometries have
been measured for 1 day due to the higher activity caused by the KCl addition in both
geometries.
Detection efficiency calibration of the instrument, as a function of the gamma decays ratio
and its energies, has also been done by Servei d’Anàlisis Isotòpiques (Universitat de
Barcelona).
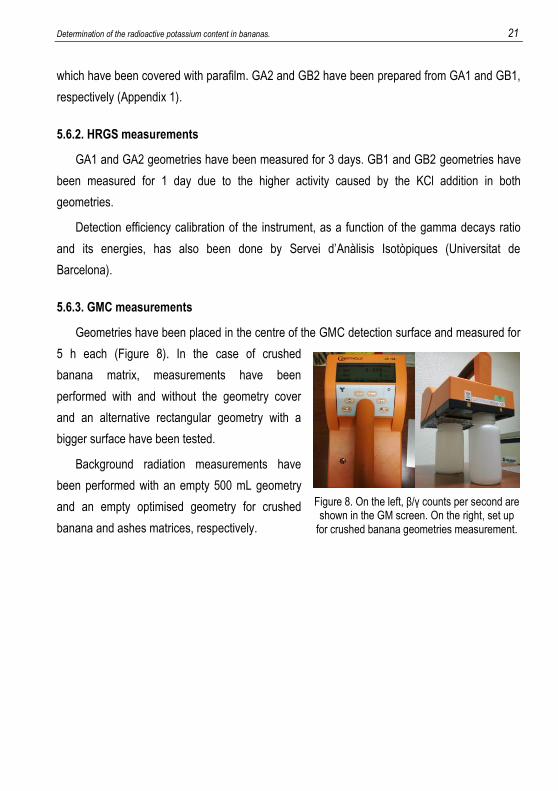
5.6.3. GMC measurements
Geometries have been placed in the centre of the GMC detection surface and measured for
5 h each (Figure 8). In the case of crushed
banana matrix, measurements have been
performed with and without the geometry cover
and an alternative rectangular geometry with a
bigger surface have been tested.
Background radiation measurements have
been performed with an empty 500 mL geometry
and an empty optimised geometry for crushed
banana and ashes matrices, respectively.
Figure 8. On the left, β/γ counts per second are shown in the GM screen. On the right, set up
for crushed banana geometries measurement.
22 Serra Ventura, Joan
6. RESULTS AND DISCUSSION
In the next sections results obtained for ash content determination, total potassium
determination by atomic emission measures, 40K determination by beta emission measures by
LSC and by gamma emission measures by HRGS are discussed, in addition to the results
obtained for the simple procedure designed for 40K determination by gamma emission using
GMC.
6.1. ASH CONTENT DETERMINATION
As a previous step to the total K and 40K determinations, the banana ash content has been
determined and a suitable matrix has been achieved, in addition to the 40K preconcentration.
For ash obtainment, a calcination step of the sample at 500ºC has been performed in order
to eliminate the organic matter and humidity within bananas (Table 2).
Capsule Crushed banana mass (g)
Banana ashes mass (g)
Ash content (%)
RE1 30.15 0.3072 1.02
RE2 30.05 0.3280 1.09
RE3 30.06 0.3120 1.04
Table 2. Crushed banana mass and banana ashes mass obtained for ash content determination. The replicates has been used for the posterior FAES and LSC analyses.
A significant reduction in sample dimension has been observed (Table 2) after calcination
mostly due to the high humidity content of bananas(18), mainly remaining metal oxides and
carbonates, resulting in an average ash content of 1.04% (0.03) (RSD=3%).
6.2. TOTAL POTASSIUM DETERMINATION BY ATOMIC EMISSION
For the later comparison of the different techniques used in this work, total potassium
content of bananas has been determined by FAES.

Determination of the radioactive potassium content in bananas. 23
The 776.5 nm emission spectral line has been chosen in a range of concentrations from 10
to 80 ppm K for the sample and standards.
For the technique calibration an external calibration curve has been obtained with a linear
fit, that follows the equation
𝑦 = 404.527𝑥 + 6860.77 𝑅2 = 0.9662
Table 3 shows the total K concentration per 100 g of banana calculated for the samples
prepared.
Sample [K] (mg/L) Emission (a.u.)
[K]/100 g banana (mg/100 g)
1 60.21 31218 494.3
2 60.87 31483 504.6
3 58.08 30355 487.7
Table 3. Potassium concentration, emission energy and potassium concentration per 100 g of banana of samples prepared.
The total K concentration per 100 g of banana calculated has been 496 mg K/100 g (9)
(RSD=2%).
The total K concentration has been compared with data found on bibliography about Plátano
de Canarias, which has been 385 mg K/100 g banana(19). Differences has been observed,
probably caused by the differences between banana crops (Section 3.2.), but results are in the
same order of magnitude. Thus, FAES result obtained has been taken as the reference value
for comparisons throughout the posterior determinations.
6.3. 40K DETERMINATION BY BETA EMISSION
At this point, the 40K content in bananas has been determined by its beta emissions using
LSC.
The technique calibration has been first performed with the addition of increasing volumes
of HNO3 in the measuring vials, which is present in the samples, in order to correct the possible
quenching processes occurring in the matrix. Due to the results obtained, a calibration with
CH3NO2, which is known to be a chemical quenching agent(20), has been performed.
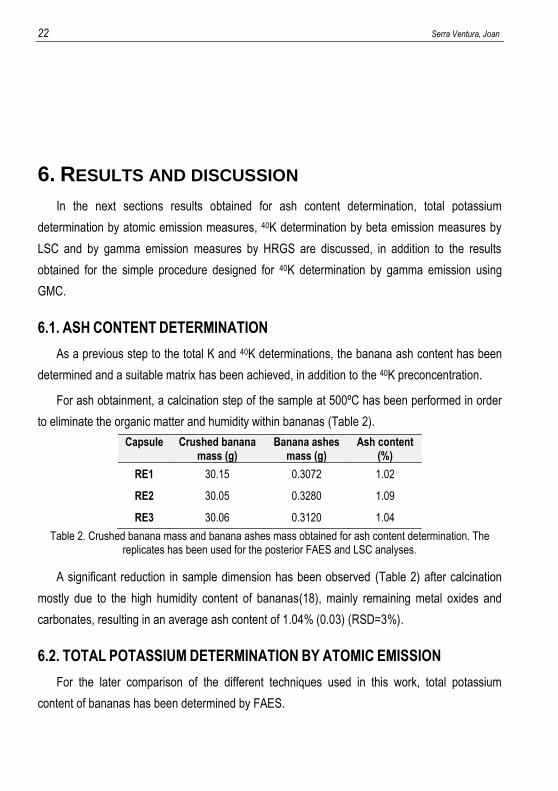
Figure 9 shows the SQP(E) values of standards proportioned by the instrument and the
corresponding detection efficiencies calculated for the calibration with HNO3.
24 Serra Ventura, Joan
88
88,5
89
89,5
90
90,5
91
720 740 760 780 800 820De
tect
ion
eff
icie
ncy
(%
)
SQP(E)
SQP(E) vs. Detection efficiency (%) HNO3
quenching calibration, LSC
Even though it had been thought that HNO3 could cause colour quenching by its thermal
decomposition to NO2 or by nitration of the scintillation vial plastic, no yellow colour has been
observed in the samples. The calibration curve has shown a constant trend in detection
efficiency of 89.2% (0.7) (RSD=0.8%) regardless the different SQP(E) values, situated in a
range of 731 to 814, which indicates that HNO3 has been acting as a chemical quenching agent.
Thus, a polynomial fit has not been shown.
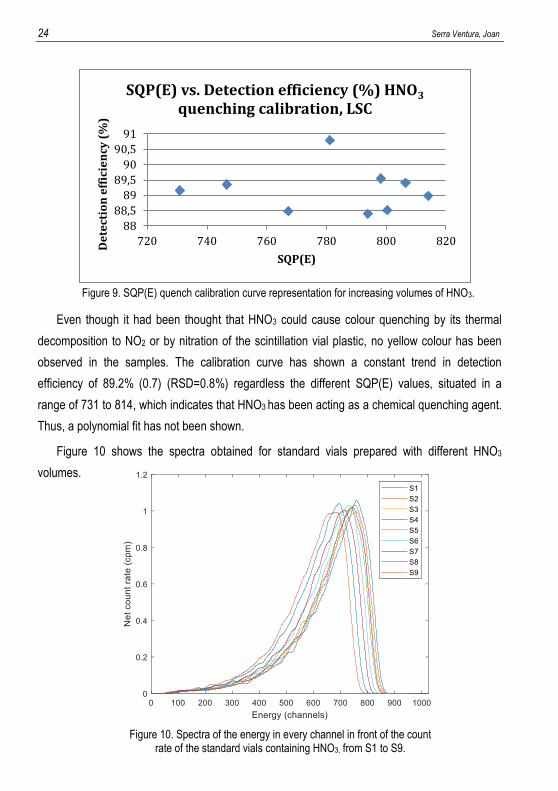
Figure 10 shows the spectra obtained for standard vials prepared with different HNO3
volumes.
Figure 10. Spectra of the energy in every channel in front of the count rate of the standard vials containing HNO3, from S1 to S9.
Figure 9. SQP(E) quench calibration curve representation for increasing volumes of HNO3.

Determination of the radioactive potassium content in bananas. 25
Even when the quenching causes the shift of the spectra to lower energies (in channels),
caused by the increasing volumes of HNO3 in standards (S1 does not contain HNO3 and S9
contains the maximum HNO3 amount), it has been proved to not be enough to see a loss of
count rate in the low energy part of the spectra (channels from 0 to 100) and hence a decrease
in detection efficiency. It is due to the high energy of the beta particles that 40K emits, most of
them appearing in channels from 600 to 800.
As HNO3 has been proved to not produce such quench to see changes in detection
efficiency, CH3NO2 has been used to calibrate the chemical quenching effects present in the
matrix.
Even though CH3NO2 nitro electronegative group presence, which captures the π electrons
associated with the scintillation cocktail aromatic solvent reducing the energy transfer from the
beta emission, same results has been observed than the ones obtained for HNO3 calibration: a
constant trend in detection efficiency of 91.7% (0.9) (RSD=1%) regardless the different
quenched standards situated in a range of 770 to 815 SQP(E) values. The shift of the spectra to
lower energies for increasing volumes of CH3NO2 is even lower than the one observed in HNO3.
Therefore, the constant detection efficiency of 91.7% obtained by CH3NO2 calibration has been
selected for the posterior samples measuring (Appendix 2).
Figure 11 shows the sample spectra obtained and Table 4 includes the SQP(E) and net
count rate values for each sample vial.
Figure 11. Spectra of the energy in channels in front of the count rate for the sample replicates.

26 Serra Ventura, Joan
The sample spectra has been situated in the 600-800 channels window and no other
interfering peaks corresponding to different radionuclides has been observed. Even though a
Savitzky-Golay smoothing has been applied, fluctuations in the sample spectra have been
observed due to its count rate order of magnitude in comparison with the one for standards.
Table 4 shows the 40K concentration and the deduced total K concentration in the samples
prepared, as well as the SQP(E) values and the net count rate obtained for each replicate.
Sample SQP(E) Net count rate (cpm)(a)
Activity per 100 g of banana (Bq/100 g)
[K] per 100 g of banana (mg/100 g)
1 796.3 5.181 13.02 411.2
2 803.2 5.119 12.91 407.6
3 805.4 5.337 13.45 424.8
(a) Net count rate has been obtained by subtracting the integrated, average counts obtained of the three blanks prepared from the count rate measured for each sample vial. Average blank count rate = 3.297 cpm. Table 4. Calculated 40K and total K concentrations in the replicates. In addition, SQP(E) and net count rate
values proportioned by 1220 Quantulus have been shown.
The average SQP(E) value obtained for the replicates has been approximately of 802,
inside the calibration range of SQP(E) values obtained, which has indicated a low HNO3
concentration and hence a low quenching effect in the samples.
The 40K activity calculated per 100 g of banana has been 13.1 Bq/100 g (0.3) (RSD=2%)
and the total K concentration per 100 g of banana has been 415 mg/100 g (9) (RSD=2%).
High precision in the 40K determination results have been observed for the LSC
measurements of banana ashes solution. The result obtained for total K concentration per 100 g
of banana deduced from the 40K determination by LSC has been close to the reference value of
496 mg/100 g obtained for total K concentration by FAES. Closer results to the total K
concentration obtained by FAES were expected due to the clean matrix used, banana ashes
solution, with no signal attenuation caused by the density component, in addition to the non
geometry dependence of LSC in comparison with the other radiochemical techniques that have
been used in this work.
6.4. 40K DETERMINATION BY GAMMA EMISSION
The second technique that has been tested for the 40K determination has been HRGS. The
results obtained for HRGS measurements of 40K gamma emissions of crushed banana and
Determination of the radioactive potassium content in bananas. 27
banana ashes matrices are shown hereunder along with the technique calibration that has been
performed.
Crushed banana geometries have been prepared by duplicate, one of them spiked with
solid KCl standard for the technique detection efficiency calibration. Dried KCl has been used as
the standard instead of a radioactive 40K standard because the same geometries for HRGS
measurements have been used for the later simple procedure for 40K determination, whose
objective is to be implemented in teaching environments where radioactive standards presence
is not common. Heterogeneities in the crushed banana matrices, probably caused by
encapsulated air between crushed banana layers, have been observed even though it has been
tried to achieve geometries as much homogeneous as possible (Appendix 3).
After its measurement, a calcination step has been performed over the geometry contents to
obtain the next ashes geometries, in order to minimise matrix effects.
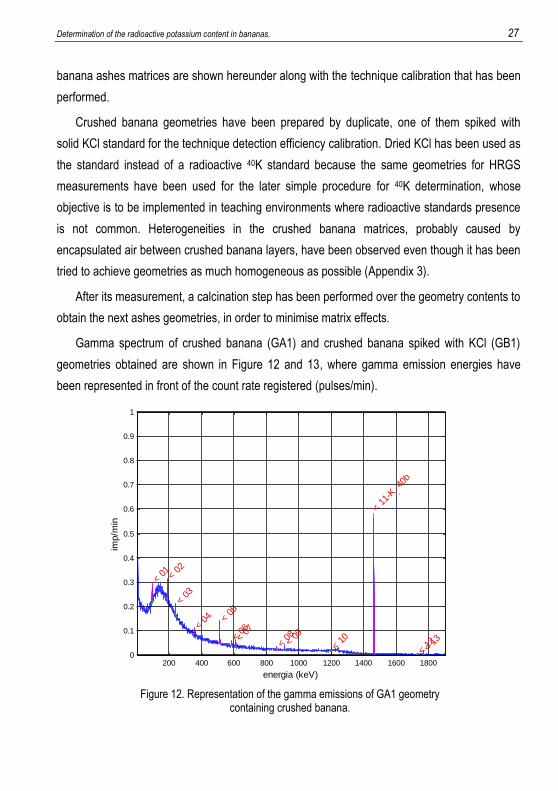
Gamma spectrum of crushed banana (GA1) and crushed banana spiked with KCl (GB1)
geometries obtained are shown in Figure 12 and 13, where gamma emission energies have
been represented in front of the count rate registered (pulses/min).
200 400 600 800 1000 1200 1400 1600 18000
0.1
0.2
0.3
0.4
0.5
0.6
0.7
0.8
0.9
1
energia (keV)
imp/m
in
< 0
1 <
02
< 0
3
< 0
4 <
05
< 0
6
< 0
7
< 0
8 <
09
< 1
0
< 1
1-K .
40b
< 1
2 <
13
Figure 12. Representation of the gamma emissions of GA1 geometry containing crushed banana.

28 Serra Ventura, Joan
200 400 600 800 1000 1200 1400 1600 18000
0.5
1
1.5
2
2.5
3
3.5
4
energia (keV)
imp/m
in
< 0
1
< 0
2
< 0
3
< 0
4-K .
40b
< 0
5
Figure 13. Representation of the gamma emissions of GB1 geometry containing crushed banana and spiked with KCl.
The gamma emissions corresponding to the 40K decay to the 1460 keV excited state of 40Ar
by electron capture have been observed in the spectra at 1460.75 keV in both cases, giving a
higher net count rate in the case of GB1: 2.78·10-1 pulses/s in front of the 4.67·10-2 pulses/s of
GA1 and a total activity of 592 Bq for GB1 in front of the total activity of 99 Bq corresponding to
GA1, all due to the KCl mass that has been added into the geometry. Since the technique only
registers the gamma disintegrations, count rates have been clearly lower in comparison with the
ones registered in LSC, where beta negative emissions have been registered, due to the
10.55% probability of gamma emissions in front of the 89.25% probability of beta negative
emissions in the case of 40K.
The second more intense peak that has been observed at 511 keV corresponds to a photon
emission by a positron annihilation, procedure that happens with only a 0.002% probability. This
peak have been only seen in GA1 spectrum due to the intensity relation with the 40K peak. No
more significant peaks corresponding to other natural radionuclides have been observed, hence
the radiation within banana sample has been assumed to be caused only by 40K.
The spiked geometry (GB1) has been used for the detection efficiency calibration and
therefore the calculation of the crushed geometry (GA1) 40K content and total K concentration
deduced (Table 5).
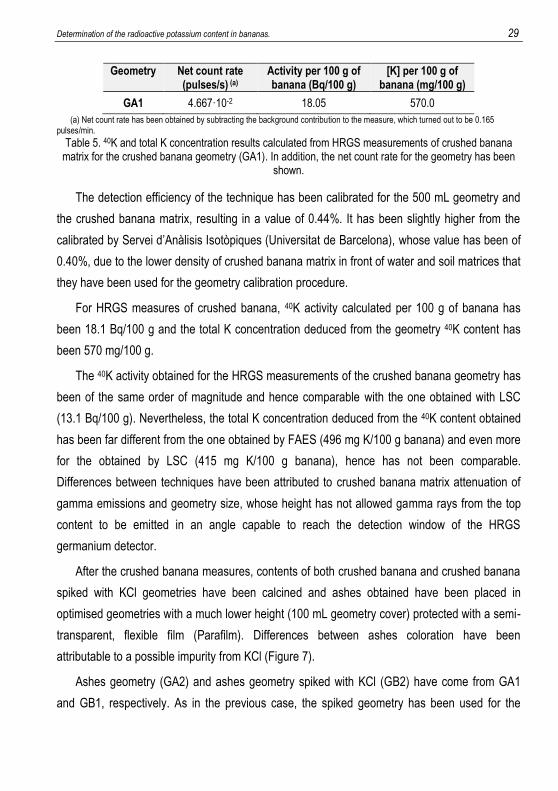
Determination of the radioactive potassium content in bananas. 29
Geometry Net count rate (pulses/s) (a)
Activity per 100 g of banana (Bq/100 g)
[K] per 100 g of banana (mg/100 g)
GA1 4.667·10-2 18.05 570.0
(a) Net count rate has been obtained by subtracting the background contribution to the measure, which turned out to be 0.165 pulses/min.
Table 5. 40K and total K concentration results calculated from HRGS measurements of crushed banana matrix for the crushed banana geometry (GA1). In addition, the net count rate for the geometry has been
shown.
The detection efficiency of the technique has been calibrated for the 500 mL geometry and
the crushed banana matrix, resulting in a value of 0.44%. It has been slightly higher from the
calibrated by Servei d’Anàlisis Isotòpiques (Universitat de Barcelona), whose value has been of
0.40%, due to the lower density of crushed banana matrix in front of water and soil matrices that
they have been used for the geometry calibration procedure.
For HRGS measures of crushed banana, 40K activity calculated per 100 g of banana has
been 18.1 Bq/100 g and the total K concentration deduced from the geometry 40K content has
been 570 mg/100 g.
The 40K activity obtained for the HRGS measurements of the crushed banana geometry has
been of the same order of magnitude and hence comparable with the one obtained with LSC
(13.1 Bq/100 g). Nevertheless, the total K concentration deduced from the 40K content obtained
has been far different from the one obtained by FAES (496 mg K/100 g banana) and even more
for the obtained by LSC (415 mg K/100 g banana), hence has not been comparable.
Differences between techniques have been attributed to crushed banana matrix attenuation of
gamma emissions and geometry size, whose height has not allowed gamma rays from the top
content to be emitted in an angle capable to reach the detection window of the HRGS
germanium detector.
After the crushed banana measures, contents of both crushed banana and crushed banana
spiked with KCl geometries have been calcined and ashes obtained have been placed in
optimised geometries with a much lower height (100 mL geometry cover) protected with a semi-
transparent, flexible film (Parafilm). Differences between ashes coloration have been
attributable to a possible impurity from KCl (Figure 7).
Ashes geometry (GA2) and ashes geometry spiked with KCl (GB2) have come from GA1
and GB1, respectively. As in the previous case, the spiked geometry has been used for the
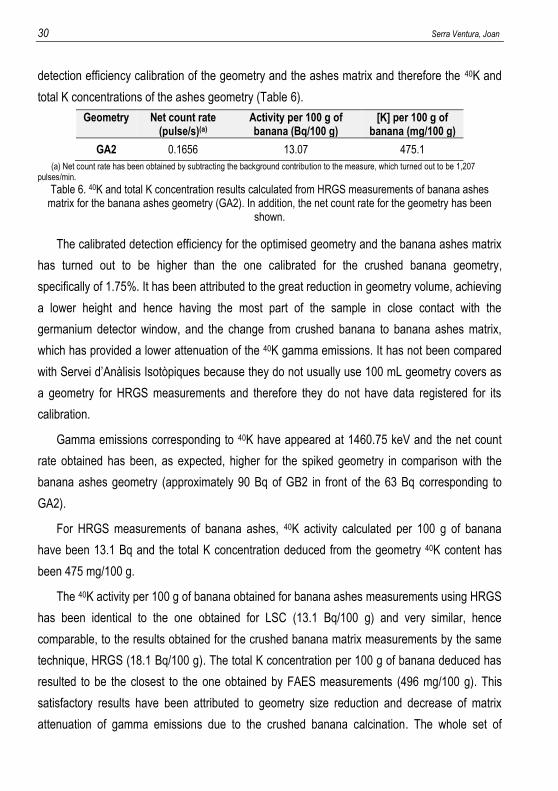
30 Serra Ventura, Joan
detection efficiency calibration of the geometry and the ashes matrix and therefore the 40K and
total K concentrations of the ashes geometry (Table 6).
Geometry Net count rate (pulse/s)(a)
Activity per 100 g of banana (Bq/100 g)
[K] per 100 g of banana (mg/100 g)
GA2 0.1656 13.07 475.1
(a) Net count rate has been obtained by subtracting the background contribution to the measure, which turned out to be 1,207 pulses/min.
Table 6. 40K and total K concentration results calculated from HRGS measurements of banana ashes matrix for the banana ashes geometry (GA2). In addition, the net count rate for the geometry has been
shown.
The calibrated detection efficiency for the optimised geometry and the banana ashes matrix
has turned out to be higher than the one calibrated for the crushed banana geometry,
specifically of 1.75%. It has been attributed to the great reduction in geometry volume, achieving
a lower height and hence having the most part of the sample in close contact with the
germanium detector window, and the change from crushed banana to banana ashes matrix,
which has provided a lower attenuation of the 40K gamma emissions. It has not been compared
with Servei d’Anàlisis Isotòpiques because they do not usually use 100 mL geometry covers as
a geometry for HRGS measurements and therefore they do not have data registered for its
calibration.
Gamma emissions corresponding to 40K have appeared at 1460.75 keV and the net count
rate obtained has been, as expected, higher for the spiked geometry in comparison with the
banana ashes geometry (approximately 90 Bq of GB2 in front of the 63 Bq corresponding to
GA2).
For HRGS measurements of banana ashes, 40K activity calculated per 100 g of banana
have been 13.1 Bq and the total K concentration deduced from the geometry 40K content has
been 475 mg/100 g.
The 40K activity per 100 g of banana obtained for banana ashes measurements using HRGS
has been identical to the one obtained for LSC (13.1 Bq/100 g) and very similar, hence
comparable, to the results obtained for the crushed banana matrix measurements by the same
technique, HRGS (18.1 Bq/100 g). The total K concentration per 100 g of banana deduced has
resulted to be the closest to the one obtained by FAES measurements (496 mg/100 g). This
satisfactory results have been attributed to geometry size reduction and decrease of matrix
attenuation of gamma emissions due to the crushed banana calcination. The whole set of

Determination of the radioactive potassium content in bananas. 31
advantages and precise results obtained have made the gamma emission measurement of
banana ashes by HRGS the best technique for the 40K determination in bananas among the
radiochemical techniques that have been used in this work.
6.5. SIMPLE PROCEDURE FOR 40K DETERMINATION
Finally, the same crushed banana and banana ashes geometries from HRGS
measurements have been measured with a routine use Geiger-Müller Counter (GMC), which is
not specific for radiochemical analyses, in order to establish a simple procedure for 40K
determination in bananas that could be implemented into teaching environments. The detection
efficiency calibration has been done by the same procedure than the one employed for HRGS
measurements: the spiked geometry with KCl has been used for the detection efficiency
calibration of the geometry and the matrix for GMC measurements for subsequently determine
the 40K concentration in the non-spiked geometry.
The results obtained for GMC measurements of 40K gamma emissions of crushed banana
and banana ashes matrices are shown hereunder along with the technique calibration that have
been performed.
Since most of the beta particles do not reach the detection surface because of their
penetration effect, one may assume the count rate obtained is mainly due to gamma emissions
only. Nevertheless, for crushed banana matrix, GMC measurements have been performed with
and without geometry covers to see whether the change causes a filter effect on beta particles.
GMC have proportioned the β/γ count rate of the geometry contents (Table 7). For the filled
geometries, the instrument has only been capable to measure the emissions from the top of the
geometry, concretely the surface of the sample. In the case of background, when measures
have been performed with covers, the GMC has been measuring the plastic material of the
cover, while when measures have been performed without covers the GMC has been
measuring the radionuclides present in the air that have been encapsulated inside the
geometry.

32 Serra Ventura, Joan
Geometry(a) β/γ count rate (cps)
Background w/o c 9.13
Background w/ c 7.85
GA1 w/o c 8.58
GA1 w/ c -(b)
GB1 w/o c 9.26
GB1 w/ c 8.70
(a) w/o c = measure performed without geometry covers. w/ c = measure performed with geometry covers. (b) Measures for GA1 geometry with cover have not been performed because results obtained for the other geometry measures were
not satisfactory. Table 7. Count rate measured for the background and filled GA1 and GB1 geometries.
The crushed banana spiked geometry (GB1) has given close but higher count rates
compared to the ones for the background radiation, regardless the cover presence or not. The
crushed banana geometry (GA1) has given non satisfactory results: lower count rate than the
background has been obtained for measures without cover and measures with cover have not
been performed because worse results have been expected.
A rectangular 400 mL geometry filled with crushed banana, which has got a bigger surface
for gamma detection, has been tested to improve the results but again same or lower count
rates than the background have been obtained.
The big volume that has represented a crushed banana full filled 500 mL geometry has not
allowed gamma emissions to reach the GMC detection surface. Hence, a reduction of the
geometry size and sample volume has been needed in order to obtain relevant results.
Consequently, calcination of geometry contents has been done for banana ashes
geometries preparation and the posterior GMC measurements. Results of the β/γ count rate
registered and 40K activity calculated, along with the total K concentration deduced from 40K
content, are shown in Table 8.
Geometry β/γ net count rate (cps)(a)
Activity per 100 g of banana (Bq/100 g)
[K] per 100 g of banana (mg/100 g)
GA2 5.18 11.4 373.7
(a) Net count rate has been obtained by subtracting the background contribution to the measure, which turned out to be 9 cps for an empty optimised geometry covered with Parafilm. Table 8. 40K and total K concentration results calculated from GMC measurements of banana ashes for the geometry content and per 100 g of banana. In addition, the net count rate obtained for the banana ashes
geometry is shown.
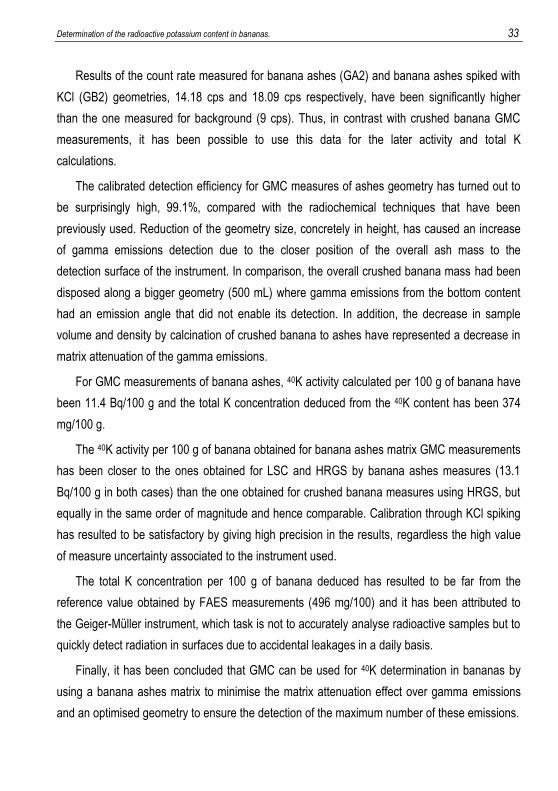
Determination of the radioactive potassium content in bananas. 33
Results of the count rate measured for banana ashes (GA2) and banana ashes spiked with
KCl (GB2) geometries, 14.18 cps and 18.09 cps respectively, have been significantly higher
than the one measured for background (9 cps). Thus, in contrast with crushed banana GMC
measurements, it has been possible to use this data for the later activity and total K
calculations.
The calibrated detection efficiency for GMC measures of ashes geometry has turned out to
be surprisingly high, 99.1%, compared with the radiochemical techniques that have been
previously used. Reduction of the geometry size, concretely in height, has caused an increase
of gamma emissions detection due to the closer position of the overall ash mass to the
detection surface of the instrument. In comparison, the overall crushed banana mass had been
disposed along a bigger geometry (500 mL) where gamma emissions from the bottom content
had an emission angle that did not enable its detection. In addition, the decrease in sample
volume and density by calcination of crushed banana to ashes have represented a decrease in
matrix attenuation of the gamma emissions.
For GMC measurements of banana ashes, 40K activity calculated per 100 g of banana have
been 11.4 Bq/100 g and the total K concentration deduced from the 40K content has been 374
mg/100 g.
The 40K activity per 100 g of banana obtained for banana ashes matrix GMC measurements
has been closer to the ones obtained for LSC and HRGS by banana ashes measures (13.1
Bq/100 g in both cases) than the one obtained for crushed banana measures using HRGS, but
equally in the same order of magnitude and hence comparable. Calibration through KCl spiking
has resulted to be satisfactory by giving high precision in the results, regardless the high value
of measure uncertainty associated to the instrument used.
The total K concentration per 100 g of banana deduced has resulted to be far from the
reference value obtained by FAES measurements (496 mg/100) and it has been attributed to
the Geiger-Müller instrument, which task is not to accurately analyse radioactive samples but to
quickly detect radiation in surfaces due to accidental leakages in a daily basis.
Finally, it has been concluded that GMC can be used for 40K determination in bananas by
using a banana ashes matrix to minimise the matrix attenuation effect over gamma emissions
and an optimised geometry to ensure the detection of the maximum number of these emissions.

34 Serra Ventura, Joan
6.6. RADIOCHEMICAL TECHNIQUES COMPARISON
Finally, a discussion over the radiochemical techniques that have been used in this work
has been done in order to expose the main advantages and disadvantages of each one and
select which suits in different cases.
The main advantages of LSC are the low limit of detection due to the high detection
efficiency that provides in the case of a high-energy beta emitter such as 40K, a low background
thanks to the lead shielding surrounding the detector and a low measure uncertainty that
ensures a high precision between replicates. In contrast, the technique requires an important
sample treatment to achieve a clear matrix without interferences, in addition to large times of
measurement (easily 40 h for a whole set of standards, samples and blanks) and the difficult
access to an ultra low level liquid scintillation spectrometer due to its high cost. Thus, LSC is
appropriate for cases where low activity samples are analysed and instruments for sample
treatment (such as muffles or sand baths) and measure (1220 Quantulus) are available.
For the case of HRGS, the main advantages of the technique are the few steps needed for
sample treatment, allowing to directly measure crushed banana samples obtaining satisfactory
results or calcine to ashes for improving the results exactitude; the high selectivity between
gamma emissions due to its resolution characteristic of a spectrometric technique and its low
background thanks to the shielding surrounding the germanium detector. Instead, it does not
have such low limit of detection as LSC and the time of measurement for the sample and the
calibration geometries can reach up to 4 days. Hence, HRGS is appropriate for cases of routine
measures of samples where sample treatment wants to be skipped for saving time and for not
adding uncertainties associated with the treatment procedure in the determination.
Last, GMC presents the advantage of its simplicity when it comes to use it due to its real
task of routine measures of working surfaces in radioactive installations, in addition to the little
sample treatment needed for the approximate determination of 40K in bananas. In contrast, the
technique offers a high measure uncertainty and a high background, which is caused by the null
presence of a shielding to reduce the cosmic radiation that is detected along with the sample
emissions, in addition to a high limit of detection which forces to have samples with relatively
high activity to obtain significant results. Nevertheless, if the purpose of the determination is to
teach radiochemistry to students without knowledge in this field, the simple procedure described
in this work is entirely valid for 40K determination in bananas.

Determination of the radioactive potassium content in bananas. 35
6.7. BANANA DOSE IN HUMANS
In order to finish this work in the same way it was started, the question of whether the
banana consumption is harmful to human health has been answered.
With the banana activity results obtained by measures of banana samples with different
radiochemical techniques it has been possible to see that an activity of an average 14 Bq/100 g
of banana is not dangerous for humans.
However, an approximation of the effective dose received for a single banana ingest has
been calculated and compared with the dose limits established for the average population, for
radioactive installations workers and also the considered limit dose for death. The effective dose
can be described as the sum of the different weighted equivalent doses in the whole tissues and
organs of human body.
Assuming that 40K radiation is caused by electrons (β- decay) and photons (γ decay) and this
particles mainly affect organs and tissues such as stomach, liver, small intestine, large intestine,
kidney, pancreas, spleen, adrenal glands and bones(21), the effective dose calculated is 3·10-8
mSv.
A dose limit of 20 mSv/year is given to workers from a radioactive installation, while for
members of the public this value decreases to 1 mSv/year. Moreover, an absorbed dose of
1000-2000 mSv can be deadly in 6 to 8 weeks, while the increase of the dose up to 30000 mSv
leads to death in no more than 1 day.
Therefore, with an effective dose of 3·10-8 mSv per banana can be concluded that the
human banana intake is completely harmless to health.

36 Serra Ventura, Joan
7. CONCLUSIONS
After the discussion of the results that have been obtained for 40K determination by the
different radiochemical techniques used, the following conclusions have been drawn.
A procedure to determine 40K in bananas has been established comprising the sample
treatment of crushed banana and its calcination to ashes, the sample measure by the 40K
gamma emissions using HRGS, equipped with an intrinsic germanium detector, in the format of
banana ashes matrix placed into an optimised geometry, which has been a 100 mL geometry
cover, and the technique calibration by KCl standard spike of a sample geometry.
FAES technique for the reference value obtainment of total K concentration in bananas has
been reinforced to be a robust method with low measure uncertainty for the obtention of
accurate results.
A procedure for 40K determination by beta emissions has been designed and tested using
LSC technique. Accurate results have been obtained by using banana ashes solution with
mainly nitric acid and the subsequent calibration for matrix quenching effects by using
nitromethane, finally establishing a constant detection efficiency. The technique has provided
high precision and the possibility to work with low activity samples, which can be a crucial factor
whether the experiment can not be performed with a big quantity of bananas as it has been in
this case.
Finally, a simple procedure for 40K determination in bananas has been designed and
applied for its future implementation in radiochemistry teaching environments. GMC
measurements of banana ashes in an optimised geometry with a calibration through KCl spike
have given significantly higher count rates than the background for the posterior 40K
concentration calculation, whose result has been quiet satisfactory if the purpose of the
determination is to teach students without radiochemistry knowledge.

Determination of the radioactive potassium content in bananas. 37
8. REFERENCES AND NOTES 1. WHO | Development of WHO nutrition guidelines. WHO 2018 [cited 2019 Jun 2]; Available from:
https://www.who.int/elena/about/guidelines_process/en/ 2. Ministerio de Agricultura, Pesca y Alimentación, Gobierno de España. Estudio del Mercado del
Plátano en España y Portugal. 2002 [cited 2019 Apr 15]. Available from: https://www.mapa.gob.es/es/alimentacion/temas/consumo-y-comercializacion-y-distribucion-alimentaria/platano_espana_tcm30-89322.pdf
3. Hardisson A, Rubio C, Baez A, Martin M, Alvarez R, Diaz E. Mineral composition of the banana (Musa acuminata) from the island of Tenerife. Food Chem. 2001;73(2),153–61.
4. U.S Department of Agriculture (USDA). Food Composition Databases Show Foods -- Bananas, raw. 2016 [cited 2019 Feb 27]. Available from: https://ndb.nal.usda.gov/ndb/foods/show/09040?fgcd=&manu=&format=Full&count=&max=25&offset=&sort=default&order=asc&qlookup=09040&ds=&qt=&qp=&qa=&qn=&q=&ing=
5. Ortega Aramburu X, Jorba Bisbal J. Las Radiaciones ionizantes: utilización y riesgos I. Edicions UPC. 1996.
6. Audi G, Bersillon O, Blachot J, Wapstra AH. The NUBASE evaluation of nuclear and decay properties. [cited 2019 Apr 2]. Available from: http://csnwww.in2p3.fr/AMDC/
7. Bé MM, Chisté V, Dulieu C, et al. Monographie BIPM-5, Table of Radionuclides. Bureau International des Poids et Mesures, Sèvres, França. 2010;5, 7-12. Available from: http://www.bipm.org/utils/common/pdf/monographieRI/Monographie_BIPM-%0A5_Tables_Vol7.pdf
8. Bagán H. Millora de la selectivitat en la determinació de radionúclids per escintil·lació plàstica sense generació de residus. Doctoral Thesis. Universitat de Barcelona; 2011.
9. Thomson J. Use and preparation of quench curves in LSC. 2004;1–7. 10. L’Annunziata MF. Handbook of Radioactivity Analysis 3rd Edition. Academic Press; 2012. 11. Radiological Society of North America I. Patient Safety - Radiation Dose in X-Ray and CT
Exams. 2019 [cited 2019 Apr 18]. Available from: https://www.radiologyinfo.org/en/info.cfm?pg=safety-xray
12. AOAC. Official methods of analysis. Assoc Anal Communities. 1995;1(5),141–4. 13. Sanchez-Castillo CP, Aguirre A, Escamilla I, et al. The mineral content of mexican fruits and
vegetables. J Food Compos Anal. 2002;11(4),340–56. 14. Miller-Ihli NJ. Atomic absorption and atomic emission spectrometry for the determination of the
trace element content of selected fruits consumed in the United States. J Food Compos Anal. 1996;9(4),301–11.
15. Guiteras J, Rubio R, Fonrodona G. Curso Experimental En Química Analítica. Síntesis SA. 2003. 214–217.
16. Tahvonen R. Contents of selected elements in some fruits, berries, and vegetables on the finnish market in 1987-1989. Journal of Food Composition and Analysis. 1993;6,75–86.
17. Verrezen F, Loots H, Hurtgen C. A performance comparison of nine selected liquid scintillation cocktails. Appl Radiat Isot. 2008;66(6–7),1038–42.
18. Luisa Casallas. Evaluación del análisis fisicoquímico del banano común (Musa sapientum I) transformado por acción de la levadura Candida guilliermondii. 2015;15-21. Available from: https://www.javeriana.edu.co/biblos/tesis/ciencias/tesis605.pdf

38 Serra Ventura, Joan
19. Asociación de Organizaciones de Productores de Plátano de Canarias (ASPROCAN).
Información Nutricional - Plátano de Canarias. [cited 2019 Mar 8]. Available from: https://platanodecanarias.es/nuestros-platanos/informacion-nutricional/
20. Tarancón A, Bagán H, García JF. Plastic scintillators and related analytical procedures for radionuclide analysis. J Radioanal Nucl Chem. 2017;314(2),555–72.
21. España. Real Decreto 783/2001, de 6 de julio, por el que se aprueba el Reglamento sobre protección sanitaria contra radiaciones ionizantes. Boletín Oficial del Estado, 26 de julio de 2001, núm. 178, pp. 27284 a 27393.
Determination of the radioactive potassium content in bananas. 39
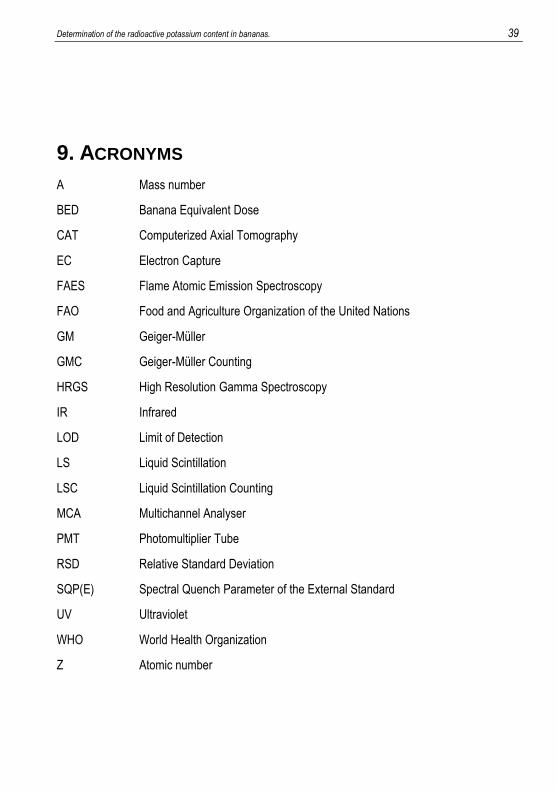
9. ACRONYMS
A Mass number
BED Banana Equivalent Dose
CAT Computerized Axial Tomography
EC Electron Capture
FAES Flame Atomic Emission Spectroscopy
FAO Food and Agriculture Organization of the United Nations
GM Geiger-Müller
GMC Geiger-Müller Counting
HRGS High Resolution Gamma Spectroscopy
IR Infrared
LOD Limit of Detection
LS Liquid Scintillation
LSC Liquid Scintillation Counting
MCA Multichannel Analyser
PMT Photomultiplier Tube
RSD Relative Standard Deviation
SQP(E) Spectral Quench Parameter of the External Standard
UV Ultraviolet
WHO World Health Organization
Z Atomic number


Determination of the radioactive potassium content in bananas. 41
APPENDICES

Determination of the radioactive potassium content in bananas. 43
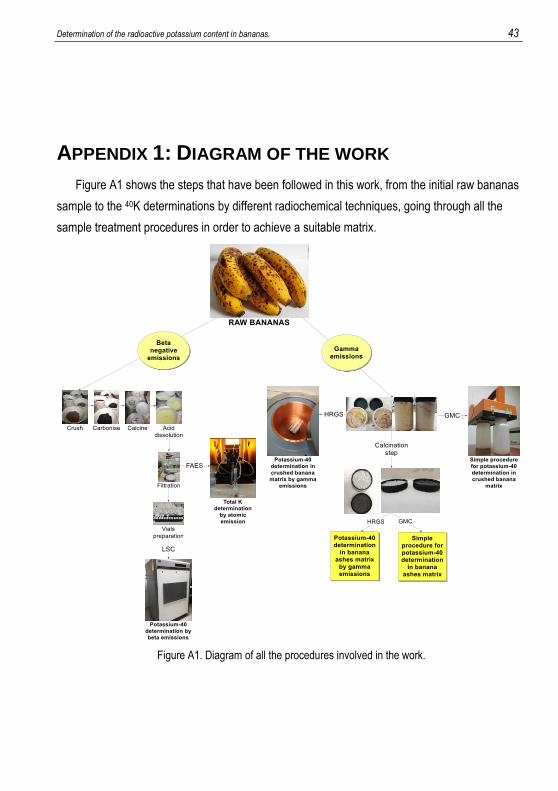
APPENDIX 1: DIAGRAM OF THE WORK
Figure A1 shows the steps that have been followed in this work, from the initial raw bananas
sample to the 40K determinations by different radiochemical techniques, going through all the
sample treatment procedures in order to achieve a suitable matrix.
Figure A1. Diagram of all the procedures involved in the work.


Determination of the radioactive potassium content in bananas. 45
APPENDIX 2: LSC CALIBRATION WITH CH3NO2
Figure A2 shows the SQP(E) values of standards proportioned by the instrument and the
corresponding detection efficiencies calculated. Quench curve is explained in Section 6.3.
Figure A3 shows the spectra obtained for standard vials prepared with increasing volumes
of CH3NO2, explained in Section 6.3.
90,0
91,0
92,0
93,0
94,0
760 770 780 790 800 810 820
De
tect
ion
eff
icie
ncy
(%
)
SQP(E)
SQP(E) vs. Detection efficiency (%) CH3NO2 quenching curve, LSC
Figure A2. SQP(E) quench calibration curve for increasing volumes of CH3NO2.
Figure A3. Spectra of the energy in every channel in front of the count rate of the standard vials containing CH3NO2, from S1 to S9.

Determination of the radioactive potassium content in bananas. 47
APPENDIX 3: HOMOGENEITY TEST
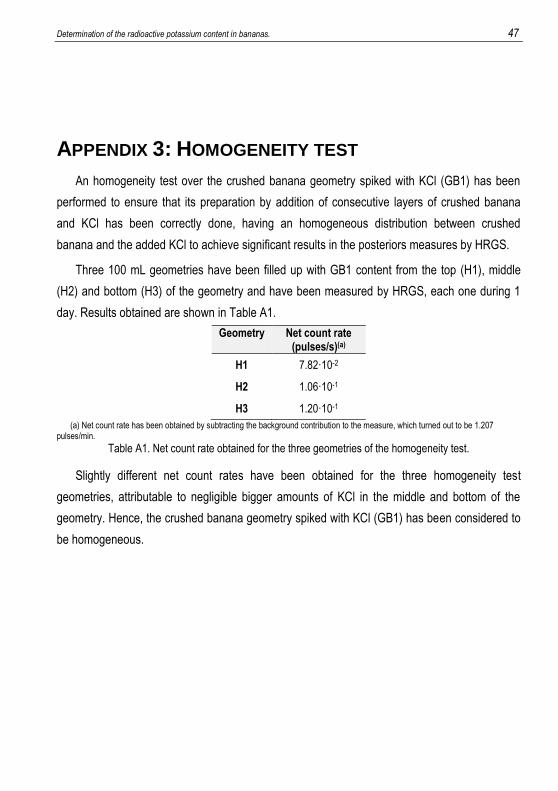
An homogeneity test over the crushed banana geometry spiked with KCl (GB1) has been
performed to ensure that its preparation by addition of consecutive layers of crushed banana
and KCl has been correctly done, having an homogeneous distribution between crushed
banana and the added KCl to achieve significant results in the posteriors measures by HRGS.
Three 100 mL geometries have been filled up with GB1 content from the top (H1), middle
(H2) and bottom (H3) of the geometry and have been measured by HRGS, each one during 1
day. Results obtained are shown in Table A1.
Geometry Net count rate (pulses/s)(a)
H1 7.82·10-2
H2 1.06·10-1
H3 1.20·10-1
(a) Net count rate has been obtained by subtracting the background contribution to the measure, which turned out to be 1.207 pulses/min.
Table A1. Net count rate obtained for the three geometries of the homogeneity test.
Slightly different net count rates have been obtained for the three homogeneity test
geometries, attributable to negligible bigger amounts of KCl in the middle and bottom of the
geometry. Hence, the crushed banana geometry spiked with KCl (GB1) has been considered to
be homogeneous.