Situación de la Industria Citrícola Chilena y Desafíos
47
Situación de la Industria Citrícola Chilena y Desafíos Mayo 2014 Juan Enrique Ortúzar Monserrat Valenzuela Comité de Cítricos de Chile
Transcript of Situación de la Industria Citrícola Chilena y Desafíos

Situación de la Industria Citrícola Chilena y Desafíos!
!Mayo!2014!
Juan!Enrique!Ortúzar!Monserrat!Valenzuela!
!Comité!de!Cítricos!de!Chile!

Situación Actual y Desafíos
• !Desarrollo!de!las!Exportaciones!
• !Renovación!de!las!Plantaciones!y!Tecnología!
• !DesaIos!Comerciales,!Sanitarios,!ProducLvos!
• !ObjeLvos!y!AcLvidades!del!Comité!!

Evolución!de!las!Exportaciones!(T)!
0
20.00040.000
60.00080.000
100.000120.000
140.000160.000
180.000
1995199619971998199920002001200220032004200520062007200820092010201120122013
MANDAR INS
GRAP EFRUIT
ORANGES
LEMONS
FOB$2013:$US$$185$Milliones$

PLAGAS$CUARENTENARIAS$NO$PRESENTES$EN$CHILE$
PLAGA CUARENTENARIA
MERCADOS RESTRINGIDOS
Moscas de la Fruta Japón, USA, Corea, China
Falsa Polilla de la Manzana USA
Cancro de los Cítricos USA?
Mancha Negra USA (UE?)
HLB --

SUPERFICIE!FRUTALES!(ha)!
0
40.000
80.000
120.000
160.000
200.000
240.000
280.000
320.000
1965 1978 1985 1990 2000 2010 2011 2013
Total1Fruit
Citrus

Plantaciones!Cítricos!(ha)!
0
5.000
10.000
15.000
20.000
25.000
1965 1976 1978 1984 1989 1992 1995 1998 2003 2010 2013
GRAPEFRUIT
MANDARINS
ORANGES
LEMONS


0100200300400500600700800
Copiap
óVicu
ñaOva
lle
Illap
el
La Ligu
a
Quillot
a
Mall
arauc
o
Peumo
Production Zone
Pp
(mm
)RAINFALL!(mm/!YEAR)!

Superficie!2013!(ha)!
FUENTE:!ESTIMACION!COMITÉ.!
Especie! III$! IV$! V$! R.M.! VI! TOTAL!
Lemons! 185! 1.434! 2.466! 2.703! 687! 7.475!
Oranges! 129! 1.028! 1.800! 2.100! 2.401! 7.458!
Mandarins! 123! 2.664! 1.750! 1.180! 675! 6.393!
Grapefruit! 1! 12! 140! 55! 83! 291!
Total! 438! 5.138! 6.156! 6.038! 3.846! 21.617!
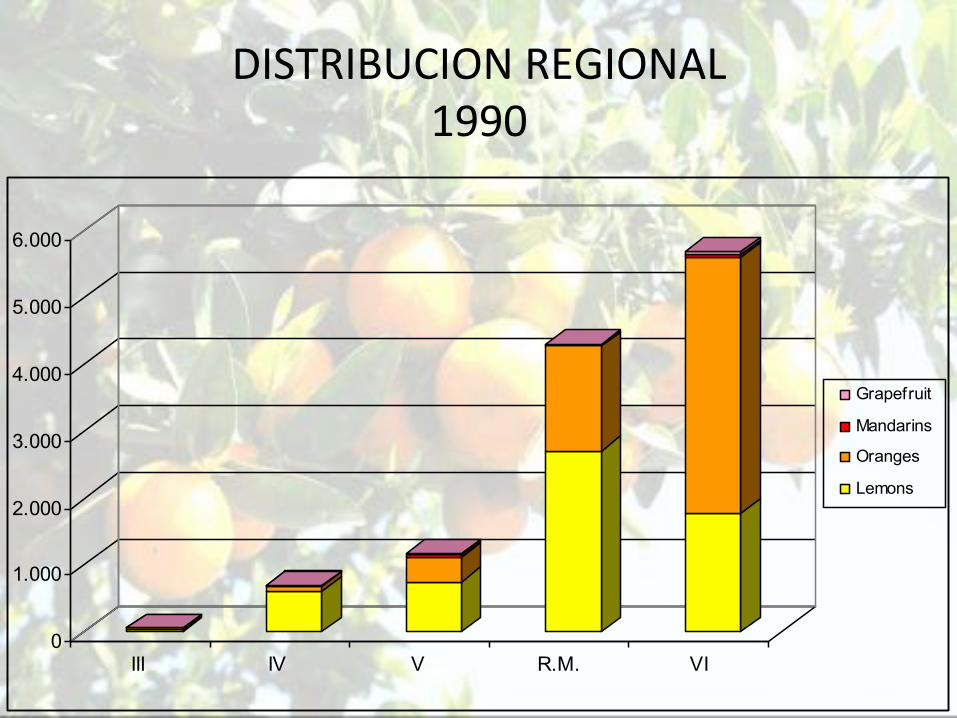
DISTRIBUCION!REGIONAL!1990!
0
1.000
2.000
3.000
4.000
5.000
6.000
III IV V R.M. VI
Grapefruit
Mandarins
Oranges
Lemons

DISTRIBUCION!REGIONAL!2011!
0
1.000
2.000
3.000
4.000
5.000
6.000
III IV V R.M. VI
Grapefruit
Mandarins
Oranges
Lemons

RENOVACION DE HUERTOS

PLANTACIONES DE NARANJO

PLANTACIONES DE NARANJO

Superficie!por!Tipo!Naranja!(ha)!
01.0002.0003.0004.0005.0006.0007.0008.0009.000
Supe
rfici
e (h
a)
1990 2000 2013
Late NavelsMid Season NavelsEarly NavelsValencias & Others

0!
50.000!
100.000!
150.000!
200.000!
250.000!
300.000!
2008! 2009! 2010! 2011! 2012!
numbe
r$of$plants$
$
Year$
Orange$Variety$PlanOng$Trends$$(years$2008R2012)$
$
Other!
Valencia!
Midknight!
Barnfield!
Rohde!
Cambria!cv.!
Navel!Late!
Lane!Late!
Cara!Cara!
Atwood!Navel!
Spring!Navel!
Parent!Washington!
Navelina!
Fukumoto!
Fuente: AGV

Chilean!Citrus!Industry!Overview!
NUEVAS ZONAS DE PRODUCCIÓN


Mandarin!Planted!Area!(ha)!
0
1000
2000
3000
4000
5000
6000
Supe
rfic
ie (h
a)
1990 2000 2013
Others
Late Mandarins
Clementines

0!
50.000!
100.000!
150.000!
200.000!
250.000!
300.000!
350.000!
400.000!
2008! 2009! 2010! 2011! 2012!
numbe
r$of$plants$
Years$$
SoT$Citrus$Variety$PlanOng$Trends$(years$2008R2012)$
Other!
Orri!cv!
Moria!cv!
Yosemite!Gold!cv.!
Tahoe!Gold!cv.!
Shasta!Gold!cv.!
Gold!Nugget!cv.!
Tango!cv!
W.!Murcoi!
Fortuna!
Nova!
Clemenules!
Oro!Grande!
Oronules!
Clemenpons!cv.!
Okitzu!
Miho!Wase!
Fuente: AGV

Chilean!Citrus!Industry!Overview!
W. Murcott

0!
20.000!
40.000!
60.000!
80.000!
100.000!
120.000!
140.000!
160.000!
180.000!
2008! 2009! 2010! 2011! 2012!
numbe
r$of$plants$
Years$
Lemon$Variety$PlanOng$Trends$(years$2008R2012)$
Lisboa!
Benjamin!Andes!cv.!
Genova!
Messina!
Eureka!
Fino!
Fuente: AGV

Desafíos y Oportunidades !• !Mercado!de!Exportación!
• Problemas!Fitosanitarios!en!USA!• Concentración!en!EEUU!• Estacionalidad!Oferta!
• !Mercado!Interno!• Desarrollo!de!Importaciones!• Mejora!de!Calidad,!Embalajes=>!Valor!
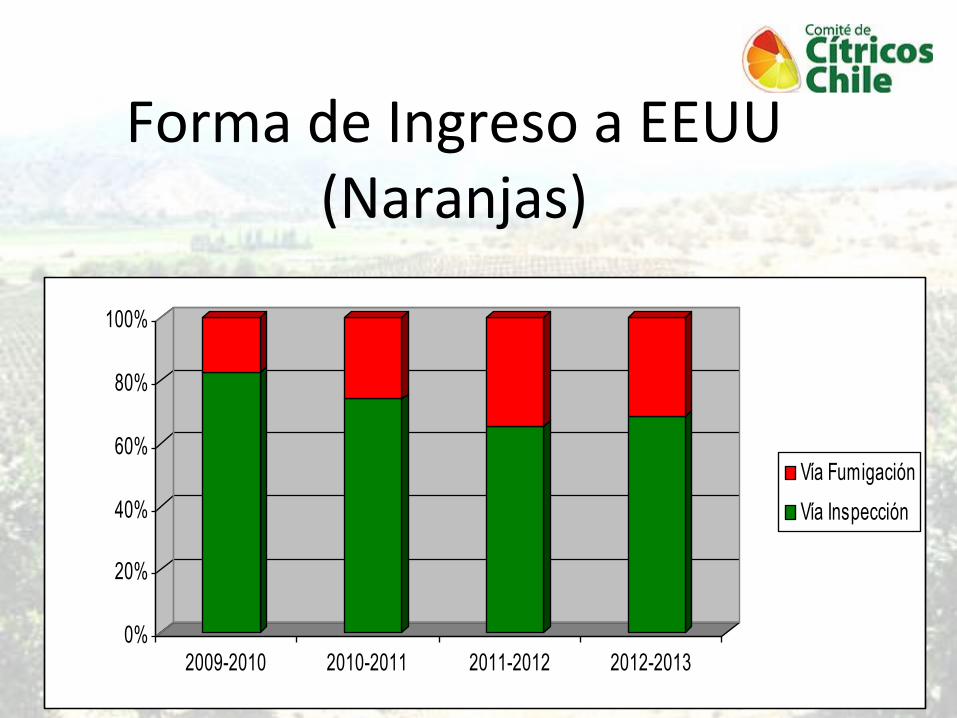
Forma!de!Ingreso!a!EEUU!(Naranjas)!
0%
20%
40%
60%
80%
100%
2009-2010 2010-2011 2011-2012 2012-2013
Vía Fumigación
Vía Inspección

Forma!de!Ingreso!a!EEUU!(Mandarinas)!
0%
20%
40%
60%
80%
100%
2009-2010 2010-2011 2011-2012 2012-2013
Via Fumigación
Via Inspección
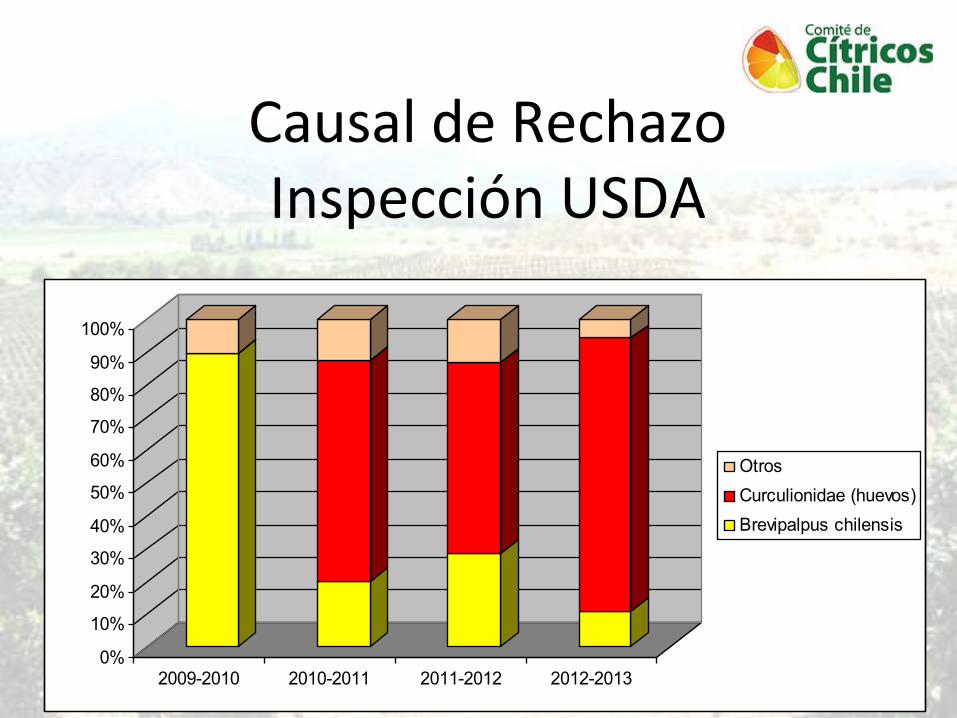
Causal!de!Rechazo!Inspección!USDA!
0%
10%
20%
30%
40%
50%
60%
70%
80%
90%
100%
2009-2010 2010-2011 2011-2012 2012-2013
OtrosCurculionidae (huevos)Brevipalpus chilensis

MERCADO$EEUU$$LIMONES EN LOS ANGELES A LA ESPERA DE FUMIGACIÓN

DAÑO DE FUMIGACIÓN EN EEUU

0!
20.000!
40.000!
60.000!
80.000!
100.000!
120.000!
140.000!
2008! 2009! 2010! 2011! 2012! 2013!
USA!
CANADA!
EUROPE!
FAR!EAST!
LATIN!!AMERICA!
MIDDLE!EAST!
Exportaciones!por!Mercado!(T)!

DISTRIBUCION!SEMANAL!CLEMENTINAS!!2011!l!2012!l!2013!(Ton)!
0$
500$
1.000$
1.500$
2.000$
2.500$
3.000$
3.500$
4.000$
4.500$
17!18!19!20!21!22!23!24!25!26!27!28!29!30!31!32!33!34!35!36!37!38!39!40!41!42!43!44!45!46!
2011$
2012$
2013$

DISTRIBUCION!SEMANAL!MANDARINAS!!2011!l2012!l!2013!(Ton)!
0$
1.000$
2.000$
3.000$
4.000$
5.000$
6.000$
25! 26! 27! 28! 29! 30! 31! 32! 33! 34! 35! 36! 37! 38! 39! 40! 41! 42! 43! 44! 45!
2011$
2012$
2013$
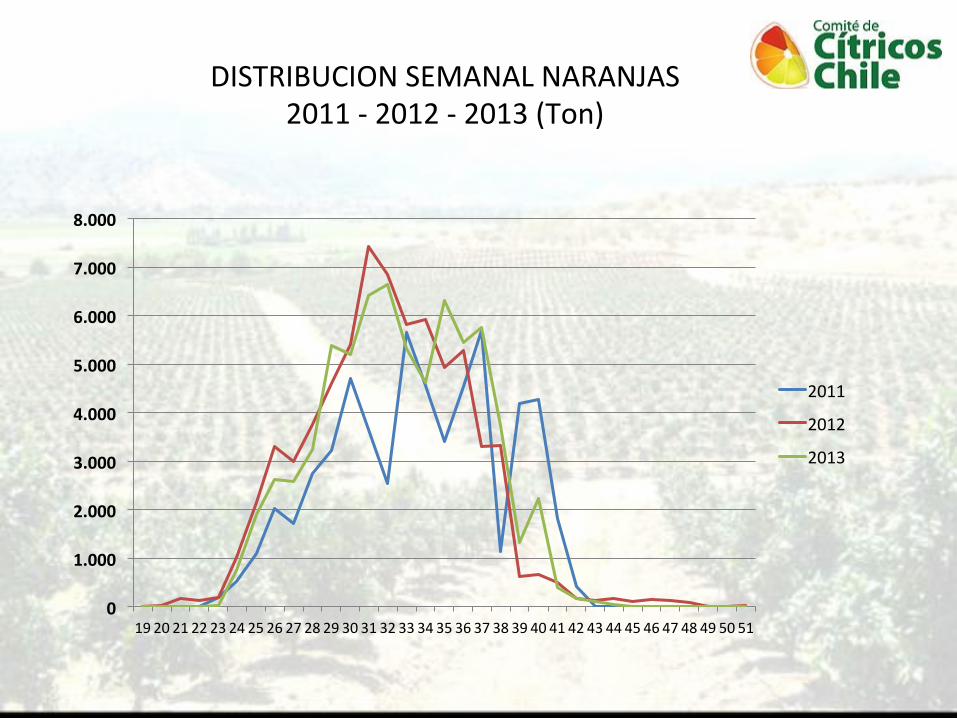
DISTRIBUCION!SEMANAL!NARANJAS!2011!l!2012!l!2013!(Ton)!
0$
1.000$
2.000$
3.000$
4.000$
5.000$
6.000$
7.000$
8.000$
19!20!21!22!23!24!25!26!27!28!29!30!31!32!33!34!35!36!37!38!39!40!41!42!43!44!45!46!47!48!49!50!51!
2011!
2012!
2013!

DISTRIBUCION!SEMANAL!!LIMONES!!2011!l!2012!l!2013!(Ton)!
0$
1.000$
2.000$
3.000$
4.000$
5.000$
6.000$
7.000$
20!21!22!23!24!25!26!27!28!29!30!31!32!33!34!35!36!37!38!39!40!41!42!43!44!45!46!47!48!49!50!51!52!53!
2011$
2012$
2013$

MERCADO!INTERNO!

IMPORTACIONES DE CÍTRICOS
0
2.000
4.000
6.000
8.000
10.000
12.000
Ton
2011 2012 2013 2014
LIMAMANDARINANARANJALIMÓN

MERCADO!INTERNO!

MERCADO!INTERNO!

Desafíos y Problemas Potenciales
• !Polinización!Cruzada!en!Mandarinas!• Nuevas!variedades!mandarinas!/!Valencias!• InvesLgación!/!Consenso!técnico!
• !Problemas!climáLcos!• Sequía!y!Heladas!

POLINIZACION CRUZADA

HELADAS

www.chileancitrus.com$www.comitedecitricos.cl$
$$

!!ObjeLvos!del!Comité!• Apoyar!GesLones!para!mejorar!Acceso!a!Mercados!
• Promoción!en!Mercado!y!Estandares!de!Calidad!
• Apoyar!InvesLgación!en!Areas!Prioritarias!
!

APOYO!A!LA!INVESTIGACIÓN!!
• Biología!Curculiónidos!• IdenLficación!Molecular!Huevos!Curculiónidos!• IdenLficación!Molecular!Polinizadores!Mandarinas!
!
!


0!
20.000!
40.000!
60.000!
80.000!
100.000!
120.000!
140.000!
CLEMENTINAS! NARANJAS! LIMONES! MANDARINAS! POMELOS! TOTAL!
EMPRESAS!ASOCIADAS!
!EMPRESAS!NO!ASOCIADAS!
65%!
81%!
76%! 68!%!
48%!
74%!
REPRESENTATIVIDAD COMITÉ DE CITRICOS 2013 (TON)

EMPRESAS!SOCIAS!COMITÉ!DE!CITRICOS!!
Gracias!