Roux 2003 AA 68(4) estandarización cerámica
17
Society for American Archaeology Ceramic Standardization and Intensity of Production: Quantifying Degrees of Specialization Author(s): Valentine Roux Source: American Antiquity, Vol. 68, No. 4 (Oct., 2003), pp. 768-782 Published by: Society for American Archaeology Stable URL: http://www.jstor.org/stable/3557072 Accessed: 03/11/2008 16:01 Your use of the JSTOR archive indicates your acceptance of JSTOR's Terms and Conditions of Use, available at http://www.jstor.org/page/info/about/policies/terms.jsp . JSTOR's Terms and Conditions of Use provides, in part, that unless you have obtained prior permission, you may not download an entire issue of a journal or multiple copies of articles, and you may use content in the JSTOR archive only for your personal, non-commercial use. Please contact the publisher regarding any further use of this work. Publisher contact information may be obtained at http://www.jstor.org/action/showPublisher?publisherCode=sam . Each copy of any part of a JSTOR transmission must contain the same copyright notice that appears on the screen or printed page of such transmission. JSTOR is a not-for-profit organization founded in 1995 to build trusted digital archives for scholarship. We work with the scholarly community to preserve their work and the materials they rely upon, and to build a common research platform that promotes the discovery and use of these resources. For more information about JSTOR, please contact [email protected]. Society for American Archaeology is collaborating with JSTOR to digitize, preserve and extend access to American Antiquity. http://www.jstor.org
-
Upload
beto-panqueque -
Category
Documents
-
view
227 -
download
0
Transcript of Roux 2003 AA 68(4) estandarización cerámica

8/13/2019 Roux 2003 AA 68(4) estandarización cerámica
http://slidepdf.com/reader/full/roux-2003-aa-684-estandarizacion-ceramica 1/16
Society for American Archaeology
Ceramic Standardization and Intensity of Production: Quantifying Degrees of SpecializationAuthor(s): Valentine RouxSource: American Antiquity, Vol. 68, No. 4 (Oct., 2003), pp. 768-782Published by: Society for American ArchaeologyStable URL: http://www.jstor.org/stable/3557072Accessed: 03/11/2008 16:01
Your use of the JSTOR archive indicates your acceptance of JSTOR's Terms and Conditions of Use, available athttp://www.jstor.org/page/info/about/policies/terms.jsp . JSTOR's Terms and Conditions of Use provides, in part, that unlessyou have obtained prior permission, you may not download an entire issue of a journal or multiple copies of articles, and youmay use content in the JSTOR archive only for your personal, non-commercial use.
Please contact the publisher regarding any further use of this work. Publisher contact information may be obtained athttp://www.jstor.org/action/showPublisher?publisherCode=sam .
Each copy of any part of a JSTOR transmission must contain the same copyright notice that appears on the screen or printedpage of such transmission.
JSTOR is a not-for-profit organization founded in 1995 to build trusted digital archives for scholarship. We work with thescholarly community to preserve their work and the materials they rely upon, and to build a common research platform thatpromotes the discovery and use of these resources. For more information about JSTOR, please contact [email protected].
Society for American Archaeology is collaborating with JSTOR to digitize, preserve and extend access to American Antiquity.
http://www.jstor.org
8/13/2019 Roux 2003 AA 68(4) estandarización cerámica
http://slidepdf.com/reader/full/roux-2003-aa-684-estandarizacion-ceramica 2/16
CERAMIC STANDARDIZATION AND INTENSITY OF PRODUCTION:QUANTIFYING DEGREES OF SPECIALIZATION
Valentine Roux
The aim of this study is to examine the relationship between metric variability of ceramic vessels of a single type and inten-
sity of production. This relationship is examined on the basis of vessels made by Indian and Spanish potters whose rates ofproduction vary from low to high. Results are compared with Filipino data to embrace different cultures and therefore pos-sibly different emic conceptions of standardization. We conclude that rate of production affects the degree of standardiza-tion. However, only in a high-rate production situation do we have motor habits that transcend emic conceptions of
standardization. Indeed, factors like size classes, emic conception of size classes, and skill may induce a certain variabil-ity despite similar rates of production. Indexing degrees of standardization needs, in other respects, to take into account thecumulative effect of production events that play on the CV (Coefficient of Variation) values. Applied to Mesopotamian data,our results suggest that third millennium ceramic production can be compared to low-rate production observed ethno-
graphically.
El prop6sito de este estudio es analizar la relacion entre la variabilidad metrica de las vasijas de un solo tipo cerdmico y laintensidad de la produccion. Esta relacion se estudia a partir de una serie de piezas manufacturadas por alfareros de la India
y de Espana cuya produccion puede variar en cantide de baja a alta. Los resultados se comparan con datos de los filipinospara abarcar diferentes culturas y, por lo tanto, posibles diferencias en conceptos emicos de estandarizaci6n. Concluimos quela tasa de produccion incide en el nivel de estandarizacion. Sin embargo, solamente en caso de una tasa alta de producci6nhay habitos de manufactura que transcienden los conceptos emicos de estandarizacion. En efecto, factores como las clases de
dimensiones, los conceptos emicos del tamaiio y la destreza del artesano producen cierta variabilidad a pesar de que hayatasas similares de produccion. Para medir los grados de estandarizacion se requiere, entre otros aspectos, tomar en cuentael efecto acumulativo de los eventos de producci6n sobre los valores del CV (coeficiente de variaci6n). Al aplicar estos resul-tados a los datos de Mesopotamia, se cuenta con bases para plantear que la produccion de ceramica en el tercer milenio
puede ser comparada con una produccion de nivel bajo tal como se lo ha observado en contextos etnogrdficos.
In archaeology, the degree of ceramic stan-dardization s taken o reflect ntensity of pro-duction and degree of specialization. The
standardization hypothesis (e.g., Costin 1991,2000; Costin and Hagstrum 1995) proposes thatmore
uniformitys due to a
higherrate of
produc-tion. The latter s correlated with economic spe-cialization, which encompasses many ways toorganize raft production domestic vs. specializedproduction, art-time s. full-time potters, attachedvs. independent potters, ndividual vs. workshop,etc.) (e.g., Arnold and Nieves 1992; Blackman etal. 1993; Costin 1991,2000; Costin and Hagstrum1995; Feinman et al. 1981; London 1991; Lon-gacre 1991;Longacreetal. 1988; Rice 1989,1991;
Sinopoli 1988; Stark 1995). Degree of standard-ization may be assessed hrough awmaterial om-position, manufacturing techniques, form anddimensions, and surface decoration. Two types ofattributes may be distinguished (Costin and
Hagstrum 1995):intentional and mechanical.
Intentional attributes re controlled by the artisanand nclude echnological, morphological, nd styl-istic properties. Mechanical attributes are those
which the potter unintentionally ntroduces ntohis or her works Costin and Hagstrum 995:622).They relate o motor habits and skill, and, becausethey are unconscious, hey more directly eflect heorganization f production. n this regard, metricvariability hould reflect he number f work units,
Valentine Roux * Laboratoire de Pr6histoire t Technologie, CNRS, 92023 Nanterre edex, France
American Antiquity, 68(4), 2003, pp. 768-782CopyrightO 2003 by the Society for American Archaeology
768

8/13/2019 Roux 2003 AA 68(4) estandarización cerámica
http://slidepdf.com/reader/full/roux-2003-aa-684-estandarizacion-ceramica 3/16
REPORTS
on the assumption hat the amount of variabilityin these mechanical attributes orrelated directlywith the number of independent potters or workgroups (Costin and Hagstrum 1995:622). For a
large quantity f pottery, he ess the variability, hefewer the number of full-time potters.
The inverse correlation between metric vari-ability and rate of production as been partly estedby ethnoarchaeological tudies (e.g., Kvamme etal. 1996; Longacre 1999). Statistical results haveenabled he authors o differentiate, or aperture ndheight, between household potters and part-timeand/or ull-time potters, and for aperture etweenpart-time and full-time potters. The authors con-clude that numerous factors
(e.g.,differences n
raw materials, potters' evels of expertise, marketdemand, manufacturing echniques, local tradi-tions, and types of measurement aids) affectceramic standardization (see also Arnold andNieves 1992), and that more effective means ofmeasuring and assessing variability n ceramicswould help untangle elationships between pro-duction intensity and product standardization(Kvamme et al. 1996:125).
With this purpose in mind, we conducted an
ethnoarchaeological tudy o isolate he parametersinvolved n standardization, s well as to quantifythe relationship between intensity of productionand degree of standardization. We examine vesselsmade by Indian and Spanish potters with differentrates of production. We then compare esults oFil-ipino data to propose regularities Gallay 1986)between rate of production nd metric variability,taking into account different possible emic con-ceptions of standardization. esults are applied o
archaeologicaldata from
Mesopotamia.Ethnographic Case Studies
Three ethnographic ituations re considered. Twoof them are in India, n rural and urban contexts.They are characterized espectively by low- andhigh-rate eramic production. hese wo situations,because they pertain o the same cultural ontext,will enable us to easily solate he parameter inten-sity of production nd assess its effects on stan-dardization. he third ase, in Spain, s in an urban
context. This enables us to compare high-rateceramic production within two different culturalcontexts. Moreover, he Spanish example enablesus to compare high-rate production sing different
fashioning techniques: without rotative kineticenergy and with rotative kinetic energy (here, pad-dle-and-anvil nd wheel throwing).
Low-Rate Ceramic Production(India)
Low-rate ceramic production was studied in thesouthern part of Andhra Pradesh A.P.). Four vil-lages, next to Tirupati, were visited within theframework of an ethnoarchaeological survey1(Chavaram Bekam, Alapakam, Kota Aruru andChapakam). These villages are separated by only3-10 km. Each of them contains 1,200-2,000inhabitants nd 2-5 potters. Potters work within hedomestic space, in the courtyard or under an
awning.There s no warehouse;
potsare stored n
the house. The firing area is generally ocated atthe outskirts of the village. Potters work through-out the year according o different hythms. Festi-val months ike January nd February epresent hepeak season, while monsoon months represent heslack season. In most cases, pottery is the onlysource of income of the potters. Pots are sold bypotters' wives, either through patron-client inks(the jajmani system) or through barter or trade,within a 3-4 km radius.
Three types of vessels represent he larger partof production and consumption: kura catti, rallacatti and pedda bana.
Kura atti are vessels for cooking vegetables fordishes like kura, samba, rasam). Ralla catti arevessels for cooking lentils (dal) and spinach hat,once cooked, are ground against he bottom of thevessel with a wooden pestle. Pedda bana are bigstorage ars where mainly cereals are stored.
All in all, around 6,000 pots are produced ach
year per potter,ut of
which, roughly peaking,ess
than 50 percent are kura catti and ralla catti, and5 percent are pedda bana. The other products arevarious ooking, ransport, nd storage pots of sev-eral sizes. The demand s not for strictly standard-ized vessels, but for a volume that may vary fromone family to another depending on the size of thefamily.
Vessels are ashioned by a combination f wheelthrowing and paddling. Pots are first thrown on apivoted-spoked wheel. Depending on their dimen-
sions, they are thrown off the hump (kura catti) orfrom a mass of clay whose quantity orresponds othe pot to be thrown (pedda bana). They aredetached rom the hump or from the wheel with a
769

8/13/2019 Roux 2003 AA 68(4) estandarización cerámica
http://slidepdf.com/reader/full/roux-2003-aa-684-estandarizacion-ceramica 4/16
AMERICAN ANTIQUITY
string n such a way that a hole is left at the bot-tom. Neck and shoulder dimensions do not usuallychange after his point. The lower part of the bodyis a thick wall, shaped by subsequent addling; he
paddling process starts when the clay has reacheda leather-hard onsistency, using stone anvils andwooden paddles. The first ask s to close the holeby paddling he pot in a downward irection. Oncethe bottom s closed, ash s added o the nner owerpart of the body that s shaped with a smaller anviland a lighter paddle. For ralla catti, sand s addedto the bottom as an abrasive gainst which vegeta-bles will be ground. Paddling ollows. The big jarsare paddled wice. Ash is added during he secondpaddling. Ash prevents he anvil from sticking tothe clay.
The pots receive ittle decoration. While pots arestill on the wheel, horizontal ines are ncised witha piece of wood. Once heyhave dried, pots are cov-ered with a red slip.
High-Rate Ceramic Production
High-rate eramic production was studied n NorthIndia and in Spain.
In North India, the study was conducted in
Uttam Nagar, a suburb of New Delhi with about200 potter households. Every house has a nuclearor extended family that owns one or two wheels,placed under open shelters, and one kiln located nthe courtyard. he clay, conveyed by truck, s storedin the courtyard r in the street, depending on spa-tial constraints. Pottery manufacture s a full-timeactivity hat akes place even during he monsoon;rains restrict he number of firings but do not stopproduction.
The differentpotters
nterviewedpecialize
inthe manufacture f water jars (ghada or matka)made n three sizes: small (ghadiya), medium bichka ghada) and arge bara ghada). All in all, around15,000 pots are produced each year per potter, ofwhich, roughly speaking, 30 percent are ghadiya,60 percent are bich ka ghada, and 10 percent arebara ghada.
Pots are ashioned ccording othe throwing ndpaddle-and-anvil echnique described or AndhraPradesh ots. However, s is common n Northwest
India (Saraswati nd Behura 1964), no hole is leftat the bottom when the pot is detached from thewheel, which is a pivoted block wheel.
Spanish ceramic workshops have been studied
by Arcellin-Pradelle and Laubenheimer (1982,1985). These workshops are made up of special-ized areas, which include the manufacturing rea,the drying area, the kiln, and the warehouse. In
some cases, the house is part of the workshop area.Two to four potters can work together. Most assis-tants are not members of the household.
The production f one workshop asbeen exam-ined n detail and published xtensively. t s locatedin Vall de Uxo, a village in the province of Castel-lon. It is run by a single potter who carries out thewhole manufacturing process. He works inten-sively (10 hours a day), 11 months a year. Vesselsare sold mainly through middlemen. Productionincludes table and cooking vessels.
Pitchers with flat bottoms are considered here.They are wheel thrown on a kick-wheel. When theclay has reached a leather-hard onsistency, thebottom s turned scraped) on the wheel. The han-dle is fixed with slurry. The potter makes about 50pitchers a day. Annual production s approximately14,000 pitchers.
According o the craftsman, his intention s tomake very similar pots; standardization, n his view,indexes the degree of skill.
Analytical Procedure
To study how rate of production ffects metric vari-ability on series of vessels representing a singleceramic type, we examine series of vessels fash-ioned within ow-rate vs. high-rate roduction on-texts. Series of vessels made by one potter is aproduction event and represent a group. Thehypothesis s as follows: f rate of production ffectsmotor habits, hen vessels made by high-rate pro-ducers will
presentess intra- and
nter-groupari-
ability han ow-rate producers. Metric ndices thatmay reveal motor habits remain o be defined onthe basis of empirical data. A wide range of mea-sures s therefore onsidered.
Measurements
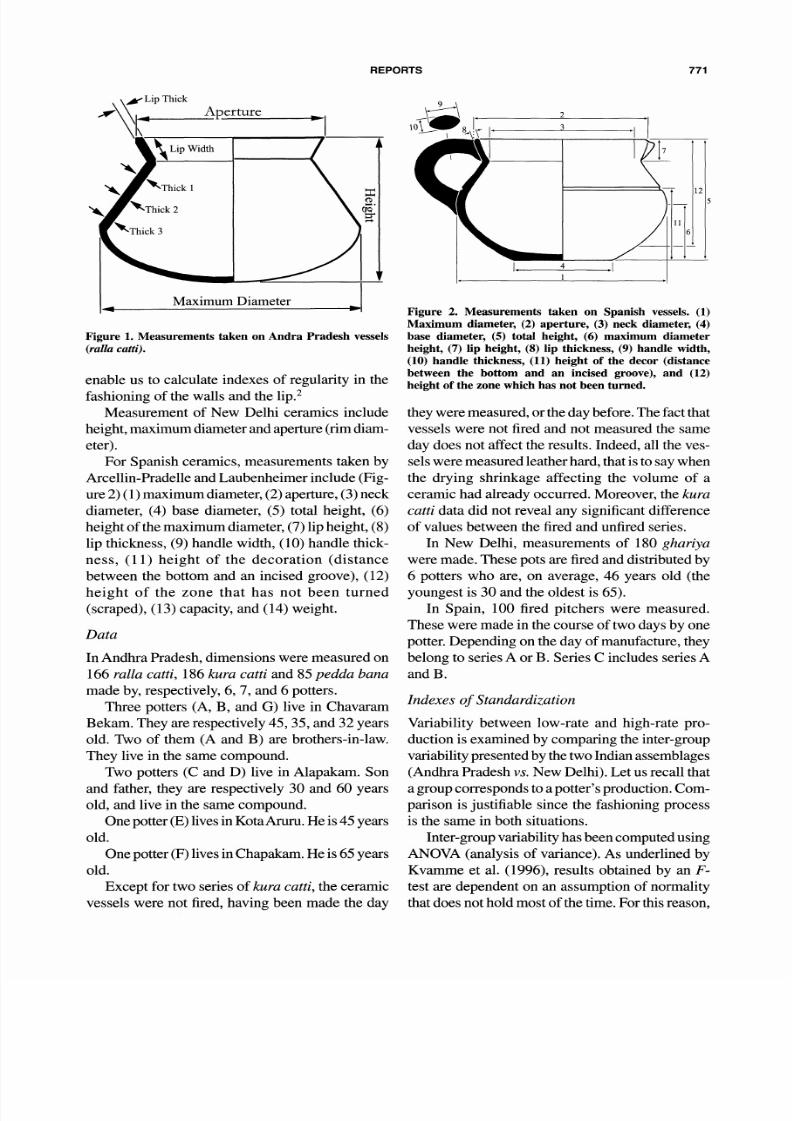
Measurements fAndhra Pradesh eramics nclude(Figure 1) height, maximum diameter, aperture(rim diameter), hickness of the wall and of the lip,and width of the ip. For he thickness, we took hree
measures n each side of the pot: wo of them relateto the wheel-thrown part, one relates to the pad-dled part. Thickness and width of the ip were mea-sured on each side of the aperture. hese measures
770 [Vol. 68, No. 4, 2003]
8/13/2019 Roux 2003 AA 68(4) estandarización cerámica
http://slidepdf.com/reader/full/roux-2003-aa-684-estandarizacion-ceramica 5/16
REPORTS
Figure 1. Measurements taken on Andra Pradesh vessels(ralla catti).
enable us to calculate ndexes of regularity n thefashioning of the walls and the lip.2
Measurement f New Delhi ceramics includeheight, maximum diameter nd aperture rim diam-eter).
For Spanish ceramics, measurements aken byArcellin-Pradelle nd Laubenheimer nclude (Fig-ure 2) (1) maximum diameter, 2) aperture, 3) neck
diameter, 4) base diameter, 5) total height, (6)height of the maximum diameter, 7) lip height, (8)lip thickness, 9) handle width, (10) handle thick-ness, (11) height of the decoration (distancebetween the bottom and an incised groove), (12)height of the zone that has not been turned(scraped), 13) capacity, and (14) weight.
Data
In Andhra Pradesh, dimensions were measured on166 ralla catti, 186 kura catti and 85 pedda banamade by, respectively, , 7, and 6 potters.
Three potters (A, B, and G) live in ChavaramBekam. They are respectively 45, 35, and 32 yearsold. Two of them (A and B) are brothers-in-law.They live in the same compound.
Two potters (C and D) live in Alapakam. Sonand father, hey are respectively 30 and 60 yearsold, and live in the same compound.
One potter E) ives n KotaAruru. e is 45 yearsold.
One potter F) lives n Chapakam. He is 65 yearsold.
Except for two series of kura catti, the ceramicvessels were not fired, having been made the day
Figure 2. Measurements taken on Spanish vessels. (1)Maximum diameter, (2) aperture, (3) neck diameter, (4)
base diameter, (5) total height, (6) maximum diameterheight, (7) lip height, (8) lip thickness, (9) handle width,(10) handle thickness, (11) height of the decor (distancebetween the bottom and an incised groove), and (12)height of the zone which has not been turned.
they were measured, r the day before. The fact thatvessels were not fired and not measured he sameday does not affect the results. Indeed, all the ves-sels were measured eather hard, hat s to say whenthe drying shrinkage affecting the volume of aceramic had already occurred. Moreover, he kura
catti data did not reveal any significant differenceof values between the fired and unfired eries.
In New Delhi, measurements f 180 ghariyawere made. These pots are fired and distributed y6 potters who are, on average, 46 years old (theyoungest s 30 and the oldest is 65).
In Spain, 100 fired pitchers were measured.These were made n the course of two days by onepotter. Depending on the day of manufacture, heybelong to series A or B. Series C includes series Aand B.
Indexes of Standardization
Variability between low-rate and high-rate pro-duction s examined by comparing he inter-groupvariability resented y the two Indian ssemblages(Andhra Pradesh s. New Delhi). Let us recall thata group corresponds o a potter's production. Com-parison s justifiable since the fashioning processis the same in both situations.
Inter-group ariability asbeen computed sing
ANOVA (analysis of variance). As underlined yKvamme et al. (1996), results obtained by an F-test are dependent on an assumption of normalitythat does not hold most of the time. For his reason,
771

8/13/2019 Roux 2003 AA 68(4) estandarización cerámica
http://slidepdf.com/reader/full/roux-2003-aa-684-estandarizacion-ceramica 6/16
AMERICAN ANTIQUITY
we proceeded with a posteriori tests (LSD3[Scheffe] and Games-Howell) hat are very robustwith populations that are not normally distrib-uted and are useful for comparing heterogeneous
variances on small samples.Variability etween ow-rate and high-rate pro-
duction s also examined by comparing he intra-group variability resented by the Indian AndhraPradesh and New Delhi) and the Spanish samples.The Spanish material will enable us to test whetherthe range of values, as observed n the Indian high-rate production ontext, aries according othe tech-nique (from paddle-and-anvil o wheel throwing).Moreover, he Spanish example will enable us totest the variability f ceramics made over he courseof two days by the same potter.
Intra-group ariability has been calculated onthe basis of Coefficient of Variation CV). CV isdefined as the sample standard deviation dividedby the sample mean, multiplied by 100 andexpressed as a percentage. t may be considered asthe standard tatistic in studies of variation andtherefore as an excellent measure of standardiza-tion (Eerkens and Bettinger 2001).
ResultsThe results of these analyses enable us to assesshow rate of production ffects the metric variabil-ity for paddled and wheel-thrown ots.
Inter-Group Variability n Low-Rate ProductionContexts
Inter-group ariability xists n low-rate productioncontexts; ANOVA hows significant differences p< .001) between the series of vessels produced bythe different ndian
pottersrom Andhra Pradesh
(Figures , 4, and 5). Statistical ests (LSD [Scheffe]and Games-Howell) confirm hese differences (p< .05). These differences hold for height, aperture,and maximum diameter.4 hey do not hold for theindexes of regularity f wall and of lip (width andthickness).
Pedda bana are produced ess frequently hanralla catti and kura catti. However, they are notcharacterized by inter-individual differencesstronger han the ones displayed by the two other
classes of vessels.Aperture s established during wheel throwing
and s not modified ater by paddling, as are vesselheight and maximum diameter. However, ontrary
Kura c.
19 -
18 -
17 -16 -
15 -
14 -
' 13 -
= 12
23 -j 22-
m 21 -
| 20 -0
: 19-
18 -
17 -
: 16
19 -
18 -
17 -
16 -
E15-
- 14 -
| 13 -
12
atti
TT T
Ti TT1 1
I I
I I I I I I I
A B C D E F G
-T T
T 11111
A B C D E F G
T TT
T Ti- II I I I I I I
A B C D E F G
Figure 3. Inter-group differences among Andhra Pradeshpotters (A-G) as shown by means and standard deviationsof measurements taken on kura catti.
to what we expected, wheel throwing does not pro-duce ess variability han he paddle-and-anvil ech-nique.
Inter-Group Variability n High-RateProduction Contexts
North Indian vessels display nter-group ariabil-ity as attested on the basis of ANOVA hat showssignificant differences p < .001) between ghariya
772 [Vol. 68, No. 4, 2003]

8/13/2019 Roux 2003 AA 68(4) estandarización cerámica
http://slidepdf.com/reader/full/roux-2003-aa-684-estandarizacion-ceramica 7/16
REPORTS
Pedda Bana
T T TTT T
Ti D 1TI
I I I I I I
A B D EF G
46 -
44 -
42 -
40 -
38-
. 36 -
E 34 -*o
= 32
46 -
j 44-
;42 -
| 40-
* 38-
| 36 -
. 34 -
S 32
TlTT
Ill
I I I I I I
A BD EF G
24 -
22 -
20 -
18-/~
= 16 -
14A I I I IF
A B D E F G
T
I I I I I I
A B D E F G
TT , T
I iiI I I I I I
A B D E F G
T
l vTT 1
I I I I I I
A BD EF G
Figure 4. Inter-group differences among Andhra Pradeshpotters (A-G) as shown by means and standard deviationsof measurements taken on ralla catti.
produced by Delhi potters (Figure 6). Statisticaltests (LSD [Scheffe] and Games-Howell) onfirmthese differences p < .05). These differences holdfor height, aperture, nd maximum diameter.5
Intra-Group Variability n Low-RateProduction Contexts
The Andhra Pradesh eramics yield the following
Figure 5. Inter-group differences among Andhra Pradeshpotters (A-G) as shown by means and standard deviationsof measurements taken on pedda bana.
results: variability n CVs for height, maximumdiameter, and aperture s highest for pedda bana.For pedda bana, CV values range from 1.43 to7.81 percent. For ralla catti, CV values rangemainly from 2.01 to 4.70 percent, except for onepotter whose CVvalues ange rom 6.61 to 7.15 per-cent. This potter F) is the oldest (65 years old). Forkura catti, CV values range mainly from 2.50 to
Ralla catti
19 -
18 -
17 -16 -
15 -
I 14 -
13 -
12
24 -
23-
22 -
21-
*20-E 19 -
* 18-
S 17
19 -
18 -
17 -
16 -
15-
X 14 -
13-
12
773

8/13/2019 Roux 2003 AA 68(4) estandarización cerámica
http://slidepdf.com/reader/full/roux-2003-aa-684-estandarizacion-ceramica 8/16
AMERICAN NTIQUITY
31.5-
31-
30.5 -
30-
29.5-
29-
28. 5-
28 -
27.5 -
27 .potteri potter2 potter3 potter4 potter5 potter6
14
13.5 -
13-
2.11 12.5-
1 23 T
29.8 -
29.66-
3 29.4-
E 29.2-
28.2 -
28.8-
2
28 p p 4 p ppotter1 potter2 potter3 potter4 potter5 potter6
Potters of New Delhi
Figure 6. Inter-group differences among New Delhi pot-ters (1-6) as shown by means and standard deviations ofmeasurements taken on ghariya.
5.54 percent, except for one potter whose CV val-ues range from 5.98 to 9.71 percent (Figure 7).This potter (B), who is 35 years old, is acknowl-edged to not be as good a potter as his brother-in-law (A).
Whatever the absolute dimensions, whetherheight, maximum diameter, or aperture, tandard
deviations SD) and CVvary within he same range.Since aperture s obtained by throwing, maximumdiameter y paddling, and height by a combinationof throwing and paddling, t follows that variation
Kura Catti- 10-8-
o 8-
V0
i 6-
4-
C. 0
AII I I I
AB C D E F G
Ralla Catti
- 10-8-
o 8-
i 6-
4-
E 2-0
U 0 I I I I I
A B D E F G
0
e
c
0c
E=
U
Pedda Bana10-
8-
6-
4-
2--
rxv I I I I I 1
A B D E F G
--- Height
.....M...... . Max. Diam.
.--.-.- Aperture
Figure 7. Coefficients of variations (CV) of measurementstaken on series of kura catti, ralla catti andpedda bana pro-duced by Andhra Pradesh potters (A-G).
32 ' I
I I I I I , I
I
II I ..
774 [Vol. 68, No. 4, 2003]
n
''`9?? b

8/13/2019 Roux 2003 AA 68(4) estandarización cerámica
http://slidepdf.com/reader/full/roux-2003-aa-684-estandarizacion-ceramica 9/16
Table 1. Measurements Taken on the Series of Ralla Catti Produced by Six Potters from Andhra Pradesh.
Max. Wall Wall Wall Lip LipPotters Height Diameter Aperture Thickl Thick2 Thick3 Width Thickness
Potter A (n = 31)
Mean (cm) 13.13 20.8 17.42 .41 .46 .39 1.32SD .62 .68 .64 .07 .06 .09 .19CV (%) 4.7 3.29 3.68 16.22 13.54 22.76 14.57
Potter B (n = 30)Mean (cm) 13.64 20.39 14.82 .25 .34 .52 1.83 .65SD .57 .54 .58 .06 .08 .11 .11 .17CV(%) 4.19 2.62 3.91 23.93 24.41 21.75 6.26 25.65
Potter D (n = 30)Mean (cm) 14.78 22.38 18.05 .40 .49 .54 1.76 1.4SD .55 .56 .36 .06 .07 .07 .11 .15CV (%) 3.75 2.51 2.01 14.9 13.58 13.48 6.44 10.5
Potter E (n = 30)Mean (cm) 14.47 22.79 17.02 .26 .31 .44 1.73 .53SD .6 .56 .61 .05 .04 .06 .09 .07CV(%) 4.16 2.45 3.58 21.01 13.66 14.08 5.47 12.39
Potter F (n = 18)Mean (cm) 13.84 22.23 17.06 .34 .38 .56 1.72 .94SD .91 1.5 1.22 .05 .06 .07 .09 .14CV (%) 6.61 6.73 7.15 13.98 16.95 12.38 5.38 14.68
Potter G (n = 27)
Mean (cm) 14.68 22.11 17.25 .41 .39 .47 1.7 .74SD .64 .84 .67 .08 .06 .07 .09 .13CV (%) 4.37 3.79 3.87 18.55 15.46 14.19 5.16 17.21
in dimension does not seem to depend on the fash-ioning technique.
Amplitude of CVvaries, or some potters, romone category of vessel to the next. The same pot-ter can present ow CV values on pedda bana, andhigher CV values on kura catti, or low CV valueson kura catti and higher CV values on ralla catti.
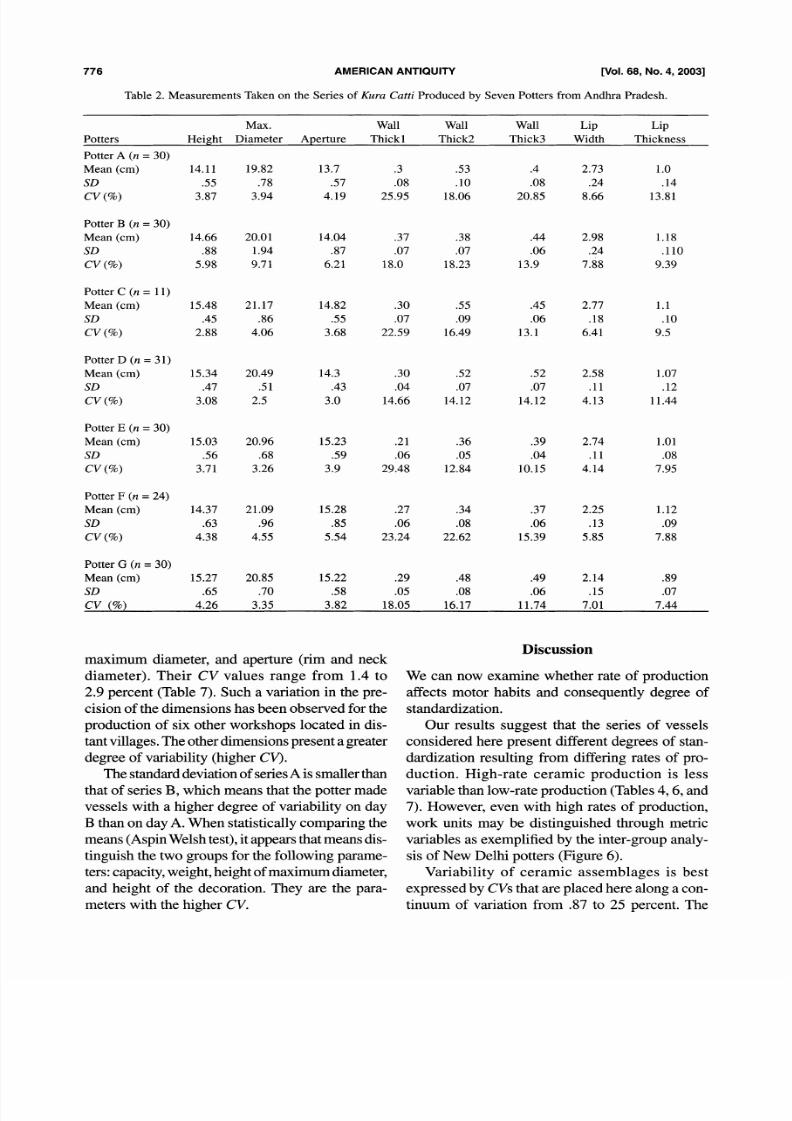
For the three ypes of vessels, thickness of wallsshows very high intra-group ariations, eflected nCVvalues hat can reach 25 percent Tables 1,2, 3).
CV values for lip thickness and width rangemostly from 4 to 8 percent. However, ome vesselgroups how high ntra-individual ariation Tables1,2,3).
When considering he standard eviations andCVvalues of each type of vessel, all potters pooled,
it appears hat, or height, maximum diameter andaperture, CVvalues ange rom 5 to 9 percent Table4). There s a cumulative ffect, also called cumu-lative blurring Blackman t al. 1993) that makes
these pooled CV values higher han hose for eachpotter.
Intra-Group Variability n High-RateProduction Contexts
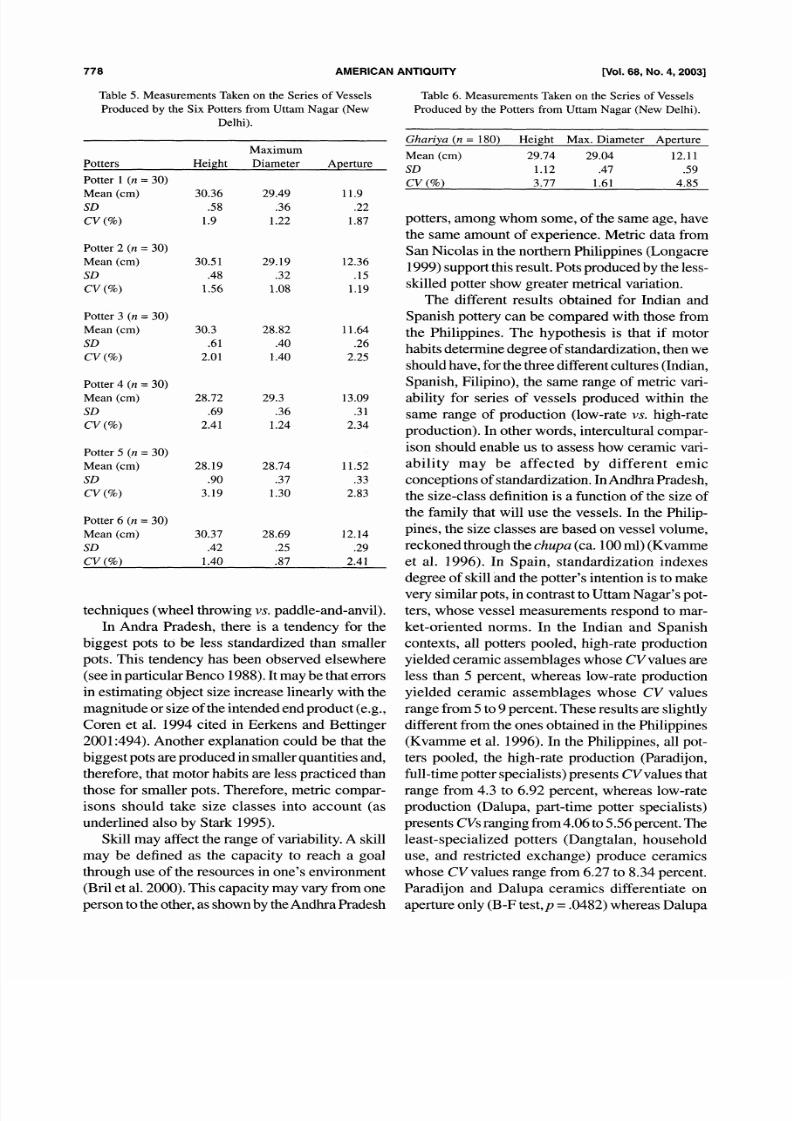
In Uttam Nagar (New Delhi),variability
withinpotters' production s less than n Andhra Pradesh.Except for one variable height of the ars made bypotter 5), all the CV values are less than 3 percent(Table 5). Maximum diameter presents he lowestvalues, ranging rom .87 to 1.40 percent. CV val-ues of aperture ange rom 1.19 to 2.83 percent. CVvalues of height range from 1.40 to 3.19 percent.
When pooling the potters, height, maximumdiameter nd aperture resent CVs hat range rom1 to 5 percent Table 6). Once again the cumula-
tive effect results in CV values higher than thosefor each individual potter.
In Spain, whatever he series considered A, Bor C), the dimensions that vary least are height,
REPORTS 775
8/13/2019 Roux 2003 AA 68(4) estandarización cerámica
http://slidepdf.com/reader/full/roux-2003-aa-684-estandarizacion-ceramica 10/16
Table 2. Measurements Taken on the Series of Kura Catti Produced by Seven Potters from Andhra Pradesh.
Max. Wall Wall Wall Lip LipPotters Height Diameter Aperture Thickl Thick2 Thick3 Width Thickness
Potter A (n = 30)
Mean (cm)SDCV (%)
14.11 19.82.55 .78
3.87 3.94
13.7.57
4.19
.3
.0825.95
.53
.1018.06
.4 2.73
.08 .2420.85 8.66
Potter B (n = 30)Mean (cm)SDCV %)
Potter C (n = 11)Mean (cm)SDCV(%)
Potter D (n = 31)Mean (cm)SDCV(%)
Potter E (n = 30)Mean (cm)SDCV (%)
Potter F (n = 24)
Mean (cm)SDCV (%)
Potter G (n = 30)Mean (cm)SDCV (%)
14.66 20.01.88 1.94
5.98 9.71
15.48 21.17.45 .86
2.88 4.06
15.34 20.49.47 .51
3.08 2.5
15.03 20.96.56 .68
3.71 3.26
14.37 21.09.63 .964.38 4.55
15.27 20.85.65 .70
4.26 3.35
14.04.87
6.21
14.82.55
3.68
14.3.43
3.0
15.23.59
3.9
15.28.855.54
.37 .38
.07 .0718.0 18.23
.30 .55
.07 .0922.59 16.49
.30 .52
.04 .0714.66 14.12
.21 .36
.06 .0529.48 12.84
.27 .34.06 .0823.24 22.62
15.22 .29.58 .05
3.82 18.05
.48
.0816.17
.44 2.98
.06 .2413.9 7.88
.45 2.77
.06 .1813.1 6.41
.52 2.58
.07 .1114.12 4.13
.39 2.74
.04 .1110.15 4.14
.37 2.25.06 .1315.39 5.85
.49 2.14
.06 .1511.74 7.01
maximum diameter, and aperture rim and neck
diameter).Their CV values
rangefrom 1.4 to
2.9 percent Table 7). Such a variation n the pre-cision of the dimensions has been observed or theproduction of six other workshops ocated in dis-tant villages. The other dimensions resent greaterdegree of variability higher CV).
The standard eviation f series A is smaller hanthat of series B, which means that he potter madevessels with a higher degree of variability on dayB than on day A. When statistically omparing hemeans Aspin Welsh est), t appears hat means dis-
tinguish he two groups or the following parame-ters: apacity, weight, height of maximum diameter,and height of the decoration. They are the para-meters with the higher CV.
Discussion
We can now examine whether rate ofproductionaffects motor habits and consequently degree of
standardization.Our results suggest that the series of vessels
considered here present different degrees of stan-dardization esulting from differing rates of pro-duction. High-rate ceramic production is lessvariable han ow-rate production Tables 4, 6, and7). However, even with high rates of production,work units may be distinguished hrough metricvariables as exemplified by the inter-group naly-sis of New Delhi potters Figure 6).
Variability of ceramic assemblages is bestexpressed by CVs hat are placed here along a con-tinuum of variation rom .87 to 25 percent. The
1.0.14
13.81
1.18.110
9.39
1.1.10
9.5
1.07.12
11.44
1.01.08
7.95
1.12.097.88
.89
.077.44
AMERICAN ANTIQUITY [Vol. 68, No. 4, 2003]76
8/13/2019 Roux 2003 AA 68(4) estandarización cerámica
http://slidepdf.com/reader/full/roux-2003-aa-684-estandarizacion-ceramica 11/16
Table 3. Measurements Taken on Series of Pedda Bana Produced by Six Potters from Andhra Pradesh.
Potters
Potter A (n = 12)
Mean (cm)SDCV(%)
Potter B (n = 16)Mean (cm)SDCV (%)
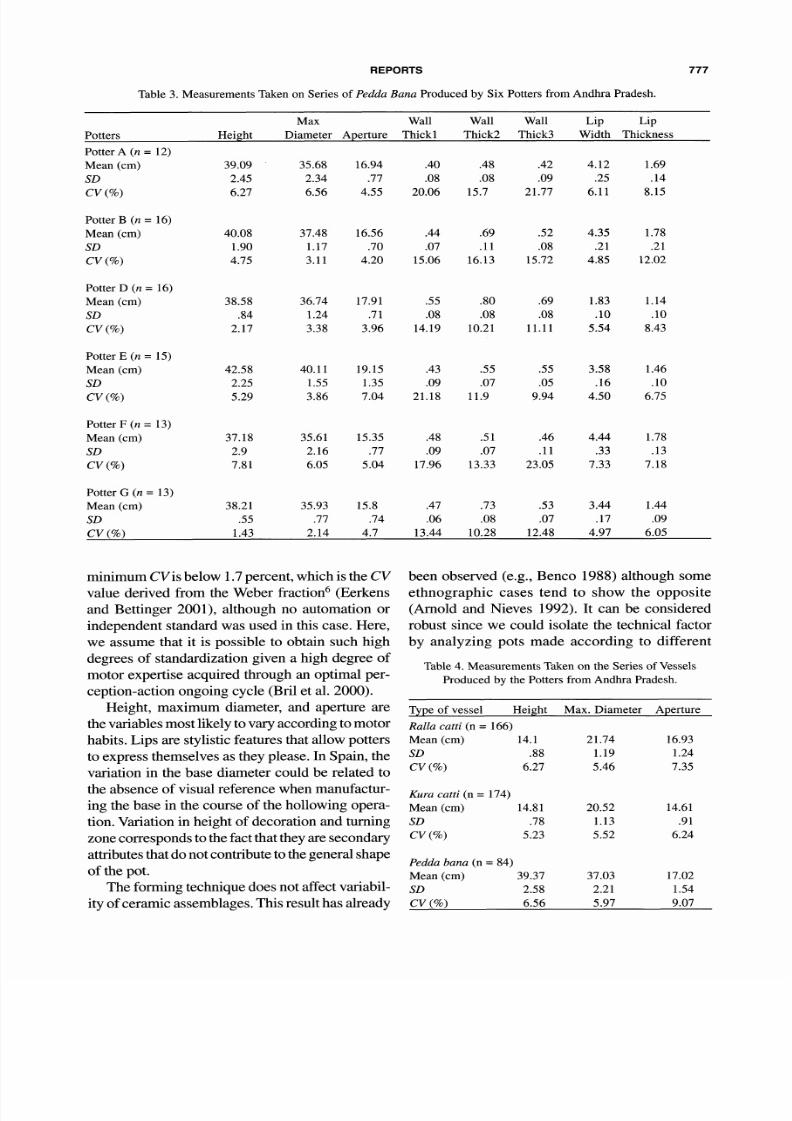
Potter D (n = 16)Mean (cm)SDCV(%)
Max Wall Wall Wall Lip LipHeiPht Diameter Aperture Thickl Thick2 Thick3 Width Thickness
39.092.456.27
40.081.904.75
38.58.84
2.17
35.68 16.94 .40 .48 .42 4.12 1.692.34 .77 .08 .08 .09 .25 .146.56 4.55 20.06 15.7 21.77 6.11 8.15
37.48 16.56 .44 .69 .52 4.35 1.781.17 .70 .07 .11 .08 .21 .213.11 4.20 15.06 16.13 15.72 4.85 12.02
36.74 17.91 .55 .80 .69 1.83 1.141.24 .71 .08 .08 .08 .10 .103.38 3.96 14.19 10.21 11.11 5.54 8.43
Potter E (n = 15)Mean (cm)SDCV(%)
42.582.255.29
40.11 19.15 .43 .551.55 1.35 .09 .073.86 7.04 21.18 11.9
.55 3.58 1.46
.05 .16 .109.94 4.50 6.75
Potter F (n = 13)Mean (cm)SDCV(%)
Potter G (n = 13)Mean
(cm)SDCV (%)
37.182.97.81
38.21.55
1.43
35.61 15.35 .48 .51 .46 4.44 1.782.16 .77 .09 .07 .11 .33 .136.05 5.04 17.96 13.33 23.05 7.33 7.18
35.93 15.8 .47 .73 .53 3.44 1.44.77 .74 .06 .08 .07 .17 .09
2.14 4.7 13.44 10.28 12.48 4.97 6.05
minimum CVis below 1.7percent, which s the CV been observed (e.g., Benco 1988) although somevalue derived from the Weber fraction6 Eerkens ethnographic cases tend to show the oppositeand Bettinger 2001), although no automation or (Arnold and Nieves 1992). It can be consideredindependent tandard was used in this case. Here, robust since we could isolate the technical actorwe assume that it is possible to obtain such high by analyzing pots made according to differentdegrees of standardization given a high degree ofdegrees ofstann n a hh d e of Table 4. Measurements Taken on the Series of Vesselsmotor
expertise acquired throughan optimal per-
Produced y the Potters rom Andhra Pradesh.ception-action ngoing cycle (Bril et al. 2000).Height, maximum diameter, and aperture are Type of vessel Height Max. Diameter Aperture
the variables most likely to vary according to motor Ralla catti (n = 166)habits. Lips are stylistic features that allow potters Mean cm) 14.1 21.74 16.93
to express themselves as they please. In Spain, the SD .88 1.19 1.24
variation n the base diameter could be related o cv(%) 6.27 5.46 7.35
the absence of visual reference when manufactur- Kura catti n = 174)
ing the base in the course of the hollowing opera- Mean cm) 14.81 20.52 14.61tion. Variation in height of decoration and turning SD .78 1.13 .91
zone corresponds to the fact that they are secondary CV %) 5.23 5.52 6.24
attributes hat do not contribute to the general shape dd b 84)_ ~c ~_1 .... V~~~~~ ~Pedda bana (n = 84)
ot tme pot.The forming echnique does not affect variabil-
ity of ceramic assemblages. This result has already
Mean (cm) 39.37 37.032.58 2.216.56 5.97
17.021.549.07
----~~~~~~--IIt-, - -r -- I- --___
-
REPORTS 777
8/13/2019 Roux 2003 AA 68(4) estandarización cerámica
http://slidepdf.com/reader/full/roux-2003-aa-684-estandarizacion-ceramica 12/16
AMERICAN NTIQUITY
Table 5. Measurements Taken on the Series of VesselsProduced by the Six Potters rom Uttam Nagar (New
Delhi).
MaximumPotters
HeightDiameter
AperturePotter 1 (n = 30)Mean (cm) 30.36 29.49 11.9SD .58 .36 .22CV (%) 1.9 1.22 1.87
Potter 2 (n = 30)Mean (cm) 30.51 29.19 12.36SD .48 .32 .15CV (%) 1.56 1.08 1.19
Potter 3 (n = 30)Mean (cm) 30.3 28.82 11.64SD .61 .40 .26CV (%) 2.01 1.40 2.25
Potter 4 (n = 30)Mean (cm) 28.72 29.3 13.09SD .69 .36 .31CV (%) 2.41 1.24 2.34
Potter 5 (n = 30)Mean (cm) 28.19 28.74 11.52SD .90 .37 .33CV (%) 3.19 1.30 2.83
Potter 6 (n = 30)Mean (cm) 30.37 28.69 12.14SD .42 .25 .29CV (%) 1.40 .87 2.41
techniques wheel throwing vs. paddle-and-anvil).In Andra Pradesh, here is a tendency for the
biggest pots to be less standardized han smallerpots. This tendency has been observed elsewhere
(seein
particularenco
1988).It
maybe that errors
in estimating object size increase inearly with themagnitude r size of the ntended nd product e.g.,Coren et al. 1994 cited in Eerkens and Bettinger2001:494). Another explanation ould be that thebiggest pots are produced n smaller quantities nd,therefore, hat motor habits are ess practiced hanthose for smaller pots. Therefore, metric compar-isons should take size classes into account (asunderlined lso by Stark 1995).
Skill may affect the range of variability. A skill
may be defined as the capacity to reach a goalthrough use of the resources n one's environment(Bril et al. 2000). This capacity may vary rom oneperson o the other, s shown by the Andhra Pradesh
Table 6. Measurements Taken on the Series of VesselsProduced by the Potters from Uttam Nagar (New Delhi).
Ghariya (n = 180) Height Max. Diameter ApertureMean (cm) 29.74 29.04 12.11
SD 1.12 .47 .59CV (%) 3.77 1.61 4.85
potters, among whom some, of the same age, havethe same amount of experience. Metric data fromSan Nicolas in the northern Philippines Longacre1999) support his result. Pots produced y the ess-skilled potter show greater metrical variation.
The different results obtained for Indian andSpanish pottery can be compared with those fromthe
Philippines.The
hypothesisis that if motor
habits determine egree of standardization, hen weshould have, or the three different ultures Indian,Spanish, Filipino), the same range of metric vari-ability for series of vessels produced within thesame range of production low-rate vs. high-rateproduction). n other words, ntercultural ompar-ison should enable us to assess how ceramic vari-ability may be affected by different emicconceptions of standardization. nAndhra radesh,the size-class definition s a function of the size of
the family that will use the vessels. In the Philip-pines, the size classes are based on vessel volume,reckoned hrough he chupa ca. 100 ml) (Kvammeet al. 1996). In Spain, standardization ndexesdegree of skill and the potter's ntention s to makevery similar pots, n contrast o Uttam Nagar's pot-ters, whose vessel measurements espond o mar-ket-oriented norms. In the Indian and Spanishcontexts, all potters pooled, high-rate productionyielded ceramic assemblages whose CVvalues areless than 5
percent,whereas low-rate
productionyielded ceramic assemblages whose CV valuesrange rom 5 to 9 percent. These results are slightlydifferent rom the ones obtained n the Philippines(Kvamme et al. 1996). In the Philippines, all pot-ters pooled, the high-rate production Paradijon,full-time potter pecialists) presents CVvalues hatrange from 4.3 to 6.92 percent, whereas ow-rateproduction Dalupa, part-time potter specialists)presents CVs anging rom 4.06 to 5.56 percent. Theleast-specialized potters (Dangtalan, household
use, and restricted exchange) produce ceramicswhose CV values range from 6.27 to 8.34 percent.Paradijon and Dalupa ceramics differentiate onaperture nly (B-F test, p = .0482) whereas Dalupa
778 [Vol. 68, No. 4, 2003]

8/13/2019 Roux 2003 AA 68(4) estandarización cerámica
http://slidepdf.com/reader/full/roux-2003-aa-684-estandarizacion-ceramica 13/16
REPORTS
Table 7. Measurements Taken on the Series of PitchersProduced by One Potter n the Course of Two Days.
Measurements
Maximum diameter
Aperture
Neck diameter
Base diameter
Total height
Maximum diam.
height
Lip height
Lip thickness
Handle width
Handle thickness
Height of the decor
Height of thenon-turned one
Capacity
Weight
Series
A
BCABCABCABCABCABCABCABCAB
CABCABCABCABC
ABC
Mean (mm)121.1
120.2121.098.9
100.1100.182.780.982.149.650.450.078.880.479.340.340.641.113.914.414.45.05.95.0
17.517.2
17.410.59.8
10.246.945.946.156.451.855.2
489.6490.2492.1
353.2348.5352.5
SD
1.7
2.42.12.12.42.61.92.22.22.62.22.32.12.22.41.82.11.9
.9
.6
.7
.1
.3
.2
.7
.5
.8.5
.5
.62.33.12.95.25.86.0
25.118.528.3
14.517.416.8
CV (%)1.4
2.01.72.22.42.52.32.62.75.74.44.62.62.62.94.45.13.76.44.34.92.06.04.84.03.0
2.84.75.16.04.96.86.19.2
11.210.05.16.2
15.7
4.15.04.7
Note: Series A (n = 50) and B (n = 50) were made over two
days. Series C pools series A and B. Data from Arcellin-Pradelle and Laubenheimer 1985).
and Dangtalan ceramics differentiate n apertureand height (B-F test,p = .008,p = .0003) (Kvammeet al. 1996). The three communities mploy a com-bination of coil-and-scrape nd paddle-and-anviltechniques o fashion their pots.
These observations suggest, first, that small-scale production does develop motor habits thatenable potters to produce standardized eries of
vessels comparable o those made by high-rate ro-ducers. This point s supported y the San Nicolasdata published by Longacre 1999). Series of waterjars (62, 36, 25, and 20 pots made respectively by
four potters) vary between about 3 and 4 percentmetrically. Their annual production s comparableto that achieved by the Andhra Pradesh potters(Longacre ndicates that they make 100 pots perweek when it is not raining). Small-scale produc-tion refers here o annual production f a few thou-sands pots. It has to be distinguished rom verysmall-scale production whose metric variability smuch higher. The Kalinga pottery varies about 12percent (Longacre 1999). Such variation s com-parable o the variation bserved n Papua ndAma-zonia for very low production Stark 1995).
Second, emic conceptions of class sizes mayinduce a certain variability, which is why CV val-ues do not range he same way from one culture othe other, despite similar rates of production asobserved also by Longacre 1999).
Third, n a cumulative-effect ituation, o small-scale ceramic assemblage presents t east wo vari-ables with CV values lower than 3 percent.
To summarize, he ethnographic ata presented
here suggest that ceramic assemblages presentingCV values from 3 to 6 percent are quite ambigu-ous. They may result from large-scale as well assmall-scale production. Ceramic assemblages pre-senting CV values from 6 to 9 percent may belongto small-scale as well as very small-scale produc-tion. Ceramic assemblages presenting at least twovariables with CV values below 3 percent point tohigh-scale production Figure 8).
These ceramic assemblages are made up offewer than 10
productionvents (i.e., let us recall
that a production vent corresponds o a potter'sproduction). n the future, more assemblages rep-resenting more numerous roduction vents shouldbe analyzed. Indeed, we have seen that the morewe pool potters ogether, he greater he cumula-tive effect that plays on the CVvalues. This cumu-lative effect should be amplified f assemblages aremade up of production vents achieved over a fewcenturies, or else multiple production vents.
Finally, et us recall that arge-scale production
is achieved by full-time specialists, whereas ow-scale production may be achieved either by full-time or part-time specialists, or even by theleast-specialized potters n a community.
779

8/13/2019 Roux 2003 AA 68(4) estandarización cerámica
http://slidepdf.com/reader/full/roux-2003-aa-684-estandarizacion-ceramica 14/16
AMERICAN ANTIQUITY
Large-scale production Large-scale production Small-scale production or(14,000 pots a year per potter) or small-scale production very small-scale production
(between 14,000 and 4,000 pots (6,000 pots a year or lessa year per potter) per potter)
<3% 3%-6% >6%9%
(|) CV Andhra radesh
6%
Cr^v i ~Delhi)iV JAndhra Pradesh
3%
(Z)r^v^ ~DelhiSpain
G ?Figure 8. Quantifying rate of production by reference to ceramic assemblages made up of less than 10 production events.
Application To Archaeological Data
Let us now apply our results o archaeological ata.We consider he open-simple-rim ine ware bowlsthat had become one of the most characteristic
ceramic forms by 2200 B.C. at Tell Leilan andnumerous other sites in Northern Mesopotamia.As outlined by Blackman et al. (1993), they offerthe rare opportunity o examine he notion of stan-dardization ince large waster stacks have beenrecovered n the eastern part of the Leilan lowertown (Period IIb). A portion of the stacks, con-taining 27 whole bowls and bowl fragments, wasbrought o United States and examined by Black-man et al. (1993). According o their results, stan-dardized
rocedureswere followed at
every stepof
the bowl-production rocess. Chemical analysis ofthe bowls in the waster stack shows a remarkablyhigh degree of homogeneity n the chemical com-position of the constituent lays. Concerning es-sel dimensions, ive measurements ere made: imdiameter, wall thickness 1 cm below the rim, ves-sel height, base diameter, and maximum basalthickness. According to Blackman et al. (1993),these bowls show a high degree of standardizationsince CVvalues are ess than 10 percent. From his,they conclude that metric data from the Leilanwasters show a level of homogeneity consistentwith expectations or specialized mass productionof utilitarian oods (Blackman t al. 1993:73).
Tell Leilan bowls are supposed to be a singleproduction vent. If we compare Tell Leilan bowlswith Indian, Spanish, and Filipino vessels in termsof standard deviation and CV, it appears hat weare dealing with a weakly standardized roduc-tion system: CV values of rim diameters are9.19 percent and CV values of heights are 4.4 per-cent. These CV values, which are not affected byany cumulative effect, are high compared o ourethnographic eference points. They do not corre-spond to so-called large-scale production. Theymay reflect small-scale production, which meansthat, even if they were made by specialists (asattested by the skills required or their ashioning;see Roux and Corbetta 1989), the rate of produc-tion
maynot have been so
high (Figure 8).The low degree of standardization hat appearsin this production s quite consistent with the vari-ability measured on a second series of open-sim-ple-rim bowls recovered from domestic refusecontexts (Leilan, Period IIb). This second seriescould have been produced ver 200 years. CV val-ues reach 18 percent. Blackman t al. (1993) inter-pret this variability in terms of noncentralizedproduction; .e., multiple workshops during periodIIb. According o our ethnographic ata, he cumu-
lative effect of intra- and inter-group variabilityshould not be underestimated as underlined lsoby Blackman et al. 1993). In the case of the sec-ond series of bowls from Tell Leilan, the 18
780 [Vol. 68, No. 4, 2003]

8/13/2019 Roux 2003 AA 68(4) estandarización cerámica
http://slidepdf.com/reader/full/roux-2003-aa-684-estandarizacion-ceramica 15/16
REPORTS
percent CV values could be the result of a cumula-tive effect over 200 years and correspond o ves-sels whose degree of variability, for a singleproduction vent, could not have exceeded 9 per-
cent. The variability f the two series of bowls maytherefore be highly comparable as suggested alsoby Blackman et al. 1993:74) and interpreted nterms of similar rates of production.
Conclusion
In this paper, we have examined he standardiza-tion hypothesis hrough he metric variability pre-sented by series of vessels produced n differenteconomic contexts. By comparing different eco-nomic situations belonging to the same culture(Indian), we have been able to isolate the parame-ter intensity of production n order to test thehypothesis according o which rate of productionplays on motor habits hat, n turn, affect he degreeof standardization. urresults how hat ateof pro-duction does affect the degree of standardization.However, when comparing ceramic assemblagesfrom different cultures (Filipino), it appears hatemic conceptions of standardization lso play onmetric variability. Only in a high-rate production
situation do we have motor habits that transcendemic conceptions of standardization. t enables usto quantify, ven f hypothetically, herelative angeof variability xpected on vessels made within dif-ferent contexts of production. When applied toarchaeological data, these results show that someceramic production onsidered up to now as highlystandardized may correspond, n fact, to relativelysmall-scale production.
By way of conclusion, let us emphasize thatarchaeological data need to be interpreted y ref-erence to quantified thnographic data. Quantifi-cation has to be cross-cultural o that it can beapplied n any cultural ontext. In order o elabo-rate cross-cultural eferents or regularities, echni-cal facts have to be studied n terms of resourcesand constraints Roux 1999). The constraints on-sidered here are the motor habits underlying heproduction of standardized eries of vessels. Thecultural aspect is taken into account through heemic conceptions of standardization. One of the
aims of ethnoarchaeological tudy s also to assessthe context nto which constraints ranscend micconceptions. Ultimately, uch an approach nablesus to test our nterpretations gainst mpirical data.
Acknowledgments. This research was supported by a grantfrom the French Institute of Pondicherry (Ministry of
Foreign Affairs). A first version of the paper was presented atthe 1994 World Archaeological Congress in New Delhi,India. I thank J. Pouchepadass or support of the project and
M.L.K. Murty for his precious collaboration in the field.Comments on earlier drafts of this paper by Patricia L.Crown and anonymous reviewers are especially acknowl-
edged. I also kindly thank Tim Kohler for critique, sugges-tions, and editorial comments. I am grateful to JehanneFeblot-Augustins and Carol Kramer or their help in improv-ing my English. Figures were drafted by Gerard Monthel(CNRS, UMR7055). The Spanish abstract was kindly trans-lated by Jean-Francois Bouchard.
References CitedArcelin-Pradelle, C., and F. Laubenheimer
1982 Une Mission d'Archeo-Ethnologie: es Ateliers dePotiers Traditionnels ans es Provinces de Valencia t deCastellen Espagne). Techniques t Technologies. ourcesDocumentaires :27-52. Institut de Recherches Mediter-raneennes, Universit6 de Provence.
1985 La Notion de Serie de Production en CeramiqueTournme. echniques t Technologies. ources Documen-taires 7:129-139. Institut de Recherches Mediter-ran6ennes, Universite de Provence.
Arnold, D., and A. L. Nieves1992 Factors Affecting Ceramic Standardization. In
Ceramic Production and Distribution: an IntegratedApproach, edited by G.J. Bey III and C.A. Pool, pp.113-214. Westview Press, Boulder, Colorado.
Benco, N.1988 Morphological Standardization: n Approach o theStudy of Craft Specialization. n A Pot or All Reasons:Ceramic Ecology Revisited, edited by C. Kolb and L.Lackey, pp. 57-72. Temple University, Philadelphia.
Blackman, M. J., G. J. Stein, and P. B. Vandiver1993 The Standardization ypothesis and Ceramic Mass
Production: Technological, Compositional and MetricIndexes of Craft Specialization tTell Leilan, Syria. Amer-ican Antiquity 8:60-8.
Bril, B., V. Roux, and G. Dietrich2000 Skills Involved n the Knapping f Chalcedony Beads:
Motor and Cognitive Characteristics f a Complex Situ-ated Action. In Cornaline de lInde: Des pratiques ech-
niques de Cambay aux techno-systemes e lIndus, editedby V. Roux, pp. 207-332. Editions de la MSH, Paris Eng-lish CD-Rom enclosed).
Coren, S., L. M. Ward, and J. T. Enns1994 Sensation and Perception. 4th ed. Harcourt Brace,
Fort Worth, Texas.Costin, C. L.
1991 Craft Specialization: ssues in Defining, Document-ing and Explaining the Organization of Production. nAdvances n Archaeological Method and Theory, Vol. 3,edited by M. B. Schiffer, pp. 1-56. University of ArizonaPress, Tucson.
2000 The Use of Ethnoarchaeology or the ArchaeologicalStudy of Ceramic Production. ournal of ArchaeologicalMethod and Theory 7:377-403.
Costin, C. L., and M. B. Hagstrum1995 Standardization, Labor Investment, Skill, and the
Organization f Ceramic Production n Late PrehispanicHighland Peru. American Antiquity 0:619-639.
781

8/13/2019 Roux 2003 AA 68(4) estandarización cerámica
http://slidepdf.com/reader/full/roux-2003-aa-684-estandarizacion-ceramica 16/16
AMERICAN ANTIQUITY
Eerkens, J. W., and R. L. Bettinger2001 Techniques or Assessing Standardization n Artifact
Assemblages: Can We Scale Material Variability? Amer-ican Antiquity 6:493-504.
Feinman, G. M., S. Upham, and K. G. Lightfoot1981 The Production Step Measure: An Ordinal ndex of
Labor nput n Ceramic Manufacture. merican Antiquity46:871-884.Gallay, A.
1986 L'archeologie Demain. Belfond, Paris.Kvamme, K. L., M. T. Stark, and W. A. Longacre
1996 Alternative rocedures orAssessing Standardizationin Ceramic Assemblages. AmericanAntiquity 1:116-126.
London, G. A.1991 Standardization nd Variation n the Work of Craft
Specialists. n Ceramic Ethnoarchaeology, dited by W.A.Longacre, pp. 182-204. University of Arizona Press, Tuc-son.
Longacre, W. A.1991 Sources of Ceramic Variability mong he Kalinga of
Northern Luzon. In Ceramic Ethnoarchaeology, dited byW.A. Longacre, pp. 95-11. University of Arizona Press,Tucson.
1999 Standardization nd Specialization: What's he Link?In Pottery and People, edited by J. Skibo and G. Feinman,pp. 231-267. University of Utah Press, Salt Lake City.
Longacre, W. A., K. L. Kvamme, and M. Kobayashi1988 Southwestern Pottery Standardization: n Ethnoar-
chaeological View from he Philippines. Kiva 53:101-112.Rice, P.
1989 Ceramic Diversity, Production nd Use. In Quantify-ing Diversity nArchaeology, dited by R. D. Leonard andG. T. Jones, pp. 109-117. Cambridge University Press,Cambridge.
1991 Specialization, Standardization nd Diversity: a Ret-rospective. In The Ceramic Legacy of Anna 0. Shepard,edited by R. L. Bishop and F. W. Lange, pp. 257-279. Uni-versity Press of Colorado, Boulder, Colorado.
Roux, V., and D. Corbetta1989 The Potter's Wheel: Craft Specialization nd Techni-
cal competence. Oxford and IBH Publishing, New Delhi.Roux, V.
1999 Ethnoarcheology nd the Generation f ReferentialModels: The Case of Harappan arelian Beads. In Ethno-Analogy and the Reconstruction fPrehistoricArtefact seand Production, edited by L. Owen and M. Porr, pp.153-17. MoVince Verlag, Ttibingen.
Saraswati, B., and N. K. Behura
1964 Pottery Techniques n Peasant India. Anthropologi-cal Survey of India, Vol. 13, Calcutta.
Sinopoli, C.1988 The Organization f Craft Production at Vijayana-
gara, South India. American Anthropologist 0:580-597.Stark, B. L.
1995 Problems n the Analysis of Standardization nd Spe-
cialization n Pottery. n Ceramic Production n the Amer-ican Southwest, edited by B. Mills and P. Crown, pp.231-267. University of Arizona Press, Tucson.
Notes
1. The ethnoarchaeological survey was carried out inAndhra Pradesh, in February 1991, in collaboration withProf. M.L.K. Murty (University of Hyderabad).
2. Index of regularity f walls = (Thickl/L-Thickl/R)2 +(Thick2/L-Thick2/R)2 + (Thick3/L-Thick3/R)2. L = left, R= right). Likewise for thickness and width of the lip.
3. The Least Significant Difference (LSD) is the mini-mum difference between the two groups that can be consid-ered statistically significant.
4. For kura catti (Figure 3), height differentiates etween
potter A and potters C, D, E, G, potter F and potter C, D, E,G, and potter B and potters C, D, G. Maximum diameter dif-ferentiates between potter A and potters C, D, E, F, G, and
potters D and E. Aperture differentiates between potter A andpotters C, D, E, F, G, potters B and C, E, F, G, and potters Dand E, F, G (Games-Howell test). For ralla catti (Figure 4),height differentiates potter A and potters B, D, E, G, potter Band potters D, E, G, and potter F and potters D and G.Maximum diameter differentiates between potter B and pot-ters D, E, F, G, potter A and potters D, E, F, G, and potters Gand E. Aperture differentiates etween potter B and potters A,D, E, F, G, and potter D and potters A, E, F, G (Games-Howell test). For pedda bana (Figure 5), height differentiatesbetween potter F and potters B, E, potter G and potters B, E,and potter E and potters A, B, D. Maximum diameter differ-entiates between
potterE and
potterA, B, D, F, G, and
pot-ters G and B. Aperture differentiates between potter F and
potters A, B, D, E, potter G and potters A, D, E, potter B and
potters D, E, potter A and potters D, E, and potters D and E(Games-Howell est).
5. Height differentiates between potters 5 and 1, 2, 4, 6,potters 3 and 1, 2, 4, 6, potters 1 and 2, 4, 6, potters 6 and 4,and potters 2 and 4. Aperture differentiates ach potter fromeach other. Maximum diameter differentiates between two
groups of potters: potters 3, 5, 6 and potters 1, 2, 4 (Games-Howell test).
6. Unlike mechanical scales that determine weightwithin an invariant nit of error, human appreciation f heav-
iness is scaled relative o object weight. This value (2 percent)has come to be called the Weber's fraction for heaviness(Eerkens and Bettinger 2001:495).
Received March 25, 2002; Revised October 31, 2002;Accepted April 17, 2003.
782 [Vol. 68, No. 4, 2003]