
Presentatie r Schop08
41
RELIABILITY ENGINEERING RELIABILITY ENGINEERING Ing. Ronald Schop Ing. Ronald Schop Weibull: Reliability Engineering Weibull: Reliability Engineering www.weibull.nl www.weibull.nl Life Data Analysis using the Weibull distribution PLOT Seminar October 2008
-
Upload
jose-d-salinas -
Category
Documents
-
view
13 -
download
0
Transcript of Presentatie r Schop08

RELIABILITY ENGINEERINGRELIABILITY ENGINEERING
Ing. Ronald SchopIng. Ronald Schop
Weibull: Reliability EngineeringWeibull: Reliability Engineering
www.weibull.nlwww.weibull.nl
Life Data Analysis using the Weibull distribution
PLOT Seminar October 2008

2
PLOT Seminar 2008
ContentContent
Why ReliabilityWhy Reliability
Weibull StatisticsWeibull Statistics
Weibull Shape Parameter Weibull Shape Parameter ββ
Cases:Cases:
1 1 -- Steering Link FailuresSteering Link Failures
2 2 -- Is the new Design better?Is the new Design better?

3
PLOT Seminar 2008
Reliability Reliability Effects:Effects:
Business PerformanceBOTH CUSTOMER &
SUPPLIER
Warranty Costs
R&M Costs
Cost of Ownership
Pricing
Safety
Residual Value
Availability
Image
Re-buying
Customer & SupplierCustomer & Supplier

4
PLOT Seminar 2008
New Price Costs Re-sale PriceLife Cycle Costs (EURO)
Cus
tom
er C
osts Current
Life Cycle CostsLife Cycle CostsCustomer CostsCustomer Costs
Preventive
Warranty
Repair & MaintenanceTotal Costs
Corrective
Current

5
PLOT Seminar 2008
USA 1990 Deaths Per 100.000
0
500
1000
1500
2000
2500
0 - 1 10 20 30 40 50 60
Age Intervals (years)
Dea
ths/
100.
000
Real Life Bath Tub CurveReal Life Bath Tub CurveStatisticsStatistics

6
PLOT Seminar 2008
Simplified Model: Simplified Model: Bath Tub curveBath Tub curve
System Life (years)
Fai
lure
s / S
yste
m
EarlyLife
Useful Life LateLife
InfantMortality
Wear outRandom
StatisticsStatistics
7
PLOT Seminar 2008
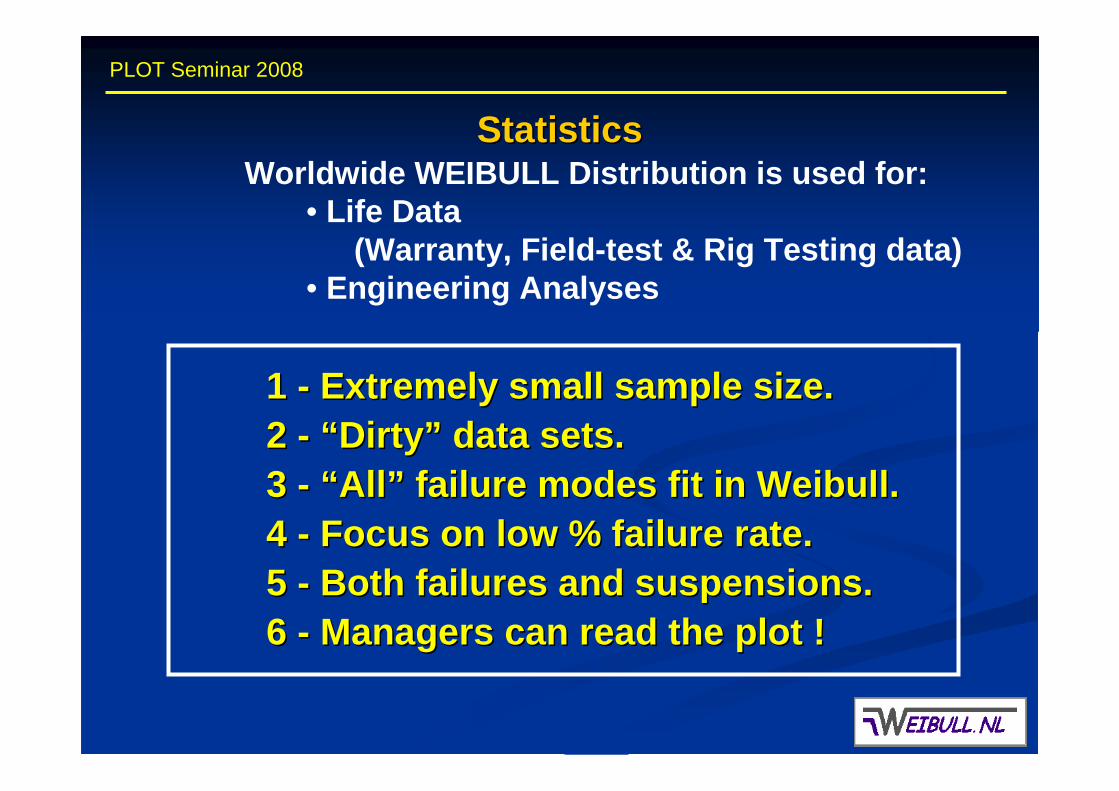
1 1 -- Extremely small sample size.Extremely small sample size.2 2 -- ““ DirtyDirty ”” data sets.data sets.3 3 -- ““ AllAll ”” failure modes fit in Weibull.failure modes fit in Weibull.4 4 -- Focus on low % failure rate. Focus on low % failure rate. 5 5 -- Both failures and suspensions.Both failures and suspensions.6 6 -- Managers can read the plot !Managers can read the plot !
Worldwide WEIBULL Distribution is used for:• Life Data
(Warranty, Field-test & Rig Testing data)• Engineering Analyses
StatisticsStatistics
8
PLOT Seminar 2008
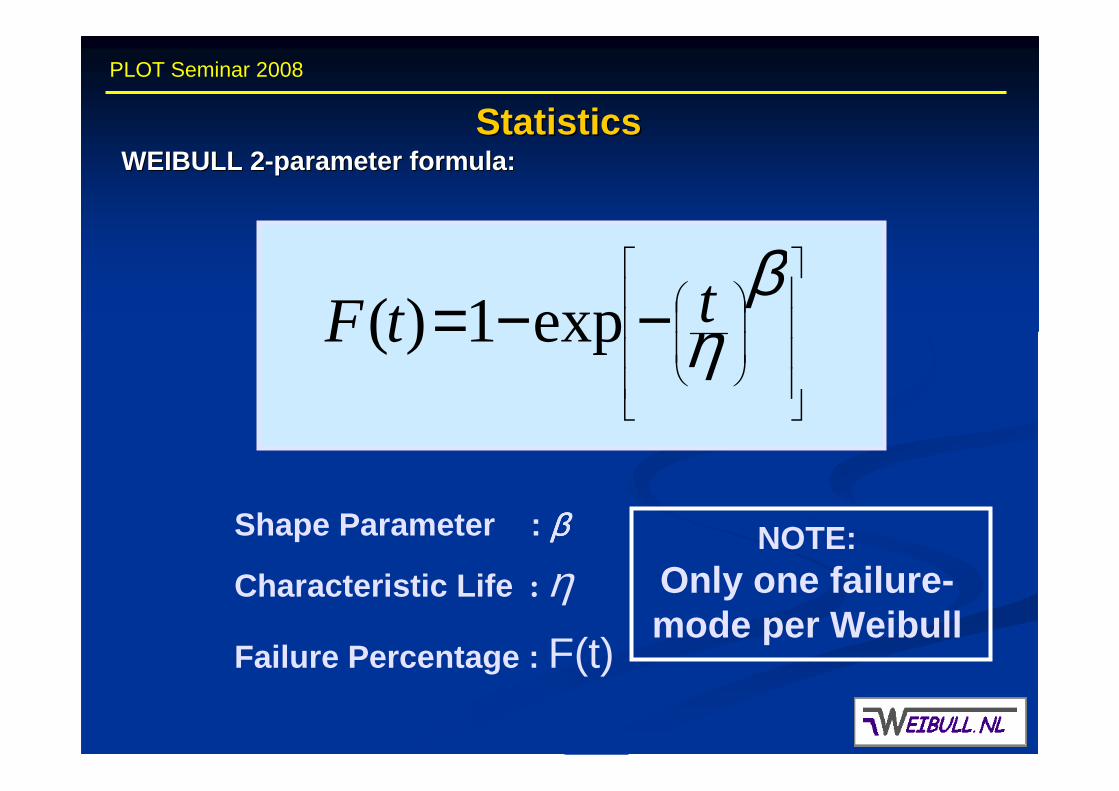
StatisticsStatisticsWEIBULL 2WEIBULL 2 --parameter formula:parameter formula:
Shape Parameter : ββββ
Characteristic Life : ηNOTE:
Only one failure-mode per Weibull
Failure Percentage : F(t)
−−=β
ηttF exp1)(

9
PLOT Seminar 2008
Cumulative %Failures (log-log)
Mileage / Time(Log scale)
CharacteristicLife
Correlation
SampleNumber
Weibull PlotWeibull Plot
ShapeParameter
RegressionLine
RegressionMethod

10
PLOT Seminar 2008
StatisticsStatistics

11
PLOT Seminar 2008
StatisticsStatistics
B(10) onWeibull plot

12
PLOT Seminar 2008
The WeibullThe Weibull
SHAPE Parameter: SHAPE Parameter: ββββββββ
Clues to Failure Clues to Failure -- ModesModes
η
ββββ = rise/runrun
rise

13
PLOT Seminar 2008
Interpreting the PlotInterpreting the PlotInfant Mortality Infant Mortality -- Beta < 1Beta < 1
Solid State ElectronicsSolid State ElectronicsBeta = .7 Beta = .7 --.8 ...good stress screening.8 ...good stress screeningBeta = .2 Beta = .2 --.3 ...bad stress screening.3 ...bad stress screening
Production Problems, quality control, misassemble, Production Problems, quality control, misassemble, ......
Overhaul ProblemsOverhaul ProblemsIncorrect Maintenance Changes Incorrect Maintenance Changes
Improves with age like WhiskyImproves with age like WhiskyOverhauling is dumb...inappropriateOverhauling is dumb...inappropriate ......

14
PLOT Seminar 2008
0
0,1
0,2
0,3
0,4
0,5
0 1 2 3 4 5 6 7 8 9 10 11 12 13 14 15
Beta = 0,5
Weibull DistributionWeibull Distribution
Infant MortalityInfant MortalityBeta < 1Beta < 1

15
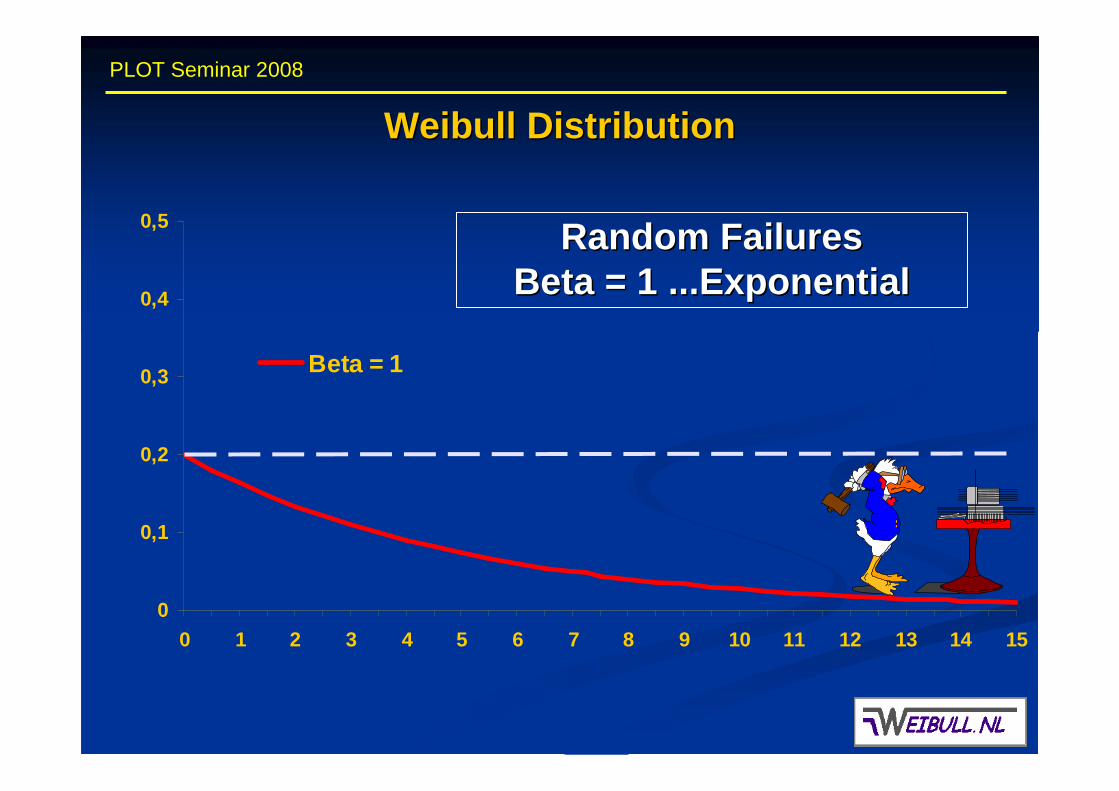
PLOT Seminar 2008
Random FailuresRandom FailuresBeta = 1.0 ...ExponentialBeta = 1.0 ...Exponential
Maintenance errors, human errorsMaintenance errors, human errorsRandom failures are independent of age. An old part is Random failures are independent of age. An old part is
as good as a new part. Ageless....as good as a new part. Ageless....
Mother Nature: lightning strikes, foreign object Mother Nature: lightning strikes, foreign object damage, woodpecker attacks on power polesdamage, woodpecker attacks on power poles
Mixtures of more than 3 failure modesMixtures of more than 3 failure modes(assuming different betas)(assuming different betas)
16
PLOT Seminar 2008
0
0,1
0,2
0,3
0,4
0,5
0 1 2 3 4 5 6 7 8 9 10 11 12 13 14 15
Beta = 1
Weibull DistributionWeibull Distribution
Random FailuresRandom FailuresBeta = 1 ...ExponentialBeta = 1 ...Exponential

17
PLOT Seminar 2008
Early WearoutEarly Wearout1.0 <Beta<4.01.0 <Beta<4.0
Most Mechanical Failure Modes...Most Mechanical Failure Modes...Low Cycle Fatigue, Bearing FailuresLow Cycle Fatigue, Bearing FailuresCorrosion, ErosionCorrosion, Erosion
Overhauls, parts replacement may be cost effective. Overhauls, parts replacement may be cost effective. Approximate replacement period may be read off Approximate replacement period may be read off plot. plot.
These are often Design Deficiencies.... ...Unpleasa nt These are often Design Deficiencies.... ...Unpleasa nt surprises.............surprises.............

18
PLOT Seminar 2008
0
0,1
0,2
0,3
0,4
0,5
0 1 2 3 4 5 6 7 8 9 10 11 12 13 14 15
Beta = 3,25
Weibull DistributionWeibull Distribution
Early WearoutEarly Wearout1.0 <Beta<4.01.0 <Beta<4.0

19
PLOT Seminar 2008
Old Age Rapid Old Age Rapid Wearout, Beta > 4.0Wearout, Beta > 4.0
Steep Betas within the Design Life cause great Steep Betas within the Design Life cause great concern, & panic... Panic because the entire fleet concern, & panic... Panic because the entire fleet will fail quickly as they age. will fail quickly as they age.
Beyond the Design Life, they are joy!Beyond the Design Life, they are joy!
Most steep Weibulls have a safe, benign period Most steep Weibulls have a safe, benign period within which the risk is very low. within which the risk is very low.
The steeper beta, the smaller the variation in the The steeper beta, the smaller the variation in the timestimes --toto --failure, and the more predictable the failure, and the more predictable the results. results.

20
PLOT Seminar 2008
Beta = 5
0
0,1
0,2
0,3
0,4
0,5
0 1 2 3 4 5 6 7 8 9 10 11 12 13 14 15
Weibull DistributionWeibull Distribution
Old Age Rapid WearoutOld Age Rapid WearoutBeta > 4.0Beta > 4.0
21
PLOT Seminar 2008
0
0,1
0,2
0,3
0,4
0,5
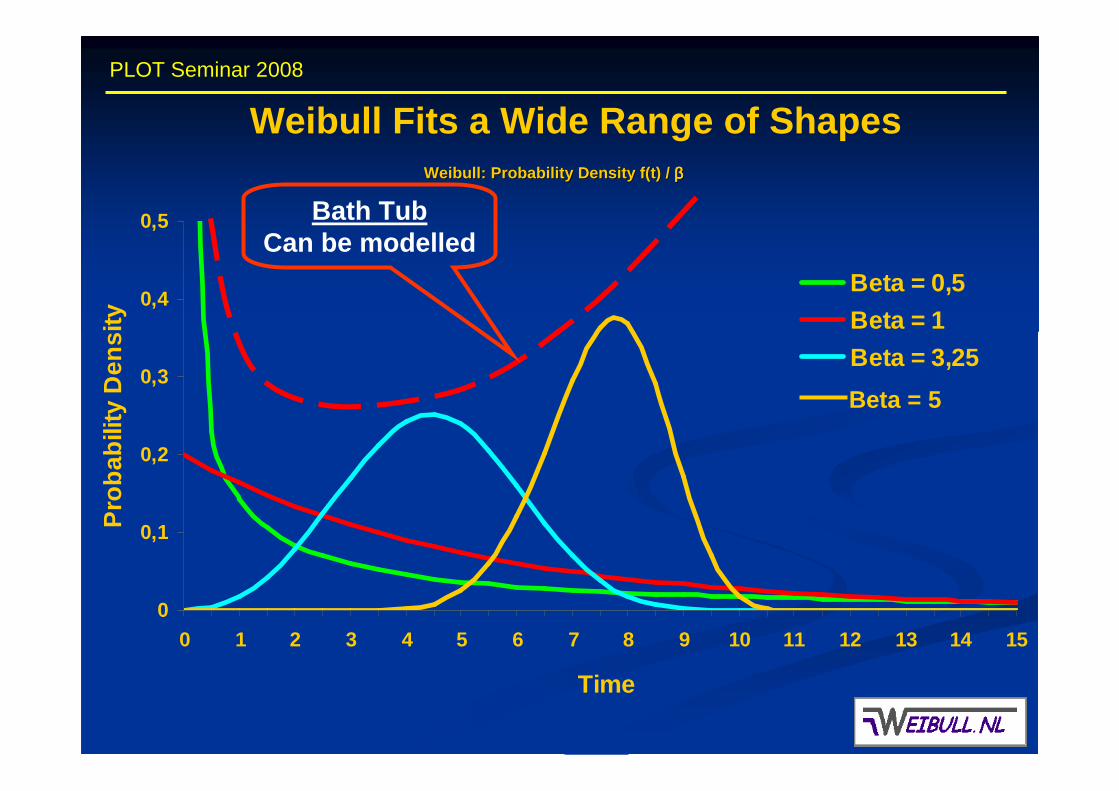
0 1 2 3 4 5 6 7 8 9 10 11 12 13 14 15
Time
Pro
babi
lity
Den
sity
Beta = 0,5
Beta = 1
Beta = 3,25
Beta = 5
Bath TubCan be modelled
Weibull Fits a Wide Range of ShapesWeibull: Probability Density f(t) / Weibull: Probability Density f(t) / ββββββββ

22
PLOT Seminar 2008
0 1 2 3 4 5 6 7 8 9 10
Fai
lure
s / S
yste
m
Design Life
InfantMortality
EarlyWear out
Random
Weibull Distributions for a Complex SystemWeibull Distributions for a Complex System
ββββ < 1 ββββ = 1 1 < ββββ < 4 ββββ > 4
Old ageRapid Wear out

23
PLOT Seminar 2008
CasesCases
1 1 –– Steering Link FailuresSteering Link Failures
2 2 –– Is the new Design better?Is the new Design better?
With Permission from Dr. R. B. Abernethy
24
PLOT Seminar 2008
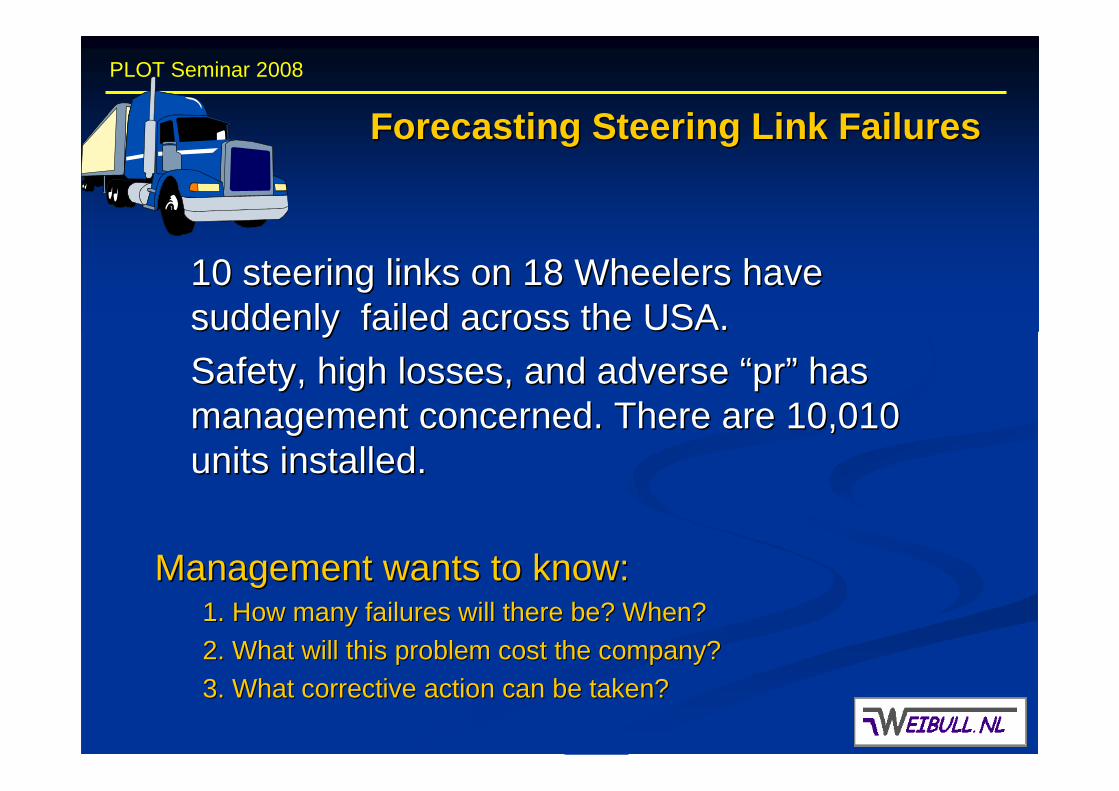
Forecasting Steering Link FailuresForecasting Steering Link Failures
10 steering links on 18 Wheelers have 10 steering links on 18 Wheelers have suddenly failed across the USA.suddenly failed across the USA.
Safety, high losses, and adverse Safety, high losses, and adverse ““prpr”” has has management concerned. There are 10,010 management concerned. There are 10,010 units installed.units installed.
Management wants to know:Management wants to know:1. How many failures will there be? When?1. How many failures will there be? When?
2. What will this problem cost the company?2. What will this problem cost the company?
3. What corrective action can be taken? 3. What corrective action can be taken?

25
PLOT Seminar 2008
With 10 failures the Weibull B1 life is 18,000 miles; this is unacceptable.

26
PLOT Seminar 2008
Next year we predict 576 failures with an upper 90% bound of Next year we predict 576 failures with an upper 90% bound of 872. The next failure is expected in six days.872. The next failure is expected in six days.
How many failures? When?How many failures? When?

27
PLOT Seminar 2008
2. What will this problem cost?2. What will this problem cost?First year loss is predicted to be just over a million dollars bFirst year loss is predicted to be just over a million dollars but ut
might be as high as $1.6M.might be as high as $1.6M.

28
PLOT Seminar 2008
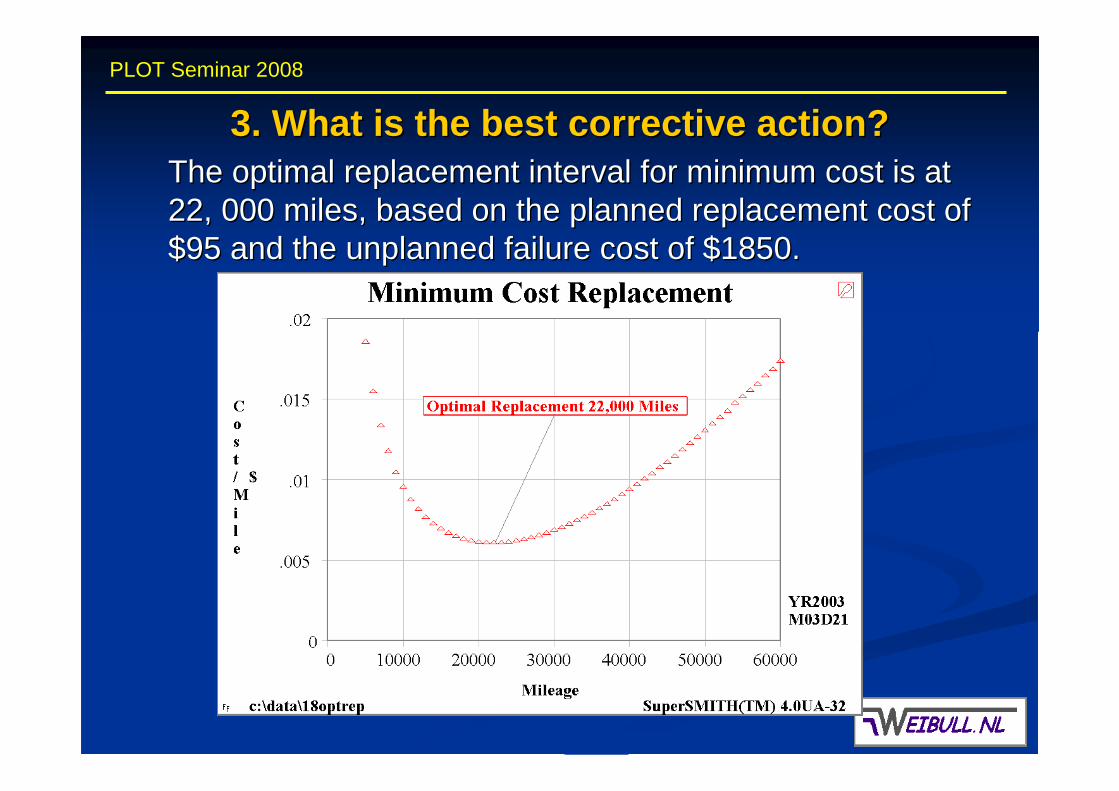
3. What is the best corrective action?3. What is the best corrective action?
Engineering says the root cause is the recent Engineering says the root cause is the recent addition of power steering kits overstressing the links. addition of power steering kits overstressing the links. It will take 2 years to redesign, test and produce It will take 2 years to redesign, test and produce 10,000 stronger links for retrofit. 10,000 stronger links for retrofit.
An immediate forced retrofit would be too painful and An immediate forced retrofit would be too painful and embarrassing as we do not have enough spare embarrassing as we do not have enough spare steering links to do it. Many trucks would be down for steering links to do it. Many trucks would be down for months.months.
Opportunistic maintenance may be the answer. Opportunistic maintenance may be the answer.
29
PLOT Seminar 2008
3. What is the best corrective action?3. What is the best corrective action?The optimal replacement interval for minimum cost is at The optimal replacement interval for minimum cost is at 22, 000 miles, based on the planned replacement cost of 22, 000 miles, based on the planned replacement cost of $95 and the unplanned failure cost of $1850.$95 and the unplanned failure cost of $1850.

30
PLOT Seminar 2008
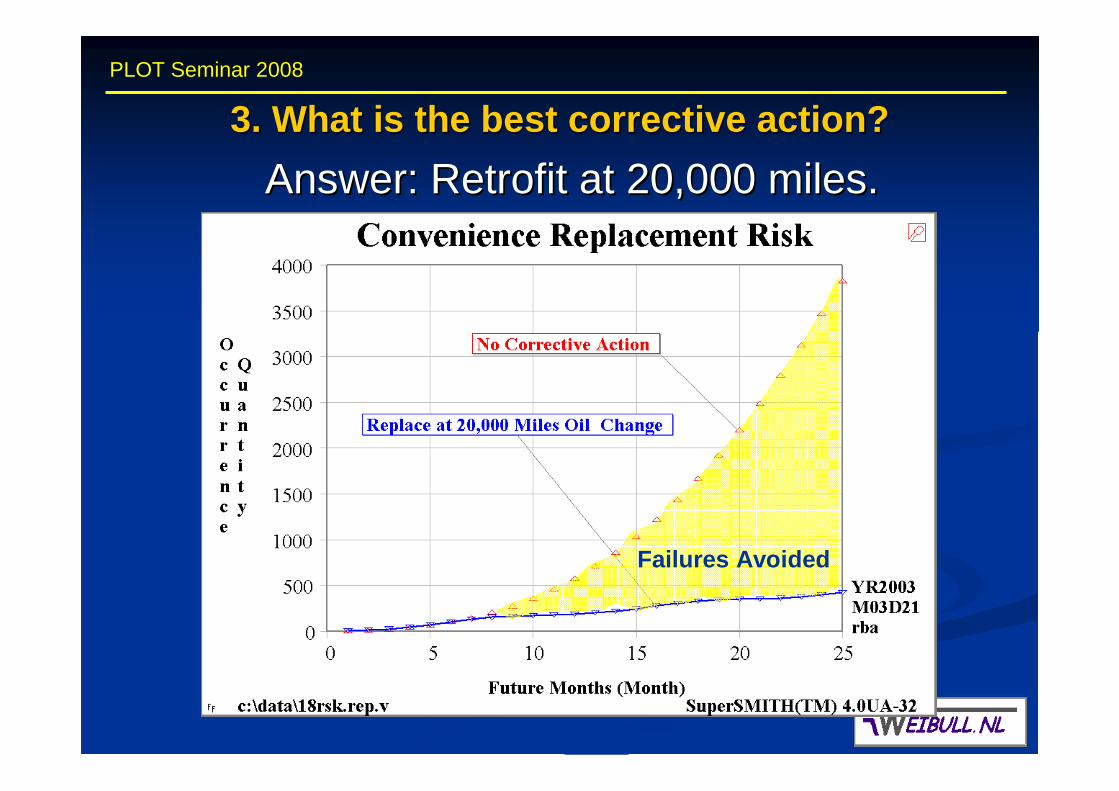
3. What is the best corrective action?3. What is the best corrective action?
2 Year Cost Analysis: 2 Year Cost Analysis:
No correction actionNo correction action = 3470 x $1850= $6.4M= 3470 x $1850= $6.4M
20K replace20K replace = 397 x $1850 +(10010 = 397 x $1850 +(10010 -- 397) x $95397) x $95= $1.6M= $1.6M …………..($4.8M Cost Avoidance)..($4.8M Cost Avoidance)
The sooner the new links are available the sooner the The sooner the new links are available the sooner the problem is fixed. 3 shift overtime is required.problem is fixed. 3 shift overtime is required.
A convenience retrofit at the 20,000 mile oil change would A convenience retrofit at the 20,000 mile oil change would be close to optimal, less painful for our customers, and it be close to optimal, less painful for our customers, and it would give us time to produce new links and solve the would give us time to produce new links and solve the problem. problem.
Risk Reduction: 12 months from 576 to 187 failures, Risk Reduction: 12 months from 576 to 187 failures, 24 months from 3470 to 397 failures.24 months from 3470 to 397 failures.
31
PLOT Seminar 2008
3. What is the best corrective action?3. What is the best corrective action?
Answer: Retrofit at 20,000 miles.Answer: Retrofit at 20,000 miles.
Failures Avoided

32
PLOT Seminar 2008
Engineering predicts that the links fail at low speed, Engineering predicts that the links fail at low speed, usually in reverse in a turn. So far this has been true. usually in reverse in a turn. So far this has been true. No one has been injured to date. Our liability No one has been injured to date. Our liability estimates are based on these assumed low cost estimates are based on these assumed low cost failures.failures.
If the assumption is wrong and the links fail at high If the assumption is wrong and the links fail at high speed, liabilities would be increased.speed, liabilities would be increased.
4. Liabilities?

33
PLOT Seminar 2008
Summary / ConclusionsSummary / Conclusions
Installation of the redesigned replacement links will end the Installation of the redesigned replacement links will end the problem. The redesign should be initiated with priority and 3 problem. The redesign should be initiated with priority and 3 shift overtime.shift overtime.
There is some indication that only one type of power steering There is some indication that only one type of power steering kit produces the failures. The power steering vendor should kit produces the failures. The power steering vendor should be contacted for a coordinated response to this problem. be contacted for a coordinated response to this problem.
This case study is based on actual data from two This case study is based on actual data from two manufacturers that experienced this problem, one with manufacturers that experienced this problem, one with trucks, one with cars. In both cases Weibull analysis trucks, one with cars. In both cases Weibull analysis provided accurate predictions and analysis for management provided accurate predictions and analysis for management action.action.

34
PLOT Seminar 2008
Case 2 Case 2 -- Is The New Design Better?Is The New Design Better?
Customers say our product is not Customers say our product is not ““perfect.perfect.”” It fails It fails rather often!rather often!
We have tested 8 of the new design and 8 of the We have tested 8 of the new design and 8 of the old units.old units.
Is the new design significantly better than the old Is the new design significantly better than the old design or are the differences just statistical design or are the differences just statistical noise, and the new product is no better?noise, and the new product is no better?
Here are the test results:Here are the test results:

35
PLOT Seminar 2008
Is There Real Improvement? Is There Real Improvement?

36
PLOT Seminar 2008
The Likelihood Ratio andThe Likelihood Ratio andContour Tests Provide the AnswerContour Tests Provide the Answer
The The Likelihood Ratio TestLikelihood Ratio Test says the New Design is not says the New Design is not significantly better at 90% but would be at a lower significantly better at 90% but would be at a lower confidence level. confidence level.
The The Likelihood Contour TestLikelihood Contour Test compliments the ratio test and compliments the ratio test and provides a picture, a plot, of the likelihood contours on the provides a picture, a plot, of the likelihood contours on the next slide. The contour test confirms the Likelihood Ratio next slide. The contour test confirms the Likelihood Ratio Tests results.Tests results.

37
PLOT Seminar 2008
Likelihood Contours Overlap Likelihood Contours Overlap

38
PLOT Seminar 2008
SummarySummary -- Is There Real Improvement?Is There Real Improvement?
We do not have enough data to show the new design is We do not have enough data to show the new design is better. More testing may prove it is significantly better.better. More testing may prove it is significantly better.
More then two sets may be compared with the likelihood More then two sets may be compared with the likelihood methods.methods.
There are many applications for this technology, comparing There are many applications for this technology, comparing vendor A with B, comparing different materials, different vendor A with B, comparing different materials, different environments as well as new design versus old design.environments as well as new design versus old design.
Statistical confidence is provided.Statistical confidence is provided.

39
PLOT Seminar 2008
SummarySummary
New Methods are developed for extensive analysis like:New Methods are developed for extensive analysis like:�� Batch Analysis.Batch Analysis.�� Failure forecasting.Failure forecasting.�� Optimal replacement point.Optimal replacement point.�� Test requirements; ZERO failures, Sudden Death, and more.Test requirements; ZERO failures, Sudden Death, and more.�� Combining different testCombining different test--lengths and sample seizes.lengths and sample seizes.�� Confidence intervals.Confidence intervals.�� CrowCrow--AMSAA System analysis (multiple modes).AMSAA System analysis (multiple modes).�� …… …… ……
Weibull distribution will fit Weibull distribution will fit ““allall”” failurefailure--modes.modes.
Simple plot managers can read and understand.Simple plot managers can read and understand.
Even with very little data analysis can be done.Even with very little data analysis can be done.
Focus on EngineeringFocus on Engineering’’s interesting area. (B1 s interesting area. (B1 –– B5)B5)

40
PLOT Seminar 2008
Handbooks and SoftwareHandbooks and Software
All methods presented, and much moreAll methods presented, and much more…… …… is documented inis documented in““The New Weibull HandbookThe New Weibull Handbook”” by Dr. Robert Abernethyby Dr. Robert AbernethyAll analysis are created with the WinSmithWeibull / Visual All analysis are created with the WinSmithWeibull / Visual SoftwareSoftware
Handbook + tutorial + Software is available as a Handbook + tutorial + Software is available as a selfself--study packet.study packet.PublicPublic Weibull Reliability Engineering Workshops are given in the Weibull Reliability Engineering Workshops are given in the
Netherlands (PATO) and the USA.Netherlands (PATO) and the USA.PrivatePrivate Workshops are delivered in the EU by Workshops are delivered in the EU by Weibull.nlWeibull.nl The The
workshop can be tailored to the customers needs, are less workshop can be tailored to the customers needs, are less expensive and are delivered on site.expensive and are delivered on site.
All workshops INCLUDE the Handbook and the Software plus full All workshops INCLUDE the Handbook and the Software plus full personal license for every student, and will make a novice to a personal license for every student, and will make a novice to a full Weibull Engineer.full Weibull Engineer.
Detailed info on Detailed info on www.weibull.nlwww.weibull.nl

41
PLOT Seminar 2008
Thank you for your attention
Ing. Ronald SchopIng. Ronald Schop
Weibull: Reliability EngineeringWeibull: Reliability Engineering
www.weibull.nlwww.weibull.nl