Presentación de PowerPoint - transportpublic.org · Evidències científiques de l’impacte dels...
35
Evidències científiques de l’impacte dels vehicles dièsel i gasolina en la qualitat de l’aire (i mesures sobre ells per millorar-la) Institut de Diagnosi Ambiental i Estudis de l’Aigua, IDAEA-CSIC Environmental Feochemistry & Atmospheric Research (EGAR) Xavier Querol
Transcript of Presentación de PowerPoint - transportpublic.org · Evidències científiques de l’impacte dels...
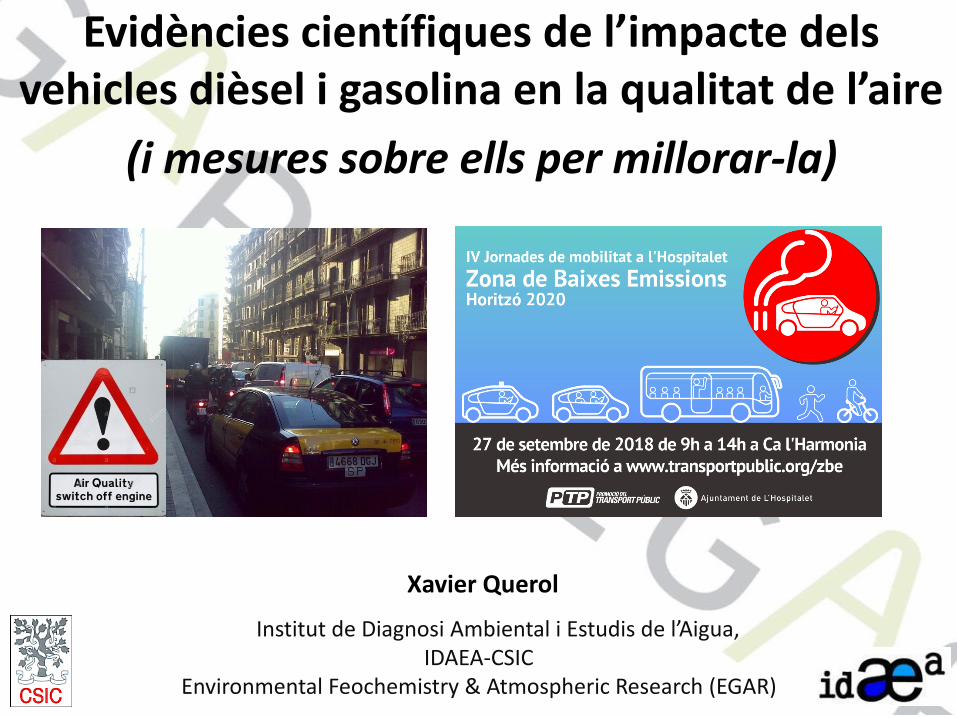
Evidències científiques de l’impacte dels vehicles dièsel i gasolina en la qualitat de l’aire
(i mesures sobre ells per millorar-la)
Institut de Diagnosi Ambiental i Estudis de l’Aigua, IDAEA-CSIC
Environmental Feochemistry & Atmospheric Research (EGAR)
Xavier Querol
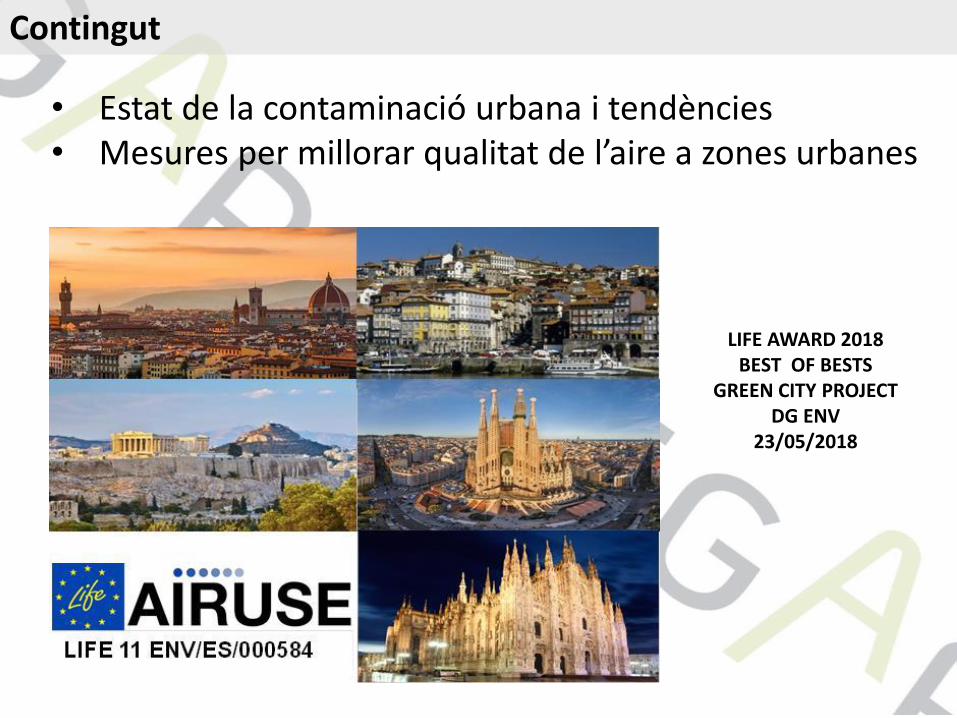
Contingut
• Estat de la contaminació urbana i tendències
• Mesures per millorar qualitat de l’aire a zones urbanes
LIFE AWARD 2018 BEST OF BESTS
GREEN CITY PROJECT DG ENV
23/05/2018

ACKNOWLEDGEMENTS
Spain : MAGRAMA, Generalitat Catalunya, Genralitat Valenciana, Barcelona, Madrid, València, L’Alcora City Councils, Italy: ARPA-Lombardia, Regione Lombardia, Regional Government of Tuscany, ARPA Toscana Portugal: Porto City Council, North Regional Coord. & DeveloP. Comm. (CCDR-N) Greece: Ministry of Environment, Energy and Climate Change

http://www.cleanaircities.net/es/
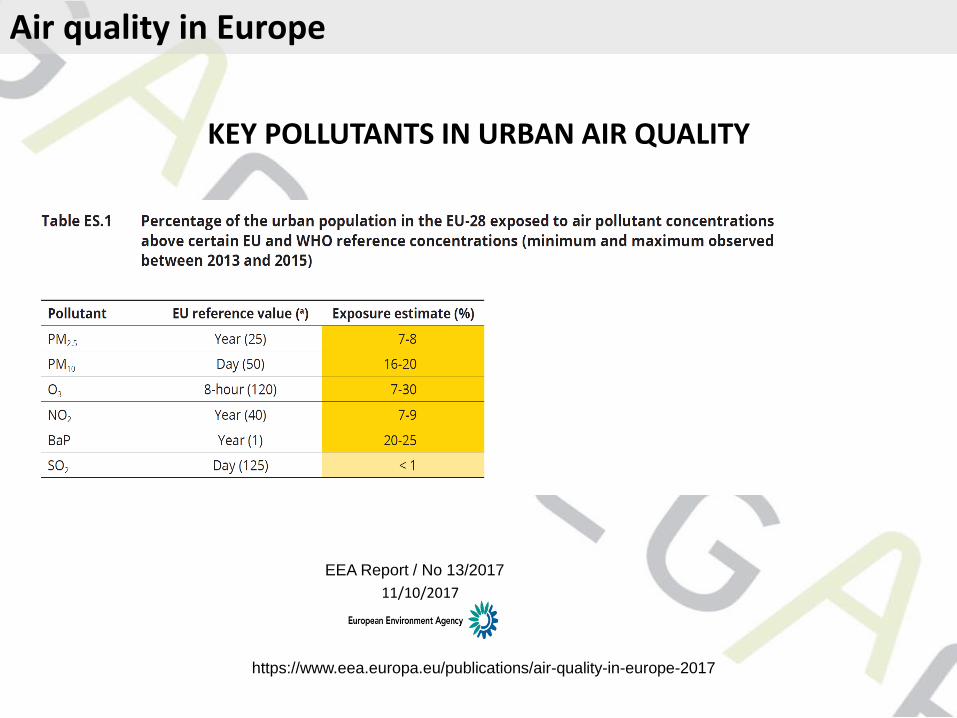
KEY POLLUTANTS IN URBAN AIR QUALITY
11/10/2017
EEA Report / No 13/2017
https://www.eea.europa.eu/publications/air-quality-in-europe-2017
Air quality in Europe

The problem of NO2
2015
0
25
50
75
100
Exceeding
EU annual -LV
NO2
EU-ALV=WHO-Guideline
µg/m
3
NO2
11/10/2017
EEA Report / No 13/2017
NO2 annual limit value
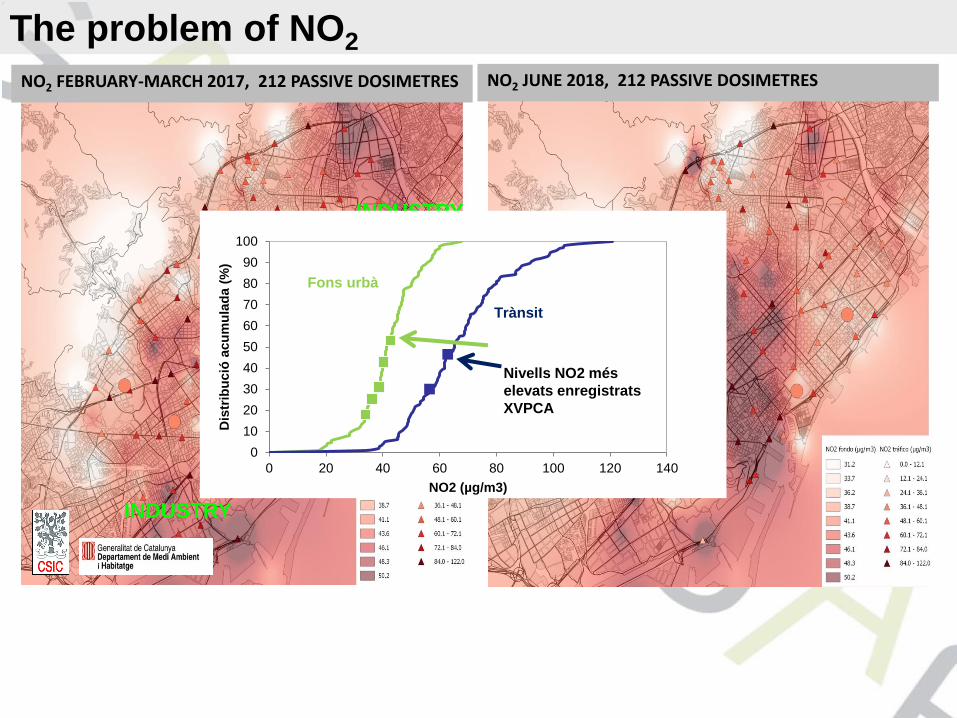
The problem of NO2
NO2 FEBRUARY-MARCH 2017, 212 PASSIVE DOSIMETRES NO2 JUNE 2018, 212 PASSIVE DOSIMETRES
INDUSTRY
INDUSTRY
0
10
20
30
40
50
60
70
80
90
100
0 20 40 60 80 100 120 140
Dis
trib
ució
acu
mu
lad
a (
%)
NO2 (µg/m3)
Fons urbà
Trànsit
Nivells NO2 més
elevats enregistrats
XVPCA
WHOGL
PM2.5
32/11/2016
http://www.eea.europa.eu/publications/air-quality-in-europe-2016
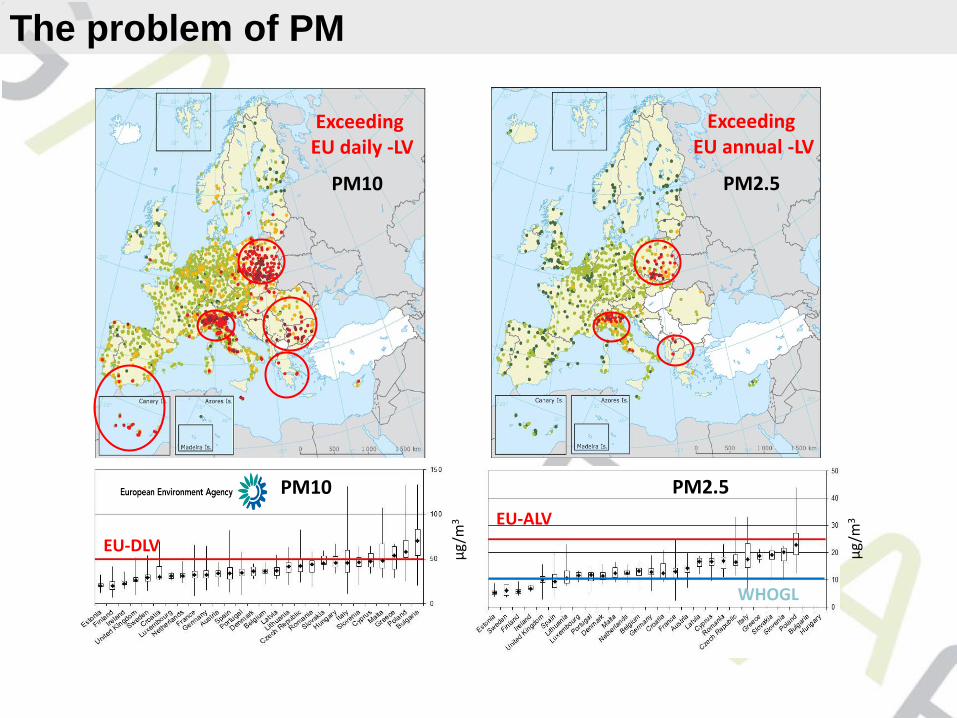
PM10
EU-ALV
EU-DLV
PM2.5 PM10
µg
/m3
µg
/m3
Exceeding EU annual -LV
Exceeding EU daily -LV
The problem of PM
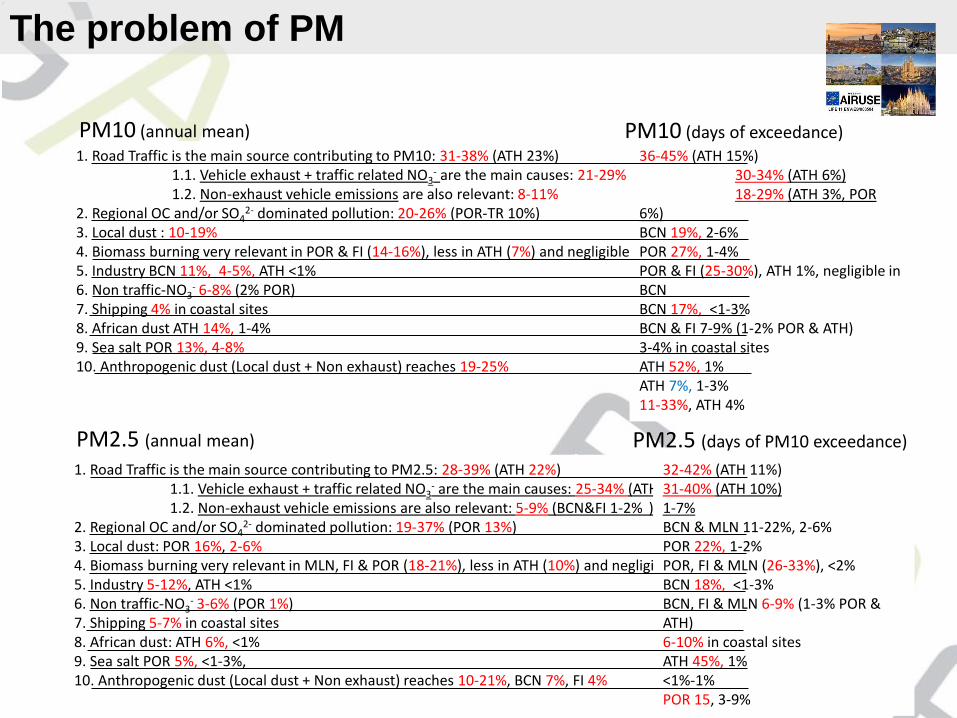
PM10 (annual mean)
1. Road Traffic is the main source contributing to PM10: 31-38% (ATH 23%) 1.1. Vehicle exhaust + traffic related NO3
- are the main causes: 21-29% (ATH 15%) 1.2. Non-exhaust vehicle emissions are also relevant: 8-11% 2. Regional OC and/or SO4
2- dominated pollution: 20-26% (POR-TR 10%) 3. Local dust : 10-19% 4. Biomass burning very relevant in POR & FI (14-16%), less in ATH (7%) and negligible in BCN 5. Industry BCN 11%, 4-5%, ATH <1% 6. Non traffic-NO3
- 6-8% (2% POR) 7. Shipping 4% in coastal sites 8. African dust ATH 14%, 1-4% 9. Sea salt POR 13%, 4-8% 10. Anthropogenic dust (Local dust + Non exhaust) reaches 19-25%
PM2.5 (annual mean)
1. Road Traffic is the main source contributing to PM2.5: 28-39% (ATH 22%) 1.1. Vehicle exhaust + traffic related NO3
- are the main causes: 25-34% (ATH 17%) 1.2. Non-exhaust vehicle emissions are also relevant: 5-9% (BCN&FI 1-2% ) 2. Regional OC and/or SO4
2- dominated pollution: 19-37% (POR 13%) 3. Local dust: POR 16%, 2-6% 4. Biomass burning very relevant in MLN, FI & POR (18-21%), less in ATH (10%) and negligible in BCN 5. Industry 5-12%, ATH <1% 6. Non traffic-NO3
- 3-6% (POR 1%) 7. Shipping 5-7% in coastal sites 8. African dust: ATH 6%, <1% 9. Sea salt POR 5%, <1-3%, 10. Anthropogenic dust (Local dust + Non exhaust) reaches 10-21%, BCN 7%, FI 4%
36-45% (ATH 15%) 30-34% (ATH 6%) 18-29% (ATH 3%, POR 6%) BCN 19%, 2-6% POR 27%, 1-4% POR & FI (25-30%), ATH 1%, negligible in BCN BCN 17%, <1-3% BCN & FI 7-9% (1-2% POR & ATH) 3-4% in coastal sites ATH 52%, 1% ATH 7%, 1-3% 11-33%, ATH 4%
PM10 (days of exceedance)
32-42% (ATH 11%) 31-40% (ATH 10%) 1-7% BCN & MLN 11-22%, 2-6% POR 22%, 1-2% POR, FI & MLN (26-33%), <2% BCN 18%, <1-3% BCN, FI & MLN 6-9% (1-3% POR & ATH) 6-10% in coastal sites ATH 45%, 1% <1%-1% POR 15, 3-9%
PM2.5 (days of PM10 exceedance)
The problem of PM

Euro4 (2005)
NOx mg/km
PM
mg
/km
Euro5 (2009)
Euro6 (2016)
Euro2 (1996)
Euro3 (2000)
Euro1 (1992)
(7) (8)
(10)
(10)
(36) (16) (NOx/PM rates for each specific Euro standard)
Euro standards for Diesel Passenger Cars NEDC test approval
(NOx+HC/PM rates for each specific Euro standard)
1
10
100
1000
0 200 400 600 800 1000 1200
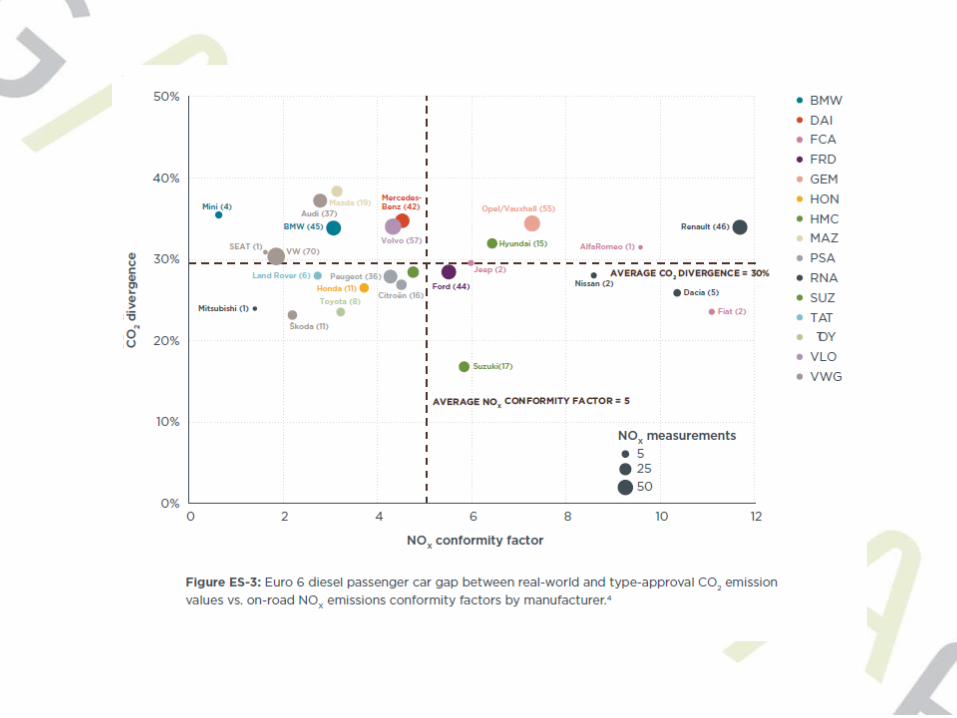
The problem of PM
Euro4 (2005)
Euro5 (2009) Euro6 (2016)
Real Word Driving emissions
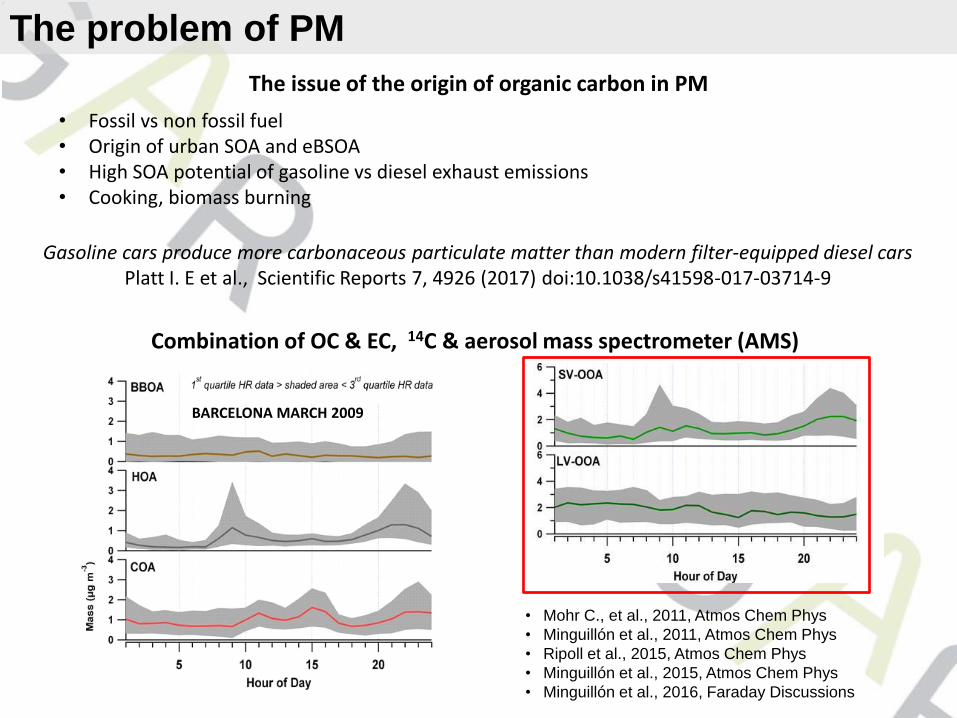
The issue of the origin of organic carbon in PM
• Fossil vs non fossil fuel • Origin of urban SOA and eBSOA • High SOA potential of gasoline vs diesel exhaust emissions • Cooking, biomass burning
Gasoline cars produce more carbonaceous particulate matter than modern filter-equipped diesel cars Platt I. E et al., Scientific Reports 7, 4926 (2017) doi:10.1038/s41598-017-03714-9
Combination of OC & EC, 14C & aerosol mass spectrometer (AMS)
• Mohr C., et al., 2011, Atmos Chem Phys
• Minguillón et al., 2011, Atmos Chem Phys
• Ripoll et al., 2015, Atmos Chem Phys
• Minguillón et al., 2015, Atmos Chem Phys
• Minguillón et al., 2016, Faraday Discussions
BARCELONA MARCH 2009
The problem of PM

The problem of PM
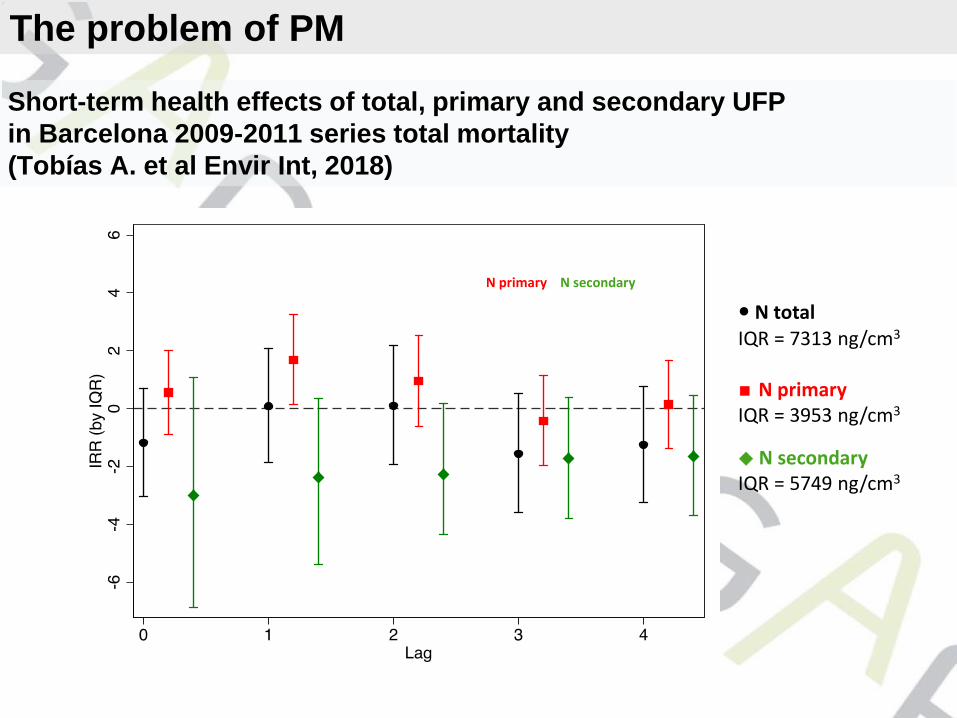
• N total IQR = 7313 ng/cm3 ◼ N primary IQR = 3953 ng/cm3
◆ N secondary IQR = 5749 ng/cm3
Short-term health effects of total, primary and secondary UFP
in Barcelona 2009-2011 series total mortality
(Tobías A. et al Envir Int, 2018)
N primary N secondary
The problem of PM
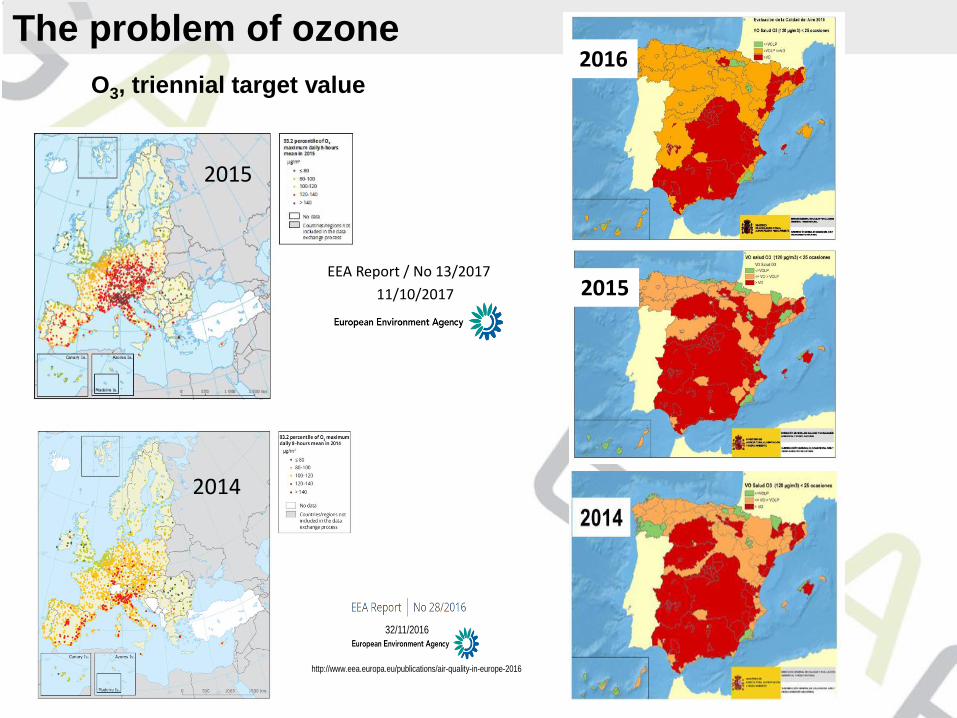
The problem of ozone
O3, triennial target value
2015
32/11/2016
http://www.eea.europa.eu/publications/air-quality-in-europe-2016
2014
2016
2015
11/10/2017
EEA Report / No 13/2017
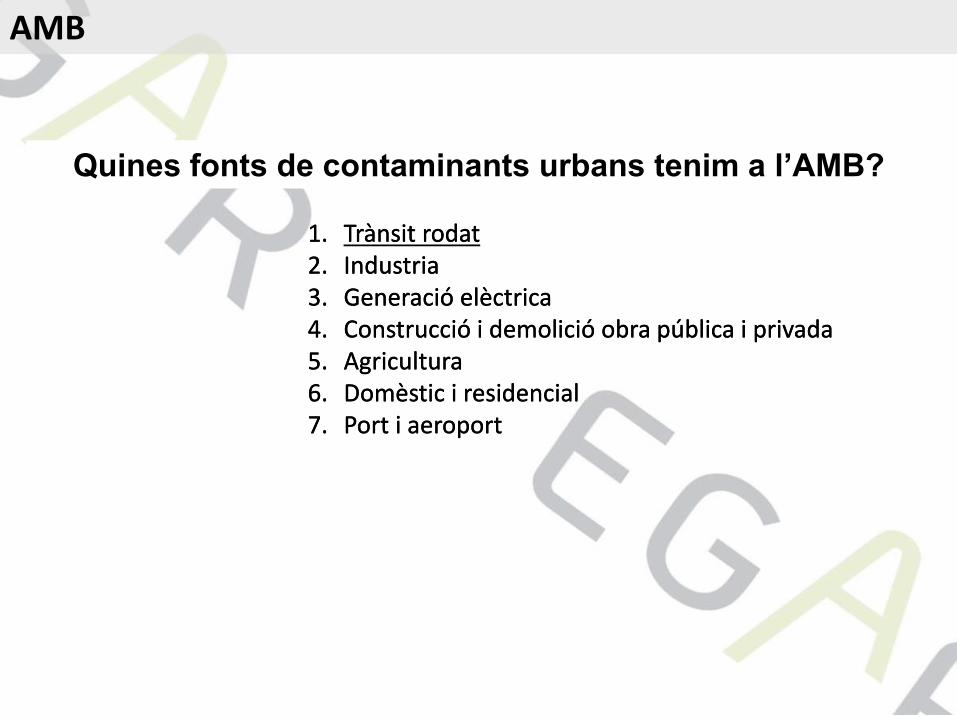
1. Trànsit rodat 2. Industria 3. Generació elèctrica 4. Construcció i demolició obra pública i privada 5. Agricultura 6. Domèstic i residencial 7. Port i aeroport
1. Trànsit rodat 2. Industria 3. Generació elèctrica 4. Construcció i demolició obra pública i privada 5. Agricultura 6. Domèstic i residencial 7. Port i aeroport
Quines fonts de contaminants urbans tenim a l’AMB?
AMB
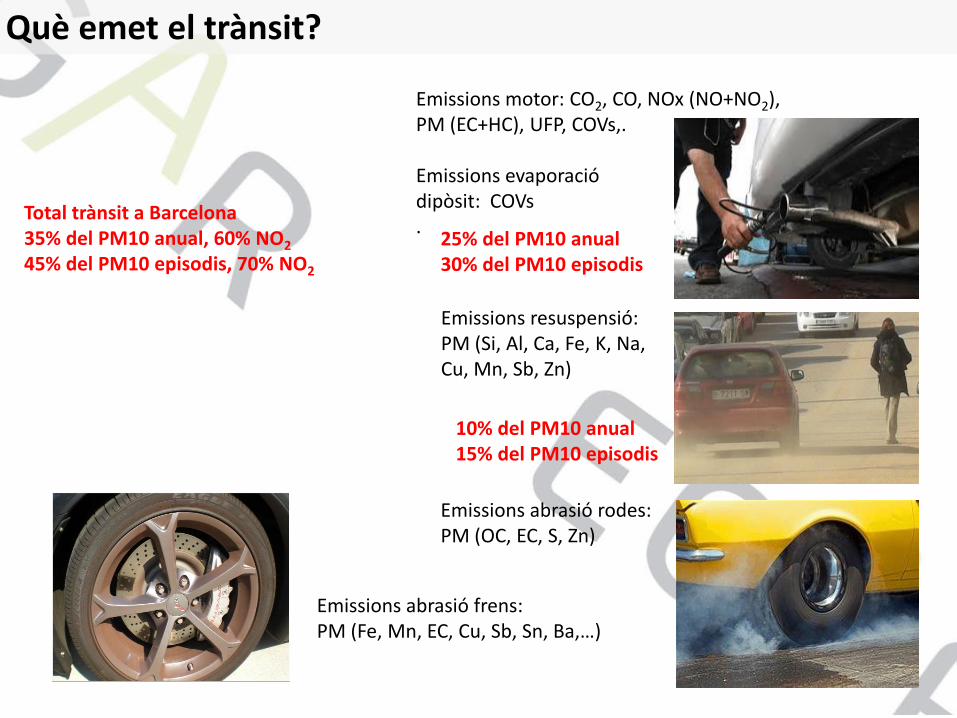
Emissions motor: CO2, CO, NOx (NO+NO2), PM (EC+HC), UFP, COVs,. Emissions evaporació dipòsit: COVs .
Emissions abrasió rodes: PM (OC, EC, S, Zn)
Emissions abrasió frens: PM (Fe, Mn, EC, Cu, Sb, Sn, Ba,…)
10% del PM10 anual 15% del PM10 episodis
25% del PM10 anual 30% del PM10 episodis
Total trànsit a Barcelona 35% del PM10 anual, 60% NO2
45% del PM10 episodis, 70% NO2
Emissions resuspensió: PM (Si, Al, Ca, Fe, K, Na, Cu, Mn, Sb, Zn)
Què emet el trànsit?

0. Els Plans de qualitat de l’aire cal fer-los a nivell metropolità més que municipal
Mesures sobre el trànsit rodat
ii. Mesures per reduir el nombre vehicles circulants
iii. Mesures dirigides a canviar flota de vehicles (ZBE, CAs, taxes,..)
v. Re-disseny urbà: verd/pacificació
i. Millora del transport pùblic
iv. Distribució urbana mercaderies i taxis
vi vii
vi. Mesures de remediació vii. Altres mesures no tecnològiques
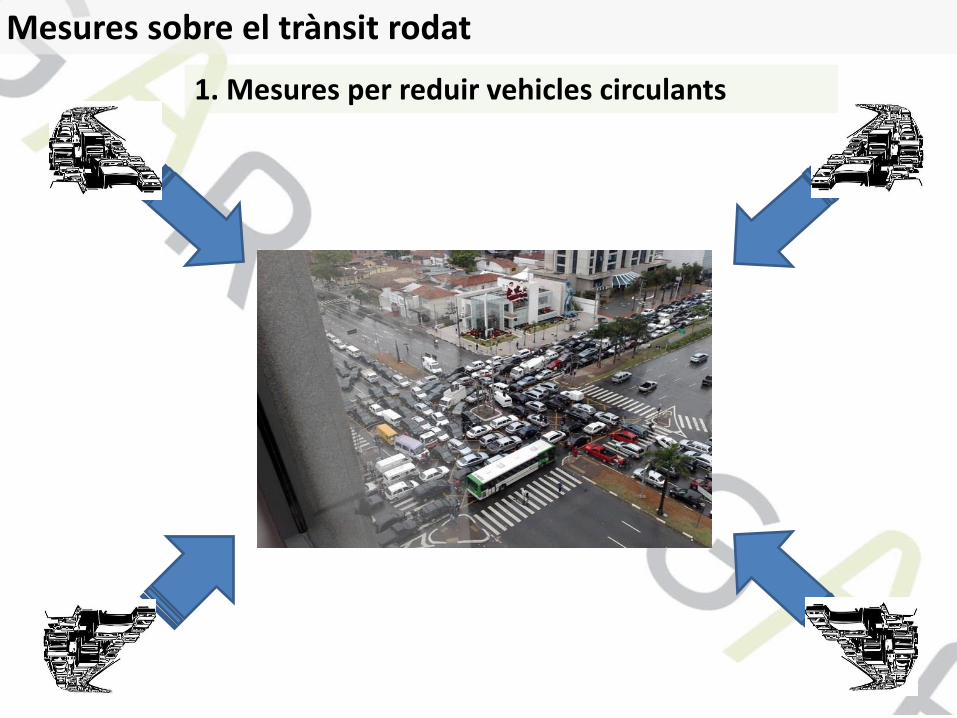
Mesures sobre el trànsit rodat
1. Mesures per reduir vehicles circulants

Mesures sobre el trànsit rodat

Mesures sobre el trànsit rodat
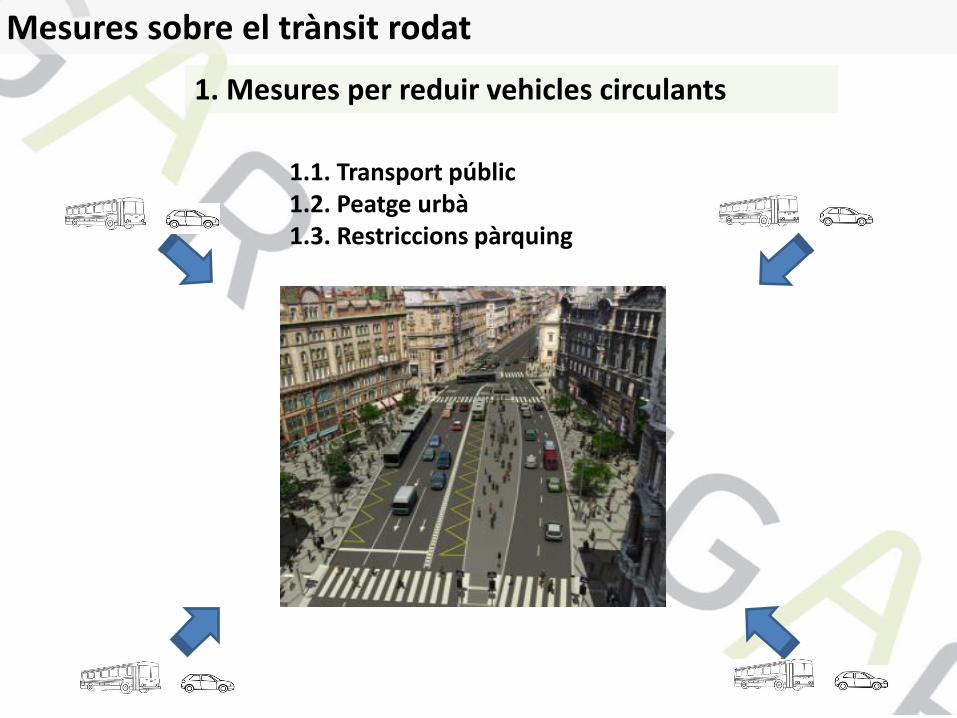
1.1. Transport públic 1.2. Peatge urbà 1.3. Restriccions pàrquing
Mesures sobre el trànsit rodat
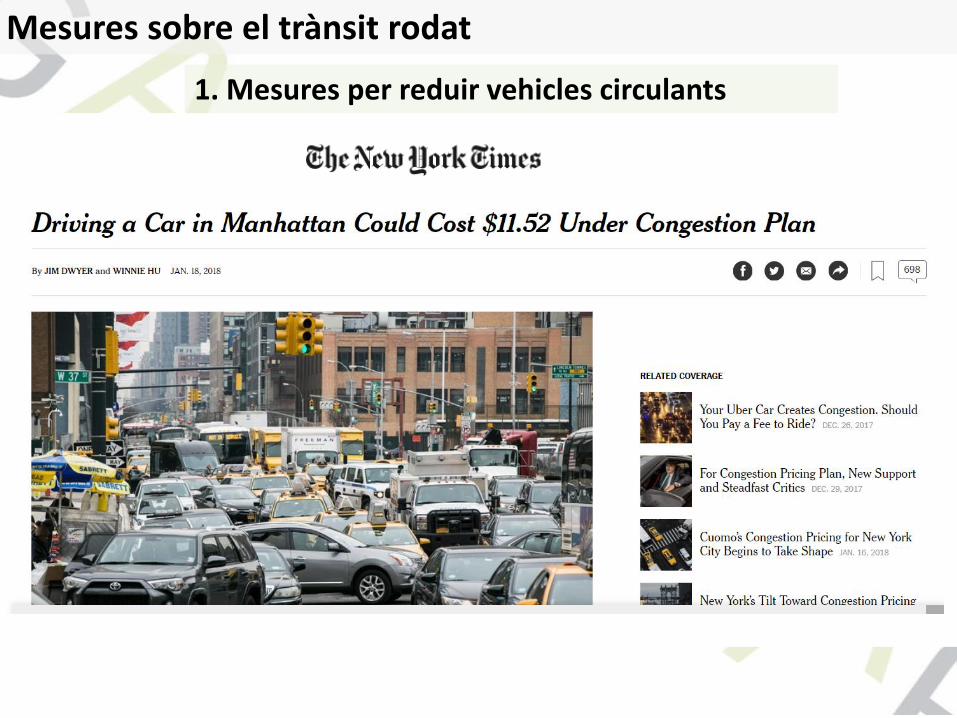
1. Mesures per reduir vehicles circulants
• 1 to 3.5 Euro for every passage • Max 11 Euro per day • Also foreign vehicles pay
>30 stations with APNR Courtesy of Christer Johansson
100 000 more inhabitants…
…but no increase in traffic
The Stockholm congestion tax
Mesures sobre el trànsit rodat
1. Mesures per reduir vehicles circulants
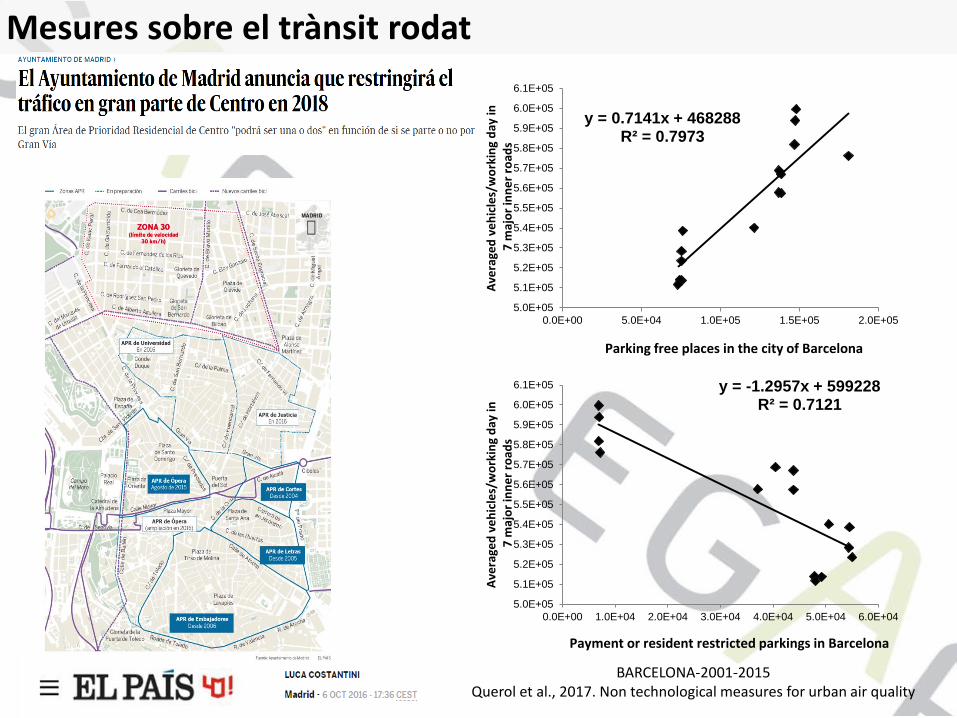
BARCELONA-2001-2015 Querol et al., 2017. Non technological measures for urban air quality
y = 0.7141x + 468288 R² = 0.7973
5.0E+05
5.1E+05
5.2E+05
5.3E+05
5.4E+05
5.5E+05
5.6E+05
5.7E+05
5.8E+05
5.9E+05
6.0E+05
6.1E+05
0.0E+00 5.0E+04 1.0E+05 1.5E+05 2.0E+05
Ave
rage
d v
eh
icle
s/w
ork
ing
day
in
7 m
ajo
r in
ne
r ro
ads
Parking free places in the city of Barcelona
y = -1.2957x + 599228 R² = 0.7121
5.0E+05
5.1E+05
5.2E+05
5.3E+05
5.4E+05
5.5E+05
5.6E+05
5.7E+05
5.8E+05
5.9E+05
6.0E+05
6.1E+05
0.0E+00 1.0E+04 2.0E+04 3.0E+04 4.0E+04 5.0E+04 6.0E+04
Ave
rage
d v
eh
icle
s/w
ork
ing
day
in
7 m
ajo
r in
ne
r ro
ads
Payment or resident restricted parkings in Barcelona
Mesures sobre el trànsit rodat
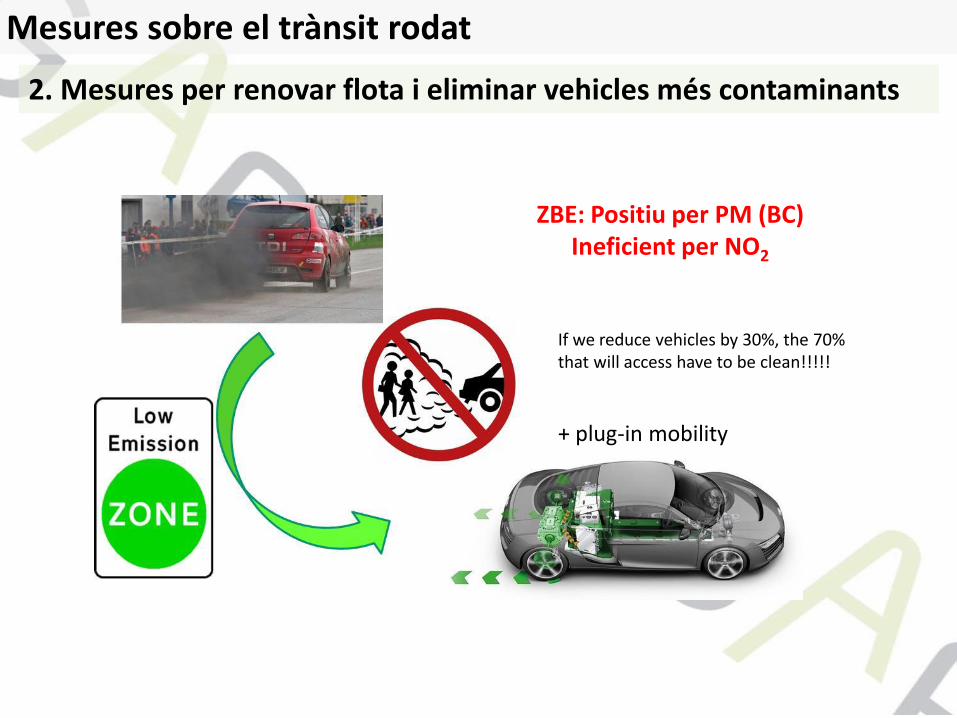
ZBE: Positiu per PM (BC) Ineficient per NO2
If we reduce vehicles by 30%, the 70% that will access have to be clean!!!!!
+ plug-in mobility
Mesures sobre el trànsit rodat
2. Mesures per renovar flota i eliminar vehicles més contaminants

LOW EMISSION ZONES 15 MEMBER STATES, 280 CITIES:
- DE, NL, UK, NO, SE, DK, CZ, AT, HU, IT AT (3)
Autopistes Tirol CZ (1) Praga
DE (50) Augsburg, Berlín, Bochum, Bonn, Bottrop, Bremen, Dinslaken, Dortmund, Duisburg,
Düsseldorf, Essen, Frankfurt, Friburg, Gelsenkirchen, Halle (Saale), Hannover, Heidelberg, Heilbronn, Herrenberg, Ilsfeld, Karlsruhe, Köln (Colonia), Krefeld,
Leipzig, Leonberg, Leonberg, Ludwigsburg, Magdeburg, Mannheim, Markgröningen, Mühlacker, Mühlheim, München, Münster, Neu-Ulm, Neuss, Oberhausen,
Osnabrück, Pfinztal, Pforzheim, Pleidelsheim, Pleidelsheim, Recklinghausen, Ratisbona, Reutlingen, Schwäbisch-Gmünd, Stuttgart, Tübingen, Ulm, Wuppertal
DK (5) Aalborg, Aarhus, Frederiksberg, Copenhague, Odense
GB (3) Londres, Oxford, Norwich
IT (42) Roma, Milán, Livorno, Pisa, Módena, Nápoles, Palermo, Parma, Pavía, Pisa, Regggio Emilia, Rimini, Torino, Trento, Varese, Verona, Lodi, Lucca, Montove, Mezzocorona,
Mondovi, Nichelino, Novara, Novi Ligure, Orbassano, Perugia, Piacenza, Prato, Ravenna......................
NL (13) Ámsterdam, Breda, Delft, La Haya, Eindhoven, Leiden, Maastrich, Rijswijk,
Rotterdam, Hertogenbosch, Schiedam, Tiburg, Utrech NO (3)
Oslo, Bergen, Trondheim, SE (6)
Estocolmo, Gotemburgo, Helsinburg, Lund, Malmo, Molndal FR
Paris: Testing in 2012 http://es.urbanaccessregulations.eu/
Congestion Charge
Other restrictions
LEZs
NOW: CLEAN AIR ZONES (CAZS) IN UK
• Must apply to ALL vehicle types • Strict in application • Also motor pets and motorbikes • Use real world driving criteria
Mesures sobre el trànsit rodat
2. Mesures per renovar flota i eliminar vehicles més contaminants
Compromís metropolità per la mobilitat neta
5
APLICACIONS DE LES MESURES 2020
ZUAP
ZBEM
ZBEU 2
3
Euro 4
Euro 5
TAULA D’EQUIVALÈNCIES DGT MEDIDAS DE TRÁFICO*
1
1 2 3
Circulen
No Circulen
*Proposta de classificació actual dels vehicles feta per la DGT. Permet diferenciar Euro 3 i 4, però no euro 4 i 5 afectant ala zona intrarondes .
1.2.3. Implantació de Zones de Baixes Emissions (ZBEM, ZBEU, ZUAP) a l’àrea metropolitana
Per a establir els tipus d’afectacions (ZBEM, ZBEU, ZUAP), s’ha tractat de seguir la proposta d’Etiquetatge Verd de la Generalitat de Catalunya i laproposta que està preparant la DGT a nivell de tot l’Estat Espanyol.
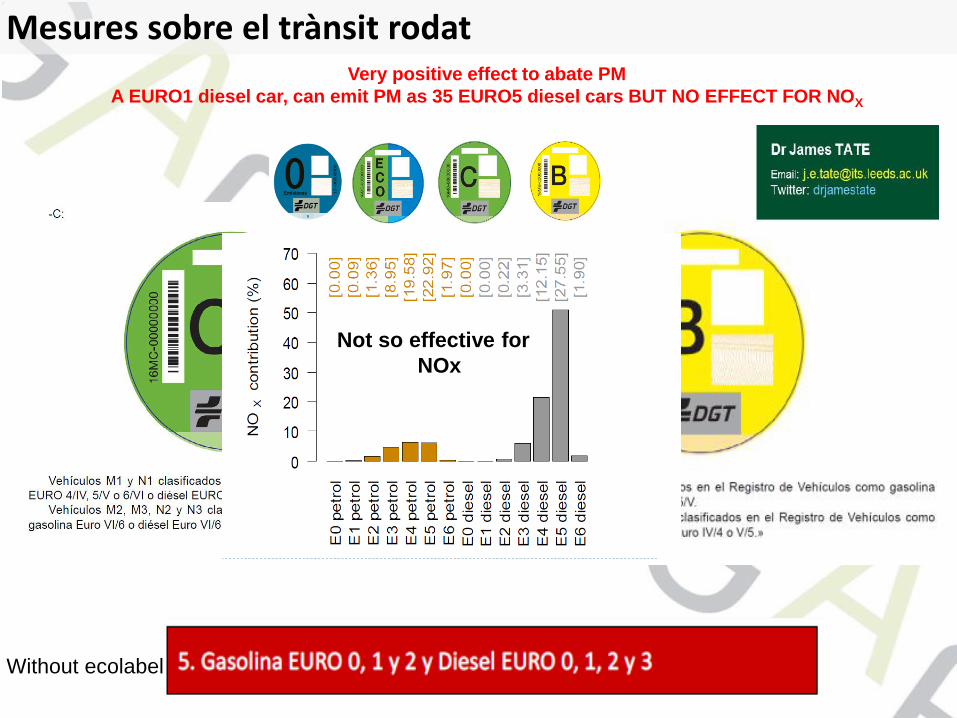
Without ecolabel
Very positive effect to abate PM
A EURO1 diesel car, can emit PM as 35 EURO5 diesel cars BUT NO EFFECT FOR NOX
Not so effective for
NOx
Mesures sobre el trànsit rodat

• Long term fiscal incentives from 1990s • Incentives added sequentially until the market
responded • The price difference between battery EV and
petrol car can be €1,000 • Exempt from
• vehicle registration tax • road tolls • VAT (normally 25%)
• Bus lane access • BEVs -reduced annual tax • Reduced rates on the main coastal ferries
• Començar per vehicles comercials amb molts km/day en ciutats • Motos
2016 with 5% of all passenger cars on Norwegian roads being a plug-in
Norway
VEHICLE ELÈCTRIC
Norwegian Road Federation (OFV) (January 2017). "Bilsalget i 2016" [Car sales in 2016]
19% of market share in 2016
Mesures sobre el trànsit rodat
2. Mesures per renovar flota i eliminar vehicles més contaminants

Mesures sobre el trànsit rodat
3. Distribució urbana de mercaderies
• Electrificació i hibridació preferent , 1 vehicle DUM = 12 cotxes privats a causa de kmtratge
• Restriccions de 7 a 11 hores (meteo desfavorable i densitat de trànsit) • Logística intel·ligent (nocturna, micro-plataformes logístiques...) • Normes estrictes i compliment de normativa volum mínim disponible per a
l'emmagatzematge de mercaderies • Evitar la circulació de taxis vuits
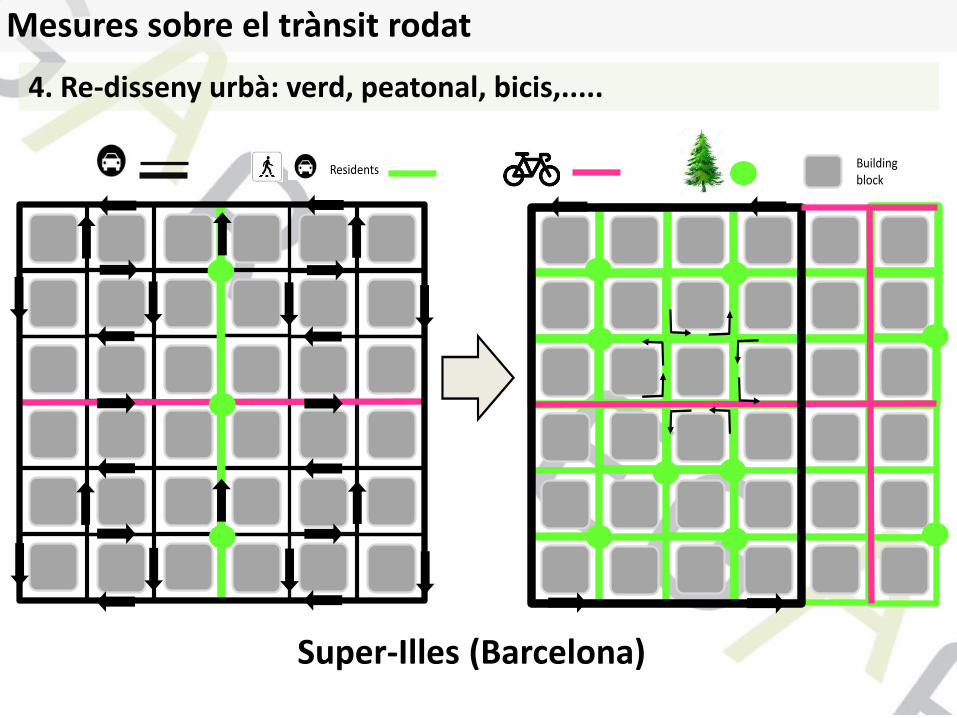
Residents Buildingblock
Super-Illes (Barcelona)
Mesures sobre el trànsit rodat
4. Re-disseny urbà: verd, peatonal, bicis,.....

p
bc
1.0
1.5
2.0
2.5
0 20 40 60
r
bc
1.0
1.5
2.0
2.5
10 20 30 40
A main contribution of road traffic emissions on indoor and outdoor Elemental Black
Carbon (EBC) levels was evidenced
High correlation between average EBC levels at different districts of the city of Barcelona and the percentage of surface area used for the road network
R2=0.61 R2=0.32
EBC
(µ
gm-3
)
Percentage of area used for the road network
Percentage of area used for parks
Parallelism between mean indoor and outdoor daily cycles. Peaks of exposure inside the classrooms determined by outdoor concentrations
0
500
1000
1500
2000
2500
3000
0 2 4 6 8 10 12 14 16 18 20 22
EBC
(µ
gm-3
)
Hour (lLocal Time)
Outdoor-Schools Indoor-Schools
Start of
school
hours
End of
school
hours
In & outdoor
Reche et al., 2015. Real-time indoor and outdoor measurements of black carbon at primary schools. Atmos. Environ. Under review.
Mesures sobre el trànsit rodat
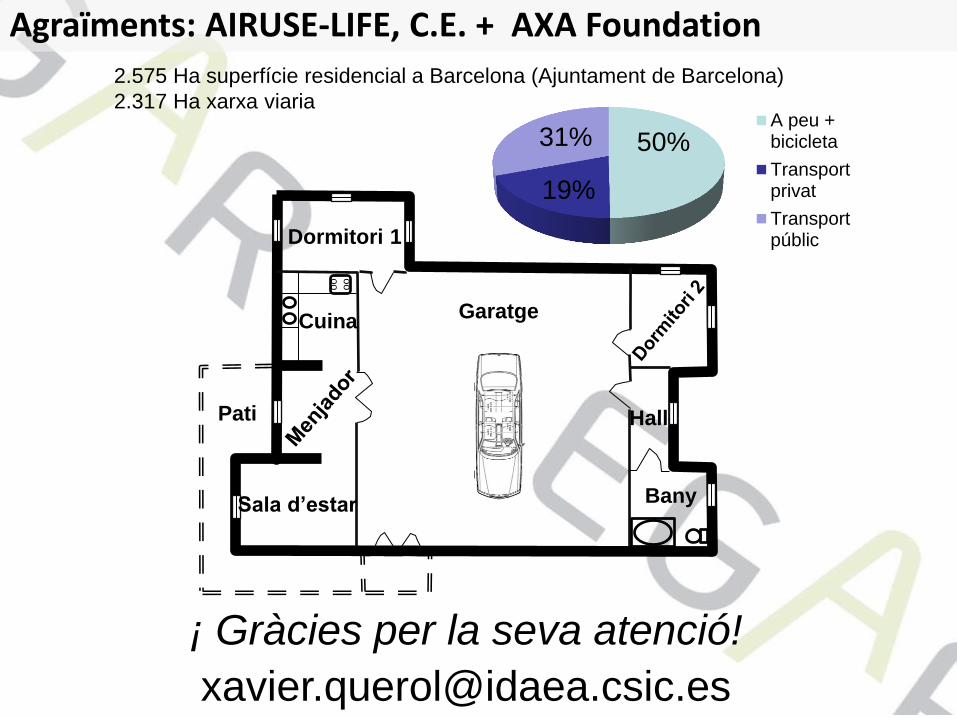
¡ Gràcies per la seva atenció!
Agraïments: AIRUSE-LIFE, C.E. + AXA Foundation 2.575 Ha superfície residencial a Barcelona (Ajuntament de Barcelona)
2.317 Ha xarxa viaria
50%
19%
31% A peu +bicicleta
Transportprivat
Transportpúblic
oo
oo
Pati
Cuina
Sala d’estar
Dormitori 1
Bany
Hall
Garatge

EU & WHO standards
2008/50/EC WHO (2006) guidelines RD 102/2011 Hourly 350 µg/m3 SO2 -- 24 times per year Daily 125 µg/m3 SO2 20 µg/m3 SO2 3 times per year Hourly 200 µg/m3 NO2 EC-WHO coincide 18 times per year Annual 40 µg/m3 NO2 EC-WHO coincide not exceeding Annual 5 µg/m3 C6H6 EC-WHO coincide not exceeding Mean 8-h max. in a day 10 mg/m3 CO EC-WHO coincide not exceeding Annual 500 ng/m3 Pb EC-WHO coincide not exceeding Annual 40 µg/m3 PM10 20 µg/m3 PM10 not exceeding Annual 25 µg/m3 PM2.5 10 µg/m3 PM2.5 not exceeding Max 8 h means of a day 120 µg/m3 O3 100 µg/m3 O3 not exceeding 25 day/year mean for 3 years BaP annual 1 ng/m3 BaP 0.12 ng/m3 BaP not exceeding
Critical pollutants
Air quality in Europe

Ámsterdam
Madrid
Barcelona
500m
El Problema de NO2
Napoli
Why so high NO2?
The problem of NO2

17
16
15
19
18
13
13
14
100 119
120 149
150 179
180 199
200 215
13
30/07-02/08/2018
15
20
16
15
11
17
14
14
14
04-05/08/2018 numbers indicate
time (LT) of maxima
Hourly maxima of O3
(µg/m3)
15
15
15
12
12
12
12
11
12
06/08/2018
The problem of ozone
0
10
20
30
40
50
60
2000 2001 2002 2003 2004 2005 2006 2007 2008 2009 2010 2011 2012 2013 2014 2015
MAD NBCN TAR
0
5
10
15
20
25
30
2000 2001 2002 2003 2004 2005 2006 2007 2008 2009 2010 2011 2012 2013 2014 2015
PUE HSJ
0
1
2
3
4
5
2000 2001 2002 2003 2004 2005 2006 2007 2008 2009 2010 2011 2012 2013 2014 2015
VA-A CS
Exceedances of the h-information threshold
180 µg/m3 O3/air quality site
0
10
20
30
40
50
60
2000 2001 2002 2003 2004 2005 2006 2007 2008 2009 2010 2011 2012 2013 2014 2015
MAD NBCN TAR
0
5
10
15
20
25
30
2000 2001 2002 2003 2004 2005 2006 2007 2008 2009 2010 2011 2012 2013 2014 2015
PUE HSJ
0
1
2
3
4
5
2000 2001 2002 2003 2004 2005 2006 2007 2008 2009 2010 2011 2012 2013 2014 2015
VA-A CS