
PEMEX Outlook 110719 ri Archivos/20… · July 2011. Variations If no further specification is...
38
Pemex Outlook July 2011
Transcript of PEMEX Outlook 110719 ri Archivos/20… · July 2011. Variations If no further specification is...
Pemex OutlookJuly 2011
VariationsIf no further specification is included, changes are made against the same period of the last year.
RoundingNumbers may not total due to rounding.
Financial InformationExcluding (i) budgetary ,(ii) volumetric, (iii) revenue from sales and services including IEPS, (iv) domestic sales including IEPS, (v) petroleum products sales including IEPS, and (vi) operating income including IEPS information, the financial information included in this report is based on unaudited consolidated financial statements prepared in accordance with Normas de Informacion Financiera (Mexican Financial Reporting Standards, FRS) -formerly Mexican GAAP- issued by the Consejo Mexicano para la Investigación y Desarrollo de Normas de Información Financiera (CINIF).
• Based on FRS B-10 "Inflation effects", 2010 and 2011 amounts are expressed in nominal terms.• Based on FRS B-3 "Income Statement” and FRS “C-10” Derivative Financial Instruments and Hedging Transactions”, the financial
income and cost of the Comprehensive Financial Result include the effect of financial derivatives.• The EBITDA is a non-U.S. GAAP and non-FRS measure issued by CINIF.
Budgetary information is based on standards from Mexican governmental accounting; therefore, it does not include information from the subsidiary companies of Petróleos Mexicanos.
Foreign Exchange ConversionsConvenience translations into U.S. dollars of amounts in Mexican pesos have been made at the established exchange rate, at March 31, 2011, of Ps. 11.9678 = U.S.$1.00. Such translations should not be construed as a representation that the peso amounts have been or could be converted into U.S. dollars at the foregoing or any other rate.
Forward-Looking Statement and Cautionary Note (1/3)
2
Fiscal RegimeSince January 1, 2006, PEMEX has been subject to a new fiscal regime. Pemex-Exploration and Production’s (PEP) tax regime is governed by the Federal Duties Law, while the tax regimes of the other Subsidiary Entities continue to be governed by Mexico’s Income Tax Law. The most important duty paid by PEP is the Ordinary Hydrocarbons Duty (OHD), the tax base of which is a quasi operating profit. In addition to the payment of the OHD, PEP is required to pay other duties.
Under PEMEX’s current fiscal regime, the Special Tax on Production and Services (IEPS) applicable to gasoline and diesel is regulated under the Federal Income Law. PEMEX is an intermediary between the Secretary of Finance and Public Credit (SHCP) and the final consumer; PEMEX retains the amount of IEPS and transfers it to the Federal Government. The IEPS rate is calculated as the difference between the retail or “final price”, and the “producer price”. The final prices of gasoline and diesel are established by the SHCP. PEMEX’s producer price is calculated in reference to that of an efficient refinery operating in the Gulf of Mexico. Since 2006, if the final price is lower than the producer price, the SHCP credits to PEMEX the difference among them. The IEPS credit amount is accrued, whereas the information generally presented by the SHCP is cash-flow.
Hydrocarbon ReservesPursuant to Article 10 of the Regulatory Law to Article 27 of the Political Constitution of the United Mexican States Concerning Petroleum Affairs, (i) PEMEX's reports evaluating hydrocarbon reserves shall be approved by the National Hydrocarbons Commission (NHC); and (ii) the Secretary of Energy will register and disclose Mexico's hydrocarbon reserves based on information provided by the NHC. As of the date of this report, this process is ongoing.
As of January 1, 2010, the SEC changed its rules to permit oil and gas companies, in their filings with the SEC, to disclose not only proved reserves, but also probable reserves and possible reserves. In addition, we do not necessarily mean that the probable or possible reserves described herein meet the recoverability thresholds established by the SEC in its new definitions. Investors are urged to consider closely the disclosure in our Form 20-F and our annual report to the Mexican Banking and Securities Commission, available at http://www.pemex.com/.
Forward-Looking Statement and Cautionary Note(2/3)
3
BidsOnly results from bids occurred between January 1 and March 31, 2011 are included. For further information, please access www.compranet.gob.mx.
Forward-looking StatementsThis report contains forward-looking statements. We may also make written or oral forward-looking statements in our periodic reports to the CNBV and the SEC, in our annual reports, in our offering circulars and prospectuses, in press releases and other written materials and in oral statements made by our officers, directors or employees to third parties. We may include forward-looking statements that address, among other things, our:
• drilling and other exploration activities;• import and export activities;• projected and targeted capital expenditures; costs; commitments; revenues; liquidity, etc.
Actual results could differ materially from those projected in such forward-looking statements as a result of various factors that may be beyond our control. These factors include, but are not limited to:
• changes in international crude oil and natural gas prices;• effects on us from competition;• limitations on our access to sources of financing on competitive terms;• significant economic or political developments in Mexico;• developments affecting the energy sector; and• changes in our regulatory environment.
Accordingly, you should not place undue reliance on these forward-looking statements. In any event, these statements speak only as of their dates, and we undertake no obligation to update or revise any of them, whether as a result of new information, future events or otherwise. These risks and uncertainties are more fully detailed in PEMEX’s most recent Form 20-F filing with the SEC (www.sec.gov), and the PEMEX prospectus filed with the CNBV and available through the Mexican Stock Exchange (www.bmv.com.mx). These factors could cause actual results to differ materially from those contained in any forward-looking statement.
PEMEXPEMEX is Mexico’s national oil and gas company. Created in 1938, it is the exclusive producer of Mexico’s oil and gas resources. The operating subsidiary entities are Pemex-Exploration and Production, Pemex-Refining, Pemex-Gas and Basic Petrochemicals and Pemex-Petrochemicals. The principal subsidiary company is PMI.
Forward-Looking Statement and Cautionary Note(3/3)
4
Content
PEMEX’s Strategy
Hydrocarbon Reserves
Production
Downstream
Financial Highlights
Key Investment Considerations
5
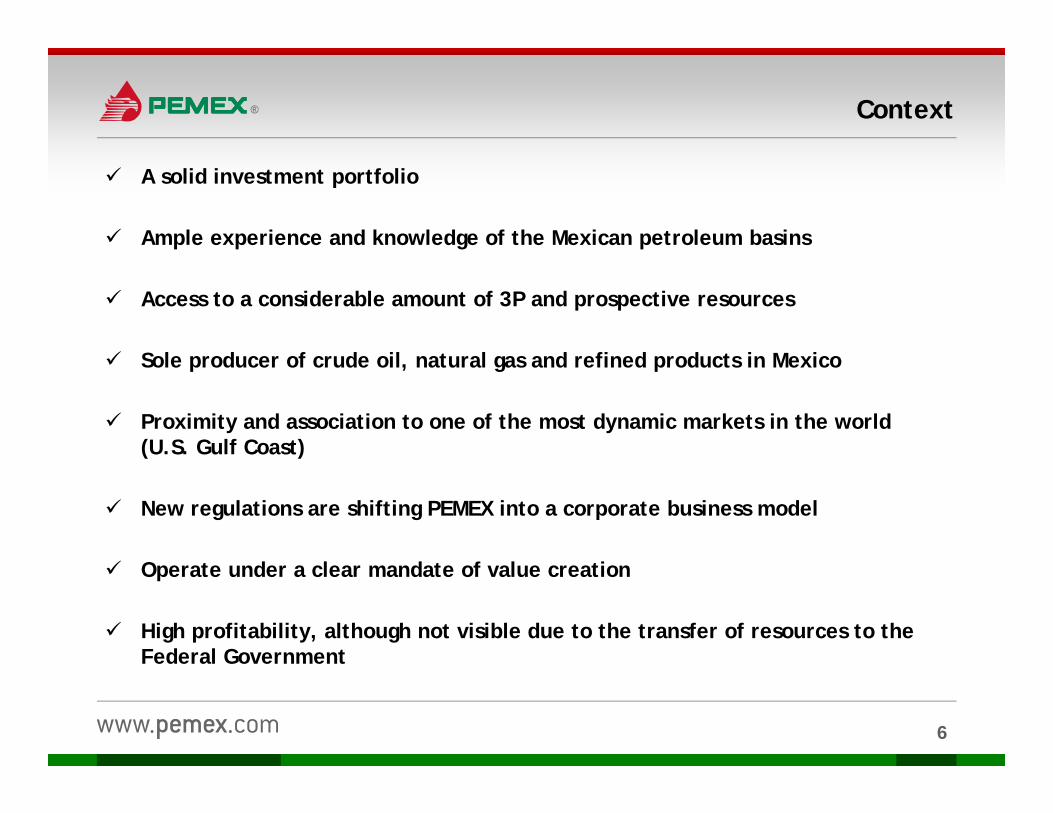
Context
A solid investment portfolio
Ample experience and knowledge of the Mexican petroleum basins
Access to a considerable amount of 3P and prospective resources
Sole producer of crude oil, natural gas and refined products in Mexico
Proximity and association to one of the most dynamic markets in the world (U.S. Gulf Coast)
New regulations are shifting PEMEX into a corporate business model
Operate under a clear mandate of value creation
High profitability, although not visible due to the transfer of resources to the Federal Government
6
Goals
Increase crude oil production:
7
Increase production from 2,576 Mbd to 2,650-2,750 Mbd by 2014 Reach 3,000 Mbd by 2018
Reach a 1P reserve replacement rate of 100% in 2012 and forward
Achieve crude oil production from new discoveries by 2013
Obtain natural gas production from deep waters by 2015
Execute two tenders of E&P Integrated Contracts in 2011
Achieve profitable downstream operations by 2012
Content
PEMEX’s Strategy
Hydrocarbon Reserves
Production
Downstream
Financial Highlights
Key Investment Considerations
8
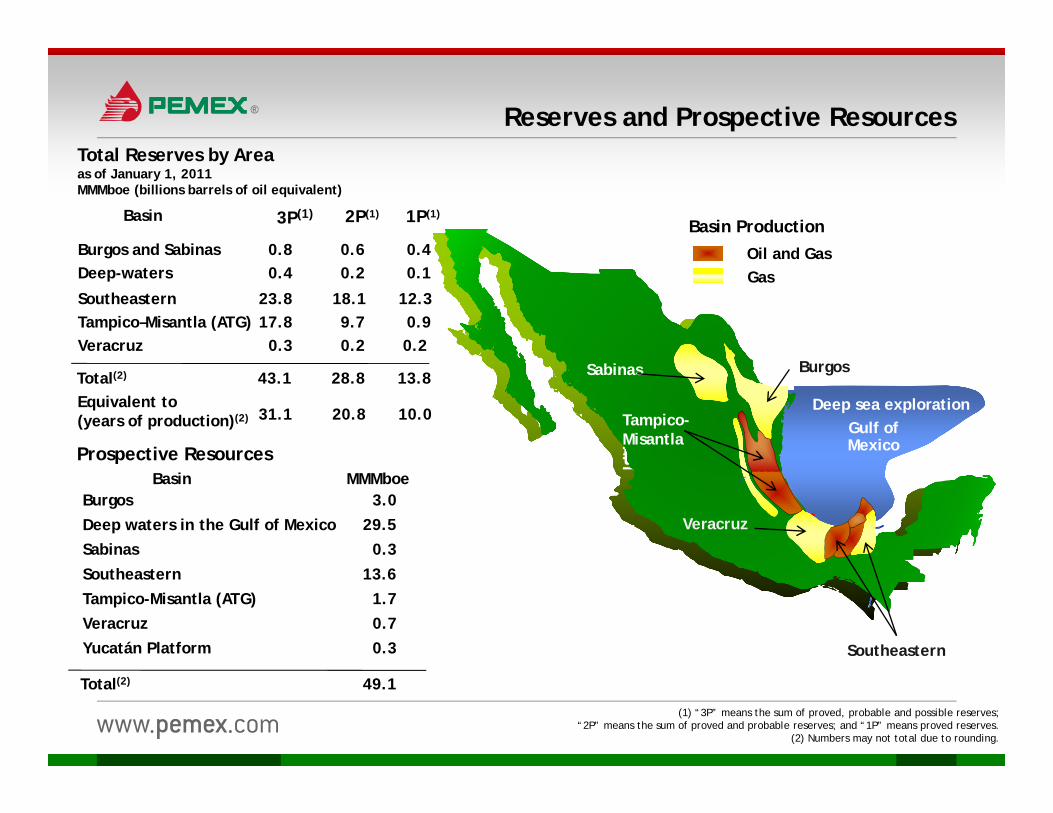
Reserves and Prospective Resources
Prospective ResourcesBasin MMMboe
Burgos 3.0Deep waters in the Gulf of Mexico 29.5Sabinas 0.3Southeastern 13.6Tampico-Misantla (ATG) 1.7Veracruz 0.7Yucatán Platform 0.3
Total(2) 49.1
(1) “3P” means the sum of proved, probable and possible reserves;“2P” means the sum of proved and probable reserves; and “1P” means proved reserves.
(2) Numbers may not total due to rounding.
Oil and GasGas
Basin Production
d
Southeastern
Tampico-Misantla
Sabinas
19.20.3
dVeracruz
Tampico-Misantla
BurgosSabinas
Gulf of Mexico
Deep sea exploration
Total Reserves by Areaas of January 1, 2011MMMboe (billions barrels of oil equivalent)
Basin 3P(1) 2P(1)
Burgos and Sabinas 0.8 0.6 0.4Deep-waters 0.4 0.2 0.1
Southeastern 23.8 18.1 12.3Tampico–Misantla (ATG) 17.8 9.7 0.9Veracruz 0.3 0.2 0.2
Total(2) 43.1 28.8 13.8Equivalent to(years of production)(2) 31.1 20.8 10.0
1P(1)
Kinbe-1
Xux-1
Tsimin-1DL
Tsimin-1
May
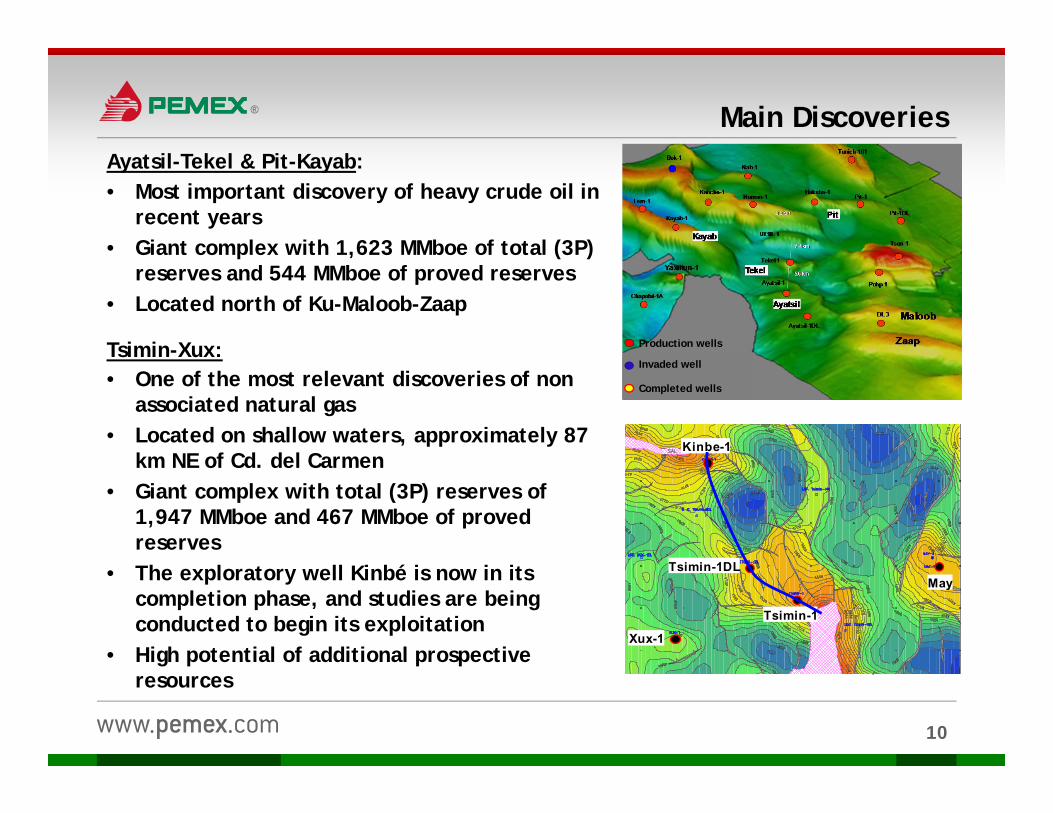
Main Discoveries
• Most important discovery of heavy crude oil in recent years
• Giant complex with 1,623 MMboe of total (3P) reserves and 544 MMboe of proved reserves
• Located north of Ku-Maloob-Zaap
Ayatsil-Tekel & Pit-Kayab:
Tsimin-Xux:• One of the most relevant discoveries of non
associated natural gas• Located on shallow waters, approximately 87
km NE of Cd. del Carmen• Giant complex with total (3P) reserves of
1,947 MMboe and 467 MMboe of proved reserves
• The exploratory well Kinbé is now in its completion phase, and studies are being conducted to begin its exploitation
• High potential of additional prospective resources
Production wells
Invaded well
Completed wells
10
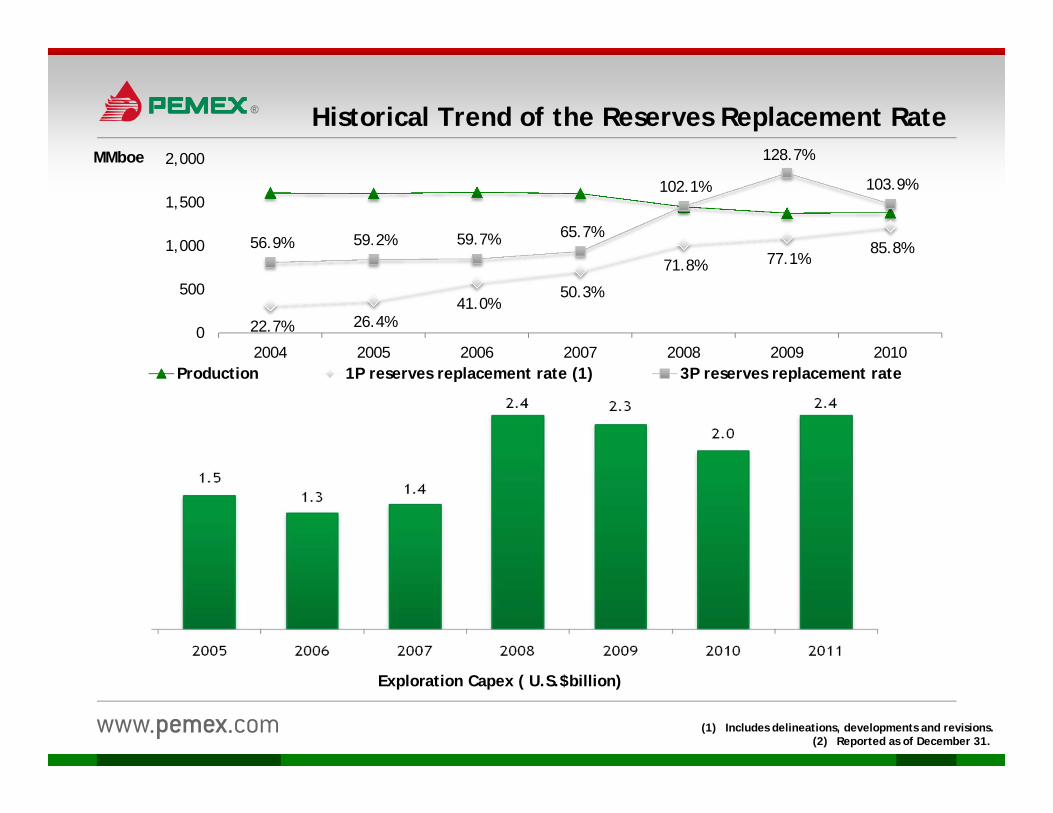
(1) Includes delineations, developments and revisions.(2) Reported as of December 31.
Historical Trend of the Reserves Replacement Rate
22.7% 26.4%41.0%
50.3%
71.8% 77.1%85.8%56.9% 59.2% 59.7% 65.7%
102.1%
128.7%
103.9%
0
500
1,000
1,500
2,000
2004 2005 2006 2007 2008 2009 2010
MMboe
Production 1P reserves replacement rate (1) 3P reserves replacement rate
Exploration Capex ( U.S.$billion)
Content
PEMEX’s Strategy
Hydrocarbon Reserves
Production
Downstream
Financial Highlights
Key Investment Considerations
12
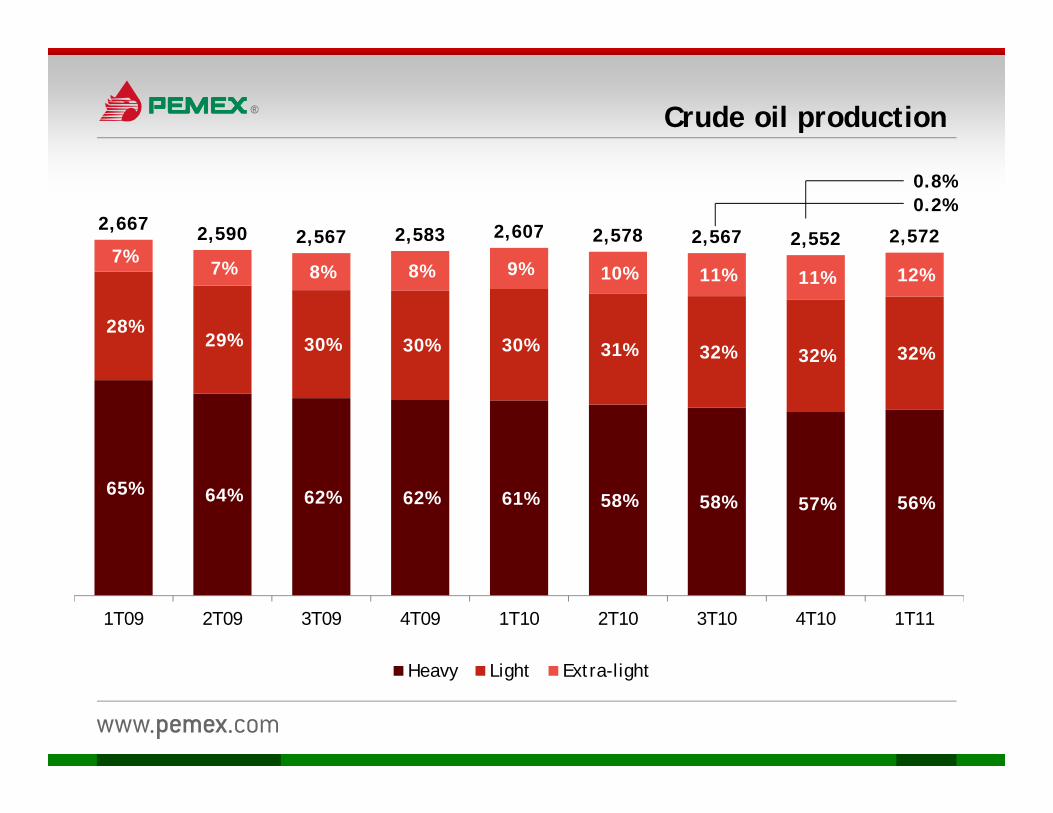
Crude oil production
65% 64% 62% 62% 61% 58% 58% 57% 56%
28%29% 30% 30% 30% 31% 32% 32% 32%
7%7% 8% 8% 9% 10% 11% 11% 12%
2,667 2,590 2,567 2,583 2,607 2,578 2,567 2,552 2,572
1T09 2T09 3T09 4T09 1T10 2T10 3T10 4T10 1T11
Heavy Light Extra-light
0.2%0.8%
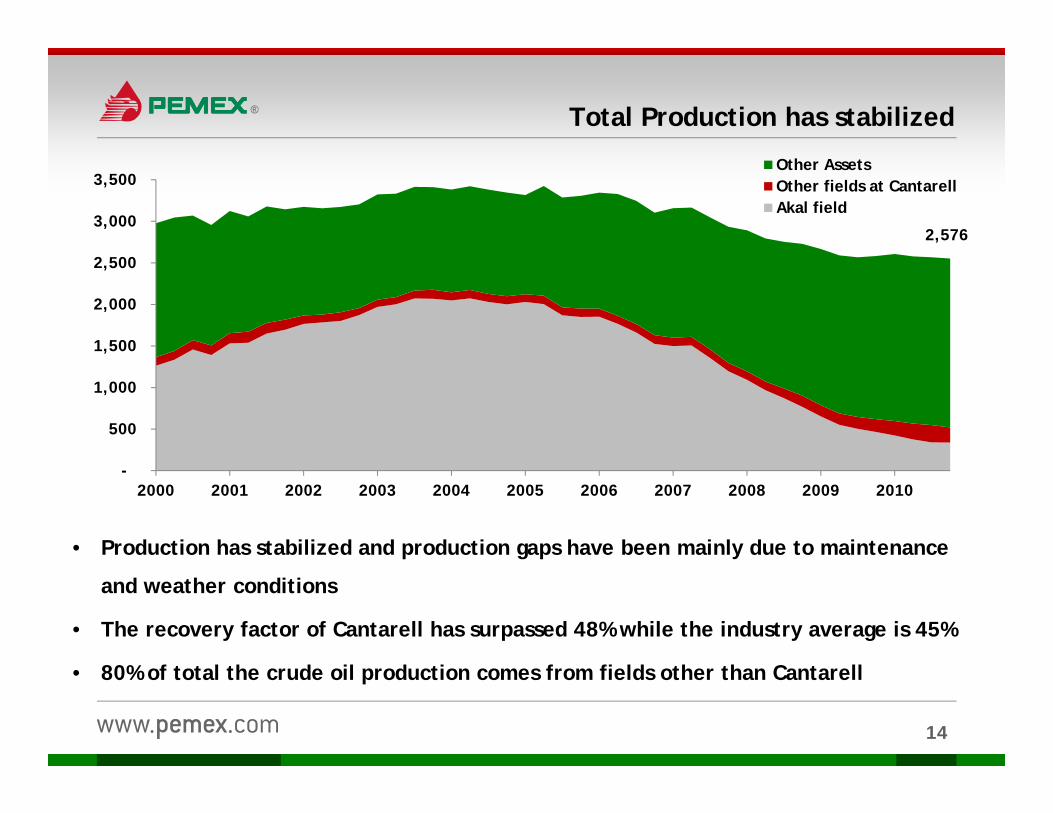
Total Production has stabilized
• Production has stabilized and production gaps have been mainly due to maintenance
and weather conditions
• The recovery factor of Cantarell has surpassed 48% while the industry average is 45%
• 80% of total the crude oil production comes from fields other than Cantarell
14
-
500
1,000
1,500
2,000
2,500
3,000
3,500
2000 2001 2002 2003 2004 2005 2006 2007 2008 2009 2010
Other AssetsOther fields at CantarellAkal field
2,576
15
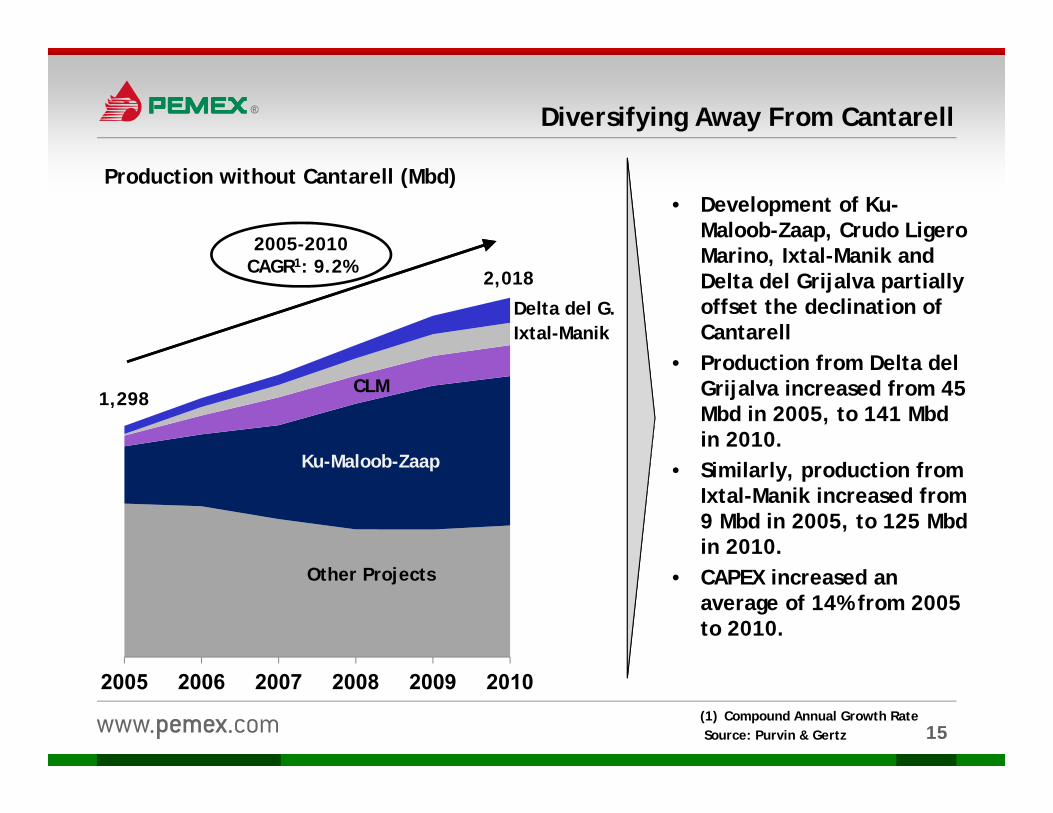
Diversifying Away From Cantarell
2005 2006 2007 2008 2009 2010
Production without Cantarell (Mbd)• Development of Ku-
Maloob-Zaap, Crudo LigeroMarino, Ixtal-Manik and Delta del Grijalva partially offset the declination of Cantarell
• Production from Delta del Grijalva increased from 45 Mbd in 2005, to 141 Mbdin 2010.
• Similarly, production from Ixtal-Manik increased from 9 Mbd in 2005, to 125 Mbdin 2010.
• CAPEX increased an average of 14% from 2005 to 2010.
1,298
Ku-Maloob-Zaap
Other Projects
CLM
Ixtal-ManikDelta del G.
2,018
2005-2010CAGR1: 9.2%
(1) Compound Annual Growth RateSource: Purvin & Gertz
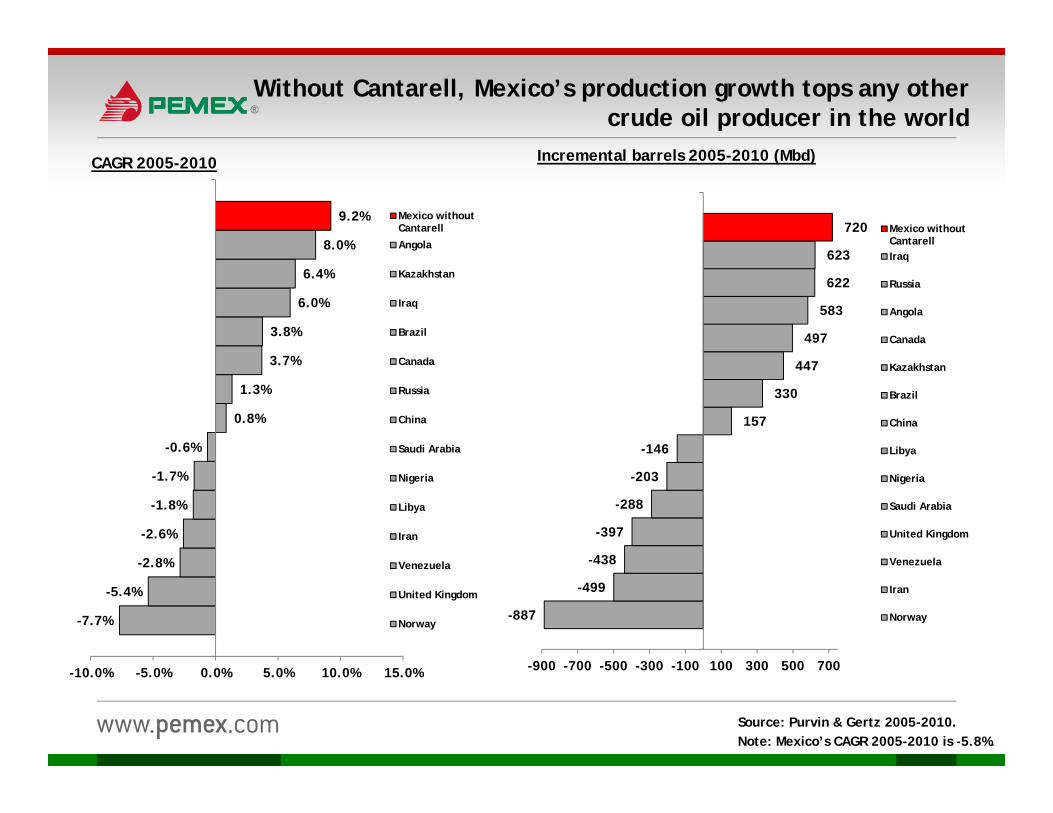
Without Cantarell, Mexico’s production growth tops any other crude oil producer in the world
-887
-499
-438
-397
-288
-203
-146
157
330
447
497
583
622
623
720
-900 -700 -500 -300 -100 100 300 500 700
Mexico withoutCantarellIraq
Russia
Angola
Canada
Kazakhstan
Brazil
China
Libya
Nigeria
Saudi Arabia
United Kingdom
Venezuela
Iran
Norway-7.7%
-5.4%
-2.8%
-2.6%
-1.8%
-1.7%
-0.6%
0.8%
1.3%
3.7%
3.8%
6.0%
6.4%
8.0%
9.2%
-10.0% -5.0% 0.0% 5.0% 10.0% 15.0%
Mexico withoutCantarell
Angola
Kazakhstan
Iraq
Brazil
Canada
Russia
China
Saudi Arabia
Nigeria
Libya
Iran
Venezuela
United Kingdom
Norway
CAGR 2005-2010
Source: Purvin & Gertz 2005-2010.Note: Mexico’s CAGR 2005-2010 is -5.8%.
Incremental barrels 2005-2010 (Mbd)
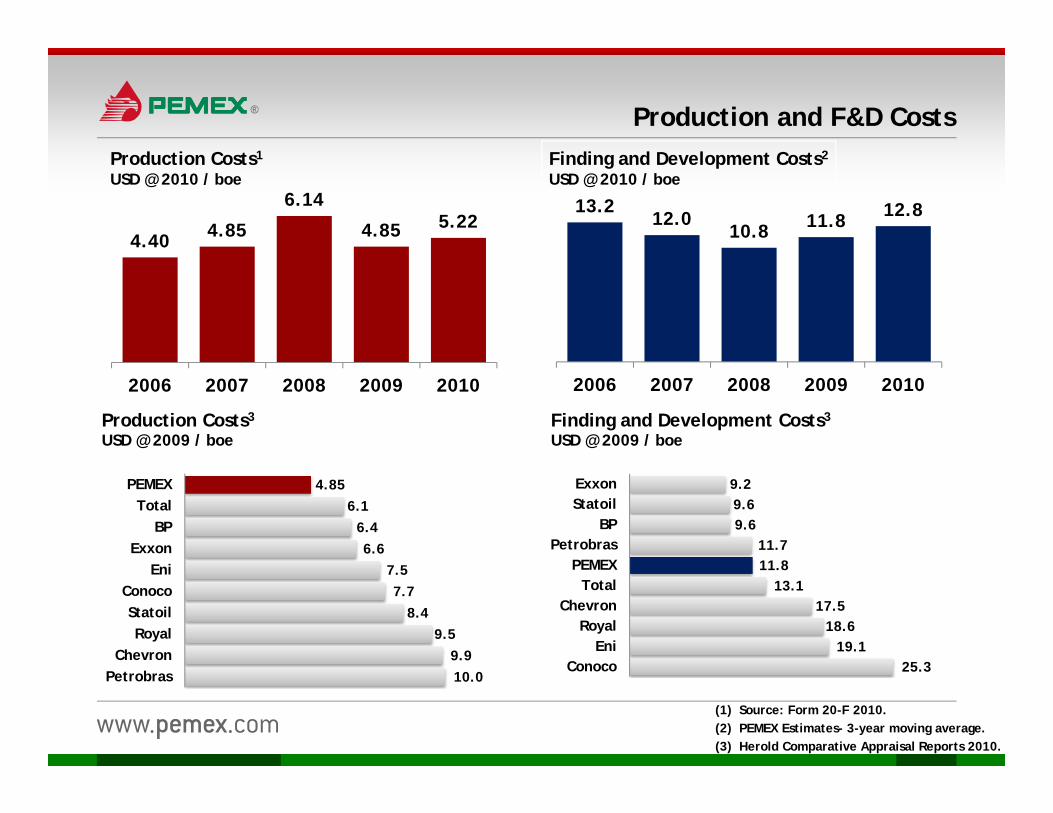
Production and F&D CostsProduction Costs1
USD @ 2010 / boeFinding and Development Costs2
USD @ 2010 / boe
4.40 4.85
6.14
4.85 5.22
2006 2007 2008 2009 2010
13.212.0
10.8 11.8 12.8
2006 2007 2008 2009 2010
4.85 6.1
6.4 6.6
7.5 7.7
8.4 9.5
9.9 10.0
PEMEXTotal
BPExxon
EniConocoStatoilRoyal
ChevronPetrobras
Production Costs3
USD @ 2009 / boe
9.2 9.6 9.6
11.7 11.8
13.1 17.5
18.6 19.1
25.3
ExxonStatoil
BPPetrobras
PEMEXTotal
ChevronRoyal
EniConoco
Finding and Development Costs3
USD @ 2009 / boe
(1) Source: Form 20-F 2010.(2) PEMEX Estimates- 3-year moving average.(3) Herold Comparative Appraisal Reports 2010.
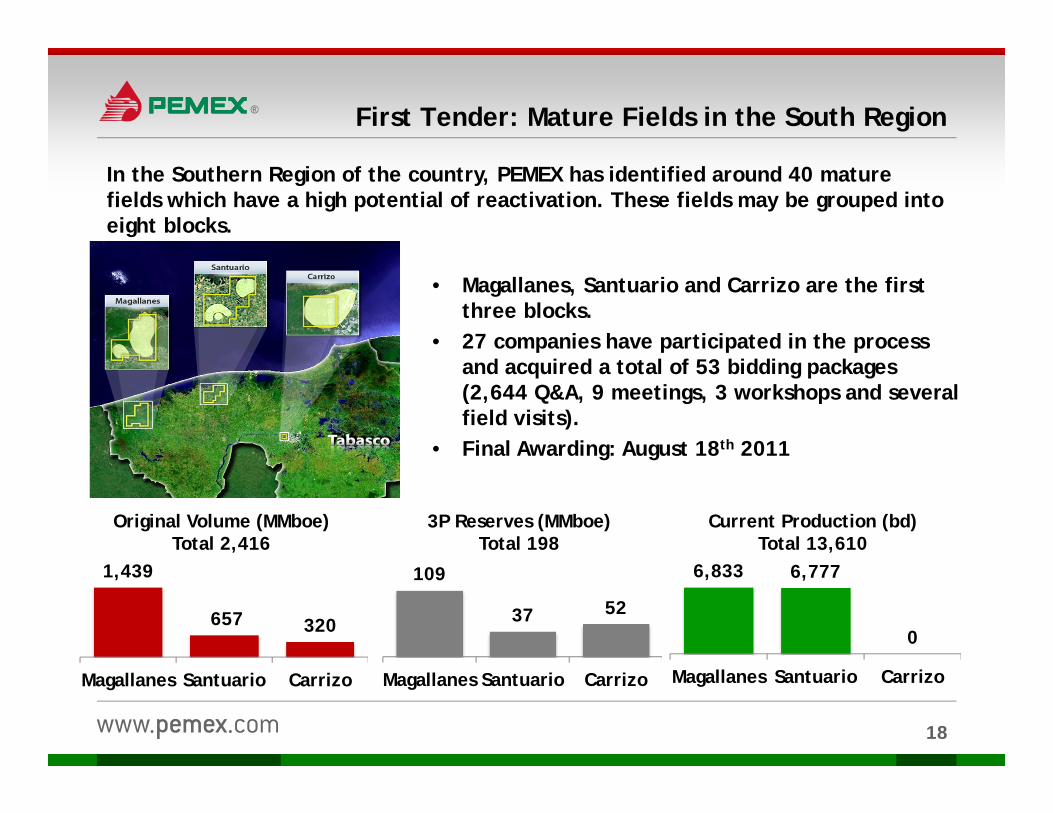
First Tender: Mature Fields in the South Region
• Magallanes, Santuario and Carrizo are the first three blocks.
• 27 companies have participated in the process and acquired a total of 53 bidding packages (2,644 Q&A, 9 meetings, 3 workshops and several field visits).
• Final Awarding: August 18th 2011
In the Southern Region of the country, PEMEX has identified around 40 mature fields which have a high potential of reactivation. These fields may be grouped into eight blocks.
109
37 52
Magallanes Santuario Carrizo
3P Reserves (MMboe)Total 198
Original Volume (MMboe)Total 2,416
1,439
657 320
Magallanes Santuario Carrizo
Current Production (bd)Total 13,610
6,833 6,777
0
Magallanes Santuario Carrizo
18
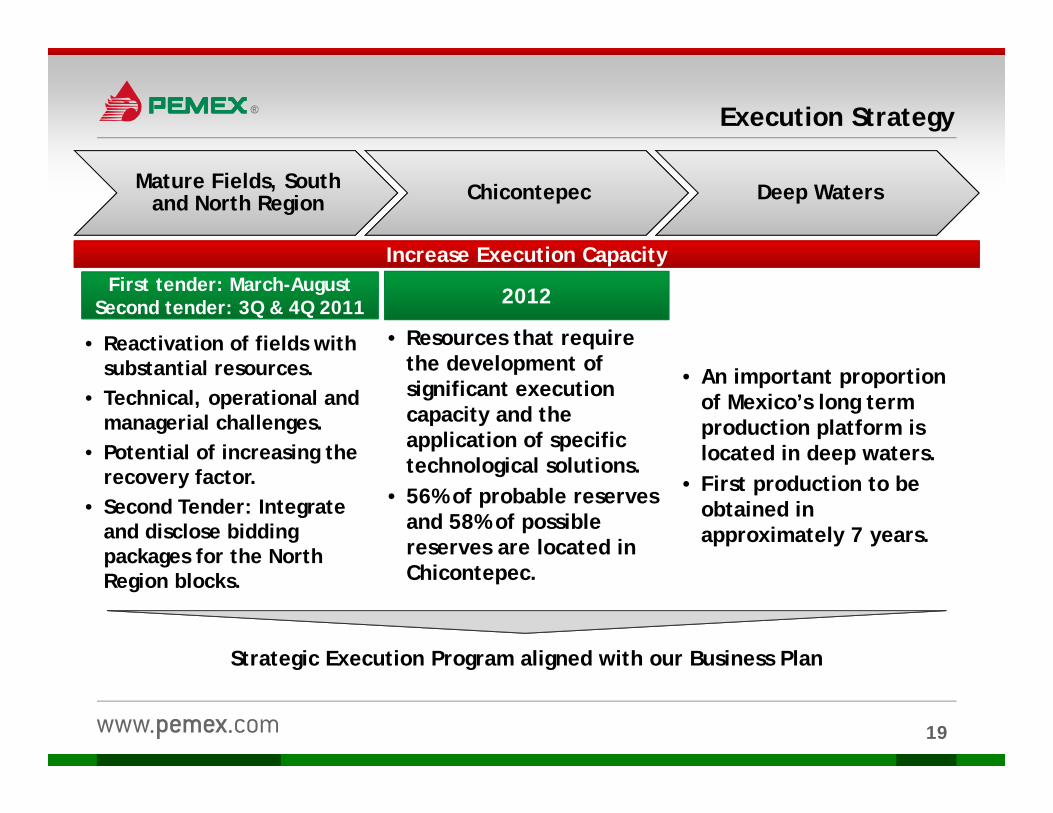
Execution Strategy
Mature Fields, South and North Region Chicontepec Deep Waters
• Reactivation of fields with substantial resources.
• Technical, operational and managerial challenges.
• Potential of increasing the recovery factor.
• Second Tender: Integrate and disclose bidding packages for the North Region blocks.
• Resources that require the development of significant execution capacity and the application of specific technological solutions.
• 56% of probable reserves and 58% of possible reserves are located in Chicontepec.
• An important proportion of Mexico’s long term production platform is located in deep waters.
• First production to be obtained in approximately 7 years.
Strategic Execution Program aligned with our Business Plan
Increase Execution CapacityFirst tender: March-August
Second tender: 3Q & 4Q 2011 2012
19
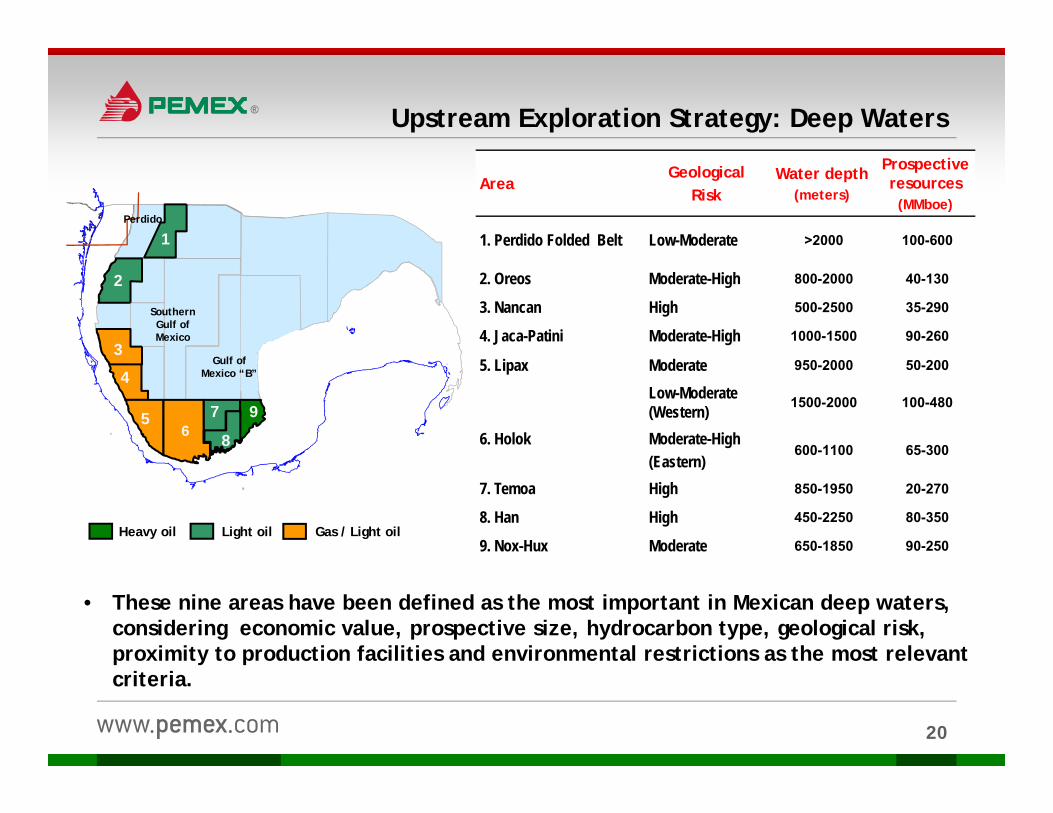
Upstream Exploration Strategy: Deep Waters
AreaGeological
RiskWater depth
(meters)
Prospective resources
(MMboe)
1. Perdido Folded Belt Low-Moderate >2000 100-600
2. Oreos Moderate-High 800-2000 40-130
3. Nancan High 500-2500 35-290
4. Jaca-Patini Moderate-High 1000-1500 90-260
5. Lipax Moderate 950-2000 50-200
6. Holok
Low-Moderate (Western) 1500-2000 100-480
Moderate-High(Eastern)
600-1100 65-300
7. Temoa High 850-1950 20-270
8. Han High 450-2250 80-350
9. Nox-Hux Moderate 650-1850 90-250
1
8
97
2
65
4
3Gulf of
Mexico “B”
Southern Gulf of Mexico
Perdido
Heavy oil Gas / Light oil
• These nine areas have been defined as the most important in Mexican deep waters, considering economic value, prospective size, hydrocarbon type, geological risk, proximity to production facilities and environmental restrictions as the most relevant criteria.
Light oil
20
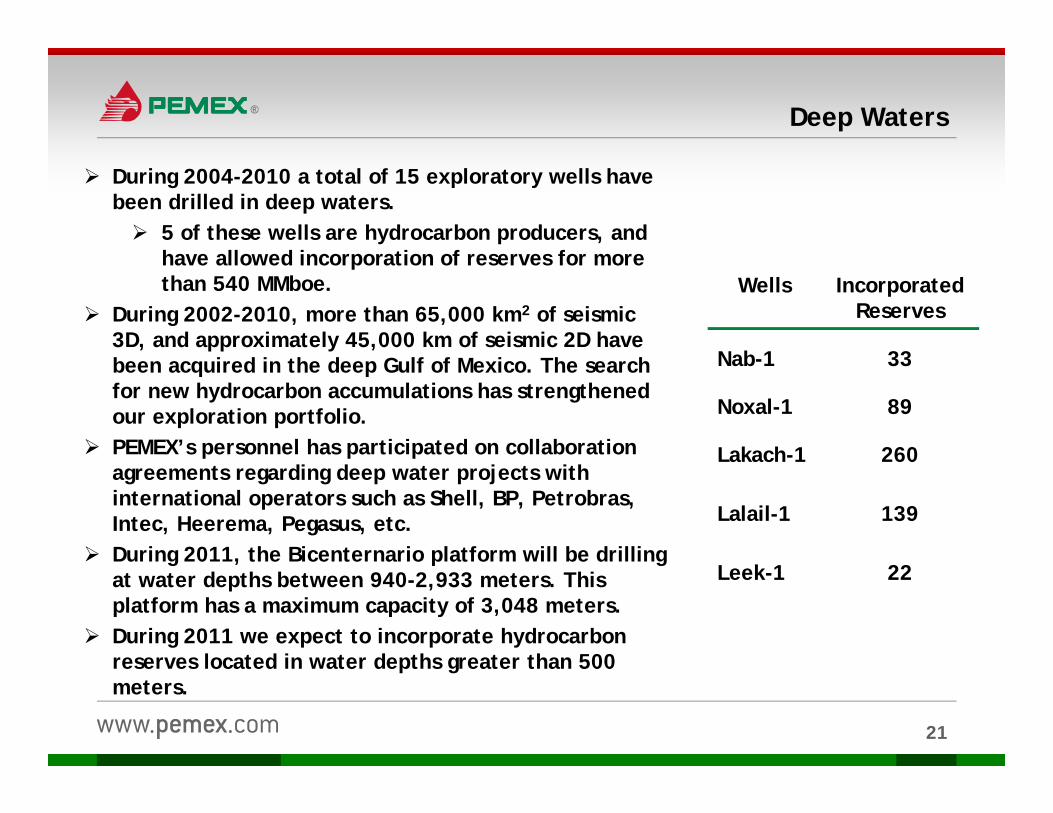
Deep Waters
During 2004-2010 a total of 15 exploratory wells have been drilled in deep waters. 5 of these wells are hydrocarbon producers, and
have allowed incorporation of reserves for more than 540 MMboe.
During 2002-2010, more than 65,000 km2 of seismic 3D, and approximately 45,000 km of seismic 2D have been acquired in the deep Gulf of Mexico. The search for new hydrocarbon accumulations has strengthened our exploration portfolio.
PEMEX’s personnel has participated on collaboration agreements regarding deep water projects with international operators such as Shell, BP, Petrobras, Intec, Heerema, Pegasus, etc.
During 2011, the Bicenternario platform will be drilling at water depths between 940-2,933 meters. This platform has a maximum capacity of 3,048 meters.
During 2011 we expect to incorporate hydrocarbon reserves located in water depths greater than 500 meters.
Wells Incorporated Reserves
Nab-1 33
Noxal-1 89
Lakach-1 260
Lalail-1 139
Leek-1 22
21
Content
PEMEX’s Strategy
Hydrocarbon Reserves
Production
Downstream
Financial Highlights
Key Investment Considerations
22
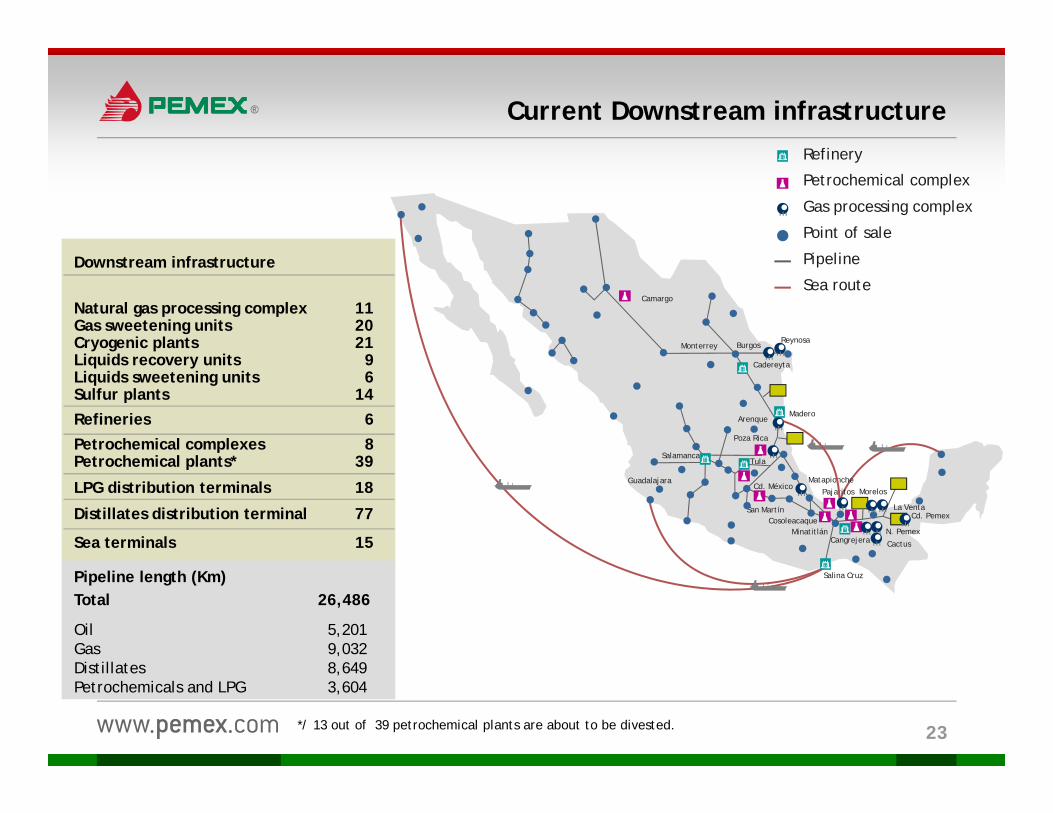
*/ 13 out of 39 petrochemical plants are about to be divested.
Pipeline length (Km)Total 26,486
Oil 5,201Gas 9,032Distillates 8,649Petrochemicals and LPG 3,604
Downstream infrastructure
Natural gas processing complex 11Gas sweetening units 20Cryogenic plants 21Liquids recovery units 9Liquids sweetening units 6Sulfur plants 14Refineries 6Petrochemical complexes 8Petrochemical plants* 39
LPG distribution terminals 18
Distillates distribution terminal 77
Sea terminals 15
23
Salina Cruz
Madero
Tula
Cadereyta
Salamanca
Camargo
San Martín
GuadalajaraCd. México
Poza Rica
Arenque
MonterreyReynosa
Burgos
MatapionchePajaritos
CosoleacaqueMinatitlán
Cactus
N. Pemex
Cd. Pemex
Morelos
La Venta
Cangrejera
Refinery
Petrochemical complex
Gas processing complex
Point of sale
Pipeline
Sea route
Current Downstream infrastructure
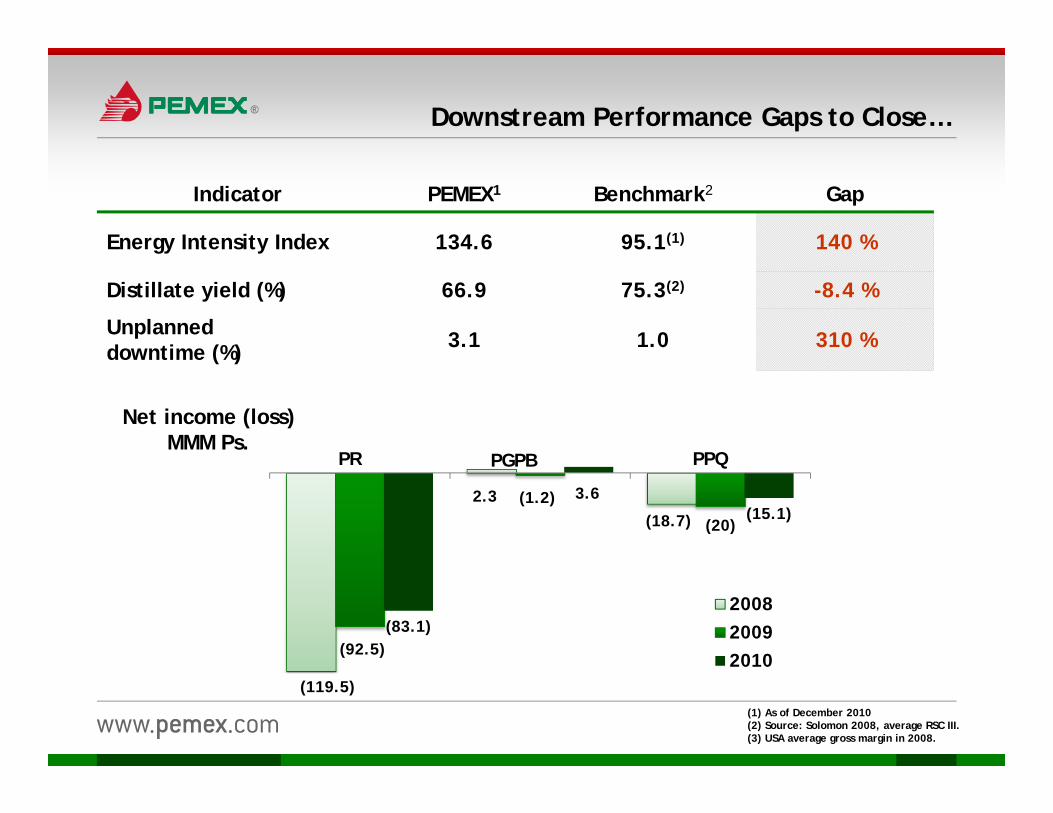
Downstream Performance Gaps to Close…
Indicator PEMEX1 Benchmark2 Gap
Energy Intensity Index 134.6 95.1(1) 140 %
Distillate yield (%) 66.9 75.3(2) -8.4 %
Unplanned downtime (%) 3.1 1.0 310 %
(1) As of December 2010(2) Source: Solomon 2008, average RSC III.(3) USA average gross margin in 2008.
(83.1)
3.6(15.1)
200820092010
(20)
Net income (loss)MMM Ps.
PR PGPB PPQ
(119.5)
(92.5)
2.3 (1.2)(18.7)
• PEMEX elaborated and begun implementing a strategy to:• Improve operational reliability, distillate yield, energy use &
consumption, programming & planning, communication & logisticsand eliminate redundancies (Operations Improvement Program)
• PEMEX is scanning all production and administrative processes toidentify and amend shortcomings to generate value from the NRS
• The implementation is being conducted in three stages:i. Madero & Salina Cruz (in progress)ii. Cadereyta & Tulaiii. Minatitlán & Salamanca
National RefiningSystem(NRS)
• Minatitlán is expected to stabilize in the following months and thebenefits of the reconfiguration should be noticeable as soon as the endof the year
• The FEED (Front End Engineering Design) of the new refinery and thereconfiguration of Salamanca are expected to begin in 2012
Added Capacity
Downstream: Refining
Natural Gas
Downstream: Gas and Petrochemicals
• Increase gas processing infrastructure according to primary production (sweetening, NG liquids recovery, liquid fractionation, and sulfur recovery).
• Capture the benefit associated with gas production (non associated) in the Northern Region.
• Increase transport capacity as required by production and demand for natural gas.
Petroche-micals
• Focus on most profitable chains:• Evaluate possible associations with the private sector on selected
chains, as to propel Mexico’s petrochemicals industry.• Increase efficiency and debottlenecking.
• Suspend non-profitable and marginal chains.
Content
PEMEX’s Strategy
Production
Hydrocarbon Reserves
Downstream
Financial Highlights
Key Investment Considerations
27
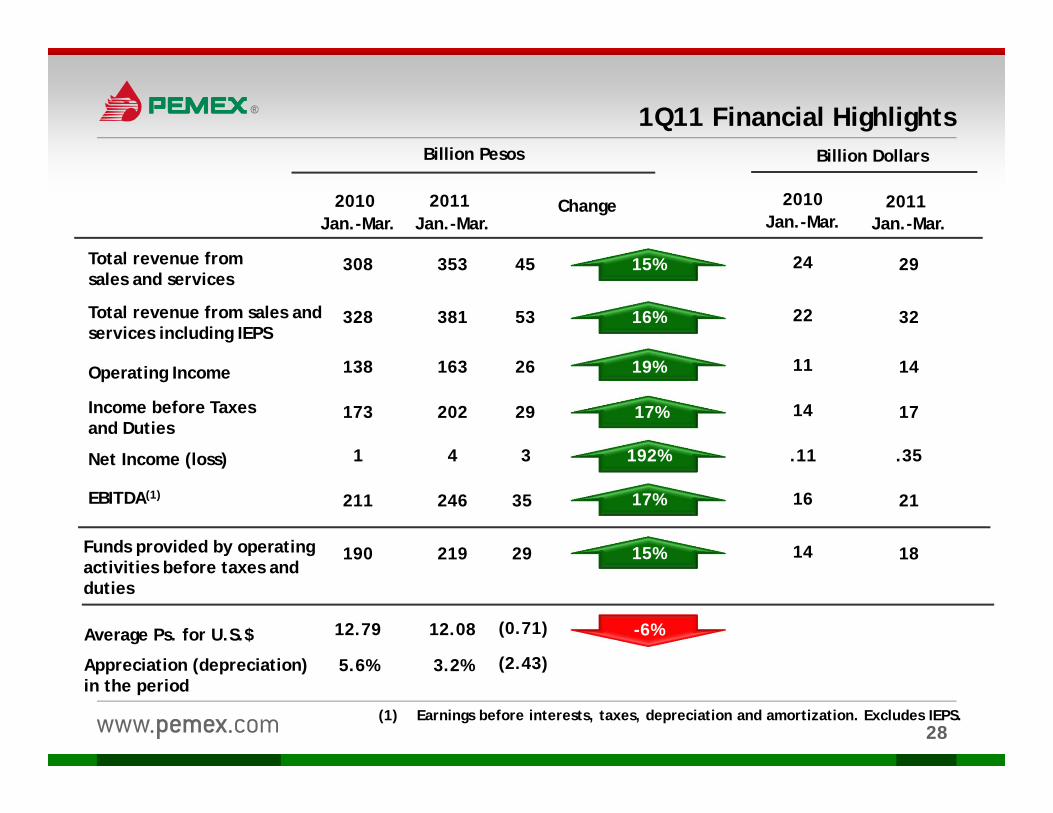
1Q11 Financial Highlights
EBITDA(1)
Billion Pesos Billion Dollars
Net Income (loss)
Change
Total revenue from sales and services
Income before Taxes and Duties
Funds provided by operating activities before taxes and duties
308 353 45
173
15% 29
29202 17
1
211
.35
17%
17%
34
246 35 21
2010Jan.-Mar.
2011Jan.-Mar.
2011Jan.-Mar.
Operating Income 138 163 26 1419%
192%
190 15%219 29 18
(1) Earnings before interests, taxes, depreciation and amortization. Excludes IEPS.
Total revenue from sales and services including IEPS
328 381 53 16% 32
12.79 12.08Average Ps. for U.S.$ (0.71)
5.6% 3.2%Appreciation (depreciation) in the period
(2.43)
-6%
28
24
14
.11
16
2010Jan.-Mar.
11
14
22
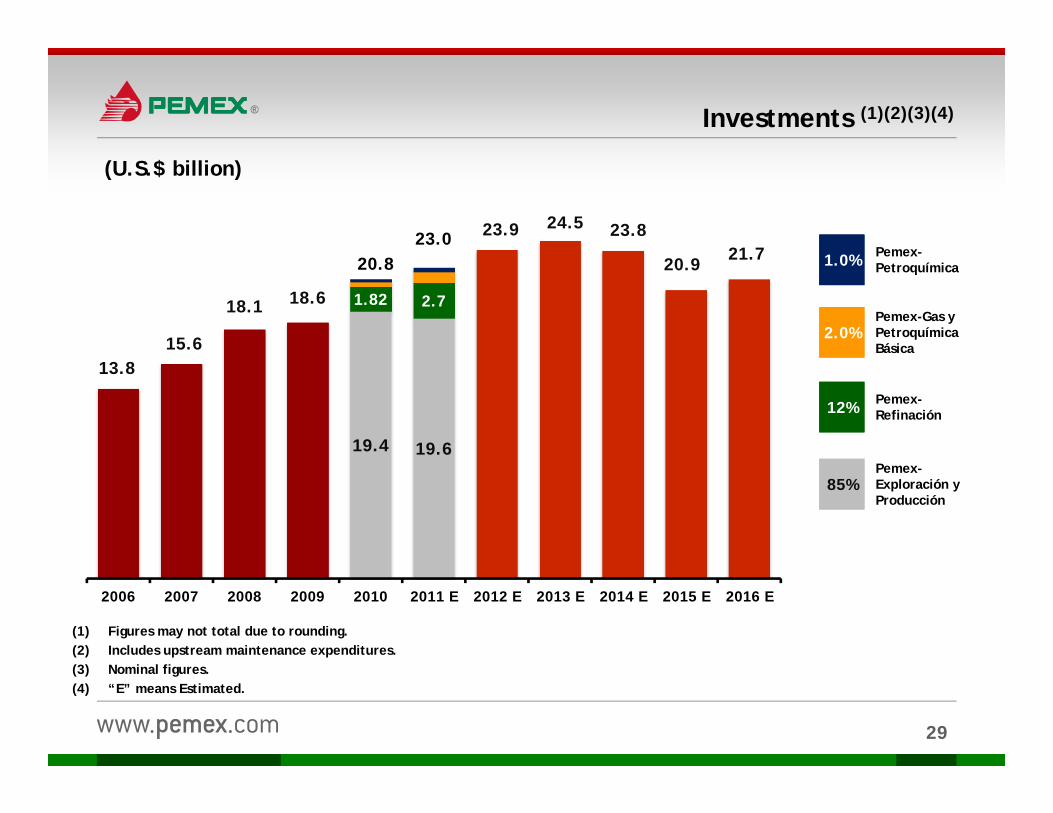
Investments (1)(2)(3)(4)
13.815.6
18.1 18.6
19.4 19.6
23.9 24.5 23.8
20.9 21.7
1.82 2.7
2006 2007 2008 2009 2010 2011 E 2012 E 2013 E 2014 E 2015 E 2016 E
(1) Figures may not total due to rounding.(2) Includes upstream maintenance expenditures.(3) Nominal figures.(4) “E” means Estimated.
(U.S.$ billion)
1.0%1.0% Pemex-Petroquímica
12%12% Pemex-Refinación
2.0%2.0%Pemex-Gas y Petroquímica Básica
Pemex-Exploración y Producción
85%85%
20.823.0
29
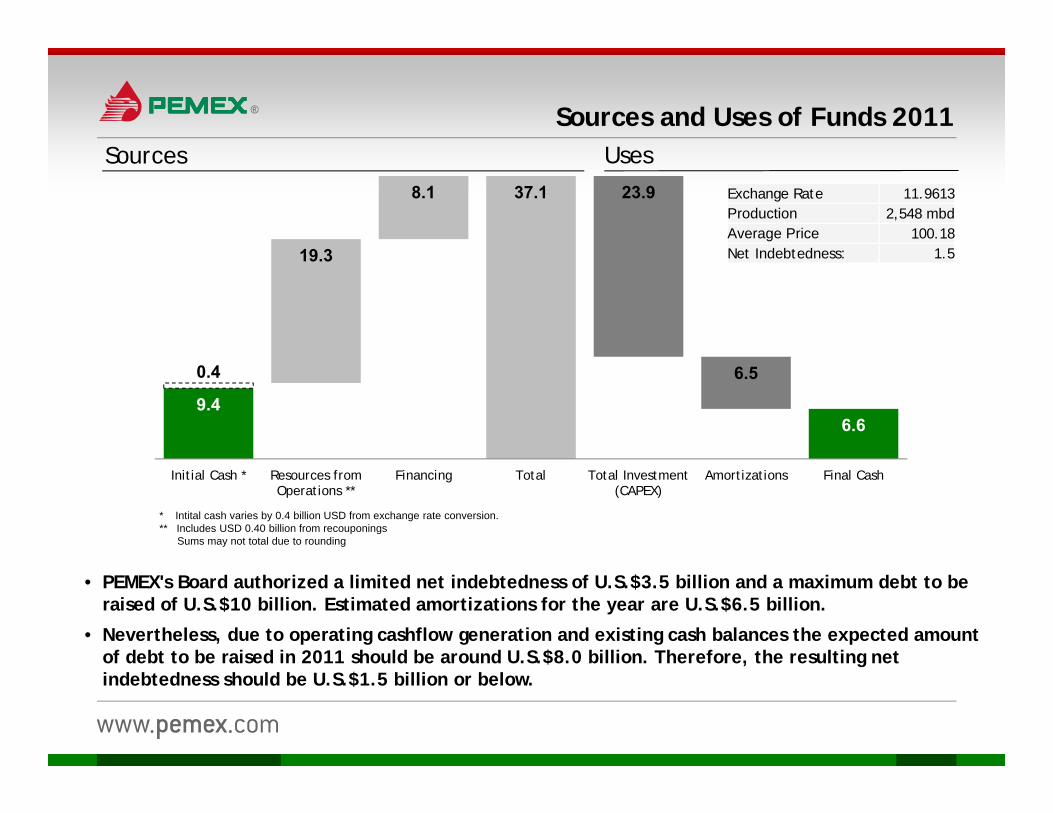
• PEMEX's Board authorized a limited net indebtedness of U.S.$3.5 billion and a maximum debt to be raised of U.S.$10 billion. Estimated amortizations for the year are U.S.$6.5 billion.
• Nevertheless, due to operating cashflow generation and existing cash balances the expected amount of debt to be raised in 2011 should be around U.S.$8.0 billion. Therefore, the resulting net indebtedness should be U.S.$1.5 billion or below.
Sources and Uses of Funds 2011Sources Uses
9.4
19.3
8.1 37.1 23.9
6.5
6.6
0.4
Initial Cash * Resources fromOperations **
Financing Total Total Investment(CAPEX)
Amortizations Final Cash
* Intital cash varies by 0.4 billion USD from exchange rate conversion.** Includes USD 0.40 billion from recouponings
Sums may not total due to rounding
Exchange Rate 11.9613Production 2,548 mbdAverage Price 100.18 Net Indebtedness: 1.5
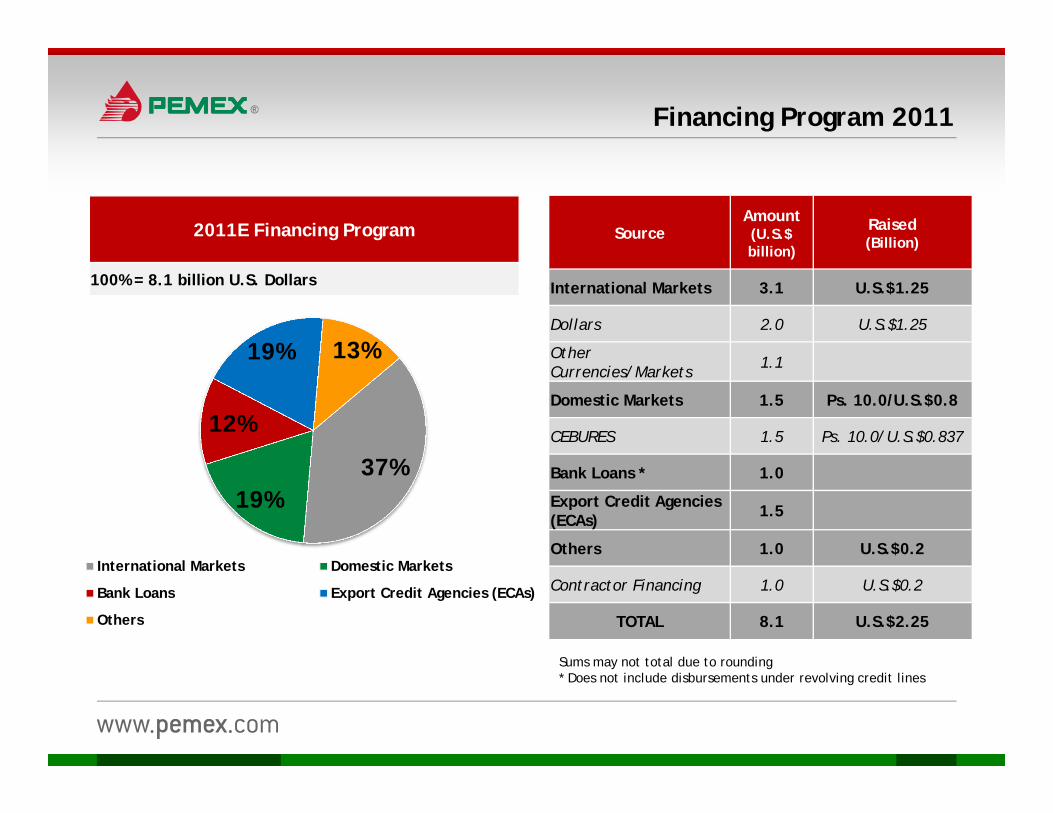
Financing Program 2011
SourceAmount (U.S.$ billion)
Raised(Billion)
International Markets 3.1 U.S.$1.25
Dollars 2.0 U.S.$1.25
Other Currencies/Markets 1.1
Domestic Markets 1.5 Ps. 10.0/U.S.$0.8
CEBURES 1.5 Ps. 10.0/U.S.$0.837
Bank Loans * 1.0
Export Credit Agencies (ECAs) 1.5
Others 1.0 U.S.$0.2
Contractor Financing 1.0 U.S.$0.2
TOTAL 8.1 U.S.$2.25
2011E Financing Program
100% = 8.1 billion U.S. Dollars
37%19%
12%
19% 13%
International Markets Domestic Markets
Bank Loans Export Credit Agencies (ECAs)
Others
Sums may not total due to rounding* Does not include disbursements under revolving credit lines
Content
PEMEX’s Strategy
Production
Hydrocarbon Reserves
Downstream
Financial Highlights
Key Investment Considerations
32
Key Investment Considerations
Stable production over 2.5 MMbd, with upside potential
Reserves replacement rate in line with the 100% goal for 2012
Improved regulatory framework shifting PEMEX towards a corporate business model
Initial round of E&P Integrated Contracts starting in 2011
Achieve profitable downstream operations by 2012
Moderate financing needs expected for 2011 and 2012
33
0.0%
1.5%
3.0%
4.5%
6.0%
7.5%
9.0%
10.5%
2000 2002 2004 2006 2008 2010
0.0
0.2
0.4
0.6
0.8
1.0
1.2
1.4
2005 2006 2007 2008 2009 2010
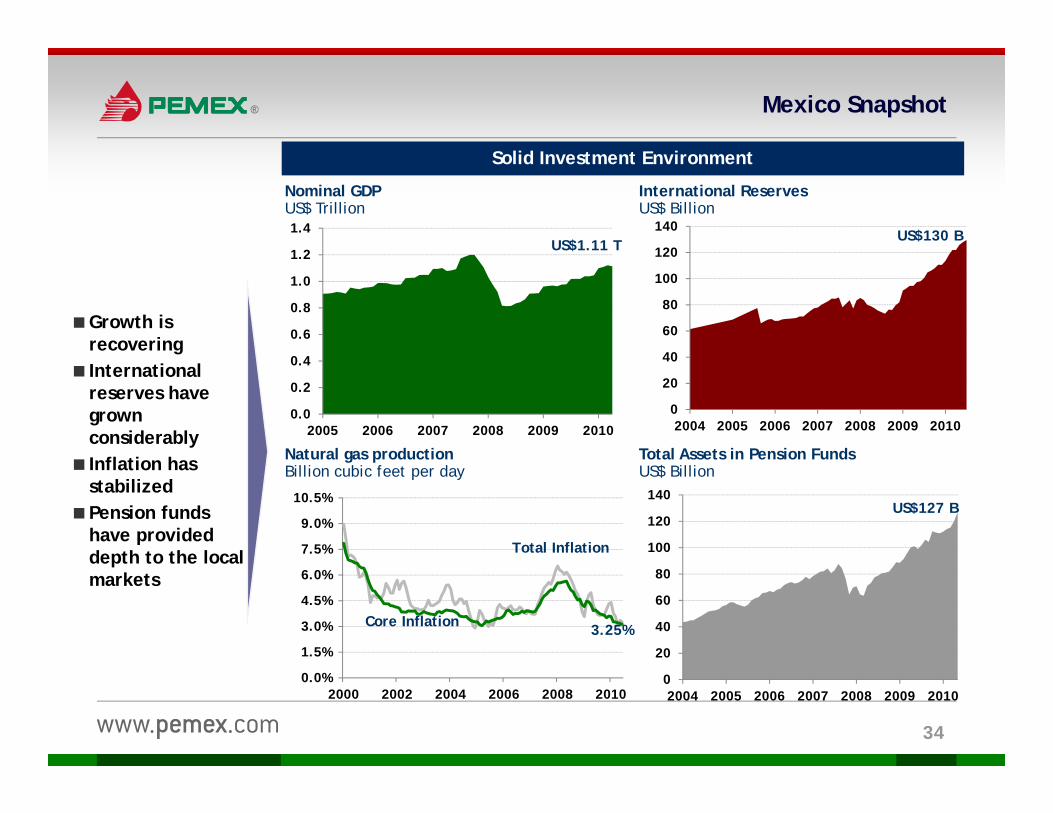
Growth is recovering
International reserves have grown considerably
Inflation has stabilized
Pension funds have provided depth to the local markets
Solid Investment Environment
Natural gas productionBillion cubic feet per day
Total Assets in Pension FundsUS$ Billion
Nominal GDPUS$ Trillion
International ReservesUS$ Billion
US$1.11 T
34
Mexico Snapshot
0
20
40
60
80
100
120
140
2004 2005 2006 2007 2008 2009 2010
US$130 B
Total Inflation
Core Inflation 3.25%
0
20
40
60
80
100
120
140
2004 2005 2006 2007 2008 2009 2010
US$127 B
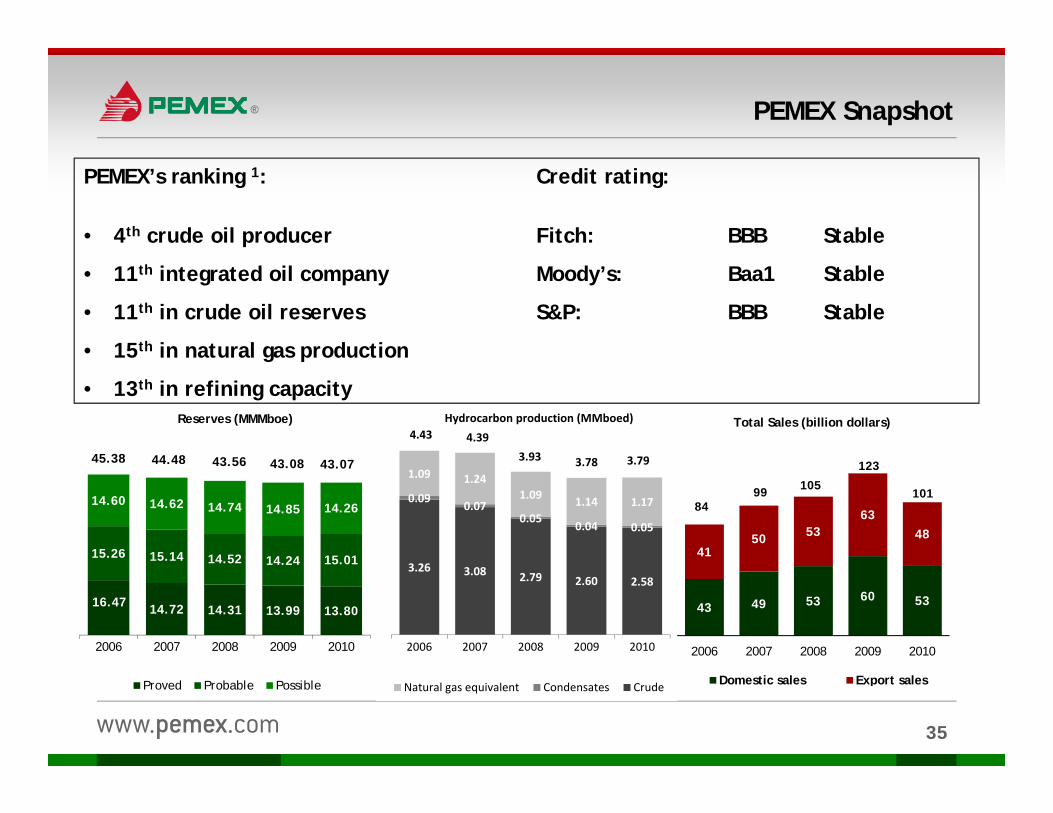
3.26 3.08 2.79 2.60 2.58
0.09 0.070.05
0.04 0.05
1.09 1.241.09 1.14 1.17
4.43 4.393.93 3.78 3.79
2006 2007 2008 2009 2010
Hydrocarbon production (MMboed)
Natural gas equivalent Condensates Crude
35
PEMEX Snapshot
PEMEX’s ranking 1:
• 4th crude oil producer
• 11th integrated oil company
• 11th in crude oil reserves
• 15th in natural gas production
• 13th in refining capacity
Credit rating:
Fitch: BBB Stable
Moody’s: Baa1 Stable
S&P: BBB Stable
16.47 14.72 14.31 13.99 13.80
15.26 15.14 14.52 14.24 15.01
14.60 14.62 14.74 14.85 14.26
45.38 44.48 43.56 43.08 43.07
2006 2007 2008 2009 2010
Reserves (MMMboe)
Proved Probable Possible
43 49 53 60 53
4150 53
6348
2006 2007 2008 2009 2010
Total Sales (billion dollars)
Domestic sales Export sales
123
10110599
84
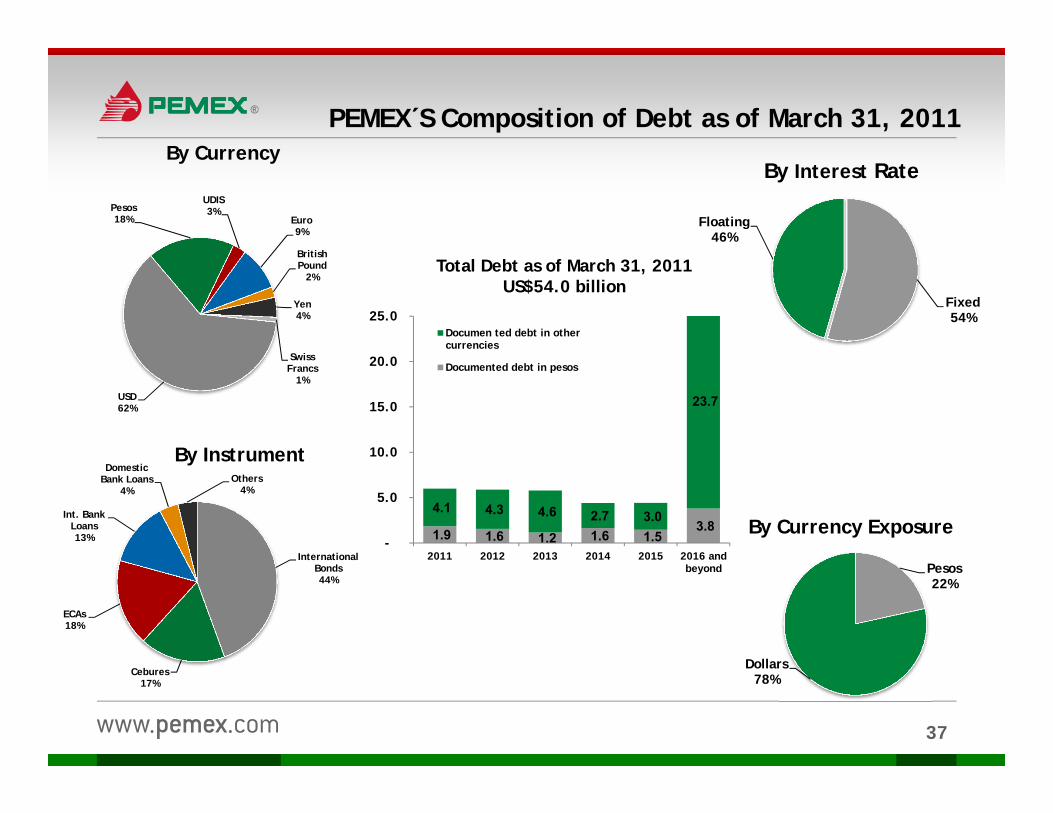
PEMEX´S Composition of Debt as of March 31, 2011By Currency
International Bonds44%
Cebures17%
ECAs18%
Int. Bank Loans13%
Domestic Bank Loans
4%Others
4%
By Instrument
Fixed54%
Floating46%
By Interest Rate
1.9 1.6 1.2 1.6 1.5 3.8
4.1 4.3 4.6 2.7 3.0
23.7
-
5.0
10.0
15.0
20.0
25.0
2011 2012 2013 2014 2015 2016 andbeyond
Documen ted debt in othercurrencies
Documented debt in pesos
Total Debt as of March 31, 2011 US$54.0 billion
USD62%
Pesos18%
UDIS3%
Euro9%
British Pound
2%
Yen4%
Swiss Francs
1%
Pesos 22%
Dollars 78%
By Currency Exposure
37
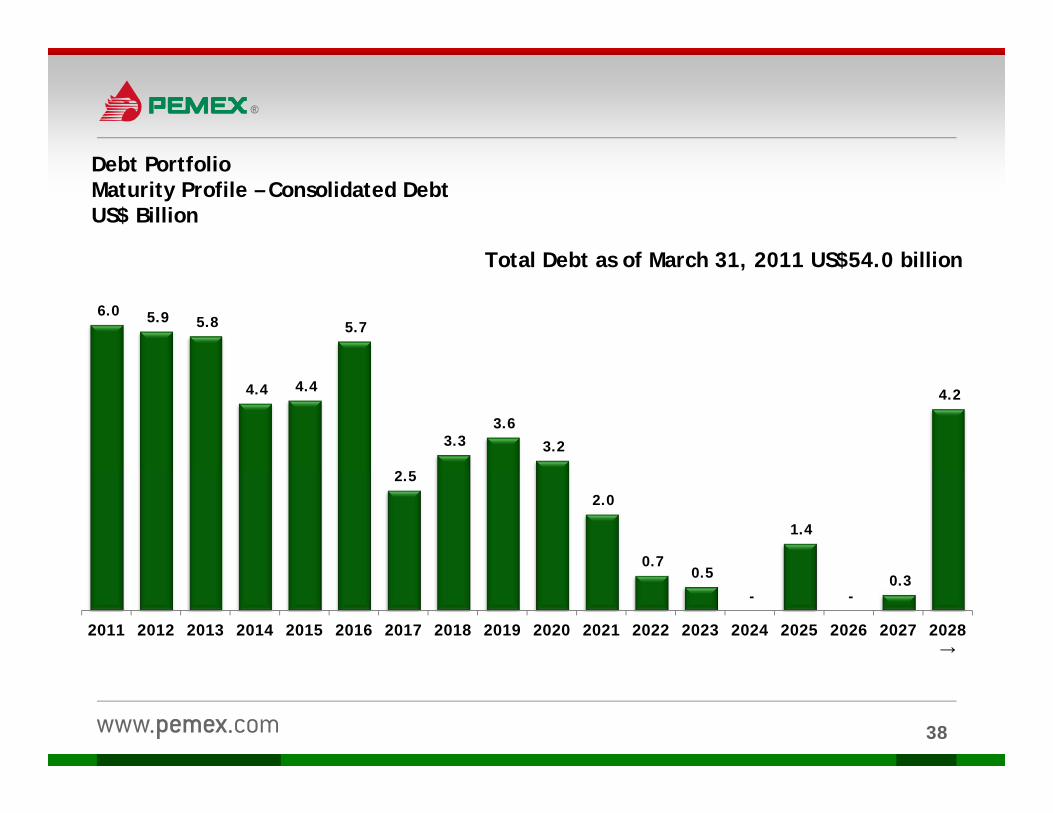
Debt PortfolioMaturity Profile – Consolidated DebtUS$ Billion
6.0 5.9 5.8
4.4 4.4
5.7
2.5
3.3 3.6
3.2
2.0
0.7 0.5
-
1.4
-0.3
4.2
2011 2012 2013 2014 2015 2016 2017 2018 2019 2020 2021 2022 2023 2024 2025 2026 2027 2028 →
Total Debt as of March 31, 2011 US$54.0 billion
38


![T sis Do]tor[l - gredos.usal.esgredos.usal.es/jspui/bitstream/10366/124342/1/DDEMPC_HerreroValín...Crear a partir del movimiento del sonido. ... Henry: Variations pour une porte et](https://static.fdocuments.ec/doc/165x107/5ad7c4c47f8b9a865b8c9fa2/t-sis-dotorl-a-partir-del-movimiento-del-sonido-henry-variations-pour.jpg)