
MicroRNA Expression Profiling of Peripheral Blood Samples Predicts Resistance to First-line...
15
MicroRNA Expression Profiling of Peripheral Blood Samples Predicts Resistance to First-line Sunitinib in Advanced Renal Cell Carcinoma Patients 1,2 Angelo Gámez-Pozo * , Luis M. Antón-Aparicio † , Cristina Bayona ‡,3 , Pablo Borrega §,3 , María I. Gallegos Sancho ¶,3 , Rocío García-Domínguez #,3 , Teresa de Portugal ** ,3 , Manuel Ramos-Vázquez ††,3 , Ramón Pérez-Carrión ‡‡ , María V. Bolós §§ , Rosario Madero ¶¶ , Iker Sánchez-Navarro * , Juan A. Fresno Vara * and Enrique Espinosa Arranz * ,## *Laboratory of Molecular Oncology and Pathology, Instituto de Genética Médica y Molecular (INGEMM), Instituto de Investigación Sanitaria del Hospital Universitario La Paz (IdiPAZ), Madrid, Spain; † Medical Oncology Department, La Coruña University Hospital, Servicio Galego de Saúde (SERGAS), La Coruña, Spain; ‡ Oncology Department, Hospital General Yagüe, Burgos, Spain; § Medical Oncology Department, Hospital de San Pedro de Alcántara, Cáceres, Spain; ¶ Medical Oncology Department, Hospital General de Segovia, Segovia, Spain; # Medical Oncology Department, Hospital Universitario de Salamanca, Salamanca, Spain; **Medical Oncology Department, Hospital Virgen de la Concha, Complejo Hospitalario de Zamora, Zamora, Spain; †† Medical Oncology Department, Centro Oncológico de Galicia, A Coruña, Spain; ‡‡ Oncology Department, Hospital Quirón, Madrid, Spain; §§ Pfizer Oncology, Madrid, Spain; ¶¶ Statistics Department, Instituto de Investigación Sanitaria del Hospital Universitario La Paz (IdiPAZ), Madrid, Spain; ## Medical Oncology Department, Hospital Universitario La Paz, Madrid, Spain Abstract Anti-angiogenic therapy benefits many patients with advanced renal cell carcinoma (RCC), but there is still a need for predictive markers that help in selecting the best therapy for individual patients. MicroRNAs (miRNAs) regulate cancer cell behavior and may be attractive biomarkers for prognosis and prediction of response. Forty-four patients with RCC were recruited into this observational prospective study conducted in nine Spanish institutions. Peripheral blood Abbreviations: MSKCC, Memorial Sloan-Kettering Cancer Center; RCC, renal cell carcinoma; miRNAs, microRNAs Address all correspondence to: Enrique Espinosa Arranz, MD, Servicio de Oncología Médica, Hospital de Día 1 a Planta, Instituto de Investigación Sanitaria del Hospital Universitario La Paz (IdiPAZ), Paseo de la Castellana, 261-28046 Madrid, Spain. E-mail: [email protected] or Juan Ángel Fresno Vara, PhD, Instituto de Genética Médica y Molecular (INGEMM), Instituto de Investigación Sanitaria del Hospital Universitario La Paz (IdiPAZ), Paseo de la Castellana, 261-28046 Madrid, Spain. E-mail: [email protected] 1 This study was supported by an unrestricted educational grant from Pfizer. The funders had no role in study design, data analysis, decision to publish, or preparation of the manuscript. This research was also supported by grants FIS CP05/00248 and Red Temática de Investigación Cooperativa en Cáncer (RTICC, RD06-0020-1022) from Instituto de Salud Carlos III, Ministerio de Ciencia e Innovación, Spain. I.S.-N. is supported by Fundación para la Investigación Biomédica del Hospital Universitario La Paz (FIBHULP). M.V.B. is an employee of Pfizer Oncology in Spain. All other authors state that they have no conflicts of interest for this study. Some results contained in this work were presented as a poster at the European Society for Medical Oncology (ESMO, Stockholm, Sweden; September 2011) and the Sociedad Española de Oncología Médica (SEOM, Málaga, Spain; October 2011). 2 This article refers to supplementary materials, which are designated by Appendix Materials, Tables W1 to W4 and Figures W1 to W7 and are available online at www.neoplasia.com. 3 These authors have contributed equally to this manuscript. Received 27 April 2012; Revised 10 October 2012; Accepted 12 October 2012 Copyright © 2012 Neoplasia Press, Inc. All rights reserved 1522-8002/12/$25.00 DOI 10.1593/neo.12734 www.neoplasia.com Volume 14 Number 12 December 2012 pp. 1144–1152 1144
-
Upload
enrique-espinosa -
Category
Documents
-
view
215 -
download
3
Transcript of MicroRNA Expression Profiling of Peripheral Blood Samples Predicts Resistance to First-line...

MicroRNA Expression Profilingof Peripheral Blood SamplesPredicts Resistance to First-lineSunitinib in Advanced RenalCell Carcinoma Patients1,2
Angelo Gámez-Pozo*, Luis M. Antón-Aparicio†,Cristina Bayona‡,3, Pablo Borrega§,3,María I. Gallegos Sancho¶,3,Rocío García-Domínguez#,3, Teresa de Portugal**,3,Manuel Ramos-Vázquez††,3, Ramón Pérez-Carrión‡‡,María V. Bolós§§, Rosario Madero¶¶,Iker Sánchez-Navarro*, Juan A. Fresno Vara*and Enrique Espinosa Arranz*,##
*Laboratory of Molecular Oncology and Pathology, Institutode Genética Médica y Molecular (INGEMM), Instituto deInvestigación Sanitaria del Hospital Universitario La Paz(IdiPAZ), Madrid, Spain; †Medical Oncology Department,La Coruña University Hospital, Servicio Galego de Saúde(SERGAS), La Coruña, Spain; ‡Oncology Department,Hospital General Yagüe, Burgos, Spain; §Medical OncologyDepartment, Hospital de San Pedro de Alcántara, Cáceres,Spain; ¶Medical Oncology Department, Hospital General deSegovia, Segovia, Spain; #Medical Oncology Department,Hospital Universitario de Salamanca, Salamanca, Spain;**Medical Oncology Department, Hospital Virgen de laConcha, Complejo Hospitalario de Zamora, Zamora, Spain;††Medical Oncology Department, Centro Oncológico deGalicia, A Coruña, Spain; ‡‡Oncology Department, HospitalQuirón, Madrid, Spain; §§Pfizer Oncology, Madrid, Spain;¶¶Statistics Department, Instituto de Investigación Sanitariadel Hospital Universitario La Paz (IdiPAZ), Madrid, Spain;##Medical Oncology Department, Hospital UniversitarioLa Paz, Madrid, Spain
AbstractAnti-angiogenic therapy benefits many patients with advanced renal cell carcinoma (RCC), but there is still a need forpredictive markers that help in selecting the best therapy for individual patients. MicroRNAs (miRNAs) regulate cancercell behavior and may be attractive biomarkers for prognosis and prediction of response. Forty-four patients with RCCwere recruited into this observational prospective study conducted in nine Spanish institutions. Peripheral blood
Abbreviations: MSKCC, Memorial Sloan-Kettering Cancer Center; RCC, renal cell carcinoma; miRNAs, microRNAsAddress all correspondence to: Enrique Espinosa Arranz, MD, Servicio de Oncología Médica, Hospital de Día 1a Planta, Instituto de Investigación Sanitaria del Hospital UniversitarioLa Paz (IdiPAZ), Paseo de la Castellana, 261-28046 Madrid, Spain. E-mail: [email protected] or Juan Ángel Fresno Vara, PhD, Instituto de Genética Médica y Molecular(INGEMM), Instituto de Investigación Sanitaria del Hospital Universitario La Paz (IdiPAZ), Paseo de la Castellana, 261-28046 Madrid, Spain. E-mail: [email protected] study was supported by an unrestricted educational grant from Pfizer. The funders had no role in study design, data analysis, decision to publish, or preparation of themanuscript. This research was also supported by grants FIS CP05/00248 and Red Temática de Investigación Cooperativa en Cáncer (RTICC, RD06-0020-1022) from Institutode Salud Carlos III, Ministerio de Ciencia e Innovación, Spain. I.S.-N. is supported by Fundación para la Investigación Biomédica del Hospital Universitario La Paz (FIBHULP).M.V.B. is an employee of Pfizer Oncology in Spain. All other authors state that they have no conflicts of interest for this study. Some results contained in this work were presented as aposter at the European Society for Medical Oncology (ESMO, Stockholm, Sweden; September 2011) and the Sociedad Española de Oncología Médica (SEOM, Málaga, Spain;October 2011).2This article refers to supplementary materials, which are designated by Appendix Materials, Tables W1 toW4 and Figures W1 toW7 and are available online at www.neoplasia.com.3These authors have contributed equally to this manuscript.Received 27 April 2012; Revised 10 October 2012; Accepted 12 October 2012
Copyright © 2012 Neoplasia Press, Inc. All rights reserved 1522-8002/12/$25.00DOI 10.1593/neo.12734
www.neoplasia.com
Volume 14 Number 12 December 2012 pp. 1144–1152 1144

samples were taken before initiation of therapy and 14 days later in patients receiving first-line therapy with sunitinibfor advanced RCC. miRNA expression in peripheral blood was assessed using microarrays and L2 boosting wasapplied to filtered miRNA expression data. Several models predicting poor and prolonged response to sunitinib wereconstructed and evaluated by binary logistic regression. Blood samples from 38 patients and 287 miRNAs were eval-uated. Twenty-eight miRNAs of the 287 were related to poor response and 23 of the 287 were related to prolongedresponse to sunitinib treatment. Predictive models identified populations with differences in the established endpoints. In the poor response group, median time to progression was 3.5 months and the overall survival was 8.5,whereas in the prolonged response group these values were 24 and 29.5 months, respectively. Ontology analysespointed out to cancer-related pathways, such angiogenesis and apoptosis. miRNA expression signatures, measuredin peripheral blood, may stratify patients with advanced RCC according to their response to first-line therapy withsunitinib, improving diagnostic accuracy. After proper validation, these signatures could be used to tailor therapy inthis setting.
Neoplasia (2012) 14, 1144–1152
IntroductionRenal cell carcinoma (RCC) accounts for 3% of all malignant tumorsand affects more than 12,000 people every year in the United States[1]. Most patients with localized disease can be cured with surgery,but less than 20% of patients with advanced disease remain alive at5 years [2,3]. Anti-angiogenic therapy has revolutionized therapy formetastatic disease, so that life expectancy has risen from 13 to 15 monthsin the year 2002 to 26 months nowadays [4–6]. Available options forfirst-line therapy include sunitinib [7], pazopanib [8], and the combi-nation of interferon plus bevacizumab [9,10], as well as temsirolimusfor poor prognosis patients [11].Although most patients benefit from new drugs, some still have
early progression [11–29% of patients treated with vascular endothelialgrowth factor (VEGF) target therapy exhibit progressive disease (PD) asbest response] and suffer unnecessary toxicity. For this reason, recentstudies have focused on the identification of factors that predict drugresponse [12,13]. These studies have analyzed a limited number ofmarkers and their results can be considered preliminary, so furtherrefinement is needed in the field.MicroRNAs (miRNAs) are a class of small noncoding RNAs that
control gene expression by targeting mRNA [14]. miRNAs play animportant role as regulators of gene expression in tumorigenesis bycontrolling many biologic processes in growth, development, differen-tiation, and apoptosis. miRNA expression profiles have been suggestedas a promising new class of biomarkers for tumor diagnosis [15–17],prognosis [18], and prediction of response to different drugs [19]. Pre-dictive markers are particularly interesting to optimize therapy. In thepresent study, we assessed miRNA expression in peripheral blood ofpatients receiving sunitinib for advanced RCC, estimating diagnosticaccuracy of these miRNAs in the prediction of sunitinib response.
Materials and Methods
Patient SelectionEligible patients were 18 years old or above, with a pathologically
confirmed diagnosis of RCC, having locally or distant advanced dis-ease who has not received any systemic treatment for kidney cancer,including cytokines, and who were scheduled for sunitinib in a daily
practice setting. Peripheral blood samples were taken before initiationof therapy and 2 weeks later. Eligible patients should remain at least14 days on therapy to be considered for analysis. This study wasapproved by an Institutional Ethics Review Board, and written andsigned consent was obtained in all cases.
Study DesignPatients were prospectively entered into this multiinstitutional
SUT-IIG9 study performed in nine Spanish Hospitals. Drug schedule,policy for dose reductions or dose delay, and timing for radiologicassessments were made in accordance with current, local practice guide-lines. Demographic and clinical data were recorded on specific caserecord forms and periodically reviewed by an external monitor. Sam-ples were anonymized and molecular analysis was performed blindedto clinical data. Study recruitment started on 26 November 2007and finished on 17 September 2010, and the database was closed forfollow-up on 17 May 2011. The authors designed the study, analyzedand held the data, wrote the manuscript, made the decision to submitthe manuscript for publication, and vouch for the accuracy and com-pleteness of the data and analyses. Prospective diagnostic study was ac-cording to Standards for Reporting of Diagnostic Accuracy guidelines.
Total RNA ExtractionLeukocytes were captured using the LeukoLOCK System and stabi-
lized using RNAlater (Ambion, Life Technologies, Carlsbad, CA). TotalRNA was extracted with the miRNeasy Mini Kit (Qiagen, Hilden,Germany) following the manufacturer’s protocol. Purified RNA qualitycontrol for quantity and purity was assessed using an ND-1000 Nano-Drop spectrophotometer (NanoDrop Technologies, Wilmington, DE).
miRNA ArraysSamples were hybridized to Human miRNA Microarray Release
14.0, 8x15K (Agilent Technologies, Santa Clara, CA). MicroRNALabeling Kit (Agilent Technologies) was used to label RNA. Basically,100 ng of total RNA was dephosphorylated and cyanine 3–cytidinebiphosphate (pCp) molecule was ligated to the 3′ end of each RNAmolecule by using T4 RNA ligase. One hundred nanograms of cyanine3–labeled RNA was hybridized for 20 hours at 55°C in a hybridization
Neoplasia Vol. 14, No. 12, 2012 miRNA Profiling Predicts Sunitinib Resistance Gámez-Pozo et al. 1145

oven (G2545A; Agilent Technologies) set to 20 rpm in a final concen-tration of 1× GE blocking agent and 1× Hi-RPM hybridization buffer,according to the manufacturer’s instructions (miRNA MicroarraySystem Protocol; Agilent Technologies). Arrays were washed accordingto the manufacturer’s instructions (miRNA Microarray System Proto-col; Agilent Technologies), dried out using a centrifuge at 1000 rpmfor 2 minutes, and scanned at 5-μm resolution on an Agilent DNAMicroarray Scanner (G2565BA; Agilent Technologies) equipped withextended dynamic range (XDR) software. Images provided by thescanner were analyzed using Agilent’s software Feature Extractionversion 10.7.3.1. Data were normalized using Variance StabilizationNormalization [20]. Only miRNAs with an average intensity overthe 20th percentile of the overall intensities, a detectable signal in atleast 15 of the 76 samples hybridized, and a normalized mean expres-sion of more than 0.9 were considered for further analysis.
Predictive ModelsPredictive models were built independently for poor response and
prolonged response. L2 boosting for classification with classic Akaikeinformation criterion (AIC) based on the binomial log likelihood forstopping the boosting iteration algorithmwas applied to filtered miRNAexpression data obtained from basal blood samples [21] to identify vari-ables related to clinical information. Twelve predictive models for one,two, three, or four variables were built using a binary logistic regressionwith the Fisher scoring as an optimization technique. Predictive accu-racy for calibration was assessed by the Hosmer-Lemeshow test [22].Discriminant power was evaluated by area under the receiver operatingcharacteristic (ROC) curve (AUC) of data training and leave-one-outcross-validated (LOOCV) ROC curves and C index [23]. A cutoff of 0was used for every model. A subgroup analysis according to MemorialSloan-Kettering Cancer Center (MSKCC) prognostic scale was per-formed. One point was assigned for diagnosis-to-treatment interval <1 year, Karnofsky performance status (KPS) < 80, low hemoglobin,elevated serum calcium, elevated lactate dehydrogenase (LDH) 1.5 timesthe upper limit of normal; zero points constituting the favorable prog-nosis group, one or two points the intermediate prognosis group, andthree or more points the poor prognosis group [24].
Statistical AnalysesWe defined progression-free survival (PFS) as the time between the
first day of treatment with sunitinib and the date of radiologic PD,clear clinical evidence of PD, or death. Patients who had not prog-ressed at database closure were censored at final follow-up. If the dateof PD was unknown, we censored PFS at the last tumor assessment.Overall survival (OS) was defined as the time between the first day ofsunitinib treatment and the date of death or last date of follow-up.Objective response was assessed by physicians, according to responseevaluation criteria in solid tumors (RECIST), and classified as com-plete response, partial response, stable disease, or PD. Normalizedexpression values and fold change values were assessed by nonpara-metric tests: the Wilcoxon test to compare two paired groups, theMann-Whitney test to compare two unpaired groups, and the Kruskall-Wallis test to compare three unmatched groups. Survival curves wereestimated using Kaplan-Meier analysis and compared using the log-ranktest. The primary end point was time to disease progression, defined as thetime from start of therapy until the time of documented radiologic pro-gression of the disease, clear clinical progression of the disease, or deathfrom cancer. OS was calculated from the start of therapy until the dateof death or last follow-up. All statistical analyses were performed using
SAS 9.1 and R(4) with “rdesign” and “mboost” packages. The relation-ship between OS, the MSKCC prognostic profile, and the poorresponse models was analyzed using the log-rank test and the Coxproportional hazards model. All tests were two-sided.
Model Validation Using Reverse Transcription–QuantitativePolymerase Chain Reaction
Expressions from miRNAs included in poor response model 3.3 andprolonged response model 3.2 were evaluated using reverse transcription–quantitative polymerase chain reaction (RT-qPCR). cDNA synthesisand real-time qPCR of miR-192, miR-193a-5p, miR-501-3p, miR-410, miR-1181, and miR-424 were performed using the miRCURYLNA Universal RT microRNA PCR system (Exiqon, Vedbaek,Denmark) according to the manufacturer’s instructions. The cDNA
Table 1. Clinical Data.
Number of Patients (%)
GenderMen 27 (71)Women 11 (29)
AgeRange 47–86Median 66
Histologic subtypeClear cell carcinoma 27 (71)Papillary 4 (10)Other 7 (19)
Metastasis locationLung 23 (61)Bone 11 (29)Lymph nodes 17 (45)Other 13 (34)
Best responseComplete 7 (19)Partial 10 (26)Stable 10 (26)Progression 11 (29)
MSKCC prognostic criteriaGood 3 (8)Intermediate 26 (68)Bad 9 (24)
ECOG performance status0 21 (55)1 13 (34)2 3 (8)ND 1 (3)
Prior nephrectomyYes 28 (74)No 10 (26)
Time from diagnosis to treatment≥1 year 14 (37)<1 year 24 (63)
No. of metastatic sites≤1 14 (37)<2 16 (42)≥3 8 (21)
Hemoglobin≥LLN 19 (50)<LLN 18 (47)ND 1 (3)
LDH≤1.5 × ULN 23 (60)>1.5 × ULN 14 (37)ND 1 (3)
Corrected calcium (mg/dl)≤10 30 (78)>10 4 (11)ND 4 (11)
ECOG, Eastern Cooperative Oncology Group; LLN, lower limit of normal; LDH, lactate dehydro-genase; ULN, upper limit of normal; ND, not described.
1146 miRNA Profiling Predicts Sunitinib Resistance Gámez-Pozo et al. Neoplasia Vol. 14, No. 12, 2012

products were subsequently diluted 80-fold, and 4 μl was used in 10 μlof PCR reactions and quantified using SYBR Green–based real-timePCR and individual miRNA LNA primer sets. The qPCRs were runon a 7900HT thermocycler (ABI; Applied Biosystems, Life Technolo-gies, Carlsbad, CA) using the thermal cycling parameters recommendedby Exiqon. Raw C t values were calculated as recommended by Exiqonusing the RQ manager software v1.2.1 (ABI) with manual settings forthreshold and baseline. Relative expression level of each target gene wasexpressed as ΔCq = Cqref − Cqtarget. Normalization was performed us-ing the mean expression value of two housekeeping miRNAs (mi-103and miR-191). As predictive models for poor response and prolongedresponse were defined using microarrays, normalized gene Cq valueswere z-score transformed and scaled as previously described [25].
Analysis of miRNA TargetsValidated targets of miRNAs related with sunitinib response were
evaluated using the Validated Target module of miRWalk [26]. Geneontology analyses including pathways, biologic process, and molecularfunctions of identified genes were performed in PANTHER [27,28].miRNA expression in kidney samples was assessed using availabledata [29].This work fulfills the Standards for Reporting of Diagnostic Accuracy
recommendations.
ResultsAt the moment of the molecular analysis, 44 consecutive patientswere included in the study. Two of them were lost to follow-up with-out response evaluation, three did not have the second blood sample,and one died before receiving the study drug. Table 1 provides clinical
data of the remaining 38 patients. Twelve patients had a progressionbefore 6 months and constitute the poor response group; 10 patientsdid not have a progression in the first 18 months and were included inthe prolonged response group, whereas 16 patients were allocated tothe moderate response group. Cutoff point at 6 months was chosenbecause this was the median time to progression of the control groupin the pivotal phase III trial of sunitinib [6].
miRNAs Related with Response to Sunitinib TreatmentPeripheral blood samples obtained before initiation of therapy
with sunitinib and 14 days later were used to assess expression valuesof miRNAs. After data filtering, 287 of 939 miRNAs were consid-ered for subsequent analysis. The data discussed in this publicationhave been deposited in the National Center for Biotechnology Infor-mation’s Gene Expression Omnibus and are accessible through GeneExpression Omnibus Series accession number GSE32099 [30]. Com-parison of the poor response and response groups found significantdifferences in the expressions of 28 miRNAs of the 287 evaluatedwhen L2 boosting was applied to filtered miRNA expression dataobtained from basal blood. Additionally, L2 boosting identified 28variables related to prolonged response to sunitinib. Fourteen of thesevariables corresponded to miRNAs found in the basal blood sam-ples, four of them were detected in day 14 blood samples, and theremaining 10 variables corresponded to significant changes in miRNAexpression between basal and day 14 samples (Table 3).
Predictive Models for Poor Response to SunitinibTwelve predictive signatures of poor response to sunitinib were built
using a binary logistic procedure. The Hosmer-Lemeshow test showedadequate calibration accuracy for all signatures. Discriminant power
Table 2. Twenty-eight miRNAs Related to Response of Sunitinib, Identified by L2 Boosting from the 287 miRNA Basal Expression Values Evaluated.
miRNA BoostingCoefficient
4.1 4.2 4.3 3.1 3.2 3.3 2.1 2.2 2.3 1.1 1.2 1.3
hiv1-miR-H1 0.0181hsa-miR-125a-5p 0.0167 xhsa-miR-1308 −0.0385hsa-miR-139-3p 0.0343 xhsa-miR-141 0.0195hsa-miR-145 0.0133hsa-miR-150 0.0173hsa-miR-181a* −0.0703 x x x x xhsa-miR-1825 −0.0988hsa-miR-192 −0.0045 x x xhsa-miR-193a-3p −0.0279 xhsa-miR-193a-5p −0.0558hsa-miR-199a-5p −0.0565hsa-miR-29a 0.0196hsa-miR-30b* 0.0743 xhsa-miR-31 0.0060hsa-miR-34a −0.0531 x xhsa-miR-362-3p 0.0105 x xhsa-miR-370 0.0138hsa-miR-501-3p 0.0554 x x x x x x xhsa-miR-505* −0.1370 x x xhsa-miR-516a-5p 0.0369 x xhsa-miR-564 0.0089 xhsa-miR-582-5p 0.0037 xhsa-miR-624* −0.0043hsa-miR-629 −0.0017hsa-miR-659 0.0184hsa-miR-933 0.0443
Twelve predictive models were established; x indicates that miRNA is included in the model.
Neoplasia Vol. 14, No. 12, 2012 miRNA Profiling Predicts Sunitinib Resistance Gámez-Pozo et al. 1147

of the predictive signatures was assessed using different criteria (Fig-ure W1). Complete analyses can be found in the SupplementaryMaterials. Signatures with two or more miRNAs had better discrimina-tive power than single mRNAs. Table 2 shows the miRNAs includedin each predictor. Figure 1 displays expression values of some miRNAsincluded in models that predicted a poor response to sunitinib.Six-month PFS was 85% for patients included in the response groupby, at least, four signatures and 20% for patients in the poor re-sponse group (Figure 1 and Tables 3 and W1). In the poor responsegroup, median time to progression was 3.5 months and the OS was8.5 months, whereas in the prolonged response group these valueswere 14 and 24 months, respectively.
Predictive Models for Prolonged Response to SunitinibTwelve predictive signatures of prolonged response to sunitinib
were built. Models with more than one miRNA harbor more dis-criminative power than just one miRNA (Figure W2). Completeanalyses can be found in the Supplementary Materials. Figure 2 dis-plays expression values of some miRNAs included in models thatpredicted a prolonged response. Eighteen-month PFS was 90% forpatients included in the prolonged response group by, at least, fivesignatures and 6.67% for patients in the moderate response group(Figure 2 and Table W1). In the moderate response group, mediantime to progression was 11 months and the OS was 23 months,
whereas in the prolonged response group these values were 24 and29.5 months, respectively.
Predictive Model ValidationExpressions from miRNAs included in poor response model 3.3
and prolonged response model 3.2 were evaluated using RT-qPCRin 37 of 38 patients with available RNA (Table W4). Despite plat-form change (from microarrays to RT-qPCR), both poor responsemodel 3.3 and prolonged response model 3.2 still harbor predictivepower (Figure W7).
OS PredictionMSKCC prognostic scale was calculated for each patient [31]. The
proportion of patients in the favorable, intermediate, and poorgroups was 8%, 68%, and 24%, respectively. There were no statis-tical differences in OS between the groups (P = .972). There was norelation between the MSKCC prognosis profile and OS in the uni-variate analysis (P = .935). Poor response model 3.3, which showedbest statistical significance, assigned 11 and 27 patients to the poor re-sponse and response groups, respectively. Hazard ratio (HR) betweengroups was 0.385 [95% confidence interval (95%CI) = 0.161–0.963,P = .032]. The multivariate analysis demonstrated that the poorresponse model 3.3 was related to OS (HR = 0.463, IC95 = 0.219–0.979, P = .044) but not the MSKCC prognostic profile (P = .897).
Figure 1. (A) Kaplan-Meier analyses, (B) ROC curves for model and LOOCV, and (C) expression of miRNAs included in the poor responsemodel 3.3.
1148 miRNA Profiling Predicts Sunitinib Resistance Gámez-Pozo et al. Neoplasia Vol. 14, No. 12, 2012

Gene Ontology and Metadata AnalysesAn overview of genes regulated by miRNAs included in poor re-
sponse and prolonged response models was obtained using the Val-idated Target module of miRWalk (Table W2). Gene ontologyanalyses of these genes were performed using PANTHER database.Most genes target cancer-related pathways such as angiogenesis, p53,Ras, PDGF, apoptosis, and so on (Figure W3). There is also an in-creased presence of metabolism and signal transduction–related genes(Table W3, online only). Poor response model 3.3 miRNAs (miR-192, miR-193a-5p, miR-501-3p) and prolonged response model 3.2miRNAs (miR-410 before treatment and miR-1181 and miR-424*fold change) target genes related with KEGG Renal Cell Carcinomapathway (Figures W4 and W5 and Table W2). The presence ofmiR-192 and miR-193-5p in normal and tumor kidney sampleswas confirmed using previously available data (Figure W6) [29].
DiscussionIn the present study, the expression of miRNA in the peripheral bloodof patients receiving sunitinib for advanced RCC was explored. Wecombined expression values of several miRNAs to build models relatedto poor response (progression before 6 months) or prolonged response(progression after 18 months) to this drug. The poor response group isparticularly relevant from the clinical point of view, because it might helpin identifying patients towhom alternative or even experimental therapiesshould be offered.Most promising models were validated using RT-qPCR. Despite
the platform change (from microarrays to qPCR), both poor response3.3 and prolonged response 3.2 models maintained predictive power(Figure W7). This is remarkable, as long as low inter-platform re-
producibility among different miRNA platforms has been previouslyreported [32].
Previous studies have found markers that predict a response tosunitinib in patients with advanced RCC. Hypertension is associatedwith improved outcome [33], whereas the presence of bone metastasesor high tumor burden has a negative impact on survival [34,35]. Somestudies have focused onmolecular biomarkers of response. For instance,strong expression of VEGF receptor 2 is associated with increased PFS[36], and serum levels of VEGF are related to PD and OS prognosis[37–39]. Other markers such as the level of circulating bone marrow–derived progenitor cells [40], the number of circulating endothelial cells[41], and the levels of brain natriuretic peptide, apolipoprotein A2(ApoA2), and serum amyloid alpha (SSA) have been reported to affectthe outcome in this population [42]. Finally, polymorphisms inCYP3A5, NR113, and ABCB1 (genes affecting the pharmacokineticsof sunitinib) are associated with PFS [43].
Information about the role of miRNAs is more limited in this field.A number of studies link miRNAs with cancer, as they regulate tran-scription factors and can eventually alter apoptosis, cell cycle, and cellmigration [15]. miRNA expression patterns vary between clear cellcarcinoma and normal kidney [15–17,44], among tumors of differentanatomic location and also among multiple tumor subtypes within asingle location [45]. miRNA patterns can distinguish between renalcancer subtypes [46] and have been found to correlate with prognosisin patients with RCC [45,47]. It has been suggested that miRNA-106bmight be used to predict early metastasis after nephrectomy [48]. Withregard to sunitinib, the drug has effects on miRNA expression in micemodels [49].
There are previous studies of gene expression [50,51] and miRNA[52] profiling in peripheral blood of patients with RCC. Our study is
Table 3. Twenty-eight Variables Related to Prolonged Response to Sunitinib Treatment Identified by L2 Boosting from 287 miRNA Basal Expression, miRNA after Treatment Expression, and miRNAFold Change.
miRNA Sample Boosting Coefficient 4.1 4.2 4.3 3.1 3.2 3.3 2.1 2.2 2.3 1.1 1.2 1.3
hsa-miR-1228 Basal −0.1594 x xhsa-miR-1267 Basal 0.0136hsa-miR-1290 Basal −0.1408 x xhsa-miR-136 Basal 0.0635 x xhsa-miR-199a-3p Basal −0.0248hsa-miR-199a-5p Basal −0.0033hsa-miR-221 Basal −0.0999 xhsa-miR-31 Basal 0.0336 xhsa-miR-34a Basal −0.0877 x xhsa-miR-371-5p Basal 0.0060hsa-miR-376a Basal 0.0037 xhsa-miR-410 Basal 0.0277 x x xhsa-miR-659 Basal 0.0112hsa-miR-923 Basal −0.0263hsa-miR-1274a After −0.0262 x x xhsa-miR-193a-5p After −0.0542hsa-miR-31 After 0.0360 xhsa-miR-99b After −0.0173hsa-miR-1181 Change −0.0227 x x x xhsa-miR-126* Change −0.0136 xhsa-miR-1267 Change 0.0015hsa-miR-193a-5p Change 0.0037 xhsa-miR-198 Change −0.0250 xhsa-miR-410 Change 0.0053hsa-miR-424* Change −0.0367 x x x x xhsa-miR-564 Change −0.0061hsa-miR-630 Change −0.0054hsa-miR-659 Change 0.0036
Twelve predictive models were established; x indicates that miRNA is included in the model.
Neoplasia Vol. 14, No. 12, 2012 miRNA Profiling Predicts Sunitinib Resistance Gámez-Pozo et al. 1149

the first that assess the expression of miRNAs in this tissue to predictresponse to sunitinib. Although we did not assess the expression of thesemiRNAs in primary tumors, some of them are detectable in both nor-mal and tumor kidneys according to the literature (Figure W6) [29].
Taken together, the aberrant expression of the miRNAs in theperipheral lymphocytes or monocytes of advanced RCC patients could,to some extent, reflect the sensitivity to sunitinib therapy, which iscompatible with the predicted canonical pathways for these miRNAs,including angiogenesis, apoptosis, p53, Ras, and so on. Additionally,some of the targeted genes are directly related with the genesis anddevelopment of RCC (Figures W4 and W5). In any case, more studiesare needed to elucidate if changes in peripheral blood miRNA expres-sion have any relation with tumor susceptibility or simply reflect hostfeatures affecting drug efficacy.
Our predictive model was also related to OS, which could be ex-pected considering that patients with no response to first-line therapyhave very limited therapeutic options. The MSKCC prognostic scaledid not detect OS differences in our population, as it has been shownpreviously [53], because most patients had a good performance status,which is a major determinant of prognosis.
Limited size is an obvious limitation in our series, which could haveled tomodel overfitting.Moreover, an independent validation is needed,because miRNAs may vary depending on the population used forthe discovery phase. Regardless of these limitations, our point was todemonstrate that a small subset of miRNAs could be informative in
peripheral blood. miRNA field is under development, so significantadvances are likely to happen in the near future.
Considering the number of available options, treatment recom-mendations for advanced RCC must be adapted and tailored to eachindividual patient. Peripheral blood offers a noninvasive alternative toassess predictive markers. miRNA expression profiling in peripheralblood may identify patients that will not benefit from sunitinib therapybefore treatment. These patients should receive an alternative fist-linetherapy or even be included in clinical trials. However, miRNA expres-sion profiling identified patients with moderate benefit of sunitinibtherapy. This population is suitable to explore new therapeutic com-binations including sunitinib.
In conclusion, peripheral blood miRNA signatures could be em-ployed to personalize therapy for advanced RCC, both in the selectionof existing drugs and in the development of new drugs.
AcknowledgmentsWe thank Julia Llinares for her contribution to data monitoring andcollection, Ana Dopazo and Alberto Benguría (Genomics Unit, CentroNacional de Investigaciones Cardiovasculares) for their technical sup-port in microarray analyses, Fátima Sánchez Cabo (BioinformaticsUnit, Centro Nacional de Investigaciones Cardiovasculares) for Vari-ance Stabilization Normalization of microarray data, and Rocío López,Esther Díaz, and María Miguel-Martín for technical support.
Figure 2. (A) Kaplan-Meier analyses, (B) ROC curves for model and LOOCV, and (C) expression of miRNAs included in the prolongedresponse model 3.2. b indicates miRNA basal expression. c indicates fold change between basal and day 14 samples.
1150 miRNA Profiling Predicts Sunitinib Resistance Gámez-Pozo et al. Neoplasia Vol. 14, No. 12, 2012
References[1] Cohen HT and McGovern FJ (2005). Renal-cell carcinoma. N Engl J Med 353,
2477–2490.[2] Flanigan RC, Mickisch G, Sylvester R, Tangen C, Van Poppel H, and Crawford
ED (2004). Cytoreductive nephrectomy in patients with metastatic renal cancer:a combined analysis. J Urol 171, 1071–1076.
[3] Kavolius JP, Mastorakos DP, Pavlovich C, Russo P, Burt ME, and Brady MS(1998). Resection of metastatic renal cell carcinoma. J Clin Oncol 16, 2261–2266.
[4] Motzer RJ, Bacik J, Murphy BA, Russo P, and Mazumdar M (2002). Interferon-alfa as a comparative treatment for clinical trials of new therapies against advancedrenal cell carcinoma. J Clin Oncol 20, 289–296.
[5] Negrier S, Escudier B, Gomez F, Douillard JY, Ravaud A, Chevreau C, BuclonM,Perol D, and Lasset C (2002). Prognostic factors of survival and rapid progressionin 782 patients with metastatic renal carcinomas treated by cytokines: a reportfrom the Groupe Français d’Immunothérapie. Ann Oncol 13, 1460–1468.
[6] Motzer RJ, Hutson TE, Tomczak P, Michaelson MD, Bukowski RM, Oudard S,Negrier S, Szczylik C, Pili R, Bjarnason GA, et al. (2009). Overall survivaland updated results for sunitinib compared with interferon alfa in patients withmetastatic renal cell carcinoma. J Clin Oncol 27, 3584–3590.
[7] Motzer RJ, Hutson TE, Tomczak P, Michaelson MD, Bukowski RM, Rixe O,Oudard S, Negrier S, Szczylik C, Kim ST, et al. (2007). Sunitinib versus interferonalfa in metastatic renal-cell carcinoma. N Engl J Med 356, 115–124.
[8] SternbergCN,Davis ID,Mardiak J, SzczylikC,LeeE,Wagstaff J, BarriosCH,SalmanP,GladkovOA,KavinaA, et al. (2010). Pazopanib in locally advanced ormetastatic renalcell carcinoma: results of a randomized phase III trial. J Clin Oncol 28, 1061–1068.
[9] Escudier B, Pluzanska A, Koralewski P, Ravaud A, Bracarda S, Szczylik C,Chevreau C, Filipek M, Melichar B, Bajetta E, et al. (2007). Bevacizumab plusinterferon alfa-2a for treatment of metastatic renal cell carcinoma: a randomised,double-blind phase III trial. Lancet 370, 2103–2111.
[10] Rini BI, Halabi S, Rosenberg JE, Stadler WM, Vaena DA, Ou SS, Archer L,Atkins JN, Picus J, Czaykowski P, et al. (2008). Bevacizumab plus interferonalfa compared with interferon alfa monotherapy in patients with metastatic renalcell carcinoma: CALGB 90206. J Clin Oncol 26, 5422–5428.
[11] Hudes G, Carducci M, Tomczak P, Dutcher J, Figlin R, Kapoor A, StaroslawskaE, Sosman J, McDermott D, Bodrogi I, et al. (2007). Temsirolimus, interferonalfa, or both for advanced renal-cell carcinoma. N Engl J Med 356, 2271–2281.
[12] Jain RK, Duda DG, Willett CG, Sahani DV, Zhu AX, Loeffler JS, Batchelor TT,and Sorensen AG (2009). Biomarkers of response and resistance to antiangiogenictherapy. Nat Rev Clin Oncol 6, 327–338.
[13] Tonini G, Fratto ME, Imperatori M, Pantano F, Vincenzi B, and Santini D(2011). Predictive factors of response to treatment in patients with metastatic renalcell carcinoma: new evidence. Expert Rev Anticancer Ther 11, 921–930.
[14] Iorio MV and Croce CM (2009). MicroRNAs in cancer: small molecules with ahuge impact. J Clin Oncol 27, 5848–5856.
[15] Chow TF, Youssef YM, Lianidou E, Romaschin AD, Honey RJ, Stewart R, Pace KT,and Yousef GM (2010). Differential expression profiling of microRNAs and theirpotential involvement in renal cell carcinoma pathogenesis.Clin Biochem 43, 150–158.
[16] Gottardo F, Liu CG, Ferracin M, Calin GA, Fassan M, Bassi P, Sevignani C,Byrne D, Negrini M, Pagano F, et al. (2007). Micro-RNA profiling in kidneyand bladder cancers. Urol Oncol 25, 387–392.
[17] Jung M, Mollenkopf HJ, Grimm C, Wagner I, Albrecht M, Waller T, Pilarsky C,Johannsen M, Stephan C, Lehrach H, et al. (2009). MicroRNA profiling of clearcell renal cell cancer identifies a robust signature to define renal malignancy. J CellMol Med 13, 3918–3928.
[18] Heinzelmann J, Henning B, Sanjmyatav J, Posorski N, Steiner T, Wunderlich H,Gajda MR, and Junker K (2011). Specific miRNA signatures are associated withmetastasis and poor prognosis in clear cell renal cell carcinoma.World JUrol 29, 367–373.
[19] Flamant S, Ritchie W, Guilhot J, Holst J, Bonnet ML, Chomel JC, Guilhot F,Turhan AG, and Rasko JE (2010). Micro-RNA response to imatinib mesylatein patients with chronic myeloid leukemia. Haematologica 95, 1325–1333.
[20] Huber W, von Heydebreck A, Sultmann H, Poustka A, and Vingron M (2002).Variance stabilization applied to microarray data calibration and to the quantifi-cation of differential expression. Bioinformatics 18(suppl 1), S96–S104.
[21] Bühlmann P and Hothorn T (2007). Boosting algorithms: regularization, predic-tion and model fitting. Stat Sci 22, 477–505.
[22] Hosmer DW and Lemeshow SA (1980). A goodness-of-fit test for the multiplelogistic regression model. Commun Stat A10, 1043–1069.
[23] Harrell FE Jr, Lee KL, and Mark DB (1996). Multivariable prognostic models:issues in developing models, evaluating assumptions and adequacy, and measuringand reducing errors. Stat Med 15, 361–387.
[24] Mekhail TM, Abou-Jawde RM, Boumerhi G, Malhi S, Wood L, Elson P, andBukowski R (2005). Validation and extension of the Memorial Sloan-Ketteringprognostic factors model for survival in patients with previously untreated meta-static renal cell carcinoma. J Clin Oncol 23, 832–841.
[25] Sanchez-Navarro I, Gamez-Pozo A, Pinto A, Hardisson D, Madero R, Lopez R,San Jose B, Zamora P, Redondo A, Feliu J, et al. (2010). An 8-gene qRT-PCR-based gene expression score that has prognostic value in early breast cancer. BMCCancer 10, 336.
[26] Dweep H, Sticht C, Pandey P, and Gretz N (2011). miRWalk—database: pre-diction of possible miRNA binding sites by “walking” the genes of three genomes.J Biomed Inform 44, 839–847.
[27] Thomas PD, Campbell MJ, Kejariwal A, Mi H, Karlak B, Daverman R, DiemerK, Muruganujan A, and Narechania A (2003). PANTHER: a library of proteinfamilies and subfamilies indexed by function. Genome Res 13, 2129–2141.
[28] Thomas PD, Kejariwal A, Campbell MJ, Mi H, Diemer K, Guo N, Ladunga I,Ulitsky-Lazareva B,Muruganujan A, Rabkin S, et al. (2003). PANTHER: a brows-able database of gene products organized by biological function, using curatedprotein family and subfamily classification. Nucleic Acids Res 31, 334–341.
[29] Lu J, Getz G, Miska EA, Alvarez-Saavedra E, Lamb J, Peck D, Sweet-Cordero A,Ebert BL, Mak RH, Ferrando AA, et al. (2005). MicroRNA expression profilesclassify human cancers. Nature 435, 834–838.
[30] Edgar R, Domrachev M, and Lash AE (2002). Gene expression omnibus: NCBIgene expression and hybridization array data repository. Nucleic Acids Res 30,207–210.
[31] Motzer RJ, Bander NH, and Nanus DM (1996). Renal-cell carcinoma. N Engl JMed 335, 865–875.
[32] Wang B, Howel P, Bruheim S, Ju J, Owen LB, Fodstad O, and Xi Y (2011).Systematic evaluation of three microRNA profiling platforms: microarray, beadsarray, and quantitative real-time PCR array. PLoS One 6, e17167.
[33] Rini BI, Cohen DP, Lu DR, Chen I, Hariharan S, Gore ME, Figlin RA, BaumMS, and Motzer RJ (2011). Hypertension as a biomarker of efficacy in patientswith metastatic renal cell carcinoma treated with sunitinib. J Natl Cancer Inst103, 763–773.
[34] Beuselinck B, Oudard S, Rixe O, Wolter P, Blesius A, Ayllon J, Elaidi R,Schoffski P, Barrascout E, Morel A, et al. (2011). Negative impact of bonemetastasis on outcome in clear-cell renal cell carcinoma treated with sunitinib.Ann Oncol 22, 794–800.
[35] Basappa NS, Elson P, Golshayan AR, Wood L, Garcia JA, Dreicer R, and RiniBI (2011). The impact of tumor burden characteristics in patients with meta-static renal cell carcinoma treated with sunitinib. Cancer 117, 1183–1189.
[36] Terakawa T, Miyake H, Kusuda Y, and Fujisawa M (2011). Expression level ofvascular endothelial growth factor receptor-2 in radical nephrectomy specimensas a prognostic predictor in patients with metastatic renal cell carcinoma treatedwith sunitinib. Urol Oncol. DOI:10.1016/j.urolonc.2011.1002.1012.
[37] Escudier B, Eisen T, Stadler WM, Szczylik C, Oudard S, Staehler M,Negrier S, Chevreau C, Desai AA, Rolland F, et al. (2009). Sorafenib for treat-ment of renal cell carcinoma: final efficacy and safety results of the phase IIItreatment approaches in renal cancer global evaluation trial. J Clin Oncol 27,3312–3318.
[38] Paule B, Bastien L, Deslandes E, Cussenot O, Podgorniak MP, Allory Y, Naimi B,Porcher R, de La Taille A, Menashi S, et al. (2010). Soluble isoforms of vascularendothelial growth factor are predictors of response to sunitinib in metastaticrenal cell carcinomas. PLoS One 5, e10715.
[39] Porta C, Paglino C, De Amici M, Quaglini S, Sacchi L, Imarisio I, andCanipari C (2010). Predictive value of baseline serum vascular endothelial growthfactor and neutrophil gelatinase-associated lipocalin in advanced kidney cancerpatients receiving sunitinib. Kidney Int 77, 809–815.
[40] Farace F, Gross-Goupil M, Tournay E, Taylor M, Vimond N, Jacques N,Billiot F, Mauguen A, Hill C, and Escudier B (2011). Levels of circulatingCD45dimCD34+VEGFR2+ progenitor cells correlate with outcome in metastaticrenal cell carcinoma patients treated with tyrosine kinase inhibitors. Br J Cancer104, 1144–1150.
[41] Gruenwald V, Beutel G, Schuch-Jantsch S, Reuter C, Ivanyi P, Ganser A, andHaubitz M (2011). Circulating endothelial cells are an early predictor in renalcell carcinoma for tumor response to sunitinib. BMC Cancer 10, 695.
[42] Vermaat JS, van der Tweel I, Mehra N, Sleijfer S, Haanen JB, Roodhart JM,Engwegen JY, Korse CM, Langenberg MH, Kruit W, et al. (2010). Two-proteinsignature of novel serological markers apolipoprotein-A2 and serum amyloid alphapredicts prognosis in patients with metastatic renal cell cancer and improves thecurrently used prognostic survival models. Ann Oncol 21, 1472–1481.
Neoplasia Vol. 14, No. 12, 2012 miRNA Profiling Predicts Sunitinib Resistance Gámez-Pozo et al. 1151

[43] van der Veldt AA, Eechoute K, Gelderblom H, Gietema J, Guchelaar HJ, van ErpNP, van den Eertwegh AJ, Haanen JB, Mathijssen RH, and Wessels JA (2011).Genetic polymorphisms associated with a prolonged progression-free survival inpatients with metastatic renal cell cancer treated with sunitinib. Clin Cancer Res17, 620–629.
[44] Weng L, Wu X, Gao H, Mu B, Li X, Wang JH, Guo C, Jin JM, Chen Z,Covarrubias M, et al. (2010). MicroRNA profiling of clear cell renal cell carcinomaby whole-genome small RNA deep sequencing of paired frozen and formalin-fixed, paraffin-embedded tissue specimens. J Pathol 222, 41–51.
[45] Petillo D, Kort EJ, Anema J, Furge KA, Yang XJ, and Teh BT (2009). Micro-RNA profiling of human kidney cancer subtypes. Int J Oncol 35, 109–114.
[46] Youssef YM, White NM, Grigull J, Krizova A, Samy C, Mejia-Guerrero S,Evans A, and Yousef GM (2011). Accurate molecular classification of kidneycancer subtypes using microRNA signature. Eur Urol 59, 721–730.
[47] Lin J, Horikawa Y, Tamboli P, Clague J, Wood CG, and Wu X (2010). Geneticvariations in microRNA-related genes are associated with survival and recurrencein patients with renal cell carcinoma. Carcinogenesis 31, 1805–1812.
[48] Slaby O, Jancovicova J, Lakomy R, Svoboda M, Poprach A, Fabian P, Kren L,Michalek J, and Vyzula R (2010). Expression of miRNA-106b in conventionalrenal cell carcinoma is a potential marker for prediction of early metastasis afternephrectomy. J Exp Clin Cancer Res 29, 90.
[49] Olson P, Lu J, Zhang H, Shai A, Chun MG, Wang Y, Libutti SK, NakakuraEK, Golub TR, and Hanahan D (2009). MicroRNA dynamics in the stages oftumorigenesis correlate with hallmark capabilities of cancer. Genes Dev 23,2152–2165.
[50] Burczynski ME, Twine NC, Dukart G, Marshall B, Hidalgo M, Stadler WM,Logan T, Dutcher J, Hudes G, Trepicchio WL, et al. (2005). Transcriptionalprofiles in peripheral blood mononuclear cells prognostic of clinical out-comes in patients with advanced renal cell carcinoma. Clin Cancer Res 11,1181–1189.
[51] Twine NC, Stover JA, Marshall B, Dukart G, Hidalgo M, Stadler W, Logan T,Dutcher J, Hudes G, Dorner AJ, et al. (2003). Disease-associated expressionprofiles in peripheral blood mononuclear cells from patients with advanced renalcell carcinoma. Cancer Res 63, 6069–6075.
[52] Wulfken LM, Moritz R, Ohlmann C, Holdenrieder S, Jung V, Becker F,Herrmann E, Walgenbach-Brunagel G, von Ruecker A, Muller SC, et al. (2011).MicroRNAs in renal cell carcinoma: diagnostic implications of serum miR-1233levels. PLoS One 6, e25787.
[53] Heng DY, Chi KN, Murray N, Jin T, Garcia JA, Bukowski RM, Rini BI, andKollmannsberger C (2009). A population-based study evaluating the impact ofsunitinib on overall survival in the treatment of patients with metastatic renalcell cancer. Cancer 115, 776–783.
1152 miRNA Profiling Predicts Sunitinib Resistance Gámez-Pozo et al. Neoplasia Vol. 14, No. 12, 2012

Figure W1. Discriminant power of poor response predictive sig-natures. λ, correlation shrinkage intensity; AIC, Akaike informationcriterion; c, Harrell’s bias-corrected concordance index; AUC, areaunder the ROC curve; AUC-LOOCV: leave-one-out cross-validatedarea under the ROC curve. All variables are referred to the righty-axis except for AIC. AUC and c partially overlap.
Table W1. PD-Free Survival in Poor and Prolonged Response Models.
Model %PDFS 6 m PoorR %PDFS 6 m Response HR 95% CI
PoorR 4.1 20 85.7 5.64 1.925–16.54PoorR 4.2 16.6 92.3 2.87 1.14–7.22PoorR 4.3 10 89.3 18.54 5.21–66.01PoorR 3.1 30 82.14 1.89 0.75–4.71PoorR 3.2 33.33 79.31 1.81 0.69–4.73PoorR 3.3 27.27 85.18 2.76 1.11–6.87PoorR 2.1 25 80 3.74 1.24–11.35PoorR 2.2 41.67 80.77 1.65 0.72–3.75PoorR 2.3 16.67 78.12 8.23 1.92–35.13
Model %PDFS 18 m ModR %PDFS 18 m ProR HR 95% CI
ProR 4.1 0 100 16.4 5.34–50.38ProR 4.2 6.67 90 10.47 3.63–30.13ProR 4.3 0 100 16.4 5.34–50.38ProR 3.1 6.67 90 4.66 1.74–12.48ProR 3.2 6.67 90 11.73 3.98–34.51ProR 3.3 13.33 80 9.12 3.09–26.93ProR 2.1 18.75 77.78 3.42 1.33–8.75ProR 2.2 13.33 80 5.05 1.90–13.41ProR 2.3 23.53 75 2.72 1.05–7.03
PDFS, PD-free survival; m, months; PoorR, poor response; ProR, prolonged response; ModR,moderate response; HR, hazard ratio; 95% CI, 95% confidence interval.
Figure W2. Discriminant power of prolonged response predictivesignatures. All variables are referred to the right y-axis except forAIC. AUC and c partially overlap.

Table W2. miRWalk-Validated Genes Targeted by Poor Response and Prolonged Response miRNAs.
miRNA Response Model Gene
hsa-miR-125a-5p Poor CD2, CTNNB1, NBN, FMR1, DICER1, IGF2BP2, COX8A, PRDM1, TNFSF11, CD4, ELA2, ATM, MOV10, CCL5, CTGF, CDKN1A, BCL2, G3BP2,RRBP1, GPI, PCNA, TNRC6B, KLF13, ETS2, PDPN, CTSD, ODZ1, BRCA1, TCF7L2, POLR2K, CDKN2D, LCT, RAB30, EGFR, ERBB2, HSPG2,IGF1R, LIF, TLE1, RB1, LIN28, MDM2, JUNB, ETV4, ERBB3, IGFBP5, FZD7, TP53, MAP2K7, MECP2, ELAVL1, IL10, IGFBP6, RNASEN,SLC9A3R1, BAP1, UBE2N, PCDH8, MAPK3, INS, RHOU, PCAF, USP7, PDGFRB, TLR4, KPNA2, MYC, SOX17, MED6, RCHY1, PSMD2, APC,NR1I2, MRE11A, NTRK3, WNT10A, BCL2L11, CD40LG, MTUS1, AHSA1, ATF1, PEA15, PSMA7, RNASEH2A, BRCA2, IFNA1, RARA
hsa-miR-139-3p Poor SSSCA1, CDC73, ROCK2, RHOD, CDKN1Bhsa-miR-141 Poor ACTG1, AHSA1, AKT1, AKT1, AMACR, ARS2, BMP2, BRD3, C6orf134, CCND1, CCND2, CCNT2, CD79A, CDC25C, CDH1, CDH17, CDKN1B,
CDON, CREB1, CSH1, CSNK1A1, DHH, DLC1, DMTF1, EGF, EIF4E, ERBB4, ETS1, EZH2, FBXW11, FBXW7, FOXA2, FOXC2, FOXE1,FOXF1, FOXL1, FOXP3, FZR1, GLI1, GLI2, GLI3, GPD1, HIF1A, HOXD10, HPRT1, IHH, INHBC, INHBE, JAG2, JUN, JUN, KCNMA1,KIAA0152, KLF5, KLF8, KLK3, LAMC2, LARP6, LOX, MAP2K4, MAP3K10, MAPK14, MAPK9, MAPKAPK5, MET, MYB, MYC, MYCN,NPC1, PARP8, PDCD4, PIK3CA, PLCG1, PLEKHM1, PLUNC, POU3F1, PPIA, PSAT1, PTEN, PTPN12, PTPN13, PTPN14, RAPGEF5, RHOD,RIT2, RPIA, RUNX2, SEMA6A, SFRP1, SFRP1, SFRS2IP, SHH, SIDT1, SIP1, SLC12A1, SLC9A3R2, SMC1A, SNAI1, SNAI2, SNAI3, SOX13,SSSCA1, STK24, STK3, SUFU, SULT2A1, TACSTD1, TBP, TBX2, TCF21, TGFB1, TGFB2, TMEM184B, TMOD3, TP53, TPPP3, TWIST1,TWIST2, UBAP1, VEGFA, VEGFA, YAP1, ZEB1, ZEB2, ZFPM2, ZNF135, ZNF77
hsa-miR-145 Poor RNASEN, STAT1, PDGFB, RNASEN, EIF4EBP1, SRGAP2, MMP9, KLF4, RBBP6, SOX2, PAK3, CDK4, IGF1, DGCR8, ADAM17, BCL2, MYC,MCL1, ERBB2, MYH11, KCNH8, TP53, EWSR1, BNIP3, EIF4E, IGF1R, SOD2, YES1, CBFB, PAK1, CCND1, COX8A, SMTN, NKX2-3,TP73, FLI1, MUC1, IRS1, WT1, VANGL1, PPP3CA, PTEN, CCNG1, ODZ1, TAGLN, KLF5, CKAP4, MYO6, FABP4, ASAHL, DICER1,AKT1, CLINT1, ZEB1, KRAS, EGFR, SRC, PGK1, KRT7, CD2AP, SFRS8, SRF, RREB1, PPP2R1B, GALNT1, EGF, RTKN, PPIA, HOXA9,CAP1, EPHB2, DDX5, EIF2C1, FSCN1, SOX4, FRAP1, SWAP70, ACTA2, EIF2C2, IFNA1, ESR1, CDH11, FCER2, RPS14, CDKN1A, POLD3,DFFA, RPS6KB1, CTNNB1, TGFBR2, CLEC4G, BIRC2, ERCC8, DFFB, SMPD1, F11R, SOX18, E2F3, ROBO2, MMP3, NKX2-5, TNFSF10,TSC2, BEX1
hsa-miR-150 Poor IL6, ZAP70, SSSCA1, MYB, CCND1, NFKB1, SLC35B2, CD4, PRKCA, RELB, CDK4, FOXP1, CD8A, BCR, , CLCN3, P2RX7, USF2, CAPNS1,MAP3K8, BCL2, MCL1, EGR2, PTGS1, IRAK2, TNFSF10, AGTR1, IL17A, CTSL1, RAC1, IRAK4, FGF7, RAB27A, ALG2, ZIC3, FASN, KIT,JAK2, IKBKE, IGF1, CNTN3, TSHZ3
hsa-miR-181a* Poor NPM1, PML, PDK4, PSMD9, MMP9, SSSCA1, CDX2, WT1, DMPK, DICER1, TGFB1, CD36, GPI, BAALC, NBN, RNASEN, TIMP3, GYPA,TACSTD1, ZFPM1, LCT, DGCR8, TFRC, BCL2, GATA6, FLT3, NTS, RDX, NLK, MECP2, NPM1, ODZ1, ELA2, IL6, CEBPA, ATM, PTEN,HOXA11, MT4, SUFU, EPOR, BCL2L11, THRB, STAT1, CD4, TWIST1, ERG, BCR, RC3H1, CDKN1B, CD8A, SOCS1, LYN, TSPO, RASSF1,GATA1, MCL1, ALAS1, DCTN6, SMAD4, ERBB2, AFP
hsa-miR-192 Poor DICER1, SLC9A3R2, RAPGEF5, NODAL, FOXA1, DNAI1, CDKN1A, SSSCA1, CTNNB1, RAG2, COL1A2, ZEB2, AKT1, FGF3, CCND2, PAK3,SMAD2, BRAF, COL4A1, TGFB1, PTEN, BRCA1, ALCAM, CYCS, SMAD3, APC, TP53, ZEB1, CDH1, DICER1, CCND1, CYP7A1, BIRC5,SMAD7, TYMS, TFE3, IFNG, COL1A1, APOE, AMACR, USF1, PIK3CA, IL1B, CTGF, SLC22A3, MDM2, MSH2, NOS2A, SIP1, ITK, CD79A,MLH1, TNF, BBS9, FADD, KRAS, MLC1, BMP6, RAD9A, MCL1, MSH6, SFRS2IP, HNF1A, NUMA1, HNF4A, TNPO1, EGFR
hsa-miR-193a-3p Poor MCL1, NOS2A, PTK2, TNF, BRAF, CTNNB1, NRAS, DNMT1, CD4, TP53, CD8A, TP73, CD28, CKAP4, E2F3, CYP7A1, CDK6, IFNGhsa-miR-193a-5p Poor and prolonged NRAS, CD4, CD8A, CD28, CTNNB1, CDK6, DNMT1, NCOA2, TP53, MCL1, TP73, PTK2, CKAP4, TGFB1, BRAFhsa-miR-199a-5p Poor and Prolonged PI3, AMELX, FASLG, AKT1, MAPK14, NEUROD1, CALB1, FASN, CD44, ALOX5, EZH2, PTEN, IKBKB, MAPK8, ALOX5AP, PRNP, SIRT1,
MAPK9, ENAM, DDR1, TWIST1, RNMT, COX8A, HIF1A, DECR1, SOX9, INSR, CYP2A6, NFKB1, EGFL7, PPIG, CRYGC, MET, PRKG1,MAPK1, AHSA1
hsa-miR-30b* Poor ARHGDIA, GPR172B, STRN, NAPG, REG3A, KLK8, GAK, SLC38A5, GSTM4, HSD17B12, PTPRK, SHOC2, TGFBR1, WDR68, EIF4E, HBXIP,VPS39, MLLT1, TRMU, WNT5A, YIF1B, LHX1, DNAJC19, ARFIP1, FHL5, HSPA1A, PGM1, BCKDHB, ABHD11, ARID4B, JUN, FAM105A,GNPNAT1, LMNB2, SLC12A2, PRSS21, SLC7A11, NOTCH2, SCYL1, DHX40, RUNX2, SHH, ADSS, FADS1, PPP1R7, SYPL1, TNFRSF10B,DMN, PRAF2, TXN2, GPR56, SAC3D1, NT5C3, PURA, AARSD1, CHST14, CALCOCO2, PTPLB, RPP38, SYNE1, MOV10, BRWD2, CA12,IGF1, ASH2L, DICER1, GRPEL2, CHMP2A, SLC4A7, HSPA1B, SERPINE2, RCN2, HSDL1, TAC1, AGRN, TMCO1, CDCP1, DOCK7, TOMM34,TMEM2, NP, PTGS2, IPO4, GARS, CYP51A1, FADS3, PPP2R4, THBS1, TNFRSF10A, DMD, DUSP12, METTL7A, MARS2, SNX15, PDE3A,PTBP2, SLC25A32, HIPK3, AKAP8, F2, UTRN, SPTLC1, KIAA0776, TMEM41B, CEP72, SLC30A1, CCND1, CLDN1, DGCR8, CPOX,RAB30, FXR2, DNAJB1, ATP6V1C1, RHEB, ATAD3B, KCNN4, GNL3L, MRPS24, AP3B1, UBE2I, TMED2, SH3BP4, ATP2A2, NUFIP2,SLC25A22, SMAD3, RNASEN, AP2A1, ARL2, PPP2R5C, TLOC1, PEX11B, ID1, LYPLA2, GALNT1, ATP6V1F, DPP7, UBE2J1, SRPRB, SLC38A1,CDKN2A, OPRS1, ARL5B, RAB34, VSNL1, PDLIM5, KIAA0409, MTRR, CAND1, LUZP1, CLTC, DHX57, GRIA2, PTRH1, GNAI2, SCAMP1,HYAL1, ACP2, SPCS3, KPNA3, ATRX, SLC1A4, GFM1, GAPDH, MLLT11, PISD, NPR3, AADACL1, GEMIN7, ESR1, NKX2-3, ZNF384, LPL,PPP3CA, TNFAIP2, NRP1, ITGB3, FMNL2, TMEM87A, TRIP13, SLC25A24, ANKFY1, SNX6, COIL, FSTL1, BET1, FGF2, UTP15, ACVR1B,IGF2BP1, TMED3, MYO1E, PRKCI, CACNA2D1, IFNA1, SLC16A3, EIF2C2, KDELC2, GPD2, MPDU1, IDH1, PLK1, CCL13, TMEM189,LY6K, SLC7A1, SSNA1, IRAK2, TMED10, IFIT5, NT5E, WDFY1, EHMT1, TGFB1, TPPP, DSG2, LRP1, PPP3R1, TPM1, SQSTM1, PTPMT1,ZNF294, VAMP3, PSAT1, PTPLAD1, RAB6A, UNC93B1, MAPK14, CDIPT, FGF13, SDCBP, STX7, KIAA0152, GNA13, HARS2, MYO10, PKN2,PXDN, BCL6, RQCD1, CPNE8, TTC9C, TMEM59, IFRD1, ATP6V0A1, RHOB, PPIB, MAP2K1IP1, JAK2, FERMT2, NAT6, NUCB1, RNF213,AGMAT, CHAF1A, DSP, TACSTD2, ABHD10, TPM2, AP3D1, AKT1, THEM4, RAI14, SNAP29, GYS1, TAF9B, RAB27B, CAPG, C1D, FNDC3A,POLE3, NCAPG, MLSTD2, TNFSF11, CTSC, TRAM1, HNRPM, LRRC8A, IFRD2, PRDM1, RFT1, OAS1, CSNK1D, SFI1, AMIGO2, KRT85,CDKAL1, SLC12A4, CBFB, HMGA2, CHD1, PANX1, SPRYD4, PAFAH1B2, GPAM, MRM1, ZIC1, ABCF2, DSPP, SMAD1, PPP5C, TPM3,P4HA2, XIAP, GALNTL2, SLC9A3R2, ANXA2, MRPS33, RAB5C, ARID1A, GJA1, SEC23A, TRIM32, PODXL, NXN, FAM96A, PAH, MTHFD2,CARHSP1, NARS, POLE4, ATG9A, SOX2, AURKB, NOTCH1, CSRP1, MRC2, IGF2R, RHOG, PPL, SLC25A1, RNMT, SLC6A3, DNAJB4, FRG1,ARL10, TMED7, KIAA1618, DOCK5, SMAD2, PPIF, PHC2, MAT2A, PRIM1, TXNRD1, PHLDB2, BCL2, CLN5, GFPT1, UBE4A, HARS,CDK5RAP1, RAD23B, PICALM, VTI1B, PLXND1, TICAM2, POLD2, ATG3, LRRC8C, SEC24A, CORO1C, NCL, RTN4, TMEM109, LIN28,PAX3, CTNNB1, RBM19, LAMC1, DUSP23, UAP1, TNFSF9, SNCA, PWP1, LYCAT, PDLIM7, ANPEP, TXNDC12, PTPRF, NARG1, MET,SLC25A13, EGFR, MBNL1, TRMT1, TYMS, MPZL1, TP53, MSI2, CHORDC1, SFXN1, HMGA1, RAB23, RARS, ADPGK, MYLIP, CEBPB,RCOR1, ITGA2, POLR2C, MOSC1, CUL4B, RELA, PGRMC1, ARFIP2, NEDD4, PTBP1, BAT2, ALPL, PAX6, RDH10, LCP1, MRPL20, SRPR,SNAP23, NOS1, SEC23IP, ELMOD2, DTD1, COMMD9, GOLGA7, PTPRJ, CDK5RAP3, RCAN2, ARID2, SYNE2, PRPF40A, UGT8, ZNF622,DNM1L, IQGAP3, BRPF3, FADS2, HMOX1, GALNT7, RBMS1, SH3BGRL3, ANP32B, ITGB4, SLC38A2, FNDC3B, GTPBP3, BDNF, EHMT2,POLA2, NELL1, PTGFRN, TMEM43, BMP2, TRIM27, MOSPD2
hsa-miR-31 Poor and Prolonged BAMBI, FOXP3, TP53, MCM2, HBEGF, DACT3, SP7, CCL16, ODZ1, HRSP12, TIAL1, JAK2, TBX1, MID1, PPP6C, PTEN, CASR, TIMP2, MYB,SATB2, BGLAP, CD4, FGFR3, HIF1A, VSNL1, PRB1, BIN3, RUNX2, ETS1, PRKD1, HMGA2, HIF1AN, CCT4, RHOA, CDKN2B, FOS, WASF3,ICAM1, CDKN2A, ITGA5, MTAP, PPP2R2A, KRT15, DCN, SELE, CDKN2D, RDX, PGGT1B, PPP2R4, PDLIM7, SFRP1, TNF, BCL2L2, DLX3,TRIM36, LATS2, JAG1, COX8A, SFRP4, TIAM1, KRT16, BAX, STMN1, WIF1, E2F3, KRT17, E2F2, ERCC4, MYC, DKK1, IBSP

Table W2. (continued )
miRNA Response Model Gene
hsa-miR-34a Poor and Prolonged CD47, TP53, CDK4, RUNX2, LOX, CNN3, E2F3, G6PD, VEGFA,MDM2, BCL2, LEF1,MDC1, CAV1, E2F1, EPHB2, TBK1, HELLS, CDK6, AKT1,IRS1,MYC, PPARG, PTPN13, EIF2C4,MITF, FASN, DLL1, HDAC9, RB1, BCL6, CDKN1A, SIRT1, STK39, RNMT,MAP2K1,MYBL1, SLC11A1,CCND1, BIRC3, TOM1, TLR4, MAP1LC3A, COL11A2, GRM7, CREB1, BAMBI, SFRP1, ELK3, HES1, HOXA5, PIK3CA, HNF4A, LIF, CCNE2,ACSL1, APC, CREBZF, CCND3, MET, MAP3K9, NDRG1, PTEN, CRIM1, SLC12A1, ATP6V1B2, MYCN, MECP2, ZEB1, NOTCH1, OCA2,ZAP70, SMARCA5, JAG1, CDC25C, BCR, BNIP3L, CDC25A, RGS3, CD44, COL2A1, E2F5, CDKN2A, TCF21, IFNG, POU4F2, FRAP1,ZEB2, ACTB, SLC2A1, ANP32B, JARID1B, NDUFA2, PPP1R13L, SND1, BRAP, ING2, NR1H4, IL1B, GABPA, FOXP1, COX8A, DICER1,SSSCA1, PEA15, BBC3, WNT1, MYB, RTEL1, SCPEP1, TIMM8A, FOXO1, LIN28, PTPN12, MAPK14, NOS2A, BDNF, MGST1, MDM4, KRAS,SEMA6A, DDIT4, ST3GAL4, PROM1, ECD, ARCN1, CXCL12, NFE2L2, ATN1, HMG2L1, HMGA2, YY1, SEC24D, MAPKAPK2, HDAC2,GRM3, VAMP2, TCL1A, TNRC6A, ARIH2, CTNNBIP1, NFKB1, BAX, ZNF135, ERBB4, DDX4, CSF1, PHGDH, UBL4A, SPI1, CISH, SFRS2,FOXJ1, PAWR, AXIN2, NOL3, CDC20B, ZNF77, KCNMA1, LARP4, PRMT5, EZH2, KLF4, RPS19, CEBPA, DKK2, RNASEN, NPC1
hsa-miR-370 Poor TCF4, ZEB2, WBSCR22, ZEB1, BRD8, TGFB1, ACACA, TGFB2, CPT1A, FASN, SREBF1, SPARC, DGAT2, TCF4, KIT, HMGA2, PDGFRA,TAGLN2, HMGA1, MAP3K8, IL6
hsa-miR-505* Poor ARSF, CDKN2A, CDKN2D, ELF4, SFRS1, TP53, C5orf41hsa-miR-516a-5p Poor KLK10hsa-miR-564 Poor and Prolonged DICER1hsa-miR-582-5p Poor TGFB1, DLK1, SMAD3, SMAD6, SMAD9hsa-miR-659 Poor and Prolonged GRNhsa-miR-126* Prolonged TLR4, ACVR2A, UBASH3A, EGF, SOX2, EGFL7, POLR2A, CEBPZ, CRK, PIK3R2, SRY, PIK3CA, CREB1, VEGFA, SPRED1, JUN, PECAM1, TOM1,
DICER1, PLK2, SRC, KDR, SLC45A3, PLAC1, AKT1, CASP3, GLI1, RNASEN, WT1, EGFR, HOXA9, CD4, SOX4, EPHB2, CXCL12, KRAS, MYB,HNF1A, CD8A, MERTK, CD70, PI3, CXCR4, NRAS, CD2AP, FOXJ2, TGFBR2, RHOC, CD28, PTPRN2, DNMT1, MRGPRX3, SMOX, MAPK8,ETS1, CD44, ITGA2B, ITGAL, COX8A, PTEN, C9orf127, ETS2, HOXD10, MAFB, FLI1, SMO, HPS1, TNC, HOXA1, CDKN1A, PDGFB, TP53,IL1B, RUNX1, PAK1, GATA3, TP63, CCND1, VCAM1, TLR2, JAK2, RUNX1T1
hsa-miR-1274a Prolonged CYP7A1, IFNG, IL1B, NOS2A, TNF, AASDHPPThsa-miR-136 Prolonged ME1, RRBP1hsa-miR-198 Prolonged ESR1, BRCA1, GJA1, TUSC2, GRIA2, FUS, MYLIP, CCND1, NOTCH1, CCND2, ARID4B, ATF2, TAC1, JUN, HIPK3, UTRN, PTPN1, CDKN2A,
VSNL1, TAF1, FSTL1, ACVR1B, MAPK14, KIAA0152hsa-miR-199a-3p Prolonged AKT1, BMP2, COMP, EPHB2, FRAP1, GARS, MET, PIK3CA, PTEN, RAG2, RB1, SOX9, TIMM8A, TNFhsa-miR-371-5p Prolonged DNMT3A, DNMT3B, FABP4, ADIPOQ, TP53, LATS2hsa-miR-376a Prolonged PRPS1, SLC16A1, TTK, SFRS11, RHOD, ZNF513, PRPS1L1, SNX19hsa-miR-410 Prolonged JUN, NFKB1, RB1, TP53, PUM1, COX8A, MAPK1IP1L, CDC2, CDKN2Ahsa-miR-424* Prolonged CCND3, GTF2IRD1, CEBPB, NIT1, CDKN1A, CCNE1, SETD2, EGFR, MED1, CREB1, MAPK9, CHEK1, CCNF, BCR, MUC1, OPRS1, ATF2,
MAP2K1, ETS1, CCNE2, FLT3, LGALS3, CHD4, E2F3, RASA1, ATF6, KIF23, SPINK1, DDX20, AP2M1, HOXA4, CCND1, TAF10, EIF2C1,CDC25A, E2F1, EIF2C2, DDX5, NFE2L1, ARPC5L, PAK3, PLAG1, ESR1, FGFR1, NFE2L2, MYB, ANLN, SMAD3, PIAS1, NCOA6, SP3, SIAH1,POU2F2, SYNGAP1, FOSB, USF2, BCL6, LATS2, CDK6, RARA, MBD4, INPPL1, YY1, WEE1, CUL2, RNASEN, RXRA, RUNX1, ITPR1, KCNH8,CDC14A, HIF1A
hsa-miR-630 Prolonged H2AFX, CDKN1A, TP53, CISH, SSSCA1, GADD45A, TP73, YES1, YAP1, PARP1, HIPK2, ATM, BCL2, BAX, BCL2L2, CDKN1B, CASP3
Figure W3. Pathways overrepresented by action of poor response and prolonged response miRNAs.
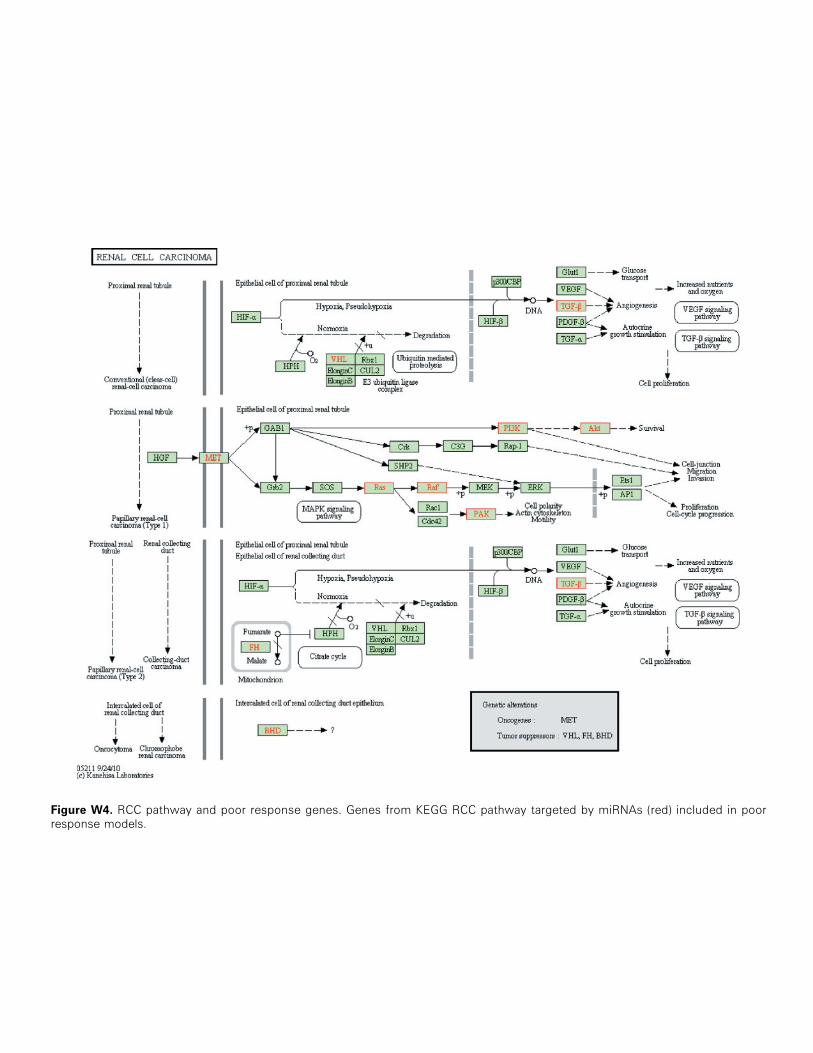
Figure W4. RCC pathway and poor response genes. Genes from KEGG RCC pathway targeted by miRNAs (red) included in poorresponse models.

Figure W5. RCC pathway and prolonged response genes. Genes from KEGG RCC pathway targeted bymiRNAs (red) included in prolongedresponse models.

Figure W6. Expression ofmiRNAs in renal carcinomas.miR-192 andmiR-193a-3p expression in normal (N_KID) and tumoral (T_KID)kidneys. ***P < .001. Data obtained from Lu et al.
Figure W7. Validation of some predictive signatures using RT-qPCR. (A) Kaplan-Meier analyses of poor response model 3.3; HR betweengroupswas 2.067 (IC95= 0.97–4.39, P= .059). (B) Kaplan-Meier analyses of prolonged responsemodel 3.2; HR between groupswas 1.962(IC95 = 0.77–4.96, P = .155).