Master Presentation
34
Microbial community changes of aerobic granules during the degradation of inhibitory wastewaters after the application of an optimal control strategy Presents: Víctor Servando García Rea Tutorial committee Dr. Iván Moreno Andrade Dra. Luisa Falcón Álvarez Dr. Miroslav Macek 1 May 2015
-
Upload
victor-servando-garcia-rea -
Category
Documents
-
view
22 -
download
0
Transcript of Master Presentation

Microbial community changes of aerobic granules during the degradation of inhibitory wastewaters after
the application of an optimal control strategy
Presents: Víctor Servando García Rea
Tutorial committee
Dr. Iván Moreno Andrade Dra. Luisa Falcón Álvarez
Dr. Miroslav Macek
1
May 2015

Industrial wastewater
2
Industrial wastewaters are the residual waters that remain after the industrial processes. Often contain a large number of xenobiotics.
Due of its complex chemical structure, industrial wastewaters are difficult to biodegrade, so that they are environment-persistent.
Images taken from: http://www.greenpeace.org/mexico/es/Noticias/2012/Marzo/Rios-mexicanos-rios-toxicos/
3
Sequential batch reactors (SBR)
4
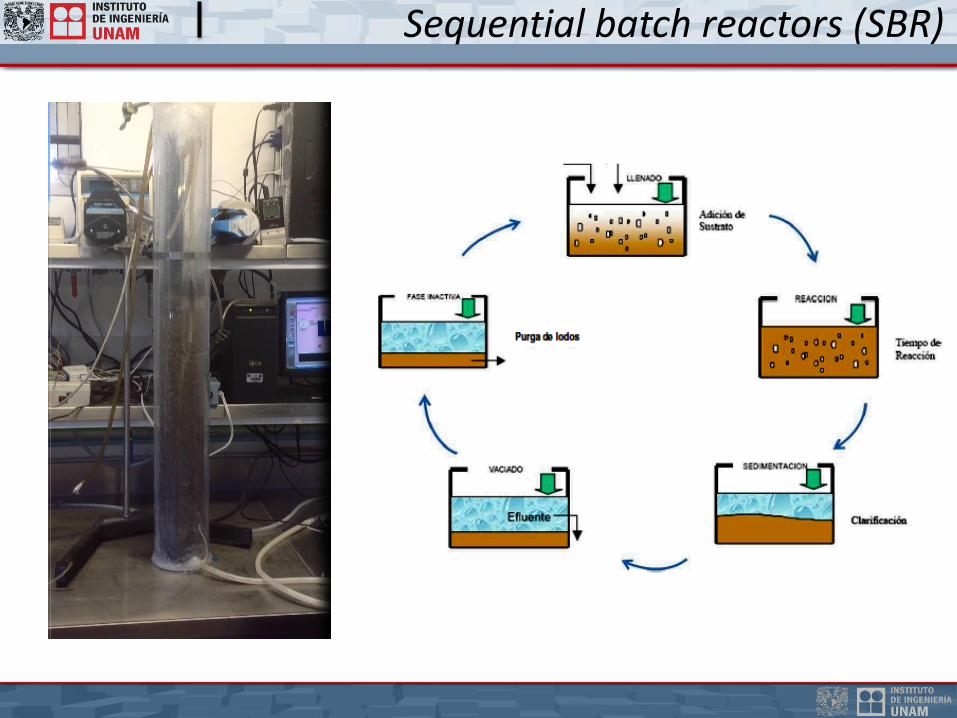
Aerobic granules
Microbial origin aggregates which do not coagulate under reduced hydrodynamic shear force and which settle faster than flocculent sludge1.
They provide and increase in the biomass retention and have a higher capacity to resist organic loading rates and toxic compounds.
Can withstand conditions of high biological stress, which other types of biological sludge cannot.
1. de Kreuk, Mc Swain et al. 2005
5
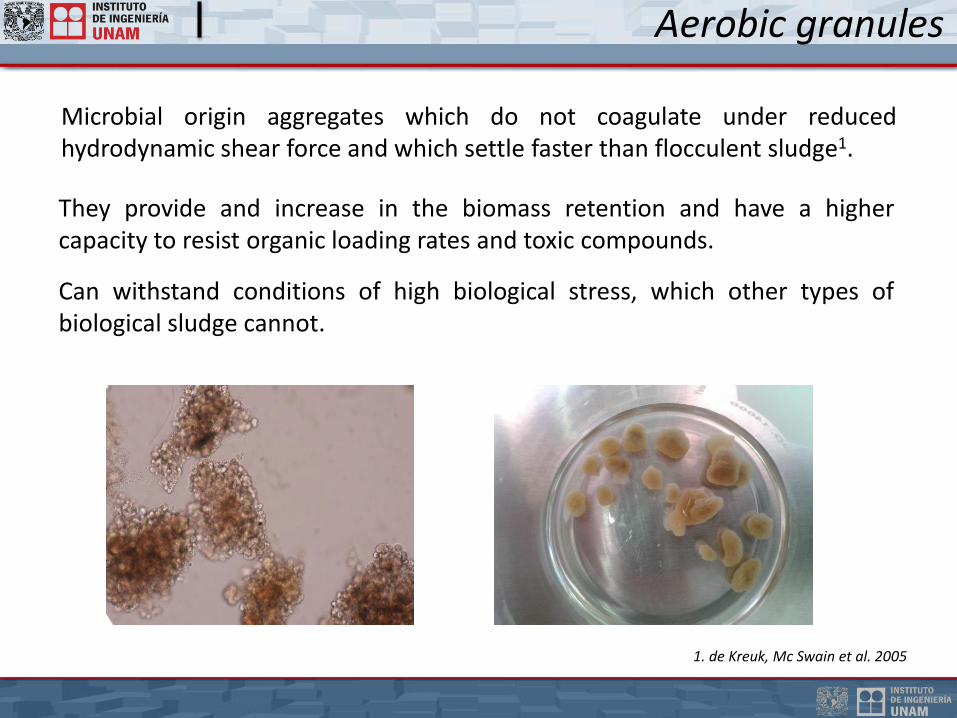
4-Clorophenol
Phenolic compounds are produced by: Petrochemical, pharmaceutical, paper mills, etc. They are used as disinfectants, pesticides, herbicides, etc. 4-Chlorophenol (4-CP) used as a model inhibitory compound.
The inhibitory compounds can cause operation problems in the wastewater treatment plants, as well as a diminish in the removal performance. The treatment of industrial wastewaters is characterized by a great variability in the flux and the concentration of the toxics.
6
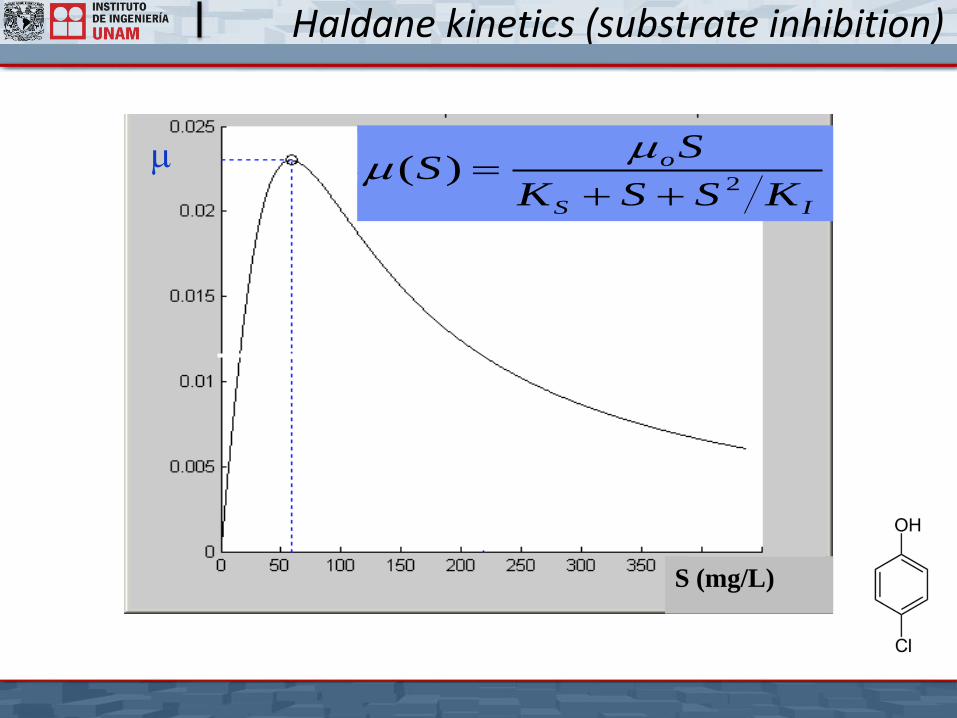
Haldane kinetics (substrate inhibition)
IS
o
KSSK
SS
2)(
S (mg/L)
7
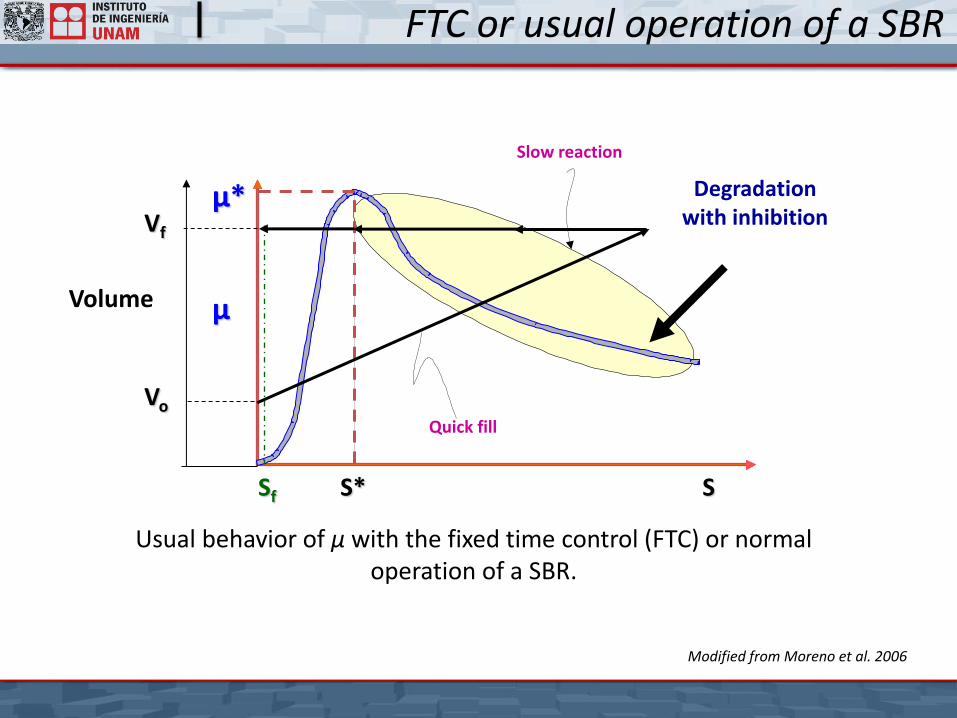
FTC or usual operation of a SBR
S*
µ*
Quick fill
S
Volume
Slow reaction
Usual behavior of µ with the fixed time control (FTC) or normal operation of a SBR.
Vf
Vo
Degradation with inhibition
µ
Sf
Modified from Moreno et al. 2006
8
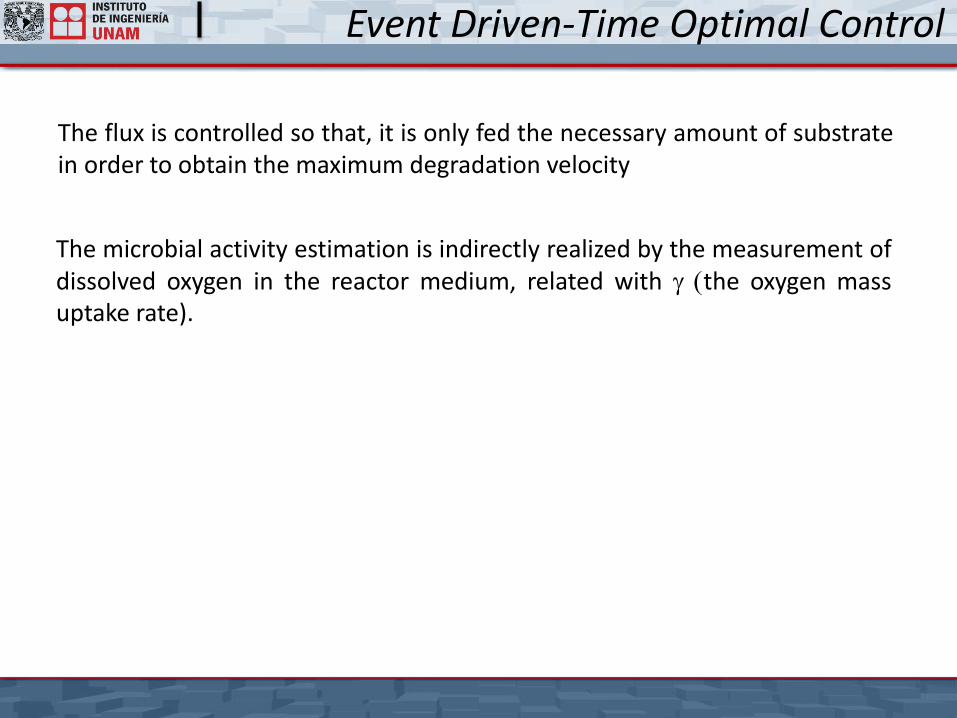
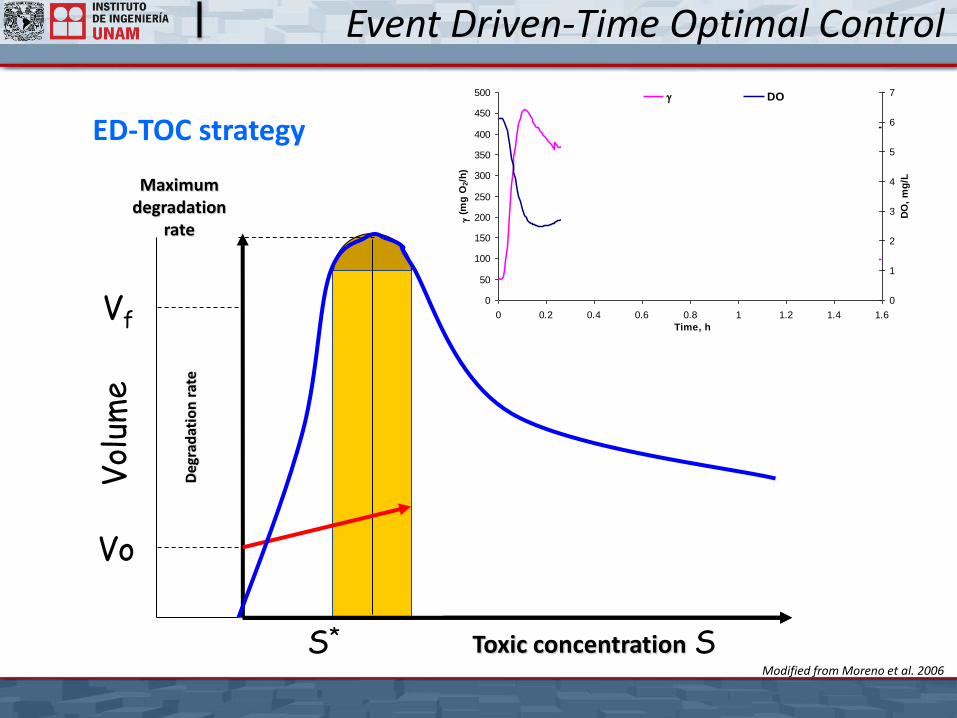
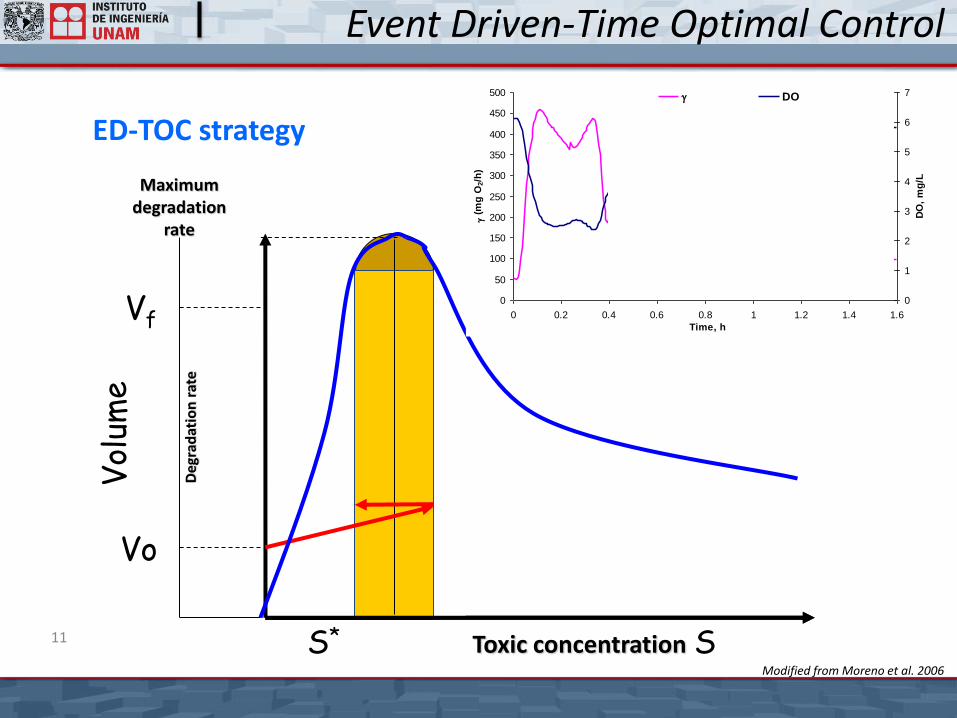
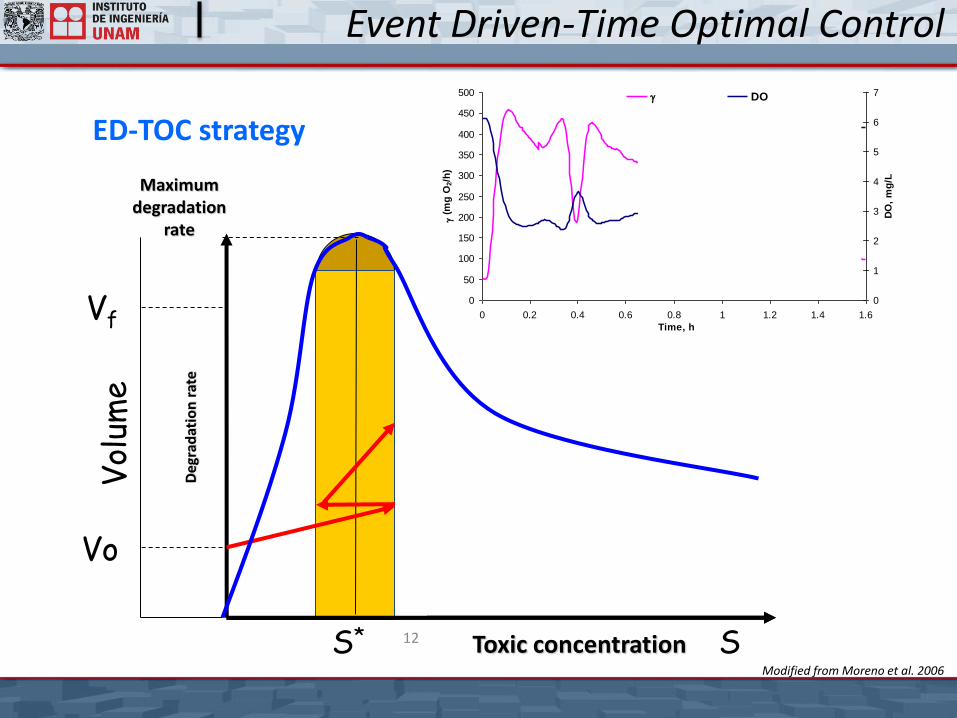
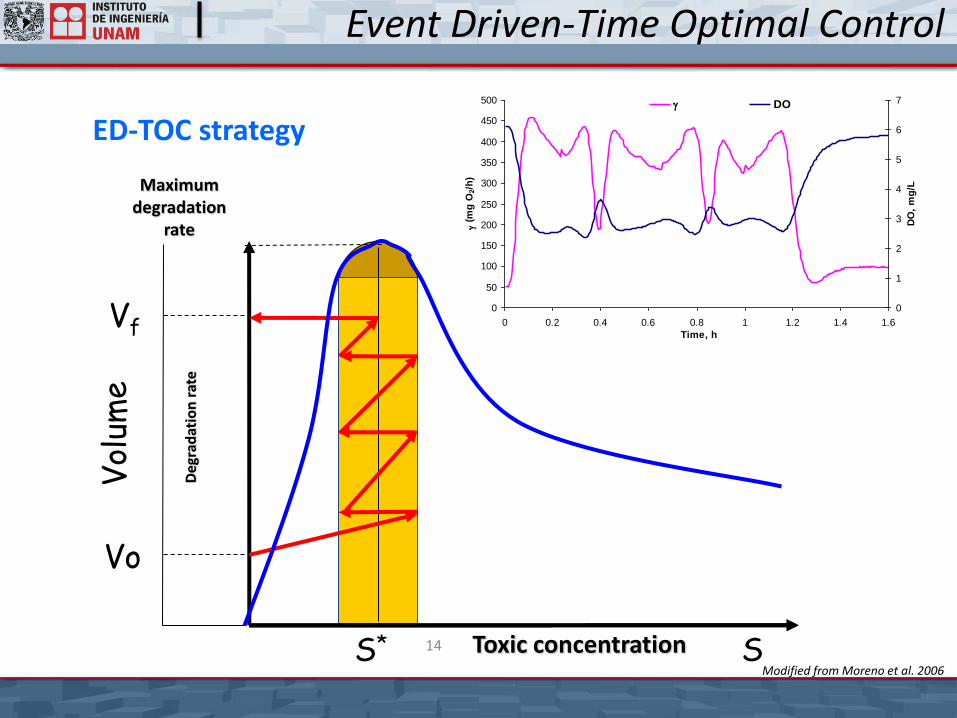
Event Driven-Time Optimal Control
The flux is controlled so that, it is only fed the necessary amount of substrate in order to obtain the maximum degradation velocity
The microbial activity estimation is indirectly realized by the measurement of dissolved oxygen in the reactor medium, related with g (the oxygen mass uptake rate).
9
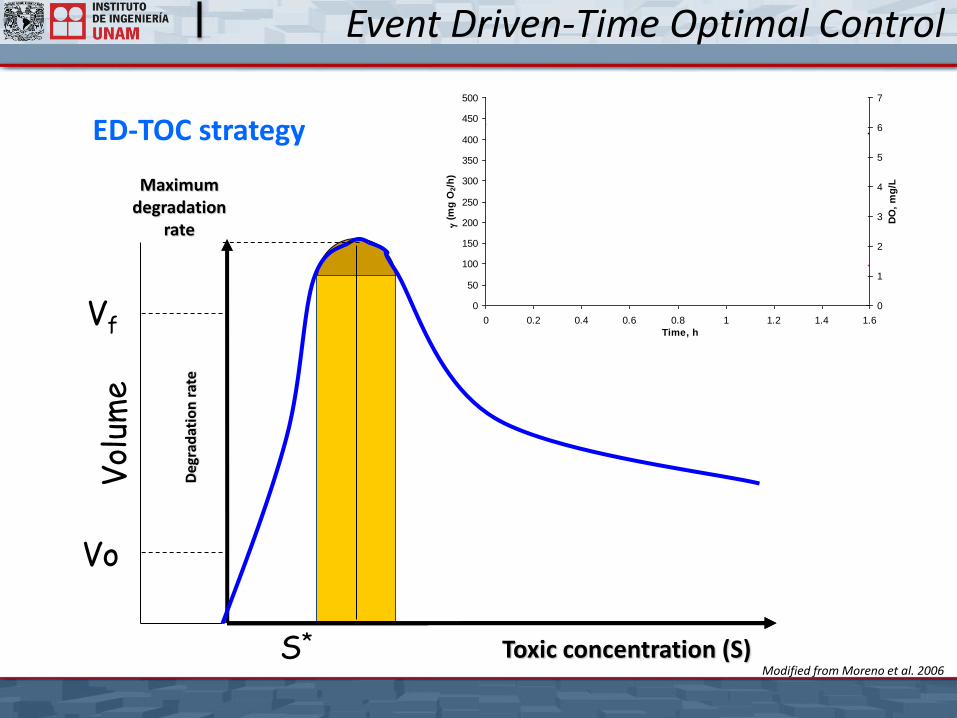
Event Driven-Time Optimal Control
S* Toxic concentration (S)
Vf
Vol
ume
Vo
Deg
rad
atio
n r
ate
Maximum
degradation rate
ED-TOC strategy
0
50
100
150
200
250
300
350
400
450
500
0 0.2 0.4 0.6 0.8 1 1.2 1.4 1.6
Time, h
g (
mg
O2/h
)
0
1
2
3
4
5
6
7
DO
, m
g/L
g DO
Modified from Moreno et al. 2006
10
Event Driven-Time Optimal Control
Vf
Vo
0
50
100
150
200
250
300
350
400
450
500
0 0.2 0.4 0.6 0.8 1 1.2 1.4 1.6
Time, h
g (
mg
O2/h
)
0
1
2
3
4
5
6
7
DO
, m
g/L
g DO
S* S Toxic concentration
Vol
ume
Deg
rad
atio
n r
ate
Maximum
degradation rate
ED-TOC strategy
Modified from Moreno et al. 2006
11
Event Driven-Time Optimal Control
11 S* S
Vf
Vo
0
50
100
150
200
250
300
350
400
450
500
0 0.2 0.4 0.6 0.8 1 1.2 1.4 1.6
Time, h
g (
mg
O2/h
)
0
1
2
3
4
5
6
7
DO
, m
g/L
g DO
Toxic concentration
Vol
ume
Deg
rad
atio
n r
ate
Maximum
degradation rate
ED-TOC strategy
Modified from Moreno et al. 2006
12
Event Driven-Time Optimal Control
12 S* S
Vf
Vo
0
50
100
150
200
250
300
350
400
450
500
0 0.2 0.4 0.6 0.8 1 1.2 1.4 1.6
Time, h
g (
mg
O2/h
)
0
1
2
3
4
5
6
7
DO
, m
g/L
g DO
Toxic concentration
Vol
ume
Deg
rad
atio
n r
ate
Maximum
degradation rate
ED-TOC strategy
Modified from Moreno et al. 2006

13
Event Driven-Time Optimal Control
13 S* S
Vf
Vo
0
50
100
150
200
250
300
350
400
450
500
0 0.2 0.4 0.6 0.8 1 1.2 1.4 1.6
Time, h
g (
mg
O2/h
)
0
1
2
3
4
5
6
7
DO
, m
g/L
g DO
Toxic concentration
Vol
ume
Deg
rad
atio
n r
ate
Maximum
degradation rate
ED-TOC strategy
Modified from Moreno et al. 2006
14 14
Event Driven-Time Optimal Control
14 S* S
Vf
Vo
0
50
100
150
200
250
300
350
400
450
500
0 0.2 0.4 0.6 0.8 1 1.2 1.4 1.6
Time, h
g (
mg
O2/h
)
0
1
2
3
4
5
6
7
DO
, m
g/L
g DO
Toxic concentration
Vol
ume
Deg
rad
atio
n r
ate
Maximum
degradation rate
ED-TOC strategy
Modified from Moreno et al. 2006
15
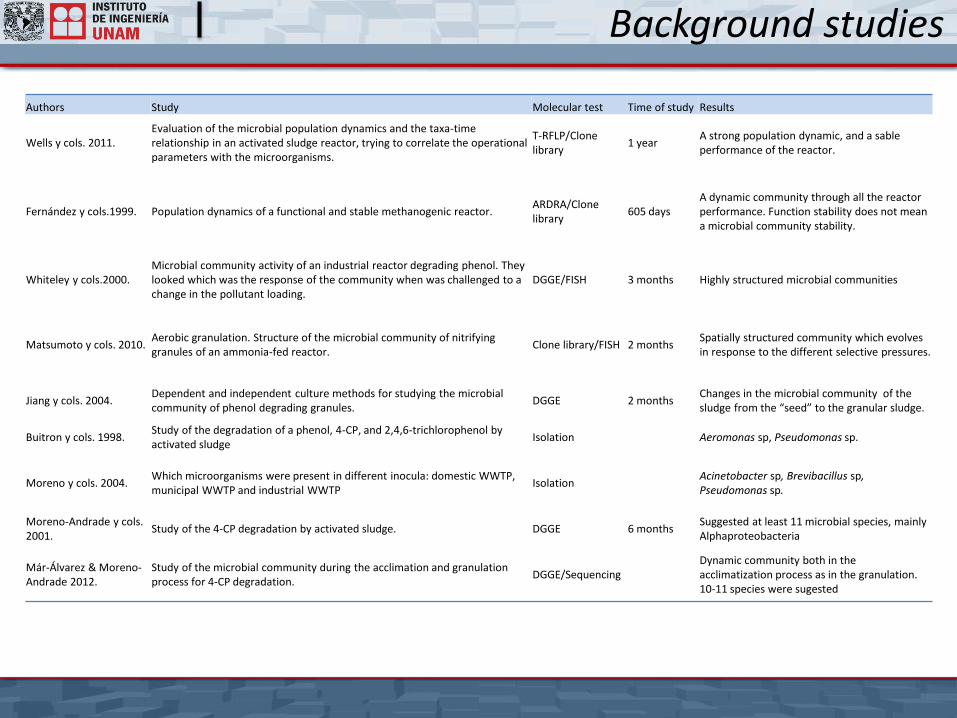
Background studies
Authors Study Molecular test Time of study Results
Wells y cols. 2011. Evaluation of the microbial population dynamics and the taxa-time relationship in an activated sludge reactor, trying to correlate the operational parameters with the microorganisms.
T-RFLP/Clone library
1 year A strong population dynamic, and a sable performance of the reactor.
Fernández y cols.1999. Population dynamics of a functional and stable methanogenic reactor. ARDRA/Clone library
605 days A dynamic community through all the reactor performance. Function stability does not mean a microbial community stability.
Whiteley y cols.2000. Microbial community activity of an industrial reactor degrading phenol. They looked which was the response of the community when was challenged to a change in the pollutant loading.
DGGE/FISH 3 months Highly structured microbial communities
Matsumoto y cols. 2010. Aerobic granulation. Structure of the microbial community of nitrifying granules of an ammonia-fed reactor.
Clone library/FISH 2 months Spatially structured community which evolves in response to the different selective pressures.
Jiang y cols. 2004. Dependent and independent culture methods for studying the microbial community of phenol degrading granules.
DGGE 2 months Changes in the microbial community of the sludge from the “seed” to the granular sludge.
Buitron y cols. 1998. Study of the degradation of a phenol, 4-CP, and 2,4,6-trichlorophenol by activated sludge
Isolation Aeromonas sp, Pseudomonas sp.
Moreno y cols. 2004. Which microorganisms were present in different inocula: domestic WWTP, municipal WWTP and industrial WWTP
Isolation Acinetobacter sp, Brevibacillus sp, Pseudomonas sp.
Moreno-Andrade y cols. 2001.
Study of the 4-CP degradation by activated sludge. DGGE 6 months Suggested at least 11 microbial species, mainly Alphaproteobacteria
Már-Álvarez & Moreno-Andrade 2012.
Study of the microbial community during the acclimation and granulation process for 4-CP degradation.
DGGE/Sequencing
Dynamic community both in the acclimatization process as in the granulation. 10-11 species were sugested
16
Hypothesis
The bacterial community of aerobic granules of a 4-Chlorophenol degrading SBR which runs with a conventional operation strategy (FTC) will be specialized when the SBR changes to an operation with an optimal control strategy (ED-TOC) which maintains the microorganisms in close to the maximum growth rate (max).
17
Objective
General objective: To evaluate the changes in the bacterial community of aerobic
granules of SBR degrading 4-Chlorophenol when the SBR is changed form the conventional operation strategy (FTC) to an optimal control strategy (ED-TOC) in which the microorganisms are close to the maximum growth rate (max).
18 18
Particular objectives
1. To determine the bacterial community present in aerobic granules of a SBR degrading 4-CP which is operated with the conventional strategy (FTC).
2. To determine the bacterial community present in aerobic granules of a SBR degrading 4-CP which is operated with and optimal control strategy (ED-TOC).
3. To monitor the physicochemical and operational parameters of the granular biomass, in order to determine if there is a change in them after the normal SBR operation (FTC) is switched to an optimal control strategy (ED-TOC), and correlate this changes with the microorganisms present.
19
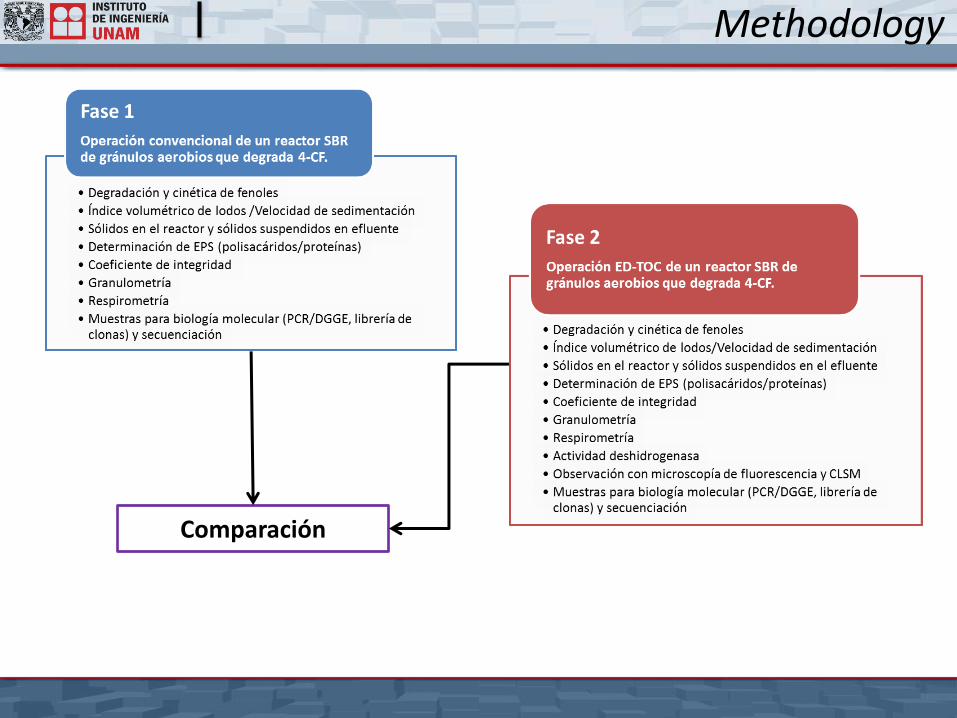
Methodology
Comparación

20
Aerobic granular SBR
SBR reactor (1), fed (fill) pump (2), drain pump (3), feeding tank (4), PC (5), data acquisition card (6), temperature and dissolved oxygen sensor, (7) temperature control system (8).
21
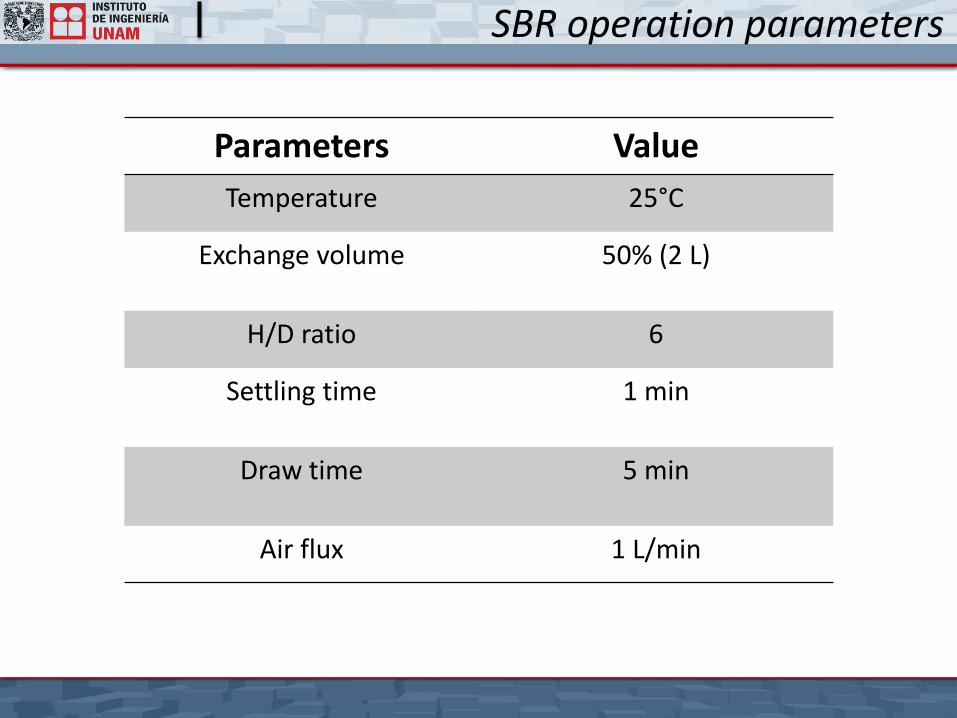
SBR operation parameters
Parameters Value
Temperature 25°C
Exchange volume 50% (2 L)
H/D ratio 6
Settling time 1 min
Draw time 5 min
Air flux 1 L/min
22
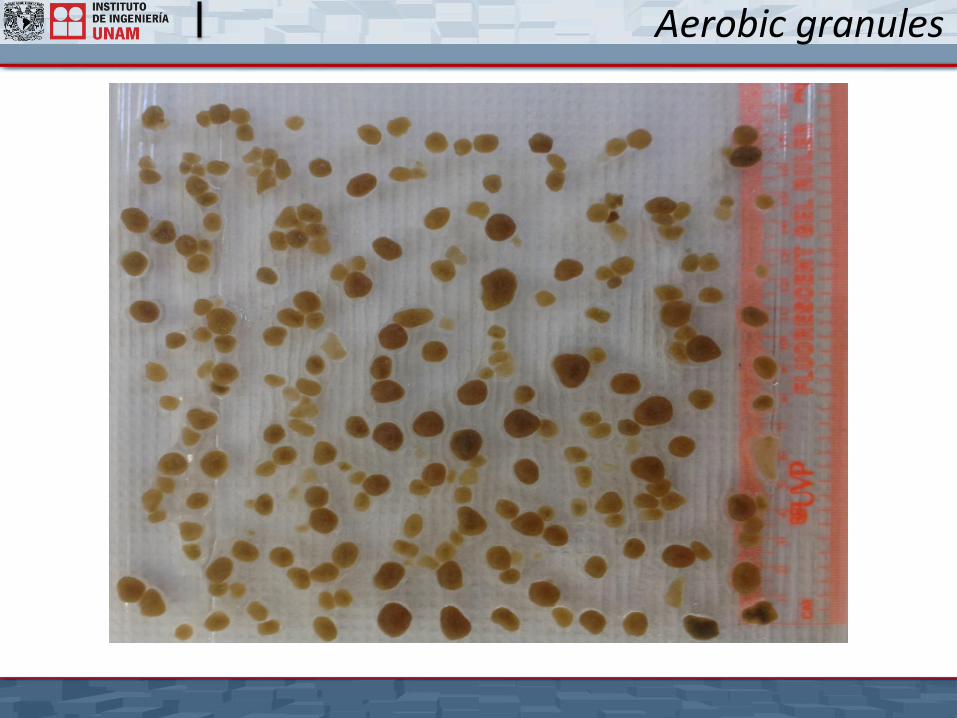
Aerobic granules

23
Physicochemical results
q= 714 +/- 100 mg4CF/gSSVd
ED-TOC 4-CP degradation kinetic
0 25 50 75 100 125 150 175 200 225 2500
20
40
60
0
2
4
6
O2
4-CF 300 mg/L
tiempo (min)
4-C
F [
mg
/L] O
2 [mg
/L]
Cinética FTC
0 100 200 300 4000
50
100
150
200
250
380 mg/L
450 mg/L
300 mg/L
tiempo (min)
4-C
F [
mg
/L]
FTC 4-CP degradation kinetic
q= 1190 +/- 300 mg4CF/gSSVd
4-CF influent
[mg/L]
4-CF effluent [mg/L]
FTC
Removal
percentage(FTC)
4-CF effluent [mg/L]
ED-TOC
Removal percentage
(ED-TOC)
300-500 0.14 +/- 0.11 99.8 +/- 0.03 % 0.41+/- 0.08 99.8+/-0.09 %
24
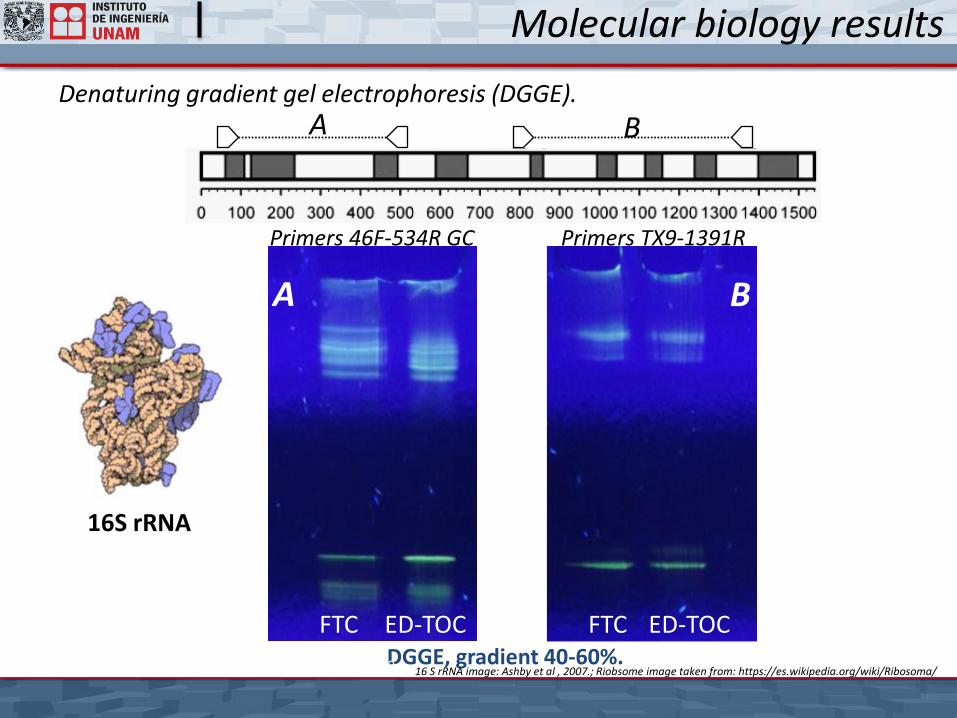
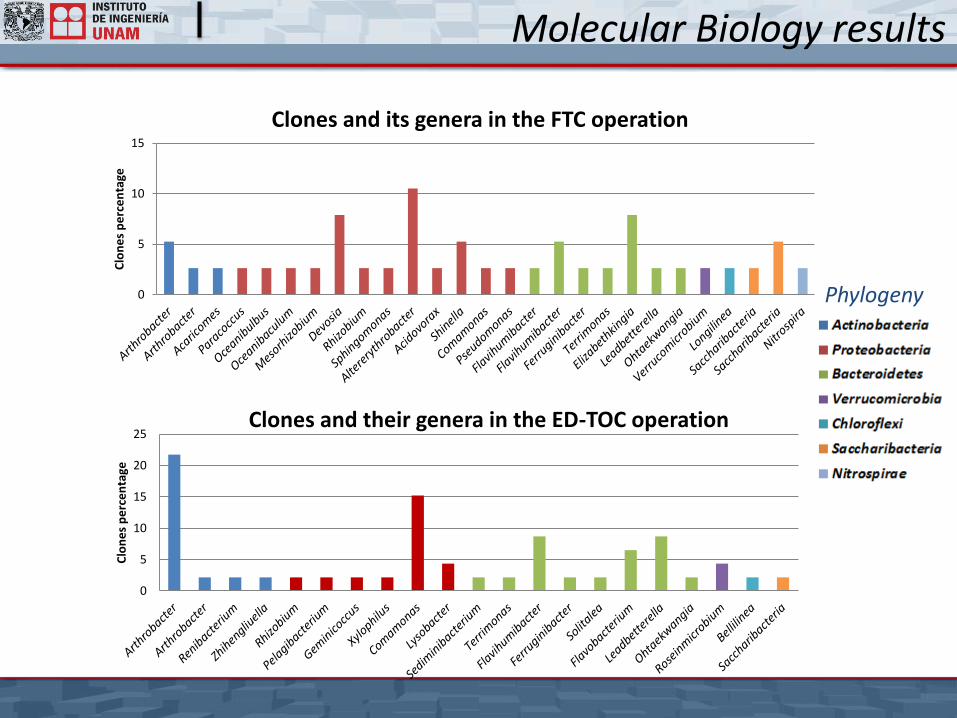
Molecular biology results
B Primers 46F-534R GC Primers TX9-1391R
DGGE, gradient 40-60%.
A B
A B
Denaturing gradient gel electrophoresis (DGGE).
ED-TOC
0
FTC
B
ED-TOC
FTC
16 S rRNA image: Ashby et al , 2007.; Riobsome image taken from: https://es.wikipedia.org/wiki/Ribosoma/
16S rRNA
25
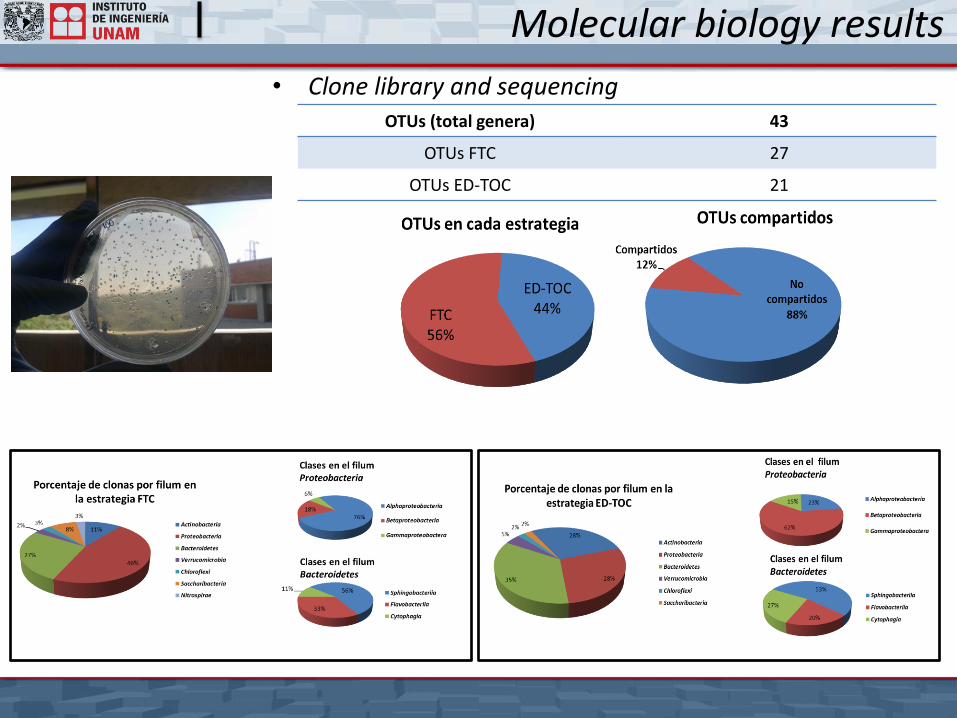
Molecular biology results
OTUs (total genera) 43
OTUs FTC 27
OTUs ED-TOC 21
• Clone library and sequencing
26
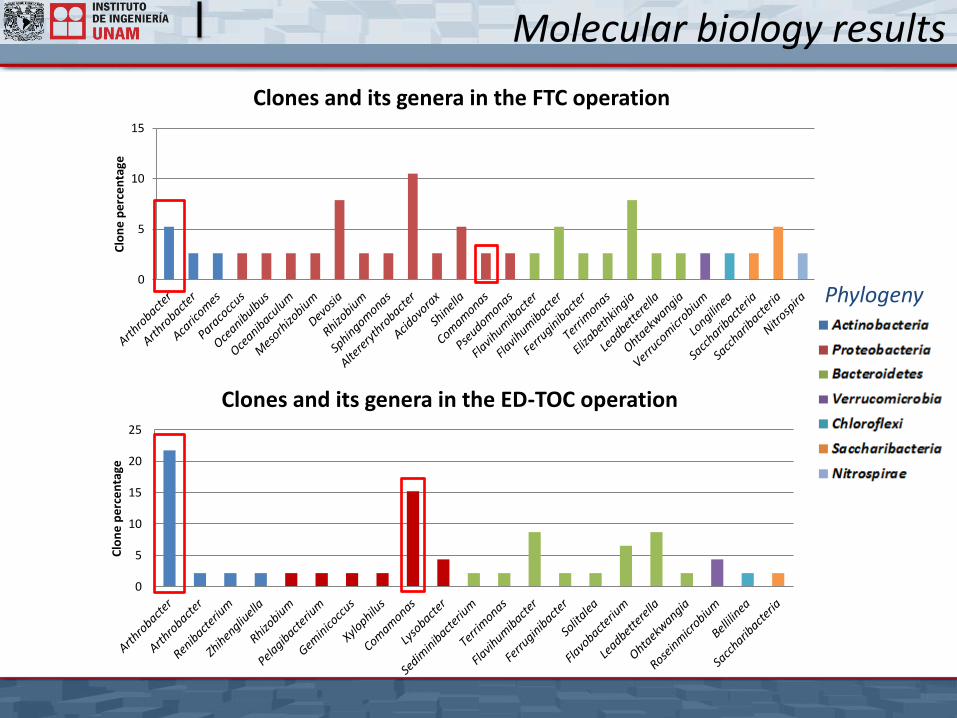
Molecular biology results
0
5
10
15C
lon
e p
erc
en
tage
Clones and its genera in the FTC operation
0
5
10
15
20
25
Clo
ne
pe
rce
nta
ge
Clones and its genera in the ED-TOC operation
Phylogeny
27
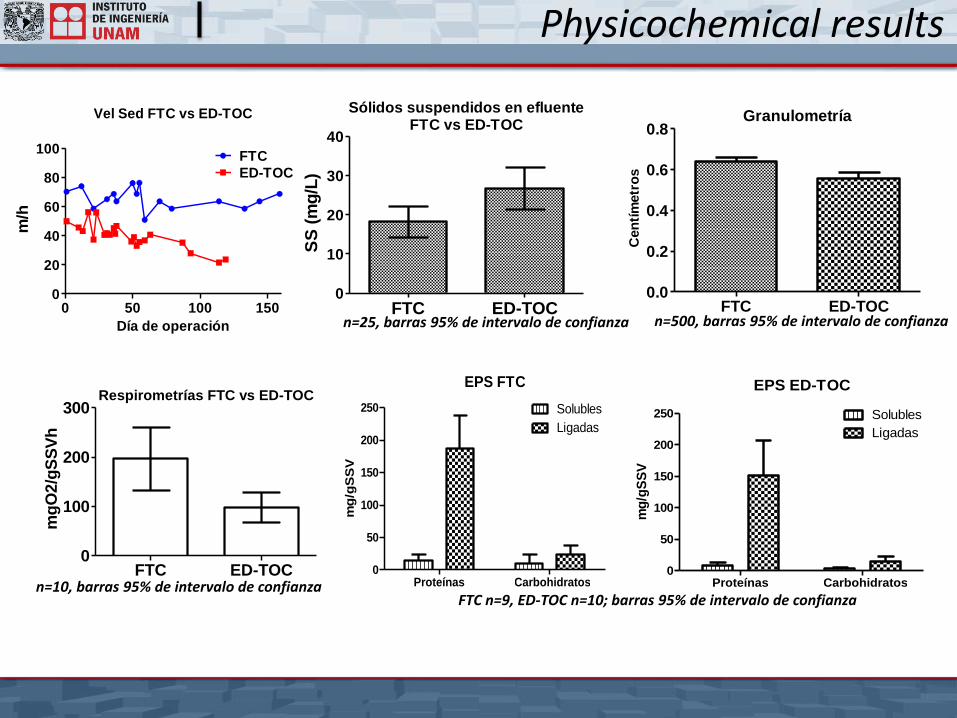
Physicochemical results
Vel Sed FTC vs ED-TOC
0 50 100 1500
20
40
60
80
100FTC
ED-TOC
Día de operación
m/h
Sólidos suspendidos en efluenteFTC vs ED-TOC
FTC ED-TOC0
10
20
30
40
SS
(m
g/L
)n=25, barras 95% de intervalo de confianza
Proteínas Carbohidratos0
50
100
150
200
250 Solubles
Ligadas
EPS FTC
mg
/gS
SV
Proteínas Carbohidratos0
50
100
150
200
250 Solubles
Ligadas
EPS ED-TOC
mg
/gS
SV
FTC n=9, ED-TOC n=10; barras 95% de intervalo de confianza
Respirometrías FTC vs ED-TOC
FTC ED-TOC0
100
200
300
mg
O2/g
SS
Vh
n=10, barras 95% de intervalo de confianza
Granulometría
FTC ED-TOC0.0
0.2
0.4
0.6
0.8
Cen
tím
etr
os
n=500, barras 95% de intervalo de confianza
28
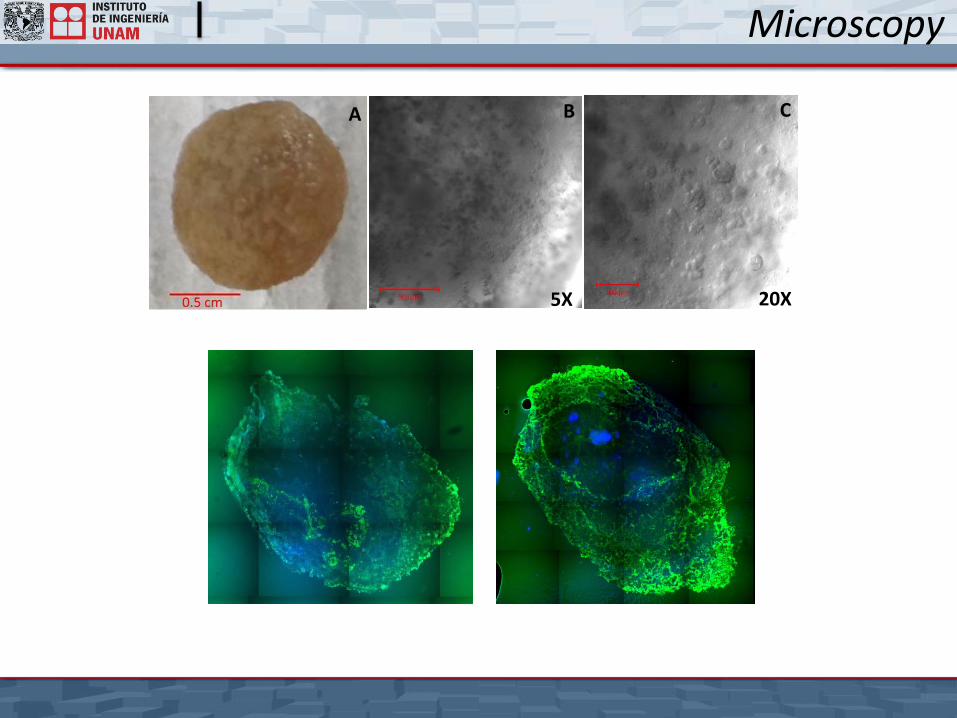
Microscopy
A
5X
B C
20X
29
Molecular Biology results
0
5
10
15
Clo
ne
s p
erc
en
tage
Clones and its genera in the FTC operation
0
5
10
15
20
25
Clo
ne
s p
erc
en
tage
Clones and their genera in the ED-TOC operation
Phylogeny
30
Conclusions
1. The bacterial community of the aerobic granules operating with the ED-TOC strategy showed a specialization compared with the bacterial community of the aerobic granules with the FTC strategy.
The bacterial community of the ED-TOC granules was less diverse (6 phyla and 21 genera) compared with the bacterial community of the FTC granules (7 phyla and 21 genera).
5 genera of the 43 present in both reactors were share between the two communities, representing 12% of the total genera.
2. The phylogenetic analysis showed that both communities are very close related. So even tough there are some changes at bacterial genera level, the granular structure and the biomass metabolic and functional activities do not change.
31
3. The 4-CP specific degradation rate (qx) and the specific oxygen uptake rate (SOUR) were higher in the FTC than in the ED-TOC (66% and 101%). The granular settling velocity and the solids concentration in the FTC strategy effluent were 69% lower and 100% higher ,respectively, than in the granules of the ED-TOC strategy, mainly due to the increase of filamentous bacteria. The granule size was 14% bigger in the FTC strategy than in the ED-TOC strategy because of the higher 4-CP concentrations in the FTC strategy. The EPS does not showed any disturbance. The 4-CP removal percentage was the same for the both strategies. Nevertheless it is worth to mention again that the range of 4-CP concentration in which the FTC worked was not deadly for the biomass. If the concentrations would have surpassed 500 mg/L inside of the reactor the reactor operation would have crashed.
Conclusions
32
Future perspectives and final remarks
Application of the control strategy in real industrial wastewater with 4-CP
The easiness of move the dynamic of a bacterial community only by the feeding procedure.
Diversity coverage that can be achieved with molecular finger-printing techniques like the DGGE, how close enough is to the real diversity?
Thank you!
33
34
Thanks