Informe de resultados de COVID-19
32
covid19.healthdata.org 1 Institute for Health Metrics and Evaluation Informe de resultados de COVID-19 México 1 de septiembre de 2021 Este documento contiene información resumida sobre las últimas proyecciones del modelo IHME sobre COVID-19 en México. El modelo se ejecutó el 31 de agosto de 2021, con datos hasta el 19 de agosto de 2021 y la proyección se mantiene al 1 de diciembre de 2021 con adecuaciones en la modelación El aumento del Delta en México continúa desarrollándose en algunos estados, pero en promedio en el país comenzó una leve disminución. Sin embargo, COVID 19 sigue siendo la primera causa de muerte esta semana. Las muertes reportadas diarias han disminuido 4.7% (de 640 a 610 por día), los casos reportados diarios también han disminuido 4.8% (de 16,500 a 15,700 por día). La tasa de letalidad por infección es superior a 0.8% en la Ciudad de México y Querétaro y la tasa de mortalidad diaria reportada es superior a 4 por millón en 23 estados. La R efectiva media es mayor que 1 en 14 estados, lo que indica un aumento de la transmisión en esas áreas, pero la tasa de detección de infecciones es muy baja, cercana al 5%. No hay un patrón geográfico de áreas de mayor transmisión, porque la variante Delta se ha convertido en predominante en el país y está impulsando el aumento actual en más de la mitad de los estados. Estimamos que la variante Delta está circulando en los 32 estados mientras que la variante Gamma está circulando en 26. Estimamos que en todo el país, al 30 de agosto aproximadamente el 67% de las personas han sido infectadas, con altas tasas de contagio en los estados del norte, centro y península de Yucatán. Si bien en general, el 85% de las personas dicen que aceptarían una vacuna contra el COVID-19, esa cifra varía ampliamente del 71% en Colima al 92% en Hidalgo. Esperamos que al ritmo actual, 78,3 millones de personas recibirán al menos una dosis de vacuna para el 1 de diciembre. En nuestro escenario de referencia actual, esperamos que para el 1 de diciembre, el 84% de las personas sean inmunes a las variantes sin escape y 72% de las personas será inmune a las variantes de escape. El uso de mascarillas, otra característica fundamental que influye en la transmisión, se ha mantenido constante desde la semana pasada, y 82% de las personas dice que siempre usaban una mascarilla al salir de casa. Estimamos que se salvarían 4.500 vidas si a partir de la próxima semana el 95% de las personas llevaran siempre una mascarilla al salir de casa. Nuestro escenario de referencia, que representa lo que pensamos que es más probable que suceda, proyecta 300,000 muertes acumuladas reportadas el 1 de diciembre, lo que representa 39,000 muertes adicionales desde el 30 de agosto hasta entonces. Nuestro peor escenario, proyecta 330,000 muertes acumuladas reportadas el 1 de diciembre, y 30,000 muertes adicionales en comparación con nuestro escenario de referencia. También anticipamos que entre ahora y el 1 de diciembre, 19 estados tendrán una presión alta o extrema en las camas de hospital, mientras que en 20 tendrá la presión alta o extrema será en la capacidad de la unidad de cuidados intensivos (UCI).
Transcript of Informe de resultados de COVID-19

covid19.healthdata.org 1 Institute for Health Metrics and Evaluation
Informe de resultados de COVID-19
México
1 de septiembre de 2021 Este documento contiene información resumida sobre las últimas proyecciones del modelo IHME sobre COVID-19 en México. El modelo se ejecutó el 31 de agosto de 2021, con datos hasta el 19 de agosto de 2021 y la proyección se mantiene al 1 de diciembre de 2021 con adecuaciones en la modelación
El aumento del Delta en México continúa desarrollándose en algunos estados, pero en promedio en el país comenzó una leve disminución. Sin embargo, COVID 19 sigue siendo la primera causa de muerte esta semana. Las muertes reportadas diarias han disminuido 4.7% (de 640 a 610 por día), los casos reportados diarios también han disminuido 4.8% (de 16,500 a 15,700 por día). La tasa de letalidad por infección es superior a 0.8% en la Ciudad de México y Querétaro y la tasa de mortalidad diaria reportada es superior a 4 por millón en 23 estados. La R efectiva media es mayor que 1 en 14 estados, lo que indica un aumento de la transmisión en esas áreas, pero la tasa de detección de infecciones es muy baja, cercana al 5%. No hay un patrón geográfico de áreas de mayor transmisión, porque la variante Delta se ha convertido en predominante en el país y está impulsando el aumento actual en más de la mitad de los estados. Estimamos que la variante Delta está circulando en los 32 estados mientras que la variante Gamma está circulando en 26.
Estimamos que en todo el país, al 30 de agosto aproximadamente el 67% de las personas han sido infectadas, con altas tasas de contagio en los estados del norte, centro y península de Yucatán. Si bien en general, el 85% de las personas dicen que aceptarían una vacuna contra el COVID-19, esa cifra varía ampliamente del 71% en Colima al 92% en Hidalgo. Esperamos que al ritmo actual, 78,3 millones de personas recibirán al menos una dosis de vacuna para el 1 de diciembre. En nuestro escenario de referencia actual, esperamos que para el 1 de diciembre, el 84% de las personas sean inmunes a las variantes sin escape y 72% de las personas será inmune a las variantes de escape. El uso de mascarillas, otra característica fundamental que influye en la transmisión, se ha mantenido constante desde la semana pasada, y 82% de las personas dice que siempre usaban una mascarilla al salir de casa. Estimamos que se salvarían 4.500 vidas si a partir de la próxima semana el 95% de las personas llevaran siempre una mascarilla al salir de casa.
Nuestro escenario de referencia, que representa lo que pensamos que es más probable que suceda, proyecta 300,000 muertes acumuladas reportadas el 1 de diciembre, lo que representa 39,000 muertes adicionales desde el 30 de agosto hasta entonces. Nuestro peor escenario, proyecta 330,000 muertes acumuladas reportadas el 1 de diciembre, y 30,000 muertes adicionales en comparación con nuestro escenario de referencia.
También anticipamos que entre ahora y el 1 de diciembre, 19 estados tendrán una presión alta o extrema en las camas de hospital, mientras que en 20 tendrá la presión alta o extrema será en la capacidad de la unidad de cuidados intensivos (UCI).

covid19.healthdata.org 2 Institute for Health Metrics and Evaluation
Detener la transmisión será muy difícil debido al rechazo a la vacuna, la disminución de la inmunidad natural, y derivada de la vacuna para la infección y la posible aparición de nuevas variantes. El comportamiento, incluida la vacunación, el uso de mascarillas y el distanciamiento social, siguen siendo fundamentales para cambiar la trayectoria de esta pandemia. Se debe considerar la implementación de estrategias de reducción de daños teniendo en cuenta que la reducción de daños a largo plazo requiere niveles muy altos de vacunación en la población mayor de 60 años y en los menores de 60 que tienen un mayor riesgo de hospitalización y muerte. Por lo tanto, será fundamental centrarse en aumentar la vacunación a través de la divulgación, los mandatos de los empleadores y las escuelas, y facilitar la vacunación de todos los grupos. La reducción de daños también requerirá el uso de mascarillas estacionales o el uso de mascarillas relacionadas con el aumento repentino en la población en riesgo, además de la vacunación.
Situación actual • Las infecciones diarias en la última semana disminuyeron a 272,100 por día en promedio en comparación con 286,700 la semana anterior. (Figura 1). El censo hospitalario diario en la última semana (hasta el 19 de agosto) disminuyó a 11,000 por día en promedio en comparación con 11,400 la semana anterior.
• Los casos notificados diariamente en la última semana disminuyeron a 15,700 por día en promedio en comparación con 16,500 la semana anterior (Figura 2).
• Las muertes reportadas por COVID-19 en la última semana disminuyeron a 610 por día en promedio en comparación con 640 la semana anterior (Figura 3).
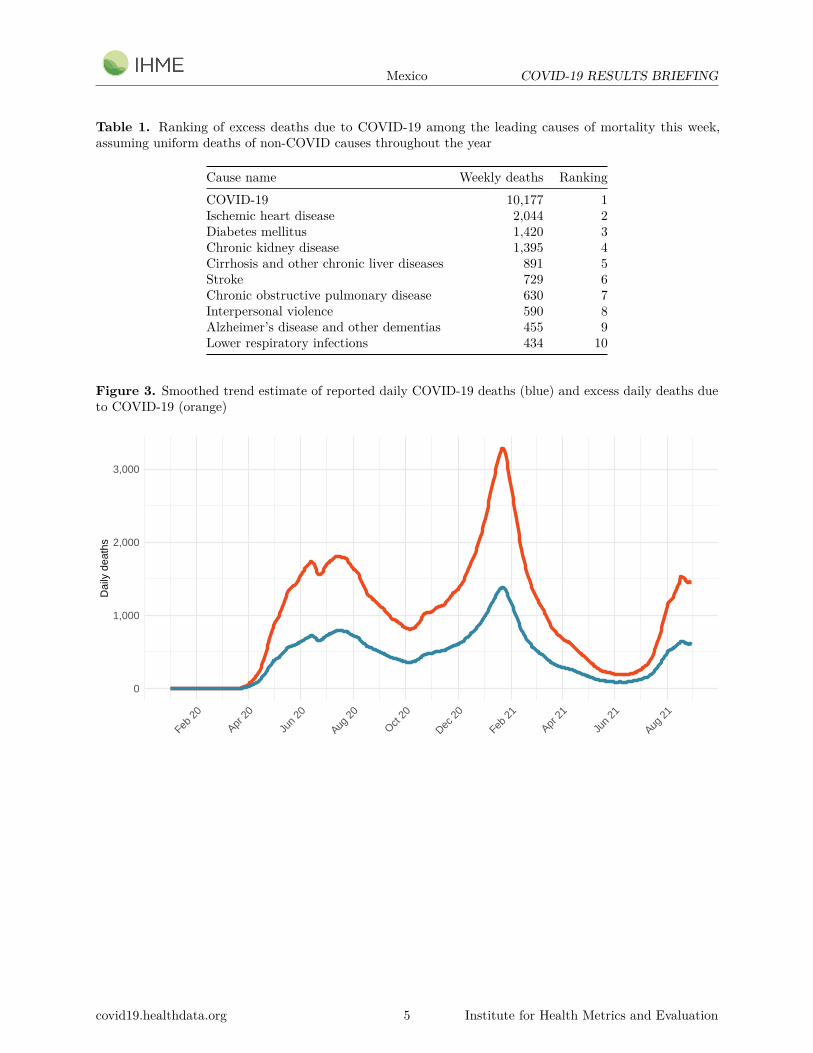
• El exceso de muertes por COVID-19 en la última semana disminuyó a 1.500 por día en promedio en comparación con las 1.500 de la semana anterior (Figura 3). Esto convierte a COVID-19 en la causa número 1 de muerte en México esta semana (Tabla 1). El exceso de muertes diarias estimado debido a COVID-19 fue 2,3 veces mayor que el número de muertes reportadas.
• La tasa de muerte por COVID-19 reportada diariamente es mayor a 4 por millón en 23 estados (Figura 4A).
• La tasa diaria de exceso de muertes por COVID-19 es superior a 4 por millón en 30 estados (Figura 4B).
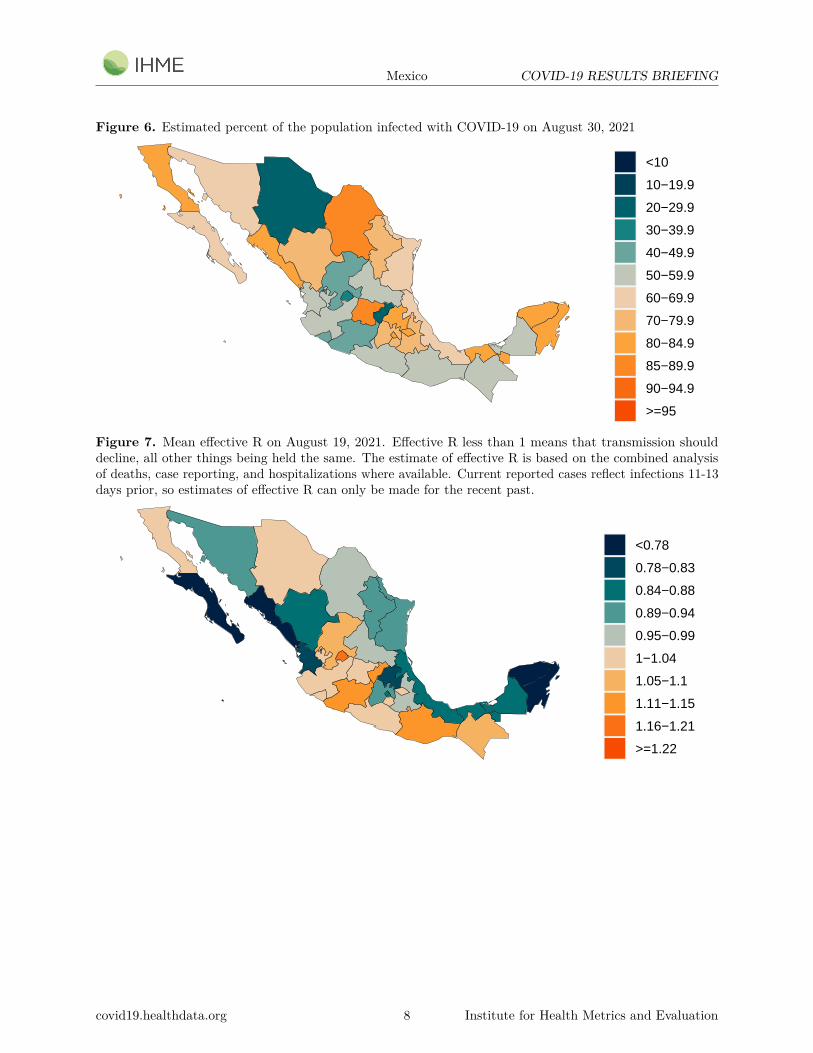
• Estimamos que el 67% de las personas en México han sido infectadas al 30 de agosto (Figura 6).
• La R efectiva, calculada usando casos, hospitalizaciones y muertes, es mayor que 1 en 14 estados (Figura 7).
• La tasa de detección de infecciones en México fue cercana al 5% el 30 de agosto (Figura 8).
• Basándonos en el GISAID y varias bases de datos nacionales, combinado con nuestro modelo de dispersión de variantes, estimamos la prevalencia actual de variantes de interés
covid19.healthdata.org 3 Institute for Health Metrics and Evaluation
(Figura 9). Estimamos que la variante Beta no circula en ningún estado, que la variante Delta circula en 31 estados y que la variante Gamma circula en 26 estados.
Tendencias en los impulsores de la transmisión • La movilidad la semana pasada fue 4% menor que la línea de base anterior a COVID-19 (Figura 11). La movilidad estuvo cerca de la línea de base (dentro del 10%) en 24 estados. La movilidad fue inferior a 30% de la línea de base en Campeche y Nuevo León.
• Al 30 de agosto, en la Encuesta de Tendencias e Impacto de COVID-19, 82% de las personas informan que siempre usaban una máscara al salir de casa en co0mparación con 81% de la semana pasada (Figura 13).
• Se realizaron 27 pruebas de diagnóstico por cada 100,000 personas el 30 de agosto (Figura 15).
• En México, el 85% de las personas dicen que aceptarían o probablemente aceptarían una vacuna para COVID-19. Esto es 0,1 puntos porcentuales más que la semana pasada. La proporción de la población que está dispuesta a recibir la vacuna COVID-19 oscila entre el 71% en Colima y el 92% en Hidalgo (Figura 19).
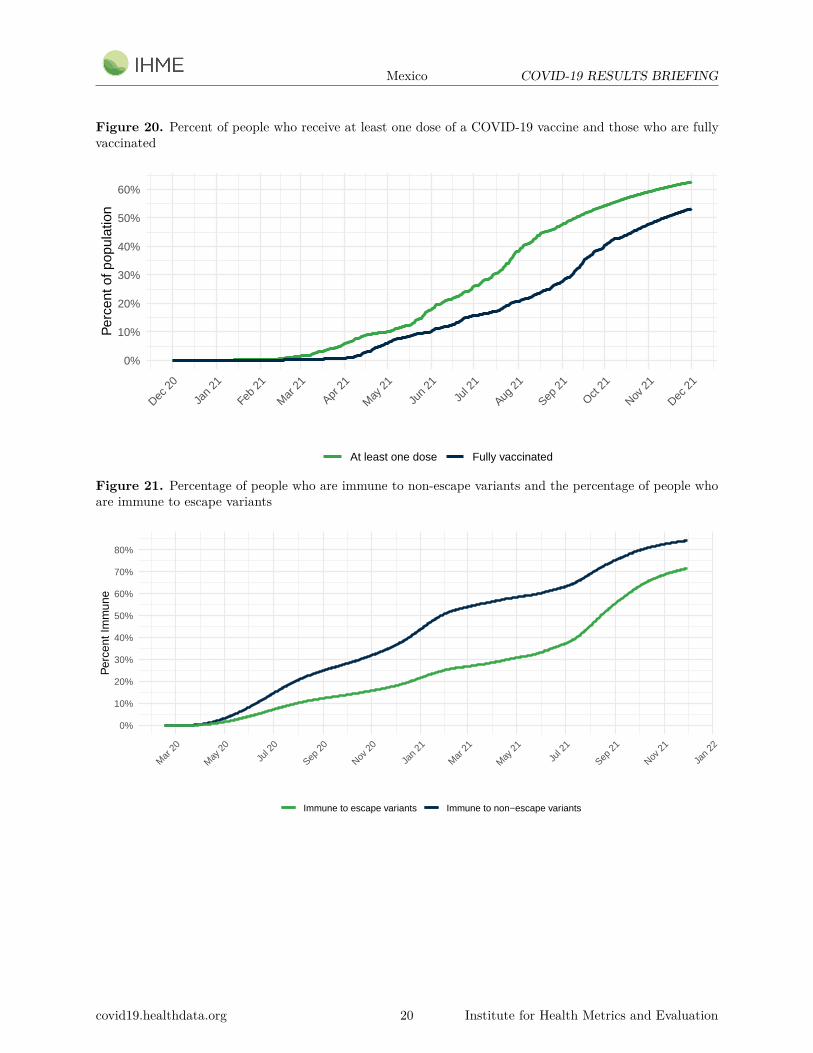
• En nuestro escenario de referencia actual, esperamos que 78,3 millones de personas estén vacunadas con al menos una dosis para el 1 de diciembre (Figura 20).
• En nuestro escenario de referencia actual, esperamos que para el 1 de diciembre, el 84% de las personas sean inmunes a las variantes sin escape y el 72% de las personas serán inmunes a las variantes de escape (Figura 21).
Proyecciones • En nuestro escenario de referencia, que representa lo que creemos que es más probable que suceda, nuestro modelo proyecta 300,000 muertes reportadas acumuladas debido a COVID-19 el 1 de diciembre. Esto representa 39,000 muertes adicionales del 30 de agosto al 1 de diciembre. Las muertes reportadas diariamente disminuirán. a 220 el 1 de diciembre de 2021 (Figura 22).
• Bajo nuestro escenario de referencia, nuestro modelo proyecta 698,000 muertes en exceso acumuladas debido a COVID-19 el 1 de diciembre. Esto representa 95,000 muertes adicionales del 30 de agosto al 1 de diciembre (Figura 22).
• Si se alcanzara la cobertura universal de mascarillas (95%) en la próxima semana, nuestro modelo proyecta 4.500 muertes reportadas acumulativas menos en comparación con el escenario de referencia el 1 de diciembre.
• En nuestro peor escenario, nuestro modelo proyecta 330,000 muertes acumuladas reportadas el 1 de diciembre, 30.000 muertes adicionales en comparación con nuestro escenario de referencia. Las muertes reportadas diariamente en el peor escenario aumentarán a 1.050 para el 21 de octubre de 2021 (Figura 22).

covid19.healthdata.org 4 Institute for Health Metrics and Evaluation
• Las infecciones diarias en el escenario de referencia se reducirán a 60.260 el 1 de diciembre de 2021 (Figura 23). Las infecciones diarias en el peor escenario aumentarán a 469,570 para el 23 de septiembre de 2021 (Figura 23).
• Los casos diarios en el escenario de referencia se reducirán a 5.310 el 1 de diciembre de 2021 (Figura 24). Los casos diarios en el peor escenario aumentarán a 30,150 para el 10 de octubre de 2021 (Figura 24).
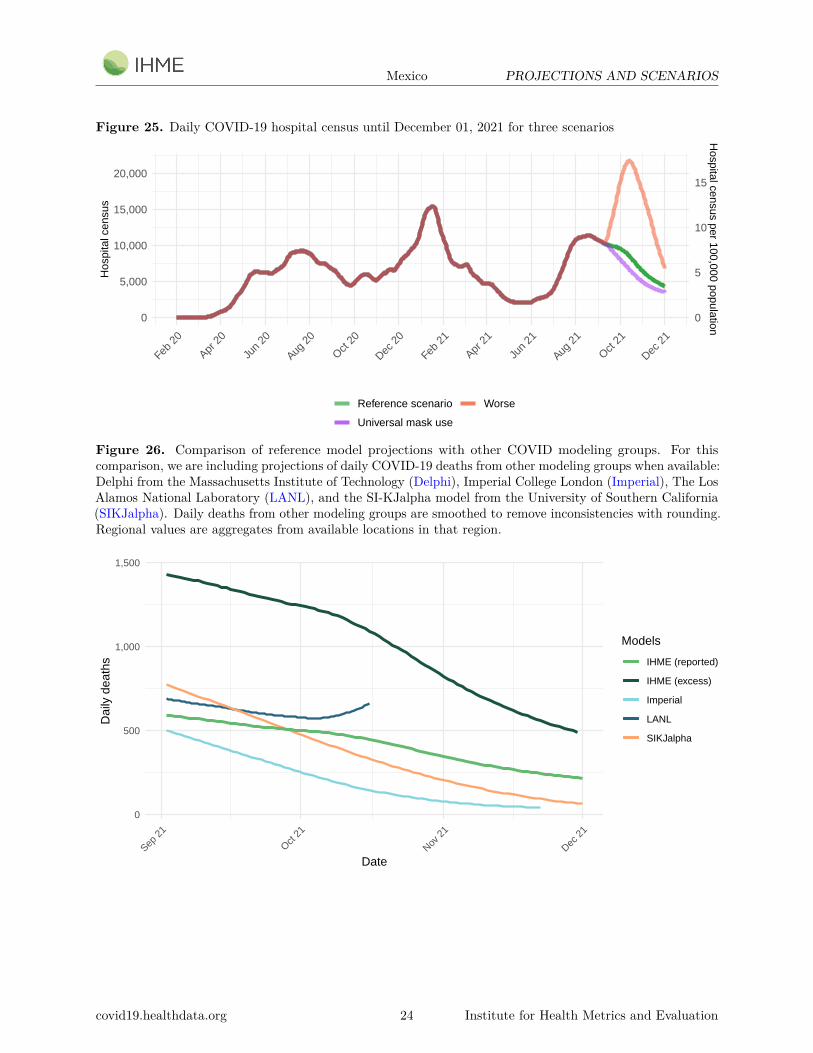
• El censo hospitalario diario en el escenario de referencia se reducirá a 4.280 el 1 de diciembre de 2021 (Figura 25). El censo hospitalario diario en el peor escenario aumentará a 21.710 para el 13 de octubre de 2021 (Figura 25).
• La Figura 26 compara nuestros pronósticos de escenarios de referencia con otros modelos archivados públicamente. Los pronósticos son muy divergentes.
• En algún momento, desde agosto hasta el 1 de diciembre, 19 estados tendrán un estrés alto o extremo en las camas de hospital (Figura 27). En algún momento, desde agosto hasta el 1 de diciembre, 20 estados tendrán un estrés alto o extremo en la capacidad de la unidad de cuidados intensivos (UCI) (Figura 28).
Actualizaciones de modelos Para 22 estados de EE. UU., Hemos observado una concordancia temporal deficiente durante las últimas semanas al comparar (a) muertes, hospitalizaciones y casos con (b) encuestas de seroprevalencia después de realizar correcciones específicas de ensayo para la seroconversión. Para mejorar esto, cambiamos las suposiciones en el modelo sobre qué ensayo se usó en esos estados en particular, de uno con disminuciones sustanciales en la sensibilidad a lo largo del tiempo a uno con una sensibilidad a largo plazo más sólida, lo que resultó en un ajuste más pequeño para estos datos. y, por tanto, estimaciones más bajas de seroprevalencia. Los siguientes son ejemplos de Florida. La figura superior muestra el enfoque anterior; la figura inferior muestra el nuevo enfoque. Los cuadrados se informan, los círculos se corrigen después.
covid19.healthdata.org 5 Institute for Health Metrics and Evaluation
COVID-19 Results Briefing
Mexico
September 1, 2021 This document contains summary information on the latest projections from the IHME model on COVID-19 in Mexico. The model was run on August 31, 2021, with data through August 19, 2021.
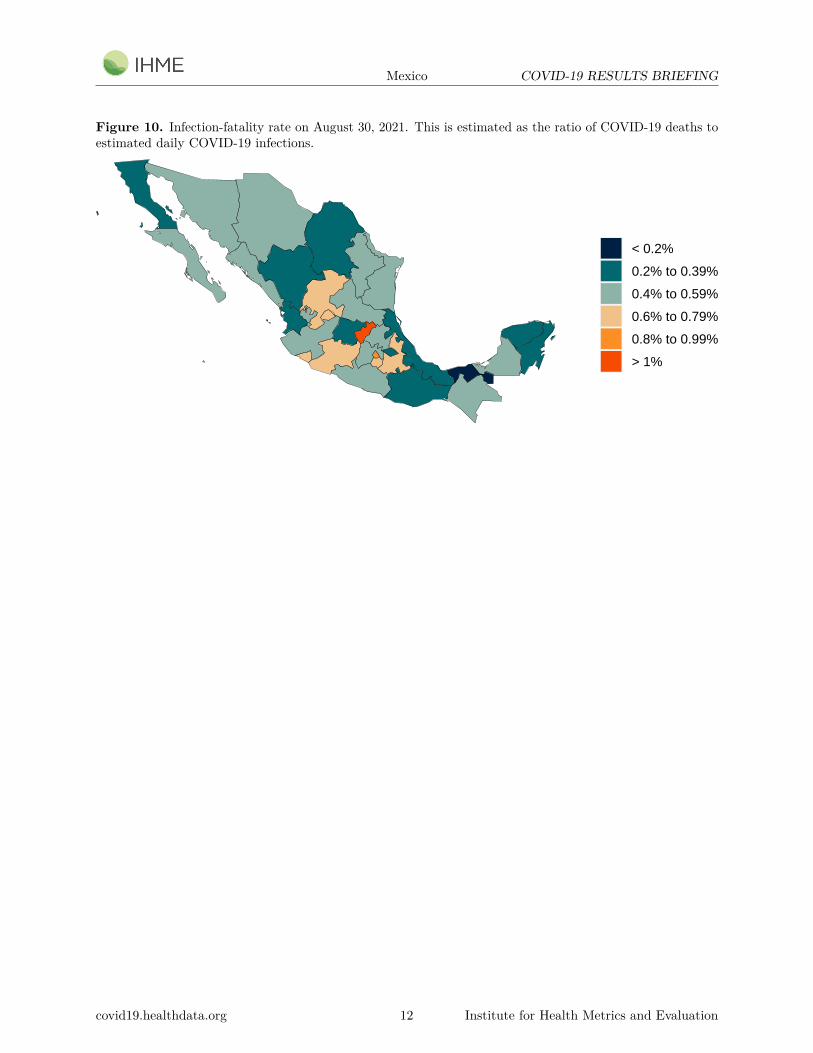
The Delta surge in Mexico continues to unfold in some states, but on average has started declining slightly. Nevertheless, COVID-19 remains the number one cause of death this week. While the daily reported deaths have decreased 4.7% (from 640 to 610 per day), the daily reported cases also have decreased by 4.8% (from 16,500 to 15,700 per day). The infection-fatality ratio is higher than 0.8% in Mexico City and Queretaro, and the daily reported death rate is higher than 4 per million in 23 states. Mean effective R is greater than 1 in 14 states, indicating increased transmission in those areas, but the infection-detection ratio is very low, near 5%. There is not a geographical pattern of areas of increased transmission, because the Delta variant has quickly become predominant and is driving the current surge. We estimate that the Delta variant is circulating in 32 states while the Gamma variant is circulating in 26. We estimate that across the country, as of August 30 approximately 67% of people have been infected, with infection rates high in the states of the north, center, and Yucatan Peninsula. While overall, 85% of people say they would accept a vaccine for COVID-19, that figure varies widely, from 71% in Colima to 92% in Hidalgo. We expect that at the current rate, 78.3 million people will receive at least one vaccine dose by December 1. In our current reference scenario, we expect that by December 1, 84% of people will be immune to non-escape variants and 72% of people will be immune to escape variants. Mask use, another critical feature influencing transmission, has remained constant since last week, with 82% of people saying that they always wore a mask when leaving home. We estimate that 4,500 lives would be saved if from next week, 95% of people always wore a mask when leaving home. Our reference scenario, which represents what we think is most likely to happen, projects 300,000 cumulative reported deaths on December 1, representing 39,000 additional deaths from August 30 to then. Our worse scenario projects 330,000 cumulative reported deaths on December 1, an additional 30,000 deaths compared to our reference scenario. We also anticipate that between now and December 1, 19 states will have high or extreme stress on hospital beds while 20 will have high or extreme stress on intensive care unit (ICU) capacity.

covid19.healthdata.org 6 Institute for Health Metrics and Evaluation
Halting transmission will be very difficult due to vaccine hesitancy, waning natural and vaccine-derived immunity for infection, and the potential emergence of new variants. Behaviors, including vaccination, mask wearing, and social distancing, remain critical in changing the trajectory of this pandemic. Consideration should be given to implementation of harm reduction strategies, keeping in mind that long-term harm reduction requires very high levels of vaccination in the population over 60 and in those under 60 who have increased risk of hospitalization and death. Therefore, a focus on increasing vaccination through outreach, employer and school mandates, and making it easy for all groups to be vaccinated will be critical. Harm reduction will also require seasonal mask use or surge-related mask use in the at-risk population in addition to vaccination.
Current situation • Daily infections in the last week decreased to 272,100 per day on average compared to
286,700 the week before (Figure 1). Daily hospital census in the last week (through August 19) decreased to 11,000 per day on average compared to 11,400 the week before.
• Daily reported cases in the last week decreased to 15,700 per day on average compared to 16,500 the week before (Figure 2).
• Reported deaths due to COVID-19 in the last week decreased to 610 per day on average compared to 640 the week before (Figure 3).
• Excess deaths due to COVID-19 in the last week were 1,500 per day on average, the same as the week before (Figure 3). This makes COVID-19 the number 1 cause of death in Mexico this week (Table 1). Estimated excess daily deaths due to COVID-19 were 2.4 times larger than the reported number of deaths.
• The daily reported COVID-19 death rate is greater than 4 per million in 23 states (Figure 4).
• The daily rate of excess deaths due to COVID-19 is greater than 4 per million in 30 states (Figure 4).
• We estimate that 67% of people in Mexico have been infected as of August 30 (Figure 6).
• Effective R, computed using cases, hospitalizations, and deaths, is greater than 1 in 14 states (Figure 7).
• The infection-detection rate in Mexico was close to 5% on August 30 (Figure 8).
• Based on the GISAID and various national databases, combined with our variant spread model, we estimate the current prevalence of variants of concern (Figure 9). We estimate that the Beta variant is circulating in no states, that the Delta variant is circulating in 31 states, and that the Gamma variant is circulating in 26 states.

covid19.healthdata.org 7 Institute for Health Metrics and Evaluation
Trends in drivers of transmission • Mobility last week was 4% lower than the pre-COVID-19 baseline (Figure 11). Mobility
was near baseline (within 10%) in 24 states. Mobility was lower than 30% of baseline in Campeche and Nuevo León.
• As of August 30, in the COVID-19 Trends and Impact Survey, 82% of people self-report that they always wore a mask when leaving their home compared to 81% last week (Figure 13).
• There were 27 diagnostic tests per 100,000 people on August 30 (Figure 15).
• In Mexico, 85% of people say they would accept or would probably accept a vaccine for COVID-19. This is up by 0.1 percentage points from last week. The proportion of the population who are open to receiving a COVID-19 vaccine ranges from 71% in Colima to 92% in Hidalgo (Figure 19).
• In our current reference scenario, we expect that 78.3 million people will be vaccinated with at least one dose by December 1 (Figure 20).
• In our current reference scenario, we expect that by December 1, 84% of people will be immune to non-escape variants and 72% of people will be immune to escape variants (Figure 21).
Projections • In our reference scenario, which represents what we think is most likely to happen,
our model projects 300,000 cumulative reported deaths due to COVID-19 on December 1. This represents 39,000 additional deaths from August 30 to December 1. Daily reported deaths will decline to 220 on December 1, 2021 (Figure 22).
• Under our reference scenario, our model projects 698,000 cumulative excess deaths due to COVID-19 on December 1. This represents 95,000 additional deaths from August 30 to December 1 (Figure 22).
• If universal mask coverage (95%) were attained in the next week, our model projects 4,500 fewer cumulative reported deaths compared to the reference scenario on December 1.
• Under our worse scenario, our model projects 330,000 cumulative reported deaths on December 1, an additional 30,000 deaths compared to our reference scenario. Daily reported deaths in the worse scenario will rise to 1,050 by October 21, 2021 (Figure 22).
• Daily infections in the reference scenario will decline to 60,260 on December 1, 2021 (Figure 23). Daily infections in the worse scenario will rise to 469,570 by September 23, 2021 (Figure 23).
• Daily cases in the reference scenario will decline to 5,310 on December 1, 2021 (Figure 24). Daily cases in the worse scenario will rise to 30,150 by October 10, 2021 (Figure 24).

covid19.healthdata.org 8 Institute for Health Metrics and Evaluation
• Daily hospital census in the reference scenario will decline to 4,280 on December 1, 2021 (Figure 25). Daily hospital census in the worse scenario will rise to 21,710 by October 13, 2021 (Figure 25).
• Figure 26 compares our reference scenario forecasts to other publicly archived models. Forecasts are widely divergent.
At some point from August through December 1, 19 states will have high or extreme stress on hospital beds (Figure 27). At some point from August through December 1, 20 states will have high or extreme stress on intensive care unit (ICU) capacity (Figure 28).

Mexico COVID-19 RESULTS BRIEFING
Model updatesFor 22 US states, we have observed poor temporal concordance over recent weeks when comparing (a)deaths, hospitalizations, and cases to (b) seroprevalence surveys after performing assay-specific correctionsfor sero-reversion. To improve this, we changed the assumptions in the model as to which assay was used inthose particular states – from one with substantial declines in sensitivity over time to one with more robustlong-term sensitivity – which resulted in a smaller adjustment for these data, and thus lower estimates ofseroprevalence. The below are examples from Florida. The top figure shows the previous approach; the lowerfigure shows the new approach. Squares are reported, circles are post-correction.
covid19.healthdata.org 3 Institute for Health Metrics and Evaluation

Mexico COVID-19 RESULTS BRIEFING
Figure 1. Daily COVID-19 hospital census and infections
0
100,000
200,000
300,000
Feb
20
Apr 2
0
Jun
20
Aug 2
0
Oct 20
Dec 2
0
Feb
21
Apr 2
1
Jun
21
Aug 2
1
Num
ber
of p
eopl
e
Daily hospital census Daily infections
Figure 2. Reported daily COVID-19 cases, moving average
0
5,000
10,000
15,000
Feb
20
Apr 2
0
Jun
20
Aug 2
0
Oct 20
Dec 2
0
Feb
21
Apr 2
1
Jun
21
Aug 2
1
Cou
nt
Daily cases
covid19.healthdata.org 4 Institute for Health Metrics and Evaluation
Mexico COVID-19 RESULTS BRIEFING
Table 1. Ranking of excess deaths due to COVID-19 among the leading causes of mortality this week,assuming uniform deaths of non-COVID causes throughout the year
Cause name Weekly deaths RankingCOVID-19 10,177 1Ischemic heart disease 2,044 2Diabetes mellitus 1,420 3Chronic kidney disease 1,395 4Cirrhosis and other chronic liver diseases 891 5Stroke 729 6Chronic obstructive pulmonary disease 630 7Interpersonal violence 590 8Alzheimer’s disease and other dementias 455 9Lower respiratory infections 434 10
Figure 3. Smoothed trend estimate of reported daily COVID-19 deaths (blue) and excess daily deaths dueto COVID-19 (orange)
0
1,000
2,000
3,000
Feb
20
Apr 2
0
Jun
20
Aug 2
0
Oct 20
Dec 2
0
Feb
21
Apr 2
1
Jun
21
Aug 2
1
Dai
ly d
eath
s
covid19.healthdata.org 5 Institute for Health Metrics and Evaluation

Mexico COVID-19 RESULTS BRIEFING
Figure 4. Daily COVID-19 death rate per 1 million on August 30, 2021
A. Daily reported COVID-19 death rate per 1 million
<1
1 to 1.9
2 to 2.9
3 to 3.9
4 to 4.9
5 to 5.9
6 to 6.9
7 to 7.9
>=8
B. Daily excess COVID-19 death rate per 1 million
<1
1 to 1.9
2 to 2.9
3 to 3.9
4 to 4.9
5 to 5.9
6 to 6.9
7 to 7.9
>=8
covid19.healthdata.org 6 Institute for Health Metrics and Evaluation
Mexico COVID-19 RESULTS BRIEFING
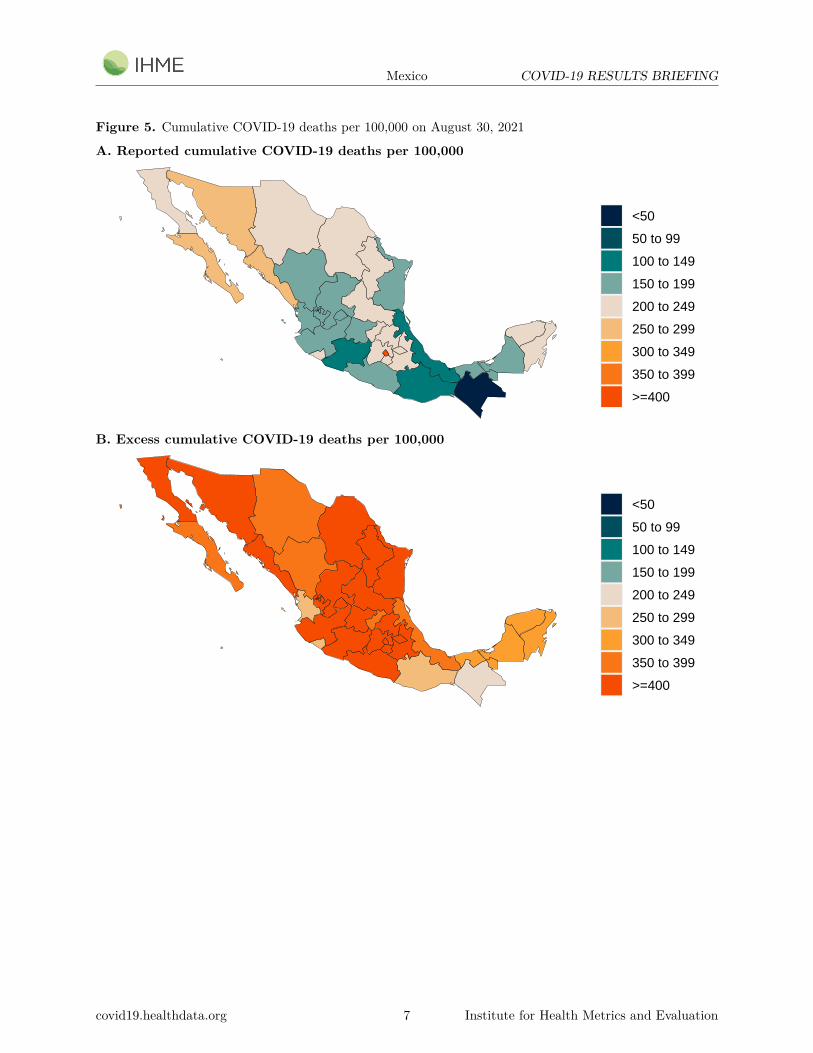
Figure 5. Cumulative COVID-19 deaths per 100,000 on August 30, 2021
A. Reported cumulative COVID-19 deaths per 100,000
<50
50 to 99
100 to 149
150 to 199
200 to 249
250 to 299
300 to 349
350 to 399
>=400
B. Excess cumulative COVID-19 deaths per 100,000
<50
50 to 99
100 to 149
150 to 199
200 to 249
250 to 299
300 to 349
350 to 399
>=400
covid19.healthdata.org 7 Institute for Health Metrics and Evaluation
Mexico COVID-19 RESULTS BRIEFING
Figure 6. Estimated percent of the population infected with COVID-19 on August 30, 2021
<10
10−19.9
20−29.9
30−39.9
40−49.9
50−59.9
60−69.9
70−79.9
80−84.9
85−89.9
90−94.9
>=95
Figure 7. Mean effective R on August 19, 2021. Effective R less than 1 means that transmission shoulddecline, all other things being held the same. The estimate of effective R is based on the combined analysisof deaths, case reporting, and hospitalizations where available. Current reported cases reflect infections 11-13days prior, so estimates of effective R can only be made for the recent past.
<0.78
0.78−0.83
0.84−0.88
0.89−0.94
0.95−0.99
1−1.04
1.05−1.1
1.11−1.15
1.16−1.21
>=1.22
covid19.healthdata.org 8 Institute for Health Metrics and Evaluation

Mexico COVID-19 RESULTS BRIEFING
Figure 8. Percent of COVID-19 infections detected. This is estimated as the ratio of reported dailyCOVID-19 cases to estimated daily COVID-19 infections based on the SEIR disease transmission model. Dueto measurement errors in cases and testing rates, the infection-detection rate can exceed 100% at particularpoints in time.
0%
25%
50%
75%
100%
Mar
20
May
20
Jul 2
0
Sep 2
0
Nov 2
0
Jan
21
Mar
21
May
21
Jul 2
1
Sep 2
1
Per
cent
of i
nfec
tions
det
ecte
d
Argentina United States of America Colombia Mexico Brazil
covid19.healthdata.org 9 Institute for Health Metrics and Evaluation

Mexico COVID-19 RESULTS BRIEFING
Figure 9. Estimated percent of circulating SARS-CoV-2 for primary variant families on August 30, 2021
A. Estimated percent Alpha variant
0%
1−9%
10−24%
25−49%
50−74%
75−89%
90−100%
B. Estimated percent Beta variant
0%
1−9%
10−24%
25−49%
50−74%
75−89%
90−100%
covid19.healthdata.org 10 Institute for Health Metrics and Evaluation

Mexico COVID-19 RESULTS BRIEFING
C. Estimated percent Delta variant
0%
1−9%
10−24%
25−49%
50−74%
75−89%
90−100%
D. Estimated percent Gamma variant
0%
1−9%
10−24%
25−49%
50−74%
75−89%
90−100%
covid19.healthdata.org 11 Institute for Health Metrics and Evaluation
Mexico COVID-19 RESULTS BRIEFING
Figure 10. Infection-fatality rate on August 30, 2021. This is estimated as the ratio of COVID-19 deaths toestimated daily COVID-19 infections.
< 0.2%
0.2% to 0.39%
0.4% to 0.59%
0.6% to 0.79%
0.8% to 0.99%
> 1%
covid19.healthdata.org 12 Institute for Health Metrics and Evaluation

Mexico COVID-19 RESULTS BRIEFING
Critical driversTable 2. Current mandate implementation
Prim
ary
scho
ol c
losu
reS
econ
dary
sch
ool c
losu
reH
ighe
r sc
hool
clo
sure
Bor
ders
clo
sed
to a
ny n
on−
resi
dent
Bor
ders
clo
sed
to a
ll no
n−re
side
nts
Indi
vidu
al m
ovem
ents
res
tric
ted
Cur
few
for
busi
ness
esIn
divi
dual
cur
few
Gat
herin
g lim
it: 6
indo
or, 1
0 ou
tdoo
rG
athe
ring
limit:
10
indo
or, 2
5 ou
tdoo
rG
athe
ring
limit:
25
indo
or, 5
0 ou
tdoo
rG
athe
ring
limit:
50
indo
or, 1
00 o
utdo
orG
athe
ring
limit:
100
indo
or, 2
50 o
utdo
orR
esta
uran
ts c
lose
dB
ars
clos
edR
esta
uran
ts /
bars
clo
sed
Res
taur
ants
/ ba
rs c
urbs
ide
only
Gym
s, p
ools
, oth
er le
isur
e cl
osed
Non
−es
sent
ial r
etai
l clo
sed
Non
−es
sent
ial r
etai
l cur
bsid
e on
lyN
on−
esse
ntia
l wor
kpla
ces
clos
edS
tay
hom
e or
der
Sta
y ho
me
fine
Mas
k m
anda
teM
ask
man
date
fine
ZacatecasYucatán
Veracruz de Ignacio de la LlaveTlaxcala
TamaulipasTabascoSonoraSinaloa
San Luis PotosíQuintana Roo
QuerétaroPuebla
OaxacaNuevo León
NayaritMéxico
MorelosMichoacán de Ocampo
Mexico CityJalisco
HidalgoGuerrero
GuanajuatoDurango
ColimaCoahuila
ChihuahuaChiapas
CampecheBaja California Sur
Baja CaliforniaAguascalientes
Mandate in placeMandate in place(imposed this week)Mandate in place(updated from previous reporting)
No mandateNo mandate(lifted this week)No mandate(updated from previous reporting)
covid19.healthdata.org 13 Institute for Health Metrics and Evaluation

Mexico COVID-19 RESULTS BRIEFING
Figure 11. Trend in mobility as measured through smartphone app use, compared to January 2020 baseline
−75
−50
−25
0
Jan
20
Mar
20
May
20
Jul 2
0
Sep 2
0
Nov 2
0
Jan
21
Mar
21
May
21
Jul 2
1
Sep 2
1
Per
cent
red
uctio
n fr
om a
vera
ge m
obili
ty
Argentina United States of America Colombia Mexico Brazil
Figure 12. Mobility level as measured through smartphone app use, compared to January 2020 baseline(percent) on August 30, 2021
=<−50
−49 to −45
−44 to −40
−39 to −35
−34 to −30
−29 to −25
−24 to −20
−19 to −15
−14 to −10
>−10
covid19.healthdata.org 14 Institute for Health Metrics and Evaluation

Mexico COVID-19 RESULTS BRIEFING
Figure 13. Trend in the proportion of the population reporting always wearing a mask when leaving home
0
25
50
75
Mar
20
May
20
Jul 2
0
Sep 2
0
Nov 2
0
Jan
21
Mar
21
May
21
Jul 2
1
Sep 2
1
Per
cent
of p
opul
atio
n
Argentina United States of America Colombia Mexico Brazil
Figure 14. Proportion of the population reporting always wearing a mask when leaving home on August 30,2021
0%
<10%
10−20%
20−30%
30−40%
40−50%
50−60%
60−70%
70−80%
80−90%
90−100%
covid19.healthdata.org 15 Institute for Health Metrics and Evaluation

Mexico COVID-19 RESULTS BRIEFING
Figure 15. Trend in COVID-19 diagnostic tests per 100,000 people
0
200
400
Mar
20
May
20
Jul 2
0
Sep 2
0
Nov 2
0
Jan
21
Mar
21
May
21
Jul 2
1
Sep 2
1
Test
per
100
,000
pop
ulat
ion
Argentina United States of America Colombia Mexico Brazil
Figure 16. COVID-19 diagnostic tests per 100,000 people on August 30, 2021
<5
5 to 9.9
10 to 24.9
25 to 49
50 to 149
150 to 249
250 to 349
350 to 449
450 to 499
>=500
covid19.healthdata.org 16 Institute for Health Metrics and Evaluation

Mexico COVID-19 RESULTS BRIEFING
Table 3. Estimates of vaccine efficacy for specific vaccines used in the model at preventing disease andinfection. The SEIR model uses variant-specific estimates of vaccine efficacy at preventing symptomaticdisease and at preventing infection. We use data from clinical trials directly, where available, and makeestimates otherwise. More information can be found on our website.
Vaccine
Efficacy atpreventing disease:
ancestral andAlpha
Efficacy atpreventing infection:ancestral and Alpha
Efficacy atpreventing disease:Beta, Delta, &
Gamma
Efficacy atpreventing infection:
Beta, Delta, &Gamma
AstraZeneca 85% 52% 83% 57%CoronaVac 50% 44% 43% 38%Covaxin 78% 69% 68% 60%Johnson &Johnson
86% 72% 85% 56%
Moderna 94% 89% 93% 80%Novavax 89% 79% 79% 69%Pfizer/BioNTech 92% 86% 90% 78%Sinopharm 73% 65% 63% 56%Sputnik-V 92% 81% 80% 70%TianjinCanSino
66% 58% 57% 50%
Othervaccines
75% 66% 65% 57%
Othervaccines(mRNA)
91% 86% 89% 78%
covid19.healthdata.org 17 Institute for Health Metrics and Evaluation

Mexico COVID-19 RESULTS BRIEFING
Figure 18. Trend in the estimated proportion of the adult (18+) population that have been vaccinated orwould probably or definitely receive the COVID-19 vaccine if available
0
25
50
75
100
Jan
21
Feb
21
Mar
21
Apr 2
1
May
21
Jun
21
Jul 2
1
Aug 2
1
Sep 2
1
Per
cent
of p
opul
atio
n
Argentina United States of America Colombia Mexico Brazil
Figure 19. This figure shows the estimated proportion of the adult (18+) population that has been vaccinatedor would probably or definitely receive the COVID-19 vaccine if available
<50%
50−59%
60−69%
70−74%
75−79%
80−84%
>85%
covid19.healthdata.org 19 Institute for Health Metrics and Evaluation
Mexico COVID-19 RESULTS BRIEFING
Figure 20. Percent of people who receive at least one dose of a COVID-19 vaccine and those who are fullyvaccinated
0%
10%
20%
30%
40%
50%
60%
Dec 2
0
Jan
21
Feb
21
Mar
21
Apr 2
1
May
21
Jun
21
Jul 2
1
Aug 2
1
Sep 2
1
Oct 21
Nov 2
1
Dec 2
1
Per
cent
of p
opul
atio
n
At least one dose Fully vaccinated
Figure 21. Percentage of people who are immune to non-escape variants and the percentage of people whoare immune to escape variants
0%
10%
20%
30%
40%
50%
60%
70%
80%
Mar
20
May
20
Jul 2
0
Sep 2
0
Nov 2
0
Jan
21
Mar
21
May
21
Jul 2
1
Sep 2
1
Nov 2
1
Jan
22
Per
cent
Imm
une
Immune to escape variants Immune to non−escape variants
covid19.healthdata.org 20 Institute for Health Metrics and Evaluation

Mexico PROJECTIONS AND SCENARIOS
Projections and scenariosWe produce three scenarios when projecting COVID-19. The reference scenario is our forecast of what wethink is most likely to happen:
• Vaccines are distributed at the expected pace. Brand- and variant-specific vaccine efficacy is updatedusing the latest available information from peer-reviewed publications and other reports.
• Future mask use is the mean of mask use over the last 7 days.• Mobility increases as vaccine coverage increases.• Governments adapt their response by re-imposing social distancing mandates for 6 weeks whenever
daily deaths reach 8 per million, unless a location has already spent at least 7 of the last 14 days withdaily deaths above this rate, and not yet re-imposed social distancing mandates. In this case, thereference scenario assumes that mandates are re-imposed when daily deaths reach 15 per million.
• Variants Alpha, Beta, Gamma, and Delta continue to spread regionally and globally from locationswith sufficient transmission.
The worse scenario modifies the reference scenario assumption in four ways:
• 100% of vaccinated individuals stop using masks.• Mobility increases in all locations to 25% above the pre-pandemic winter baseline, irrespective of vaccine
coverage.• Governments are more reluctant to re-impose social distancing mandates, waiting until the daily death
rate reaches 15 per million, unless a location has already spent at least 7 of the last 14 days with dailydeaths above this rate, and not yet re-imposed social distancing mandates. In this case, the referencescenario assumes that mandates are re-imposed when daily deaths reach 38 per million. In either case,we assume social distancing mandates remain in effect for 6 weeks.
• Variants Alpha, Beta, Gamma, and Delta spread between locations twice as fast when compared withour reference scenario.
The universal masks scenario makes all the same assumptions as the reference scenario but assumes alllocations reach 95% mask use within 7 days.
covid19.healthdata.org 21 Institute for Health Metrics and Evaluation

Mexico PROJECTIONS AND SCENARIOS
Figure 22. Daily COVID-19 deaths until December 01, 2021 for three scenarios
A. Reported daily COVID-19 deaths per 100,000
0
500
1,000
0.0
0.3
0.6
0.9
Feb
20
Apr 2
0
Jun
20
Aug 2
0
Oct 20
Dec 2
0
Feb
21
Apr 2
1
Jun
21
Aug 2
1
Oct 21
Dec 2
1
Dai
ly d
eath
sD
aily deaths per 100,000
Reference scenario
Universal mask use
Worse
B. Excess daily COVID-19 deaths per 100,000
0
1,000
2,000
3,000
0
1
2
Feb
20
Apr 2
0
Jun
20
Aug 2
0
Oct 20
Dec 2
0
Feb
21
Apr 2
1
Jun
21
Aug 2
1
Oct 21
Dec 2
1
Dai
ly d
eath
sD
aily deaths per 100,000
Reference scenario
Universal mask use
Worse
covid19.healthdata.org 22 Institute for Health Metrics and Evaluation

Mexico PROJECTIONS AND SCENARIOS
Figure 23. Daily COVID-19 infections until December 01, 2021 for three scenarios
0
100,000
200,000
300,000
400,000
0
100
200
300
Feb
20
Apr 2
0
Jun
20
Aug 2
0
Oct 20
Dec 2
0
Feb
21
Apr 2
1
Jun
21
Aug 2
1
Oct 21
Dec 2
1
Dai
ly in
fect
ions
Daily infections per 100,000
Reference scenario
Universal mask use
Worse
Figure 24. Daily COVID-19 reported cases until December 01, 2021 for three scenarios
0
10,000
20,000
30,000
0
5
10
15
20
25
Feb
20
Apr 2
0
Jun
20
Aug 2
0
Oct 20
Dec 2
0
Feb
21
Apr 2
1
Jun
21
Aug 2
1
Oct 21
Dec 2
1
Dai
ly c
ases
Daily cases per 100,000
Reference scenario
Universal mask use
Worse
covid19.healthdata.org 23 Institute for Health Metrics and Evaluation
Mexico PROJECTIONS AND SCENARIOS
Figure 25. Daily COVID-19 hospital census until December 01, 2021 for three scenarios
0
5,000
10,000
15,000
20,000
0
5
10
15
Feb
20
Apr 2
0
Jun
20
Aug 2
0
Oct 20
Dec 2
0
Feb
21
Apr 2
1
Jun
21
Aug 2
1
Oct 21
Dec 2
1
Hos
pita
l cen
sus
Hospital census per 100,000 population
Reference scenario
Universal mask use
Worse
Figure 26. Comparison of reference model projections with other COVID modeling groups. For thiscomparison, we are including projections of daily COVID-19 deaths from other modeling groups when available:Delphi from the Massachusetts Institute of Technology (Delphi), Imperial College London (Imperial), The LosAlamos National Laboratory (LANL), and the SI-KJalpha model from the University of Southern California(SIKJalpha). Daily deaths from other modeling groups are smoothed to remove inconsistencies with rounding.Regional values are aggregates from available locations in that region.
0
500
1,000
1,500
Sep 2
1
Oct 21
Nov 2
1
Dec 2
1
Date
Dai
ly d
eath
s
Models
IHME (reported)
IHME (excess)
Imperial
LANL
SIKJalpha
covid19.healthdata.org 24 Institute for Health Metrics and Evaluation

Mexico PROJECTIONS AND SCENARIOS
Figure 27. The estimated inpatient hospital usage is shown over time. The percent of hospital beds occupiedby COVID-19 patients is color-coded based on observed quantiles of the maximum proportion of beds occupiedby COVID-19 patients. Less than 5% is considered low stress, 5-9% is considered moderate stress, 10-19% isconsidered high stress, and 20% or greater is considered extreme stress.
Zacatecas
Yucatán
Veracruz de Ignacio de la Llave
Tlaxcala
Tamaulipas
Tabasco
Sonora
Sinaloa
San Luis Potosí
Quintana Roo
Querétaro
Puebla
Oaxaca
Nuevo León
Nayarit
México
Morelos
Michoacán de Ocampo
Mexico City
Jalisco
Hidalgo
Guerrero
Guanajuato
Durango
Colima
Coahuila
Chihuahua
Chiapas
Campeche
Baja California Sur
Baja California
Aguascalientes
Mar
20
May
20
Jul 2
0
Sep 2
0
Nov 2
0
Jan
21
Mar
21
May
21
Jul 2
1
Sep 2
1
Nov 2
1
Jan
22
Stress level
Low
Moderate
High
Extreme
All hospital beds
covid19.healthdata.org 25 Institute for Health Metrics and Evaluation

Mexico PROJECTIONS AND SCENARIOS
Figure 28. The estimated intensive care unit (ICU) usage is shown over time. The percent of ICU bedsoccupied by COVID-19 patients is color-coded based on observed quantiles of the maximum proportion ofICU beds occupied by COVID-19 patients. Less than 10% is considered low stress, 10-29% is consideredmoderate stress, 30-59% is considered high stress, and 60% or greater is considered extreme stress.
Zacatecas
Yucatán
Veracruz de Ignacio de la Llave
Tlaxcala
Tamaulipas
Tabasco
Sonora
Sinaloa
San Luis Potosí
Quintana Roo
Querétaro
Puebla
Oaxaca
Nuevo León
Nayarit
México
Morelos
Michoacán de Ocampo
Mexico City
Jalisco
Hidalgo
Guerrero
Guanajuato
Durango
Colima
Coahuila
Chihuahua
Chiapas
Campeche
Baja California Sur
Baja California
Aguascalientes
Mar
20
May
20
Jul 2
0
Sep 2
0
Nov 2
0
Jan
21
Mar
21
May
21
Jul 2
1
Sep 2
1
Nov 2
1
Jan
22
Stress level
Low
Moderate
High
Extreme
Intensive care unit beds
covid19.healthdata.org 26 Institute for Health Metrics and Evaluation

Mexico MORE INFORMATION
More informationData sources:
Mask use and vaccine confidence data are from the The Delphi Group at Carnegie Mellon University andUniversity of Maryland COVID-19 Trends and Impact Surveys, in partnership with Facebook. Mask use dataare also from Premise, the Kaiser Family Foundation, and the YouGov COVID-19 Behaviour Tracker survey.
Genetic sequence and metadata are primarily from the GISAID Initiative. Further details available on theCOVID-19 model FAQ page.
A note of thanks:
We wish to warmly acknowledge the support of these and others who have made our COVID-19 estimationefforts possible.
More information:
For all COVID-19 resources at IHME, visit http://www.healthdata.org/covid.
To download our most recent results, visit our Data downloads page.
Questions? Requests? Feedback? Please contact us at https://www.healthdata.org/covid/contact-us.
covid19.healthdata.org 27 Institute for Health Metrics and Evaluation