Finanzas II - Tasas 1C 2009
38
Facultad de Ciencias Sociales y Económicas Universidad Católica Argentina www.condensadordeflujo.wordpress.com TASAS Finanzas II - LAE Ezequiel CALVIÑO Alejandro M. SALEVSKY Juan M. CASCONE Sabrina REY Santiago De LAVALLAZ Adrián ECKER Juan Pablo BARREIRA
-
Upload
finanzasuca -
Category
Documents
-
view
1.676 -
download
2
Transcript of Finanzas II - Tasas 1C 2009

Facultad de Ciencias Sociales y EconómicasUniversidad Católica Argentina
www.condensadordeflujo.wordpress.com
TASAS
Finanzas II - LAE
Ezequiel CALVIÑOAlejandro M. SALEVSKYJuan M. CASCONESabrina REYSantiago De LAVALLAZAdrián ECKERJuan Pablo BARREIRA

CERCA DEL CLIENTE
2
YIELDCURVE INDICE
1. Noticias
2. Repaso de Tasas
3. Ejercicios Tasas
4. Spot & Forward Rates / Yield Curve

CERCA DEL CLIENTE
3
YIELDCURVE
Noticias

CERCA DEL CLIENTE
4
YIELDCURVE REPASO
1. Interes simple vs. compuesto
2. TNA VS. TEA
3. Tasa equivalente
4. Tasa de interés vs. tasa de descuento
5. Tasa nominal vs. Tasa Real

CERCA DEL CLIENTE
5
YIELDCURVE
1. Interés simple vs. compuesto
2.900
3.400
3.900
4.400
4.900
5.400
5.900
6.400
6.900
7.400
7.900
0 1 2 3 4 5 6 7 8 9 10
Tiempo
$ C
apit
al fi
nal
Interés simple
Interés compuesto

CERCA DEL CLIENTE
6
YIELDCURVE
2. TNA vs. TEA
Es la tasa de retorno que Es la tasa de retorno que efectivamente se efectivamente se obtiene por realizar una obtiene por realizar una inversiinversióón durante un n durante un determinado perdeterminado perííodoodo
Es la tasa efectiva de una Es la tasa efectiva de una operacioperacióón proporcionada al n proporcionada al aañño. No indica con precisio. No indica con precisióón el n el rendimiento de la operacirendimiento de la operacióón ya n ya que no considera el efecto de que no considera el efecto de la capitalizacila capitalizacióón de intereses.n de intereses.

CERCA DEL CLIENTE
7
YIELDCURVE
3. Tasas Equivalentes
=

CERCA DEL CLIENTE
8
YIELDCURVE
4. Tasa de interés vs. Tasa de descuento

CERCA DEL CLIENTE
9
YIELDCURVE
5. Tasa nominal vs. Tasa Real
(1+n) = (1+i) x (1+(1+n) = (1+i) x (1+φφ))

CERCA DEL CLIENTE
10
YIELDCURVE
Ejercicios

CERCA DEL CLIENTE
11
YIELDCURVE YTM – YIELD TO MATURITY
Generalidades
•Es la tasa de retorno promedio anual que se obtendrá por una inversión si se la mantiene desde hoy hasta su vencimiento (maturity date)
•Es la tasa de mercado que hace que el flujo de fondos descontadode un bono sea igual a su precio .
Ejemplo
•Se tiene un bono con un valor nominal de $100, tasa cupón del 10% (anual) y madurez a 5 años (amortización total a fin del período). Calcular el precio (valor actual) del bono si
•YTM=10.00%
•YTM=12.00%
•YTM=8.00%
•RTA:
•100.00
•92.79
•107.99
¿Qué relación existe entre la actividad económica de un país y sus niveles inflacionarios?
¿Qué relación existe en un país entre los niveles inflacionarios y los ?
¿Qué relación existe entre el valor de un bono (inversión),
la tasa cupón (tasa pactada) y la YTM (tasa de mercado) en
una economía?

CERCA DEL CLIENTE
12
YIELDCURVE RISK FREE RATE
Generalidades
•Títulos emitidos por el US Department of the Treasury, están respaldados por el gobierno de USA, por lo que son considerados por todos como títulos sin riesgo de crédito
•EEUU al ser mayor emisor de deuda en el mundo y dado gran volumen de cada emisión, hacen que el mercado de estos títulos sea el más activo y el más líquido del mundo
Tipos •Hay dos categorías de US Treasury securities: discount(vencimiento a 1 año o menos) y coupon
Risk Premium
•Es el rendimiento extra por sobre un bono libre de riesgo. Ej: yield Bono Tesoro: 8% y bono “X”: 9% => riesgo adicional (spread) 100 basis points

CERCA DEL CLIENTE
13
YIELDCURVE SPOT RATE
Generalidades
•Es la YTM del bono discount (zero-coupon). Se expresa en forma efectiva anual (TEA). Ej: una S2 es la tasa efectiva anual de un bono zero-coupon de dos años de madurez.
•Un bono (inversión) con cupones y/o amortizaciones (pagos) parciales puede transformarse en un bono zero-coupon
Ejemplo#1
•Calcular la spot rate de un bono zero coupon de madurez 1 año, precio actual de 938.58 y valor nominal de 1.000
•Calcular la spot rate de un bono zero coupon de madurez 2 años, precio actual 857.34 y valor nominal de 1.000
Síntetizaciónde bonos
cupón
•Se puede encontrar la tasa spot para más de un año utilizando en bonos con cupon tasas spots conocidas para descontar los flujosanuales previos
Ejemplo#2•Se tiene un bono (inversión) que paga 50.00 por año y vence en dos años. Su precio actual es de 946.93.
(946.93)
50.00 1.050.00
1+S1=1.07 1+S2=?
CERCA DEL CLIENTE
14
YIELDCURVE FORWARD RATE
Generalidades
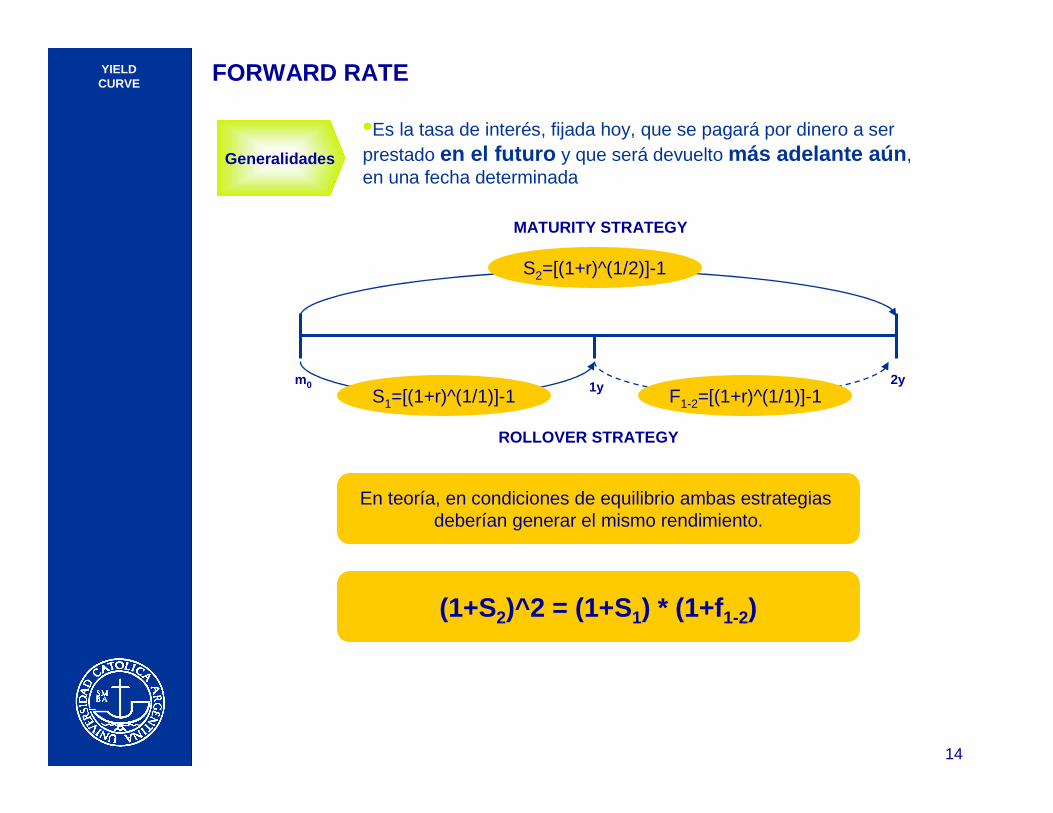
•Es la tasa de interés, fijada hoy, que se pagará por dinero a ser prestado en el futuro y que será devuelto más adelante aún , en una fecha determinada
m0 1y 2y
S2=[(1+r)^(1/2)]-1
S1=[(1+r)^(1/1)]-1 F1-2=[(1+r)^(1/1)]-1
MATURITY STRATEGY
ROLLOVER STRATEGY
En teoría, en condiciones de equilibrio ambas estrategias deberían generar el mismo rendimiento.
(1+S2)^2 = (1+S 1) * (1+f1-2)

CERCA DEL CLIENTE
15
YIELDCURVE FORWARD RATE
Ejemplo
•Se tienen los siguientes bonos emitidos por el gobierno. Determinar la Spot1, f1-2 y f2-3
Bono mo y1 y2 y3
A
B
C
(909.09)
(991.81)
(977.18)
1.000
100
100
1.100
100 1.100
Investments. Sharpe 6th edition. Pag 132. Exercise 14

CERCA DEL CLIENTE
16
YIELDCURVE YIELD CURVE
Generalidades
•El gráfico que muestra la relación del retorno (yield) de bonos con la misma calificación crediticia (bonos del Tesoro USA), pero con diferentes vencimientos (maturities
•La yield curve está armada a partir de observaciones de precios y retornos en el Treasury market, porque 1) Treasurysecurities son libres de default risk 2) al ser el mercado más grande y activo, hay pocos problemas de iliquidez

CERCA DEL CLIENTE
17
YIELDCURVE LAS FORMAS DE LA YIELD CURVE
t
r
NORMAL
t
r
HUMPED
t
r
INVERTIDA
t
r
FLAT
¿Qué relación existe entre la actividad económica de un país y sus niveles inflacionarios?
¿Qué relación existe en un país entre los niveles inflacionarios y los ?
•¿Cuál esta asociada con una recesión en el futuro?•¿Con el riesgo asociado al tiempo?•¿una transición económica?•¿Qué relación existe entre la pendiente y la brecha de rendimientos corto/largo plazo?

CERCA DEL CLIENTE
18
YIELDCURVE TEORÍA DE LAS EXPECTATIVAS
Generalidades
Ejemplo
•Si un bono zero coupon ofrece a dos años una YTM del 6.00% y un bono zero coupon ofrece a dos años una YTM del 7.00% ¿cuál es la forward rate para el año 3?
•Si la tasa real exigida por los inversores para dicha inversión dado su riesgo es del 4.00%, ¿cuál es la inflación esperada?
(1+S2)^2 = (1+S 1) * (1+f1-2)
donde
(1+f1-2) = (1+r) * (1+φ1-2)
La forward rate representa la opinión promedio de la futura spot rateLa única razón para que la pendiente sea positiva es que los inversores esperan que los tasas de corto plazo en el futuro sean mayores que las actualesEl mercado espera que la spot rate cambie porque la tasa real o la tasa de inflación va a cambiar
CERCA DEL CLIENTE
19
YIELDCURVE TEORÍA DE LA PREFERENCIA DE LA LIQUIDEZ
Generalidades
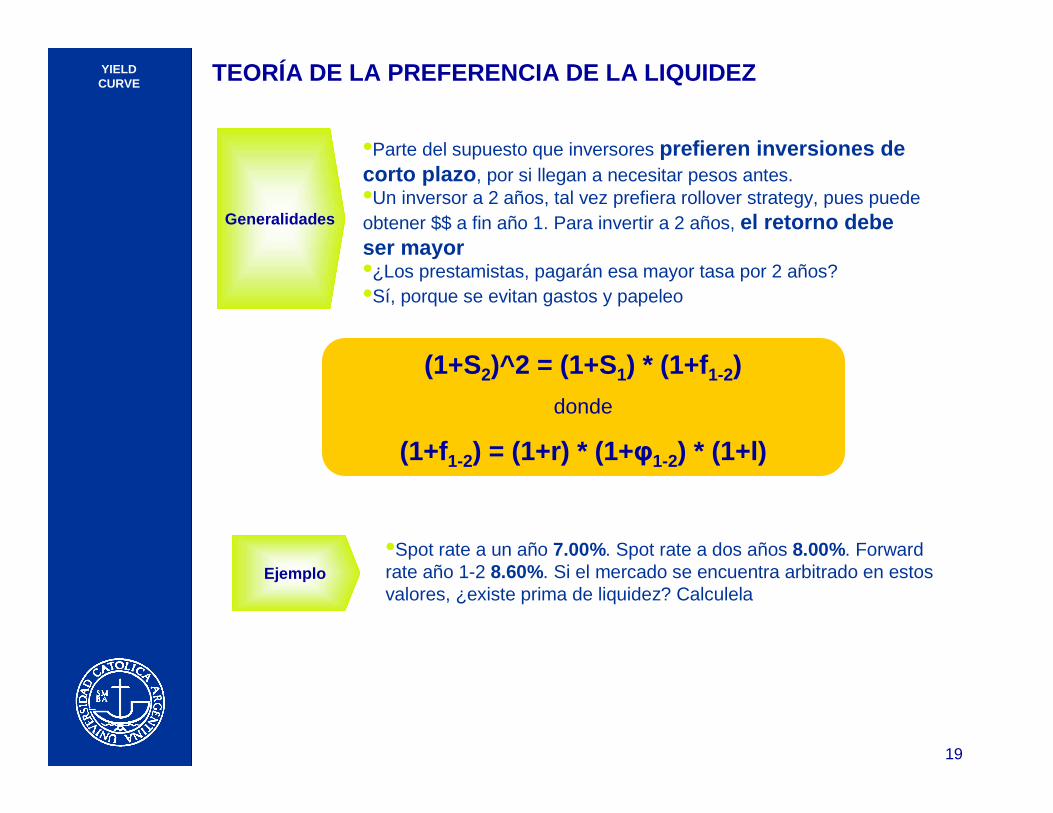
Ejemplo•Spot rate a un año 7.00%. Spot rate a dos años 8.00%. Forwardrate año 1-2 8.60%. Si el mercado se encuentra arbitrado en estos valores, ¿existe prima de liquidez? Calculela
(1+S2)^2 = (1+S 1) * (1+f1-2)
donde
(1+f1-2) = (1+r) * (1+φ1-2) * (1+l)
•Parte del supuesto que inversores prefieren inversiones de corto plazo , por si llegan a necesitar pesos antes. •Un inversor a 2 años, tal vez prefiera rollover strategy, pues puede obtener $$ a fin año 1. Para invertir a 2 años, el retorno debe ser mayor•¿Los prestamistas, pagarán esa mayor tasa por 2 años?•Sí, porque se evitan gastos y papeleo

CERCA DEL CLIENTE
20
YIELDCURVE TEORÍA DE SEGMENTACIÓN DE LOS MERCADOS
Generalidades
•Los inversores tienen habitats preferidos , (corto o largo plazo), a los cuales están restringidos por ley, preferencias o costumbre
•Los bonos corto plazo demandados por bancos. Bonos largo plazo demandados por fondos de pensión. Cada grupo demanda diferentes plazos, entonces el mercado se segmenta
•Inversores y prestamistas no están dispuestos a cambiarde un sector a otro para tomar ventaja de oportunidades que surjan
•Las spot rates están determinadas por las condiciones de la oferta y la demanda de cada mercado
•Una curva con pendiente positiva tiene lugar cuando la intersección de la oferta y la demanda para fondos a corto plazo ocurre a menores tasas que para los fondos a largo plazo
CERCA DEL CLIENTE
21
YIELDCURVE UTILIDAD DE LA YIELD CURVE
¿Qué relación existe entre la actividad económica de un país y sus niveles inflacionarios?
¿Qué relación existe en un país entre los niveles inflacionarios y los costos de financiamiento?
¿Un aumento de los US Securities puede tener implicancias en el la economía local?
¿Qué variables cree Ud. que pueden ser obtenidas usando como proxy la YC?
?
AR
BIT
RA
JE
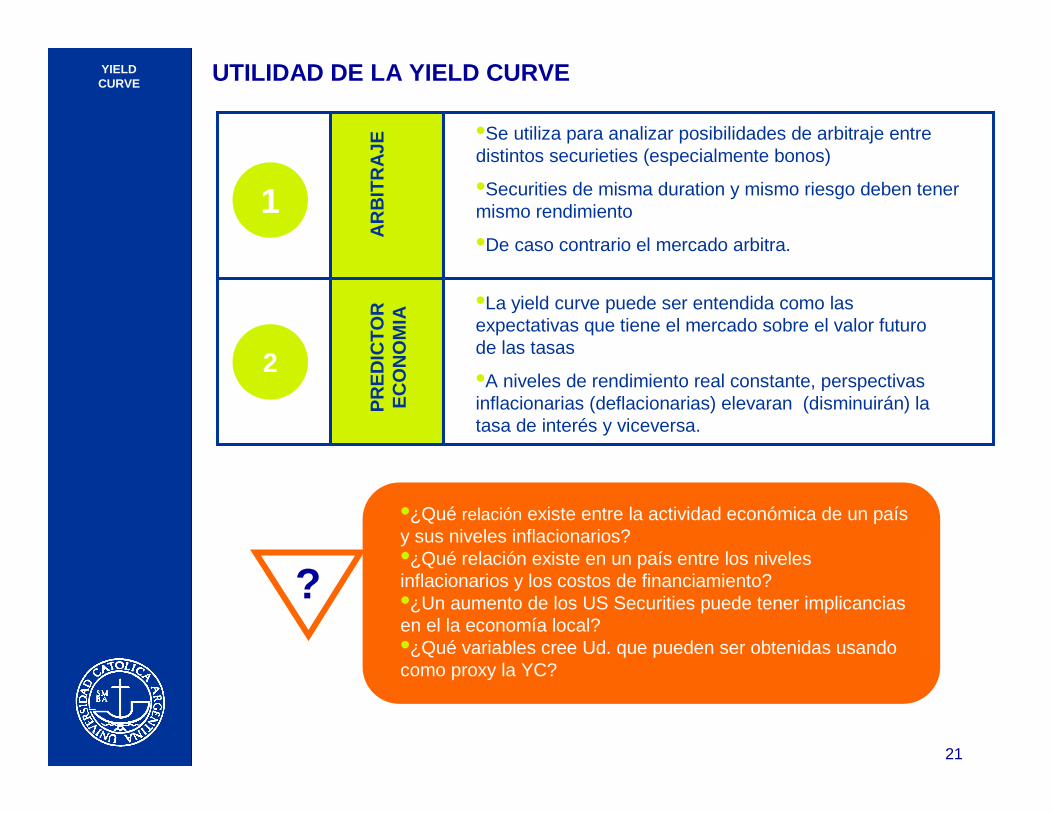
•Se utiliza para analizar posibilidades de arbitraje entre distintos securieties (especialmente bonos)
•Securities de misma duration y mismo riesgo deben tener mismo rendimiento
•De caso contrario el mercado arbitra.
1
PR
ED
ICT
OR
E
CO
NO
MIA
•La yield curve puede ser entendida como las expectativas que tiene el mercado sobre el valor futuro de las tasas
•A niveles de rendimiento real constante, perspectivas inflacionarias (deflacionarias) elevaran (disminuirán) la tasa de interés y viceversa.
2
•¿Qué relación existe entre la actividad económica de un país y sus niveles inflacionarios?•¿Qué relación existe en un país entre los niveles inflacionarios y los costos de financiamiento?•¿Un aumento de los US Securities puede tener implicancias en el la economía local?•¿Qué variables cree Ud. que pueden ser obtenidas usando como proxy la YC?

CERCA DEL CLIENTE
22
YIELDCURVE
Inflation Rate: 6.44% Inflation Rate: 14.76%
NORMAL INVERTED
http://www.stockcharts.com/charts/YieldCurve.htmlhttp://inflationdata.com/inflation/inflation_rate/HistoricalInflation.aspx?dsInflation_currentPage=1
YIELD CURVES VS INFLATION (yoy)

CERCA DEL CLIENTE
23
YIELDCURVE
Inflation Rate: 4.60% Inflation Rate: 2.26%
NORMAL FLAT
http://www.stockcharts.com/charts/YieldCurve.htmlhttp://inflationdata.com/inflation/inflation_rate/HistoricalInflation.aspx?dsInflation_currentPage=1
YIELD CURVES VS INFLATION (yoy)

CERCA DEL CLIENTE
24
YIELDCURVE
Inflation Rate: 2.82% Inflation Rate: 2.54%
STEEP FLAT
http://www.stockcharts.com/charts/YieldCurve.htmlhttp://inflationdata.com/inflation/inflation_rate/HistoricalInflation.aspx?dsInflation_currentPage=1
YIELD CURVES VS INFLATION (yoy)

CERCA DEL CLIENTE
25
YIELDCURVE
Inflation Rate: 3.41% Inflation Rate: 1.64%
FLAT STEEP
http://www.stockcharts.com/charts/YieldCurve.htmlhttp://inflationdata.com/inflation/inflation_rate/HistoricalInflation.aspx?dsInflation_currentPage=1
YIELD CURVES VS INFLATION (yoy)

CERCA DEL CLIENTE
26
YIELDCURVE
Inflation Rate: 3.17%
FLAT
Inflation Rate: 3.24%
HUMPED
http://www.stockcharts.com/charts/YieldCurve.htmlhttp://inflationdata.com/inflation/inflation_rate/HistoricalInflation.aspx?dsInflation_currentPage=1
YIELD CURVES VS INFLATION (yoy)

CERCA DEL CLIENTE
27
YIELDCURVE
YIELD CURVE EN ARGENTINA (YTM real)

CERCA DEL CLIENTE
28
YIELDCURVE
YIELD CURVE EN ARGENTINA (YTM real)

CERCA DEL CLIENTE
29
YIELDCURVE
YIELD CURVE ACTUAL EN ARGENTINA (YTM real)

CERCA DEL CLIENTE
30
YIELDCURVE
La siguiente yield curve se obtuvo el pasado 17 de f ebrero del 2009 según los rendimientos de los Bonos del Tesoro de los Estados Unidos.
Actualmente USA se encuentra en una marcada recesió n y no existe aún un consenso entre los especialistas sobre si el moment o del quiebre de tendencia se dará hacia fines del tercer trimestre d el año o dentro del primero o segundo trimestre del 2010. Sin embargo, la actual curva presenta una fuerte pendiente positiva lo cual a pr iori debería indicar altas expectativas de crecimiento económico. ¿Cómo puede Ud. explicar esta situación?

CERCA DEL CLIENTE
31
YIELDCURVE
Back up

CERCA DEL CLIENTE
32
YIELDCURVE
Yield To matuirity
Yield to maturity (YTM) is the yield promised by the bondholder on the assumption that the bond will be heldto maturity, that all coupon and principal payments will be made and coupon payments are reinvested atthe bond's promised yield at the same rate as invested. It is a measurement of the return of the bond. This technique in theory allows investors to calculate the fair value of different financial instruments. TheYTM is almost always given in terms of annual effective rate.
The calculation of YTM is identical to the calculation of internal rate of return.
• If a bond's current yield is less than its YTM, then the bond is selling at a discount.
• If a bond's current yield is more than its YTM, then the bond is selling at a premium.
• If a bond's current yield is equal to its YTM, then the bond is selling at par.
Risk Free Rate
The theoretical rate of return of an investment with zero risk. The risk-free rate represents the interest aninvestor would expect from an absolutely risk-free investment over a specified period of time. In theory, the risk-free rate is the minimum return an investor expects for any investment because he or she willnot accept additional risk unless the potential rate of return is greater than the risk-free rate.
In practice, however, the risk-free rate does not exist because even the safest investments carry a verysmall amount of risk. Thus, the interest rate on a three-month U.S. Treasury bill is often used as the risk-free rate.
Spot Rate
The yield to maturity of a zero-coupon bond, usually a Treasury bond, which is used as a benchmark for otherbond yields and valuations. Because a zero-coupon bond has no coupon payments, there is no reinvestment risk and, therefore, the precise yield to maturity of the bond can be known. Theconstruction of a spot rate Treasury yield curve is used to demonstrate the arbitrage-free relationshipbetween spot rates and forward rates known as the term structure of interest rates. Spot rates are alsoused in the calculation of a zero-volatility spread (Z-spread) used to price certain fixed-income securities.
CERCA DEL CLIENTE
33
YIELDCURVE
Trying To Predict Interest Rates
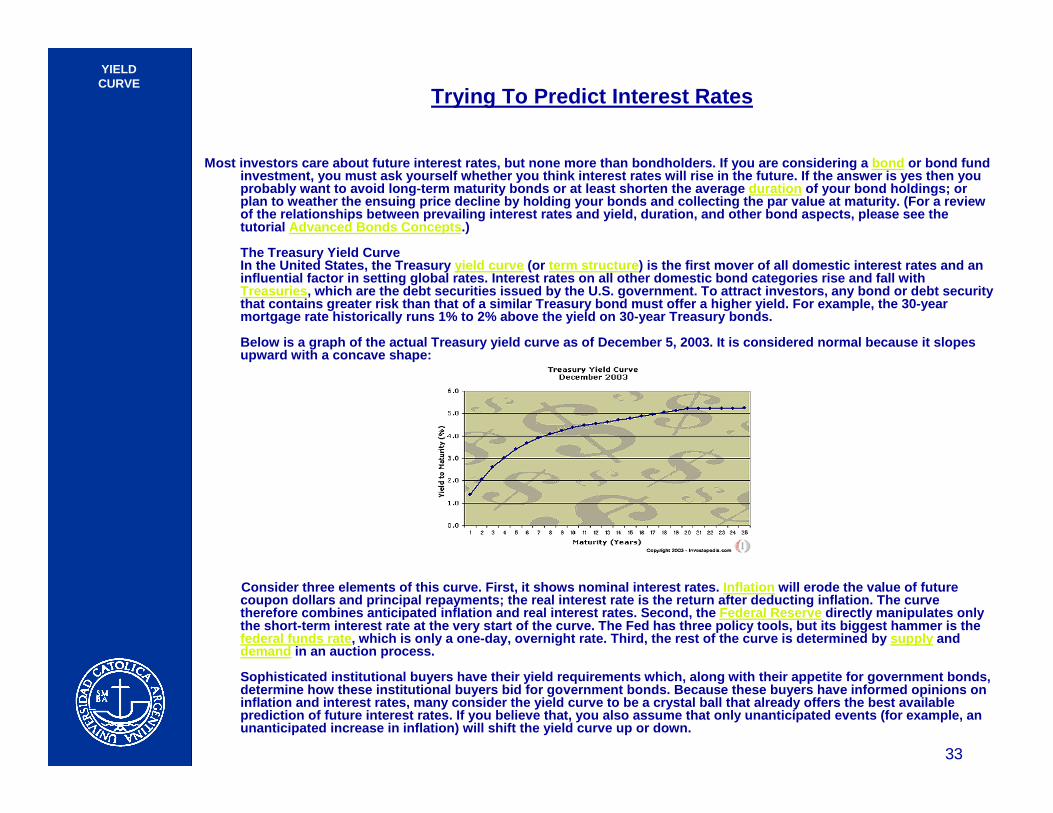
Most investors care about future interest rates, but none m ore than bondholders. If you are considering a bond or bond fundinvestment, you must ask yourself whether you think intere st rates will rise in the future. If the answer is yes then yo uprobably want to avoid long-term maturity bonds or at least s horten the average duration of your bond holdings; orplan to weather the ensuing price decline by holding you r bonds and collecting the par value at maturity. (For a re viewof the relationships between prevailing interest rates and yield, duration, and other bond aspects, please see thetutorial Advanced Bonds Concepts .)
The Treasury Yield CurveIn the United States, the Treasury yield curve (or term structure ) is the first mover of all domestic interest rates and aninfluential factor in setting global rates. Interest r ates on all other domestic bond categories rise and fall withTreasuries , which are the debt securities issued by the U.S. govern ment. To attract investors, any bond or debt securitythat contains greater risk than that of a similar Treasury bond must offer a higher yield. For example, the 30-yearmortgage rate historically runs 1% to 2% above the yield on 30-year Treasury bonds.
Below is a graph of the actual Treasury yield curve as of D ecember 5, 2003. It is considered normal because it slope supward with a concave shape:
Consider three elements of this curve. First, it shows nom inal interest rates. Inflation will erode the value of futurecoupon dollars and principal repayments; the real inter est rate is the return after deducting inflation. The curve therefore combines anticipated inflation and real inter est rates. Second, the Federal Reserve directly manipulates onlythe short-term interest rate at the very start of the curve. The Fed has three policy tools, but its biggest hammer is th efederal funds rate , which is only a one-day, overnight rate. Third, the re st of the curve is determined by supply anddemand in an auction process.
Sophisticated institutional buyers have their yield requi rements which, along with their appetite for government bo nds, determine how these institutional buyers bid for governm ent bonds. Because these buyers have informed opinions oninflation and interest rates, many consider the yield curv e to be a crystal ball that already offers the best availa bleprediction of future interest rates. If you believe that, you also assume that only unanticipated events (for example , anunanticipated increase in inflation) will shift the yiel d curve up or down.
CERCA DEL CLIENTE
34
YIELDCURVE
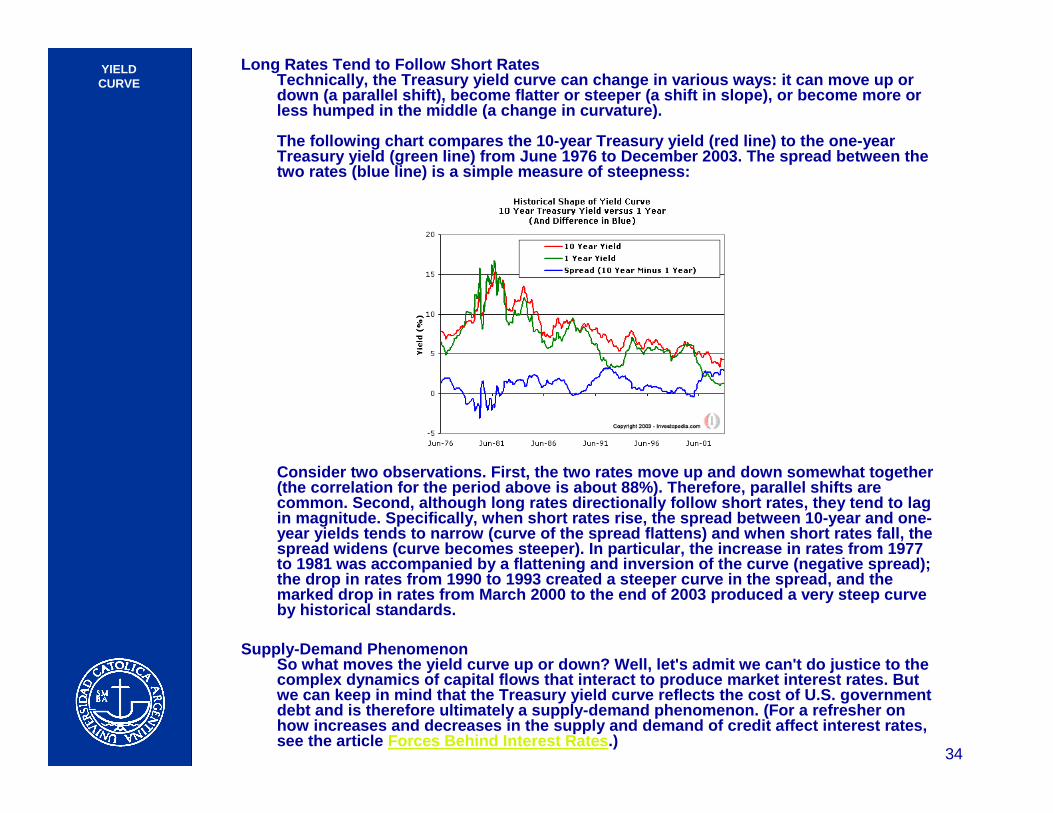
Long Rates Tend to Follow Short RatesTechnically, the Treasury yield curve can change in var ious ways: it can move up ordown (a parallel shift), become flatter or steeper (a shi ft in slope), or become more orless humped in the middle (a change in curvature).
The following chart compares the 10-year Treasury yield (r ed line) to the one-yearTreasury yield (green line) from June 1976 to December 200 3. The spread between thetwo rates (blue line) is a simple measure of steepness:
Consider two observations. First, the two rates move up a nd down somewhat together(the correlation for the period above is about 88%). Theref ore, parallel shifts are common. Second, although long rates directionally foll ow short rates, they tend to lagin magnitude. Specifically, when short rates rise, th e spread between 10-year and one-year yields tends to narrow (curve of the spread flattens) and when short rates fall, thespread widens (curve becomes steeper). In particular, the increase in rates from 1977 to 1981 was accompanied by a flattening and inversion of t he curve (negative spread); the drop in rates from 1990 to 1993 created a steeper curv e in the spread, and themarked drop in rates from March 2000 to the end of 2003 prod uced a very steep curve by historical standards.
Supply-Demand PhenomenonSo what moves the yield curve up or down? Well, let's adm it we can't do justice to thecomplex dynamics of capital flows that interact to produce market interest rates. Butwe can keep in mind that the Treasury yield curve reflects the cost of U.S. governmentdebt and is therefore ultimately a supply-demand phenomen on. (For a refresher onhow increases and decreases in the supply and demand of cre dit affect interest rates, see the article Forces Behind Interest Rates .)

CERCA DEL CLIENTE
35
YIELDCURVE
Supply-Related FactorsMonetary PolicyIf the Fed wants to increase the fed funds rate, it supplies m ore short-term securities in open market operations. Th eincrease in the supply of short-term securities restricts the money in circulation since borrowers give money to theFed. In turn, this decrease in the money supply increase s the short-term interest rate because there is less money in circulation (credit) available for borrowers. By incre asing the supply of short-term securities, the Fed is yanki ng up the very left end of the curve, and the nearby short-term yie lds will snap quickly in lockstep.
Can we predict future short-term rates? Well, the expectations theory says that long-term rates embed a predictionof future short-term rates. But consider the actual Decem ber yield curve illustrated above, which is normal but ve rysteep. The one-year yield is 1.38% and the two-year yield i s 2.06%. If you were going to invest with a two-year time horizon and if interest rates were going to hold steady, you would, of course, do much better to go straight intobuying the two-year bond (which has a much higher yield) i nstead of buying the one-year bond and rolling it overinto another one-year bond. Expectations theory, howeve r, says the market is predicting an increase in the short rate. Therefore, at the end of the year you will be able to r oll over into a more favorable one-year rate and be keptwhole relative to the two-year bond, more or less. In oth er words, expectations theory says that a steep yield curv e predicts higher future short-term rates.
Unfortunately, the pure form of the theory has not perform ed well: interest rates often remain flat during a normal (upward sloping) yield curve. Probably the best explana tion for this is that, because a longer bond requires you toendure greater interest rate uncertainty, there is extra yield contained in the two-year bond. If we look at the yie ldcurve from this point of view, the two-year yield contains two elements: a prediction of the future short-term rateplus extra yield (i.e., a risk premium) for the uncerta inty. So we could say that, while a steeply sloping yield curve portends an increase in the short-term rate, a gently upw ard sloping curve, on the other hand, portends no changein the short-term rate - the upward slope is due only to the ex tra yield awarded for the uncertainty associated withlonger term bonds.
Because Fed watching is a professional sport, it is not eno ugh to wait for an actual change in the fed funds rate, as only surprises count. It is important for you, as a bond i nvestor, to try to stay one step ahead of the rate, anticipating rather than observing its changes. Market pa rticipants around the globe carefully scrutinize the wordi ngof each Fed announcement (and the Fed governors' speeches) in a vigorous attempt to discern future intentions.
Fiscal PolicyWhen the U.S. government runs a deficit, it borrows money by issuing longer term Treasury bonds to institutionallenders. The more the government borrows, the more supp ly of debt it issues. At some point, as the borrowingincreases, the U.S. government must increase the interes t rate to induce further lending. However, foreign lende rswill always be happy to hold bonds in the U.S. government: Treasuries are highly liquid and the U.S. has neverdefaulted (it actually came close to a default in late 199 5, but Robert Rubin, the Treasury secretary at the time, staved off the threat and has called a Treasury default "un thinkable - something akin to nuclear war"). Still, fore ignlenders can easily look to alternatives like eurobonds and, therefore, they are able to demand a higher interes t rate ifthe U.S. tries to supply too much of its debt.

CERCA DEL CLIENTE
36
YIELDCURVE Demand-Related Factors
InflationIf we assume that borrowers of U.S. debt expect a given real return, then an increase in expected inflation will increase the nominal interest rate (the nominal yield = real yield + inflation). Inflation also explains why short-term rates move more rapidly than long-term rates: when the Fed raises short-term rates, long-term rates incr ease to reflect the expectation ofhigher future short-term rates; however, this increase i s mitigated by lower inflationexpectations as higher short-term rates also suggest lowe r inflation (as the Fed sells/suppliesmore short-term Treasuries, it collects money and tighte ns the money supply):
An increase in feds funds (short-term) tends to flatten th e curve because the yield curve reflectsnominal interest rates: higher nominal = higher real i nterest rate + lower inflation.
Fundamental EconomicsThe factors that create demand for Treasuries include econo mic growth, competitivecurrencies and hedging opportunities. Just remember: anything that increases t he demand forlong-term Treasury bonds puts downward pressure on interes t rates (higher demand = higherprice = lower yield or interest rates) and less demand for b onds tends to put upward pressureon interest rates. A stronger U.S. economy tends to make c orporate (private) debt more attractive than government debt, decreasing demand for U. S. debt and raising rates. A weakereconomy, on the other hand, promotes a "flight to quality ", increasing the demand forTreasuries, which creates lower yields. It is sometimes a ssumed that a strong economy willautomatically prompt the Fed to raise short-term rates, bu t not necessarily. Only when growthtranslates or overheats into higher prices is the Fed likely to raise rates.
In the global economy, Treasury bonds compete with othe r nations's debt. On the global stage, Treasuries represent an investment in both the U.S. real interest rates and the dollar. The euro is a particularly important alternative: for most of 2003 , the European Central Bank pegged itsshort-term rate at 2%, a more attractive rate than the fed funds rate of 1%.

CERCA DEL CLIENTE
37
YIELDCURVE
Finally, Treasuries play a huge role in the hedging act ivities of market participants. In environments of falling interest rates, many holders of mo rtgage-backed securities, forinstance, have been hedging their prepayment risk by purc hasing long-term Treasuries. These hedging purchases can play a big role in demand, helping to keep rates low, but theconcern is that they may contribute to instability.
ConclusionWe have covered some of the key traditional factors associat ed with interest ratemovements. On the supply side, monetary policy determine s how much government debtand money are supplied into the economy. On the demand side , inflation expectations are the key factor. However, we have also discussed other impo rtant influences on interestrates, including: fiscal policy (that is, how much doe s the government need to borrow?) andother demand-related factors such as economic growth and c ompetitive currencies.
Here is a summary chart of the different factors influencin g interest rates:

CERCA DEL CLIENTE
38
YIELDCURVE
• 1.- Teoría pura de las expectativas de Fisher . Sostiene que la forma de la curva se debe exclusivamente a las expectativas de los in versores sobre los tipos de interés. La curva tipo - plazo tendrá pendiente posit iva cuando los inversores anticipan tipos de interés crecientes, mientras que tendrán pendiente negativa en el caso contrario.Los tipos de interés a largo plazo serian un promed io entre el tipo de interés a corto plazo en el momento actual y los tipos a cort o plazo que se esperan en el futuro, siendo estos últimos predecibles por los ti pos de interés "a plazo" o "forward" que existen actualmente en los mercados.
• 2. Teoría de la preferencia por la liquidez de Hick s. Mantiene que en un mundo incierto los inversores tienen aversión al riesgo y por lo tanto, los títulos con mayor vencimiento incorporan una prima por riesgo, o bien una prima por perdida de liquidez, que esta incorporada a la rent abilidad. Estas primas crecientes invalida la teoría de Fisher, ya que los tipos forward implícitos en la curva serian predictores sesgados de los tipos futur os.
• 3. Teoría de la segmentación de Mercados de Cullber ston . Reformulada por Modigliani - Sutch es también conocida como teoría del hábitat preferido. Estos autores sostienen que los tipos de interés para un cierto vencimiento solamente están determinados por la oferta y la dem anda de fondos con vencimientos concretos. Para cada vencimiento exist irá un único mercado y los inversores solamente estarán dispuestos a invertir en aquellos vencimientos que obtengan significativas diferencias en la renta bilidad obtenida. De esta forma, seria las presiones institucionales y de inv ersión, con sus respectivas preferencias respecto a vencimientos concretos, los que determinan la curva tipo - plazo.