![Legislación turística municipal. Costa atlántica bonaerense · Legislación Turística Municipal. Costa Atlántica Bonaerense [LA COSTA – PINAMAR – VILLA GESELL] 3 Agradecimientos](https://static.fdocuments.ec/doc/165x107/5f0ca66e7e708231d4367547/legislacin-turstica-municipal-costa-atlntica-bonaerense-legislacin-turstica.jpg)
Evolución de los bosques en la costa Atlántica ibérica durante el … · 2018-02-10 · Tesis...
228
UNIVERSIDAD POLITÉCNICA DE MADRID ESCUELA TÉCNICA SUPERIOR DE INGENIEROS DE MONTES Evolución de los bosques en la costa Atlántica ibérica durante el Cuaternario. Implicaciones paleoclimáticas Quaternary evolution of the Atlantic Iberian coastal forest. Palaeoclimatic Implications TESIS DOCTORAL Ignacio García-Amorena Gómez del Moral Ingeniero de Montes Madrid, 2007
Transcript of Evolución de los bosques en la costa Atlántica ibérica durante el … · 2018-02-10 · Tesis...
UNIVERSIDAD POLITÉCNICA DE MADRID
ESCUELA TÉCNICA SUPERIOR DE INGENIEROS DE MONTES
Evolución de los bosques en la costa Atlántica ibérica durante
el Cuaternario. Implicaciones paleoclimáticas
Quaternary evolution of the Atlantic Iberian coastal forest.
Palaeoclimatic Implications
TESIS DOCTORAL
Ignacio García-Amorena Gómez del Moral
Ingeniero de Montes
Madrid, 2007

Tesis Doctoral García-Amorena, I., 2007
i
UNIVERSIDAD POLITÉCNICA DE MADRID
ESCUELA TÉCNICA SUPERIOR DE INGENIEROS DE MONTES
DEPARTAMENTO DE SILVOPASCICULTURA
Evolución de los bosques en la costa Atlántica ibérica durante
el Cuaternario. Implicaciones paleoclimáticas
Quaternary evolution of the Atlantic Iberian coastal forest.
Palaeoclimatic Implications
TESIS DOCTORAL
Ignacio García-Amorena Gómez del Moral
Ingeniero de Montes
DIRECTORES
SUPERVISORS
Friederike Wagner
Doctora por la Utrecht University
Fernando Gómez Manzaneque
Doctor en Ciencias Biológicas por la Universidad Autónoma
Madrid, 2007

Tesis Doctoral García-Amorena, I., 2007
ii
UNIVERSIDAD POLITÉCNICA DE MADRID
(D-15)
Tribunal nombrado por el Magfco. y Excmo. Sr. Rector de la Universidad
Politécnica de Madrid, el día…………de……………………….de 200….
Presidente: ____________________________________________________
Vocal:________________________________________________________
Vocal:________________________________________________________
Vocal:________________________________________________________
Secretario: ____________________________________________________
Suplente: _____________________________________________________
Suplente: _____________________________________________________
Realizado el acto de defensa y lectura de la Tesis el día......de…………………de 200… en
la E.T.S.I./Facultad………………………………………….
EL PRESIDENTE LOS VOCALES
EL SECRETARIO
Tesis Doctoral García-Amorena, I., 2007
iii
Esta tesis ha sido informada positivamente para su defensa en exposición pública por
los siguientes investigadores:
COMITÉ PARA LA MENCIÓN EUROPEA
Dr. Henk Visscher
Faculty of Science (Department of Biology)
Utrecht University (Holanda)
Dr. Helena Granja
Departamento de Ciências da Terra
Universidade do Minho (Braga, Portugal)
COMITÉ DE LECTURA PREVIA
Dr. Carlos Morla Juaristi
Escuela Técnica Superior de Ingenieros de Montes (Depto. Silvopascicultura)
Universidad Politécnica de Madrid (España)
Dr. Agustín Rubio Sánchez
Escuela Técnica Superior de Ingenieros de Montes (Depto. Silvopascicultura)
Universidad Politécnica de Madrid (España)
Dr. José María Postigo Mijarra
Facultad de Ciencias (Dpto. Biología)
Universidad Autónoma de Madrid (España)
Tesis Doctoral García-Amorena, I., 2007
iv
¡Árboles! ¿Habéis sido flechas caídas del azul? ¿Qué terribles guerreros os lanzaron? ¿Han sido las estrellas? Vuestras músicas vienen del alma de los pájaros, de los ojos de Dios, de la pasión perfecta.
¡Árboles! ¿Conocerán vuestras raíces toscas mi corazón en tierra?
Federico García Lorca
Tesis Doctoral García-Amorena, I., 2007
v
ÍNDICE
RESUMEN ................................................................................................................................vii
1. INTRODUCCIÓN..............................................................................................................1
1.1. Estado de conocimientos paleobotánicos ......................................................... 4
1.2. Marco climático.............................................................................................. 10
1.3. Variación en el nivel del mar.......................................................................... 13
1.4. El papel del CO2 en la dinámica climática ..................................................... 14
1.5. La hoja como biosensor del CO2 atmosférico ................................................ 17
2. OBJETIVOS .....................................................................................................................21
3. ÁREA DE ESTUDIO .......................................................................................................23
4. MATERIALES Y MÉTODOS........................................................................................26
4.1. Descripción de los yacimientos ...................................................................... 26
4.2. Identificación de los restos vegetales ............................................................. 31
4.3. Asignación cronológica .................................................................................. 37
4.4. Parámetros epidérmicos.................................................................................. 37
5. RESULTADOS .................................................................................................................41
5.1. Dataciones ...................................................................................................... 41
5.2. Identificaciones............................................................................................... 41
5.3. Análisis epidérmicos ...................................................................................... 45
5.3.1. Material histórico............................................................................................ 45
5.3.2. Material fósil .................................................................................................. 51
6. DISCUSIÓN......................................................................................................................54
6.1. La composición florística de los bosques en la costa Atlántica ibérica durante
los últimos 34000 años ............................................................................................... 54
6.1.1. Pinus gr. sylvestris-nigra................................................................................ 54
6.1.2. Pinus pinaster ................................................................................................. 55
6.1.3. Otras coníferas................................................................................................ 55
6.1.4. Árboles planocaducifolios .............................................................................. 56
6.1.4.1. Ulmus minor ................................................................................................... 57
6.1.5. Otros taxones .................................................................................................. 58
6.2. Evolución de los bosques en los últimos 34000 años..................................... 59

Tesis Doctoral García-Amorena, I., 2007
vi
6.2.1. Pleistoceno Final ............................................................................................ 59
6.2.2. Holoceno......................................................................................................... 62
6.3. Respuesta de los parámetros estomáticos de Q. robur-petraea al incremento
de CO2 atmosférico. Efecto de la latitud. ................................................................... 65
6.3.1. Las dimensiones estomáticas ante el incremento de CO2 atmosférico........... 69
6.4. Reconstrucción paleoclimática ....................................................................... 72
6.4.1. Pleistoceno superior........................................................................................ 72
6.4.2. Holoceno......................................................................................................... 77
7. CONCLUSIONES ............................................................................................................83
8. BIBLIOGRAFIA ..............................................................................................................87
AGRADECIMIENTOS ACKNOWLEDGEMENTS ............................................................117
ENGLISH VERSION.................................................119
ABSTRACT ............................................................................................................................121
CHAPTER I: Introduction....................................................................................................123
CHAPTER II: Aims of the study ..........................................................................................136
CHAPTER III .........................................................................................................................139
Stomatal responses in deciduous oaks from southern Europe to the anthropogenic
atmospheric CO2 increase; refining the stomatal-based CO2 proxy .................................139
CHAPTER IV .........................................................................................................................155
Atmospheric CO2 radiative forcing during the Holocene Thermal Maximum
revealed by stomatal frequency analysis ..............................................................................155
CHAPTER V...........................................................................................................................169
Impact of the last glacial-interglacial cycle on the coastal forests of western Iberia .......169
CHAPTER VI .........................................................................................................................191
The Holocene forests in the Cantabrian coast of the Iberian Peninsula ...........................191
CHAPTER VII: Conclusions.................................................................................................213
Tesis Doctoral García-Amorena, I., 2007
vii
RESUMEN
Con el objeto de profundizar en el conocimiento sobre la composición y dinámica
del paisaje vegetal de la costa Atlántica ibérica durante el último ciclo glaciar-
interglaciar, se han muestreado 18 yacimientos, de los que se han extraído 228 maderas,
50 frutos y más de 350 restos foliares. Estos restos fueron identificados mediante su
estudio morfológico y anatómico, y datados mediante la asignación cronoestratigráfica
basada en la medición del 14C de restos leñosos. Estos datos permitieron, gracias a las
propiedades de los macrorrestos, deducir el paisaje que existió en las costas ibéricas
desde la desembocadura del río Tajo hasta el Golfo de Vizcaya, desde hace 34000 años
hasta la actualidad. Igualmente, se ha podido afirmar el carácter autóctono de algunos
taxones en la costa Atlántica ibérica, y reconocer la importancia de esta área como
refugio para distintos taxones en momentos glaciares.
Adicionalmente, el conocimiento de la presencia de ciertas poblaciones en el pasado
ha permitido estimar las condiciones paleoclimáticas en la costa Atlántica ibérica.
Igualmente, el estudio anatómico de los restos foliares ha informado sobre las
condiciones atmosféricas del momento en el que se desarrollaron. Estas condiciones,
principalmente la concentración del dióxido de carbono, afectan a distintos parámetros
epidérmicos, como la frecuencia y dimensión de los estomas.
El estudio anatómico de numerosos restos foliares de Quercus robur en la costa
septentrional de la Península Ibérica, ofreció la posibilidad de conocer la evolución del
CO2 atmosférico a lo largo de los últimos 10000 años. Para ello se desarrolló un
modelo, a partir de pliegos de herbario recolectados a lo largo del siglo pasado, que
relaciona la frecuencia estomática de Q. robur-petraea ibéricos con la concentración
atmosférica del CO2. Este modelo ha sido validado para un rango de CO2 específico
(295-330 ppmv), y para poblaciones ubicadas a menos de 1000 m sobre el nivel del
mar. La comparación de dicho modelo con el existente, de aplicación en poblaciones de
Q. robur-petraea holandeses, permitió proponer un modelo común para poblaciones
europeas de Q. robur-petraea por debajo de 1000 m sobre el nivel del mar.
Por último, el conocimiento de la evolución del CO2 atmosférico a lo largo del
Holoceno, en comparación con los registros disponibles de paleotemperatura, ha
permitido distinguir el importante papel de este gas invernadero en la dinámica
climática de los últimos 10000 años.
Tesis Doctoral García-Amorena, I., 2007 Introducción
1
1. INTRODUCCIÓN
La elevada presión que el hombre ha ejercido sobre los recursos naturales en los
últimos milenios es la causa de que actualmente nos encontremos con un entorno
intensamente alterado y cada vez más degradado en la Península Ibérica. La correcta
interpretación del paisaje vegetal que nos rodea y el conocimiento de su interacción con
los factores que han condicionado su evolución son necesarios, entre otras cosas, para
poder llevar a cabo una gestión adecuada de los recursos de nuestros montes. Dicha
interpretación ha de estar basada en datos científicos sobre los acontecimientos
paleobiogeográficos.
El largo periodo de respuesta que caracteriza a la sucesión de formaciones vegetales
hacia el equilibrio con las condiciones ambientales que le rodean, hace difícil realizar
observaciones experimentales sobre dinámica vegetal. La Paleobotánica, al basarse en el
estudio de los restos vegetales que han llegado a nuestros días, y con la aportación de
los conocimientos de ecología vegetal, contribuye a establecer con base científica
modelos de evolución de la vegetación. No obstante esos modelos tienen que ser
revisados continuamente a la luz de las nuevas aportaciones que puedan ofrecer otros
estudios paleobotánicos más recientes (Colin Prentice, 1986; Meyen, 1987).
Los restos vegetales que informan sobre la vegetación que se desarrolló en el pasado
se pueden clasificar en microrrestos y macrorrestos (Lowe & Walker, 1997). Los
primeros, caracterizados por no poder ser observados a simple vista, incluyen pólenes y
esporas, objeto de estudio en Palinología. La elevada producción de pólenes, su
facilidad de transporte por el viento y su generalmente elevada resistencia a la
degradación, hacen que estos microrrestos puedan acumularse progresivamente en
distintos estratos, e informen por tanto de manera secuencial sobre la evolución de la
cubierta vegetal del entorno muestreado. Este entorno al que representan tendrá escala
regional, debido a la citada movilidad de los granos de polen (Bradshaw, 1991). Ésto,
unido al escaso detalle taxonómico que se puede obtener los pólenes (Moore & Webb,
1983), hacen aconsejable su combinación con otras fuentes de información
complementarias (Birks & Birks, 2000).
Los llamados macrorrestos se pueden distinguir sin ayuda de aparato alguno se
denominan macrorrestos (Lowe & Walker, 1997). El estado en el que los encontremos
será resultado de su resistencia a la degradación y de las condiciones en las que se han

Tesis Doctoral García-Amorena, I., 2007 Introducción
2
preservado desde el momento de su muerte hasta el de su estudio. El conocimiento de
los procesos de degradación sufridos en el transcurso de ese tiempo proporcionará
información sobre la procedencia y las condiciones en las que se ha conservado dicho
resto (Roberts, 1997). Por otro lado, la distancia desde el lugar de origen del
macrorresto hasta el de su definitivo emplazamiento se encuentra limitada por la
dificultad de transporte debido a su tamaño. Esta circunstancia le proporciona el
carácter de representación local (Birks & Birks, 2000). Una situación particular la
constituyen los restos en posición de vida sobre sustratos inalterados, donde el lugar de
origen del macrorresto es el mismo que el de su localización. Este aspecto, vinculado a
la elevada precisión de información taxonómica que contienen los macrorrestos,
constituye una de las principales ventajas del estudio de este tipo de materiales (Birks,
2003).
Por otro lado, para poder entender la distribución actual de la vegetación se hace
necesario considerar uno de los principales factores que la ha condicionado: la historia
climática de la Tierra (Costa Tenorio et al., 1990; Costa et al., 1997; Tzedakis et al.,
1997; Allen et al., 1999). Los registros paleobotánicos muestran cómo la distribución y
composición de la vegetación ha sido diferente en los distintos interglaciares y periodos
interestadiales (Pons & Reille, 1988; Huntley, 1990a; De Beaulieu & Reille, 1992). El
conocimiento detallado de la evolución climática y de su interacción con la vegetación,
además de ayudar a la comprensión de la distribución de las especies vegetales, podrá
aportar información sobre la respuesta esperable del paisaje vegetal ante el actual
incremento antropogénico de temperatura (Colin Prentice, 1986; Stott & Kettleborough,
2002).
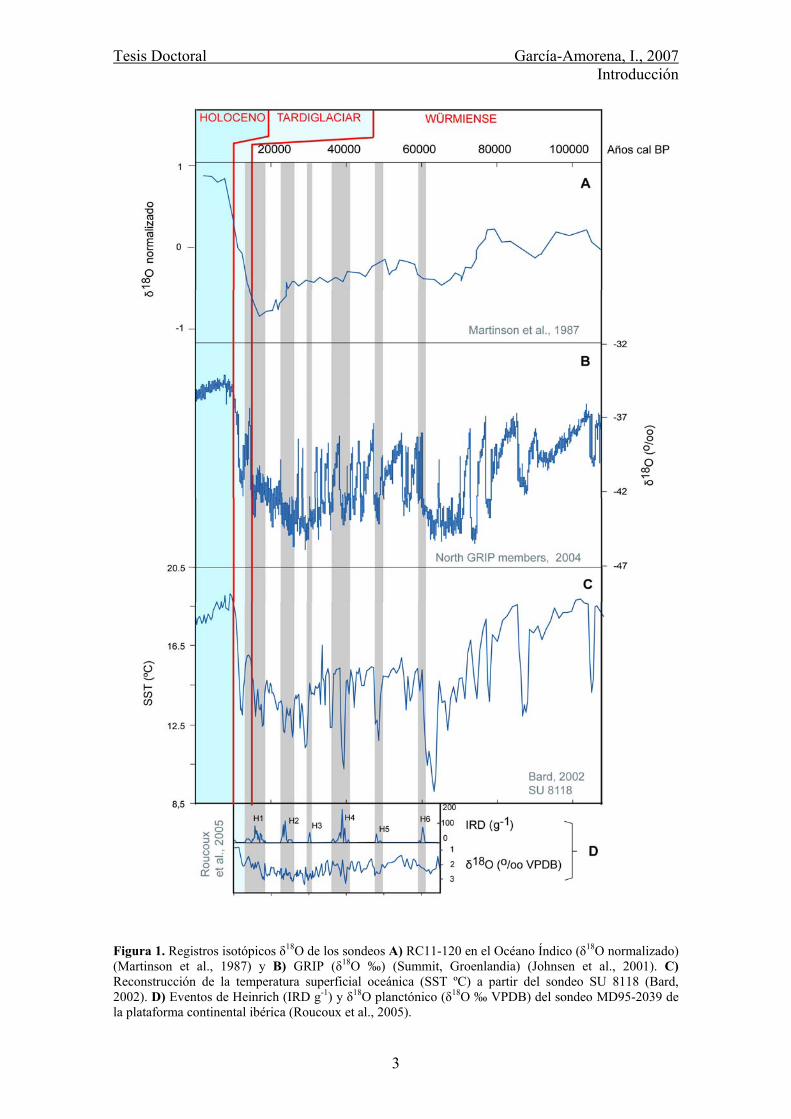
Los sondeos en los fondos oceánicos y en los cascos polares realizados a partir de
1980 han permitido establecer una detallada secuencia climática a escala hemisférica
para los últimos 300 kaños BP [BP (before present) = antes de 1950 AD] (Shackleton et
al., 1984; Martinson et al., 1987; Bond et al., 1993; Dansgaard et al., 1993; Boessenkool
et al., 2001; Andersen et al., 2004; Roucoux et al., 2005). En dicha secuencia se
observan múltiples fluctuaciones, en ocasiones de amplitud superior a los 15ºC de
temperatura media anual en menos de 200 años (figura 1). No obstante, cada región
geográfica tiene una historia climática determinada a la que la vegetación ha tenido que
Tesis Doctoral García-Amorena, I., 2007 Introducción
3
Figura 1. Registros isotópicos δ18O de los sondeos A) RC11-120 en el Océano Índico (δ18O normalizado) (Martinson et al., 1987) y B) GRIP (δ18O ‰) (Summit, Groenlandia) (Johnsen et al., 2001). C) Reconstrucción de la temperatura superficial oceánica (SST ºC) a partir del sondeo SU 8118 (Bard, 2002). D) Eventos de Heinrich (IRD g-1) y δ18O planctónico (δ18O ‰ VPDB) del sondeo MD95-2039 de la plataforma continental ibérica (Roucoux et al., 2005).
Tesis Doctoral García-Amorena, I., 2007 Introducción
4
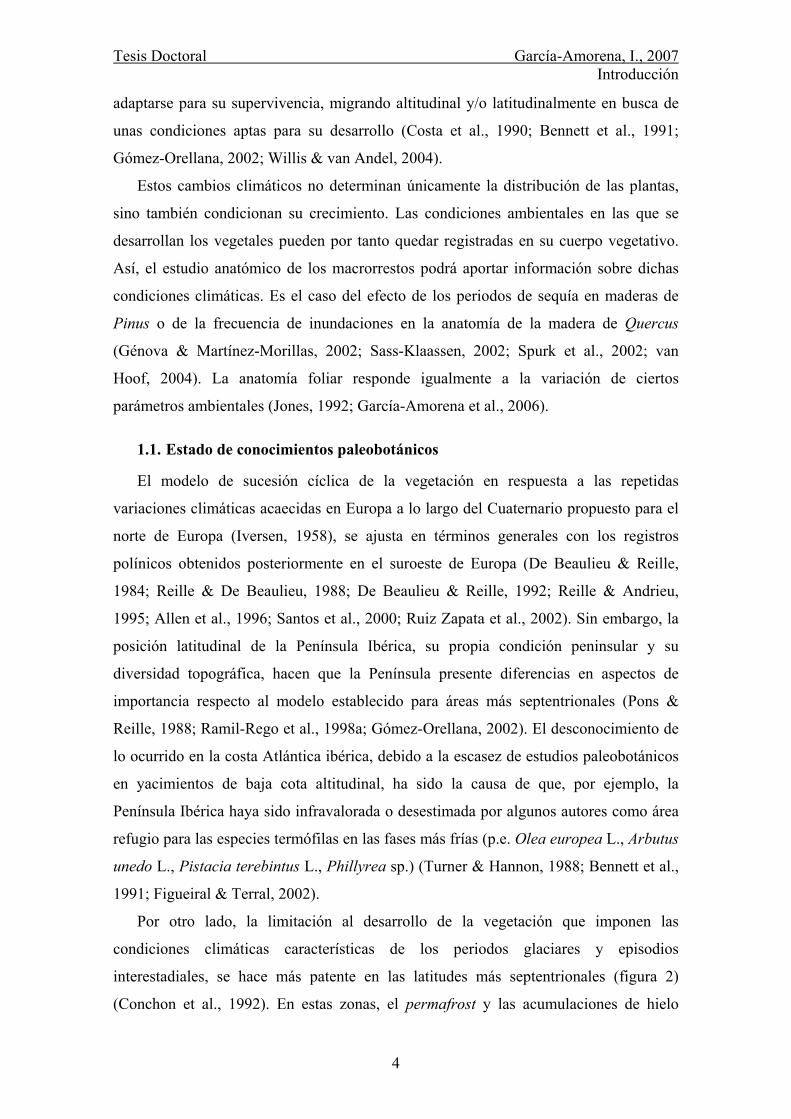
adaptarse para su supervivencia, migrando altitudinal y/o latitudinalmente en busca de
unas condiciones aptas para su desarrollo (Costa et al., 1990; Bennett et al., 1991;
Gómez-Orellana, 2002; Willis & van Andel, 2004).
Estos cambios climáticos no determinan únicamente la distribución de las plantas,
sino también condicionan su crecimiento. Las condiciones ambientales en las que se
desarrollan los vegetales pueden por tanto quedar registradas en su cuerpo vegetativo.
Así, el estudio anatómico de los macrorrestos podrá aportar información sobre dichas
condiciones climáticas. Es el caso del efecto de los periodos de sequía en maderas de
Pinus o de la frecuencia de inundaciones en la anatomía de la madera de Quercus
(Génova & Martínez-Morillas, 2002; Sass-Klaassen, 2002; Spurk et al., 2002; van
Hoof, 2004). La anatomía foliar responde igualmente a la variación de ciertos
parámetros ambientales (Jones, 1992; García-Amorena et al., 2006).
1.1. Estado de conocimientos paleobotánicos
El modelo de sucesión cíclica de la vegetación en respuesta a las repetidas
variaciones climáticas acaecidas en Europa a lo largo del Cuaternario propuesto para el
norte de Europa (Iversen, 1958), se ajusta en términos generales con los registros
polínicos obtenidos posteriormente en el suroeste de Europa (De Beaulieu & Reille,
1984; Reille & De Beaulieu, 1988; De Beaulieu & Reille, 1992; Reille & Andrieu,
1995; Allen et al., 1996; Santos et al., 2000; Ruiz Zapata et al., 2002). Sin embargo, la
posición latitudinal de la Península Ibérica, su propia condición peninsular y su
diversidad topográfica, hacen que la Península presente diferencias en aspectos de
importancia respecto al modelo establecido para áreas más septentrionales (Pons &
Reille, 1988; Ramil-Rego et al., 1998a; Gómez-Orellana, 2002). El desconocimiento de
lo ocurrido en la costa Atlántica ibérica, debido a la escasez de estudios paleobotánicos
en yacimientos de baja cota altitudinal, ha sido la causa de que, por ejemplo, la
Península Ibérica haya sido infravalorada o desestimada por algunos autores como área
refugio para las especies termófilas en las fases más frías (p.e. Olea europea L., Arbutus
unedo L., Pistacia terebintus L., Phillyrea sp.) (Turner & Hannon, 1988; Bennett et al.,
1991; Figueiral & Terral, 2002).
Por otro lado, la limitación al desarrollo de la vegetación que imponen las
condiciones climáticas características de los periodos glaciares y episodios
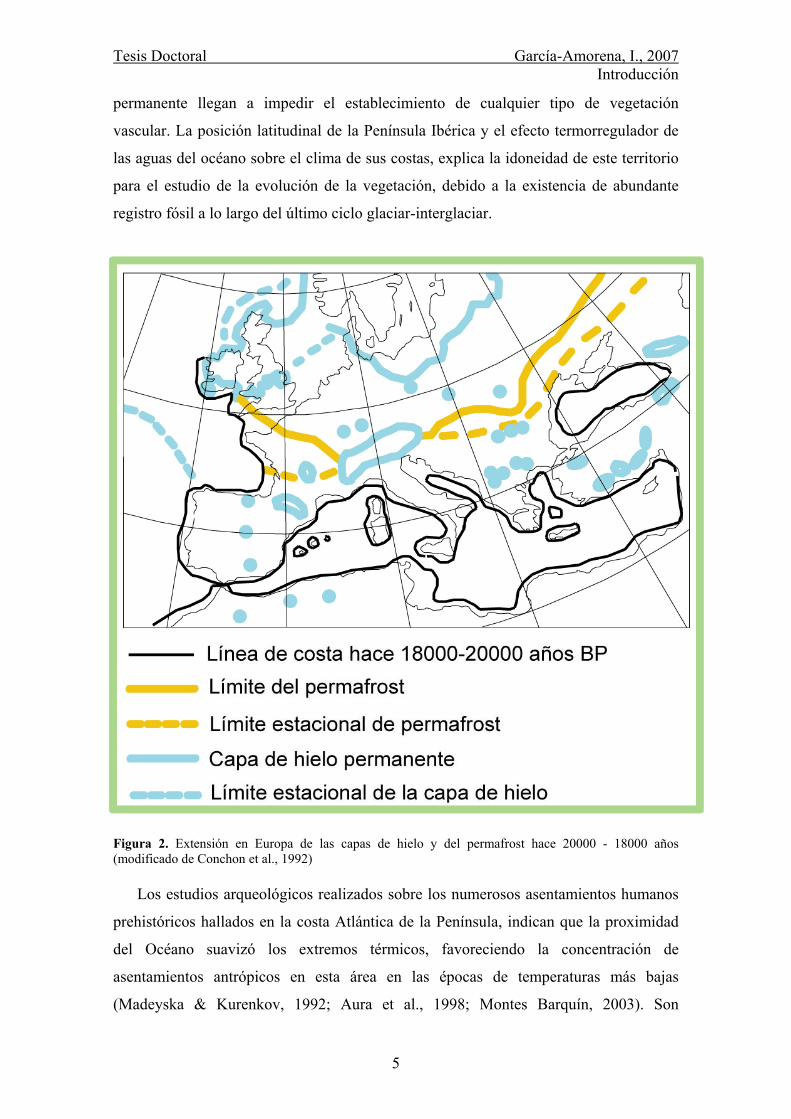
interestadiales, se hace más patente en las latitudes más septentrionales (figura 2)
(Conchon et al., 1992). En estas zonas, el permafrost y las acumulaciones de hielo
Tesis Doctoral García-Amorena, I., 2007 Introducción
5
permanente llegan a impedir el establecimiento de cualquier tipo de vegetación
vascular. La posición latitudinal de la Península Ibérica y el efecto termorregulador de
las aguas del océano sobre el clima de sus costas, explica la idoneidad de este territorio
para el estudio de la evolución de la vegetación, debido a la existencia de abundante
registro fósil a lo largo del último ciclo glaciar-interglaciar.
Figura 2. Extensión en Europa de las capas de hielo y del permafrost hace 20000 - 18000 años (modificado de Conchon et al., 1992)
Los estudios arqueológicos realizados sobre los numerosos asentamientos humanos
prehistóricos hallados en la costa Atlántica de la Península, indican que la proximidad
del Océano suavizó los extremos térmicos, favoreciendo la concentración de
asentamientos antrópicos en esta área en las épocas de temperaturas más bajas
(Madeyska & Kurenkov, 1992; Aura et al., 1998; Montes Barquín, 2003). Son
Tesis Doctoral García-Amorena, I., 2007 Introducción
6
numerosos los estudios polínicos realizados en los sedimentos de cúmulos relacionados
con la actividad funeraria y agrícola, y en sedimentos de abrigos humanos en cuevas y
al aire libre (Aira Rodriguez, 1986; Vernet & Figueiral, 1993; Sánchez Goñi, 1994;
Zilhao et al., 1995; Zapata & Meaza, 1998; Iriarte, 2003). Algunos de ellos incluso
cuentan con estudios antracológicos. Sin embargo la interpretación de los estudios
paleobotánicos realizados en estos yacimientos está sujeta a limitaciones. Entre ellas
figuran la sobre-representación de las especies que el hombre acumula en sus
asentamientos, la frecuente presencia de hiatos debido a la erosión intermitente del
suelo, las migraciones verticales de los fósiles, y la degradación diferencial de los restos
vegetales (Küster, 1991; Sánchez Goñi, 1993; Zilhão, 1993; Buxó, 1997). No obstante,
las hipótesis desarrolladas hasta el momento sobre la evolución de la vegetación en la
costa Atlántica ibérica a lo largo del último ciclo glaciar-interglaciar, a falta de otras
fuentes de información, están principalmente basadas en el estudio de este tipo de
yacimientos (tabla 1 y figura 3).
Por otro lado, los primeros estudios paleopolínicos realizados en yacimientos no
antrópicos de la costa Atlántica peninsular presentan también importantes limitaciones
en cuanto a la calidad de la información aportada: no cuentan con dataciones precisas y
se desarrollaron sobre perfiles de escaso desarrollo (Menéndez Amor, 1950; Mary et al.,
1975; Saá Otero, 1985). La proliferación a finales del siglo pasado de estudios
paleopolínicos sobre yacimientos no antrópicos en la Iberia atlántica, ha tenido escaso
reflejo en las zonas litorales, donde sigue habiendo una escasez de trabajos
paleopolínicos y ninguno de ellos aborda extensivamente el estudio de los macrorrestos
(tabla 1 y figura 3) (Saá & Díaz-Fierros, 1987; Steevenson & Moore, 1988; Mateus,
1989; López Sáez et al., 2002; Santos & Goñi, 2003; García Antón et al., 2006).

Tesis Doctoral García-Amorena, I., 2007 Introducción
7
Figura 3. Localización de los principales yacimientos paleobotánicos consultados. Sombreado: yacimientos arqueológicos. Numeración: referencia del yacimiento (tabla 1). Coordenadas geográficas U.T.M. 30.
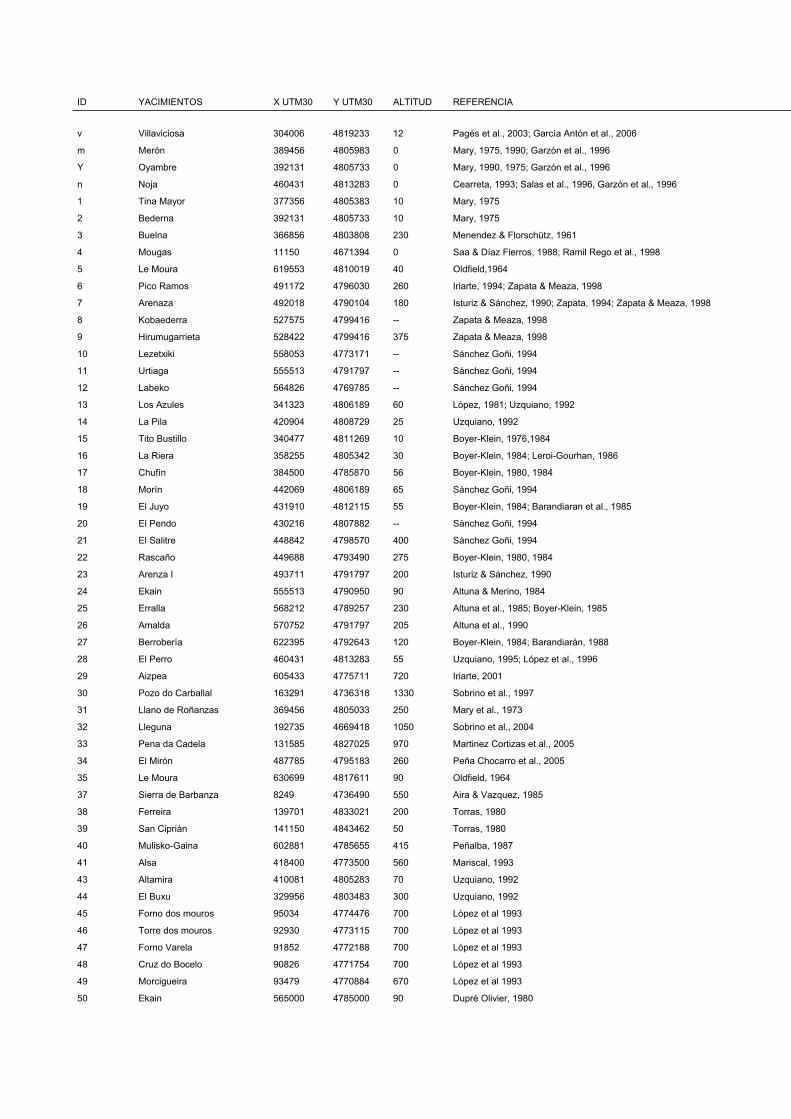
ID YACIMIENTOS X UTM30 Y UTM30 ALTITUD REFERENCIA
v Villaviciosa 304006 4819233 12 Pagés et al., 2003; García Antón et al., 2006
m Merón 389456 4805983 0 Mary, 1975, 1990; Garzón et al., 1996
Y Oyambre 392131 4805733 0 Mary, 1990, 1975; Garzón et al., 1996
n Noja 460431 4813283 0 Cearreta, 1993; Salas et al., 1996, Garzón et al., 1996
1 Tina Mayor 377356 4805383 10 Mary, 1975
2 Bederna 392131 4805733 10 Mary, 1975
3 Buelna 366856 4803808 230 Menendez & Florschütz, 1961
4 Mougas 11150 4671394 0 Saa & Díaz Fierros, 1988; Ramil Rego et al., 1998
5 Le Moura 619553 4810019 40 Oldfield,1964
6 Pico Ramos 491172 4796030 260 Iriarte, 1994; Zapata & Meaza, 1998
7 Arenaza 492018 4790104 180 Isturiz & Sánchez, 1990; Zapata, 1994; Zapata & Meaza, 1998
8 Kobaederra 527575 4799416 -- Zapata & Meaza, 1998
9 Hirumugarrieta 528422 4799416 375 Zapata & Meaza, 1998
10 Lezetxiki 558053 4773171 -- Sánchez Goñi, 1994
11 Urtiaga 555513 4791797 -- Sánchez Goñi, 1994
12 Labeko 564826 4769785 -- Sánchez Goñi, 1994
13 Los Azules 341323 4806189 60 López, 1981; Uzquiano, 1992
14 La Pila 420904 4808729 25 Uzquiano, 1992
15 Tito Bustillo 340477 4811269 10 Boyer-Klein, 1976,1984
16 La Riera 358255 4805342 30 Boyer-Klein, 1984; Leroi-Gourhan, 1986
17 Chufín 384500 4785870 56 Boyer-Klein, 1980, 1984
18 Morín 442069 4806189 65 Sánchez Goñi, 1994
19 El Juyo 431910 4812115 55 Boyer-Klein, 1984; Barandiaran et al., 1985
20 El Pendo 430216 4807882 -- Sánchez Goñi, 1994
21 El Salitre 448842 4798570 400 Sánchez Goñi, 1994
22 Rascaño 449688 4793490 275 Boyer-Klein, 1980, 1984
23 Arenza I 493711 4791797 200 Isturiz & Sánchez, 1990
24 Ekain 555513 4790950 90 Altuna & Merino, 1984
25 Erralla 568212 4789257 230 Altuna et al., 1985; Boyer-Klein, 1985
26 Amalda 570752 4791797 205 Altuna et al., 1990
27 Berrobería 622395 4792643 120 Boyer-Klein, 1984; Barandiarán, 1988
28 El Perro 460431 4813283 55 Uzquiano, 1995; López et al., 1996
29 Aizpea 605433 4775711 720 Iriarte, 2001
30 Pozo do Carballal 163291 4736318 1330 Sobrino et al., 1997
31 Llano de Roñanzas 369456 4805033 250 Mary et al., 1973
32 Lleguna 192735 4669418 1050 Sobrino et al., 2004
33 Pena da Cadela 131585 4827025 970 Martinez Cortizas et al., 2005
34 El Mirón 487785 4795183 260 Peña Chocarro et al., 2005
35 Le Moura 630699 4817611 90 Oldfield, 1964
37 Sierra de Barbanza 8249 4736490 550 Aira & Vazquez, 1985
38 Ferreira 139701 4833021 200 Torras, 1980
39 San Ciprián 141150 4843462 50 Torras, 1980
40 Mulisko-Gaina 602881 4785655 415 Peñalba, 1987
41 Alsa 418400 4773500 560 Mariscal, 1993
43 Altamira 410081 4805283 70 Uzquiano, 1992
44 El Buxu 329956 4803483 300 Uzquiano, 1992
45 Forno dos mouros 95034 4774476 700 López et al 1993
46 Torre dos mouros 92930 4773115 700 López et al 1993
47 Forno Varela 91852 4772188 700 López et al 1993
48 Cruz do Bocelo 90826 4771754 700 López et al 1993
49 Morcigueira 93479 4770884 670 López et al 1993
50 Ekain 565000 4785000 90 Dupré Olivier, 1980

Tesis Doctoral García-Amorena, I., 2007 Introducción
9
51 Laminak II 540731 4795433 40 Uzquiano, 1994
52 Mosteiro 91872 4716444 700 López et al., 1990
53 Laguna de Maside 91163 4706449 700 López et al., 1990
54 Montes de Buyo 143963 4837434 400 Menendez & Florschutz, 1961; van Mourik, 1986
55 Toiriz 122559 4724309 530 van Mourik, 1986
56 Brins 45448 5769991 300 van Mourik, 1986
57 Ares 76560 4821782 0 Santos et al., 1993
58 Mougas 18345 4671394 0 Saa 1985; Saa & Viaz-Fierros, 1988
59 Cabeza de Porto Marinho -33973 4362358 Figueiral, 1993; Zilhão et al., 1995
60 Lagoa do Marinho 76242 4637182 1150 Ramil Rego et al., 1993, 1998
61 Acebrón 191493 4107638 25 Stevenson & Moore, 1988
62 Los Tornos 464766 4777563 920 Peñalba, 1994
63 Saldropo 523075 4766406 625 Peñalba, 1994
64 Belate 613400 4768000 825 Peñalba, 1994
65 Atxuri 624400 4788500 500 Peñalba, 1994
66 Quintanar de la Sierra 498481 4649683 1500 Peñalba, 1994; Ruiz Zapata et al., 2002
67 Lourdes 737611 476865 430 Reille & Andrieu, 1995
68 Biscaye 738630 4768681 410 Reille & Andrieu, 1995
70 Pena Vella 139705 4823487 700 Ramil Rego, 1992; Ramil Rego et al., 1998
71 Chan do Lamoso 129716 4824208 1150 Ramil Rego, 1992; Ramil Rego et al., 1998; Muñoz Sobrino et al., 2005
72 Pozo do Carballal 148982 4742955 1330 Ramil Rego et al., 1998
73 Penido Vello 129716 4824208 700 Ramil Rego, 1992; Ramil Rego et al., 1998; Muñoz Sobrino et al., 2005
74 Pena da Candela 128995 4814219 970 Ramil Rego, 1992
75 Povado de San Juliao 20375 4613500 130 Aira & Ramil Rego, 1995
76 Padul 440682 4095080 785 Pons & Reille, 1988
77 Velay-Lac du Bouchet 1035411 4996124 1200 Reille et al., 2000; Reille & de Beaulieu, 1988
78 Lagoa Lucenza 150403 4692218 1400 Santos et al., 2000; Muñoz Sobrino et al., 2001; Leira & Santos, 2002
79 Lagoa Comprida 105197 4474493 1610 van der Knaap & van Leeuwen, 1994
80 Covao do Boieiro 105197 4474493 1725 van der Knaap & van Leeuwen, 1994
81 Lleguna 198918 4668728 1050 Hannon, 1985
82 Sanguijuelas-Sanabria 198918 4668728 1085 Menendez & Florschütz, 1961; Watts, 1986; Allen et al., 1996; Sobrino et al., 2004
83 La Roya 198918 4668728 1608 Hannon, 1985; Allen et al., 1996
84 Lago de Ajo 245916 4765682 1500 McKeever,1984; Watts, 1986; Allen et al., 1996
85 Lagoa Travessa -122 4250434 0 Mateus, 1989
86 Area Longa 151637 4838131 0 Gómez-Orellaba, 2002
87 Charco da Candieira 115191 4473814 1409 van der Knaap & van Leeuwen, 1994
88 Laguna de Santo André -7394 4189237 10 Santos & Goñi, 2003
89 Laguna del Gallo 215320 4061367 10 López et al., 2002
90 Buraca Grande 14140 4444990 -- Zilhao et al., 1995
91 Gruta do Caldeirao 30081 4422951 -- Figueiral, 1995
92 Castro de Penices 35274 4604727 -- Figueiral, 1995
93 San Lourenço 113179 4632427 -- Figueiral, 1995
94 Alto de Sta Ana 125297 4634227 -- Figueiral, 1995
95 Vinha da Soutinha 133953 4642814 0 Figueiral, 1995
96 MD95-2039 -131031 4516578 -3381 Roucoux et al., 2005
97 SO75-6KL -71501 4218395 -1281 Boessenkool et al., 2001
98 SU 81-18 -133089 4204305 -3135 Duplessy et al., 1993
99 SO75-26KL -72408 4205430 -1099 Zahn et al., 1997
100 CH 6719 426109 5066710 -1800 Duplessy et al., 1981
Tabla 1. Principales yacimientos consultados. ID: Número de referencia de la figura 3. Altitud sobre el nivel del mar en metros.
Tesis Doctoral García-Amorena, I., 2007 Introducción
10
1.2. Marco climático
La secuencia climática establecida para los últimos 40000 años por los registros
oceánicos, continentales y polares constituye el marco cronológico de este trabajo, que
engloba el Holoceno, el Tardiglaciar y parte del Würmiense Final (figura 1). Este
último periodo, perteneciente al último estadío glaciar, se caracteriza por la existencia
de una serie de mínimos de temperatura que varían en función de la localidad del
registro paleoclimático. Mientras que la curva estándar de los registros isotópicos
marinos así como alguno de los registros del casquete polar de Groenlandia (Martinson
et al., 1987; Andersen et al., 2004) reflejan mínimos entre los ~18000 y los ~30000 años
BP, otros registros los sitúan entre los ~18000 y los ~70000 años BP (figura 1) (Johnsen
et al., 2001; Bard, 2002; Parrenin et al., 2004; Roucoux et al., 2005).
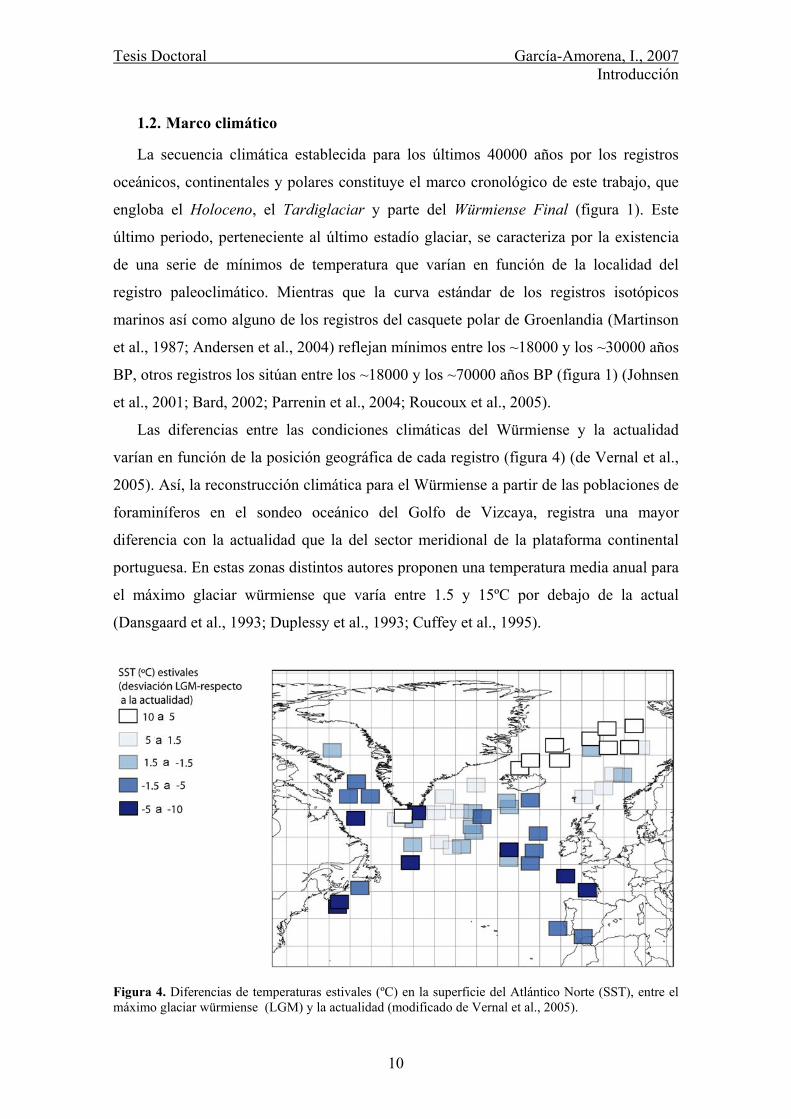
Las diferencias entre las condiciones climáticas del Würmiense y la actualidad
varían en función de la posición geográfica de cada registro (figura 4) (de Vernal et al.,
2005). Así, la reconstrucción climática para el Würmiense a partir de las poblaciones de
foraminíferos en el sondeo oceánico del Golfo de Vizcaya, registra una mayor
diferencia con la actualidad que la del sector meridional de la plataforma continental
portuguesa. En estas zonas distintos autores proponen una temperatura media anual para
el máximo glaciar würmiense que varía entre 1.5 y 15ºC por debajo de la actual
(Dansgaard et al., 1993; Duplessy et al., 1993; Cuffey et al., 1995).
Figura 4. Diferencias de temperaturas estivales (ºC) en la superficie del Atlántico Norte (SST), entre el máximo glaciar würmiense (LGM) y la actualidad (modificado de Vernal et al., 2005).
Tesis Doctoral García-Amorena, I., 2007 Introducción
11
Tras el máximo glaciar würmiense, en el periodo Tardiglaciar, las temperaturas
aumentaron hasta alcanzar valores similares a los actuales al comienzo del Holoceno
(figura 1). Sin embargo, en este periodo se suceden una serie de fluctuaciones térmicas
de importancia: en la Península Ibérica se observa generalmente una interrupción en el
ascenso de temperaturas entre los 13000 y 10000 años BP (Pons & Reille, 1988; Allen
et al., 1996; Peñalba et al., 1997; van der Knaap & van Leeuwen, 1997; Muñoz-Sobrino
et al., 2001), episodio estadial que se denomina en Europa Dryas Reciente, y que aísla el
complejo interestadial Bølling/Allerød del comienzo del periodo Holoceno (Turner &
Hannon, 1988). Este evento frío queda recogido en distintos registros, tanto
continentales como oceánicos.
En los sedimentos oceánicos, aparte del estudio de foraminíferos, las partículas
inorgánicas transportadas por los icebergs constituyen otra importante fuente de
información. Los granos líticos depositados en los fondos marinos al descongelarse los
bloques de hielo (Ice Rafted Debris o Eventos de Heinrich), reflejan periodos fríos en
los que se expandieron los hielos polares (Bond et al., 1992). Dichos eventos han dejado
su huella en la plataforma continental portuguesa a lo largo del Würmiense y, en
algunos casos con mayor importancia, en el Dryas Reciente (figura 1) (Zahn et al.,
1997; Boessenkool et al., 2001; Roucoux et al., 2005). Estos registros concuerdan con
las propuestas de posición del frente polar atlántico en el máximo glaciar würmiense por
debajo de los 40ºN de latitud en las costas de Portugal (Ruddiman & McIntyre, 1981;
Bard et al., 1987), y dan idea de las condiciones climáticas que debieron afectar a la
costa Atlántica ibérica durante el Würm y el Dryas Reciente.
El Holoceno, periodo posterior a estos episodios fríos, se caracteriza por una relativa
estabilidad climática en comparación con los periodos anteriores. Sin embargo,
actualmente existen numerosas evidencias que reflejan variaciones de temperatura y
humedad de distinta amplitud y periodos de frecuencia a lo largo de este periodo (Bond
et al., 1997; Ahn et al., 2004; Kaufman et al., 2004; Masson-Delmotte et al., 2005;
Kaplan & Wolfe, 2006).
Los trabajos que analizan los registros climáticos holocenos en grandes regiones del
Hemisferio Norte, concluyen que el clima ha sufrido en general una variación cíclica de
temperatura de unos 1500 años de frecuencia (Bond et al., 1997; Masson-Delmotte et
al., 2005). Igualmente se observa un máximo de temperatura ubicado en la primera
Tesis Doctoral García-Amorena, I., 2007 Introducción
12
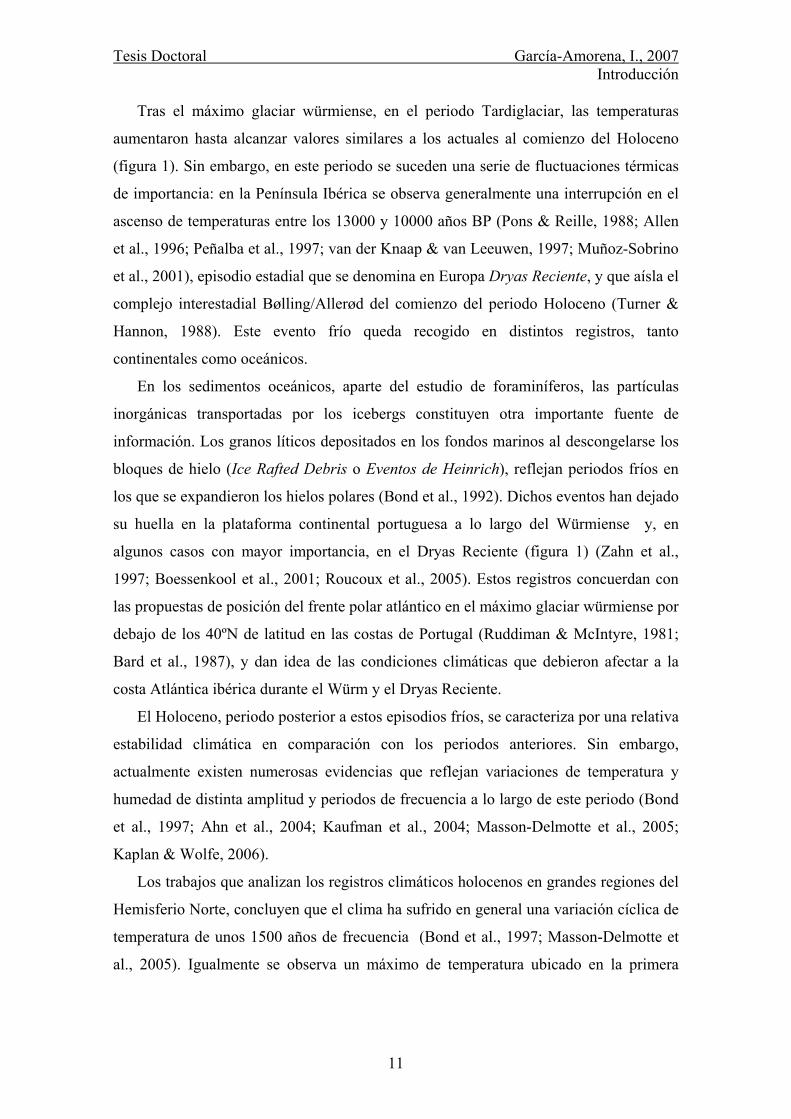
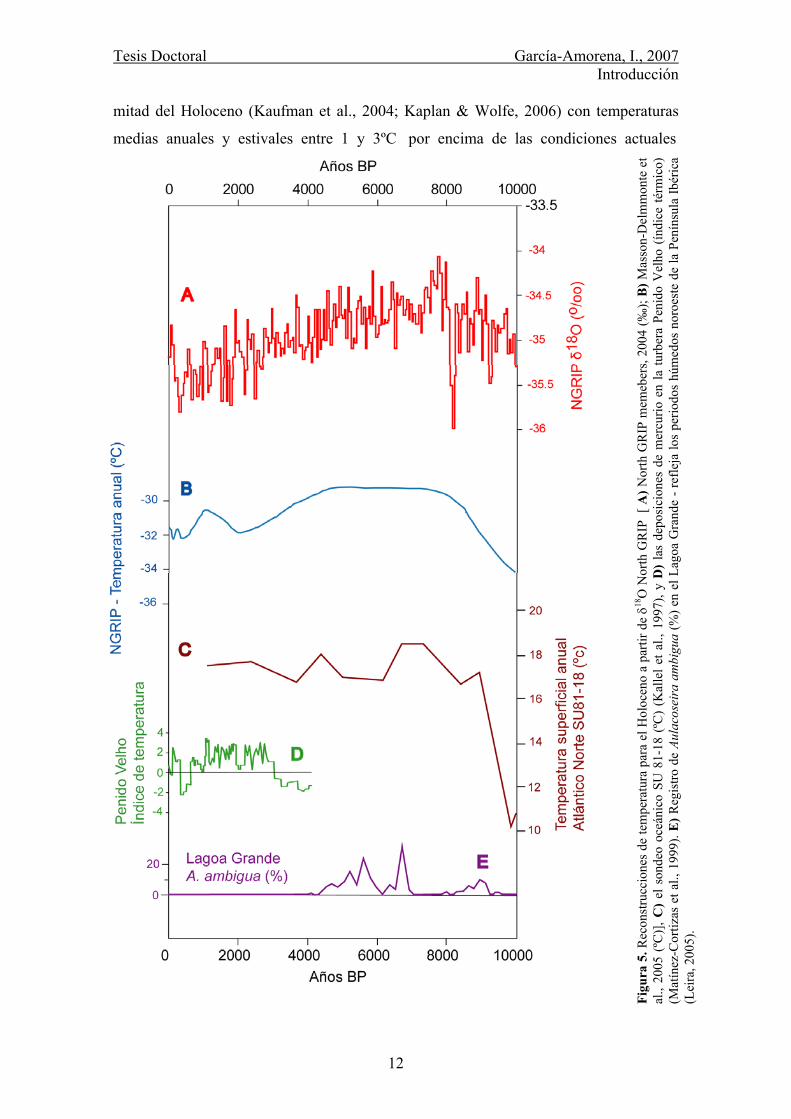
mitad del Holoceno (Kaufman et al., 2004; Kaplan & Wolfe, 2006) con temperaturas
medias anuales y estivales entre 1 y 3ºC por encima de las condiciones actuales
Figu
ra 5
. Rec
onst
rucc
ione
s de
tem
pera
tura
par
a el
Hol
ocen
o a
parti
r de δ18
O N
orth
GR
IP [
A) N
orth
GR
IP m
emeb
ers,
2004
(‰);
B) M
asso
n-D
elm
mon
te e
tal
., 20
05 (
ºC)]
, C)
el s
onde
o oc
eáni
co S
U 8
1-18
(ºC
) (K
alle
l et a
l., 1
997)
, y D
) la
s de
posi
cion
es d
e m
ercu
rio e
n la
turb
era
Peni
do V
elho
(ín
dice
térm
ico)
(Mat
ínez
-Cor
tizas
et a
l., 1
999)
. E) R
egis
tro d
e Au
laco
seir
a am
bigu
a (%
) en
el L
agoa
Gra
nde
- ref
leja
los
perio
dos
húm
edos
nor
oest
e de
la P
enín
sula
Ibér
ica
(Lei
ra, 2
005)
.
Tesis Doctoral García-Amorena, I., 2007 Introducción
13
(Huntley & Prentice, 1988; Martinez-Cortizas et al., 1999; Andersen et al., 2004). Antes
de este máximo térmico se registra un enfriamiento en los 8200 años BP y
posteriormente, una caída de temperatura tras el máximo térmico del Holoceno
(enfriamiento neoglacial) (Peñalba et al., 1997; Heiri & Lotter, 2003; Andersen et al.,
2004). Después de este periodo de enfriamiento se registra un periodo de calentamiento
(periodo cálido romano-medieval) seguido de otro enfriamiento (pequeña edad glacial),
para posteriormente alcanzarse las temperaturas actuales (figura 5) (Duplessy et al.,
1993; Kallel et al., 1997; Dahl-Jensen et al., 1998; Martinez-Cortizas et al., 1999).
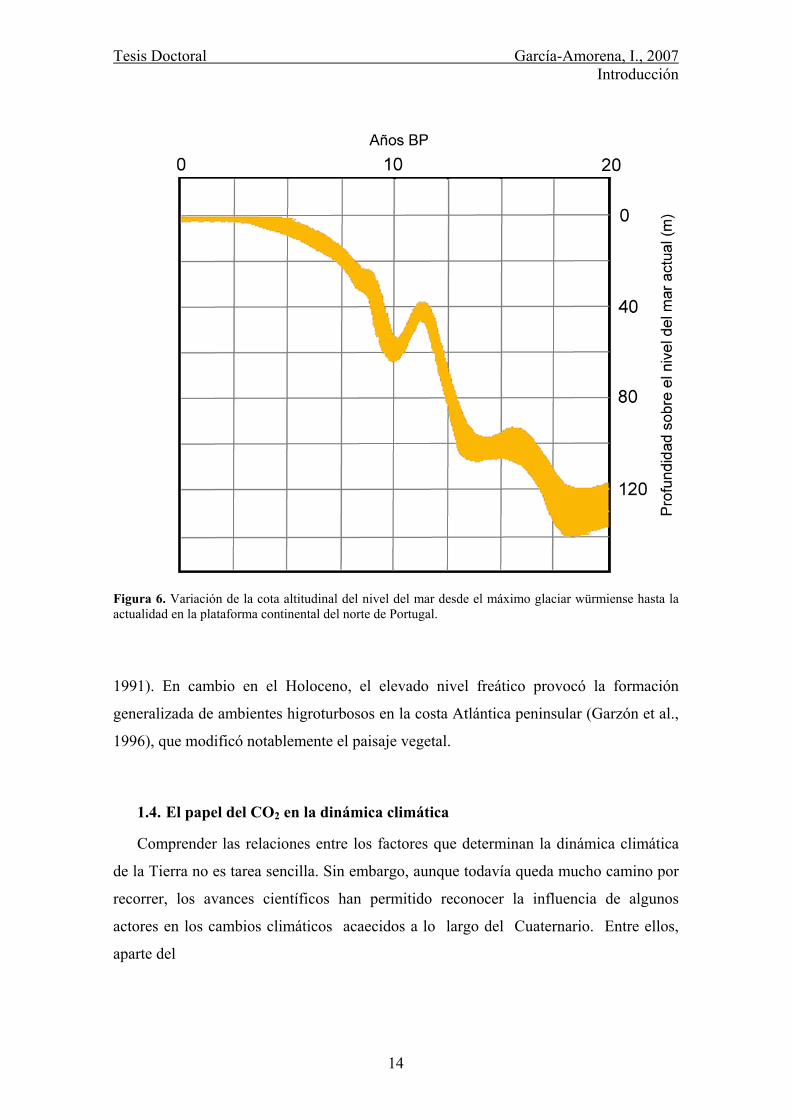
1.3. Variación en el nivel del mar
La estrecha relación entre el clima y el nivel de las aguas oceánicas, determina que
junto con las variaciones climáticas acaecidas en el último ciclo glaciar-interglaciar se
observe una importante fluctuación en el nivel oceánico (figura 6). La recuperación
climática que siguió al periodo Würmiense vino acompañada de un ascenso de las aguas
oceánicas, más o menos continuado, de aproximadamente 120 m desde el máximo
glaciar würmiense hasta el máximo térmico del Holoceno hace unos 6.000 años
(Shackleton, 1987; Chao et al., 2002; Lambeck et al., 2002; Kaplan & Wolfe, 2006). A
partir de entonces los movimientos de ajuste tectónico-isostático han tenido un
importante papel a nivel regional. Así, en el litoral cantábrico, la posición de distintos
yacimientos paleobotánicos costeros refleja variaciones oceánicas entre -4 y + 1 m
respecto al nivel actual a lo largo del Holoceno (Salas et al., 1996; Cearreta, 1999;
Rivas, 2000). En cambio, en este periodo, no existen evidencias en las costas de Galicia
y Portugal que indiquen una posición del nivel del mar superior al actual (Granja & De
Groot, 1996; Zazo et al., 1997; Alonso & Pagés, 2000; Dias et al., 2000; Chao et al.,
2002).
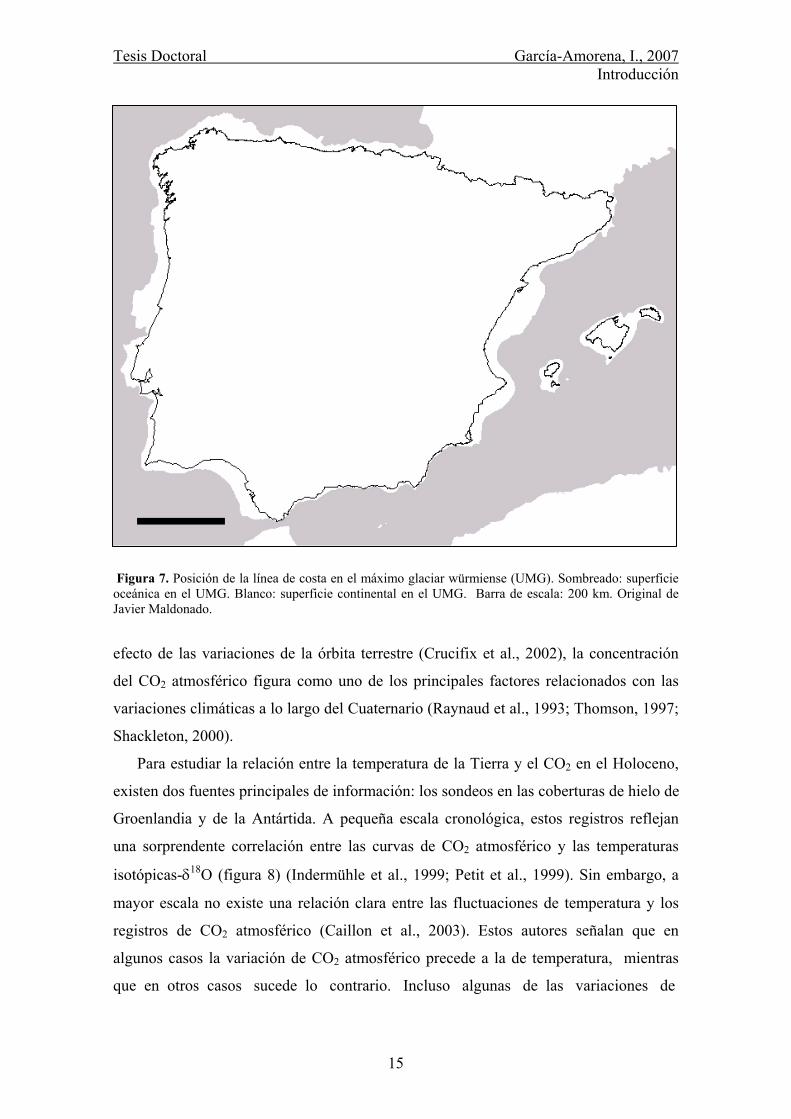
En el último ciclo glaciar-interglaciar, la dinámica de vegetación de la costa
Atlántica ibérica estuvo especialmente afectada por la variación del nivel de las aguas
marinas. Estas variaciones originaron tanto fluctuaciones en la capa freática como la
modificación de la superficie disponible para el establecimiento de la vegetación
terrestre. La consecuente retirada de la línea de costa dejó una extensa superficie de
tierra al descubierto en el máximo glaciar würmiense, en algunas zonas superior a 45
km de anchura (figura 7). Los grandes volúmenes de arenas, gravas y fangos expuestos,
ofrecieron una gran variedad de biotopos a colonizar por la vegetación (Rodrigues et al.,
Tesis Doctoral García-Amorena, I., 2007 Introducción
14
Figura 6. Variación de la cota altitudinal del nivel del mar desde el máximo glaciar würmiense hasta la actualidad en la plataforma continental del norte de Portugal.
1991). En cambio en el Holoceno, el elevado nivel freático provocó la formación
generalizada de ambientes higroturbosos en la costa Atlántica peninsular (Garzón et al.,
1996), que modificó notablemente el paisaje vegetal.
1.4. El papel del CO2 en la dinámica climática
Comprender las relaciones entre los factores que determinan la dinámica climática
de la Tierra no es tarea sencilla. Sin embargo, aunque todavía queda mucho camino por
recorrer, los avances científicos han permitido reconocer la influencia de algunos
actores en los cambios climáticos acaecidos a lo largo del Cuaternario. Entre ellos,
aparte del
Tesis Doctoral García-Amorena, I., 2007 Introducción
15
Figura 7. Posición de la línea de costa en el máximo glaciar würmiense (UMG). Sombreado: superficie oceánica en el UMG. Blanco: superficie continental en el UMG. Barra de escala: 200 km. Original de Javier Maldonado.
efecto de las variaciones de la órbita terrestre (Crucifix et al., 2002), la concentración
del CO2 atmosférico figura como uno de los principales factores relacionados con las
variaciones climáticas a lo largo del Cuaternario (Raynaud et al., 1993; Thomson, 1997;
Shackleton, 2000).
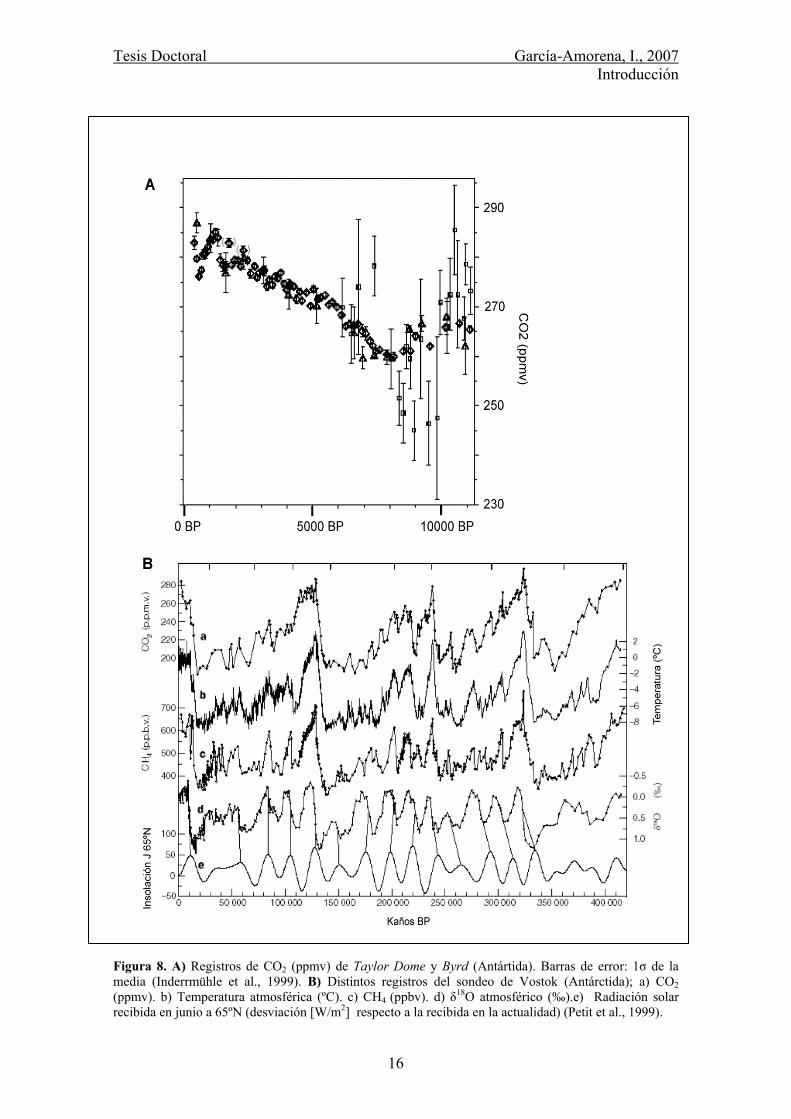
Para estudiar la relación entre la temperatura de la Tierra y el CO2 en el Holoceno,
existen dos fuentes principales de información: los sondeos en las coberturas de hielo de
Groenlandia y de la Antártida. A pequeña escala cronológica, estos registros reflejan
una sorprendente correlación entre las curvas de CO2 atmosférico y las temperaturas
isotópicas-δ18O (figura 8) (Indermühle et al., 1999; Petit et al., 1999). Sin embargo, a
mayor escala no existe una relación clara entre las fluctuaciones de temperatura y los
registros de CO2 atmosférico (Caillon et al., 2003). Estos autores señalan que en
algunos casos la variación de CO2 atmosférico precede a la de temperatura, mientras
que en otros casos sucede lo contrario. Incluso algunas de las variaciones de
Tesis Doctoral García-Amorena, I., 2007 Introducción
16
Figura 8. A) Registros de CO2 (ppmv) de Taylor Dome y Byrd (Antártida). Barras de error: 1σ de la media (Inderrmühle et al., 1999). B) Distintos registros del sondeo de Vostok (Antárctida); a) CO2 (ppmv). b) Temperatura atmosférica (ºC). c) CH4 (ppbv). d) δ18O atmosférico (‰).e) Radiación solar recibida en junio a 65ºN (desviación [W/m2] respecto a la recibida en la actualidad) (Petit et al., 1999).
Tesis Doctoral García-Amorena, I., 2007 Introducción
17
temperatura bien documentadas en el Hemisferio Norte, no tienen un claro reflejo en la
curva de CO2 atmosférico (Raynaud et al., 1993).
En el caso del Holoceno, los registros del casquete polar de Groenlandia están
contaminados con el CO2 producido por las impurezas atrapadas en el hielo (Raynaud et
al., 1993). Por otro lado, los distintos sondeos de la Antártica evidencian valores de CO2
atmosférico a lo largo del Holoceno no concordantes entre sí (Ahn et al., 2004). No
obstante, en función de estos registros se alega una relativa estabilidad del CO2
atmosférico durante este periodo, lo cual no concuerda con la evolución de la
temperatura holocena, ni se encuentra explicación alguna que justifique la relativa
estabilidad del CO2 atmosférico en comparación con la temperatura isotópica
(Indermühle et al., 1999; Ahn et al., 2004).
Como alternativa a los registros polares, los parámetros epidérmicos de hojas fósiles
ofrecen una nueva fuente de información sobre la evolución del CO2 atmosférico en el
pasado (Woodward, 1987).
1.5. La hoja como biosensor del CO2 atmosférico
Existen numerosos registros en los cascos polares, en los fondos marinos y en los
sedimentos continentales, que muestran que el clima no ha sido constante a lo largo de
la historia de la Tierra. De la misma manera, los restos vegetales que se encuentran en
estos archivos naturales, manifiestan cómo la vegetación ha ido variando su
composición y distribución en el pasado (Iversen, 1964; Roucoux et al., 2005). Hoy,
corroborado por numerosas observaciones y experimentos realizados bajo diferentes
condiciones atmosféricas, se conoce cómo las fluctuaciones climáticas son uno de los
principales factores responsables de las variaciones observadas en la vegetación de la
Tierra (Colin Prentice, 1986; Kirilenko et al., 2000; Williams et al., 2002). Gracias al
desarrollo de técnicas que permiten observar la estructura de los tejidos vegetales, como
el microscopio óptico o el microscopio electrónico, se tiene actualmente constancia de
cómo cambios en las condiciones ambientales, también afectan a las plantas a nivel
estructural. La estrecha relación que existe entre la composición atmosférica y la vida de
las plantas hace que éstas actúen como un archivo natural en el que quedan reflejados
distintos parámetros ambientales.
Tesis Doctoral García-Amorena, I., 2007 Introducción
18
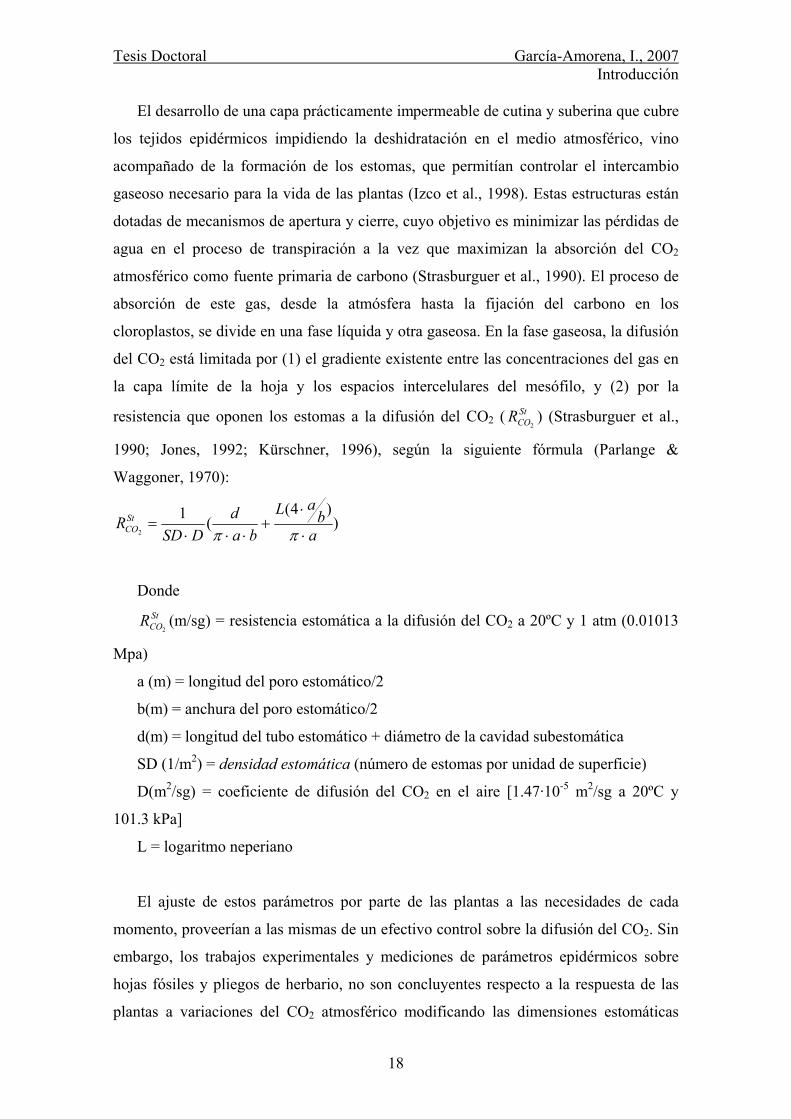
El desarrollo de una capa prácticamente impermeable de cutina y suberina que cubre
los tejidos epidérmicos impidiendo la deshidratación en el medio atmosférico, vino
acompañado de la formación de los estomas, que permitían controlar el intercambio
gaseoso necesario para la vida de las plantas (Izco et al., 1998). Estas estructuras están
dotadas de mecanismos de apertura y cierre, cuyo objetivo es minimizar las pérdidas de
agua en el proceso de transpiración a la vez que maximizan la absorción del CO2
atmosférico como fuente primaria de carbono (Strasburguer et al., 1990). El proceso de
absorción de este gas, desde la atmósfera hasta la fijación del carbono en los
cloroplastos, se divide en una fase líquida y otra gaseosa. En la fase gaseosa, la difusión
del CO2 está limitada por (1) el gradiente existente entre las concentraciones del gas en
la capa límite de la hoja y los espacios intercelulares del mesófilo, y (2) por la
resistencia que oponen los estomas a la difusión del CO2 ( StCOR
2) (Strasburguer et al.,
1990; Jones, 1992; Kürschner, 1996), según la siguiente fórmula (Parlange &
Waggoner, 1970):
))4(
(12 a
baL
bad
DSDRSt
CO ⋅
⋅+
⋅⋅⋅=
ππ
Donde StCOR
2(m/sg) = resistencia estomática a la difusión del CO2 a 20ºC y 1 atm (0.01013
Mpa)
a (m) = longitud del poro estomático/2
b(m) = anchura del poro estomático/2
d(m) = longitud del tubo estomático + diámetro de la cavidad subestomática
SD (1/m2) = densidad estomática (número de estomas por unidad de superficie)
D(m2/sg) = coeficiente de difusión del CO2 en el aire [1.47·10-5 m2/sg a 20ºC y
101.3 kPa]
L = logaritmo neperiano
El ajuste de estos parámetros por parte de las plantas a las necesidades de cada
momento, proveerían a las mismas de un efectivo control sobre la difusión del CO2. Sin
embargo, los trabajos experimentales y mediciones de parámetros epidérmicos sobre
hojas fósiles y pliegos de herbario, no son concluyentes respecto a la respuesta de las
plantas a variaciones del CO2 atmosférico modificando las dimensiones estomáticas
Tesis Doctoral García-Amorena, I., 2007 Introducción
19
(parámetros a, b y d). En cambio, se ha observado una relación entre la densidad
estomática de algunas especies (SD) y los niveles de concentración del CO2
atmosférico.
A pesar de que muchos parámetros ambientales, como la luminosidad, la humedad
relativa del aire, el estrés hídrico del suelo, los nutrientes disponibles o la temperatura
atmosférica influyen en la densidad estomática (Osborn & Taylor, 1990; Bakker, 1991;
Beerling & Chaloner, 1992; Jones, 1992; Beerling & Chaloner, 1993; Poole et al., 1996;
Kürschner et al., 1998; Wagner, 1998; Filella & Peñuelas, 1999), ésta es inversamente
proporcional al CO2 atmosférico en numerosas especies (Grace et al., 1981; Woodward,
1987; Beerling & Chaloner, 1992; Kürschner, 1996; Wagner, 1998; Kouwenberg, 2004;
van Hoof, 2004).
El uso del Índice Estomático [SI% = 100×número de estomas/(número de estomas +
número de células epidérmicas) (Salisbury, 1927)] proporciona una medición
independiente del tamaño de las células epidérmicas, por lo que minimiza todos los
factores relacionados con la dimensión celular (Kürschner, 1996). No obstante, se ha
demostrado que las diferentes condiciones ambientales (temperatura, luminosidad,
humedad, etc) a las que se encuentran expuestas las hojas de luz y las de sombra afectan
al Índice Estomático (p.e. Poole et al., 1996; Kürschner, 1997). Sin embargo el efecto
de estos factores sobre las mediciones de SI se pueden minimizar seleccionando hojas
de un solo morfotipo (generalmente de luz). La distinción morfológica entre las hojas de
sol y las de sombra es posible, al menos en Quercus robur-petraea, gracias a la distinta
ondulación que presentan las paredes anticlinales de las células epidérmicas de uno y
otro morfotipo (Kürschner, 1997). Igualmente, el efecto en el Índice Estomático de la
sobreproducción de CO2 por la respiración de los microorganismos del suelo se puede
minimizar al recolectar hojas ubicadas a más de 3 m del nivel del suelo (Bazzaz &
Williams, 1991; Lockheart et al., 1998).
Numerosos trabajos muestran cómo la respuesta estomática a las variaciones del
CO2 atmosférico es estable a nivel de especie, mostrando una relación sigmoidal entre el
índice estomático y el CO2 atmosférico a una misma presión atmosférica. (p.e. Betula
alba, B. pubescens, Quercus robur, Q, petraea, Salix herbacea, Pinus flexilis, Tsuga
menziesii) (Beerling & Chaloner, 1992; Van de Water et al., 1994; Wagner, 1998;
Wagner et al., 2000; Kouwenberg, 2004; Van Hoof et al., 2005). Esta respuesta
sigmoidal es la esperada bajo un punto de vista fisiológico, existiendo fronteras
Tesis Doctoral García-Amorena, I., 2007 Introducción
20
superiores e inferiores para este carácter. Así, la disminución del número proporcional
de estomas ante un aumento continuo en la concentración de CO2 atmosférico, está
limitada por la necesidad de estomas para realizar las funciones de intercambio gaseoso
y transpiración. De la misma manera la planta no puede aumentar hasta el infinito la
proporción de estomas, ya que implicaría la muerte de la planta por desecación
(Woodward, 1987; Beerling & Chaloner, 1992; Van de Water et al., 1994; Kürschner,
1996; Wagner, 1998; Rundgren & Beerling, 1999; Guy, 2003).
Esta relación entre el índice estomático y el CO2 atmosférico ha sido utilizada para
deducir, a partir del índice estomático medido en hojas fósiles de edad conocida, los
niveles de CO2 atmosférico en el pasado. Este es el caso de Q. petraea y Q. robur, cuyo
índice estomático ha servido para extrapolar los niveles del CO2 atmosférico en
distintos periodos fragmentarios del Terciario y del Holoceno, a partir de las
calibraciones que expresamente se han desarrollado para las poblaciones de Holanda y
Alemania (Rundgren & Beerling, 1999; Wagner et al., 1999; Kürschner, 2001; Wagner
et al., 2002; Van Hoof et al., 2005). No obstante, la naturaleza de la respuesta del índice
estomático determina que estas calibraciones tengan aplicación en un ámbito geográfico
reducido (Ferris & Taylor, 1994; Wang & Kellomäki, 1997; Hultine & Marshall, 2000;
Royer, 2001; Wagner et al., 2004). Por tanto, el uso de calibraciones ajustadas a hojas
fósiles halladas en una región determinada, resulta inapropiado en otras localidades con
condiciones ambientales diferentes. Tal es el caso de los materiales fósiles que se
pudieran encontrar en la Península Ibérica, donde no es directamente aplicable el
modelo CO2-SI calibrado para Holanda y Alemania.
Tesis Doctoral García-Amorena, I., 2007 Objetivos
21
2. OBJETIVOS
Se fija como objetivo principal de este trabajo profundizar en el conocimiento sobre
la composición y dinámica del paisaje vegetal de la costa Atlántica ibérica durante el
último ciclo glaciar-interglaciar, prestando especial atención a su relación con las
fluctuaciones climáticas que afectaron a las poblaciones vegetales de esta región. Para
alcanzar dicho objetivo nos basamos en la Paleobotánica y Paleoclimatología,
buscando nuevos datos que den un soporte científico a las hipótesis propuestas.
En este trabajo enfocamos nuestros esfuerzos en localizar, muestrear y analizar
macrorrestos vegetales en yacimientos costeros e intermareales atlánticos ibéricos del
final del Cuaternario. Se aplican técnicas para la identificación de restos vegetales y de
asignación cronológica sobre el material recolectado, con los que se contribuye a
ampliar el conocimiento sobre la evolución de la vegetación a lo largo del último ciclo
climático en la costa Atlántica de la Península Ibérica.
Dada la relación entre la evolución de la vegetación y las fluctuaciones climáticas,
se pretende deducir a partir de las comunidades que se establecieron en la costa
Atlántica de la Península Ibérica, las condiciones ambientales que caracterizaron a estas
costas en el pasado. La temperatura se podrá obtener a partir de la existencia de ciertas
comunidades, mientras que la concentración atmosférica de CO2 se podrá deducir a
partir de los caracteres epidérmicos de los restos foliares. La relación entre los registros
disponibles de temperatura con los de CO2 contribuirá al conocimiento del papel del
CO2 en la dinámica climática.
Para lograr dicho fin, se hace necesario el establecimiento de un modelo que
relacione el índice estomático con el CO2 atmosférico, válido para los materiales fósiles
recolectados en el litoral atlántico peninsular.
En resumen, podemos concretar la finalidad de este trabajo, en los siguientes
objetivos específicos:
Localización y prospección de yacimientos en la costa Atlántica de la Península
Ibérica susceptibles de albergar macrorrestos de la vegetación instalada en el
Pleistoceno Superior y Holoceno.
Obtención de macrorrestos para su posterior estudio, utilizando técnicas
apropiadas de muestreo y de extracción del material fósil incluido en los
sedimentos de los yacimientos prospectados.
Tesis Doctoral García-Amorena, I., 2007 Objetivos
22
Identificación de los macrorrestos vegetales recolectados hasta el nivel
taxonómico más preciso posible. Para cumplir dicho objetivo se desarrollan para
algunos materiales técnicas de identificación basadas en el estudio de tricomas y
morfología foliar.
Establecimiento de la cronología de los yacimientos, basada en las mediciones
del 14C de los materiales leñosos extraídos en los distintos estratos.
Propuesta de un modelo de evolución de la vegetación para la costa Atlántica
ibérica en el final del Cuaternario, con indicación de las condiciones climáticas
que las caracterizaron. Para lograr este fin se utilizarán tanto los resultados
obtenidos de la identificación y datación de los materiales estudiados, como los
datos paleobotánicos, corológicos y ecológicos publicados hasta la fecha.
Desarrollar y ajustar metodologías para la estimación del CO2 atmosférico en el
Holoceno, a partir de distintos parámetros epidérmicos de las hojas fósiles
encontradas en los yacimientos estudiados. En concreto, desarrollar un modelo
SI-CO2 mediante el análisis de materiales ibéricos de Quercus robur-petraea,
vivos y de herbario, válido para su aplicación en el norte de la Península Ibérica.
A partir de los materiales foliares de Q. robur-petraea ibéricos recolectados y
con la aplicación del modelo SI-CO2 propuesto, obtener un patrón de variación
regional de CO2 atmosférico a lo largo del Holoceno. Con esta aportación se
analizará el papel del CO2 atmosférico en la dinámica climática del presente
estadío interglaciar.
Tesis Doctoral García-Amorena, I., 2007 Área de estudio
23
3. ÁREA DE ESTUDIO
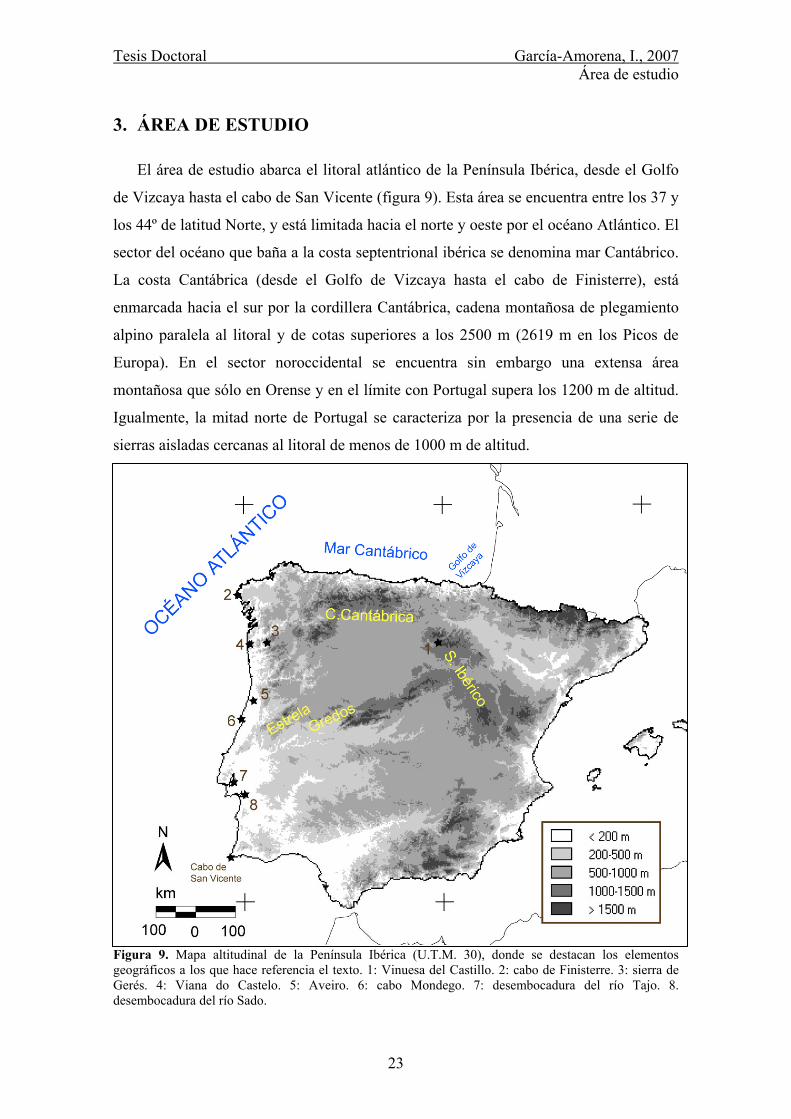
El área de estudio abarca el litoral atlántico de la Península Ibérica, desde el Golfo
de Vizcaya hasta el cabo de San Vicente (figura 9). Esta área se encuentra entre los 37 y
los 44º de latitud Norte, y está limitada hacia el norte y oeste por el océano Atlántico. El
sector del océano que baña a la costa septentrional ibérica se denomina mar Cantábrico.
La costa Cantábrica (desde el Golfo de Vizcaya hasta el cabo de Finisterre), está
enmarcada hacia el sur por la cordillera Cantábrica, cadena montañosa de plegamiento
alpino paralela al litoral y de cotas superiores a los 2500 m (2619 m en los Picos de
Europa). En el sector noroccidental se encuentra sin embargo una extensa área
montañosa que sólo en Orense y en el límite con Portugal supera los 1200 m de altitud.
Igualmente, la mitad norte de Portugal se caracteriza por la presencia de una serie de
sierras aisladas cercanas al litoral de menos de 1000 m de altitud.
Figura 9. Mapa altitudinal de la Península Ibérica (U.T.M. 30), donde se destacan los elementos geográficos a los que hace referencia el texto. 1: Vinuesa del Castillo. 2: cabo de Finisterre. 3: sierra de Gerés. 4: Viana do Castelo. 5: Aveiro. 6: cabo Mondego. 7: desembocadura del río Tajo. 8. desembocadura del río Sado.
Tesis Doctoral García-Amorena, I., 2007 Área de estudio
24
La red hidrográfica del sector atlántico-norte de la Península Ibérica que tiene su
origen en la cordillera Cantábrica, se caracteriza por ríos de corta longitud y fuerte
poder erosivo que han labrado profundos cañones sobre muy diversos materiales
litológicos. La cordillera Cantábrica desciende bruscamente hacia el norte, quedando
delimitada por un sistema escalonado y discontinuo de plataformas litorales alargadas y
planas, denominadas rasas (10% a 20% de inclinación hacia el mar), ubicadas entre los
20 y 260 m de altitud (Mary, 1983; Mary, 1990). Se extienden desde La Guardia
(Pontevedra), hasta Plentzia (Vizcaya), aunque la zona de mayor continuidad se
encuentra entre Foz (Lugo) y San Vicente de la Barquera (Cantabria). Su origen como
superficies de arrasamiento marino o continental, aún no ha quedado claramente
establecido.
A lo largo del sector oriental del litoral cantábrico, existen pequeñas superficies
erosivas de menor altitud que atestiguan distintos niveles marinos cuaternarios. El nivel
situado a 1-3 m sobre el nivel medio del mar, que se encuentra en Nois (Lugo) y en
Oyambre y San Vicente de la Barquera (Cantabria), corresponde a la posición que
alcanzó el nivel del mar durante el Último Interglacial (Alonso & Pagés, 2000, 2001).
La transgresión holocena ha sido estudiada en distintos estuarios a lo largo de la
costa Cantábrica, desde el País Vasco hasta Galicia, fundamentalmente mediante el
análisis de sondeos. En el País Vasco se ha interpretado como una transgresión en dos
pulsos transgresivo – regresivos (Cearreta, 1994; Gutiérrez Elorza, 1994; Rivas, 2000).
La regresión última (denominada Dunquerquiense, Xivares o Jaizquibel) situada en el
periodo Subboreal, queda reflejada en distintos depósitos en el litoral cantábrico. En el
sector occidental (Alonso, 2005; García Antón et al, 2006; Bao et al. 2006) se han
obtenido modelos de evolución del nivel del mar que apuntan a una subida rápida desde
el inicio hasta los 7000 años aproximadamente, una ralentización alrededor de los 5000
y un ritmo medio de ascenso hasta la actualidad, en la que se ha acelerado.
Por tanto, aun cuando en los estuarios del País Vasco se interpreta la secuencia
holocena como el resultado de dos ciclos transgresivo – regresivos, existen evidencias
en la costa occidental de la Península Ibérica y en el sector occidental del litoral
cantábrico, que indican que el nivel del mar no ha superado a lo largo del Holoceno su
posición actual. En este caso los diferentes registros holocenos del nivel marino a lo
largo de la costa estudiada, han sido atribuidas al distinto comportamiento geotectónico
y movimientos eustáticos que ha sufrido la costa ibérica a lo largo de este periodo del
Tesis Doctoral García-Amorena, I., 2007 Área de estudio
25
Cuaternario (Zazo et al., 1997; Alonso & Pagés, 2000; Dias et al., 2000; Rivas, 2000;
Chao et al., 2002; Soares de Carvalho et al., 2002; Pagés et al., 2003; Bao et al., 2006).
La etapa de ralentización y/o parada de la subida del nivel del mar detectada en el
sector occidental fue la responsable de la formación de numerosas turberas a lo largo de
la costa Cantábrica en este periodo, que han sido estudiadas por distintos autores (Mary,
1990, Garzón et al. 1996). Es en estas turberas y en los depósitos relacionados con la
transgresión marina de los últimos 10.000 años, exhumados en sondeos, pozos y
excavaciones, en los que se ubican la mayoría de los yacimientos estudiados.
Climáticamente, la costa Atlántica de la Península Ibérica se caracteriza por poseer
unas temperaturas medias anuales moderadas, entre 12ºC y 16ºC, con ausencia de
heladas y temperaturas máximas estivales que no superan generalmente 24ºC en el
sector septentrional, pero que en el sur de Portugal, fuera ya de nuestra área de estudio,
alcanzan los 28ºC (Font Tullot, 1983). El corto periodo de sequía estival que caracteriza
las costas del noroeste peninsular, va adquiriendo mayor importancia hacia el sur, donde
en la región del Algarbe llega a superar los tres meses de duración (Allué, 1990).
Igualmente, los más de 1000 mm de precipitación anuales que recibe la costa Cantábrica
(en Guipúzcoa superan los 1500 mm anuales), se reducen a la mitad en el extremo
meridional de Portugal (Font Tullot, 1983). Nos encontramos por tanto, en una zona de
transición entre el clima Atlántico Europeo y el Mediterráneo (Ozenda & Borel, 2001;
Rivas-Martínez et al., 2002).
Los yacimientos explorados se encuentran en sedimentos cuaternarios que rellenan
los valles excavados por el entramado hidrológico de este periodo. Los materiales
recolectados han sido expuestos en playas y acantilados costeros por la erosión marina,
o con motivo de la realización de obras civiles en el litoral.
Tesis Doctoral García-Amorena, I., 2007 Materiales y métodos
26
4. MATERIALES Y MÉTODOS
La localización de yacimientos susceptibles de albergar macrorrestos vegetales
fósiles, se ha realizado mediante búsqueda bibliográfica de estudios geomorfológicos
realizados con anterioridad en la costa Atlántica de la Península Ibérica, así como
contactando personalmente con investigadores y técnicos que realizan sus actividades
profesionales en las áreas objeto de nuestro interés.
La toma de muestras se realizó en sucesivas visitas a los yacimientos, coincidiendo
con periodos de mínimo nivel de las aguas oceánicas en mareas vivas. El método de
muestreo utilizado varió en función del tipo de macrorresto a localizar. En el caso de
macrorrestos xilológicos de gran tamaño se realizó un muestreo superficial completo,
mientras que para la recolección de macrorrestos de menor tamaño, especialmente
foliares, se realizaron muestreos estratigráficos por columnas (Jones & Rowe, 1999).
La prospección y toma de muestras ha sido realizada en su mayor parte por el
equipo de Paleobotánica de la Unidad Docente de Botánica de la Escuela Técnica
Superior de Ingenieros de Montes de la Universidad Politécnica de Madrid (ETSIM-
UPM), entre los años 1994 y 2005. Los macrorrestos de los yacimientos portugueses
entre Aveiro y Viana do Castelo fueron recogidos en la costa tras los periodos de
tormenta por Gaspar Soares de Carvalho y Helena Maria Granja (Universidad do
Minho) entre 1980 y 2005. La recolección de las muestras expuestas en las obras civiles
de Asturias y Cantabria durante los años 2004 y 2005, fue posible gracias a la
colaboración de los geólogos encargados de la construcción de la autovía del
Cantábrico, Manuel Hacar e Iñaki Ortiz. Ángela Alonso y José Luís Pagés (Universidad
de la Coruña) y Pablo Ramil Rego (Universidad de Santiago de Compostela) nos
comunicaron la existencia de diversos yacimientos colaborando en el muestreo de
campo.
4.1. Descripción de los yacimientos
A lo largo de la costa Atlántica se han localizado 18 yacimientos, nueve situados en
el litoral cantábrico y otros nueve en la costa Portuguesa (tabla 2, figura 10). Estos
yacimientos se pueden englobar en tres grupos; 1) los que están sometidos a la acción
directa del agua del mar, ya sea por flujo y reflujo de las mareas o por la acción directa
del oleaje, 2) las rías, no sometidas actualmente a la acción directa del agua marina pero

Tesis Doctoral García-Amorena, I., 2007 Materiales y métodos
27
en cuya génesis el mar desempeñó un papel decisivo, y 3) los yacimientos ubicados en
el interior, independientes de la acción marina.
Yacimientos sometidos a la acción directa del oleaje
El yacimiento de Noja (Cantabria), se sitúa en una depresión de origen cárstico
donde entre las calizas cretácicas alternan rellenos limosos, arcillosos, arenas
continentales y varios niveles de turba de hasta 100 cm de espesor. En este depósito se
han encontrado, entre los 0 y los 4 m por debajo del nivel del mar actual, troncos y
raíces en posición de vida, con cronologías entre 3000 y 4500 años BP (Salas et al.,
1996).
Los yacimientos de Merón y Oyambre (Cantabria) están asentados sobre un antiguo
nivel de playas colgadas de más de 70000 años BP que yace sobre una base de material
cretácico y paleógeno de distinta naturaleza. Los sedimentos holocenos turbosos, ricos
Figura 10. Ubicación de los yacimientos estudiados (U.T.M. 30).

Tesis Doctoral García-Amorena, I., 2007 Materiales y métodos
28
Tabla 2. Listado de yacimientos estudiados. U.T.M.: Universal Tranverse Mercator, datum Postdam. coordenadas. H: altitud sobre el nivel del mar (m). UD: unidad estratigráfica. Sombreado: estratos donde se han recolectado restos foliares para la medición del CO2 atmosférico.
YACIMIENTO UTM H UD
ESPOSENDE 29TNF172991 0 1-Turba 2-300 m NE farol
3-Asentamiento (bajo duna) APULIA 29TNF185922 0 1-Capela Velha
SILVALDE 29TNF298377 0 1-Armadilla romana ESMORIZ 29TNF291342 0 1-N Cortegaça-1990
CORTEGAÇA 29TNF288323 0 1-Sur espigón-2002
2-Sur espigón-1998
SAN PEDRO DE MACEDA 29TNF282299 0 1-Cama baja mar
OVAR 29TNF272245 0 1-Duna
PARAMÓS 29TNF295365 0 1-Tijuca
BARREIRO 29SMC950809 0 1-Baja mar
BALDAYO 29TNH27279481 0 Turba
FINCA GALEA 29TPJ28092067 65 Extracción
NAVIA 29TPJ83672429 10 P3
PRAVIA 29TQJ36132567 10 P6 (22 m)
P6 (18 m)
P12 (8 m)
VILLAVICIOSA 30TUP04001923 15 A-SR2
A-base
B
D
C
E-turba
E-tronco
BORBOLLA 30TUP68280573 50 Valle
MERÓN 30TUP89450598 0 Playa
Cortado
OYAMBRE 30TUP92130573 0 Cortado
NOJA 30TVP60431328 -4 Turba
Tesis Doctoral García-Amorena, I., 2007 Materiales y métodos
29
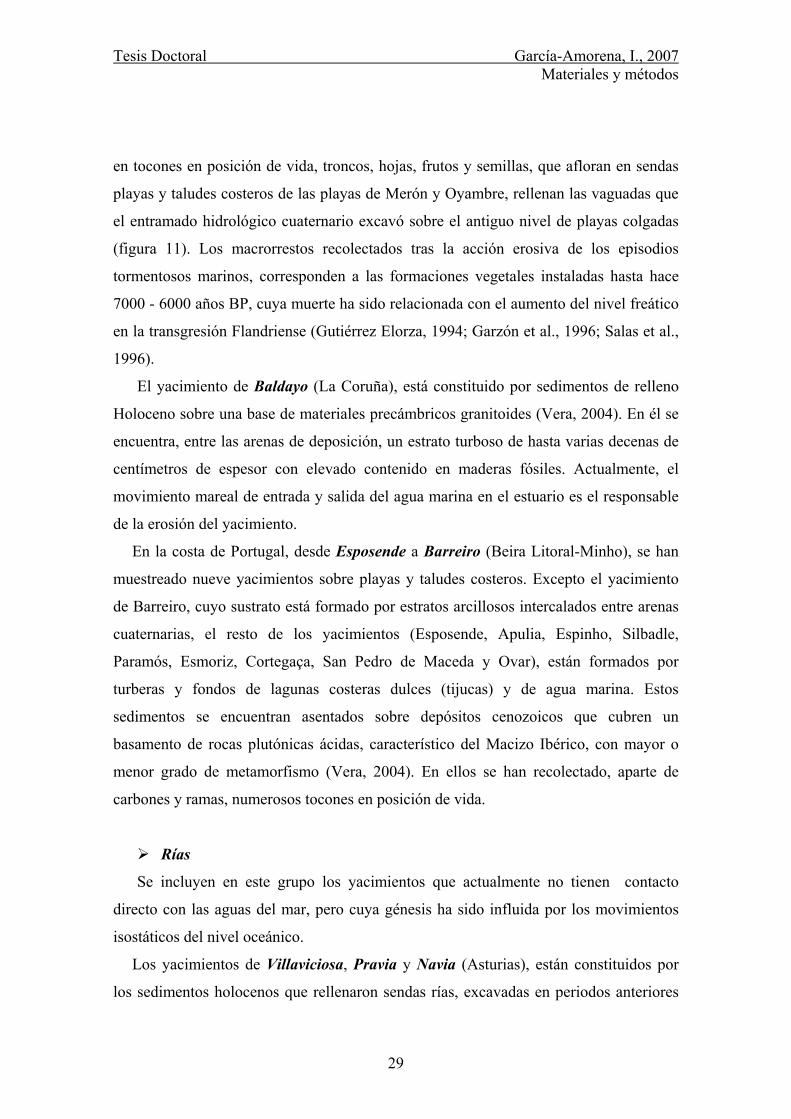
en tocones en posición de vida, troncos, hojas, frutos y semillas, que afloran en sendas
playas y taludes costeros de las playas de Merón y Oyambre, rellenan las vaguadas que
el entramado hidrológico cuaternario excavó sobre el antiguo nivel de playas colgadas
(figura 11). Los macrorrestos recolectados tras la acción erosiva de los episodios
tormentosos marinos, corresponden a las formaciones vegetales instaladas hasta hace
7000 - 6000 años BP, cuya muerte ha sido relacionada con el aumento del nivel freático
en la transgresión Flandriense (Gutiérrez Elorza, 1994; Garzón et al., 1996; Salas et al.,
1996).
El yacimiento de Baldayo (La Coruña), está constituido por sedimentos de relleno
Holoceno sobre una base de materiales precámbricos granitoides (Vera, 2004). En él se
encuentra, entre las arenas de deposición, un estrato turboso de hasta varias decenas de
centímetros de espesor con elevado contenido en maderas fósiles. Actualmente, el
movimiento mareal de entrada y salida del agua marina en el estuario es el responsable
de la erosión del yacimiento.
En la costa de Portugal, desde Esposende a Barreiro (Beira Litoral-Minho), se han
muestreado nueve yacimientos sobre playas y taludes costeros. Excepto el yacimiento
de Barreiro, cuyo sustrato está formado por estratos arcillosos intercalados entre arenas
cuaternarias, el resto de los yacimientos (Esposende, Apulia, Espinho, Silbadle,
Paramós, Esmoriz, Cortegaça, San Pedro de Maceda y Ovar), están formados por
turberas y fondos de lagunas costeras dulces (tijucas) y de agua marina. Estos
sedimentos se encuentran asentados sobre depósitos cenozoicos que cubren un
basamento de rocas plutónicas ácidas, característico del Macizo Ibérico, con mayor o
menor grado de metamorfismo (Vera, 2004). En ellos se han recolectado, aparte de
carbones y ramas, numerosos tocones en posición de vida.
Rías
Se incluyen en este grupo los yacimientos que actualmente no tienen contacto
directo con las aguas del mar, pero cuya génesis ha sido influida por los movimientos
isostáticos del nivel oceánico.
Los yacimientos de Villaviciosa, Pravia y Navia (Asturias), están constituidos por
los sedimentos holocenos que rellenaron sendas rías, excavadas en periodos anteriores
Tesis Doctoral García-Amorena, I., 2007 Materiales y métodos
30
sobre materiales Jurásicos, del Permotrias y Bundsandstein. Las obras de la autovía del
Cantábrico, han permitido realizar una reconstrucción estratigráfica detallada de la ría
de Villaviciosa (Pagés et al., 2003), cuya dinámica puede ser extrapolada a las otras rías
gracias a los sondeos preliminares realizados en ellas. En Villaviciosa se observa un
desplazamiento del cauce hacia el oeste por pulsos, que provocó el relleno secuencial de
la cuenca por acreción lateral. Los cantos rodados de origen fluvial sedimentados en la
base alternan, a medida que nos desplazamos hacia el techo, con sedimentos limosos y
arenosos fluvio-marinos (figura 11). La secuencia estratigráfica de la ría de Villaviciosa
responde a un aumento rápido del nivel del mar en el comienzo del Holoceno para
estabilizarse, aproximadamente hace 7000 años BP, cinco metros por debajo del nivel
actual (Pagés et al., 2003).
En la ría de Villaviciosa, las obras de construcción de la autovía han puesto al
descubierto un perfil de más de 200 m de longitud por 30 m de profundidad. Dicho
perfil pudo ser muestreado en toda su superficie en busca de macrorrestos. También se
realizaron varios muestreos por columna estratigráfica en distintos puntos del
yacimiento, para la obtención de macrorrestos de menor tamaño.
En la ría de Pravia se recolectaron, a distintas profundidades, macrorrestos y
sedimentos de los sondeos realizados en las obras de excavación de varios pilotes del
viaducto (figura 11). Igualmente, en el proceso de excavación para el relleno de los
pilotes del viaducto de Navia, se hallaron restos leñosos a distintas profundidades.
Yacimientos interiores
Los yacimientos de Finca Galea (Lugo) y de La Borbolla (Asturias), están ubicados
en valles interiores del piso colino, donde la acción del mar se restringe actualmente a
su efecto termorregulador sobre el clima. Ambos yacimientos están constituidos por
sustratos holocenos de fondos de valle sobre una base de granitos plutónicos (Finca
Galea) y de areniscas jurásicas y calizas carboníferas (la Borbolla) (Vera, 2004). En
ambos yacimientos se han extraído troncos de grandes dimensiones.
Tesis Doctoral García-Amorena, I., 2007 Materiales y métodos
31
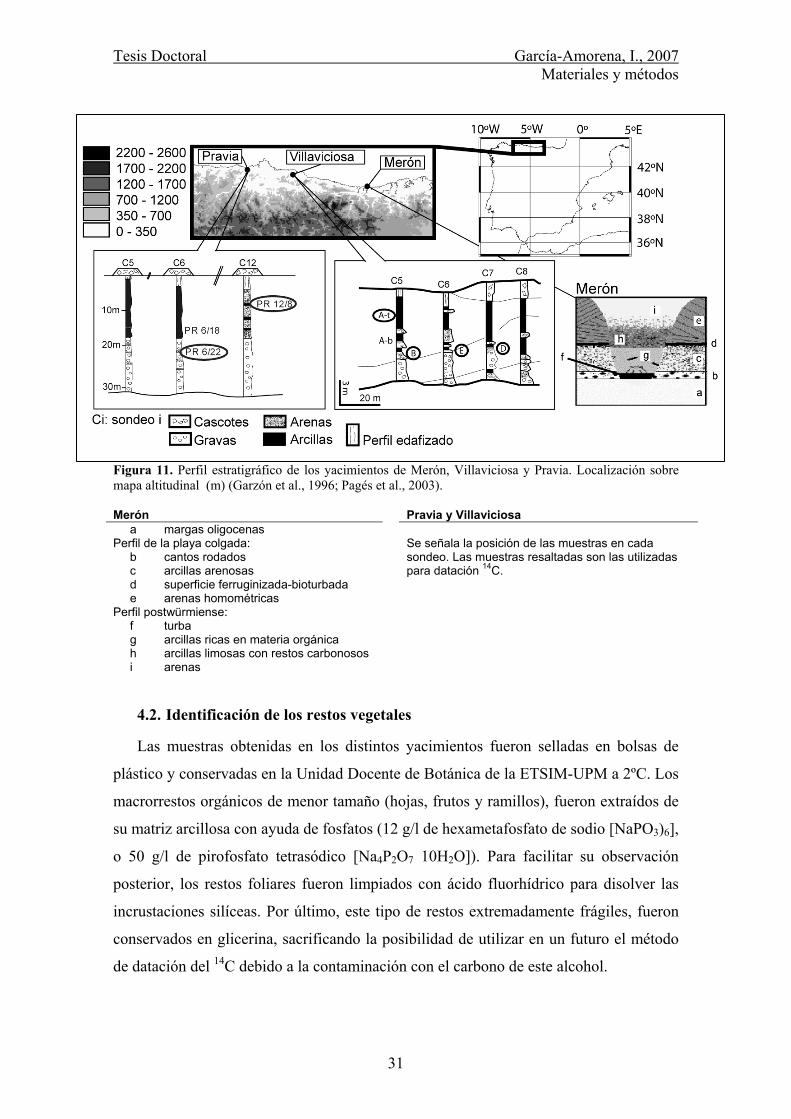
Figura 11. Perfil estratigráfico de los yacimientos de Merón, Villaviciosa y Pravia. Localización sobre mapa altitudinal (m) (Garzón et al., 1996; Pagés et al., 2003). Merón Pravia y Villaviciosa a margas oligocenas Perfil de la playa colgada: Se señala la posición de las muestras en cada b cantos rodados sondeo. Las muestras resaltadas son las utilizadas c arcillas arenosas para datación 14C. d superficie ferruginizada-bioturbada e arenas homométricas Perfil postwürmiense: f turba g arcillas ricas en materia orgánica h arcillas limosas con restos carbonosos i arenas
4.2. Identificación de los restos vegetales
Las muestras obtenidas en los distintos yacimientos fueron selladas en bolsas de
plástico y conservadas en la Unidad Docente de Botánica de la ETSIM-UPM a 2ºC. Los
macrorrestos orgánicos de menor tamaño (hojas, frutos y ramillos), fueron extraídos de
su matriz arcillosa con ayuda de fosfatos (12 g/l de hexametafosfato de sodio [NaPO3)6],
o 50 g/l de pirofosfato tetrasódico [Na4P2O7 10H2O]). Para facilitar su observación
posterior, los restos foliares fueron limpiados con ácido fluorhídrico para disolver las
incrustaciones silíceas. Por último, este tipo de restos extremadamente frágiles, fueron
conservados en glicerina, sacrificando la posibilidad de utilizar en un futuro el método
de datación del 14C debido a la contaminación con el carbono de este alcohol.

Tesis Doctoral García-Amorena, I., 2007 Materiales y métodos
32
Maderas
Los restos leñosos recolectados fueron medidos y fotografiados antes de proceder a
la preparación e hidratación de cubos de 1.5 cm de lado, para la obtención de los planos
transversal, radial y tangencial (figura 12), en lámina delgada con microtomo de raíles
(Jane, 1956; Barefoot & Hankins, 1982; Roig et al., 1997; Figueiral, 1999; Carlquist,
2001). En el caso de muestras leñosas en avanzado estado de degradación o compresión,
fue necesario el blanqueo o maceración de las láminas delgadas en hipoclorito de sodio
al 4% (NaH ClO2), antes de proceder a su teñido con safranina. El xileno,
tradicionalmente aplicado para la fijación de safranina tras varios lavados con alcohol,
ha sido sustituido por el compuesto industrial menos nocivo ‘Histo-Clear’. Las láminas
delgadas obtenidas a partir de los tres planos correspondientes, fueron estudiadas con el
microscopio óptico de transmisión (Olympus BX50, oculares ×10, lentes ×5, ×10, ×20 y
×50).
Figura 12. Planos principales para la identificación de los restos leñosos. Tr: corte transversal. Rd: corte radial. Tg: corte tangencial.
Las maderas en avanzado estado de carbonificación (enriquecimiento en ácidos
húmicos), fueron desecadas parcialmente para que adquiriesen una consistencia que
permitiese su corte en el microtomo. Los restos carbonizados fueron fracturados
manualmente para su observación a la lupa binocular (Olympus SZX12, ×7-90) y al
microscopio óptico de luz reflejada (Meyen, 1987).
Los caracteres estudiados (Metcalfe & Chalk, 1979; Barefoot & Hankins, 1982;
Wheeler et al., 1989; Carlquist, 2001; Richter et al., 2004) fueron contrastados con
claves, descripciones, fotografías y dibujos (Greguss, 1945; Greguss, 1955; Jacquiot,
1955; Greguss, 1959; Jacquiot et al., 1973; Core et al., 1979; Wheeler et al., 1986;
Guindeo & García, 1989; Schweingruber, 1990; Dallwitz et al., 1993 onwards; García
et al., 1996; Richter & Dallwitz, 2000 onwards; García et al., 2002; Heiss, 2003; Group,
2004-onwards). La diagnosis resultante fue comprobada mediante comparación
morfológica con material actual preparado expresamente al efecto y con la colección de
referencia de la Unidad Docente de Maderas (ETSIM-UPM).
Tesis Doctoral García-Amorena, I., 2007 Materiales y métodos
33
Debido a la similitud de los caracteres xilológicos entre algunas especies de pinos,
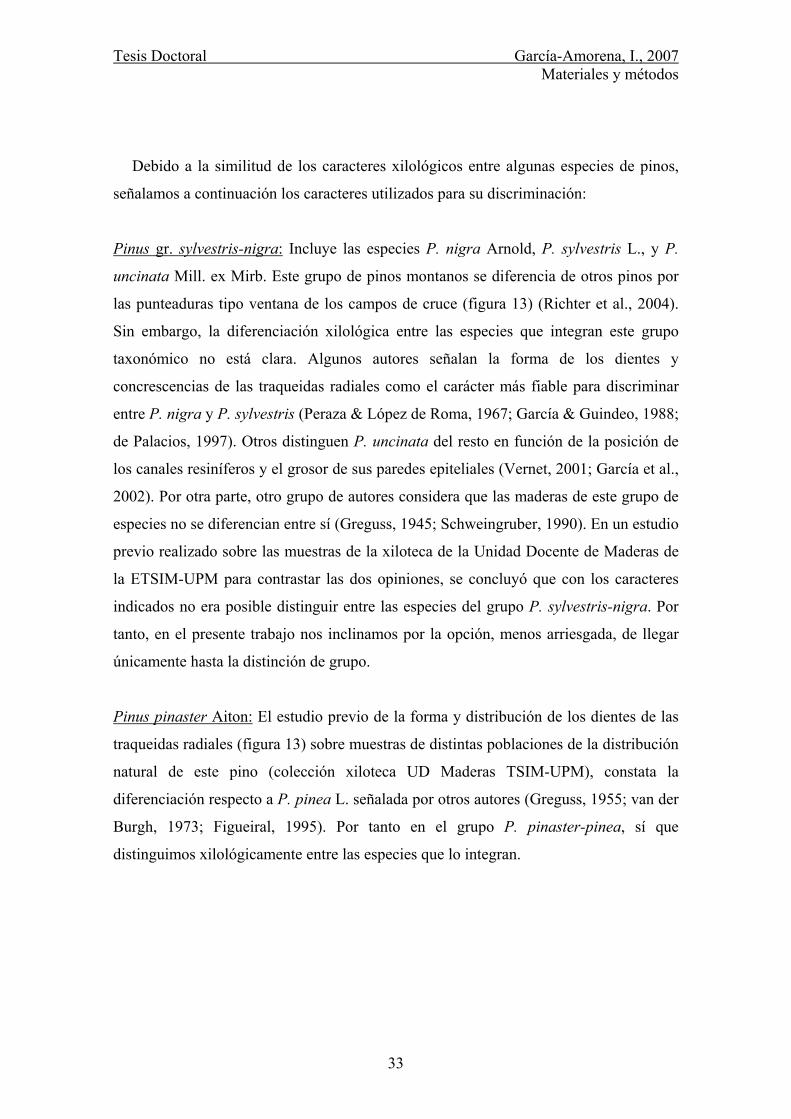
señalamos a continuación los caracteres utilizados para su discriminación:
Pinus gr. sylvestris-nigra: Incluye las especies P. nigra Arnold, P. sylvestris L., y P.
uncinata Mill. ex Mirb. Este grupo de pinos montanos se diferencia de otros pinos por
las punteaduras tipo ventana de los campos de cruce (figura 13) (Richter et al., 2004).
Sin embargo, la diferenciación xilológica entre las especies que integran este grupo
taxonómico no está clara. Algunos autores señalan la forma de los dientes y
concrescencias de las traqueidas radiales como el carácter más fiable para discriminar
entre P. nigra y P. sylvestris (Peraza & López de Roma, 1967; García & Guindeo, 1988;
de Palacios, 1997). Otros distinguen P. uncinata del resto en función de la posición de
los canales resiníferos y el grosor de sus paredes epiteliales (Vernet, 2001; García et al.,
2002). Por otra parte, otro grupo de autores considera que las maderas de este grupo de
especies no se diferencian entre sí (Greguss, 1945; Schweingruber, 1990). En un estudio
previo realizado sobre las muestras de la xiloteca de la Unidad Docente de Maderas de
la ETSIM-UPM para contrastar las dos opiniones, se concluyó que con los caracteres
indicados no era posible distinguir entre las especies del grupo P. sylvestris-nigra. Por
tanto, en el presente trabajo nos inclinamos por la opción, menos arriesgada, de llegar
únicamente hasta la distinción de grupo.
Pinus pinaster Aiton: El estudio previo de la forma y distribución de los dientes de las
traqueidas radiales (figura 13) sobre muestras de distintas poblaciones de la distribución
natural de este pino (colección xiloteca UD Maderas TSIM-UPM), constata la
diferenciación respecto a P. pinea L. señalada por otros autores (Greguss, 1955; van der
Burgh, 1973; Figueiral, 1995). Por tanto en el grupo P. pinaster-pinea, sí que
distinguimos xilológicamente entre las especies que lo integran.
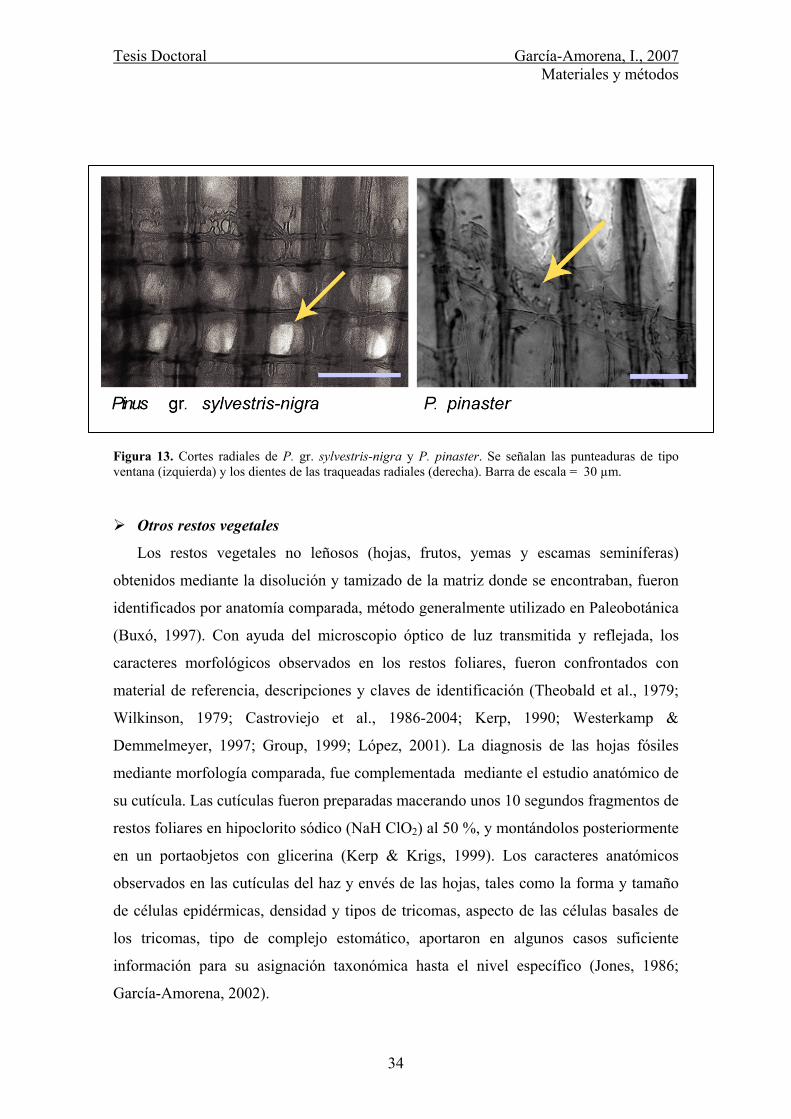
Tesis Doctoral García-Amorena, I., 2007 Materiales y métodos
34
Figura 13. Cortes radiales de P. gr. sylvestris-nigra y P. pinaster. Se señalan las punteaduras de tipo ventana (izquierda) y los dientes de las traqueadas radiales (derecha). Barra de escala = 30 µm.
Otros restos vegetales
Los restos vegetales no leñosos (hojas, frutos, yemas y escamas seminíferas)
obtenidos mediante la disolución y tamizado de la matriz donde se encontraban, fueron
identificados por anatomía comparada, método generalmente utilizado en Paleobotánica
(Buxó, 1997). Con ayuda del microscopio óptico de luz transmitida y reflejada, los
caracteres morfológicos observados en los restos foliares, fueron confrontados con
material de referencia, descripciones y claves de identificación (Theobald et al., 1979;
Wilkinson, 1979; Castroviejo et al., 1986-2004; Kerp, 1990; Westerkamp &
Demmelmeyer, 1997; Group, 1999; López, 2001). La diagnosis de las hojas fósiles
mediante morfología comparada, fue complementada mediante el estudio anatómico de
su cutícula. Las cutículas fueron preparadas macerando unos 10 segundos fragmentos de
restos foliares en hipoclorito sódico (NaH ClO2) al 50 %, y montándolos posteriormente
en un portaobjetos con glicerina (Kerp & Krigs, 1999). Los caracteres anatómicos
observados en las cutículas del haz y envés de las hojas, tales como la forma y tamaño
de células epidérmicas, densidad y tipos de tricomas, aspecto de las células basales de
los tricomas, tipo de complejo estomático, aportaron en algunos casos suficiente
información para su asignación taxonómica hasta el nivel específico (Jones, 1986;
García-Amorena, 2002).
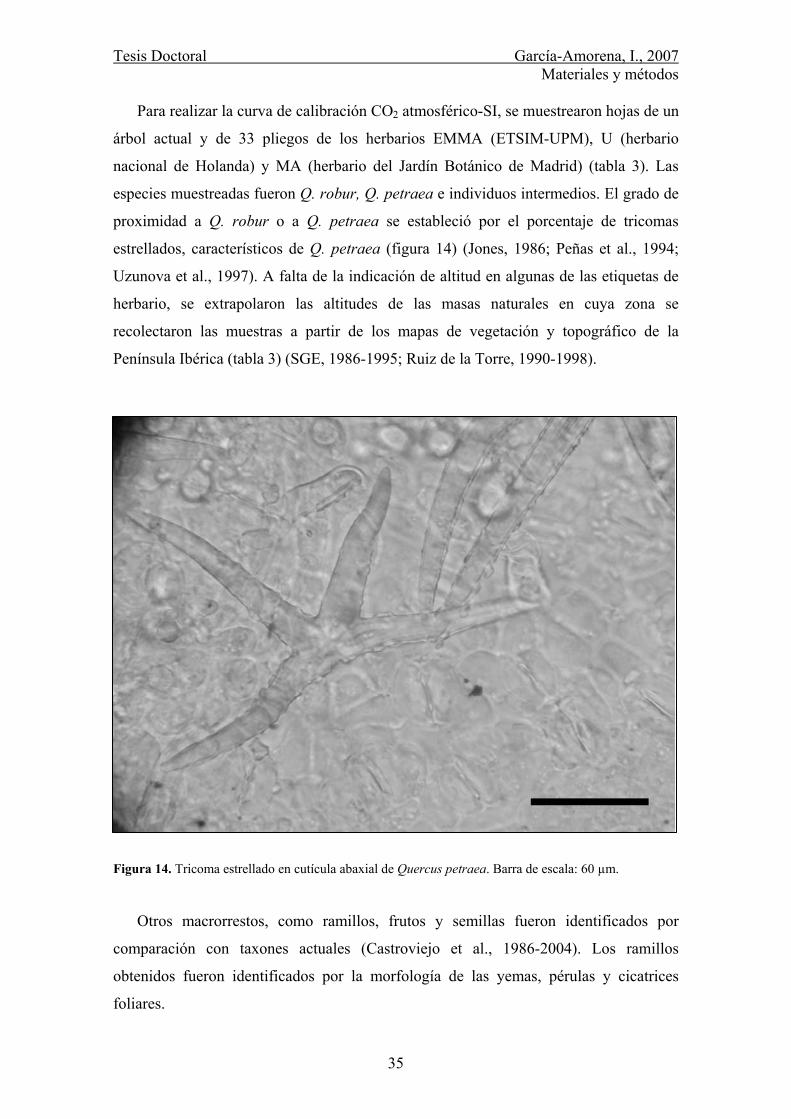
Tesis Doctoral García-Amorena, I., 2007 Materiales y métodos
35
Para realizar la curva de calibración CO2 atmosférico-SI, se muestrearon hojas de un
árbol actual y de 33 pliegos de los herbarios EMMA (ETSIM-UPM), U (herbario
nacional de Holanda) y MA (herbario del Jardín Botánico de Madrid) (tabla 3). Las
especies muestreadas fueron Q. robur, Q. petraea e individuos intermedios. El grado de
proximidad a Q. robur o a Q. petraea se estableció por el porcentaje de tricomas
estrellados, característicos de Q. petraea (figura 14) (Jones, 1986; Peñas et al., 1994;
Uzunova et al., 1997). A falta de la indicación de altitud en algunas de las etiquetas de
herbario, se extrapolaron las altitudes de las masas naturales en cuya zona se
recolectaron las muestras a partir de los mapas de vegetación y topográfico de la
Península Ibérica (tabla 3) (SGE, 1986-1995; Ruiz de la Torre, 1990-1998).
Figura 14. Tricoma estrellado en cutícula abaxial de Quercus petraea. Barra de escala: 60 µm.
Otros macrorrestos, como ramillos, frutos y semillas fueron identificados por
comparación con taxones actuales (Castroviejo et al., 1986-2004). Los ramillos
obtenidos fueron identificados por la morfología de las yemas, pérulas y cicatrices
foliares.
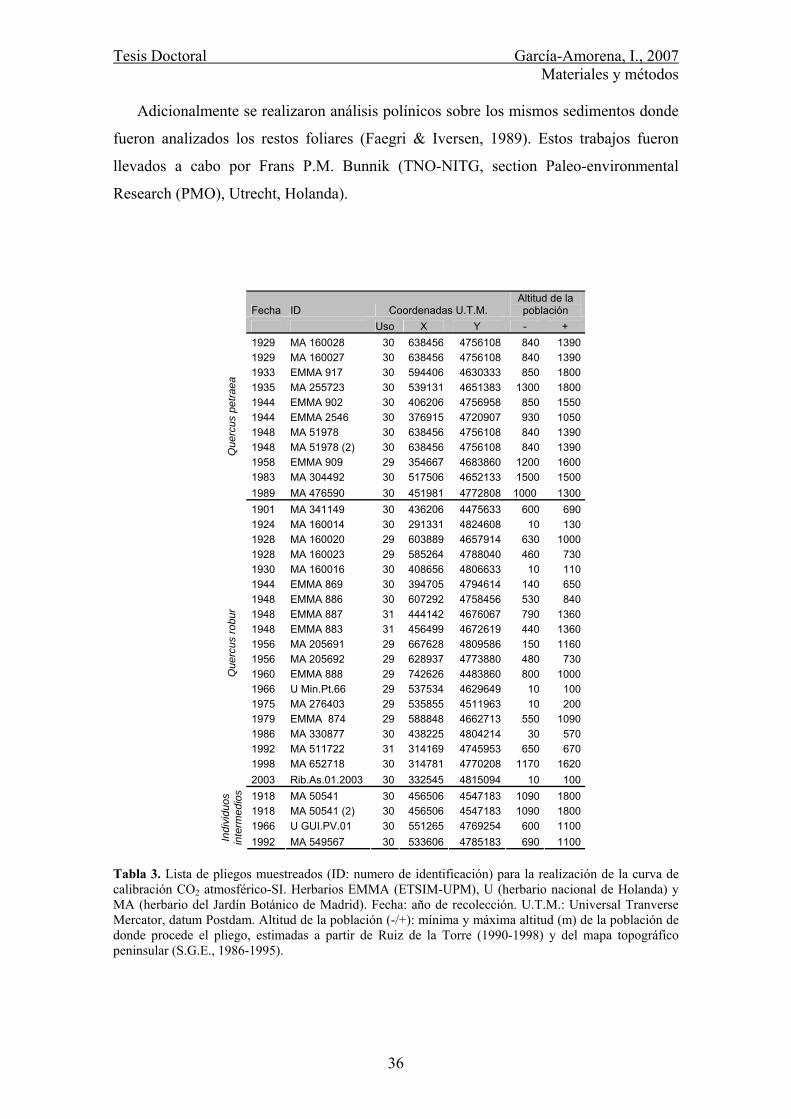
Tesis Doctoral García-Amorena, I., 2007 Materiales y métodos
36
Adicionalmente se realizaron análisis polínicos sobre los mismos sedimentos donde
fueron analizados los restos foliares (Faegri & Iversen, 1989). Estos trabajos fueron
llevados a cabo por Frans P.M. Bunnik (TNO-NITG, section Paleo-environmental
Research (PMO), Utrecht, Holanda).
Tabla 3. Lista de pliegos muestreados (ID: numero de identificación) para la realización de la curva de calibración CO2 atmosférico-SI. Herbarios EMMA (ETSIM-UPM), U (herbario nacional de Holanda) y MA (herbario del Jardín Botánico de Madrid). Fecha: año de recolección. U.T.M.: Universal Tranverse Mercator, datum Postdam. Altitud de la población (-/+): mínima y máxima altitud (m) de la población de donde procede el pliego, estimadas a partir de Ruiz de la Torre (1990-1998) y del mapa topográfico peninsular (S.G.E., 1986-1995).
Fecha ID Coordenadas U.T.M. Altitud de la población
Uso X Y - + 1929 MA 160028 30 638456 4756108 840 1390 1929 MA 160027 30 638456 4756108 840 1390 1933 EMMA 917 30 594406 4630333 850 1800 1935 MA 255723 30 539131 4651383 1300 1800 1944 EMMA 902 30 406206 4756958 850 1550 1944 EMMA 2546 30 376915 4720907 930 1050 1948 MA 51978 30 638456 4756108 840 1390 1948 MA 51978 (2) 30 638456 4756108 840 1390 1958 EMMA 909 29 354667 4683860 1200 1600 1983 MA 304492 30 517506 4652133 1500 1500
Que
rcus
pet
raea
1989 MA 476590 30 451981 4772808 1000 1300 1901 MA 341149 30 436206 4475633 600 690 1924 MA 160014 30 291331 4824608 10 130 1928 MA 160020 29 603889 4657914 630 1000 1928 MA 160023 29 585264 4788040 460 730 1930 MA 160016 30 408656 4806633 10 110 1944 EMMA 869 30 394705 4794614 140 650 1948 EMMA 886 30 607292 4758456 530 840 1948 EMMA 887 31 444142 4676067 790 1360 1948 EMMA 883 31 456499 4672619 440 1360 1956 MA 205691 29 667628 4809586 150 1160 1956 MA 205692 29 628937 4773880 480 730 1960 EMMA 888 29 742626 4483860 800 1000 1966 U Min.Pt.66 29 537534 4629649 10 100 1975 MA 276403 29 535855 4511963 10 200 1979 EMMA 874 29 588848 4662713 550 1090 1986 MA 330877 30 438225 4804214 30 570 1992 MA 511722 31 314169 4745953 650 670 1998 MA 652718 30 314781 4770208 1170 1620
Que
rcus
robu
r
2003 Rib.As.01.2003 30 332545 4815094 10 100 1918 MA 50541 30 456506 4547183 1090 1800 1918 MA 50541 (2) 30 456506 4547183 1090 1800 1966 U GUI.PV.01 30 551265 4769254 600 1100
Indi
vidu
os
inte
rmed
ios
1992 MA 549567 30 533606 4785183 690 1100

Tesis Doctoral García-Amorena, I., 2007 Materiales y métodos
37
4.3. Asignación cronológica
Las cronologías de los yacimientos estudiados fueron establecidas por unidades
estratigráficas, principalmente a partir de las mediciones radiométricas del 14C (Lowe &
Walker, 1997), realizadas sobre restos leñosos. Las edades de los estratos de donde no
se disponían de dataciones radiocarbónicas fueron extrapoladas a partir de los datos de
profundidad y de 14C de los estratos superior e inferior más cercanos. Este tipo de
extrapolación únicamente se realizó en un estrato del yacimiento de Villaviciosa y en
otro de Pravia, debido a la proximidad de otros datos de datación absoluta (figura 11).
Los macrorrestos a datar fueron seleccionados entre los situados en los estratos de
interés, teniendo en cuenta la inexistencia de evidencias de contaminación por hongos u
otro tipo de materias orgánicas. Del interior de los mismos se extrajeron entre 50 y 100
g de madera que, envueltos en papel de aluminio, etiquetados y sellados, fueron
enviados a los laboratorios Beta Analyitic INC. (Miami, U.S.A.) y Quadru (Pretoria,
Sudáfrica) para su datación radiométrica. La edad de radiocarbono proporcionada por
dichos laboratorios (Convencional Radiocarbon Ages) fue el resultado de la medición
del contenido en 14C corregido con la proporción de 13C/12C. Los resultados, en edades
BP, fueron calibrados a años de calendario (cal BP) con los programas Calib 5.0.2
(Stuiver et al., 2005) y Oxcal 3.10 (Bronk Ramsey, 2005) mediante series
dendrocronológicas (Reimer et al., 2004) (figura 15).
Figura 15. Curva de calibración de edades de radiocarbono de 0 a 2000 años BP (Reimer et al., 2004; Bronk Ramsey, 2005)
4.4. Parámetros epidérmicos
Tras el montaje de las cutículas foliares de los material fósiles y recientes en su
portaobjetos, según se indica en el apartado 3.3, los parámetros epidérmicos que se
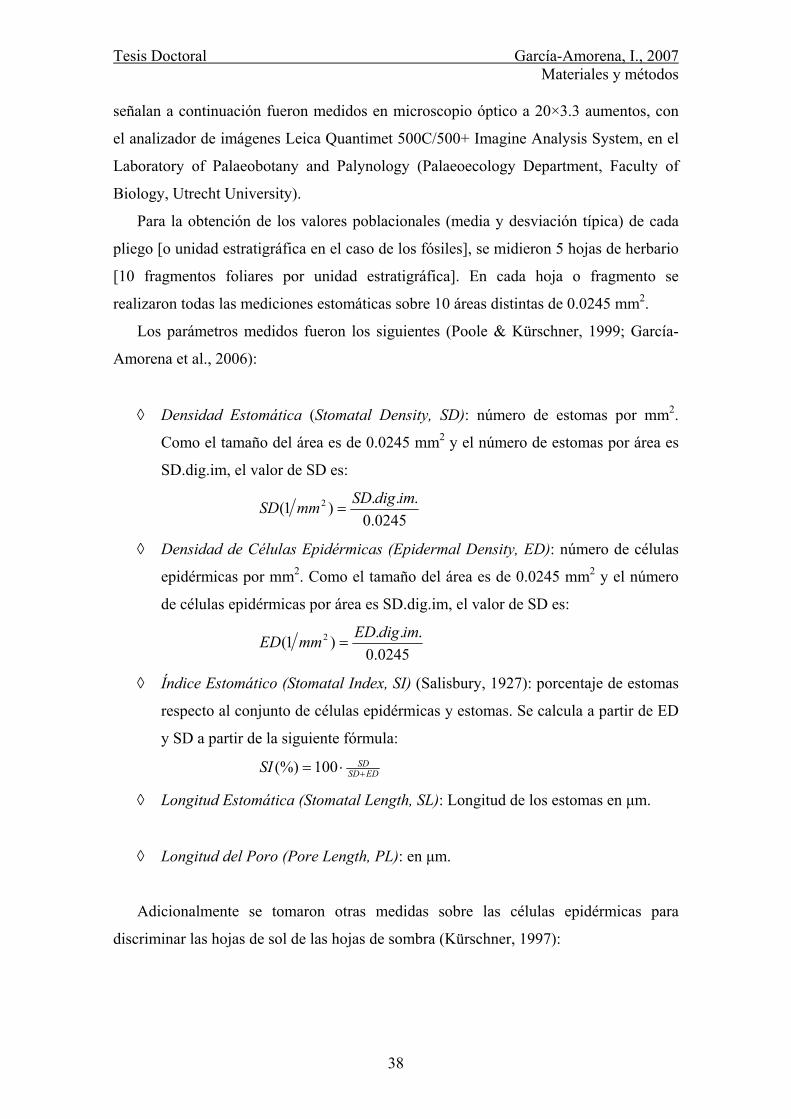
Tesis Doctoral García-Amorena, I., 2007 Materiales y métodos
38
señalan a continuación fueron medidos en microscopio óptico a 20×3.3 aumentos, con
el analizador de imágenes Leica Quantimet 500C/500+ Imagine Analysis System, en el
Laboratory of Palaeobotany and Palynology (Palaeoecology Department, Faculty of
Biology, Utrecht University).
Para la obtención de los valores poblacionales (media y desviación típica) de cada
pliego [o unidad estratigráfica en el caso de los fósiles], se midieron 5 hojas de herbario
[10 fragmentos foliares por unidad estratigráfica]. En cada hoja o fragmento se
realizaron todas las mediciones estomáticas sobre 10 áreas distintas de 0.0245 mm2.
Los parámetros medidos fueron los siguientes (Poole & Kürschner, 1999; García-
Amorena et al., 2006):
◊ Densidad Estomática (Stomatal Density, SD): número de estomas por mm2.
Como el tamaño del área es de 0.0245 mm2 y el número de estomas por área es
SD.dig.im, el valor de SD es:
0245.0...)1( 2 imdigSDmmSD =
◊ Densidad de Células Epidérmicas (Epidermal Density, ED): número de células
epidérmicas por mm2. Como el tamaño del área es de 0.0245 mm2 y el número
de células epidérmicas por área es SD.dig.im, el valor de SD es:
0245.0...)1( 2 imdigEDmmED =
◊ Índice Estomático (Stomatal Index, SI) (Salisbury, 1927): porcentaje de estomas
respecto al conjunto de células epidérmicas y estomas. Se calcula a partir de ED
y SD a partir de la siguiente fórmula:
EDSDSDSI +⋅= 100(%)
◊ Longitud Estomática (Stomatal Length, SL): Longitud de los estomas en µm.
◊ Longitud del Poro (Pore Length, PL): en µm.
Adicionalmente se tomaron otras medidas sobre las células epidérmicas para
discriminar las hojas de sol de las hojas de sombra (Kürschner, 1997):
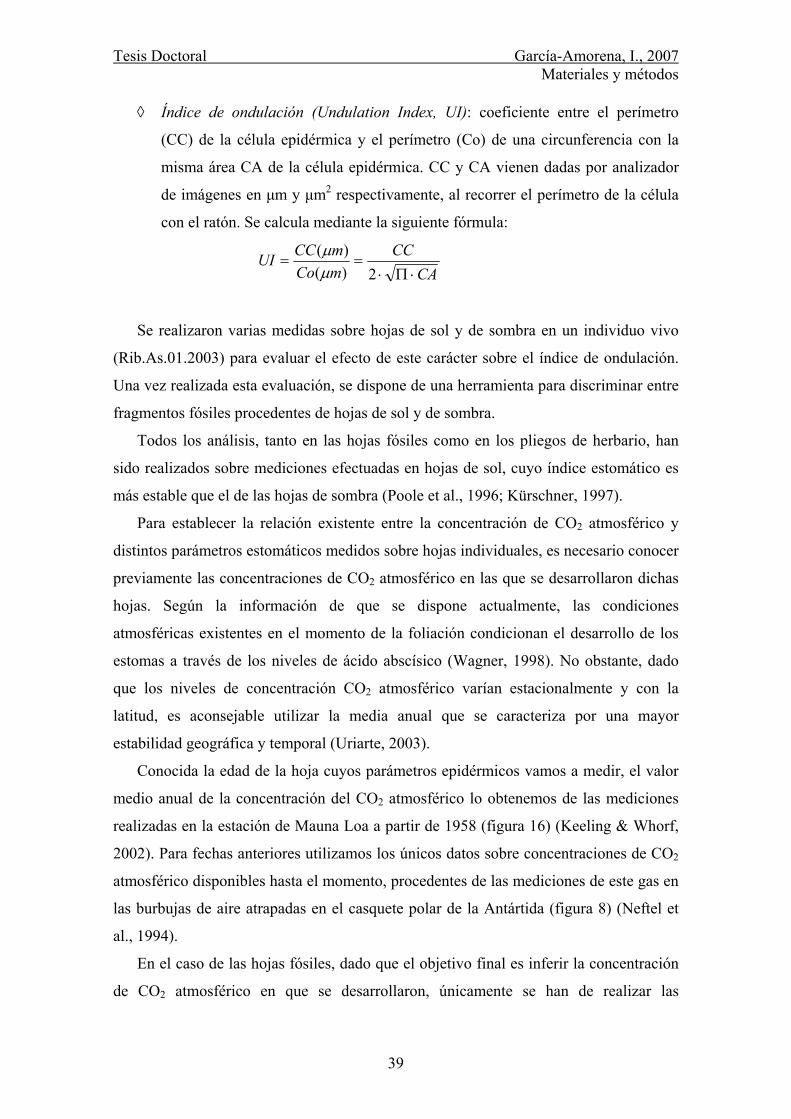
Tesis Doctoral García-Amorena, I., 2007 Materiales y métodos
39
◊ Índice de ondulación (Undulation Index, UI): coeficiente entre el perímetro
(CC) de la célula epidérmica y el perímetro (Co) de una circunferencia con la
misma área CA de la célula epidérmica. CC y CA vienen dadas por analizador
de imágenes en µm y µm2 respectivamente, al recorrer el perímetro de la célula
con el ratón. Se calcula mediante la siguiente fórmula:
CACC
mComCCUI
⋅Π⋅==
2)()(
µµ
Se realizaron varias medidas sobre hojas de sol y de sombra en un individuo vivo
(Rib.As.01.2003) para evaluar el efecto de este carácter sobre el índice de ondulación.
Una vez realizada esta evaluación, se dispone de una herramienta para discriminar entre
fragmentos fósiles procedentes de hojas de sol y de sombra.
Todos los análisis, tanto en las hojas fósiles como en los pliegos de herbario, han
sido realizados sobre mediciones efectuadas en hojas de sol, cuyo índice estomático es
más estable que el de las hojas de sombra (Poole et al., 1996; Kürschner, 1997).
Para establecer la relación existente entre la concentración de CO2 atmosférico y
distintos parámetros estomáticos medidos sobre hojas individuales, es necesario conocer
previamente las concentraciones de CO2 atmosférico en las que se desarrollaron dichas
hojas. Según la información de que se dispone actualmente, las condiciones
atmosféricas existentes en el momento de la foliación condicionan el desarrollo de los
estomas a través de los niveles de ácido abscísico (Wagner, 1998). No obstante, dado
que los niveles de concentración CO2 atmosférico varían estacionalmente y con la
latitud, es aconsejable utilizar la media anual que se caracteriza por una mayor
estabilidad geográfica y temporal (Uriarte, 2003).
Conocida la edad de la hoja cuyos parámetros epidérmicos vamos a medir, el valor
medio anual de la concentración del CO2 atmosférico lo obtenemos de las mediciones
realizadas en la estación de Mauna Loa a partir de 1958 (figura 16) (Keeling & Whorf,
2002). Para fechas anteriores utilizamos los únicos datos sobre concentraciones de CO2
atmosférico disponibles hasta el momento, procedentes de las mediciones de este gas en
las burbujas de aire atrapadas en el casquete polar de la Antártida (figura 8) (Neftel et
al., 1994).
En el caso de las hojas fósiles, dado que el objetivo final es inferir la concentración
de CO2 atmosférico en que se desarrollaron, únicamente se han de realizar las

Tesis Doctoral García-Amorena, I., 2007 Materiales y métodos
40
mediciones epidérmicas pertinentes y conocer la edad de las mismas, ya sea mediante
datación radiocarbónica o por su posición estratigráfica. Una vez estimada la
concentración de CO2 a partir de parámetros epidérmicos, conoceremos este parámetro
ambiental en un momento determinado del pasado geológico.
Figura 16. CO2 atmosférico medio anual medido en la estación de Mauna Loa a partir de 1958 (Keeling & Whorf, 2002).
Tesis Doctoral García-Amorena, I., 2007 Resultados
41
5. RESULTADOS
5.1. Dataciones
Las 30 mediciones radiocarbónicas sitúan los yacimientos analizados entre los
34000 años BP y la actualidad (tabla 4). Únicamente los yacimientos de San Pedro de
Maceda y Esmoriz pertenecen al Pleistoceno Superior, mientras que el resto de los
yacimientos se sitúan en el Holoceno. De éstos, el estrato superior de Villaviciosa, los
yacimientos de Finca Galea y Baldayo junto con los estratos 2 y 3 de Esposende y el
muestreado en 1998 en Cortegaça, datan del último milenio.
Excepto en los casos de las rías de Navia, Pravia y Villaviciosa, los macrorrestos
colectados se encontraban sobre yacimientos de escaso desarrollo, cuyos sedimentos
habían sido depositados en un periodo inferior a 2000 años. Sin embargo, en las rías
citadas los sedimentos abarcan gran parte del Holoceno. En estos yacimientos no todos
los estratos fueron datados, estimándose las edades del resto de los estratos en función
de su profundidad (p.e., muestras PR 6/18 y A-b, figura 11, tabla 4).
5.2. Identificaciones
Entre los 75 macrorrestos portugueses identificados (tabla 5), recolectados en
sedimentos turbosos y fondos de antiguas lagunas costeras (tijucas), se encuentran 34
tocones de Pinus (P. sylvestris y P. pinaster) y dos de Alnus sp. . La posición de estos
macrorrestos en sustratos no redepositados, informa sobre el origen local de los mismos.
Destacan las maderas pleistocenas de Pinus gr. sylvestris-nigra halladas en San Pedro
de Maceda y Esmoriz, dos de los cuales se encontraron en posición de vida junto con
una madera de Quercus gr. robur-petraea y otra de Fraxinus sp. Los 32 tocones en
posición de vida de Barreiro, con edades entre los 7500 y los 8000 años cal BP,
correspondientes todos a Pinus pinaster y constituyen el mejor yacimiento Holoceno
intermareal de estas características conocido hasta la fecha en la Península Ibérica. Los
restos portugueses de edad holocena (Esposende, Apulia, Silvalde, Cortegaça, Ovar y
Paramós) pertenecen en su mayoría a taxones planocaducifolios.
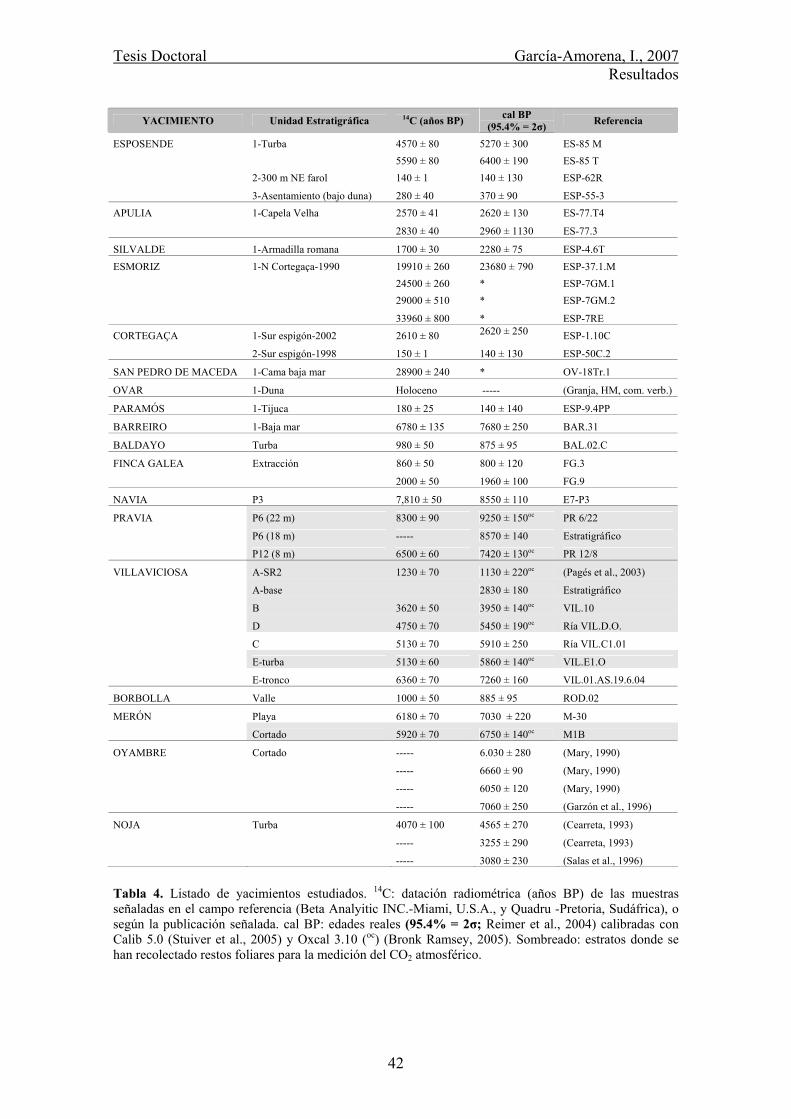
Tesis Doctoral García-Amorena, I., 2007 Resultados
42
Tabla 4. Listado de yacimientos estudiados. 14C: datación radiométrica (años BP) de las muestras señaladas en el campo referencia (Beta Analyitic INC.-Miami, U.S.A., y Quadru -Pretoria, Sudáfrica), o según la publicación señalada. cal BP: edades reales (95.4% = 2σ; Reimer et al., 2004) calibradas con Calib 5.0 (Stuiver et al., 2005) y Oxcal 3.10 (oc) (Bronk Ramsey, 2005). Sombreado: estratos donde se han recolectado restos foliares para la medición del CO2 atmosférico.
YACIMIENTO Unidad Estratigráfica 14C (años BP) cal BP (95.4% = 2σ) Referencia
ESPOSENDE 1-Turba 4570 ± 80 5270 ± 300 ES-85 M 5590 ± 80 6400 ± 190 ES-85 T 2-300 m NE farol 140 ± 1 140 ± 130 ESP-62R
3-Asentamiento (bajo duna) 280 ± 40 370 ± 90 ESP-55-3 APULIA 1-Capela Velha 2570 ± 41 2620 ± 130 ES-77.T4
2830 ± 40 2960 ± 1130 ES-77.3
SILVALDE 1-Armadilla romana 1700 ± 30 2280 ± 75 ESP-4.6T ESMORIZ 1-N Cortegaça-1990 19910 ± 260 23680 ± 790 ESP-37.1.M 24500 ± 260 * ESP-7GM.1 29000 ± 510 * ESP-7GM.2
33960 ± 800 * ESP-7RE CORTEGAÇA 1-Sur espigón-2002 2610 ± 80 2620 ± 250 ESP-1.10C
2-Sur espigón-1998 150 ± 1 140 ± 130 ESP-50C.2
SAN PEDRO DE MACEDA 1-Cama baja mar 28900 ± 240 * OV-18Tr.1
OVAR 1-Duna Holoceno ----- (Granja, HM, com. verb.)
PARAMÓS 1-Tijuca 180 ± 25 140 ± 140 ESP-9.4PP
BARREIRO 1-Baja mar 6780 ± 135 7680 ± 250 BAR.31
BALDAYO Turba 980 ± 50 875 ± 95 BAL.02.C
FINCA GALEA Extracción 860 ± 50 800 ± 120 FG.3
2000 ± 50 1960 ± 100 FG.9
NAVIA P3 7,810 ± 50 8550 ± 110 E7-P3
PRAVIA P6 (22 m) 8300 ± 90 9250 ± 150oc PR 6/22
P6 (18 m) ----- 8570 ± 140 Estratigráfico
P12 (8 m) 6500 ± 60 7420 ± 130oc PR 12/8
VILLAVICIOSA A-SR2 1230 ± 70 1130 ± 220oc (Pagés et al., 2003)
A-base 2830 ± 180 Estratigráfico
B 3620 ± 50 3950 ± 140oc VIL.10
D 4750 ± 70 5450 ± 190oc Ría VIL.D.O.
C 5130 ± 70 5910 ± 250 Ría VIL.C1.01
E-turba 5130 ± 60 5860 ± 140oc VIL.E1.O
E-tronco 6360 ± 70 7260 ± 160 VIL.01.AS.19.6.04
BORBOLLA Valle 1000 ± 50 885 ± 95 ROD.02
MERÓN Playa 6180 ± 70 7030 ± 220 M-30
Cortado 5920 ± 70 6750 ± 140oc M1B
OYAMBRE Cortado ----- 6.030 ± 280 (Mary, 1990)
----- 6660 ± 90 (Mary, 1990)
----- 6050 ± 120 (Mary, 1990)
----- 7060 ± 250 (Garzón et al., 1996)
NOJA Turba 4070 ± 100 4565 ± 270 (Cearreta, 1993)
----- 3255 ± 290 (Cearreta, 1993)
----- 3080 ± 230 (Salas et al., 1996)

Tesis Doctoral García-Amorena, I., 2007 Resultados
43
YACIMIENTO ID IDENTIFICACIÓN ES-85 M Alnus glutinosa ES-85 T Alnus glutinosa [* +] ES-85 P Turba ES-62R Pinus pinea
ESPOSENDE
ESP-55-3 Pinus pinaster cf. Pinea [C] ES-77.T1 Fraxinus ES-77.T2.A Alnus sp. [C] ES-77.T2.B Quercus caducifolio ES-77.T3 Juniperus ES-77.T4.1 Fraxinus sp. ES-77.T4.2 Quercus gr. robur-petraea
APULIA
ES-77.3 No identificada ESPINHO ESP-40.3T Sedimento
ESP-4.6M Castanea sp. ESP-4.6T Castanea sp. SILVALDE ESP-4.7R Erica gr. cinerea-vagans ESP-9.4PP Alnus sp. [C] PARAMÓS ESP-9.4PP1 Sambucus sp. ESP-7GM.1 Pinus gr. sylvestris-nigra ESP-7HM.1 Castanea sativa [+] ESP-7HM.2 Pinus gr. sylvestris-nigra [+] ESP-7GM.2 Pinus gr. sylvestris-nigra ESP-7RE No identificada ESP-7R Pinus gr. sylvestris-nigra ESP-37.1.M Pinus gr. sylvestris-nigra ESP-7AV.2 Pinus gr. sylvestris-nigra [+] ESP-7JM.2 Pinus gr. sylvestris-nigra ESP-7.J.M.1 Pinus gr. sylvestris-nigra [+] ESP-7AC Pinus gr. sylvestris-nigra ESP-7AV.1 Pinus gr. sylvestris-nigra ESP-7AV.3 Pinus gr. sylvestris-nigra ESP-7FM Pinus gr. sylvestris-nigra ESP-7 Pinus gr. sylvestris-nigra ESP-7A-2M2 Pinus gr. sylvestris-nigra ESP-7A-2M1 Pinus gr. sylvestris-nigra [*] ESP-7AV.4 Pinus gr. sylvestris-nigra ESP-7D Pinus gr. sylvestris-nigra ESP-7A.5.1 Pinus gr. sylvestris-nigra
ESMORIZ
ESP-7T1 Fraxinus sp. [C] ESP-1.10C No identificada [C] ESP-1.31 Erica gr. cinerea-vagans [C] OV-18Tr.3 Pinus gr. sylvestris-nigra ESP-50C.1 Acacia tp. longifolia
CORTEGAÇA
ESP-50C.2 Pinus gr. pinaster-pinea SAN PEDRO DE MACEDA ESP-17M Maloideae
OV-18Tr.1 Pinus gr. sylvestris-nigra OV-18Tr.2 Pinus gr. sylvestris-nigra OV-18Tr.3 Pinus gr. sylvestris-nigra OV-18 Quercus gr. robur-petraea [C]
SAN PEDRO DE MACEDA
SPM.06.12.02 Pinus gr. sylvestris-nigra [*] OVAR OV-PT-06.2003 Populus sp. -------- S-42.3 (LNETI) Alnus sp. BARREIRO BAR.01-BAR.32 Pinus pinaster (×32) [+ *]
Tabla 5. Identificación de los macrorrestos leñosos de los yacimientos de Portugal. *: resto en posición de vida. +: diámetro superior a 10 cm. C: resto carbonizado. ID: nombre de la muestra. En los yacimientos cantábricos se han identificado 50 frutos, 153 maderas y más de
350 restos foliares (tabla 6). En el yacimiento de Villaviciosa, de edades comprendidas
entre 7260 ± 160 y 1130 ± 220 años cal BP, se estudiaron 60 restos leñosos colectados
en el perfil expuesto en las obras de la autovía del Cantábrico. La presencia de
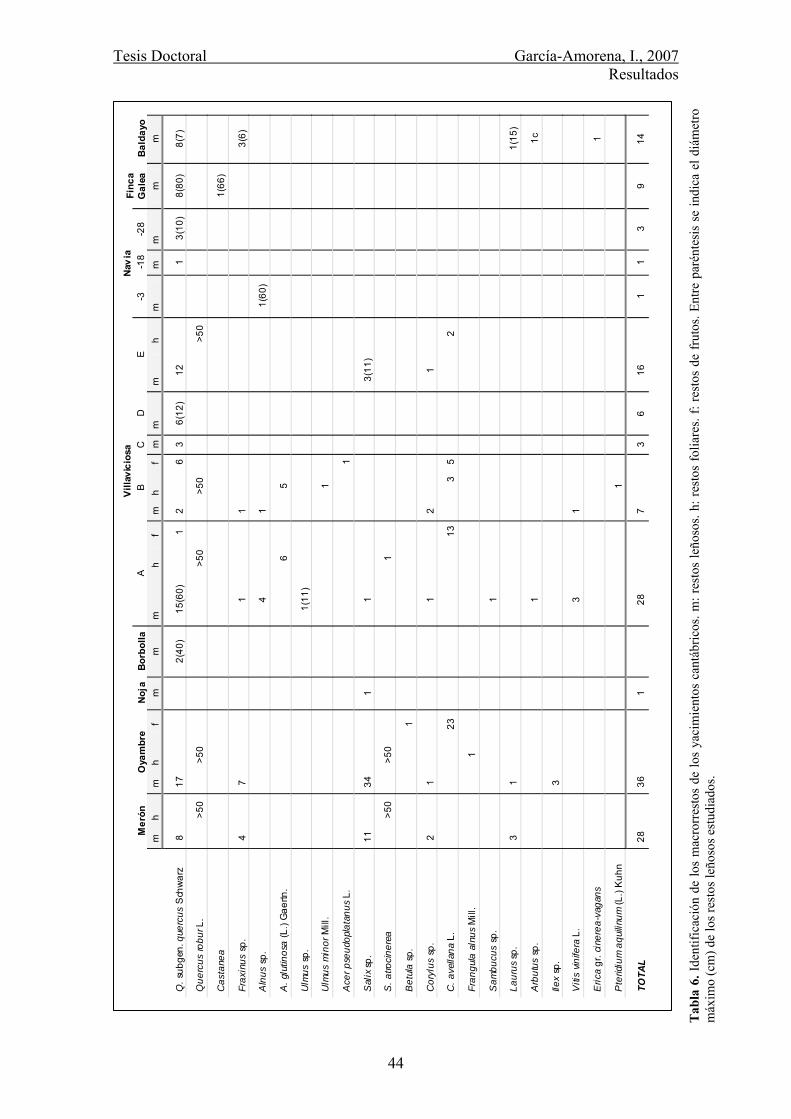
Tesis Doctoral García-Amorena, I., 2007 Resultados
44
Tab
la 6
. Ide
ntifi
caci
ón d
e lo
s m
acro
rres
tos
de lo
s ya
cim
ient
os c
antá
bric
os. m
: res
tos
leño
sos.
h: re
stos
folia
res.
f: re
stos
de
frut
os. E
ntre
par
énte
sis
se in
dica
el d
iám
etro
m
áxim
o (c
m) d
e lo
s res
tos l
eños
os e
stud
iado
s.
Vill
avic
iosa
N
avia
Mer
ón
Oya
mbr
e No
ja
Borb
olla
A
B
C
D
E
-3
-18
-28
Finc
a G
alea
B
alda
yo
m
h
m
h f
m
m
m
h f
m
h f
m
m
m
h m
m
m
m
m
Q. s
ubge
n. q
uerc
us S
chw
arz
8
17
2(
40)
15(6
0)
1
2
63
6(12
) 12
1
3(10
) 8(
80)
8(7)
Que
rcus
robu
r L.
>5
0
>50
>50
>50
>50
Cas
tane
a
1(
66)
Frax
inus
sp.
4
7
1
1
3(6)
Aln
us s
p.
4
1
1(
60)
A. g
lutin
osa
(L.)
Gae
rtn.
6
5
Ulm
us s
p.
1(
11)
Ulm
us m
inor
Mill
.
1
Ace
r pse
udop
lata
nus
L.
1
Sal
ix s
p.
11
34
1
1
3(
11)
S. a
troci
nere
a
>50
>5
0
1
Bet
ula
sp.
1
Cor
ylus
sp.
2
1
1
2
1
C. a
vella
na L
.
23
13
3 5
2
Fran
gula
aln
us M
ill.
1
Sam
bucu
s sp
.
1
Laur
us s
p.
3
1
1(
15)
Arb
utus
sp.
1
1c
Ilex
sp.
3
Viti
s vin
ifera
L.
3
1
Eric
a gr
. cin
erea
-vag
ans
1
Pte
ridiu
m a
quili
num
(L.)
Kuh
n
1
TOTA
L 28
36
1
28
7
3
6 16
1 1
3 9
14
Tesis Doctoral García-Amorena, I., 2007 Resultados
45
Quercus robur, seguido de Salix atrocinerea, Corylus avellana y Alnus glutinosa,
constituye la tónica en la mayoría de los estratos de este yacimiento. Tres maderas de
Vitis sp. de edad entre 3950 ± 140 y 1130 ± 220 años cal BP, junto con restos de
Fraxinus sp., Ulmus minor, Acer pseudoplatanus, Sambucus sp., Arbutus sp. y
fragmentos de frondes de Pteridium aquilinum, enriquecen el cortejo florístico de los
bosques holocenos de Villaviciosa. En el resto de yacimientos que reflejan la vegetación
establecida en la costa Cantábrica en el primer tercio del Holoceno (Pravia, Navia,
Oyambre y Merón), Q. robur y Salix atrocinerea comparten protagonismo. En estos
yacimientos se encuentra una pequeña pero significativa proporción de macrorrestos de
Laurus sp., Fraxinus sp., Frangula alnus y Betula sp. . En Oyambre se han hallado
numerosos frutos de Corylus avellana. En los yacimientos correspondientes al último
tercio del Holoceno (Noja, Finca Galea, Borbolla y Baldayo) son abundantes los
macrorrestos de Quercus sp., que se encuentran acompañados de Salix sp., Castanea
sp., Fraxinus sp., Laurus sp., Arbutus unedo y Erica gr. lusitanica-cinerea.
En los restos foliares de los yacimientos de Oyambre, Merón, Villaviciosa y Pravia,
se observa una gran abundancia de Q. robur, A. glutinosa y S. atrocinerea, con
presencia de Corylus avellana, Cornus sanguinea y Pteridium aquilinum (tabla 6). En el
análisis cuticular de los restos foliares de Q. robur se detecta una pequeña pero
significativa presencia de tricomas característicos de Q. petraea.
Los análisis polínicos realizados sobre los mismos sedimentos donde se ha realizado
el estudio de macrorrestos foliares de Villaviciosa (estratos A-techo, B y E) (tabla 4 y
figura 11), muestran un dominio de Quercus sp. y Corylus sp., con porcentajes
absolutos superiores al 20% en ambos casos, y un máximo de Quercus sp. superior al
50% en el estrato más joven (figura 17). En el mismo diagrama se observa un porcentaje
absoluto de Pinus sp. de ~15% en los tres estratos. Se observa la presencia de Alnus sp.,
Betula sp. y Fraxinus sp., y esporádicamente la de Ulmus sp., Sorbus sp., Abies sp. y
Picea sp.
5.3. Análisis epidérmicos
5.3.1. Material histórico
En primer lugar, respecto al análisis realizado sobre las hojas de sol y de sombra con
objeto de diferenciar los dos morfotipos en función de la ondulación de las paredes

Tesis Doctoral García-Amorena, I., 2007 Resultados
46
anticlinales de las células epidérmicas, se obtuvo como resultado que las hojas de
sombra se diferenciaban por poseer un índice de ondulación (UI) mayor a 1.5. Con este
dato se pudieron desechar las hojas de sombra y realizar el resto de las mediciones
epidérmicas (apartado 4.4) sobre hojas de sol. De esta manera se reduce variabilidad
que produce obtener parámetros estomáticos sobre morfotipos diferentes (Kürschner,
1997).
En la tabla 7 se recogen las medias de las mediciones epidérmicas realizadas sobre
todas las muestras de sol de Q. robur y Q. petraea recolectadas en los herbarios EMMA
(ETSIM-UPM), MA (Jardín Botánico de Madrid) y U (Universidad de Utrecht). La
figura 18 muestra la relación entre el índice estomático [SI (%)] de cada pliego con el
CO2 atmosférico del año en el que fueron recolectados (Keeling & Whorf, 2002; Neftel
et al., 1994). En dicha figura se observa cómo los valores de CO2 comprendidos entre
295 y 230 ppmv son los que evidencian una respuesta más marcada en la variación del
índice estomático. Por tanto, dicho rango es el que modelizamos mediante una regresión
lineal por mínimos cuadrados.
Para reducir la variabilidad residual del índice estomático producida por las
diferentes condiciones ambientales en las que se desarrollaron los distintos individuos
(irradiación, presión atmosférica, etc), los datos se agruparon y analizaron en función de
la altitud de las masas de donde provenían los pliegos (‘altitud +’ en tabla 3). Para este
fin se aplicaron tres filtros altitudinales; 0-2000 m sobre el nivel del mar (m s.n.m.), 0-
1500 m s.n.m. y 0-1000 m s.n.m. . En la tabla 8 y figura 19 se recogen los distintos
coeficientes de las regresiones lineales calculadas por el método de mínimos cuadrados
a partir de los datos resultantes de la aplicación de los tres grupos altitudinales. Aunque
los residuos de todas las regresiones realizadas cumplieron las hipótesis de normalidad,
independencia y homocedasticidad (Draper & Smith, 1981; Saporta, 1990), las
mediciones sobre pliegos procedentes de masas por debajo de 1000 m de altitud
mostraron el coeficiente de correlación más elevado entre el SI y el incremento del CO2
atmosférico (R2=57,10%) (tabla 8).
Por otro lado, al tener en cuenta la variabilidad del SI intrapoblacional aplicando
regresiones lineales por mínimos cuadrados ponderadas con los valores 1/σ (σ =
desviación típica de la media de cada pliego), se observa que se obtienen mayores
coeficientes de correlación. En la tabla 7 se recogen únicamente los coeficientes de la
Tesis Doctoral García-Amorena, I., 2007 Resultados
47
regresión lineal ponderada por el método de mínimos cuadrados a partir de los datos
resultantes de la aplicación del filtro 0-1000 m s.n.m., cuyo R2=76.96%).
De todas las demás mediciones realizadas, la longitud del poro [PL (µm)] y el
parámetro derivado coeficiente de esbeltez estomática [SC (%) = 100×PL/SL], son las
que muestrearon una respuesta más definida al aumento del CO2 experimentado en el
siglo pasado (figura 20). El coeficiente de esbeltez estomática se propone por primera
vez como índice para estimar el CO2 atmosférico a partir de las mediciones de longitud
de los estomas de Quercus (capítulo III).
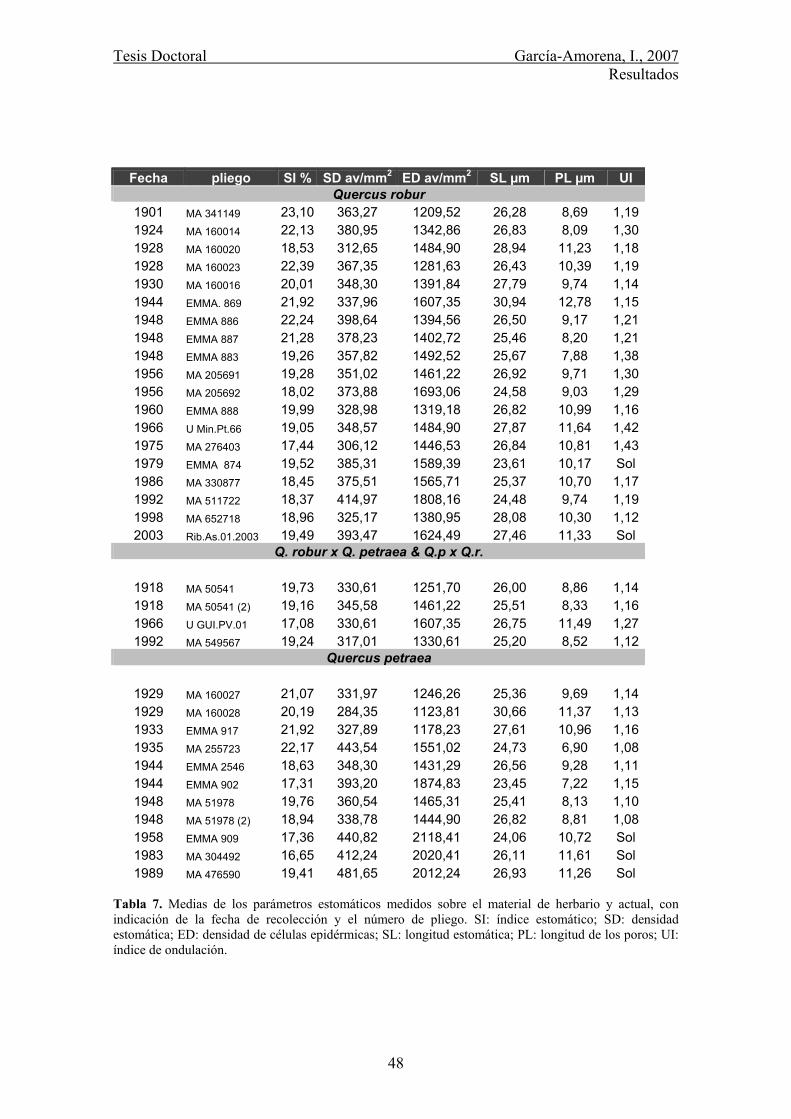
Tesis Doctoral García-Amorena, I., 2007 Resultados
48
Tabla 7. Medias de los parámetros estomáticos medidos sobre el material de herbario y actual, con indicación de la fecha de recolección y el número de pliego. SI: índice estomático; SD: densidad estomática; ED: densidad de células epidérmicas; SL: longitud estomática; PL: longitud de los poros; UI: índice de ondulación.
Fecha pliego SI % SD av/mm2 ED av/mm2 SL µm PL µm UI Quercus robur
1901 MA 341149 23,10 363,27 1209,52 26,28 8,69 1,19 1924 MA 160014 22,13 380,95 1342,86 26,83 8,09 1,30 1928 MA 160020 18,53 312,65 1484,90 28,94 11,23 1,18 1928 MA 160023 22,39 367,35 1281,63 26,43 10,39 1,19 1930 MA 160016 20,01 348,30 1391,84 27,79 9,74 1,14 1944 EMMA. 869 21,92 337,96 1607,35 30,94 12,78 1,15 1948 EMMA 886 22,24 398,64 1394,56 26,50 9,17 1,21 1948 EMMA 887 21,28 378,23 1402,72 25,46 8,20 1,21 1948 EMMA 883 19,26 357,82 1492,52 25,67 7,88 1,38 1956 MA 205691 19,28 351,02 1461,22 26,92 9,71 1,30 1956 MA 205692 18,02 373,88 1693,06 24,58 9,03 1,29 1960 EMMA 888 19,99 328,98 1319,18 26,82 10,99 1,16 1966 U Min.Pt.66 19,05 348,57 1484,90 27,87 11,64 1,42 1975 MA 276403 17,44 306,12 1446,53 26,84 10,81 1,43 1979 EMMA 874 19,52 385,31 1589,39 23,61 10,17 Sol 1986 MA 330877 18,45 375,51 1565,71 25,37 10,70 1,17 1992 MA 511722 18,37 414,97 1808,16 24,48 9,74 1,19 1998 MA 652718 18,96 325,17 1380,95 28,08 10,30 1,12 2003 Rib.As.01.2003 19,49 393,47 1624,49 27,46 11,33 Sol
Q. robur x Q. petraea & Q.p x Q.r.
1918 MA 50541 19,73 330,61 1251,70 26,00 8,86 1,14 1918 MA 50541 (2) 19,16 345,58 1461,22 25,51 8,33 1,16 1966 U GUI.PV.01 17,08 330,61 1607,35 26,75 11,49 1,27 1992 MA 549567 19,24 317,01 1330,61 25,20 8,52 1,12
Quercus petraea
1929 MA 160027 21,07 331,97 1246,26 25,36 9,69 1,14 1929 MA 160028 20,19 284,35 1123,81 30,66 11,37 1,13 1933 EMMA 917 21,92 327,89 1178,23 27,61 10,96 1,16 1935 MA 255723 22,17 443,54 1551,02 24,73 6,90 1,08 1944 EMMA 2546 18,63 348,30 1431,29 26,56 9,28 1,11 1944 EMMA 902 17,31 393,20 1874,83 23,45 7,22 1,15 1948 MA 51978 19,76 360,54 1465,31 25,41 8,13 1,10 1948 MA 51978 (2) 18,94 338,78 1444,90 26,82 8,81 1,08 1958 EMMA 909 17,36 440,82 2118,41 24,06 10,72 Sol 1983 MA 304492 16,65 412,24 2020,41 26,11 11,61 Sol 1989 MA 476590 19,41 481,65 2012,24 26,93 11,26 Sol

Tesis Doctoral García-Amorena, I., 2007 Resultados
49
Figu
ra 1
7. A
nális
is p
olín
ico
de lo
s est
rato
s A, B
y E
de
Vill
avic
iosa
(Fra
ns P
.M. B
unni
k, T
NO
-NIT
G, s
ectio
n Pa
leo-
envi
ronm
enta
l Res
earc
h, U
trech
t, H
olan
da).
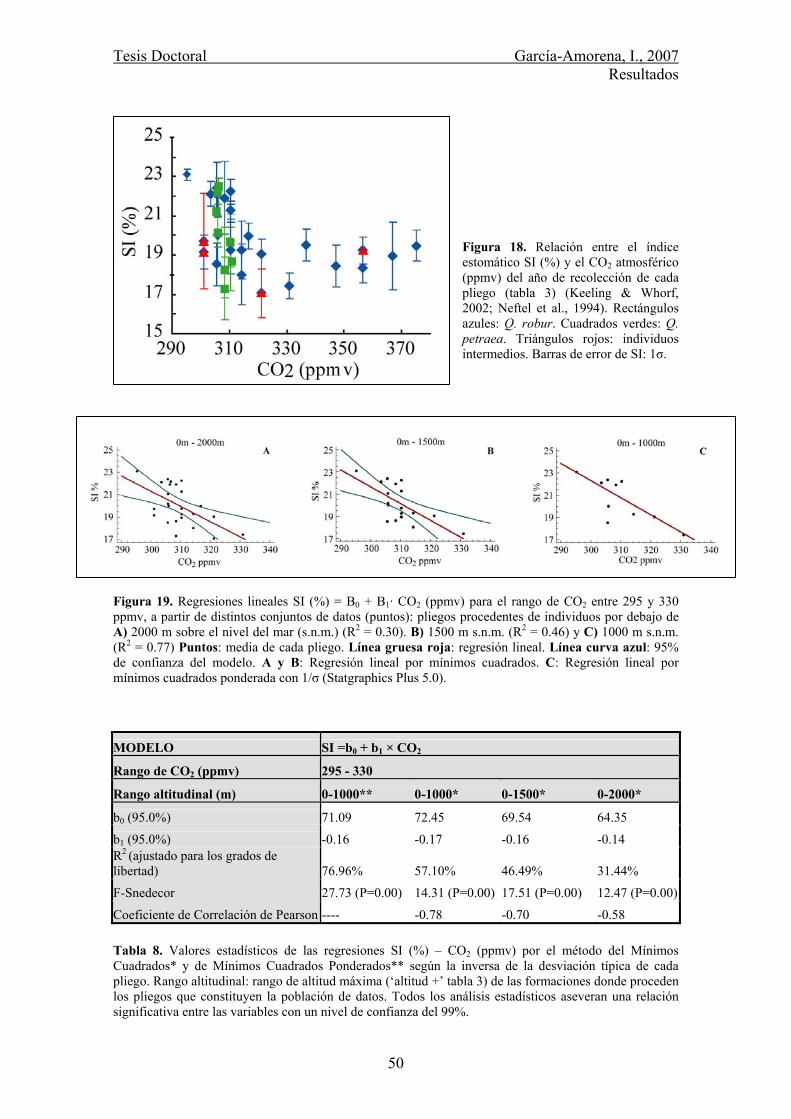
Tesis Doctoral García-Amorena, I., 2007 Resultados
50
Figura 18. Relación entre el índice estomático SI (%) y el CO2 atmosférico (ppmv) del año de recolección de cada pliego (tabla 3) (Keeling & Whorf, 2002; Neftel et al., 1994). Rectángulos azules: Q. robur. Cuadrados verdes: Q. petraea. Triángulos rojos: individuos intermedios. Barras de error de SI: 1σ.
Figura 19. Regresiones lineales SI (%) = B0 + B1· CO2 (ppmv) para el rango de CO2 entre 295 y 330 ppmv, a partir de distintos conjuntos de datos (puntos): pliegos procedentes de individuos por debajo de A) 2000 m sobre el nivel del mar (s.n.m.) (R2 = 0.30). B) 1500 m s.n.m. (R2 = 0.46) y C) 1000 m s.n.m. (R2 = 0.77) Puntos: media de cada pliego. Línea gruesa roja: regresión lineal. Línea curva azul: 95% de confianza del modelo. A y B: Regresión lineal por mínimos cuadrados. C: Regresión lineal por mínimos cuadrados ponderada con 1/σ (Statgraphics Plus 5.0).
MODELO SI =b0 + b1 × CO2
Rango de CO2 (ppmv) 295 - 330
Rango altitudinal (m) 0-1000** 0-1000* 0-1500* 0-2000*
b0 (95.0%) 71.09 72.45 69.54 64.35
b1 (95.0%) -0.16 -0.17 -0.16 -0.14 R2 (ajustado para los grados de libertad) 76.96% 57.10% 46.49% 31.44%
F-Snedecor 27.73 (P=0.00) 14.31 (P=0.00) 17.51 (P=0.00) 12.47 (P=0.00)
Coeficiente de Correlación de Pearson ---- -0.78 -0.70 -0.58 Tabla 8. Valores estadísticos de las regresiones SI (%) – CO2 (ppmv) por el método del Mínimos Cuadrados* y de Mínimos Cuadrados Ponderados** según la inversa de la desviación típica de cada pliego. Rango altitudinal: rango de altitud máxima (‘altitud +’ tabla 3) de las formaciones donde proceden los pliegos que constituyen la población de datos. Todos los análisis estadísticos aseveran una relación significativa entre las variables con un nivel de confianza del 99%.
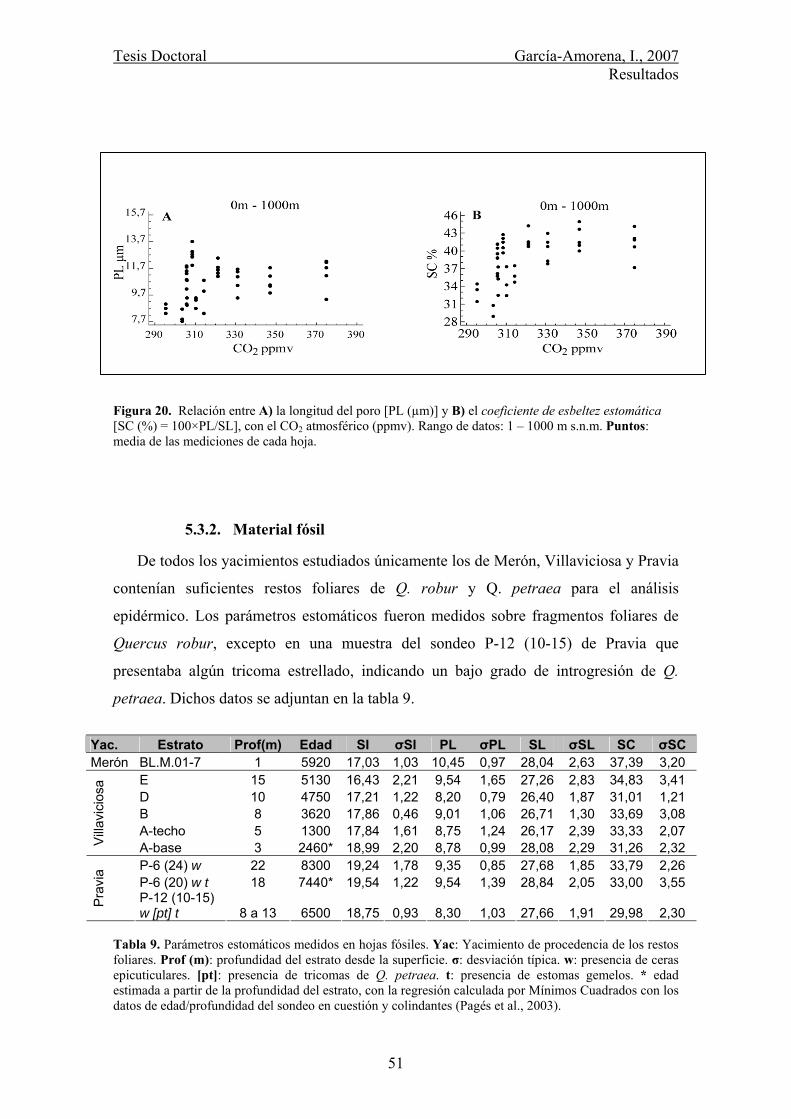
Tesis Doctoral García-Amorena, I., 2007 Resultados
51
Figura 20. Relación entre A) la longitud del poro [PL (µm)] y B) el coeficiente de esbeltez estomática [SC (%) = 100×PL/SL], con el CO2 atmosférico (ppmv). Rango de datos: 1 – 1000 m s.n.m. Puntos: media de las mediciones de cada hoja.
5.3.2. Material fósil
De todos los yacimientos estudiados únicamente los de Merón, Villaviciosa y Pravia
contenían suficientes restos foliares de Q. robur y Q. petraea para el análisis
epidérmico. Los parámetros estomáticos fueron medidos sobre fragmentos foliares de
Quercus robur, excepto en una muestra del sondeo P-12 (10-15) de Pravia que
presentaba algún tricoma estrellado, indicando un bajo grado de introgresión de Q.
petraea. Dichos datos se adjuntan en la tabla 9.
Yac. Estrato Prof(m) Edad SI σSI PL σPL SL σSL SC σSC Merón BL.M.01-7 1 5920 17,03 1,03 10,45 0,97 28,04 2,63 37,39 3,20
E 15 5130 16,43 2,21 9,54 1,65 27,26 2,83 34,83 3,41 D 10 4750 17,21 1,22 8,20 0,79 26,40 1,87 31,01 1,21 B 8 3620 17,86 0,46 9,01 1,06 26,71 1,30 33,69 3,08 A-techo 5 1300 17,84 1,61 8,75 1,24 26,17 2,39 33,33 2,07
Vill
avic
iosa
A-base 3 2460* 18,99 2,20 8,78 0,99 28,08 2,29 31,26 2,32 P-6 (24) w 22 8300 19,24 1,78 9,35 0,85 27,68 1,85 33,79 2,26 P-6 (20) w t 18 7440* 19,54 1,22 9,54 1,39 28,84 2,05 33,00 3,55
Pra
via
P-12 (10-15) w [pt] t 8 a 13 6500 18,75 0,93 8,30 1,03 27,66 1,91 29,98 2,30
Tabla 9. Parámetros estomáticos medidos en hojas fósiles. Yac: Yacimiento de procedencia de los restos foliares. Prof (m): profundidad del estrato desde la superficie. σ: desviación típica. w: presencia de ceras epicuticulares. [pt]: presencia de tricomas de Q. petraea. t: presencia de estomas gemelos. * edad estimada a partir de la profundidad del estrato, con la regresión calculada por Mínimos Cuadrados con los datos de edad/profundidad del sondeo en cuestión y colindantes (Pagés et al., 2003).
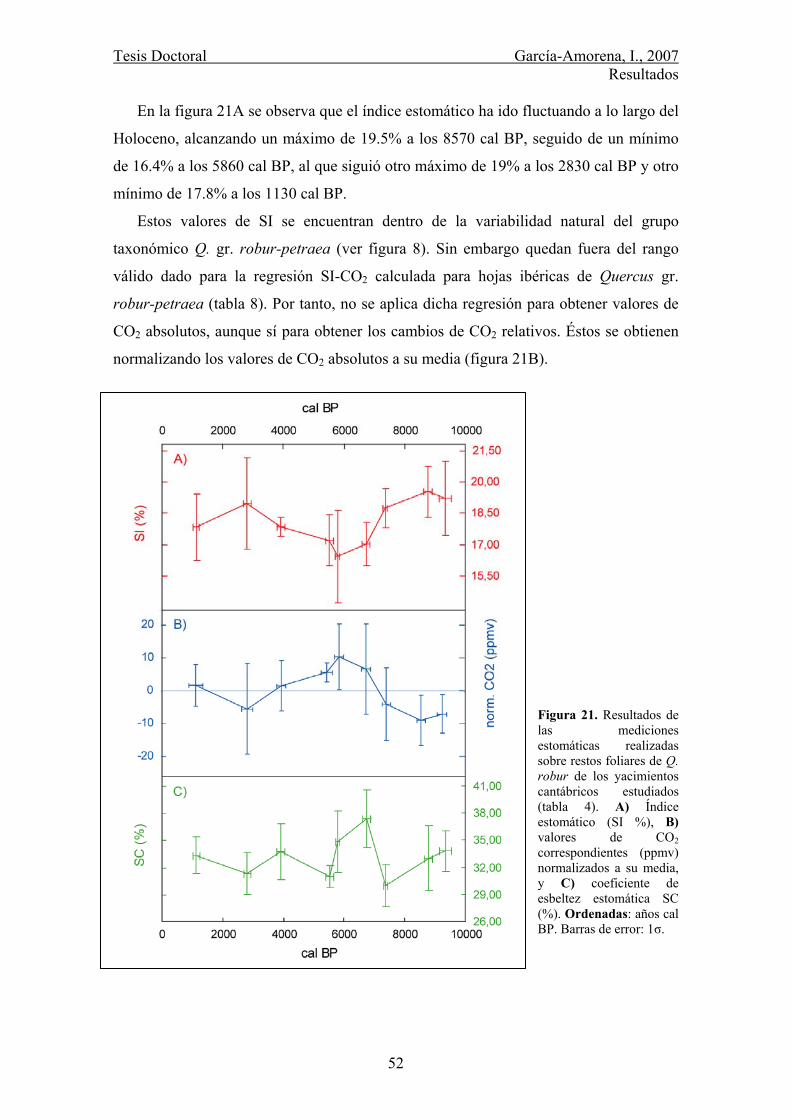
Tesis Doctoral García-Amorena, I., 2007 Resultados
52
En la figura 21A se observa que el índice estomático ha ido fluctuando a lo largo del
Holoceno, alcanzando un máximo de 19.5% a los 8570 cal BP, seguido de un mínimo
de 16.4% a los 5860 cal BP, al que siguió otro máximo de 19% a los 2830 cal BP y otro
mínimo de 17.8% a los 1130 cal BP.
Estos valores de SI se encuentran dentro de la variabilidad natural del grupo
taxonómico Q. gr. robur-petraea (ver figura 8). Sin embargo quedan fuera del rango
válido dado para la regresión SI-CO2 calculada para hojas ibéricas de Quercus gr.
robur-petraea (tabla 8). Por tanto, no se aplica dicha regresión para obtener valores de
CO2 absolutos, aunque sí para obtener los cambios de CO2 relativos. Éstos se obtienen
normalizando los valores de CO2 absolutos a su media (figura 21B).
Figura 21. Resultados de las mediciones estomáticas realizadas sobre restos foliares de Q. robur de los yacimientos cantábricos estudiados (tabla 4). A) Índice estomático (SI %), B) valores de CO2 correspondientes (ppmv) normalizados a su media, y C) coeficiente de esbeltez estomática SC (%). Ordenadas: años cal BP. Barras de error: 1σ.

Tesis Doctoral García-Amorena, I., 2007 Resultados
53
Los resultados de la normalización del CO2 atmosférico muestran que a lo largo del
Holoceno se han sucedido una serie de variaciones en la concentración del dióxido de
carbono, de aproximadamente 20 ppmv de amplitud y unos 6000 años de frecuencia.
Dicha curva es simétrica a la de SI (figura 21A), con dos mínimos, a los 8570 y 2830
cal BP, y un máximo a los 5860 cal BP. A los 1130 cal BP se observa cómo el CO2
atmosférico regresa a los valores próximos a la media holocena.
Entre el resto de mediciones efectuadas sobre el material fósil de Q. robur, el
coeficiente de esbeltez estomática (SC %), es el que muestra una respuesta más parecida
a la variación relativa del CO2 atmosférico a lo largo del Holoceno (figura 21C). Entre
las similaritudes encontradas son de destacar:
1) Un rápido aumento de SC entre los 7420 y los 6750 cal BP, donde SC asciende
de 30% al 37.39%.
2) Un mínimo a los 2810 cal BP en el que los valores de SC disminuyen hasta el
31.26%.
3) Una estabilización de los valores de SC a los 1130 cal BP, en los que SC toma
valores próximos a su media holocena (33.33%).
Tesis Doctoral García-Amorena, I., 2007 Discusión
54
6. DISCUSIÓN
6.1. La composición florística de los bosques en la costa Atlántica ibérica
durante los últimos 34000 años
La gran variedad de taxones identificados en la costa Atlántica de la Península
Ibérica, con edades comprendidas entre los 34000 años y la actualidad, manifiesta la
gran riqueza florística y paisajística que ha caracterizado a esta área a lo largo de su
historia (Sánchez Goñi, 1994; Figueiral, 1995; Zilhaõ et al., 1995; Zapata & Meaza,
1998; García Antón et al., 2006). Sin embargo, todavía existe un debate sobre el papel
en la conservación de la flora de la costa Atlántica durante el Cuaternario, y en especial
sobre el origen autóctono o alóctono de algunas especies en esta área. El estudio de
macrorrestos realizado en el presente trabajo aporta nueva información sobre la
presencia de ciertos taxones en la costa Atlántica peninsular durante la última parte del
Cuaternario.
6.1.1. Pinus gr. sylvestris-nigra
Los 21 troncos fósiles de Pinus gr. sylvestris-nigra encontrados en los yacimientos
de Esmoriz y San Pedro de Maceda (figura 10), dos de ellos en posición de vida (tablas
4 y 5), reflejan el establecimiento de una población de estos pinares en las costas de
Portugal, a 41º de latitud N, entre los ~20000 y los ~34000 años BP. Numerosos restos
antracológicos de este mismo grupo taxonómico hallados en abrigos humanos, apoyan
la presencia de este taxón cerca de las costas del centro y norte de Portugal, desde el
máximo glaciar würmiense hasta el comienzo del Holoceno (Figueiral & Terral, 2002;
Figueiral & Carcaillet, 2005).
Los taxones que integran el cortejo florístico en el que aparece este grupo
taxonómico en los yacimientos de San Pedro de Maceda y Esmoriz (Fraxinus sp., y Q.
gr. robur-petraea, tabla 5), no conviven actualmente con las formaciones de P. uncinata
(Costa et al., 1997; Ruiz de la Torre & Ceballos, 1979). Igualmente, las
reconstrucciones paleoclimáticas disponibles para la costa Atlántica peninsular señalan
que las condiciones de temperatura entre los 34000 y los 20000 años BP no eran aptas
para el desarrollo de este pino (figura 4). Por tanto, parece poco probable que los
macrorrestos de San Pedro de Maceda y Esmoriz correspondan a P. uncinata.
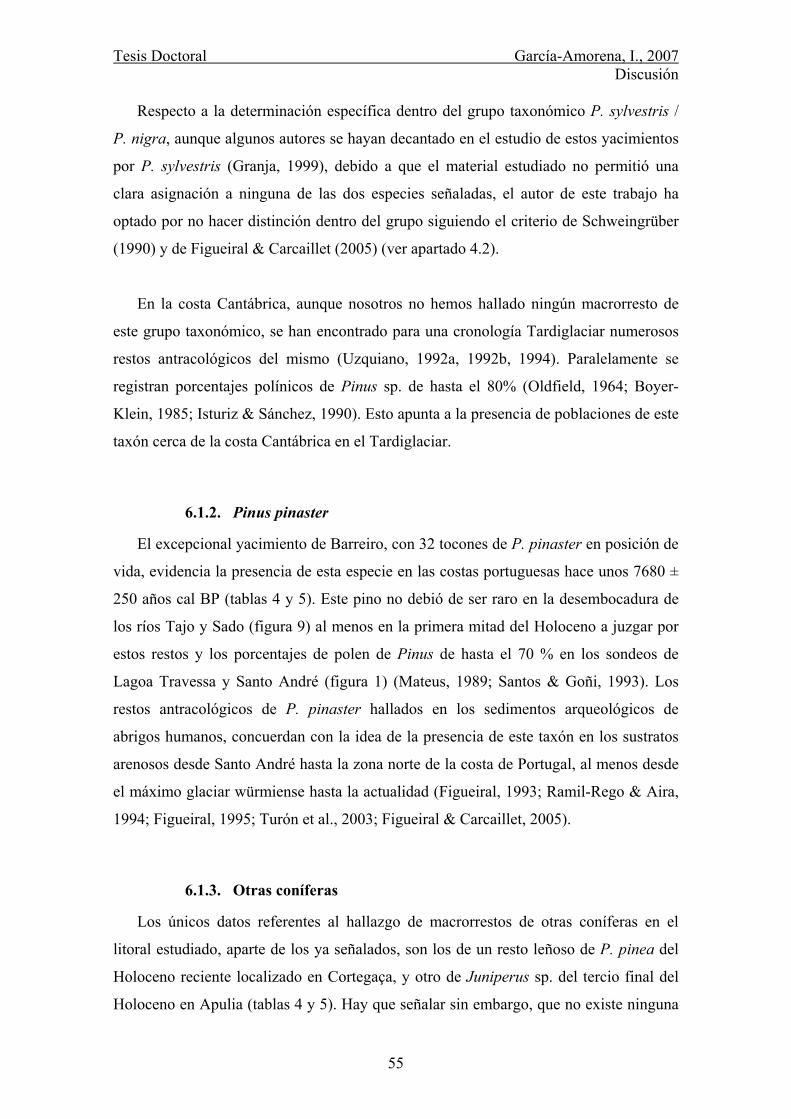
Tesis Doctoral García-Amorena, I., 2007 Discusión
55
Respecto a la determinación específica dentro del grupo taxonómico P. sylvestris /
P. nigra, aunque algunos autores se hayan decantado en el estudio de estos yacimientos
por P. sylvestris (Granja, 1999), debido a que el material estudiado no permitió una
clara asignación a ninguna de las dos especies señaladas, el autor de este trabajo ha
optado por no hacer distinción dentro del grupo siguiendo el criterio de Schweingrüber
(1990) y de Figueiral & Carcaillet (2005) (ver apartado 4.2).
En la costa Cantábrica, aunque nosotros no hemos hallado ningún macrorresto de
este grupo taxonómico, se han encontrado para una cronología Tardiglaciar numerosos
restos antracológicos del mismo (Uzquiano, 1992a, 1992b, 1994). Paralelamente se
registran porcentajes polínicos de Pinus sp. de hasta el 80% (Oldfield, 1964; Boyer-
Klein, 1985; Isturiz & Sánchez, 1990). Esto apunta a la presencia de poblaciones de este
taxón cerca de la costa Cantábrica en el Tardiglaciar.
6.1.2. Pinus pinaster
El excepcional yacimiento de Barreiro, con 32 tocones de P. pinaster en posición de
vida, evidencia la presencia de esta especie en las costas portuguesas hace unos 7680 ±
250 años cal BP (tablas 4 y 5). Este pino no debió de ser raro en la desembocadura de
los ríos Tajo y Sado (figura 9) al menos en la primera mitad del Holoceno a juzgar por
estos restos y los porcentajes de polen de Pinus de hasta el 70 % en los sondeos de
Lagoa Travessa y Santo André (figura 1) (Mateus, 1989; Santos & Goñi, 1993). Los
restos antracológicos de P. pinaster hallados en los sedimentos arqueológicos de
abrigos humanos, concuerdan con la idea de la presencia de este taxón en los sustratos
arenosos desde Santo André hasta la zona norte de la costa de Portugal, al menos desde
el máximo glaciar würmiense hasta la actualidad (Figueiral, 1993; Ramil-Rego & Aira,
1994; Figueiral, 1995; Turón et al., 2003; Figueiral & Carcaillet, 2005).
6.1.3. Otras coníferas
Los únicos datos referentes al hallazgo de macrorrestos de otras coníferas en el
litoral estudiado, aparte de los ya señalados, son los de un resto leñoso de P. pinea del
Holoceno reciente localizado en Cortegaça, y otro de Juniperus sp. del tercio final del
Holoceno en Apulia (tablas 4 y 5). Hay que señalar sin embargo, que no existe ninguna
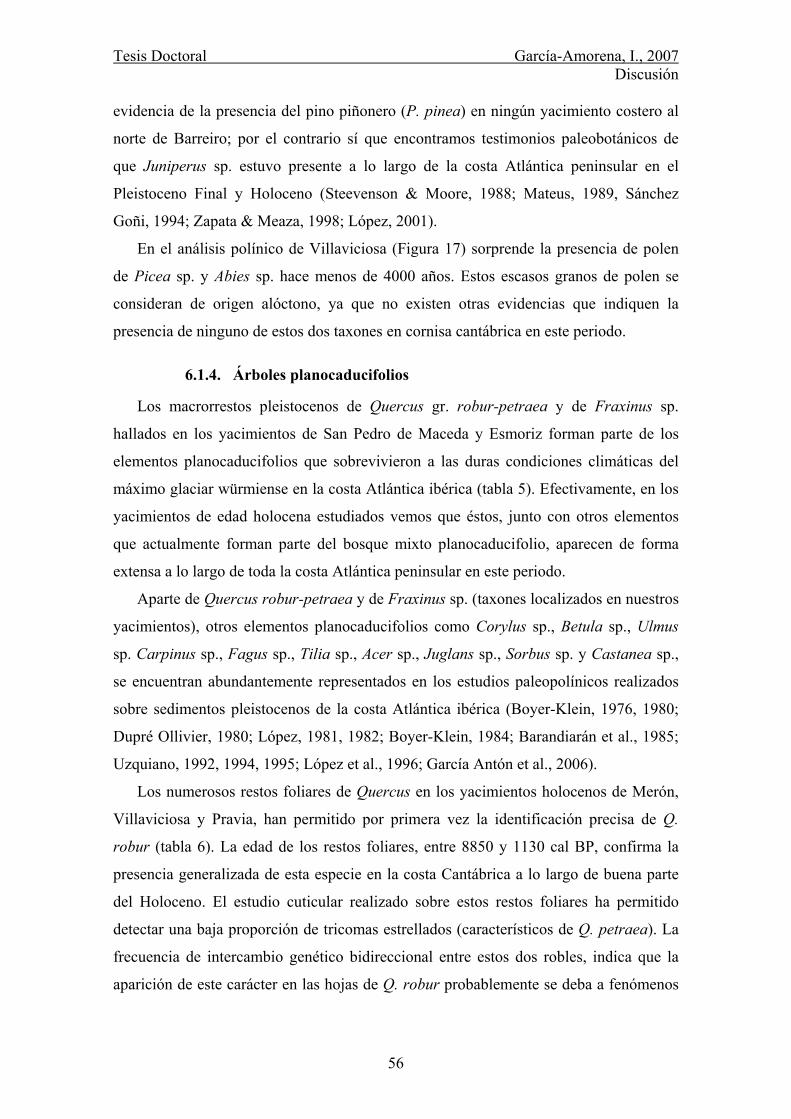
Tesis Doctoral García-Amorena, I., 2007 Discusión
56
evidencia de la presencia del pino piñonero (P. pinea) en ningún yacimiento costero al
norte de Barreiro; por el contrario sí que encontramos testimonios paleobotánicos de
que Juniperus sp. estuvo presente a lo largo de la costa Atlántica peninsular en el
Pleistoceno Final y Holoceno (Steevenson & Moore, 1988; Mateus, 1989, Sánchez
Goñi, 1994; Zapata & Meaza, 1998; López, 2001).
En el análisis polínico de Villaviciosa (Figura 17) sorprende la presencia de polen
de Picea sp. y Abies sp. hace menos de 4000 años. Estos escasos granos de polen se
consideran de origen alóctono, ya que no existen otras evidencias que indiquen la
presencia de ninguno de estos dos taxones en cornisa cantábrica en este periodo.
6.1.4. Árboles planocaducifolios
Los macrorrestos pleistocenos de Quercus gr. robur-petraea y de Fraxinus sp.
hallados en los yacimientos de San Pedro de Maceda y Esmoriz forman parte de los
elementos planocaducifolios que sobrevivieron a las duras condiciones climáticas del
máximo glaciar würmiense en la costa Atlántica ibérica (tabla 5). Efectivamente, en los
yacimientos de edad holocena estudiados vemos que éstos, junto con otros elementos
que actualmente forman parte del bosque mixto planocaducifolio, aparecen de forma
extensa a lo largo de toda la costa Atlántica peninsular en este periodo.
Aparte de Quercus robur-petraea y de Fraxinus sp. (taxones localizados en nuestros
yacimientos), otros elementos planocaducifolios como Corylus sp., Betula sp., Ulmus
sp. Carpinus sp., Fagus sp., Tilia sp., Acer sp., Juglans sp., Sorbus sp. y Castanea sp.,
se encuentran abundantemente representados en los estudios paleopolínicos realizados
sobre sedimentos pleistocenos de la costa Atlántica ibérica (Boyer-Klein, 1976, 1980;
Dupré Ollivier, 1980; López, 1981, 1982; Boyer-Klein, 1984; Barandiarán et al., 1985;
Uzquiano, 1992, 1994, 1995; López et al., 1996; García Antón et al., 2006).
Los numerosos restos foliares de Quercus en los yacimientos holocenos de Merón,
Villaviciosa y Pravia, han permitido por primera vez la identificación precisa de Q.
robur (tabla 6). La edad de los restos foliares, entre 8850 y 1130 cal BP, confirma la
presencia generalizada de esta especie en la costa Cantábrica a lo largo de buena parte
del Holoceno. El estudio cuticular realizado sobre estos restos foliares ha permitido
detectar una baja proporción de tricomas estrellados (característicos de Q. petraea). La
frecuencia de intercambio genético bidireccional entre estos dos robles, indica que la
aparición de este carácter en las hojas de Q. robur probablemente se deba a fenómenos

Tesis Doctoral García-Amorena, I., 2007 Discusión
57
de hibridación, frente a otras hipótesis como plasticidad o conservación de caracteres
ancestrales.
Debido a las exigencias ecológicas de Q. petraea, cuyas poblaciones ibéricas
actualmente se encuentran en su mayoría entre 500 y 1500 m sobre el nivel del mar, las
maderas de Q. robur-petraea encontradas en los yacimientos holocenos portugueses
pertenezcan probablemente también a Q. robur.
Por otro lado, los restos foliares y frutos de Corylus avellana encontrados desde
Merón hasta Villaviciosa (tabla 6), han permitido, igualmente por primera vez, su
identificación en el rango específico. Un resto foliar de Frangula alnus, una sámara de
Acer pseudoplatanus (figura 22) y una hoja de Ulmus minor, completan el cuadro de
taxones planocaducifolias identificados hasta el rango específico en la cornisa
cantábrica.
Además de los taxones anteriores, hemos identificado en cronología holocena
(tablas 4 y 5) Maloideae, Castanea sp., Fraxinus sp., Betula sp., Populus sp., Sambucus
sp., Salix sp. y Alnus sp., que concuerdan con los trabajos paleobotánicos disponibles
hasta la fecha sobre la vegetación holocena de la costa Atlántica ibérica (Oldfield, 1964;
Boyer-Klein, 1980; Dupré Ollivier, 1980; Boyer-Klein, 1984; Barandiarán et al., 1985;
Isturiz & Sánchez, 1990; Mary, 1990; Uzquiano, 1992b; López et al., 1993; Sánchez
Goñi, 1994; Uzquiano, 1994; García Antón et al., 2006). El estudio de los restos foliares
encontrados ha permitido detectar de nuevo por primera vez, la presencia holocena de
Alnus glutinosa (figura 25) en Villaviciosa, y de Salix atrocinerea (figura 24) en los
yacimientos de Merón, Oyambre y Villaviciosa.
En el análisis polínico del yacimiento de Villaviciosa (tabla 17), se observa la
presencia anecdótica de Fagus sp. a los ~4000 años BP. Aunque la presencia de haya no
está corroborada por macrorrestos, el testimonio polínico de Villaviciosa apoya el papel
de este taxón como elemento integrante del bosque mixto planocaducifolio en el piso
colino eurosiberiano en la Península Ibérica durante el Cuaternario final y Holoceno
(Menéndez Amor & Florschütz, 1961; Mary, 1973; Mariscal 1993; Peñalba 1994; Costa
et al., 1997; Muñoz-Sobrino et al., 2005; García Antón et al., 2006).
6.1.4.1. Ulmus minor
La localización e identificación de una hoja completa de Ulmus minor en el
sedimento de Villaviciosa (figura 23) con una edad de 3950 ± 120 años cal BP, apoya
por primera vez el origen autóctono de esta especie en los bosques costeros cantábricos
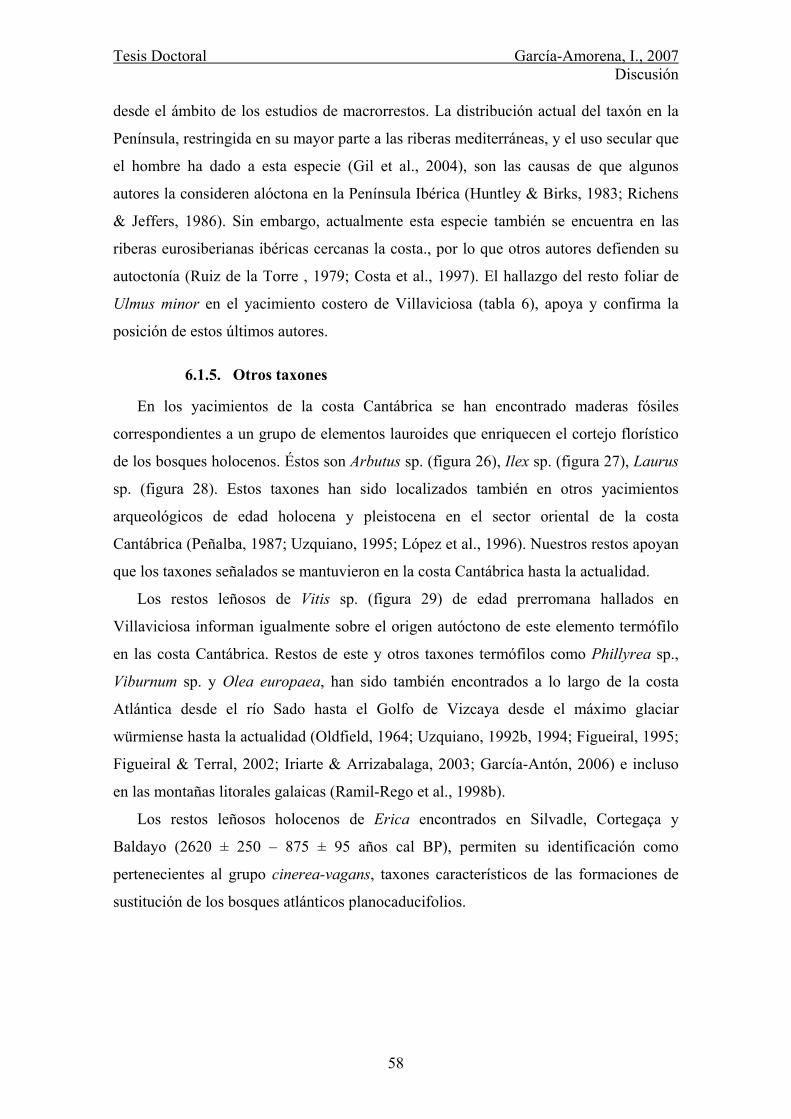
Tesis Doctoral García-Amorena, I., 2007 Discusión
58
desde el ámbito de los estudios de macrorrestos. La distribución actual del taxón en la
Península, restringida en su mayor parte a las riberas mediterráneas, y el uso secular que
el hombre ha dado a esta especie (Gil et al., 2004), son las causas de que algunos
autores la consideren alóctona en la Península Ibérica (Huntley & Birks, 1983; Richens
& Jeffers, 1986). Sin embargo, actualmente esta especie también se encuentra en las
riberas eurosiberianas ibéricas cercanas la costa., por lo que otros autores defienden su
autoctonía (Ruiz de la Torre , 1979; Costa et al., 1997). El hallazgo del resto foliar de
Ulmus minor en el yacimiento costero de Villaviciosa (tabla 6), apoya y confirma la
posición de estos últimos autores.
6.1.5. Otros taxones
En los yacimientos de la costa Cantábrica se han encontrado maderas fósiles
correspondientes a un grupo de elementos lauroides que enriquecen el cortejo florístico
de los bosques holocenos. Éstos son Arbutus sp. (figura 26), Ilex sp. (figura 27), Laurus
sp. (figura 28). Estos taxones han sido localizados también en otros yacimientos
arqueológicos de edad holocena y pleistocena en el sector oriental de la costa
Cantábrica (Peñalba, 1987; Uzquiano, 1995; López et al., 1996). Nuestros restos apoyan
que los taxones señalados se mantuvieron en la costa Cantábrica hasta la actualidad.
Los restos leñosos de Vitis sp. (figura 29) de edad prerromana hallados en
Villaviciosa informan igualmente sobre el origen autóctono de este elemento termófilo
en las costa Cantábrica. Restos de este y otros taxones termófilos como Phillyrea sp.,
Viburnum sp. y Olea europaea, han sido también encontrados a lo largo de la costa
Atlántica desde el río Sado hasta el Golfo de Vizcaya desde el máximo glaciar
würmiense hasta la actualidad (Oldfield, 1964; Uzquiano, 1992b, 1994; Figueiral, 1995;
Figueiral & Terral, 2002; Iriarte & Arrizabalaga, 2003; García-Antón, 2006) e incluso
en las montañas litorales galaicas (Ramil-Rego et al., 1998b).
Los restos leñosos holocenos de Erica encontrados en Silvadle, Cortegaça y
Baldayo (2620 ± 250 – 875 ± 95 años cal BP), permiten su identificación como
pertenecientes al grupo cinerea-vagans, taxones característicos de las formaciones de
sustitución de los bosques atlánticos planocaducifolios.
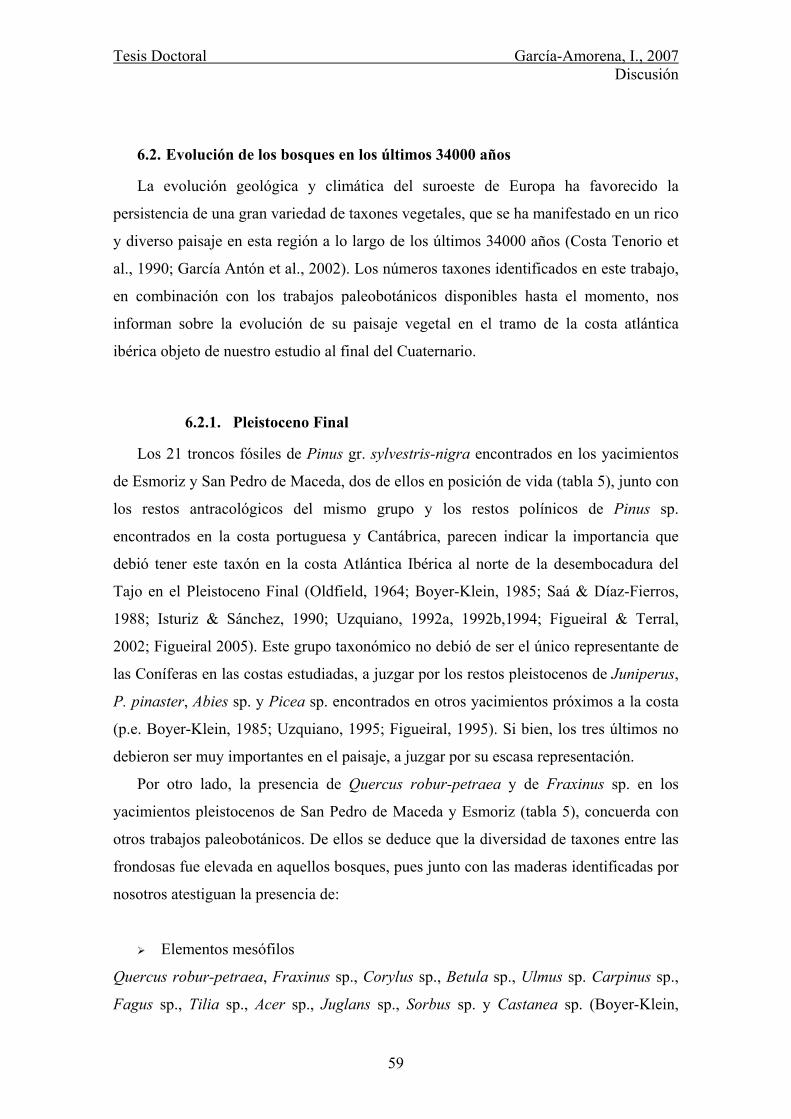
Tesis Doctoral García-Amorena, I., 2007 Discusión
59
6.2. Evolución de los bosques en los últimos 34000 años
La evolución geológica y climática del suroeste de Europa ha favorecido la
persistencia de una gran variedad de taxones vegetales, que se ha manifestado en un rico
y diverso paisaje en esta región a lo largo de los últimos 34000 años (Costa Tenorio et
al., 1990; García Antón et al., 2002). Los números taxones identificados en este trabajo,
en combinación con los trabajos paleobotánicos disponibles hasta el momento, nos
informan sobre la evolución de su paisaje vegetal en el tramo de la costa atlántica
ibérica objeto de nuestro estudio al final del Cuaternario.
6.2.1. Pleistoceno Final
Los 21 troncos fósiles de Pinus gr. sylvestris-nigra encontrados en los yacimientos
de Esmoriz y San Pedro de Maceda, dos de ellos en posición de vida (tabla 5), junto con
los restos antracológicos del mismo grupo y los restos polínicos de Pinus sp.
encontrados en la costa portuguesa y Cantábrica, parecen indicar la importancia que
debió tener este taxón en la costa Atlántica Ibérica al norte de la desembocadura del
Tajo en el Pleistoceno Final (Oldfield, 1964; Boyer-Klein, 1985; Saá & Díaz-Fierros,
1988; Isturiz & Sánchez, 1990; Uzquiano, 1992a, 1992b,1994; Figueiral & Terral,
2002; Figueiral 2005). Este grupo taxonómico no debió de ser el único representante de
las Coníferas en las costas estudiadas, a juzgar por los restos pleistocenos de Juniperus,
P. pinaster, Abies sp. y Picea sp. encontrados en otros yacimientos próximos a la costa
(p.e. Boyer-Klein, 1985; Uzquiano, 1995; Figueiral, 1995). Si bien, los tres últimos no
debieron ser muy importantes en el paisaje, a juzgar por su escasa representación.
Por otro lado, la presencia de Quercus robur-petraea y de Fraxinus sp. en los
yacimientos pleistocenos de San Pedro de Maceda y Esmoriz (tabla 5), concuerda con
otros trabajos paleobotánicos. De ellos se deduce que la diversidad de taxones entre las
frondosas fue elevada en aquellos bosques, pues junto con las maderas identificadas por
nosotros atestiguan la presencia de:
Elementos mesófilos
Quercus robur-petraea, Fraxinus sp., Corylus sp., Betula sp., Ulmus sp. Carpinus sp.,
Fagus sp., Tilia sp., Acer sp., Juglans sp., Sorbus sp. y Castanea sp. (Boyer-Klein,
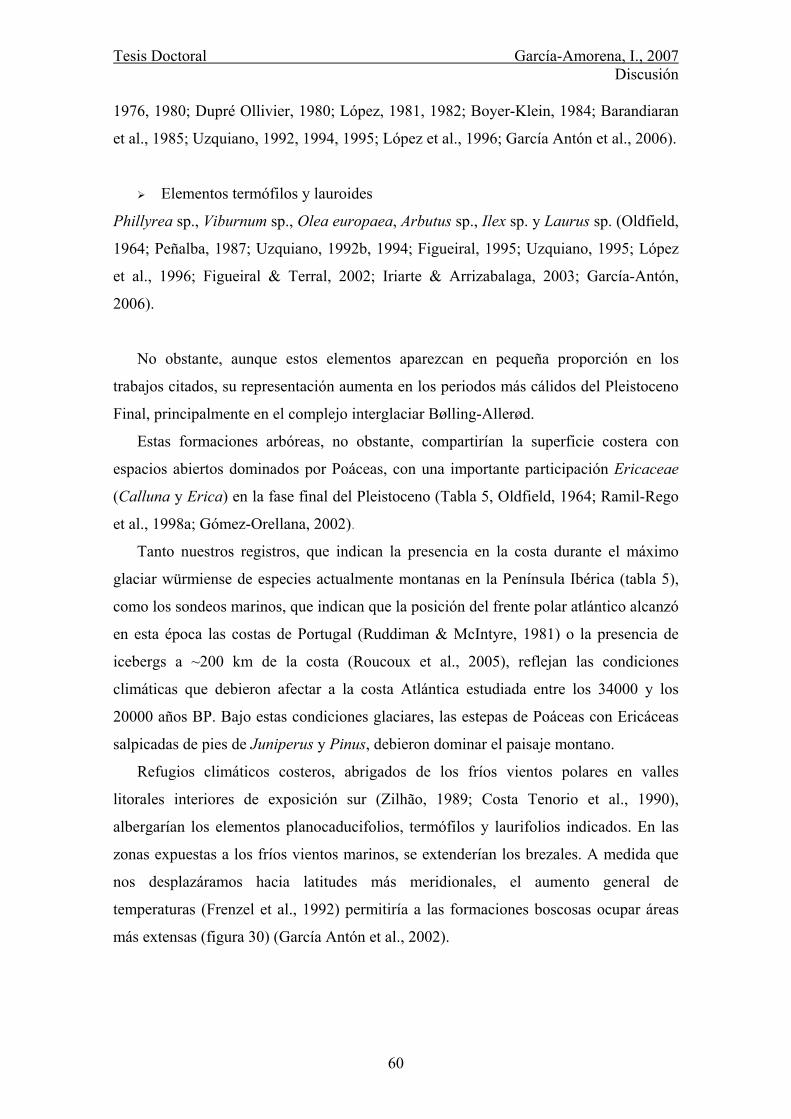
Tesis Doctoral García-Amorena, I., 2007 Discusión
60
1976, 1980; Dupré Ollivier, 1980; López, 1981, 1982; Boyer-Klein, 1984; Barandiaran
et al., 1985; Uzquiano, 1992, 1994, 1995; López et al., 1996; García Antón et al., 2006).
Elementos termófilos y lauroides
Phillyrea sp., Viburnum sp., Olea europaea, Arbutus sp., Ilex sp. y Laurus sp. (Oldfield,
1964; Peñalba, 1987; Uzquiano, 1992b, 1994; Figueiral, 1995; Uzquiano, 1995; López
et al., 1996; Figueiral & Terral, 2002; Iriarte & Arrizabalaga, 2003; García-Antón,
2006).
No obstante, aunque estos elementos aparezcan en pequeña proporción en los
trabajos citados, su representación aumenta en los periodos más cálidos del Pleistoceno
Final, principalmente en el complejo interglaciar Bølling-Allerød.
Estas formaciones arbóreas, no obstante, compartirían la superficie costera con
espacios abiertos dominados por Poáceas, con una importante participación Ericaceae
(Calluna y Erica) en la fase final del Pleistoceno (Tabla 5, Oldfield, 1964; Ramil-Rego
et al., 1998a; Gómez-Orellana, 2002).
Tanto nuestros registros, que indican la presencia en la costa durante el máximo
glaciar würmiense de especies actualmente montanas en la Península Ibérica (tabla 5),
como los sondeos marinos, que indican que la posición del frente polar atlántico alcanzó
en esta época las costas de Portugal (Ruddiman & McIntyre, 1981) o la presencia de
icebergs a ~200 km de la costa (Roucoux et al., 2005), reflejan las condiciones
climáticas que debieron afectar a la costa Atlántica estudiada entre los 34000 y los
20000 años BP. Bajo estas condiciones glaciares, las estepas de Poáceas con Ericáceas
salpicadas de pies de Juniperus y Pinus, debieron dominar el paisaje montano.
Refugios climáticos costeros, abrigados de los fríos vientos polares en valles
litorales interiores de exposición sur (Zilhão, 1989; Costa Tenorio et al., 1990),
albergarían los elementos planocaducifolios, termófilos y laurifolios indicados. En las
zonas expuestas a los fríos vientos marinos, se extenderían los brezales. A medida que
nos desplazáramos hacia latitudes más meridionales, el aumento general de
temperaturas (Frenzel et al., 1992) permitiría a las formaciones boscosas ocupar áreas
más extensas (figura 30) (García Antón et al., 2002).
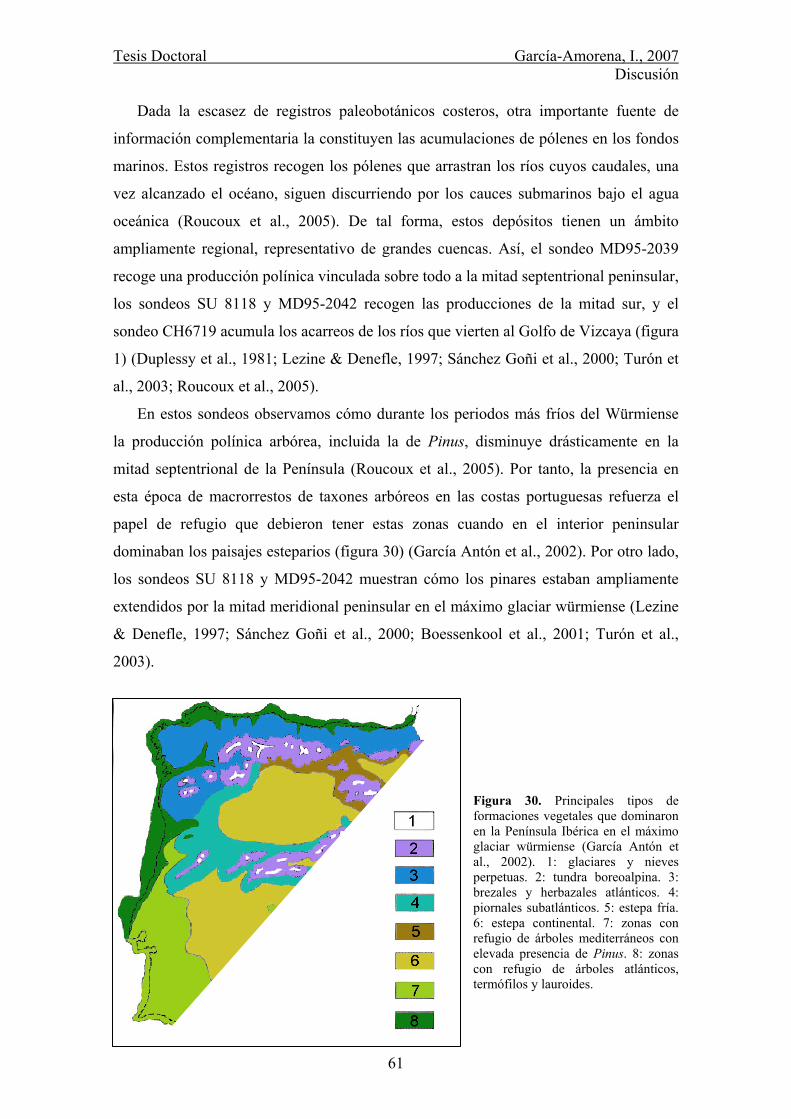
Tesis Doctoral García-Amorena, I., 2007 Discusión
61
Dada la escasez de registros paleobotánicos costeros, otra importante fuente de
información complementaria la constituyen las acumulaciones de pólenes en los fondos
marinos. Estos registros recogen los pólenes que arrastran los ríos cuyos caudales, una
vez alcanzado el océano, siguen discurriendo por los cauces submarinos bajo el agua
oceánica (Roucoux et al., 2005). De tal forma, estos depósitos tienen un ámbito
ampliamente regional, representativo de grandes cuencas. Así, el sondeo MD95-2039
recoge una producción polínica vinculada sobre todo a la mitad septentrional peninsular,
los sondeos SU 8118 y MD95-2042 recogen las producciones de la mitad sur, y el
sondeo CH6719 acumula los acarreos de los ríos que vierten al Golfo de Vizcaya (figura
1) (Duplessy et al., 1981; Lezine & Denefle, 1997; Sánchez Goñi et al., 2000; Turón et
al., 2003; Roucoux et al., 2005).
En estos sondeos observamos cómo durante los periodos más fríos del Würmiense
la producción polínica arbórea, incluida la de Pinus, disminuye drásticamente en la
mitad septentrional de la Península (Roucoux et al., 2005). Por tanto, la presencia en
esta época de macrorrestos de taxones arbóreos en las costas portuguesas refuerza el
papel de refugio que debieron tener estas zonas cuando en el interior peninsular
dominaban los paisajes esteparios (figura 30) (García Antón et al., 2002). Por otro lado,
los sondeos SU 8118 y MD95-2042 muestran cómo los pinares estaban ampliamente
extendidos por la mitad meridional peninsular en el máximo glaciar würmiense (Lezine
& Denefle, 1997; Sánchez Goñi et al., 2000; Boessenkool et al., 2001; Turón et al.,
2003).
Figura 30. Principales tipos de formaciones vegetales que dominaron en la Península Ibérica en el máximo glaciar würmiense (García Antón et al., 2002). 1: glaciares y nieves perpetuas. 2: tundra boreoalpina. 3: brezales y herbazales atlánticos. 4: piornales subatlánticos. 5: estepa fría. 6: estepa continental. 7: zonas con refugio de árboles mediterráneos con elevada presencia de Pinus. 8: zonas con refugio de árboles atlánticos, termófilos y lauroides.
Tesis Doctoral García-Amorena, I., 2007 Discusión
62
6.2.2. Holoceno
Los macrorrestos holocenos colectados en la costa Atlántica de la Península Ibérica
(tablas 4, 5 y 6) muestran un drástico cambio en la vegetación con respecto al periodo
anterior. La variación en las condiciones climáticas que han experimentado la costa
Atlántica ibérica desde el máximo glaciar würmiense hasta el comienzo del Holoceno
(figura 1) (Huntley & Birks, 1983; Huntley, 1990b; Peñalba et al., 1997), junto con la
fuerte presión antrópica que han sufrido las costas ibéricas durante los últimos milenios,
explican las diferencias de paisaje que evidencian los registros paleobotánicos entre los
dos periodos, y que señalamos a continuación.
Coníferas
Los 32 tocones de Pinus pinaster de Barreiro, de 6780 ± 135 años cal BP de edad
(tabla 6), junto con las evidencias polínicas de Lagoa Travessa y Santo André (Mateus,
1989; Santos & Goñi, 2003), y los numerosos restos antracológicos encontrados en
abrigos humanos cercanos al litoral portugués (Figueiral, 1995), apuntan a una
sustitución en las costas de Portugal de las formaciones würmienses de Pinus gr.
sylvestris-nigra por las de P. pinaster en el Holoceno. De hecho, los registros
paleobotánicos disponibles señalan que los restos de Pinus gr. sylvestris-nigra van
siendo cada vez más escasos tanto en la costa portuguesa como en la Cantábrica hacia el
final del Pleistoceno, hasta desaparecer completamente de la zona (López, 1981;
Uzquiano, 1992b; Figueiral, 1995; Iriarte & Arrizabalaga, 2003).
Los pinares de P. pinaster existentes en las costas portuguesas al comienzo del
Holoceno se redujeron considerablemente en torno a los 7000 años BP, viéndose
progresivamente sustituidos por formaciones de Ericaceae y Poaceae (Mateus, 1989;
Santos & Goñi, 2003). Poblaciones de este taxon han podio mantenerse hasta la
actualidad en zonas arenosas, de areniscas o granitos, o en relieves abruptos en
diferentes puntos de las costas atlánticas ibéricas (Beira Litoral, Monte Pindo o en
Asturias occidental) (Costa et al., 1997).
En resumen, los registros paleobotánicos muestran que en los periodos fríos los
pinos se habrían refugiado en algunos puntos de la costa Atlántica, y que con la llegada
de la mejoría climática participarían activamente en la reconquista de áreas despobladas.
P. pinaster se extendería por las zonas arenosas y sustratos compactados al comienzo
del Holoceno, mientas que P. gr. sylvestris-nigra migraría tempranamente en el
Tesis Doctoral García-Amorena, I., 2007 Discusión
63
Holoceno hacia lugares más apropiados en alta montaña (Mariscal, 1993; Peñalba,
1994; Ramil-Rego et al., 1998a).
En cuanto a P. pinea, sus restos leñosos encontrados en los yacimientos de Portugal
son de edades muy recientes. Sin embargo, en la sección más meridional de la costa
Atlántica portuguesa se han encontrado sus piñones en yacimientos eneolíticos y de la
Edad de Bronce. Estos resto, junto con los diagramas polínicos, indican una apreciable
importancia paisajística en la región del Algarbe y desembocadura del Guadalquivir
(Steevenson & Moore, 1988; Ramil & Aira, 1994).
Bosques mixtos caducifolios
Los macrorrestos de los yacimientos estudiados (tablas 5 y 6), evidencian por un
lado la riqueza florística que caracterizó a los bosques mixtos de la costa Atlántica
peninsular en momentos concretos del Holoceno (apartado 6.1). Por otro lado, los
registros polínicos y de carbones en cuevas del litoral atlántico evidencian que
simultáneamente a la evolución señalada para las coníferas al comienzo del Holoceno,
los bosques planocaducifolios fueron ganando terreno en la costa Atlántica peninsular
(Oldfield, 1964; van Mourik, 1986; Saá & Díaz-Fierros, 1988; Isturiz & Sánchez, 1990;
Mary, 1990; Uzquiano, 1992b; López et al., 1993; Ramil-Rego et al., 1998a; Muñoz-
Sobrino et al., 2005). La combinación de los resultados obtenidos en nuestro trabajo con
los estudios paleobotánicos disponibles permite deducir que tras el incremento de
Betula al inicio del Holoceno, se extendieron formaciones dominadas por Corylus
avellana y Quercus robur. Estos bosques de robles y avellanos se enriquecerían
rápidamente con especies planocaducifolias, termófilas y lauroides que habían
sobrevivido a las condiciones climáticas del Würmiense en los refugios costeros
(apartado 6.1).
Por otro lado, el escaso grado de introgresión de Q. petraea observado en las hojas
de Q. robur indica una posición lejana entre las poblaciones de las respectivas especies
desde el comienzo del Holoceno. Por tanto, estos dos robles, que podrían haber
intercambiado su información genética en los refugios próximos al litoral en los
periodos más fríos del Pleistoceno Final, se distanciaron en el Holoceno temprano. Sería
entonces cuando las poblaciones principales de Q. petraea se desplazarían hacia la
franja montañosa en la que se encuentran actualmente (principalmente entre 500 y 1500

Tesis Doctoral García-Amorena, I., 2007 Discusión
64
m sobre el nivel del mar), mientras que las de Q. robur se quedaría fundamentalmente
en zonas basales.
En cuanto al papel de Corylus avellana, se observa su gran importancia en las costas
desde el comienzo del Holoceno (p.e. Menéndez Amor & Florschütz, 1961; Isturiz &
Sánchez, 1990; Iriarte & Arrizabalaga, 2003), mientras que Betula, únicamente parece
que tuvo importancia paisajística en la zona estudiada durante la fase de recuperación
del bosque a comienzos del Holoceno (Isturiz & Sánchez, 1990; Uzquiano, 1992b).
Hacia la montaña este patrón se invierte, disminuyendo la importancia de Corylus
avellana y aumentando la de Betula (Peñalba, 1994; Ramil & Aira, 1994; Santos et al.,
2000; Muñoz-Sobrino et al., 2005).
Formaciones azonales
El aumento del nivel del mar (figura 6) que acompañó a la mejoría climática desde
el máximo glaciar würmiense hasta el óptimo climático del holoceno, hace unos 6000-
7000 años, implicó una generalización de ambientes higroturbosos en la costa Atlántica
peninsular (Garzón et al., 1996). En estos ambientes se extendieron las formaciones de
taxones higrófilos localizados en nuestros yacimientos, como Salix atrocinerea, Alnus
glutinosa, Fraxinus sp., y en menor proporción Populus sp., y Sambucus sp.,
representados en los yacimientos holocenos de Merón, Oyambre, Noja, Villaviciosa,
Navia, Baldayo, Esposende, Apúlia, Paramós y Ovar (tablas 5 y 6). Las turberas y
fondos de antiguas lagunas de agua dulce o salada aquí estudiadas, son evidencia de la
subida del nivel freático, consecuencia de las fluctuaciones holocenas del nivel del mar
(capítulo V) (Garzón et al., 1996; Granja, 1999).
Por otro lado, no faltaron en el Holoceno las comunidades de taxones adaptados a
suelos pobres en nutrientes o degradados por la acción antrópica, como Erica cinerea-
vagans, Juniperus sp., o incluso el ya citado Pinus pinaster (tablas 5 y 6) (van Mourik,
1986; Mateus, 1989; Zilhão, 1993; Figueiral, 1995; Aura et al., 1998; López, 2001;
Santos & Goñi, 2003; Muñoz-Sobrino et al., 2004). La acción antrópica, intensificada
desde la época romana, favorecería la expansión de algunas de estas especies, así como
otras que fueran de utilidad, como P. pinea, Castanea sp., Ulmus minor o Vitis sp.
(López, 1981; Saá & Díaz-Fierros, 1988; Steevenson & Moore, 1988; Mateus, 1989;
Zilhão, 1993; Figueiral, 1995; Lezine & Denefle, 1997; Aura et al., 1998; Ramil-Rego
et al., 1998a; Figueiral & Terral, 2002; Martínez Cortizas et al., 2005).
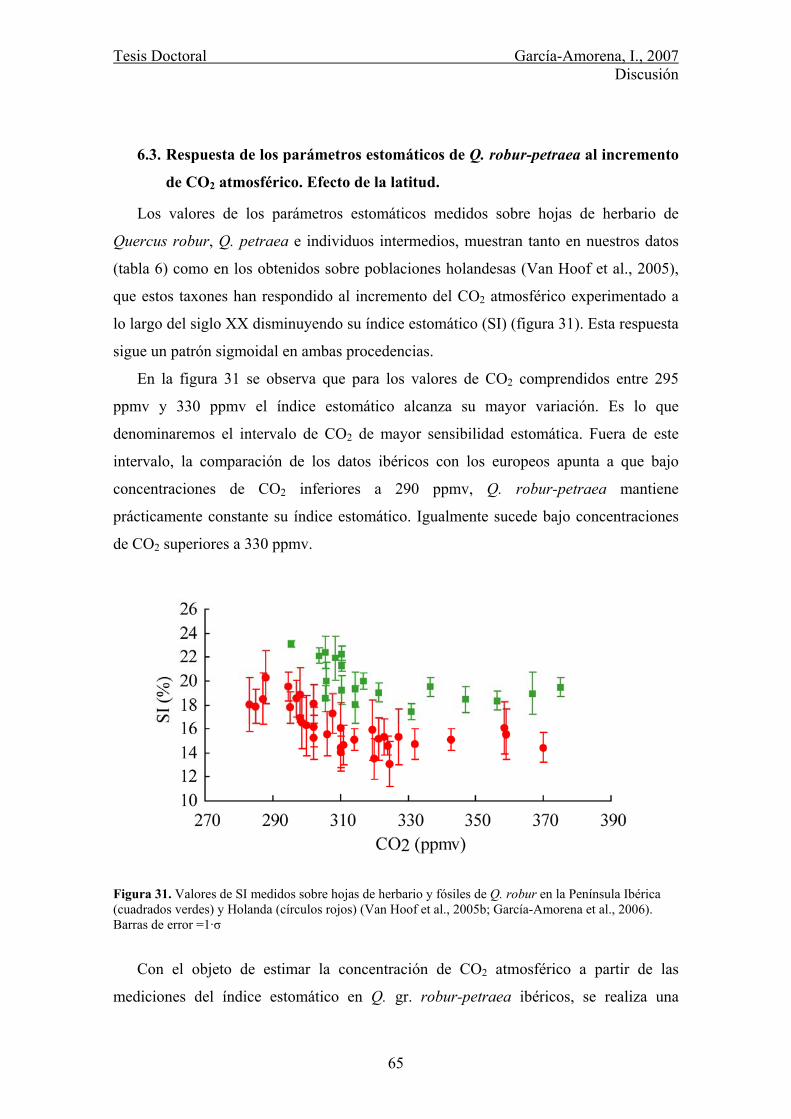
Tesis Doctoral García-Amorena, I., 2007 Discusión
65
6.3. Respuesta de los parámetros estomáticos de Q. robur-petraea al incremento
de CO2 atmosférico. Efecto de la latitud.
Los valores de los parámetros estomáticos medidos sobre hojas de herbario de
Quercus robur, Q. petraea e individuos intermedios, muestran tanto en nuestros datos
(tabla 6) como en los obtenidos sobre poblaciones holandesas (Van Hoof et al., 2005),
que estos taxones han respondido al incremento del CO2 atmosférico experimentado a
lo largo del siglo XX disminuyendo su índice estomático (SI) (figura 31). Esta respuesta
sigue un patrón sigmoidal en ambas procedencias.
En la figura 31 se observa que para los valores de CO2 comprendidos entre 295
ppmv y 330 ppmv el índice estomático alcanza su mayor variación. Es lo que
denominaremos el intervalo de CO2 de mayor sensibilidad estomática. Fuera de este
intervalo, la comparación de los datos ibéricos con los europeos apunta a que bajo
concentraciones de CO2 inferiores a 290 ppmv, Q. robur-petraea mantiene
prácticamente constante su índice estomático. Igualmente sucede bajo concentraciones
de CO2 superiores a 330 ppmv.
Figura 31. Valores de SI medidos sobre hojas de herbario y fósiles de Q. robur en la Península Ibérica (cuadrados verdes) y Holanda (círculos rojos) (Van Hoof et al., 2005b; García-Amorena et al., 2006). Barras de error =1·σ
Con el objeto de estimar la concentración de CO2 atmosférico a partir de las
mediciones del índice estomático en Q. gr. robur-petraea ibéricos, se realiza una
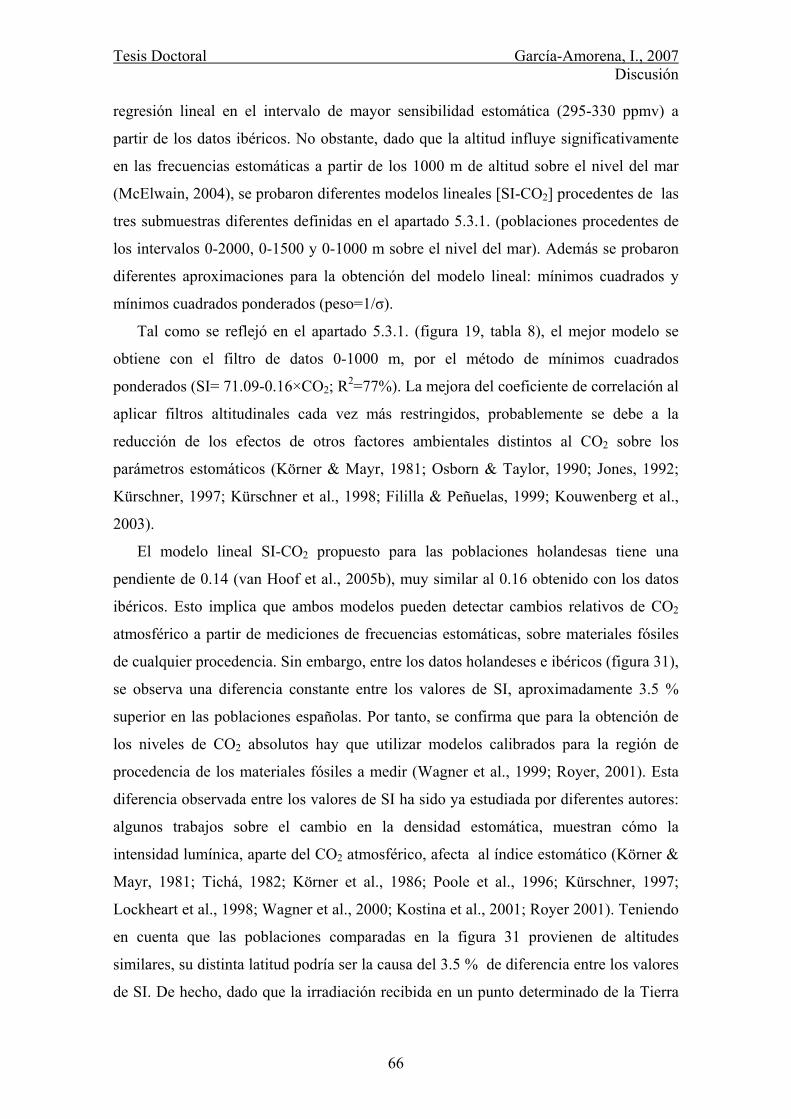
Tesis Doctoral García-Amorena, I., 2007 Discusión
66
regresión lineal en el intervalo de mayor sensibilidad estomática (295-330 ppmv) a
partir de los datos ibéricos. No obstante, dado que la altitud influye significativamente
en las frecuencias estomáticas a partir de los 1000 m de altitud sobre el nivel del mar
(McElwain, 2004), se probaron diferentes modelos lineales [SI-CO2] procedentes de las
tres submuestras diferentes definidas en el apartado 5.3.1. (poblaciones procedentes de
los intervalos 0-2000, 0-1500 y 0-1000 m sobre el nivel del mar). Además se probaron
diferentes aproximaciones para la obtención del modelo lineal: mínimos cuadrados y
mínimos cuadrados ponderados (peso=1/σ).
Tal como se reflejó en el apartado 5.3.1. (figura 19, tabla 8), el mejor modelo se
obtiene con el filtro de datos 0-1000 m, por el método de mínimos cuadrados
ponderados (SI= 71.09-0.16×CO2; R2=77%). La mejora del coeficiente de correlación al
aplicar filtros altitudinales cada vez más restringidos, probablemente se debe a la
reducción de los efectos de otros factores ambientales distintos al CO2 sobre los
parámetros estomáticos (Körner & Mayr, 1981; Osborn & Taylor, 1990; Jones, 1992;
Kürschner, 1997; Kürschner et al., 1998; Fililla & Peñuelas, 1999; Kouwenberg et al.,
2003).
El modelo lineal SI-CO2 propuesto para las poblaciones holandesas tiene una
pendiente de 0.14 (van Hoof et al., 2005b), muy similar al 0.16 obtenido con los datos
ibéricos. Esto implica que ambos modelos pueden detectar cambios relativos de CO2
atmosférico a partir de mediciones de frecuencias estomáticas, sobre materiales fósiles
de cualquier procedencia. Sin embargo, entre los datos holandeses e ibéricos (figura 31),
se observa una diferencia constante entre los valores de SI, aproximadamente 3.5 %
superior en las poblaciones españolas. Por tanto, se confirma que para la obtención de
los niveles de CO2 absolutos hay que utilizar modelos calibrados para la región de
procedencia de los materiales fósiles a medir (Wagner et al., 1999; Royer, 2001). Esta
diferencia observada entre los valores de SI ha sido ya estudiada por diferentes autores:
algunos trabajos sobre el cambio en la densidad estomática, muestran cómo la
intensidad lumínica, aparte del CO2 atmosférico, afecta al índice estomático (Körner &
Mayr, 1981; Tichá, 1982; Körner et al., 1986; Poole et al., 1996; Kürschner, 1997;
Lockheart et al., 1998; Wagner et al., 2000; Kostina et al., 2001; Royer 2001). Teniendo
en cuenta que las poblaciones comparadas en la figura 31 provienen de altitudes
similares, su distinta latitud podría ser la causa del 3.5 % de diferencia entre los valores
de SI. De hecho, dado que la irradiación recibida en un punto determinado de la Tierra
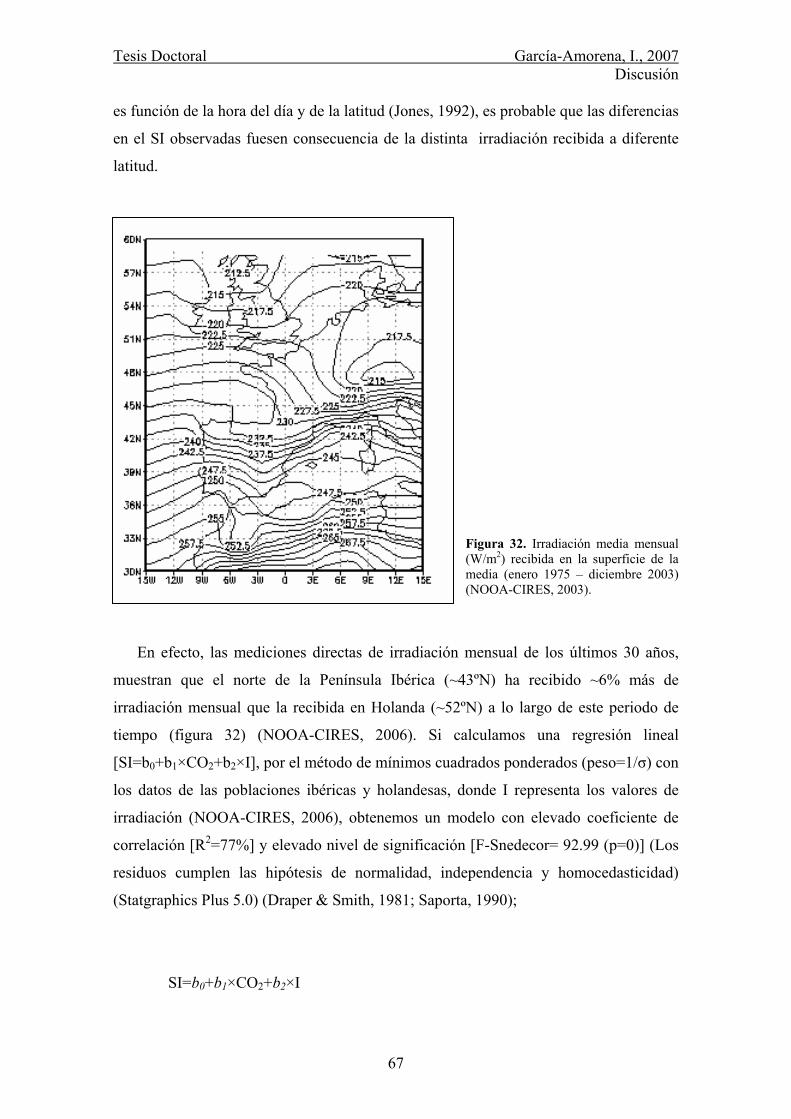
Tesis Doctoral García-Amorena, I., 2007 Discusión
67
es función de la hora del día y de la latitud (Jones, 1992), es probable que las diferencias
en el SI observadas fuesen consecuencia de la distinta irradiación recibida a diferente
latitud.
Figura 32. Irradiación media mensual (W/m2) recibida en la superficie de la media (enero 1975 – diciembre 2003) (NOOA-CIRES, 2003).
En efecto, las mediciones directas de irradiación mensual de los últimos 30 años,
muestran que el norte de la Península Ibérica (~43ºN) ha recibido ~6% más de
irradiación mensual que la recibida en Holanda (~52ºN) a lo largo de este periodo de
tiempo (figura 32) (NOOA-CIRES, 2006). Si calculamos una regresión lineal
[SI=b0+b1×CO2+b2×I], por el método de mínimos cuadrados ponderados (peso=1/σ) con
los datos de las poblaciones ibéricas y holandesas, donde I representa los valores de
irradiación (NOOA-CIRES, 2006), obtenemos un modelo con elevado coeficiente de
correlación [R2=77%] y elevado nivel de significación [F-Snedecor= 92.99 (p=0)] (Los
residuos cumplen las hipótesis de normalidad, independencia y homocedasticidad)
(Statgraphics Plus 5.0) (Draper & Smith, 1981; Saporta, 1990);
SI=b0+b1×CO2+b2×I
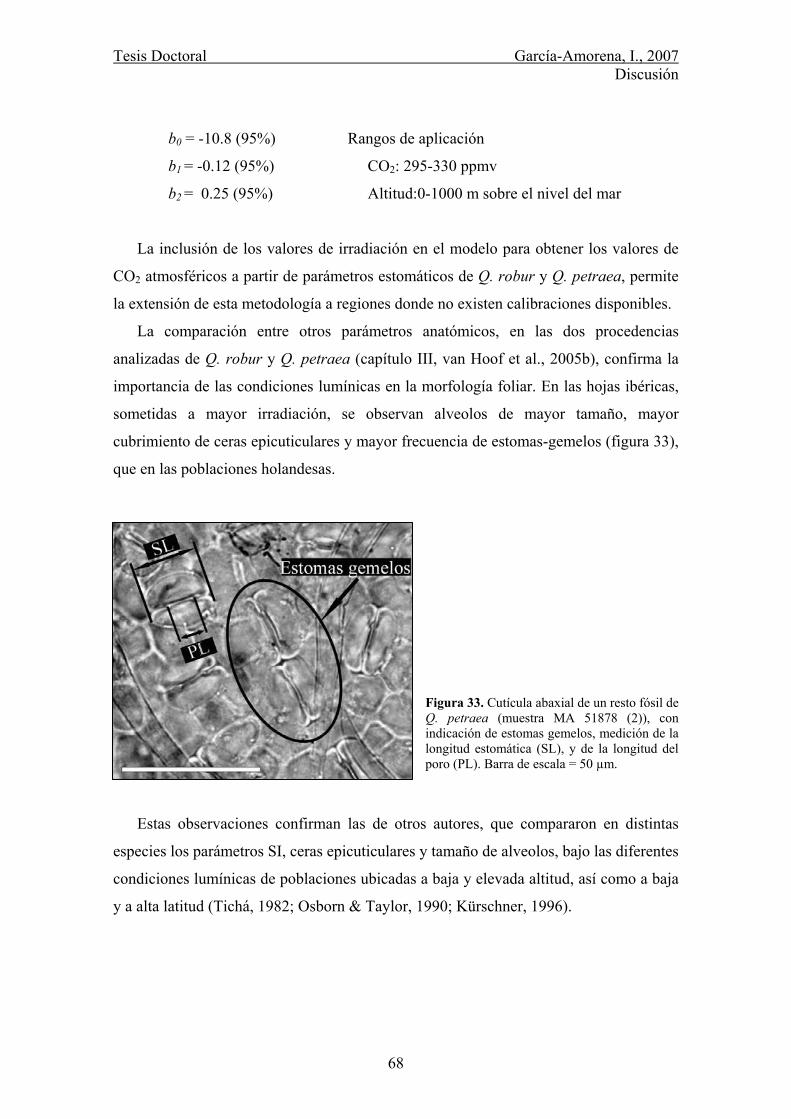
Tesis Doctoral García-Amorena, I., 2007 Discusión
68
b0 = -10.8 (95%)
b1 = -0.12 (95%)
b2 = 0.25 (95%)
Rangos de aplicación
CO2: 295-330 ppmv
Altitud:0-1000 m sobre el nivel del mar
La inclusión de los valores de irradiación en el modelo para obtener los valores de
CO2 atmosféricos a partir de parámetros estomáticos de Q. robur y Q. petraea, permite
la extensión de esta metodología a regiones donde no existen calibraciones disponibles.
La comparación entre otros parámetros anatómicos, en las dos procedencias
analizadas de Q. robur y Q. petraea (capítulo III, van Hoof et al., 2005b), confirma la
importancia de las condiciones lumínicas en la morfología foliar. En las hojas ibéricas,
sometidas a mayor irradiación, se observan alveolos de mayor tamaño, mayor
cubrimiento de ceras epicuticulares y mayor frecuencia de estomas-gemelos (figura 33),
que en las poblaciones holandesas.
Figura 33. Cutícula abaxial de un resto fósil de Q. petraea (muestra MA 51878 (2)), con indicación de estomas gemelos, medición de la longitud estomática (SL), y de la longitud del poro (PL). Barra de escala = 50 µm.
Estas observaciones confirman las de otros autores, que compararon en distintas
especies los parámetros SI, ceras epicuticulares y tamaño de alveolos, bajo las diferentes
condiciones lumínicas de poblaciones ubicadas a baja y elevada altitud, así como a baja
y a alta latitud (Tichá, 1982; Osborn & Taylor, 1990; Kürschner, 1996).
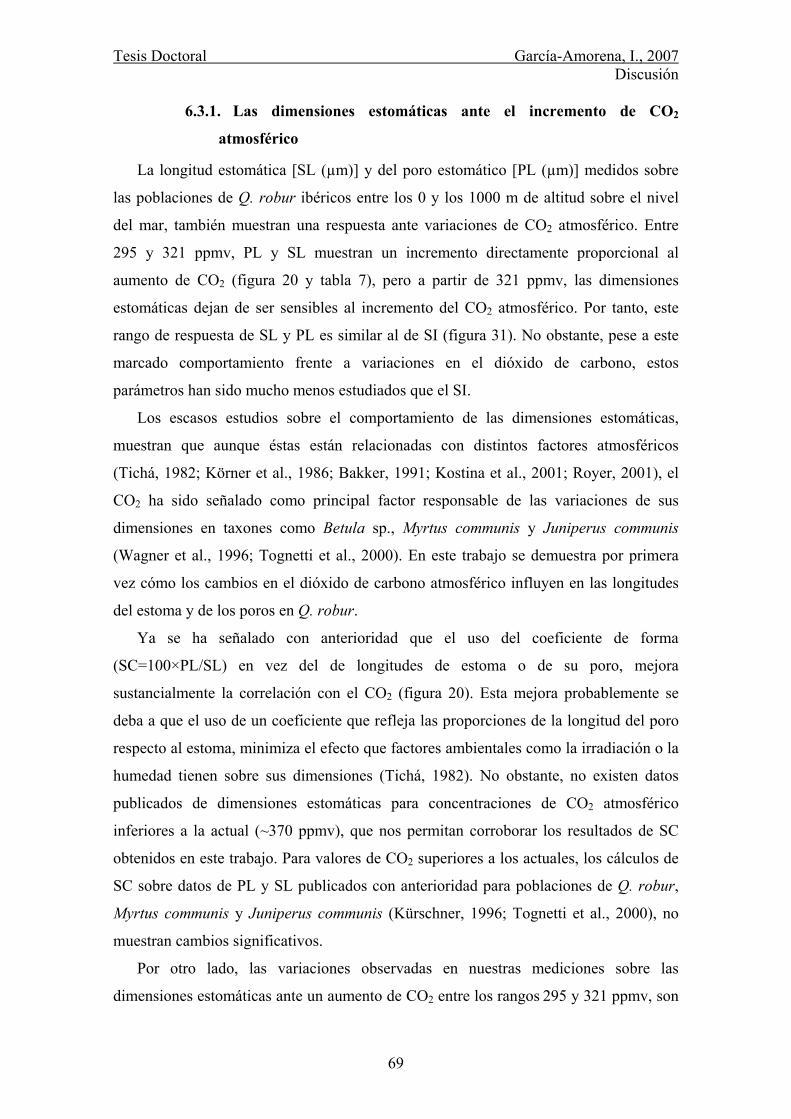
Tesis Doctoral García-Amorena, I., 2007 Discusión
69
6.3.1. Las dimensiones estomáticas ante el incremento de CO2
atmosférico
La longitud estomática [SL (µm)] y del poro estomático [PL (µm)] medidos sobre
las poblaciones de Q. robur ibéricos entre los 0 y los 1000 m de altitud sobre el nivel
del mar, también muestran una respuesta ante variaciones de CO2 atmosférico. Entre
295 y 321 ppmv, PL y SL muestran un incremento directamente proporcional al
aumento de CO2 (figura 20 y tabla 7), pero a partir de 321 ppmv, las dimensiones
estomáticas dejan de ser sensibles al incremento del CO2 atmosférico. Por tanto, este
rango de respuesta de SL y PL es similar al de SI (figura 31). No obstante, pese a este
marcado comportamiento frente a variaciones en el dióxido de carbono, estos
parámetros han sido mucho menos estudiados que el SI.
Los escasos estudios sobre el comportamiento de las dimensiones estomáticas,
muestran que aunque éstas están relacionadas con distintos factores atmosféricos
(Tichá, 1982; Körner et al., 1986; Bakker, 1991; Kostina et al., 2001; Royer, 2001), el
CO2 ha sido señalado como principal factor responsable de las variaciones de sus
dimensiones en taxones como Betula sp., Myrtus communis y Juniperus communis
(Wagner et al., 1996; Tognetti et al., 2000). En este trabajo se demuestra por primera
vez cómo los cambios en el dióxido de carbono atmosférico influyen en las longitudes
del estoma y de los poros en Q. robur.
Ya se ha señalado con anterioridad que el uso del coeficiente de forma
(SC=100×PL/SL) en vez del de longitudes de estoma o de su poro, mejora
sustancialmente la correlación con el CO2 (figura 20). Esta mejora probablemente se
deba a que el uso de un coeficiente que refleja las proporciones de la longitud del poro
respecto al estoma, minimiza el efecto que factores ambientales como la irradiación o la
humedad tienen sobre sus dimensiones (Tichá, 1982). No obstante, no existen datos
publicados de dimensiones estomáticas para concentraciones de CO2 atmosférico
inferiores a la actual (~370 ppmv), que nos permitan corroborar los resultados de SC
obtenidos en este trabajo. Para valores de CO2 superiores a los actuales, los cálculos de
SC sobre datos de PL y SL publicados con anterioridad para poblaciones de Q. robur,
Myrtus communis y Juniperus communis (Kürschner, 1996; Tognetti et al., 2000), no
muestran cambios significativos.
Por otro lado, las variaciones observadas en nuestras mediciones sobre las
dimensiones estomáticas ante un aumento de CO2 entre los rangos 295 y 321 ppmv, son
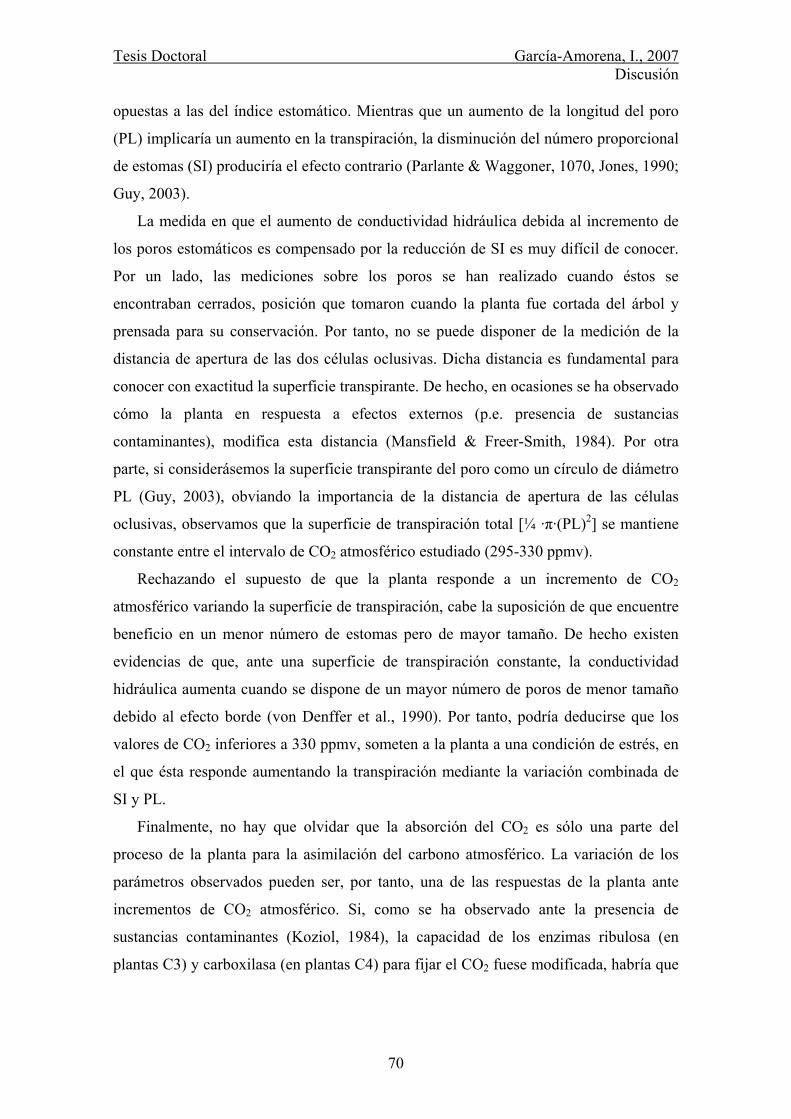
Tesis Doctoral García-Amorena, I., 2007 Discusión
70
opuestas a las del índice estomático. Mientras que un aumento de la longitud del poro
(PL) implicaría un aumento en la transpiración, la disminución del número proporcional
de estomas (SI) produciría el efecto contrario (Parlante & Waggoner, 1070, Jones, 1990;
Guy, 2003).
La medida en que el aumento de conductividad hidráulica debida al incremento de
los poros estomáticos es compensado por la reducción de SI es muy difícil de conocer.
Por un lado, las mediciones sobre los poros se han realizado cuando éstos se
encontraban cerrados, posición que tomaron cuando la planta fue cortada del árbol y
prensada para su conservación. Por tanto, no se puede disponer de la medición de la
distancia de apertura de las dos células oclusivas. Dicha distancia es fundamental para
conocer con exactitud la superficie transpirante. De hecho, en ocasiones se ha observado
cómo la planta en respuesta a efectos externos (p.e. presencia de sustancias
contaminantes), modifica esta distancia (Mansfield & Freer-Smith, 1984). Por otra
parte, si considerásemos la superficie transpirante del poro como un círculo de diámetro
PL (Guy, 2003), obviando la importancia de la distancia de apertura de las células
oclusivas, observamos que la superficie de transpiración total [¼ ·π·(PL)2] se mantiene
constante entre el intervalo de CO2 atmosférico estudiado (295-330 ppmv).
Rechazando el supuesto de que la planta responde a un incremento de CO2
atmosférico variando la superficie de transpiración, cabe la suposición de que encuentre
beneficio en un menor número de estomas pero de mayor tamaño. De hecho existen
evidencias de que, ante una superficie de transpiración constante, la conductividad
hidráulica aumenta cuando se dispone de un mayor número de poros de menor tamaño
debido al efecto borde (von Denffer et al., 1990). Por tanto, podría deducirse que los
valores de CO2 inferiores a 330 ppmv, someten a la planta a una condición de estrés, en
el que ésta responde aumentando la transpiración mediante la variación combinada de
SI y PL.
Finalmente, no hay que olvidar que la absorción del CO2 es sólo una parte del
proceso de la planta para la asimilación del carbono atmosférico. La variación de los
parámetros observados pueden ser, por tanto, una de las respuestas de la planta ante
incrementos de CO2 atmosférico. Si, como se ha observado ante la presencia de
sustancias contaminantes (Koziol, 1984), la capacidad de los enzimas ribulosa (en
plantas C3) y carboxilasa (en plantas C4) para fijar el CO2 fuese modificada, habría que
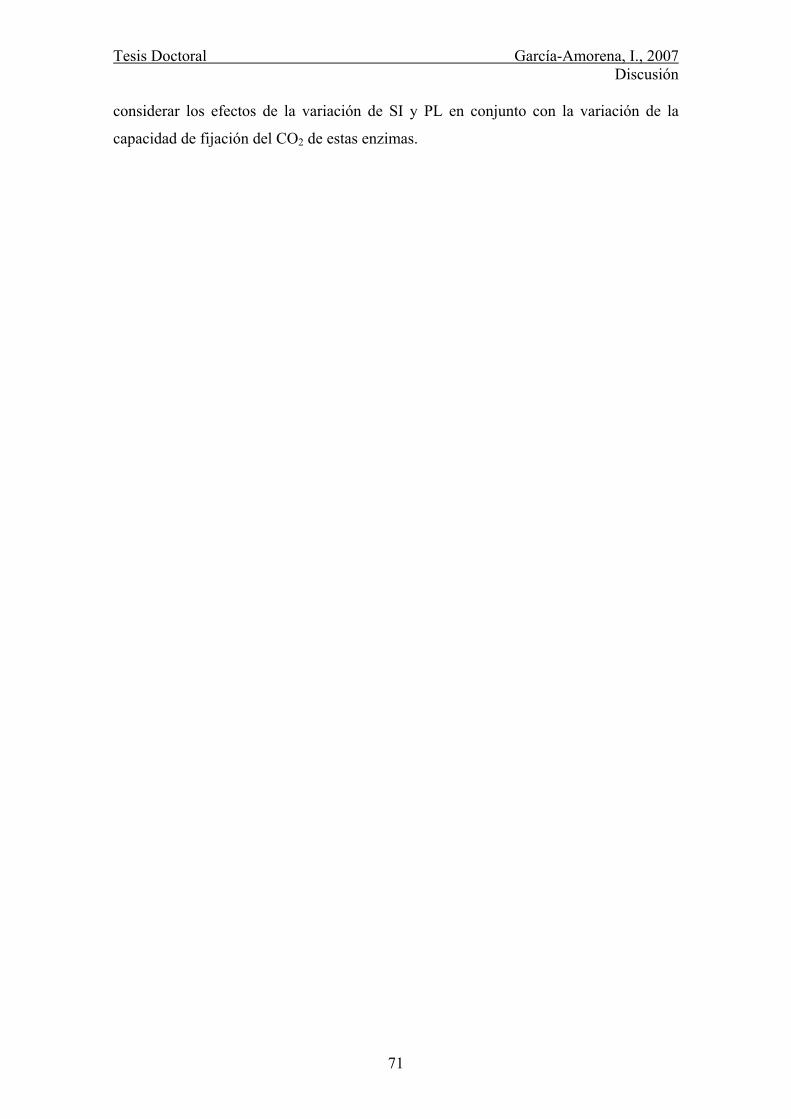
Tesis Doctoral García-Amorena, I., 2007 Discusión
71
considerar los efectos de la variación de SI y PL en conjunto con la variación de la
capacidad de fijación del CO2 de estas enzimas.
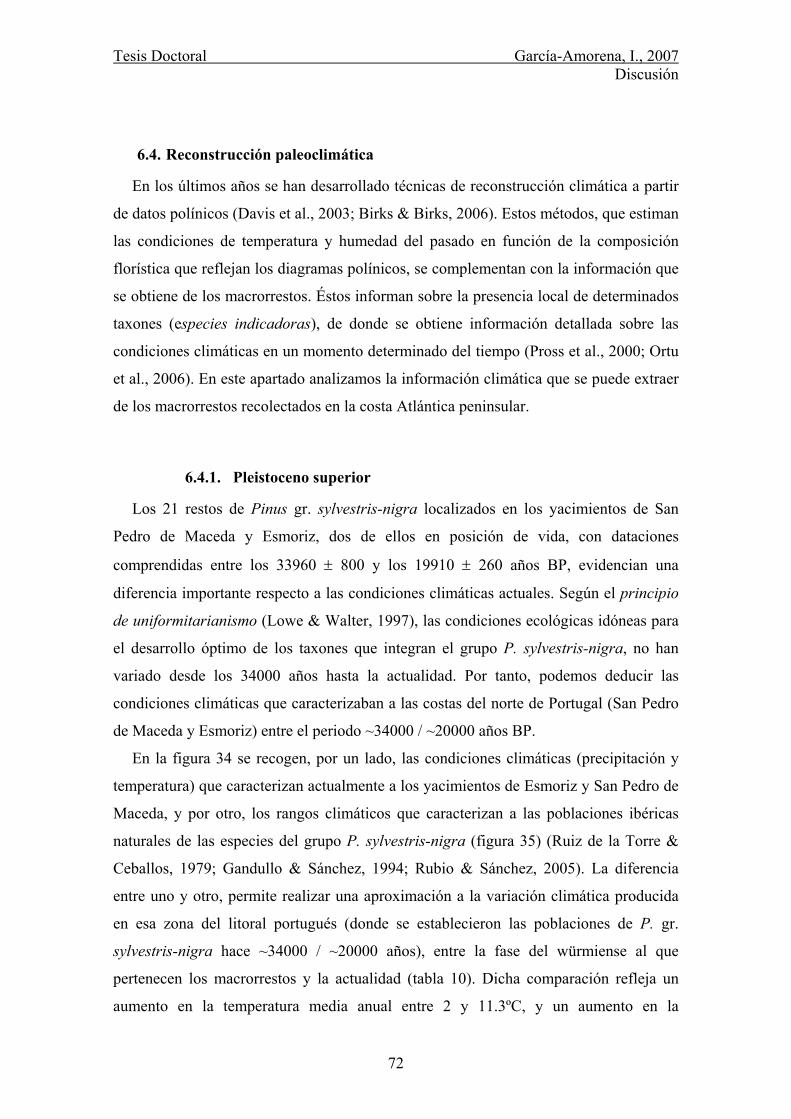
Tesis Doctoral García-Amorena, I., 2007 Discusión
72
6.4. Reconstrucción paleoclimática
En los últimos años se han desarrollado técnicas de reconstrucción climática a partir
de datos polínicos (Davis et al., 2003; Birks & Birks, 2006). Estos métodos, que estiman
las condiciones de temperatura y humedad del pasado en función de la composición
florística que reflejan los diagramas polínicos, se complementan con la información que
se obtiene de los macrorrestos. Éstos informan sobre la presencia local de determinados
taxones (especies indicadoras), de donde se obtiene información detallada sobre las
condiciones climáticas en un momento determinado del tiempo (Pross et al., 2000; Ortu
et al., 2006). En este apartado analizamos la información climática que se puede extraer
de los macrorrestos recolectados en la costa Atlántica peninsular.
6.4.1. Pleistoceno superior
Los 21 restos de Pinus gr. sylvestris-nigra localizados en los yacimientos de San
Pedro de Maceda y Esmoriz, dos de ellos en posición de vida, con dataciones
comprendidas entre los 33960 ± 800 y los 19910 ± 260 años BP, evidencian una
diferencia importante respecto a las condiciones climáticas actuales. Según el principio
de uniformitarianismo (Lowe & Walter, 1997), las condiciones ecológicas idóneas para
el desarrollo óptimo de los taxones que integran el grupo P. sylvestris-nigra, no han
variado desde los 34000 años hasta la actualidad. Por tanto, podemos deducir las
condiciones climáticas que caracterizaban a las costas del norte de Portugal (San Pedro
de Maceda y Esmoriz) entre el periodo ~34000 / ~20000 años BP.
En la figura 34 se recogen, por un lado, las condiciones climáticas (precipitación y
temperatura) que caracterizan actualmente a los yacimientos de Esmoriz y San Pedro de
Maceda, y por otro, los rangos climáticos que caracterizan a las poblaciones ibéricas
naturales de las especies del grupo P. sylvestris-nigra (figura 35) (Ruiz de la Torre &
Ceballos, 1979; Gandullo & Sánchez, 1994; Rubio & Sánchez, 2005). La diferencia
entre uno y otro, permite realizar una aproximación a la variación climática producida
en esa zona del litoral portugués (donde se establecieron las poblaciones de P. gr.
sylvestris-nigra hace ~34000 / ~20000 años), entre la fase del würmiense al que
pertenecen los macrorrestos y la actualidad (tabla 10). Dicha comparación refleja un
aumento en la temperatura media anual entre 2 y 11.3ºC, y un aumento en la
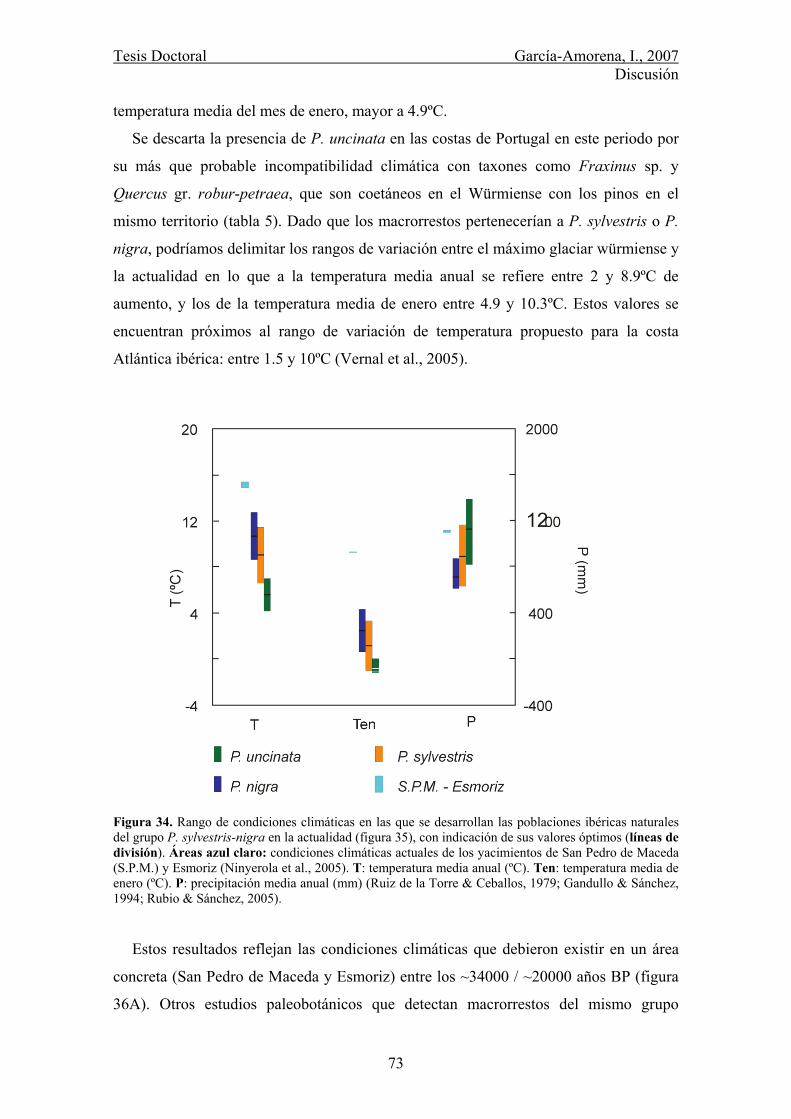
Tesis Doctoral García-Amorena, I., 2007 Discusión
73
temperatura media del mes de enero, mayor a 4.9ºC.
Se descarta la presencia de P. uncinata en las costas de Portugal en este periodo por
su más que probable incompatibilidad climática con taxones como Fraxinus sp. y
Quercus gr. robur-petraea, que son coetáneos en el Würmiense con los pinos en el
mismo territorio (tabla 5). Dado que los macrorrestos pertenecerían a P. sylvestris o P.
nigra, podríamos delimitar los rangos de variación entre el máximo glaciar würmiense y
la actualidad en lo que a la temperatura media anual se refiere entre 2 y 8.9ºC de
aumento, y los de la temperatura media de enero entre 4.9 y 10.3ºC. Estos valores se
encuentran próximos al rango de variación de temperatura propuesto para la costa
Atlántica ibérica: entre 1.5 y 10ºC (Vernal et al., 2005).
Figura 34. Rango de condiciones climáticas en las que se desarrollan las poblaciones ibéricas naturales del grupo P. sylvestris-nigra en la actualidad (figura 35), con indicación de sus valores óptimos (líneas de división). Áreas azul claro: condiciones climáticas actuales de los yacimientos de San Pedro de Maceda (S.P.M.) y Esmoriz (Ninyerola et al., 2005). T: temperatura media anual (ºC). Ten: temperatura media de enero (ºC). P: precipitación media anual (mm) (Ruiz de la Torre & Ceballos, 1979; Gandullo & Sánchez, 1994; Rubio & Sánchez, 2005). Estos resultados reflejan las condiciones climáticas que debieron existir en un área
concreta (San Pedro de Maceda y Esmoriz) entre los ~34000 / ~20000 años BP (figura
36A). Otros estudios paleobotánicos que detectan macrorrestos del mismo grupo
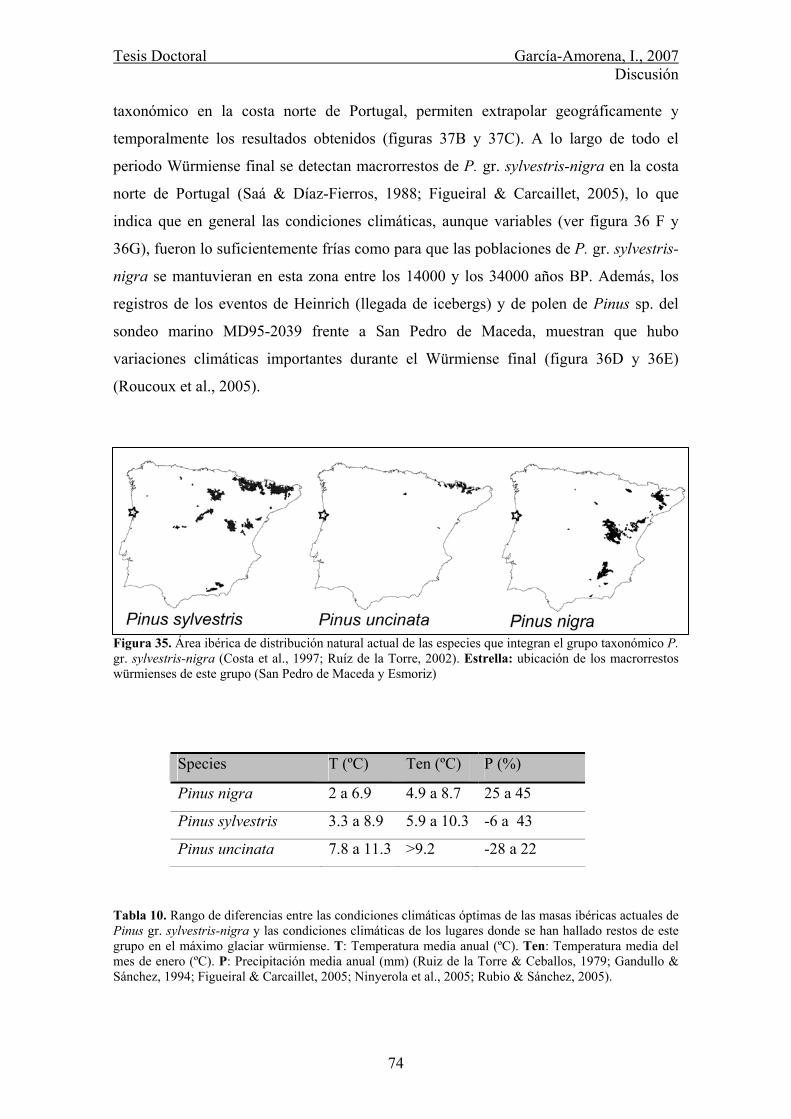
Tesis Doctoral García-Amorena, I., 2007 Discusión
74
taxonómico en la costa norte de Portugal, permiten extrapolar geográficamente y
temporalmente los resultados obtenidos (figuras 37B y 37C). A lo largo de todo el
periodo Würmiense final se detectan macrorrestos de P. gr. sylvestris-nigra en la costa
norte de Portugal (Saá & Díaz-Fierros, 1988; Figueiral & Carcaillet, 2005), lo que
indica que en general las condiciones climáticas, aunque variables (ver figura 36 F y
36G), fueron lo suficientemente frías como para que las poblaciones de P. gr. sylvestris-
nigra se mantuvieran en esta zona entre los 14000 y los 34000 años BP. Además, los
registros de los eventos de Heinrich (llegada de icebergs) y de polen de Pinus sp. del
sondeo marino MD95-2039 frente a San Pedro de Maceda, muestran que hubo
variaciones climáticas importantes durante el Würmiense final (figura 36D y 36E)
(Roucoux et al., 2005).
Figura 35. Área ibérica de distribución natural actual de las especies que integran el grupo taxonómico P. gr. sylvestris-nigra (Costa et al., 1997; Ruíz de la Torre, 2002). Estrella: ubicación de los macrorrestos würmienses de este grupo (San Pedro de Maceda y Esmoriz)
Tabla 10. Rango de diferencias entre las condiciones climáticas óptimas de las masas ibéricas actuales de Pinus gr. sylvestris-nigra y las condiciones climáticas de los lugares donde se han hallado restos de este grupo en el máximo glaciar würmiense. T: Temperatura media anual (ºC). Ten: Temperatura media del mes de enero (ºC). P: Precipitación media anual (mm) (Ruiz de la Torre & Ceballos, 1979; Gandullo & Sánchez, 1994; Figueiral & Carcaillet, 2005; Ninyerola et al., 2005; Rubio & Sánchez, 2005).
Species T (ºC) Ten (ºC) P (%)
Pinus nigra 2 a 6.9 4.9 a 8.7 25 a 45
Pinus sylvestris 3.3 a 8.9 5.9 a 10.3 -6 a 43
Pinus uncinata 7.8 a 11.3 >9.2 -28 a 22
Tesis Doctoral García-Amorena, I., 2007 Discusión
75
En cuanto a precipitación, los macrorrestos pleistocenos encontrados en San Pedro
de Maceda y Esmoriz permiten suponer unos valores no inferiores a 600 mm (figura
34). En cambio, actualmente se reciben 1110 ± 130 mm de media anual en San Pedro
de Maceda y Esmoriz (figura 34). Por tanto, estos datos indican que de haber una
reducción en la precipitación, ésta no sería superior a al 45% entre el máximo glaciar
würmiense y la actualidad (figura 34 y tabla 10) (Ruiz de la Torre & Ceballos, 1979;
Gandullo & Sánchez, 1994; Figueiral & Carcaillet, 2005; Ninyerola et al., 2005; Rubio
& Sánchez, 2005).
Otros datos disponibles para el interior de la Península muestran una reducción en la
precipitación para el máximo glaciar würmiense de hasta el 60% en comparación con la
actualidad (Frenzel et al., 1992; Peyron et al., 1998). La variación de la precipitación
entre el máximo glaciar würmiense y la actualidad fue por tanto mayor en el interior
peninsular que en las costas del norte de Portugal, como apoya la insignificante
proporción de taxones xerofíticos registrados en las costas occidentales de la Península
Ibérica durante el máximo glaciar würmiense (Allen et al., 1996; van der Knaap & van
Leeuwen, 1997; Ramil-Rego et al., 1998a; Muñoz-Sobrino et al., 2001).

Tesis Doctoral García-Amorena, I., 2007 Discusión
76
Figura 36. A: edad de los macrorrestos leñosos de P. gr. sylvestris-nigra de San Pedro de Maceda y Esmoriz, y B: de los carbones del mismo grupo encontrados en yacimientos arqueológicos próximos a la costa norte de Portugal (Figueiral & Carcaillet, 2005). C: Porcentajes absolutos de Pinus en el yacimiento de Mougás (Saá & Díaz-Fierros, 1988). D: Eventos de Heinrich en el sondeo marino MD95-2039 (Roucoux et al., 2005), con sus porcentajes polínicos de Pinus (E) y el δ18O planctónico (F). E: temperatura (ºC) deducida a partir del δ18O – GRIP (72.58ºN 37.64ºO) (Johnsen et al., 2001).

Tesis Doctoral García-Amorena, I., 2007 Discusión
77
6.4.2. Holoceno
La reconstrucción paleofitogeográfica basada en los datos paleobotánicos
procedentes de la costa Atlántica de la mitad septentrional peninsular (apartado 5.2),
refleja en general una homogeneidad climática a lo largo del Holoceno. Esta
homogeneidad caracteriza el presente estadío interglaciar en comparación con otros
anteriores (Petit et al., 1999). No obstante, a lo largo de este periodo se observan una
serie de fluctuaciones de temperatura (Bond et al., 1997), que han quedado reflejados en
los macrorrestos vegetales estudiados. En este trabajo, el análisis de los parámetros
epidérmicos de los restos foliares de Quercus robur recolectados en los yacimientos de
Merón, Villaviciosa y Pravia, ha permitido extraer la información que contenían sobre
uno de los factores relacionados con la dinámica climática del Holoceno: el CO2.
El estudio de frecuencias estomáticas de los fragmentos foliares citados refleja una
fluctuación cíclica del CO2 atmosférico a lo largo del presente periodo interglaciar, con
las siguientes características (figura 21):
1. Al comienzo del Holoceno se observa una disminución de los valores de CO2
hasta alcanzar un mínimo en 8570 cal BP.
2. Este mínimo se vuelve a registrar unos 6000 años después, en 2830 cal BP.
3. Entre estos dos valores mínimos de CO2 se encuentra un máximo en 5860 cal
BP.
4. Entre los mínimos señalados y el máximo registrado en 5860 cal BP se observa
una variación en la concentración del dióxido de carbono atmosférico de 20
ppmv.
5. Al final del registro, datado en 1120 cal BP, los valores de CO2 retornan a
valores próximos a la media Holocena.
En el patrón descrito, se observan similitudes con distintos registros de temperatura
considerados representativos a nivel ampliamente regional (registros procedentes de
localidades elevadas no influidas por condiciones microclimáticas particulares). Entre
estas similitudes destacan (figura 37):
Un periodo frío al comienzo del Holoceno, con un nivel de CO2 9 ppmv por
debajo de la media holocena (figura 21B). Esta desviación en el dióxido de

Tesis Doctoral García-Amorena, I., 2007 Discusión
78
carbono coincide con una disminución de 0.9ºC en la temperatura media anual
detectada por distintos autores para el mismo periodo (Peñalba et al., 1997; Heiri
et al., 2003).
Un periodo óptimo climático entre los 7000 y los 4000, con un máximo de CO2
de 10.4 ppmv por encima de la media holocena (figura 21B). Este periodo se
caracteriza por una temperatura media anual entre 0.57 y 2.4ºC superior a la
media del Holoceno (Peñalba et al., 1997; Dahl-Jesen et al., 1998; Heiri et al.,
2003; Andersen et al., 2004). Estos valores de temperatura se mantienen más o
menos constantes en algunos registros hasta 3000 años, aunque hay que destacar
la elevada variabilidad regional en la ubicación temporal de este óptimo
climático holoceno (Kaufman et al., 2004; Kaplan & Wolfe, 2006).
Un periodo de enfriamiento entre 0.8 y 0.51ºC por debajo de la temperatura
media anual holocena que culmina a los 2830 años BP (Peñalba et al., 1997;
Dahl-Jesen et al., 1998; Heiri et al., 2003), coincidente con una desviación de -
5.5 ppmv de CO2 con respecto a la media del Holoceno (figura 21B).
Un periodo de calentamiento moderado en 1130 años BP caracterizado por
valores de temperatura media anual entre -0.23 y -0.33ºC por debajo de la
media del Holoceno (Peñalba et al., 1997; Dahl-Jesen et al., 1998; Heiri et al.,
2003). La concentración del CO2 atmosférico aumenta entre los 2830 y 1130
años BP hasta alcanzar -0.09 ppmv respecto a la media del Holoceno (figura
21B).

Tesis Doctoral García-Amorena, I., 2007 Discusión
79
Figura 37. A) fuerza de radiación (W
/m2) (±1·desviación típica) derivada de la variación del C
O2 atm
osférico. B) variación de la tem
peratura anual (ºC) en el
Hem
isferio Norte, derivada de la fuerza de radiación del C
O2 atm
osférico. C) desviación de la tem
peratura media del m
es de julio (ºC) deducida a partir del sondeo
polínico de Quintanar de la Sierra (1470 m
sobre el nivel del mar, sistem
a Ibérico) (Peñalba et al., 1997). D) desviación de la tem
peratura media del m
es de julio (ºC)
deducida a partir del registro de Quironóm
idos de Hinterburgsee (1515 m
sobre el nivel del mar, A
lpes suizos) (Heiri et al., 2003). E
) reconstrucción de la temperatura
media anual (ºC
) del sondeo Borehole-N
GR
IP (Dahl-Jessen et al., 1998). F) δ
18O (‰
) de Borehole-N
GR
IP (Andersen et al., 2004).
Tesis Doctoral García-Amorena, I., 2007 Discusión
80
Estos periodos se pueden relacionar con:
(1) el pulso frío de los 8200 años BP, correspondiente a la descarga de agua del deshielo
del casquete polar de “Laurentia”
(2) el óptimo climático holoceno, registrado entre los 11000 y los 5000 años BP en
función de la región geográfica
(3) el periodo de enfriamiento neoglacial posterior, y
(4) el periodo cálido romano-medieval en torno a los 1000-2000 años BP (Alley et al.,
1999; Martinez-Cortizas et al., 1999; Kaufman et al., 2004; Kaplan & Wolfe, 2006).
Para explicar esta variación climática, existen hasta el momento diversas posturas
que proponen a uno u otro factor como principales agentes responsables (p.e. variación
en la órbita terrestre, dinámica solar, actividad volcánica, composición atmosférica,
dinámica de los casquetes polares, etc; Lowe & Walker, 1997; Crucifix et al., 2002). No
obstante, no existe consenso en torno al papel de cada uno de ellos en la dinámica
climática de nuestro planeta. Nuestros datos indican una relación fuerte entre el cambio
climático y la variación de la concentración del dióxido de carbono en el Holoceno
(figura 37), lo que concuerda con las hipótesis que señalan la concentración de este gas
como uno de los principales factores conductores del clima a escala global (p.e.
Raynauld et al., 1993).
Con objeto de conocer en qué medida participa la variación del CO2 atmosférico en
el cambio climático, podemos cuantificar el efecto invernadero del CO2 mediante la
siguiente fórmula:
⎥⎦⎤
⎢⎣⎡⋅=COCLndF α
donde dF representa la radiación del CO2 en W/m2, α = 5.35, CO representa el nivel de
base de CO2 atmosférico no afectado por las actividades industriales del siglo pasado
(278 ppmv, según las recomendaciones del IPPC, 2001), y C representa la desviación
del de CO2 respecto al CO (Myrhe et al., 1998).
A partir de estos valores (figura 37A) se puede estimar la variación de la
temperatura atribuible a los cambios en la concentración del CO2 atmosférico en el
Tesis Doctoral García-Amorena, I., 2007 Discusión
81
Hemisferio Norte [ )(º CT∆ ] aplicando las estimaciones del modelo ECBilt-CLIO
(Opsteegh et al., 1998; Goosse & Fichefet, 1999): 2/)(º dFCT ≈∆ . Con esta
aproximación podemos observar cómo los 20 ppmv de variación de CO2 atmosférico se
traducen en una variación de temperatura de hasta 0.19ºC a lo largo del Holoceno en el
Hemisferio Norte (figura 37B). Comparando la variación de temperatura debida al CO2,
con la variación de temperatura total sufrida en la misma zona a lo largo del Holoceno
(Peñalba et al., 1997; Dahl-Jesen et al., 1998; Heiri et al., 2003; Andersen et al., 2004),
se deduce que el CO2 es responsable del 10% de la variación total de temperatura tanto
anual como estival.
Pero si bien queda patente la importancia de este gas invernadero como factor
implicado en el cambio climático del Holoceno, también se observa al comparar el
efecto del CO2 con el de la variación de la irradiación solar:
Por tanto, comparando la fuerza radiativa en términos de ºC consecuencia de las
variaciones del CO2 atmosférico (figura 37A) y de la irradiación solar, se deduce que:
1. Que la fluctuación de la concentración del CO2 atmosférico a lo largo del
Holoceno es responsable de una variación en la temperatura media anual
terrestre equiparable al ~20% de la adjudicable a la disminución de la
irradiación solar en el Hemisferio Norte en este periodo.
2. Que la variación de la concentración del CO2 atmosférico a lo largo del
Holoceno, con ~6000 años de frecuencia, tiene un distinto patrón que el de la
variación de la insolación estival recibida a 65ºN en el mismo periodo (~10500
años de frecuencia; Lowe & Walter, 1997). Este diferente comportamiento es
responsable de la distinta ubicación temporal del máximo de cada factor
climático (~6000 años BP para el CO2 atmosférico y ~11000 años BP para la
irradiación solar), y de las tendencias contrapuestas de ambas fuerzas radiativas
a lo largo de la segunda mitad del Holoceno (figuras 21 y 38).
La reducción de la insolación estival recibida a 65ºN durante el Holoceno, considerada como
causa principal de las fluctuaciones climáticas en el Hemisferio Norte (Liu et al., 2003), se
estima a lo largo el Holoceno en 2 W/m2 (figura 39). Esta reducción en la insolación
equivale a 1ºC de disminución en la temperatura media anual (Crucifix et al., 2002).
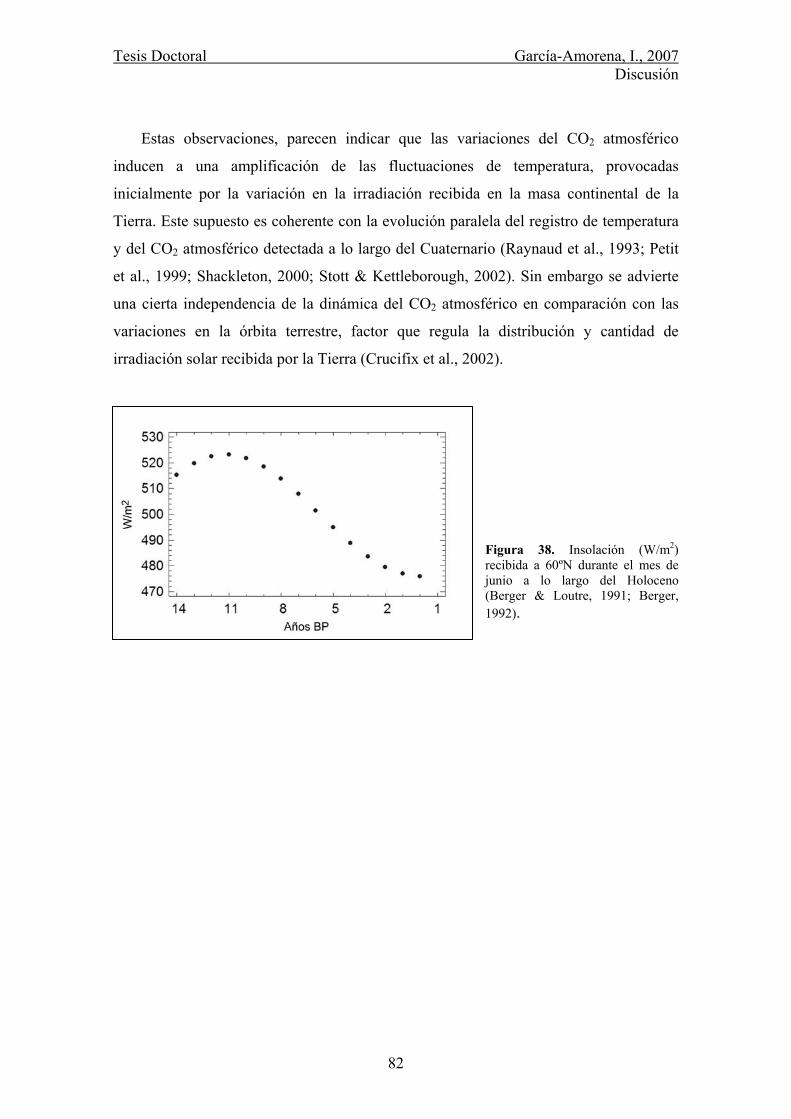
Tesis Doctoral García-Amorena, I., 2007 Discusión
82
Estas observaciones, parecen indicar que las variaciones del CO2 atmosférico
inducen a una amplificación de las fluctuaciones de temperatura, provocadas
inicialmente por la variación en la irradiación recibida en la masa continental de la
Tierra. Este supuesto es coherente con la evolución paralela del registro de temperatura
y del CO2 atmosférico detectada a lo largo del Cuaternario (Raynaud et al., 1993; Petit
et al., 1999; Shackleton, 2000; Stott & Kettleborough, 2002). Sin embargo se advierte
una cierta independencia de la dinámica del CO2 atmosférico en comparación con las
variaciones en la órbita terrestre, factor que regula la distribución y cantidad de
irradiación solar recibida por la Tierra (Crucifix et al., 2002).
Figura 38. Insolación (W/m2) recibida a 60ºN durante el mes de junio a lo largo del Holoceno (Berger & Loutre, 1991; Berger, 1992).
Tesis Doctoral García-Amorena, I., 2007 Conclusiones
83
7. CONCLUSIONES
CALIBRACIÓN CO2-SI
De la medición y el análisis de los parámetros estomáticos en hojas de Quercus robur
por debajo de los 1000 m sobre el nivel del mar, colectados a lo largo de los últimos 100
años, se han obtenido las siguientes conclusiones:
1. Nuestros estudios confirman la relación inversamente proporcional entre el
índice estomático (SI) y la concentración de CO2 atmosférico, en el rango 295-
330 ppmv.
2. La relación entre los valores de CO2 y el índice estomático responde al modelo
SI=71.09-0.16×CO2, con un coeficiente de variación R2=77%.
3. Para una misma concentración de CO2 se observa una diferencia de 3.5% en el
índice estomático entre poblaciones holandesas y españolas. Esta diferencia debe
relacionarse con la distinta irradiación solar recibida entre estas dos regiones
geográficas.
4. Dicha consideración permite que el modelo SI= -10.8-0.12×CO2+1.25×I con un
coeficiente de variación R2=77%, donde I representa la irradiación media
mensual (W/m2), sea extrapolable a regiones geográficas sin modelos
disponibles,
5. Las variaciones observadas en la longitud del poro estomático (PL) y la longitud
estomática (SL) sugieren una relación directamente proporcional al incremento
de la concentración de CO2 atmosférico en el rango 295-320 ppmv. Se propone
el uso del coeficiente estomático (SC=100×PL/SL) como mejor estimador de la
variación del CO2 atmosférico en dicho rango.
Tesis Doctoral García-Amorena, I., 2007 Conclusiones
84
EL CO2 ATMOSFÉRICO EN EL HOLOCENO
De la comparación entre los parámetros estomáticos medidos en los restos foliares de Q.
robur obtenidos en la costa Cantábrica de la Península Ibérica, con el modelo SI-CO2
específicamente desarrollado para esta región geográfica, se concluye que:
1. La concentración de CO2 atmosférico ha variado cíclicamente a lo largo del
Holoceno en ±10 ppmv respecto de la media. En 8570 ± 140 y 2830 ± 180 cal
BP se registran mínimos de concentración de CO2, mientras que en 5860 ± 140
cal BP se encuentran sus máximas concentraciones. Al final del Holoceno, en
1130 ± 220 cal BP, los valores de CO2 vuelven a aumentar hasta aproximarse a
la media Holocena. Estas concentraciones se corresponden respectivamente con
las siguientes fases:
Evento frío 8.2 (hace 8200 años BP)
Óptimo climático holoceno
Periodo de enfriamiento neoglacial
Periodo cálido romano-medieval.
2. La comparación de este patrón de variación de CO2 atmosférico a lo largo del
Holoceno con los registros de paleotemperatura regionales del Hemisferio Norte,
muestra la estrecha relación del mismo con la dinámica climática. La estimación
del efecto invernadero provocada por este gas refleja que la variación de la
concentración del CO2 explica aproximadamente el 10% de la variación de
temperatura sufrida a lo largo de los últimos 10000 años en el Hemisferio Norte.
Igualmente refleja que, entre las causas de esta fluctuación climática, el CO2
explica aproximadamente el 20% de la variación correspondiente a la
disminución de la irradiación solar a lo largo del Holoceno en las latitudes
medias del Hemisferio Norte.
3. La concentración del CO2 atmosférico constituye un agente amplificador de las
variaciones climáticas observadas a escala de 1000 años, con independencia de
los parámetros astronómicos de la órbita terrestre.
Tesis Doctoral García-Amorena, I., 2007 Conclusiones
85
PALEOFITOGEOGRAFÍA DE LAS COSTAS ATLÁNTICAS IBÉRICAS
El estudio de los restos vegetales fósiles (maderas, hojas, frutos y pólenes) extraídos en
18 yacimientos de la costa Atlántica de la Península Ibérica, refleja:
1. La presencia de gran variedad de taxones en ese territorio, a lo largo de los
últimos 34000 años.
2. La existencia de poblaciones de Pinus gr. sylvestris/nigra con Juniperus, en el
máximo glaciar würmiense. Estas poblaciones reflejan unas condiciones
climáticas costeras más áridas y frías que en la actualidad. Las precipitaciones
pudieron reducirse hasta un 45%. Las temperaturas invernales, con descensos
entre 5 y 10ºC para las medias del mes de enero, disminuyeron más que las
anuales, que llegaron a ser entre 2 y 9ºC de media más frías que en la actualidad.
3. A partir del Holoceno no se vuelven a encontrar restos de P. gr. sylvestris/nigra
en yacimientos de la costa estudiada.
4. P. pinaster, que vivió en el último máximo glaciar en las costas atlánticas
portuguesas, alcanza el primer tercio del Holoceno en ese territorio. La
interpretación dada a las poblaciones que actualmente viven en estas zonas
costeras es objeto de activo debate geobotánico; nuestros datos representan un
apoyo a las hipótesis que defienden su origen natural.
5. Taxones planocaducifolios (Quercus robur, Corylus avellana, Fraxinus sp.,
Betula sp., Castanea sp., etc), y lauroides (Arbutus sp., Laurus sp., Ilex, sp., etc),
que vivieron en la costa Atlántica ibérica durante el Würmiense, se mantienen en
la misma durante el Holoceno persistiendo hasta la actualidad. Estos taxones,
junto con las poblaciones würmienses de P. sylvestris-nigra, demuestran que
esta costa ha tenido especial relevancia como refugio de distintas especies
vegetales en épocas glaciales. Otros taxones identificados por primera vez en la
costa cantábrica en cronología prehistórica son: Acer pseudoplatanus, Frangula
alnus y Vitis sp.
Tesis Doctoral García-Amorena, I., 2007 Conclusiones
86
6. La importancia de taxones higrófilos (Alnus glutinosa, Salix atrocinerea,
Populus sp., Fraxinus sp., Sambucus sp., etc) a partir del segundo tercio del
Holoceno es concordante con los fenómenos eustáticos que determinaron la
formación de lagunas litorales de agua dulce en donde pudieron desarrollarse
este tipo de comunidades.
7. Los macrorrestos encontrados han permitido registrar por primera vez la
presencia prehistórica de Ulmus minor.
8. Los caracteres cuticulares de las poblaciones de Quercus robur detectadas en la
costa Atlántica ibérica en el Holoceno, muestran una pequeña proporción de
elementos característicos de Q. petraea, posiblemente debido a los intercambios
genéticos bidireccionales entre las dos especies.

Tesis Doctoral García-Amorena, I., 2007 Bibliografía
87
8. BIBLIOGRAFIA
Ahn, J., Wahlen, M., Deck, B.L., Brook, E.J., Mayewski, P.A., Taylor, K.C. and White,
J.W.C., 2004. A record of atmospheric CO2 during the last 40,000 years from
the Siple Dome, Antarctica ice core. Journal of Geophysical Research, 109:
D13305.
Aira Rodriguez, M.J., 1986. Contribución al estudio de suelos fósiles, de montaña y
antropofenos de Galicia, por análisis polínico, Universidad de Santiago de
Compostela, Santiago de Compostela, 39 pp.
Airal, M. and Vázquez, J., 1985. Nuevos datos palinológicos sobre la agricultura
prehistórica en Galicia (España). Trabalhos de Antropologia e Etnologia, 25(2-
4): 243-252.
Alonso, A. and Pagés, J., 2000. El registro sedimentario del final del Cuaternario en el
litoral noroeste de a Península Ibérica. Márgenes Cantábrico y Atlántico. Revista
de la Sociedad Geológica de España, 13(1): 17-29.
Allen, J., Brandt, U., Brauer, A., Hubberten, H., Huntley, B., Keller, J., Kraml, M.,
Mackensen, A., Mingram, J., Negendank, J., Nowaczyk, N., Oberhansli, H.,
Watts, W., Wulf, S. and Zolitschka, B., 1999. Rapid environmental changes in
southern Europe during the last glacial period. Nature, 400(6746): 740-743.
Allen, J.R., Huntley, B. and Watts, W., 1996. The vegetation and climate of northwest
Iberia over the last 14000 yr. Journal of Quaternary Sciences, 11(2): 125-147.
Alley, R.B. and Clark, P.U., 1999. The deglaciation of the Northern Hemisphere: a
global perspective. Annual Review of Earth and Planetary Sciences, 27(1): 149-
182.
Alley, R.B., Mayewski, P.A., Sowers, T., Stuiver, M., Taylor, K.C. and Clark, P.U.,
1997. Holocene climatic instability; a prominent, widespread event 8200 yr ago.
Geology, 25(6): 483.
Allué, J.L., 1990. Atlas fitoclimático de España: Taxonomías Ministerio de Agricultura,
Pesca y Alimentación, Instituto Nacional de Investigaciones Agrarias, Madrid,
Monografías I.N.I.A. ; 69 pp.
Andersen, K.K., Azuma, N., Barnola, J.M., Bigler, M., Biscaye, P., Caillon, N.,
Chappellaz, J., Clausen, H.B., Dahl-Jensen, D., Fischer, H., Fluckiger, J.,
Tesis Doctoral García-Amorena, I., 2007 Bibliografía
88
Fritzsche, D., Fujii, Y., Goto-Azuma, K., Gronvold, K., Gundestrup, N.S.,
Hansson, M., Huber, C., Hvidberg, C.S., Johnsen, S.J., Jonsell, U., Jouzel, J.,
Kipfstuhl, S., Landais, A., Leuenberger, M., Lorrain, R., Masson-Delmotte, V.,
Miller, H., Motoyama, H., Narita, H., Popp, T., Rasmussen, S.O., Raynaud, D.,
Rothlisberger, R., Ruth, U., Samyn, D., Schwander, J., Shoji, H., Siggard-
Andersen, M.L., Steffensen, J.P., Stocker, T., Sveinbjornsdottir, A.E., Svensson,
A., Takata, M., Tison, J.L., Thorsteinsson, T., Watanabe, O., Wilhelms, F. and
White, J.W.C., 2004. High-resolution record of Northern Hemisphere climate
extending into the last interglacial period. Nature, 431(7005): 147-151.
Aubert, S., Belet, J., Bouchette, A., Otto, T., Deboubat, J., Fortune, M. and Jalut, G.,
2004. Dynamique tardiglaciare et holocène de la végétation à l'étage montagnard
dans les Pyrénées centrales. Ecology, 327: 381-388.
Aura, J.E., Villaverde, V., Morales, M.G., Sainz, C.G., Zilhao, J. and Straus, L.G.,
1998. The Pleistocene/Holocene transition in the Iberian Peninsula: Continuity
and change in human adaptations. Quaternary International, 50: 87-103.
Bacastow, R.B., 1996. The effect of temperature change of the warm surface waters of
the oceans on atmospheric CO 2. Global Biogeochemical Cycles, 10(2): 319-
334.
Bakker, J., 1991. Effects of humidity on stomatal density and its relation to leaf
conductance. Scientia Horticulturae, 48: 205-212.
Barandiarán, I., Freeman, L., González, J. and Klein, R., 1985. Excavaciones en la
cueva del Juyo, Monografía 14. Ministerio de Cultura, Dirección General de
Bellas Artes y Archivos, Madrid, 224 pp.
Bard, E., 2002. Abrupt climate changes over millennial time scales: climate shock.
Physics Today, 55: 32–38.
Bard, E., Arnold, M., Maurice, P., Duprat, J., Moyes, J. and Duplessy, J.C., 1987.
Retreat velocity of the North-Atlantic Polar Front during the last deglaciation
determined by C-14 accelerator mass-spectrometry. Nature, 328(6133): 791-
794.
Barefoot, A. and Hankins, F., 1982. Identification of modern and Tertiary woods.
Clarendon Press, Oxford, 189 pp.
Bazzaz, F.A. and Williams, W.E., 1991. Atmospheric CO2 concentrations within a
mixed forest: implications for seedling growth. Ecology, 12 (1), 12-16.
Tesis Doctoral García-Amorena, I., 2007 Bibliografía
89
Beerling, D. and Chaloner, W., 1992. Stomatal density as an indicator of atmospheric
CO2 concentration. The Holocene, 2: 71-78.
Beerling, D. and Chaloner, W., 1993. The impact of atmospheric CO2 and temperature
change on stomatal density: observations from Quercus robur Lammas leaves.
Annals of Botany, 71: 231-235.
Bennett, K.D., Tzedakis, P.C. and Willis, K.J., 1991. Quaternary refugia of north
European trees. Journal of Biogeography, 18(1): 103-115.
Berger, A., 1992. Orbital Variations and Insolation Database, IGBP PAGES/World
Data Center-A for Paleoclimatology Data Contribution Series 92-007.
NOAA/NGDC Paleoclimatology Program, Boulder CO, USA.
Berger, A. and Loutre, M., 1991. Insolation values for the climate of the last 10 millien
years. Quaternary Science Reviews, 10(4): 297-317.
Birks, H.H., 2003. The importance of plant macrofossils in the reconstruction of
Lateglacial vegetation and climate: examples from Scotland, western Norway,
and Minnesota, USA. Quaternary Science Reviews, 22(5-7): 453-473.
Birks, H. and Birks, H., 2000. Future uses of pollen analysis must include plant
macrofossils. Journal of Biogeography, 27: 31-35.
Birks, H. and Birks, H., 2006. Multi-proxy studies in palaeolimnology. Vegetation
History and Archaeobotany, 15(4): 235-251.
Boessenkool, K.P., Brinkhuis, H., Schonfeld, J. and Targarona, J., 2001. North Atlantic
sea-surface temperature changes and the climate of western Iberia during the last
deglaciation; a marine palynological approach. Global and Planetary Change,
30(1): 33-39.
Bond, G., Broecker, W., Johnsen, S., McManus, J., Labeyrie, L., Jouzel, J. and Bonani,
G., 1993. Correlations between climate records from North-Atlantic sediments
and Greenland ice. Nature, 365(6442): 143-147.
Bond, G., Heinrich, H., Broecker, W., Labeyrie, L., McManus, J., Andrews, J., Huon,
S., Jantschik, R., Clasen, S., Simet, C., Tedesco, K., Klas, M., Bonani, G. and
Ivy, S., 1992. Evidence for massive discharges of icebergs into the North
Atlantic ocean during the last glacial period. Letters to Nature, 360: 245-248.
Bond, G., Showers, W., Cheseby, M., Lotti, R., Almasi, P., deMenocal, P., Priore, P.,
Cullen, H., Hajdas, I. and Bonani, G., 1997. A pervasive millennian-scale cycle
in North Atlantic Holocene and glacial climates. Science, 278: 1257-1266.
Tesis Doctoral García-Amorena, I., 2007 Bibliografía
90
Boyer-Klein, A., 1980. Nouveaux résultats palynologiques de sites solutréens et
magdaléniens cantabriques. Bulletin de la Sociéte Préhistorique Francaise,
70(4): 103-107.
Boyer-Klein, A., 1984. Analyses polliniques cantabriques au Tardiglaciaire. Revue de
Paléobiologie, Volume spécial: 33-39.
Boyer-Klein, A., 1985. Analyse Pollinique de la Grotte d'Erralla. Munibe (Antropología
y Arqueología), 37: 45-48.
Bradshaw, R., 1991. Spatial scale in the pollen record. In: D. Harris and K. Thomas
(Editors), Modelling ecological change. Perspectives from neoecology,
palaeoecology and environmental archaeology. Institute of Archaeology,
University College, London, pp. 41-52.
Bronk Ramsey, C., 2005. OxCal progam v3. 10. Online: http://www. rlaha. ox. ac.
uk/orau/oxcal. html.
Buxó, R., 1997. Arqueología de las plantas. Crítica, Barcelona, 367 pp.
Caillon, N., Severinghaus, J., Jouzel, J., Barnola, J.M., Kang, J. and Lipenkov, V., 2003.
Timing of atmosphric CO2 and Anctarctic temperature changes across
termination III. Science, 299: 1728-1731.
Carlquist, S., 2001. Comparative wood anatomy. Systematic, ecological, and
evolutionary aspects of dicotyledon wood. Springer, Berlin, 448 pp.
Carrión, J.S., Navarro, C., Navarro, J., Munuera, M., 2000. The distribution of cluster
pine (Pinus pinaster) in Spain as derived from palaeoecological data,
relationships with phytosociological classification. The Holocene. 10(2), 243-
252.
Castroviejo, S., Laínz, M., López, G., Monserrat, P., Muñoz, F., Paiva, J. and Villar, L.,
1986-2004. Flora ibérica. Plantas vasculares de la Península Ibérica e Islas
Baleares, I-XV. Real Jardín Botánico, C.S.I.C. Madrid, Madrid.
Cearreta, A., 1994. Análisis micropaleontológico e interpretación palaeoecológica del
relleno sedimentario holoceno en el Estuario del Bidasoa (Golfo de Bizcaia.
Geobios, 27: 271-283.
Cearreta, A., 1999. Holocene sea-level change in the Bilbao estuary (North Spain):
foraminiferal evidence. Micropaleontology, 44: 265-276.
Cearreta, A., Irabien, M., Onaindía, M., Sáiz, J., Amezaga, I., González, J. and Iriarte,
M., 1997. Cambios ambientales en el litoral cantábrico oriental durante el
Tesis Doctoral García-Amorena, I., 2007 Bibliografía
91
Holoceno. In: J. Rodríguez Vidal (Editor), Cuaternario Ibérico / Asociación
Española para el Estudio del Cuaternario (AEQUA)
Ceulemans, R., van Praet, L. and Jiang, X.N., 1995. Effects of CO2 enrichment, leaf
position and clone on stomatal index and epidermal cell density in poplar
(Populus). New Phytologist, 131, 99-107.
Colin Prentice, I., 1986. Vegetation responses to past climatic variation. Plant Ecology,
67(2): 131-141.
Conchon, O., Fulton, R., Faustova, M., Isayeva, L., Majski, J., Porter, S., Spasskaya, I.,
Timirava, S., Velichko, A., Zagwijn, W., Baulin, V., Danilova, N., Nechayev, V.
and Péwé, T., 1992. Glaciation and permafrost about 20.000 to 18.000 yr B.P.,
Atlas of paleoclimates and paleoenvironments of the northern hemisphere. Late
Pleistocene-Holocene. Frenzel, B
Core, H., Côté, W. and Day, A., 1979. Wood structure and identification. Syracuse
University Press, New york, 182 pp.
Costa, M., Morla, C. and Sainz, H., 1997. Los bosques ibéricos. Una interpretación
geobotánica. Planeta, Barcelona, 597 pp.
Costa Tenorio, M., García Antón, M., Morla Juaristi, C. and Sainz Ollero, H., 1990. La
evolución de los bosques de la Península Ibérica: una interpretación basada en
datos paleobiogeográficos. Ecología, Fuera de Serie Nº 1: 31-58.
Crucifix, M., Loutre, M.F., Tulkens, P., Fichefet, T. and Berger, A., 2002. Climate
evolution during the Holocene: a study with an Earth system model of
intermediate complexity. Climate Dynamics, 19(1): 43-60.
Cuffey, K.M., Clow, G.D., Alley, R.B., Stuiver, M., Waddington, E.D. and Saltus,
R.W., 1995. Large arctic temperature-change at the Wisconsin-Holocene glacial
transition. Science, 270(5235): 455-458.
Chao, R.B., Casais, M.C., Cortizas, A.M., Alberti, A.P. and Paz, M.V., 2002. Holocene
evolution on Galician coast (NW Spain): an example of paraglacial dynamics.
Quaternary International, 93-4: 149-159.
Cheddadi, R., Vendramin, G.G., Litt, T., Francois, L., Kageyama, M., Lorentz, S.,
Laurent, J.M., de Beaulieu, J.L., Sadori, L., Jost, A., Lunt, D., 2006. Imprints of
glacial refugia in the modern genetic diversity of Pinus sylvestris. Global
Ecology and Biogeography. 15(3), 271-282.
Tesis Doctoral García-Amorena, I., 2007 Bibliografía
92
Dahl-Jensen, D., Mosegaard, K., Gundestrup, N., Clow, G.D., Johnsen, S.J., Hansen,
A.W. and Balling, N., 1998. Past Temperatures Directly from the Greenland Ice
Sheet. Science, 282(5387): 268-271.
Dallwitz, M., Paine, T. and Zurcher, E., 1993 onwards. User’s guide to the DELTA
System: a general system for processing taxonomic descriptions, pp.
http://biodiversity.uno.edu/delta/.
Dansgaard, W., Johnsen, S.J., Clausen, H.B., Dahljensen, D., Gundestrup, N.S.,
Hammer, C.U., Hvidberg, C.S., Steffensen, J.P., Sveinbjornsdottir, A.E., Jouzel,
J. and Bond, G., 1993. Evidence for general instability of past climate from a
250-Kyr ice-core record. Nature, 364(6434): 218-220.
Davis, B., Brewer, S., Stevenson, A. and Guiot, J., 2003. The temperature of Europe
during the Holocene reconstructed from pollen data. Quaternary Science
Reviews, 22(15-17): 1701-1716.
De Beaulieu, J.L. and Reille, M., 1984. A long Upper Pleistocene pollen record from
Les Echets, near Lyon, France. Boreas, 13(2): 111-132.
De Beaulieu, J.L. and Reille, M., 1992. The last climatic cycle at La-Grande Pile
(Vosges, France) a new pollen profile. Quaternary Science Reviews, 11(4): 431-
438.
de Palacios, P., 1997. Anatomía de maderas de coníferas a nivel de especieregión
norteamericana y europea Universidad Politécnica de Madrid, Madrid 2 v. pp.
de Vernal, A., Eynaud, F., Henry, M., Hillaire-Marcel, C., Londeix, L., Mangin, S.,
Matthiessen, J., Marret, F., Radi, T., Rochon, A., Solignac, S. and Turon, J.,
2005. Reconstruction of sea-surface conditions at middle to high latitudes of the
Northern Hemisphere during the Last Glacial Maximum (LGM) based on
dinoflagellate cyst assemblages. Quaternary Science Reviews, 24: 897–924.
Dias, J.M.A., Boski, T., Rodrigues, A. and Magalhaes, F., 2000. Coast line evolution in
Portugal since the Last Glacial Maximum until present - a synthesis. Marine
Geology, 170(1-2): 177-186.
Díaz-Fernández, P.M., Jiménez, P., Martín, S., De Tuero, M., Gil, L., 1995. Regiones
de procedencia de Quercus robur L., Quercus petraea (Matt) Liebl. y Quercus
humilis Miller. ICONA, Madrid.
Tesis Doctoral García-Amorena, I., 2007 Bibliografía
93
Díaz Losada, E., González Porto, A. and Saa Otero, P., 1990. Aportación al
conocimiento paleoecológico del Holoceno en el NW de la Península Ibérica.
Anales de la Asociación de Palinólogos de Lengua Española, 5: 5-10.
Draper, N. and Smith, H., 1981. Applied regression analysis, second edition. John
Wiley & Sons, New York, 709 pp.
Duplessy, J.C., Bard, E., Labeyrie, L., Duprat, J. and Moyes, J., 1993. Oxygen-isotope
records and salinity changes in the northeastern Atlantic-Ocean during the last
18,000 Years. Paleoceanography, 8(3): 341-350.
Duplessy, J.C., Delibrias, G., Turon, J.L., Pujol, C. and Duprat, J., 1981. Deglacial
warming of the norteastern atlantic ocean: correlation with the paleoclimatic
evolution of the european continent. Palaeogeography Palaeoclimatology
Palaeoecology, 35: 121-144.
Dupré Ollivier, M., 1980. Palinología de los niveles VII a II. In: J. Altuna and J. Merino
(Editors), El yacimiento prehistórico de la cueva de Ekain (Deba, Guipúzcoa).
Eusko Ikaskuntza, Sociedad de Estudios Vascos, pp. 61-351.
Ezquerra, F. and Gil, L., 2004. La transformación histórica del paisaje forestal en
Cantabria. Tercer Inventario Forestal Nacional. Organismo Autónomo Parques
Nacionales, Ministerio de Medio Ambiente, Madrid, 161 pp.
Faegri, K. and Iversen, J., 1989. Textbook of pollen analysis. John Wiley, Chichester,
328 pp.
Ferris, R. and Taylor, G., 1994. Stomatal characteristics of four native herbs following
exposure to elevated CO2. Annals of Botany, 73: 447-453.
Figueiral, I., 1995. Charcoal analysis and the history of Pinus pinaster (cluster pine) in
Portugal. Review of Palaeobotany and Palynology, 89: 441-454.
Figueiral, I., 1999. Lignified and charcoalified fossil wood. In: D. Harris and K.
Thomas (Editors), Modelling ecological change. Perspectives from neoecology,
palaeoecology and environmental archaeology. Institute of Archaeology,
University College, London, pp. 92-96.
Figueiral, I. and Carcaillet, C., 2005. A review of Late Pleistocene and Holocene
biogeography of highland Mediterranean pines (Pinus type sylvestris) in
Portugal, based on wood charcoal. Quaternary Science Reviews, 24(23-24):
2466-2476.
Tesis Doctoral García-Amorena, I., 2007 Bibliografía
94
Figueiral, I. and Terral, J., 2002. Late Quaternary refugia of Mediterranean taxa in the
Portuguese Estremadura: charcoal based paleovegatation and climatic
reconstruction. Quaternary Science Reviews, 21: 549-558.
Filella, I. and Peñuelas, J., 1999. Altitudinal differences in UV absorvance, UV
reflectance and related morphological traits of Quercus ilex and Rhododendron
ferrugineum in the Mediterranean region. Plant Ecology, 145: 157-165.
Font Tullot, I., 1983. Atlas climático de España. Ministerio de Transportes, Turismo y
Comunicaciones, Instituto Nacional de Meteorología, Madrid, pp. 43 lam.
Frenzel, B., Pècsi, M. and Velichko, A.A., 1992. Atlas of palaeoclimates and
palaeoenvironments of the Northern Hemisphere. Late Pleistocene-Holocene.
Geographical Research Institute, Hungarian Academy of Science, Budapest
Budapest-Stuttgart, pp. 1-79.
Gandullo, J.M. and Sánchez, O., 1994. Estaciones ecológicas de los pinares españoles.
Ministerio de Agricultura Pesca y Alimentación. ICONA., 188 pp.
García-Amorena, I., 1998. Estudio paleobotánico de los yacimientos holocenos
intermareales de Cantabria: Consideraciones Paleofotogeográficas. Universidad
Politécnica de Madrid, Escuela Técnica Superior de Ingenieros de Montes,
Madrid.
García-Amorena, I., 2002. Estudio preliminar del valor diagnóstico de caracteres
foliares para la identificación de taxones en los géneros Quercus L. (Fagaceae)
y Pinus L. (Pinaceae). Su aplicación en paleobotánica., Escuela Técnica de
Ingenieros de Montes. Universidad Politécnica de Madrid, Madrid.
García-Amorena, I., Wagner, F., van Hoof, T. and Gómez Manzaneque, F., 2006.
Stomatal responses in deciduous oaks from southern Europe to the
anthropogenic atmospheric CO2 increase; refining the stomatal-based CO2
proxy. Review of Palaeobotany and Palynology, 141(3-4): 303-312.
García Antón, M., Gil Romera, G., Pagés, J.L. and Alonso Millán, A., 2006. The
Holocene pollen record in the Villaviciosa Estuary (Asturias, North Spain).
Palaeogeography Palaeoclimatology Palaeoecology, 237(2-4): 280-292.
García Antón, M., Maldonado, J., C, M. and Sainz Ollero, H., 2002. Fitogeografía
histórica de la península Ibérica. In: F. Pineda, J. De Miguel and M. Casado
(Editors), La Diversidad Biológica de España. Prentice Hall, Madrid [...], pp. 45-
63.

Tesis Doctoral García-Amorena, I., 2007 Bibliografía
95
García, L., de Palacios, P., Guindeo, A., García, L., Lázaro, I., González, L., Rodríguez,
Y, García, F, Bobadilla, I. and Camacho, A., 2002. Anatomía e identificación de
maderas de coníferas a nivel de especie. Fundación Conde del Valle de Salazar
& Ediciones Mundi-prensa, Madrid, Madrid, 421 pp.
García, L. and Guideo, A., 1988. Anatomía e identificación de las maderas de coníferas
españolas. AITIM, Madrid, 142 pp.
García, L., Guindeo, A. and de Palacios, P., 1996. Madera de coníferas. Fundación
Conde del Valle de Salazar, Madrid, 349 pp.
Garzón, G., Alonso, A., Torres, T. and Llamas, J., 1996. Edad de las playas colgadas y
de las turberas de Oyambre y Merón (Cantabria). Geogaceta, 20(2): 498-501.
Génova, M. and Martínez-Morillas, D., 2002. Estudio dendrocronológico de Pinus nigra
en Checa (Guadalajara). Ecología, 16: 83-95.
Gil, L., Fuentes-Utrilla, P., Soto, A., Cervera, M.T. and Collada, C., 2004. English elm
(Ulmus procera) is a 2000-year-old Roman clone. Nature, 431: 1035.
Gómez-Orellana, L., 2002. El Último ciclo glaciar-interglaciar en el litoral del NW
ibérico: dinámica climática y paisajística, Universidad de Santiago de
Compostela, España, 356 pp.
Goosse, H. and Fichefet, T., 1999. Importance of ice-ocean interactions for the global
ocean circulation: A model study. JGR-Oceans, 104(C10): 23,337.
Grace, J., Ford, E. and Jarvis, P., 1981. Plants and their atmospheric environment.
Blackwell, Oxford-London-Edimburgh.
Granja, H.M., 1999. Evidence for Late Pleistocene and Holocene sea-level, neotectonic
and climate control in the coastal zone of northwest Portugal. Geologie en
Mijnbouw. 77, 233-245.
Granja, H. and De Groot, T., 1996. Sea-level rise and neotectonism in a holocene
coastal environment at Cortegaça beach (NW Portugal): a case study. Journal of
coastal research, 12(1): 160-170.
Granja, H.M., De Groot, T.H., Costa, A.L., 2006. Evidence for Pleistocene wet aeolian
dune and interdune accumulation, San Pedro de Maceda, NW Portugal.
Sedimentology. Submitted.
Greguss, P., 1945. The identification of Central-European dicotyledonous trees and
shrubs based on xylotomy. The Hungarian Museum of natural History,
Budapest, 183 pp.
Tesis Doctoral García-Amorena, I., 2007 Bibliografía
96
Greguss, P., 1955. Identification of living gymnosperms on the basisof xylotomy.
Akadémiai Kiado, Budapest, 263 pp.
Greguss, P., 1959. Holzanatomie der Europäischen laubhölzer und sträucher.
Akadémiai Kiado, Budapest, 330 pp.
GRIP members, 2004. High-resolution record of Northern Hemisphere climate
extending into the last interglacial period. Nature. 431(7005), 147-151.
Group, L.A.W., 1999. Manual of leaf architecture - morphological description and
categorization of dicotyledonous and net-veined monocotiledonous
angiosperms, Washington, D.C, 65 pp.
Group, T.I.W., 2004-onwards. InsideWood, pp. http://insidewood/ lib.ncsu.edu/search.
Guindeo, A. and García, L., 1989. Anatomía de las maderas de frondosas españolas.
AITIM, Madrid, 618 pp.
Gutiérrez Elorza, M., 1994. Geomorfología de España. Rueda, Madrid, 526 pp.
Guy, J., 2003. Towards a physical based model of CO2-induced stomatal frequency
response. New phytologist 57: 391-398.
Heiri, O. and Lotter, A.F., 2003. 9000 years of chironomid assemblage dynamics in an
Alpine lake: long-term trends, sensitivity to disturbance, and resilience of the
fauna. Journal of Paleolimnology, 30(3): 273-289.
Heiss, A.G., 2003. Anatomy of European and North American woods - an interactive
identification key, pp.
http://homepage.uibk.ac.at/homepage/c717/c717189/eng/wood_eng.html.
Hewitt, G.M., 1999. Post-glacial re-colonization of European biota. Biological Journal
of the Linnean Society, 68(1-2): 87-112.
Hultine, K. and Marshall, J., 2000. Altitude trends in conifer leaf morphology and stable
carbon isotope composition. Oecologia, 123: 32-40.
Huntley, B., 1990a. European post-glacial forests: compositional changes in response to
climatic change. Journal of Vegetation Science, 1: 507-518.
Huntley, B., 1990b. European vegetation history: palaeovegetation maps from pollen
data - 13000 yr BP to present. Journal of Quaternary Sciences, 5(2): 103-122.
Huntley, B. and Birks, H.J.B., 1983. An atlas of past and present pollen maps for
Europe : 0 - 13000 years ago Cambridge University Press, Cambridge [etc.], 667
pp.
Tesis Doctoral García-Amorena, I., 2007 Bibliografía
97
Huntley, B. and Prentice, I.C., 1988. July temperatures in Europe from pollen data,
6000 years before present. Science, 241(4866): 687-690.
Indermühle, A., Stocker, T., Joos, F., Fischer, H., Smith, H., Wahlen, M., Deck, B.,
Mastroianni, D., Tschumi, J., Blunier, T., Meyer, R. and Stauffer, B., 1999.
Holocene carbon-cycle dynamics based on CO2 trapped in ice at Taylor Dome,
Antarctica. Nature, 398: 121-126.
IPCC, 2001. Climate change 2001: impacts adaptation and vulnerability. Summary for
policymakers. Intergovernmental Panel on Climate Change. Cambridge
University Press, Cambridge.
Iriarte, M., 2000a. Antropización del paisaje y economía de producción en Euskal
Heeria durante el primer milienio a.C. In: M.d.A.d. Catalunya (Editor), Els
productes alimentaris d'origen vegetal a l'edat del Ferro de l'Europa Occidental:
de la producció al consum, Girona, pp. 18, 117-126.
Iriarte, M., 2000b. El entorno vegetal del yacimiento paleolítico de Labeko Koba
(Arrasate, País Vasco): análisis polínico. Munibe (Antropología-Arkeología),
52: 89-16.
Iriarte, M., 2001. El entorno vegetal de los pobladores prehistóricos de Aizpea: análisis
polínico. Anejos de Veleia, Series maior 10: 315-323.
Iriarte, M., 2003. Man made landscape during the Holocene in the Basque country. In:
R.Z.M.e. al. (Editor), Quaternary climatic changes and environmental crises in
the Mediterranean Region. Alcalá de Henares (Madrid): Universidad de Alcalá,
pp. 23-33.
Iriarte, M. and Arrizabalaga, A., 2003. El bosque en el País Vasco prehistórico.
Cuadernos de la Sociedad Española de Ciencias Forestales, 16: 85-90.
Isturiz, M. and Sánchez, M., 1990. Investigaciones palinológicas en la prehistoria vasca.
Munibe (Antropologia - Arkeologia), 42: 277-285.
Iversen, I., 1964. Retrogressive Vegetation Succession in the Post-Glacial. The Journal
of Animal Ecology, 33(British Ecological Society Jubilee Symposium): 59-70.
Iversen, J., 1958. The bearings of glacial and interglacial epochs on the formation and
extinction of plant taxa. In: O. Hedberg (Editor), Systematics of Today. Acta
Universitalis Upsalensis, pp. 210-215.
Tesis Doctoral García-Amorena, I., 2007 Bibliografía
98
Izco, J., Barreno, E., Brugués, M., Costa, M., Devesa, J., Fernández, F., Gallargdo, T.,
LLimona, X., Salvo, E., Talavera, S. and Valdés, B., 1998. Botánica. McGraw-
Hill, Interamericana, Madrid [etc], 781 pp.
Jacquiot, C., 1955. Atlas d'anatomie des bois des conifères. Centre Technique du Bois,
Paris, 133 pp.
Jacquiot, C., Trenard, Y. and Dirol, D., 1973. Atlas d'anatomie des angiospermes
(essences feuillues). Centre Technique du Bois, Paris, 174 pp.
Jalas, J. and Suominen, J., 1976. Atlas florae europaeae: distribution of vascular plants
in Europe. Vol. 3, Salicaceae to Balanophoraceae. Committee for Mapping the
Flora of Europe, Helsinki.
Jane, F., 1956. The structure of wood. Adam & Charles Black, London, 427 pp.
Jessen, C.A., Rundgren, M., Bjorck, S. and Hammarlund, D., 2005. Abrupt climatic
changes and an unstable transition into a late Holocene Thermal Decline: a
multiproxy lacustrine record from southern Sweden. Journal of Quaternary
Science, 20(4): 349-362.
Johnsen, S., Dahl-Jensen, D., Gundestrup, N., Steffensen, J., Clausen, H., Miller, H.,
Masson-Delmotte, V., Sveinbjörnsdotttir, A. and White, J., 2001. Oxygen
isotope and palaeotemperature records from six Greenland ice-core stations:
Camp Century, Dye-3, GRIP, GISP2, Renland and NorthGRIP. Journal of
Quaternary Science, 16(4): 299–307.
Jones, H., 1992. Plants and microclimate. Cambridge University Press, Cambridge.
Jones, J.H., 1986. Evolution of the Fagaceae - the implications of foliar features. Annals
of the Missouri Botanical Garden, 73(2): 228-275.
Jones, T. and Rowe, N., 1999. Fossil plants and spores. Modern techniques. Geological
Society, London, 396 pp.
Jones, H.G., 1998. Stomatal control of photosynthesis and transpiration. Journal of
Experimental Botany, 49, 387-398.
Kallel, N., Paterne, M., Labeyrie, L., Duplessy, J.C. and Arnold, M., 1997. Temperature
and salinity records of the Tyrrhenian Sea during the last 18,000 years.
Palaeogeography Palaeoclimatology Palaeoecology, 135(1-4): 97-108.
Kaplan, M.R. and Wolfe, A.P., 2006. Spatial and temporal variability of Holocene
temperature in the North Atlantic region. Quaternary Research, 65: 223-231.

Tesis Doctoral García-Amorena, I., 2007 Bibliografía
99
Kaufman, D.S., Ager, T.A., Anderson, N.J., Anderson, P.M., Andrews, J.T., Bartlein,
P.J., Brubaker, L.B., Coats, L.L., Cwynar, L.C. and Duvall, M.L., 2004.
Holocene thermal maximum in the western Arctic (0–180 W). Quaternary
Science Reviews, 23: 529–560.
Keeling, C. and Whorf, T., 2002. Atmospheric CO2 concentrations – Mauna Loa
Observatory, Hawaii. 1958-2001.
Kerp, H., 1990. The study of fossil gymnosperms by means of cuticular analysis.
Palaios, 5: 548-569.
Kerp, H. and Krigs, M., 1999. Light microscopy of cuticles. In: T. Jones and N. Rowe
(Editors), Fossil plants and spores. Modern techniques. The Geological Society,
London, pp. 52-56.
Kirilenko, A., Belotelov, N. and Bogatyrev, B., 2000. Global model of vegetation
migration: incorporation of climatic variability. Ecological Modelling, 132: 125-
133.
Körner, Ch., Bannister, P. and Mark, A.F., 1986. Altitudinal variation in stomatal
conductance, nitrogen content and leaf anatomy in different plant life forms in
New Zealand. Oecologia, 69, 577-588.
Kostina, E., Wuff, A. and Julkunen-Tiitto, R., 2001. Growth, structure, stomatal
responses and secondary metabolites of birch seedlings (Betula pendula) under
elevated UV-B radiation in the field. Trees, 15, 483-491.
Kouwenberg, L., 2004. Aplication of conifer needles in the reconstruction of Holocene
CO2 levels, Utrecht University, The Netherlands, 130 pp.
Kouwenberg, L.L.R., McElwain, J.C., Kürschner, W.M., Wagner, F., Beerling, D.J.,
Mayle, F.E. and Visscher, H., 2003. Stomatal frequency adjustment of four
conifer species to historical changes in atmospheric CO2. American Journal of
Botany, 90, 610-619.
Kouwenberg, L., Wagner, R., Kürschner, W. and Visscher, H., 2005. Atmospheric CO2
fluctuations during the last millennium reconstructed by stomatal frequency
analysis of Tsuga heterophylla needles. Geology, 33(1): 33-36.
Koziol, M.J., 1984. Interactions of gaseous pollutants with carbohydrate metabolism.
In: M.J. Koziol and F.R. Whatley (Editors), Gaseous Air Pollutants and Plant
Metabolism. Butterworths, London, pp. 251-273.
Tesis Doctoral García-Amorena, I., 2007 Bibliografía
100
Kürschner, W.M., 1996. Leaf stomata as biosensor of palaeoatmospheric CO2 levels.
Ph.D Thesis, Laboratory of Palaeobotany and Palynology, Utrecht University,
The Netherlands. LPP Contribution Series, 5, 153 pp.
Kürschner, W., 1997. The anatomical diversity of recent and fossil leaves of the
durmast oak (Quercus petraea Lieblein/Q. pseudocastanea Goeppert)-
implications for their use as biosensors of palaeoatmospheric CO2 levels.
Review of Palaeobotany and Palynology, 96: 1-30.
Kürschner, W., 2001. Leaf sensor for CO2 in deep time. Nature, 411: 247-248.
Kürschner, W.M., Wagner, F., Visscher, E.H. and Visscher, H., 1997. Predicting the
response of leaf stomatal frequency to a future CO2-enriched atmosphere:
constraints from historical observations. Geologische Rundschau, 86, 512-517.
Kürschner, W., Stulen, I., Wagner, F. and Kuiper, P., 1998. Comparison of
palaeobotanical observations with experimental data on the leaf anatomy of
durmast oak [Quercus petraea (Fagaceae)] in response to environmental
change. Annals of Botany, 81: 657-664.
Küster, H., 1991. Phytosociology and archaeobotany. In: D. Harris and K. Thomas
(Editors), Modelling ecological change. Perspectives from neoecology,
palaeoecology and environmental archaeology. Institute of Archaeology,
University College, London, pp. 17-26.
Lambeck, K., Esat, T. and Potter, E., 2002. Links between climate and sea levels for the
past three million years. Nature, 419: 199-206.
Leira, M., Santos, L., 2002. An early Holocene short climatic event in the nortwest
Iberian Peninsula inferred from pollen and diatoms. Quaternary International.
93-94, 3-12.
Lezine, A.M. and Denefle, M., 1997. Enhanced anticyclonic circulation in the eastern
North Atlantic during cold intervals of the last deglaciation inferred from deep-
sea pollen records. Geology, 25(2): 119-122.
Liu, Z., Brady, E. and Lynch-Stieglitz, J., 2003. Global ocean response to orbital
forcing in the Holocene. Paleoceanography, 18(2): 1041.
Lockheart, M.J., Poole, I., van Bergen, P.F. and Evershed, R.P., 1998. Leaf carbon
isotope compositions and stomatal characters: important considerations for
palaeoclimate reconstruction. Organic Geochemistry, 29 (4), 1003-1008.
Tesis Doctoral García-Amorena, I., 2007 Bibliografía
101
López, G., 2001. Los árboles y arbustos de la Península Ibérica e Islas Baleares. Mundi
Prensa, Madrid, Madrid, 1727 pp.
López, P., 1981. Análisis polínico del yacimiento de los Azules (Cangas de Onis,
Oviedo). Botánica Macaronésica, 8-9: 243-248.
López, P., 1982. Abauntz: análisis polínico. Arqueología Navarra, 3: 355-358.
López, P., López, J., Aira, M. and Saa, P., 1993. Análisis paleobotánico de cinco
yacimientos arqueológicos de la Sierra de Bocelo (La Coruña, Galicia). Anales
de la Asociación de Palinólogos de Lengua Española, 6: 59-73.
López, R.A., 2000. Paleobotánica de los olmos. In: L. Gil, A. Solla and S. Iglesias
(Editors), Los olmos ibéricos. Conservación y mejora frente a la grafiosis.
Ministerio de Medio Ambiente. DGCONA, Madrid, pp. 432.
López Sáez, J.A., López, P. and Martín Sánchez, M., 2002. Palaeoecology and
Holocene environmental change from a saline lake in south-west
Spain:protohistorical vegetation in Cádiz By. Quaternary International, 93-
94(197-206).
Lowe, J.J. and Walker, M.J.C., 1997. Quaternary environments. Pearson-Prentice Hall,
Harlow, England [...], 446 pp.
McElwain, J.C., Mayle, F.E. and Beerling, D.J., 2002. Stomatal evidence for a decline
in atmospheric CO2 concentration during the Younger Dryas stadial: a
comparison with Antarctic ice core records. Journal of Quaternary Science,
17(1): 21-29.
McElwain, J.C., 2004. Climate-independent paleoaltimetry using stomatal density in
fossil leaves as a proxy for CO2 partial pressure. Geology, 32, 1017-1020.
Madeyska, T. and Kurenkov, E., 1992. Human occupation about 24.000 to 15.000 yr
B.P., Atlas of paleoclimates and paleoenvironments of the northern hemisphere.
Late Pleistocene-Holocene. Frenzel, B
Mansfield, T.A. and Freer-Smith, P.H., 1984. The role of stomata in resistance
mechanisms. In: M.J. Koziol and F.R. Whatley (Editors), Gaseous Air Pollutants
and Plant Metabolism. Butterworths, London, pp. 131–146.
Mariscal, B., 1993. Variación de la vegetación holocena (4300-280 B.P.) de Cantabria
a través del análisis polínico de la turbera de Alsa. Estudios Geológicos, 49: 63-
68.
Tesis Doctoral García-Amorena, I., 2007 Bibliografía
102
Martinez-Cortizas, A., Pontevedra-Pombal, X., Garcia-Rodeja, E., Novoa-Munoz, J.C.
and Shotyk, W., 1999. Mercury in a Spanish peat bog: Archive of climate
change and atmospheric metal deposition. Science, 284(5416): 939-942.
Martínez Cortizas, A., Mighall, T., Pontevedra Pombal, X., Nóvoa Muñoz, J.C.,
Peteado Varela, E. and Piñeiro Rebolo, R., 2005. Linking changes in
atmospheric dust deposition, vegetation change and human activities in
northwest Spain during the last 5300 years. Holocene, 15(5): 698-706.
Martinson, D., Pisias, N., Hays, J., Imbrie, J., Moore, T. and Shackleton, N., 1987. Age
dating and the orbital theory of the Ice Ages - development of a high-resolution-
0 to 300,000-year chronostratigraphy. Quaternary Research, 27(1): 1-29.
Mary, G., 1973. Un diagramme sporopollinique et des datations C-14 pour la tourbiére
du Llano de Roñanzas Asturias (España). Boletín de la Sociedad Geológica
Francesa, 25: 38.
Mary, G., 1983. Evolución del márgen costero de la cordillera Cantábrica en Asturias
desde el Mioceno. Trabajos de Geología. Universidad de Oviedo, 13: 3-35.
Mary, G., 1990. La evolución del litoral cantábrico durante el Holoceno. In: U.P. Vasco
(Editor), The environment and the human socety in the western Pyrenees and the
Basque Mountains during the Upper Pleistocene and the Holocene, País Vasco,
pp. 81-87.
Mary, G., Medus, J and Delibrias, G., 1975. Le Quaternaire de la cote asturienne
(Espagne). Bulletin de l'Association française pour l'Etude du Quaternaire, 1:
13-23.
Masson-Delmotte, V., Landais, A., Stievenard, M., Cattani, O., Falourd, S., Jouzel, J.,
Johnsen, S., Dahl-Jensen, D., Sveinsbjornsdottir, A., White, J., Popp, T. and
Fischer, H., 2005. Holocene climatic changes in Greenland: Different deuterium
excess signals at Greenland Ice Core Project (GRIP) and NorthGRIP. Journal of
Geophysical Research, 110: D14102, doi:10.1029/2004JD005575.
Mateus, J., 1989. Lagoa Travesa: a Holocene pollen diagram from the southwest coast
of Portugal. Revista de Biología, 14: 17-94.
Mateus, J., Queiroz, P., 1993. Os estudos de vegetação quaternária em Portugal;
contextos, balanço de resultados, perspectivas, O quaternário em Portugal,
balanço e perpectivas. Colibri, Lisboa.
Tesis Doctoral García-Amorena, I., 2007 Bibliografía
103
Menéndez Amor, J., 1950. Estudio de las turberas de la zona oriental asturiana. Anales
de la Asociación Española para el Progreso de las Ciencias, XV(4): 801-816.
Menéndez Amor, J. and Florschütz, F., 1961. Contribución al conocimiento de la
historia de la vegetación en España durante el Cuaternaio. Estudios Geológicos,
XVII: 83-99.
Metcalfe, C. and Chalk, L., 1979. Anatomy of the dicotyledons (second edition). Wood
structure and conclution of the general introduction, II. Clarendon Press, Oxford,
297 pp.
Meyen, S., 1987. Fundamentals of palaeobotany. Chapman and Hall, London and New
York, 432 pp.
Miglietta, F. and Raschi, A., 1993. Studying the effect of elevated CO2 in the open in a
naturally enriched environment in central Italy. Vegetatio, 104-105, 391-400.
Montes Barquín, R., 2003. El primer poblamiento de la región cantábrica. El Paleolítico
Inferior cantábrico. Secretaría General Técnica, Subdirección General de
Información y Publicaciones, Madrid, 253 pp.
Moore, P.D. and Webb, J.A., 1983. An illustrated guide to pollen analysis. Hodder and
Stoghton, London [etc.], 133 pp.
Muñoz-Sobrino, C., Ramil-Rego, P. and Gomez-Orellana, L., 2004. Vegetation of the
Lago de Sanabria area (NW Iberia) since the end of the Pleistocene: a
palaeoecological reconstruction on the basis of two new pollen sequences.
Vegetation History and Archaeobotany, 13(1): 1-22.
Muñoz-Sobrino, C., Ramil-Rego, P., Gomez-Orellana, L. and Varela, R.A.D., 2005.
Palynological data on major Holocene climatic events in NW Iberia. Boreas,
34(3): 381-400.
Muñoz-Sobrino, C., Ramil-Rego, P. and Guitian, M.A.R., 2001. Vegetation in the
mountains of northwest Iberia during the last glacial-interglacial transition.
Vegetation History and Archaeobotany, 10(1): 7-21.
Myhre, G., Highwood, E.J., Shine, K.P. and Stordal, F., 1998. New estimates of
radiative forcing due to well mixed greenhouse gases. Geophysical Research
Letters, 25(14): 2715-2718.
Neftel, A., Friedly, H., Moor, E., Lötscher, H., Oeschger, H., Siegenthaler, U. and
Stauffer, B., 1994. Historical CO2 record from the Siple station ice core. In:
O.R.N.L. Carbon Dioxide Information Analysis Center, U.S. (Editor), Trends: A
Tesis Doctoral García-Amorena, I., 2007 Bibliografía
104
compendium of data on global change. Department of Energy, Oak Ridge, TN,
U.S.A.
Ninyerola, M., Pons, X. and Roure, J., 2005. Atlas Climático Digital de la Península
Ibérica. Metodología y aplicaciones en bioclimatología y geobotánica.
Universidad Autónoma de Barcelona, Bellaterra, Bellaterra, pp.
http://opengis.uab.es/wms/iberia/index.htm.
NOOA-CIRES, 2006. Cimate Diagnosis Center, Boulder, Colorado.
Oldfield, F., 1964. Late-Quaternary deposits at le Moura, Biarritz, south-west France.
The New Phytologist, 63: 374-409.
Opsteegh, J.D., Haarsma, R.J., Selten, F.M. and Kattenberg, A., 1998. A dynamic
alternative to mixed boundary conditions in ocean models. Tellus 50A: 348–
367.
Ortu, E., Brewer, S. and Peyron, O., 2006. Pollen-inferred palaeoclimate reconstructions
in mountain areas: problems and perspectives. Journal of Quaternary Science,
21(6): 615-627.
Osborn, J. and Taylor, T., 1990. Morphological and ultrastructural studies of plant
cuticular membranes. I. Sun and shade leaves of Quercus velutina (Fagaceae).
Botanical Gazette, 151(4): 465-476.
Ozenda, P. and Borel, J.L., 2001. An ecological map of Europe: why and how? (vol
323, pg 983, 2000). Comptes Rendus De L Academie Des Sciences Serie Iii-
Sciences De La Vie-Life Sciences, 324(2): 179-179.
Pagés, J., Alonso, A., Cearreta, A., Hacar, M. and Bao, R., 2003. The Holocene record
in the Villaviciosa estuary (Asturias, Spain). In: R.Z.M.e. al. (Editor),
Quaternary Climatic Changes and Environmental Crisis in the Mediterranean
Region. Alcalá de Henares (Madrid): Universidad de Alcalá, pp. 249-256.
Parlange, J. and Waggoner, P., 1970. Stomatal dimensions and resistance to diffusion.
Plant Physiology, 46(2): 337–342.
Parrenin, F., Rémy, F., Ritz, C., Siegert, M. and Jouzel, J., 2004. New modeling of the
Vostok ice flow line and implication for the glaciological chronology of the
Vostok ice core. Journal of Geophysical Research, 109: D20102,
doi:10.1029/2004JD004561.
Peinado, M. and Rivas-Martínez, S., 1987. La vegetación de España. Colección Aula
Abierta (Universidad de Alcalá de Henares), Alcalá de Henares, 544 pp.
Tesis Doctoral García-Amorena, I., 2007 Bibliografía
105
Peñalba, M., 1987. Analisi polinikoaren emaitzak. Mulisko-Gaina (Guipuzkoa). Munibe
(Antropologia-Arkeologia), 39: 93-120.
Peñalba, M., 1994. The history of the Holocene vegetation in nothern Spain from pollen
analysis. Journal of Ecology, 82: 815-832.
Peñalba, M., Arnold, M., Guiot, J., Duplessy, J-C and de Beaulieu, J., 1997.
Termination of the Last Glaciation in the Iberian peninsula inferred from the
pollen sequence of Quintanar de la Sierra. Quaternary Research, 48: 205-214.
Peñas, A., Llamas, F., Pérez Morales, C. and Acedo, C., 1994. Aportaciones al
conocimiento del género Quercus en la cordillera Cantábrica. I. Tricomas
Foliatres de las especies caducifolias. Lagascalia, 17(2): 311-324.
Peña-Chocarro, L., Peña, L.Z., Gazólaz, J.G., Morales, M.G., Sesma, J.S. and Straus,
L.G., 2005. The spread of agriculture in northern Iberia: new archaeobotanical
data from El Mirón cave (Cantabria) and the open-air site of Los Cascajos
(Navarra). Vegetation History and Archaeobotany, 14(4): 268-278.
Peraza, C., 1964. Estudio de las maderas de coníferas españolas y de la zona norte de
Marruecos Instituto Forestal de Investigaciones y Experiencias, Madrid.
Peraza, C. and López de Roma, A., 1967. Estudio de las principales maderas de
Canarias. Ministerio de Agricultura, Dirección General de Montes, Caza y Pesca
Fluvial, Instituto Forestal de Investigaciones y Experiencias, Madrid, 220 pp.
Petit, R.J., Brewer, S., Bordacs, S., Burg, K., Cheddadi, R., Coart, E., Cottrell, J.,
Csaikl, U.M., van Dam, B., Deans, J.D., Espinel, S., Fineschi, S., Finkeldey, R.,
Glaz, I., Goicoechea, P.G., Jensen, J.S., Konig, A.O., Lowe, A.J., Madsen, S.F.,
Matyas, G., Munro, R.C., Popescu, F., Slade, D., Tabbener, H., de Vries,
S.G.M., Ziegenhagen, B., de Beaulieu, J.L., Kremer, A., 2002. Identification of
refugia and post-glacial colonisation routes of European white oaks based on
chloroplast DNA and fossil pollen evidence. Forest Ecology and Management.
156(1-3), 49-74.
Petit, J., Jouzel, J., Raynaud, D., Barkov, N., Barnola, J., Basile, I., Bender, M.,
Chappellaz, J., Davisk, M., Delaygue, G., Delmotte, M., Kotlyakov, V.,
Legrand, M., Lipenkov, V., Lorius, C., Pépin, L., Ritz, C., Saltzmank, E. and
Stievenard, M., 1999. Climate and atmospheric history of the past 420,000 years
from the Vostok ice core, Antarctica. Nature, 399: 429-436.
Tesis Doctoral García-Amorena, I., 2007 Bibliografía
106
Peyron, O., Guiot, J., Cheddadi, R., Tarasov, P., Reille, M., de Beaulieu, J.L., Bottema,
S. and Andrieu, V., 1998. Climatic reconstruction in Europe for 18,000 yr BP
from pollen data. Quaternary Research, 49(2): 183-196.
Pokorny, P., 2005. Role of man in the development of Holocene vegetation in Central
Bohemia. Preslia, 77(1): 113-128.
Pons, A. and Reille, M., 1988. The Holocene-Pleistocene and Upper-Pleistocene pollen
record from Padul (Granada, Spain) - a new study. Palaeogeography
Palaeoclimatology Palaeoecology, 66(3-4): 243-263.
Poole, I. and Kürschner, W., 1999. Stomatal density and index: the practice. In: T. Jones
and N. Rowe (Editors), Fossil plants and spores. Modern techniques. The
Geological Society, London, pp. 257-265.
Poole, I., Weyers, J., Lawson, T. and Raven, J., 1996. Variations in stomatal density and
index: implications for palaeoclimatic reconstructions. Plant, Cell and
Environment, 19: 705-712.
Pross, J., Klotz, S. and Mosbrugger, V., 2000. Reconstructing palaeotemperatures for
the Early and Middle Pleistocene using the mutual climatic range method based
on plant fossils. Quaternary Science Reviews, 19: 1785-1799.
Rábade, J.M., 2002. Atlas forestal de España. TRAGSA, Madrid, 455 pp.
Ramil, P. and Aira, M., 1994. Datos sobre la presencia de Pinus L. en el NO de la
Península Ibérica durante el Holoceno a través del análisis polínico. Revista de
Biología, 15: 3-13.
Ramil-Rego, P., Muñóz-Sobrino, C., Rodríguez-Guitián, M. and Gómez-Orellana, L.,
1998a. Differences in the vegattion of the north Iberian Peninsula during the last
16,000 years. Plant Ecology, 138: 41-62
Ramil-Rego, P., Rodríguez-Guitián, M. and Muñoz-Sobrino, C., 1998b. Sclerophyllous
vegetation dynamics in the north of the Iberian peninsula during the last 16000
years. Global Ecology and Biogeography Letters, 7: 335-351.
Raynaud, D., Jouzel, J., Barnola, J., Chappellaz, J., Delmas, R. and Lorius, C., 1993.
The ice record of greenhouse gases. Science, 259: 926-934.
Reille, M. and Andrieu, V., 1995. The Late Pleistocene and Holocene in the Lourdes
basin, western Pyrenees, France - New pollen analytical and chronological data.
Vegetation History and Archaeobotany, 4(1): 1-21.
Tesis Doctoral García-Amorena, I., 2007 Bibliografía
107
Reille, M. and De Beaulieu, J.L., 1988. History of the Wurm and Holocene vegetation
in western Velay (Massif Central, France) - a comparison of pollen analysis
from 3 corings at Lac-Du-Bouchet. Review of Palaeobotany and Palynology,
54(3-4): 233-248.
Reimer, P., Baillie, M., Bard, E., Bayliss, A., Beck, J., Bertrand, C., Blackwell, P.,
Buck, C.B., G, Cutler, K., Damon, P., Edwards, R., Fairbanks, R., Friedrich, M.,
Guilderson, T., Hughen, K., Kromer, B., McCormac, F., Manning, S., Bronk
Ramsey, C., Reimer, R., Remmele, S., Southon, J., Stuiver, M., Talamo, S.,
Taylor, F., van der Plicht, J. and Weyhenmeyer, C., 2004. IntCal04 Terrestrial
radiocarbon age calibration, 26 - 0 ka BP. Radiocarbon, 46: 1029-1058.
Richens, R.H. and Jeffers, J.R., 1986. Numerical taxonomy and etnobotany of elms of
Northern Spain. Anales del Jardín Botánico de Madrid, 42(2): 325-341.
Richter, H., Grosser, D., Heinz, I. and Gasson, P., 2004. IAWA list of microscopic
features for softwood identification. International Assosiation of Wood
Anatomist, Leiden, The Netherlands, 70 pp.
Richter, H.G. and Dallwitz, M.J., 2000 onwards. Commercial timbers: descriptions,
illustrations, identification, and information retrieval.In English, French,
German, and Spanish, pp. http://biodiversity.uno.edu/delta/.
Rivas-martínez, S., Díaz, T.E., Fernández-González, F., Izco, J., Loidi, J., Lousã, M.
and Penas, A., 2002. Vascular plant communities of Spain and Portugal.
Addenda to the syntaxonomical checklist of 2001. Itinera geobotanica, 15(1): 5-
432.
Rivas-Martinez, S. and Sáenz, C., 1991. Enumeracion de los Quercus de la Peninsula
Iberica. Rivasgodaya, 6, 101-110.
Rivas, V., 2000. Clima y nivel del mar: reconstrucción de las posiciones marinas
cuaternarias a través de las evidencias en el litoral cantábrico. In: J.C. García
Codron (Editor), La Reconstrucción del clima de época preindustrial / V
Reunión Nacional de Climatología. Servicio de Publicaciones de la Universidad
de Cantabria, Santander, pp. 170-212.
Roberts, N., 1997. The Holocene. An environmenal history. Blackwell, Oxford and
Malden, Massachusetts, 316 pp.
Rodrigues, A., Malgalhães, F. and Alverirnho, D., 1991. Evolution of the north
portuguese coast in the last 18.000 years. Quaternary International, 9: 67-74.

Tesis Doctoral García-Amorena, I., 2007 Bibliografía
108
Roig, S., Gómez, F., Masedo, F., Morla, C. and Dánchez, L., 1997. Estudio
paleobotánico de estróbilos y maderas subfósiles holocenas en el yacimiento de
Cevico Navero (Palencia, España). Anales del Jardín Botánico de Madrid, 55(1):
111-123.
Roucoux, K.H., De Abreu, L., Shackleton, N.J. and Tzedakis, P.C., 2005. The response
of NW Iberian vegetation to North Atlantic climate oscillations during the last
65 kyr. Quaternary Science Reviews, 24(14-15): 1637-1653.
Royer, D., 2001. Stomata density and stomata index as indicators of paleoatmospheric
CO2 concentration. Review of Palaeobotany and Palynology 114: 1-28.
Rozema, J., vandeStaaij, J. and Bjorn, L.O., 1997. UV-B as an environmental factor in
plant life: Stress and regulation. Trends in Ecology and Evolution, 12 (1), 22-28.
Rubio, A. and Sánchez, O., 2005. Definición de áreas potenciales paramétricas de
especies forestales. El caso de Pinus uncinata. Cuadernos de la Sociedad
Española de Ciencias Forestales, 20(2): 271-283.
Ruddiman, W.F. and McIntyre, A., 1981. The North-Atlantic ocean during the last
deglaciation. Palaeogeography Palaeoclimatology Palaeoecology, 35(2-4): 145-
214.
Ruiz de la Torre, J., 1990-1998. Mapa Forestal de España 1:200.000. ICONA, Escuela
Técnica Superior de Ingenieros de Montes, Madrid.
Ruiz de la Torre, J., 2002. Mapa forestal de España: memoria general : Escala 1 :
1.000.000 Organismo Autónomo Parques Nacionales, D.L., Madrid, 554 pp.
Ruiz de la Torre, J. and Ceballos, L., 1979. Árboles y arbustos de la España peninsular.
Fundación Conde del Valle de Salazar, Madrid, 512 pp.
Ruiz Zapata, M.B., Gil García, M.J., Dorado Valiño, M., Valdeolmillos, A., Vegas, J.
and Pérez.González, J., 2002. Clima y vegetación durante el tardiglaciar y el
Holoceno en la Sierra de Neila (sistema Ibérico noroccidental). Cuaternario y
Geomorfología, 16(1-4): 9-20.
Rundgren, M. and Beerling, D., 1999. A Holocene CO2 record from stomatal index of
subfossil Salix herbacea L. leaves from northern Sweden. The Holocene, 9,5:
509-513.
Rundgren, M. and Björck, S., 2003. Late-glacial and early Holocene variations in
atmospheric CO2 concentration indicated by high-resolution stomatal index data.
Earth and Planetary Science Letters, 213: 19-204.
Tesis Doctoral García-Amorena, I., 2007 Bibliografía
109
Saá, M. and Díaz-Fierros, F., 1987. Contribución al conocimiento de la historia
paleobotánica de la costa sur de Galicia (NW de España). Los sedimentos de
Mougás y Cabo Silleiro. In: U.d. Salamanca-APLE (Editor), Actas de
paleobotánica. Civis, J; Valle, MF, Salamanca, pp. 355-358.
Saá, M. and Díaz-Fierros, F., 1988. Contribución al estudio paleobotánico mediante
análisis de pólen. Estudios Geológicos, 44: 339-349.
Saá Otero, P., 1985. Contribución a la datación de sedimentos costeros por análisis
polínico, Universidad de Santiago de Compostela, España.
Sack, L., Cowan, P.D., Jaikumar, N. and Holbrook, N.M., 2003. The hydrology of
leaves: co-ordination of structure and function in temperate woody species. Plant
Cell and Environment, 26, 1343-1356.
Sainz, H., Moreno, J., 2002. Flora vascular endémica española. In: F. Pineda, J. de
Miguel, M. Casado, J. Montalvo (Eds.), La Diversidad Biológica de España.
Prentice Hall-CYTED, Madrid, pp. 175-196.
Salas, L., Remondo, J. and Martínez, P., 1996. Cambios del nivel del mar durante el
Holoceno en el Cantábrico a partir del estudio de la turbera de Trengandín. In:
S.E.d. Geomorfología (Editor), IV Reunión de Geomorfología, O Castro, pp.
237-247.
Salisbury, E.J., 1927. On the causes and ecological significance of stomatal frequency
with special reference to the woodland flora. Philosophical Transactions of the
Royal Society, 261 (B-Biological Sciences), 1-65.
Sánchez Goñi, M., 1990. Analyse palynologique de sites prehistoriques du Pays
Basque: premiers resultats pour les grottes de Lezetxiki et Urtiaga. In: U.P.
Vasco (Editor), The environment and the human society in the western Pyrenees
and the basque mountains during the Upper Pleistocene and the Holocene, Pais
Vasco, pp. 111-130.
Sánchez Goñi, M., 1993. Criterios de base tafonómica para la interpretación de análisis
palinológicos en cueva: el ejemplo de la región cantábrica. Estudios sobre
Cuaternario, 117-130(117-130): 117-130.
Sánchez Goñi, M., 1994. L'environnement de l'homme préhistorique dans la région
cantabrique d'après la taphonomie pollinique des grottes. L'Anthropologie, 98(2-
3): 379-417.
Tesis Doctoral García-Amorena, I., 2007 Bibliografía
110
Sánchez Goñi, M., Turon, J., Eynaud, F. and Gendreau, S., 2000. European climatic
responses to millenian-scale changes in the atmosphere-ocean system during the
Last Glacial Period. Quaternary Research, 54: 394-403.
Santos, L. and Goñi, M.F.S., 2003. Lateglacial and Holocene environmental changes in
Portuguese coastal lagoons 3: vegetation history of the Santo Andre coastal area.
Holocene, 13(3): 459-464.
Santos, L., Romani, J.R.V. and Jalut, G., 2000. History of vegetation during the
Holocene in the Courel and Queixa Sierras, Galicia, northwest Iberian
Peninsula. Journal of Quaternary Science, 15(6): 621-632.
Saporta, G., 1990. Probabilités analyse des donées et statistique, XXVI. Technip, Paris,
493 pp.
Sass-Klaassen, U., 2002. Dendroarchaeology: successes in the past and challenges for
the future. Dendrochronologia, 20: 1-2.
Schweingruber, F., 1990. Anatomy of European woods. WSL/FNP, Paul Haupt Berne
& Stuttgart Publishers, Stuttgart, 800 pp.
Servicio Geográfico del Ejército. 1986-1995. Mapa militar de España 1:500.000.
S.G.E., España, CD-Rom.
Shackleton, N.J., 1987. Oxygen Isotopes, Ice Volume and Sea-Level. Quaternary
Science Reviews. 6(3-4), 183-190.
Shackleton, N., 2000. The 100,000-year ice-age cycle identified and found to lag
temperature, carbon dioxide, and orbital eccentricity. Science, 289: 1897-1902.
Shackleton, N.J., 1987. Oxygen Isotopes, Ice Volume and Sea-Level. Quaternary
Science Reviews, 6(3-4): 183-190.
Shackleton, N.J., Backman, J., Zimmerman, H., Kent, D.V., Hall, M.A., Roberts, D.G.,
Schnitker, D., Baldauf, J.G., Desprairies, A. and Homrighausen, R., 1984.
Oxygen isotope calibration of the onset of ice-rafting and history of glaciation in
the North Atlantic region. Nature, 307: 620-623.
Soares de Carvalho, G., Granja, H., Gomes, P., Loureiro, E., Henriques, R., Carrilho, I.,
Costa, A. and Ribeiro, P., 2002. New data and new ideas concerning recent
geomorphological changes in the NW coastal zone of Portugal. In:
EUROCOAST (Editor), Littorel 2002, the changing coast.
EUROCOAST/EUCC, Porto-Portugal, pp. 399-410.
Tesis Doctoral García-Amorena, I., 2007 Bibliografía
111
Spurk, M., Leuschner, H., Baillie, M., Briffa, K. and Friedrich, M., 2002. Depositional
frequency of German subfossil oaks: climatically and non-climatically induced
fluctuations in the Holocene. Holocene, 12(6): 707-715.
Steevenson, A. and Moore, P., 1988. Studies in the vegetation history of S.W. Spain.
IV. Palynological investagations of a velley mire at El Acebrón, Huelva. Journal
of Biogeography, 15: 339-361.
Stott, P. and Kettleborough, J., 2002. Origins and estimates of uncertainty in predictions
of twenty-first century temperature rise. Nature, 416(6882): 723-726.
Strasburguer, F., Noll, F., Schenck, H. and Schimper, A., 1990. Tratado de Botánica.
Omega, Barcelona, 1100 pp.
Stuiver, M., Reimer, P. and Reimer, R., 2005. CALIB 5.0., pp. [WWW program and
documentation].
Theobald, W., Krahulik, J. and Rollins, R., 1979. Trichome description and
classification. In: C. Metcalfe and L. Chalk (Editors), Anatomy of the
dycotiledons V.I. Systematic anatomy of Leaf and steam, with a brief history of
the subject. Clarendon Press, Oxford, pp. 40-53.
Thomas, P.W., Woodward, F.I. and Quick, W.P., 2004. Systemic irradiance signalling
in tobacco. New Phytologist, 161 (1), 193-198.
Thomson, D., 1997. Dependence of global temperatures on atmospheric CO2 and solar
irradiance. Proceedings of the National Academy of Sciences of the United
States of America, 94: 8370-8377.
Tichá, I., 1982. Photosynthetic characteristics during ontogenesis of leaves. 7. Stomata
density and sizes. Photosynthetica, 16, 375-471.
Tognetti, R., Minnocci, A., Peñuelas, J., Raschi, A. and Jones, M.B., 2000. Comparative
field water relations of three Mediterranean shrub species co-occurring at a
natural CO2 vent. Journal of Experimental Botany, 51 (347), 1135-1146.
Torras Troncoso, M., Díaz-Fierros Viqueirsa, F. and Vázquez Varela, J., 1980. Sobre el
comienzo de la agricultura en Galicia. Gallaecia, 6: 51-9.
Turner, C. and Hannon, G.E., 1988. Vegetational Evidence for Late Quaternary
Climatic Changes in Southwest Europe in Relation to the Influence of the North-
Atlantic Ocean. Philosophical Transactions of the Royal Society of London
Series B-Biological Sciences, 318(1191): 451-485.
Tesis Doctoral García-Amorena, I., 2007 Bibliografía
112
Turon, J., Lézine, A. and Denèfle, M., 2003. Land-sea correlations for the last glaciation
inferred from a pollen and dinocyst record from the Portuguese margin.
Quaternary Research, 59(1): 88-96.
Tzedakis, P., Andrieu, V., deBeaulieu, J., Crowhurst, S., Follieri, M., Hooghiemstra, H.,
Magri, D., Reille, M., Sadori, L., Shackleton, N. and Wijmstra, T., 1997.
Comparison of terrestrial and marine records of changing climate of the last
500,000 years. Earth and Planetary Science Letters, 150(1-2): 171-176.
Uriarte, A, 2003. Historia del Clima y de la Tierra. Departamento de Transportes y
Obras Públicas del Gobierno Vasco, Vitoria, 306 pp.
Uzquiano, P., 1992a. L'homme et le bois au Paléolitique en règion Cantabrique,
Espagne. xemples d'Altamira et d'El Buxu. Bulletin de la société botanique de
France, 139(2/3/4): 361-372.
Uzquiano, P., 1992b. The late glacial/postglacial transition in the Cantabrian cordillera
(Asturias and Cantabria, Spain) based on charcoal analysis. Palaios, 7: 540-547.
Uzquiano, P., 1994. Estudio antracológico de Laminak II (Berriatua, Bizkaia). Bizkaiko
Foru Aldundia-Diputación Foral de Bizcaia, XXI: 168-172.
Uzquiano, P., 1995. La disparition de Picea à la fin du Pleistocène supérieur en région
cantabrique d'après l'antracoloanayse: déterminisme climatique et anthropique.
Comptes rendus de l'Académie des sciences. Série 2. Sciences de la terre et des
planètes, 321: 545-51.
Uzunova, K., Palamarev, E. and Ehrendorfer, F., 1997. Anatomical changes and
evolutionary trends in the foliar epidermis of extant and fossil Euro-
Mediterranean oaks (Fagaceae). Plant Systematics and Evolution, 204(3): 141-
159.
Van de Water, P., Leavitt, S. and Betancourt, J., 1994. Trends in stomatal density and
C-13/C-12 ratios of Pinus flexilis needles during last glacial-interglacial cycle.
Science, 264(5156): 239-243.
van der Burgh, J., 1973. Hölzer der niederrheinischen braunkohlenformation, 2. Hölzer
der braunkohlenformation "Maria Theresia" zuhierzogenrath, "Zukunft West" zu
eschweiler und "Victor" (zülich mitte) zu zülpich. Nebst einer
systematischanatomischien bearbeittung der gattung Pinus L. Review of
Palaeobotany and Palynology, 15: 73-275.
Tesis Doctoral García-Amorena, I., 2007 Bibliografía
113
Van der Burgh, J., Visscher, H., Dilcher, D.L. and Kürschner, WM., 1993.
Paleoatmospheric signatures in Neogene fossil leaves. Science, 260 (5115),
1788-1790.
van der Knaap, W.O. and van Leeuwen, J.F.N., 1997. Late Glacial and early Holocene
vegetation succession, altitudinal vegetation zonation, and climatic change in the
Serra da Estrela, Portugal. Review of Palaeobotany and Palynology, 97(3-4):
239-285.
Van de Water, P.K., Leavitt, S.W. and Betancourt, J.L., 1994. Trends in stomatal
density and C-13/C-12 ratios of Pinus flexilis needles during last glacial-
interglacial cycle. Science, 264 (5156), 239-243.
Van Hoof, T., 2004. Coupling between atmospheric CO2 and temperature during the
onset of the Little Ice Age. Ph.D. Thesis, Laboratory of Palaeobotany and
Palynology, Utrecht University, The Netherlands. LPP Contribution Series, 18.
Van Hoof, T.B., Kaspers, K.A., Wagner, F., van de Wal, R.S.W., Kürschner, W.M. and
Visscher, H., 2005a. Atmospheric CO2 during the 13th century AD:
reconciliation of data from ice core measurements and stomatal frequency
analysis. Tellus Series B-Chemical and Physical Meteorology, 57, 351-355.
Van Hoof, T.B., Kürschner, W.M., Wagner, F. and Visscher, H., 2005b. Stomatal index
response of Quercus robur and Quercus petraea to the anthropogenic
atmospheric CO2 increase. Plant Ecology, 1, 1-7.
van Mourik, J.M., 1986. Pollen profiles of slope deposits in the Galician area (N.W.
Spain), Universiteit van Amsterdam, Amsterdam 171 pp.
Vera, J.A., 2004. Geología de España. Sociedad Geológica de España-Instituto
Geológico y Minero de España, Madrid, 884 pp.
Vernet, J.L., 2001. Guide d'identification des charbons de bois préhistoriques et récents:
Sud-ouest de l'Europe: France, Peninsule Ibérique et Îles Canaries. CNRS, cop,
Paris, 395 pp.
Vernet, J.L. and Figueiral, I., 1993. The highlands of Abodoreira (nort-west Portugal):
Ecological conditions from Middle/Late Neolithic to Early Bronce Age.
Evidence from charcoal analysis. Oxford Journal of Archaeology, 12(1): 19-28.
von Denffer, D., Ziegler, H., Ehrendorfer, F. and Bresinski, A., 1990. Tratado de
Botanica. 32 ed. Omega, Barcelona.
Tesis Doctoral García-Amorena, I., 2007 Bibliografía
114
Wagner, F., 1998. The influence of environment on the stomatal frequency in Betula.
Ph.D. Thesis, Laboratory of Palaeobotany and Palynology, Utrecht University,
The Netherlands. LPP Contribution Series, 9, 102 pp.
Wagner, F., Below, R., Klerk, P.D., Dilcher, D.L., Joosten, H., Kürschner, W.M. and
Visscher, H., 1996. A natural experiment on plant acclimation: lifetime stomatal
frequency response of an individual tree to annual atmospheric CO2 increase.
Proceedings of the National Academy of Sciences of the United States of
America, 93 (21), 11705–11708.
Wagner, F., Aaby, B. and Visscher, H., 2002. Rapid atmospheric CO2 changes
associated with the 8,200-years-B.P. cooling event. Proceedings of the National
Academy of Sciences of the United States of America, 99(19): 12011-12014.
Wagner, F., Bohncke, S., Dilcher, D., Kürschner, W., van Geel, B. and Visscher, H.,
1999. Century-scale shifts in early Holocene atmospheric CO2 concentration.
Science, 284: 1971-1973.
Wagner, F., Kouwenberg, L., van Hoof, T. and Visscher, H., 2004. Reproducibility of
Holocene atmospheric CO2 records based on stomatal frequency. Quaternary
Science Reviews, 23: 1947-1954.
Wagner, F., Neuvonen, S., Kürschner, W. and Visscher, H., 2000. The influence of
hybridization on epidermal properties of birch species and the consequences for
palaeoclimatic interpretations. Plant Ecology, 48: 61-69.
Wang, K. and Kellomäki, S., 1997. Stomatal conductance and transpiration in shoots of
Scots pine after 4-year exposure to elevated CO2 and temperature. Canadian of
Journal Botany, 75: 552-561.
Watts, W.A., 1986. Stages of climatic changes from full glacial to Holocene in
Northwestern Spain, southern France and Italy. A comparison of the Atlantic
coast and the Mediterranean bassin. In: A. Ghazi, R. Fantechi (Eds.), EC
Climatology Programme Symposium. D. Reidel Publisher, Dordrecht, Sophia
Antipolis, France, pp. 101-112.
Westerkamp, C. and Demmelmeyer, H., 1997. Leaf surfaces of Central European
woody plants. Atlas and keys. Gebrüder Borntraeger,, Berlin and Stuttgart, 558
pp.

Tesis Doctoral García-Amorena, I., 2007 Bibliografía
115
Wheeler, E., Baas, P. and Gasson, P., 1989. IAWA list of microscopic features for
hardwood identification. International Assosiation of Wood Anatomist, Leiden,
The Netherlands, 332 pp.
Wheeler, E., Pearson, R., LaPasha, C., Zack, T. and Hatley, W., 1986. Computer-aided
wood identification, Bull. 474. The North Carolina Agricultural Research
Service, Raleigh, North Carolina, 160 pp.
Wilkinson, H., 1979. The plant surface (mainly leaf). In: C. Metcalfe and L. Chalk
(Editors), Anatomy of the dycotiledons V.I. Systematic anatomy of Leaf and
steam, with a brief history of the subject. Clarendon Press, Oxford, pp. 97-204.
Williams, J.W., Post, D.M., Cwynar, L.C., Lotter, A.F. and Levesque, A.J., 2002. Rapid
and widespread vegetation responses to past climate change in the North
Atlantic region. Geology, 30(11): 971-974.
Willis, K.J. and van Andel, T.H., 2004. Trees or no trees? The environments of central
and eastern Europe during the Last Glaciation. Quaternary Science Reviews,
23(23-24): 2369-2387.
Woodward, F., 1987. Stomatal numbers are sensitive to increases in CO2 from pre-
industrial levels. Nature 327: 617-618.
Zahn, R., Schonfeld, J., Kudrass, H.R., Park, M.H., Erlenkeuser, H. and Grootes, P.,
1997. Thermohaline instability in the North Atlantic during meltwater events:
Stable isotope and ice-rafted detritus records from core SO75-26KL, Portuguese
margin. Paleoceanography, 12(5): 696-710.
Zapata, L. and Meaza, G., 1998. Procesos de antropización y cambios en el paisaje
vegetal del País Vasco atlántico en la prehistoria reciente: su incidencia en la
expansión de hayedos y encinares. Munibe (Ciencias Naturales - Natur
Zientziak), 50: 21-35.
Zazo, C., Goy, J.L., Hillarie-Marcel, C., Hoyos, M., Cuerda, J., Gjaleb, B., Bardají, T.,
Dabrio, C.J., Lario, J., Silva, P.G., González, A., González, F. and Soler, V.,
1997. El nivel del mar y los interglaciares cuaternarios: Su registro en las costas
peninsulares e insulares españolas. In: J. Rodríguez Vidal (Editor), Cuaternario
Ibérico / Asociación Española para el Estudio del Cuaternario (AEQUA).
Asociación Española para el Estudio del Cuaternario, Huelva.

Tesis Doctoral García-Amorena, I., 2007 Bibliografía
116
Zilhão, J., 1989. The last Glacial Maximum in Cantabrian Spain: the Solutrean. In: O.
Soffer and C. Gamble (Editors), The world at 18000 BP. Unwin Hydman Ltd,
London, Boston, Sydney, Wellington.
Zilhão, J., 1990. The Portuguese Estremadura at 18000 BP: the Solutrean. In: O. Soffer
and G. C. (Editors), The world at 18000 BP. Academic Division of Unwin
Hyman Ltd, London [etc.].
Zilhão, J., 1993. The spread of agro-pastoral economies across mediterranean Europe: A
view from the far west. Journal of Mediterranean Archaeology, 6(1): 5-63.
Zilhao, J., Marks, A.E., Ferring, C.R., Bicho, N.F. and Figueiral, I., 1995. The Upper
Paleolithic of the Rio Maior Basin (Portugal) Preliminary results of a 1987-1993
Portuguese-American research project. Trabalhos de Antropologia e Etnologia,
35(4): 69-82.
Tesis Doctoral García-Amorena, I., 2007 Agradecimientos - Acknowledgements
117
AGRADECIMIENTOS ACKNOWLEDGEMENTS
A Javier Maldonado, director original de esta tesis, siempre compañero en el campo, en
el laboratorio y en tantas aficiones comunes. A Carlos Morla y a Fernando Gómez
Manzaneque, que me dieron la oportunidad de llevar a cabo esta ilusión y me
acompañaron desde el inicio de mis andaduras hasta la siempre penúltima revisión sin
agotárseles nunca el entusiasmo. Gracias por todos estos años de apoyo.
To Friederike Wagner, who since we met offered me her support and knowledge, even
though I did not understand a word in English (do not tell about Dutch-still improving).
You taught me the art of publishing with fun, together with Tom van Hoof, Timme
Donders, Franks Bunnik, and Wolfram Kürschner. Thanks for your company, good
advises and scientific hold. Many thanks to all that people that supported me in so many
ways in my Dutch summers; Andy Lotter and Irene Hofmann (Dank je wel voor jullie
gastvrijhweid), Marjolein Mullen, Oliver Heiri, Francesca Sangiorgi, and to Marijke
and the people who helped me at the Laboratory of Palaeobotany and Palynology in
Utrecht (Appy, Henk, Roel, Johan, Lenny, Merlijn, Jeroen, Walter, Verushka, Ton,
Natasja, Jan, Leonard and Zwier). And many thanks to Henk Visscher, for his
irreplaceable contributions at the last stage of my thesis.
I also have to thank Zlatko Kvacek that invited me to his laboratory at the very
beginning of my research, supervised me and opened the international scientific doors
to me. Thanks also due to Jakub Sakala, Jiřina Daškova and Milan Libertín that gave
me a place in their busy room and in their families (with a kind of magic!).
A Helena Granja, Soares Carvalho, Barreto Caldas y José Pissarra por su ayuda y
hospitalidad, por ofrecerme su amistad y el fruto de sus numerosos años de muestreo.
A Agustín Rubio, Unai López, Joaquín Solana, Alberto Pardos, Pablo Ramil, Manuel
Hacar, Iñaki Ortiz y al personal de las Unidades Docentes de Anatomía y de Maderas de
la E.S.T.I. de Montes (U.P.M.), por el tiempo dedicado en tantos viajes de campo,
discusiones científicas y sus prácticos consejos en el manejo de distintas herramientas
estadísticas y de laboratorio.
Tesis Doctoral García-Amorena, I., 2007 Agradecimientos - Acknowledgements
118
Por último, pero no menos importante, tengo que agradecer a un grupo de gente que me
acompañó a lo largo de todos estos años. Sin su ayuda, comprensión y compañía en
tantas y tan diferentes ocasiones, no hubiese llegado nunca a donde estoy:
A María Martínez, Carlos Manzanares, Juan Manuel Rubiales, Pedro Regato, José
María Postigo, Ángela Alonso, José Luís Pagés, Mercedes García Antón, Graciela Gil,
Cristina Alcalde, Mar Génova, Rufo García, Paloma Gil, Helios Sainz, Salvia García,
Fa (Javier Gortazar), Carlos Alonso, Pilar Vizcaíno, Elena del Valle, Sigrid del Río,
Ana Seves y a Alberto Arroyo. No existen palabras para expresaros mi agradecimiento.
A mi familia.
Esta tesis ha sido realizada gracias a la financiación y colaboración de las siguientes entidades:
Ministerio de Educación y Ciencia (Becas FPU)
Ministerio de Ciencia y Tecnología (proyectos CICYT BOS2000-0149 y CGL2004-00048)
Universidad Politécnica de Madrid (U.P.M.) (proyecto 14591, AMO208)
Laboratorio de Paleobotánica y Palinología de la Universidad de Utrecht
E.T.S.I. de Montes de la U.P.M.
Dpto. de Silvopascuicultura de la E.T.S.I. Montes, U.P.M.
Unidad Docente de Botánica de la E.T.S.I. Montes, U.P.M. y herbario EMMA
Jardín Botánico de Madrid (Herbario MA)

119
ENGLISH VERSION

Tesis Doctoral García-Amorena, I., 2007
120
This thesis is based on the following manuscripts:
Chapter III
García-Amorena, I., Wagner F., van Hoof T.B., Gómez Manzaneque F., 2006. Stomatal
responses in deciduous oaks from southern Europe to the anthropogenic atmospheric
CO2 increase; refining the stomatal-based CO2 proxy. Review of Palaeobotany and
Palynology, 141: 303-312.
Chapter IV
García-Amorena, I., Wagner, F., Gomez Manzaneque, F., van Hoof, T., Morla, C.,
Visscher, H. Atmospheric CO2 radiative forcing during the Holocene Thermal
Maximum revealed by stomatal frequency analysis. To be submitted.
Chapter V
García-Amorena I., Gómez Manzaneque F., Rubiales, J.M., Granja, H.M., Soares de
Carvalho, G., Morla, C. Impact of the last glacial-interglacial cycle on the coastal
forests of western Iberia. Submitted to Palaeogeography, Palaeoclimatology,
Palaeoecology.
Chapter VI
García-Amorena, I., Morla, C., Rubiales, J.M., Gómez Manzaneque, F. The Holocene
forests in the Atlantic coast of northern Spain by means of their macro-remains. New
taxonomical data. Submitted to The Holocene.

121
ABSTRACT
Tesis Doctoral García-Amorena, I., 2007 Abstract
122
Two hundred and twenty eight wood remains, 50 fruits and over 350 leaf remains have
been collected and identified from Late Pleistocene and Holocene deposits at 18 sites
along the Atlantic coast of the Iberian Peninsula. Based on their morphological
properties and 14C ages, these remains provided insight into the dynamics and past
composition of coastal forests throughout the last glacial-interglacial climate cycle. The
local origin of the macro-remains allowed identification of refugia where different
plants could survive the last glaciation. The finding of macro-remains of taxa whose
Iberian autochthony has sometimes been questioned is highlighted.
Additionally, palaeoclimate conditions along the Portuguese coast were estimated on
the basis of the past presence of certain characteristic populations. Anatomical
properties of fossil leaves also provided information about the atmospheric composition
at the time when those plants lived. Past atmospheric CO2 concentrations could be
reconstructed through analysis of epidermal parameters of Quercus robur fossil leaves
like frequency and dimensions of stomata. This analysis provided new atmospheric CO2
data that emphasized the important role of CO2 on climate dynamics throughout the last
10000 years.
In order to obtain the Holocene CO2 data from the collected fossil leaves, a new
stomata-based CO2 model was proposed, based on modern trees and herbarium samples
of Q. robur and Q. petraea from Iberia. This model was validated for Iberian Q. robur-
petraea populations growing below 1000 m above sea level and between a CO2 range
from 295 ppmv to 330 ppmv. Comparison with the available data from the Netherlands
allowed construction of a common stomata-based CO2 model, valid for Q. robur-
petraea European populations in areas below 1000 m a.s.l., by introducing a solar
irradiance correction factor.

123
CHAPTER I: Introduction

Tesis Doctoral García-Amorena, I., 2007 Introduction
Secular exploitation of natural resources during the last millennia caused major
disturbance of the natural vegetation on the Iberian Peninsula. For an appropriate forest
management, a good interpretation of the surrounding landscape as well as knowledge
of the mechanisms of vegetation evolution is required.
For this purpose, palaeobotanical analysis of plant remains could help to develop highly
accurate vegetation evolution models. Such models have to be continuously tested and
modified in the light of new palaeobotanical data (Prentice, 1986; Meyen, 1987). The
study of micro-remains from a specific site generally provides a continuous record of
the surrounding regional vegetation. Complementary macro-remain analysis benefits
from a generally higher degree of taxonomical information about the local to in-situ
vegetation (Birks and Birks, 2000; Lowe and Walker, 1997; Roberts, 1997).
Besides human impact on the environment, there exists a strong link between Earth’s
climate dynamics and past vegetation composition and distribution (Huntley, 1990a;
Tzedakis et al., 1997). Therefore, the study of palaeoclimate mechanisms and the
interaction of past climate variability with vegetation could result in highly relevant
information for the understanding of vegetation evolution and predictions of future
development (Colin Prentice, 1986).
Deep-ocean sediments and ice-core drillings from 1980 onwards provide an accurate
chronology and climatic sequences for the last 300,000 years BP [BP (before present) =
before 1950 AD] (Andersen et al., 2004; Boessenkool et al., 2001; Bond et al., 1993;
Dansgaard et al., 1993; Martinson et al., 1987; Roucoux et al., 2005). Multiple
fluctuations of mean annual temperature of, in some cases, over 15ºC are observed to
occur within periods of 200 years (fig. I-1). Under these conditions of severe climate
change, vegetation had to adapt or migrate to survive (Hewitt, 1999). Such extreme
environmental change is often recorded in structural adaptations of the woody plant
body of the surviving vegetation (e.g. Génova and Martínez-Morillas, 2002; Sass-
Klaassen, 2002; Spurk et al., 2002; van Hoof, 2004). Likewise, leaf morphological and
anatomical alterations could reflect the specific environmental parameters that caused
their development (García-Amorena et al., 2006b).
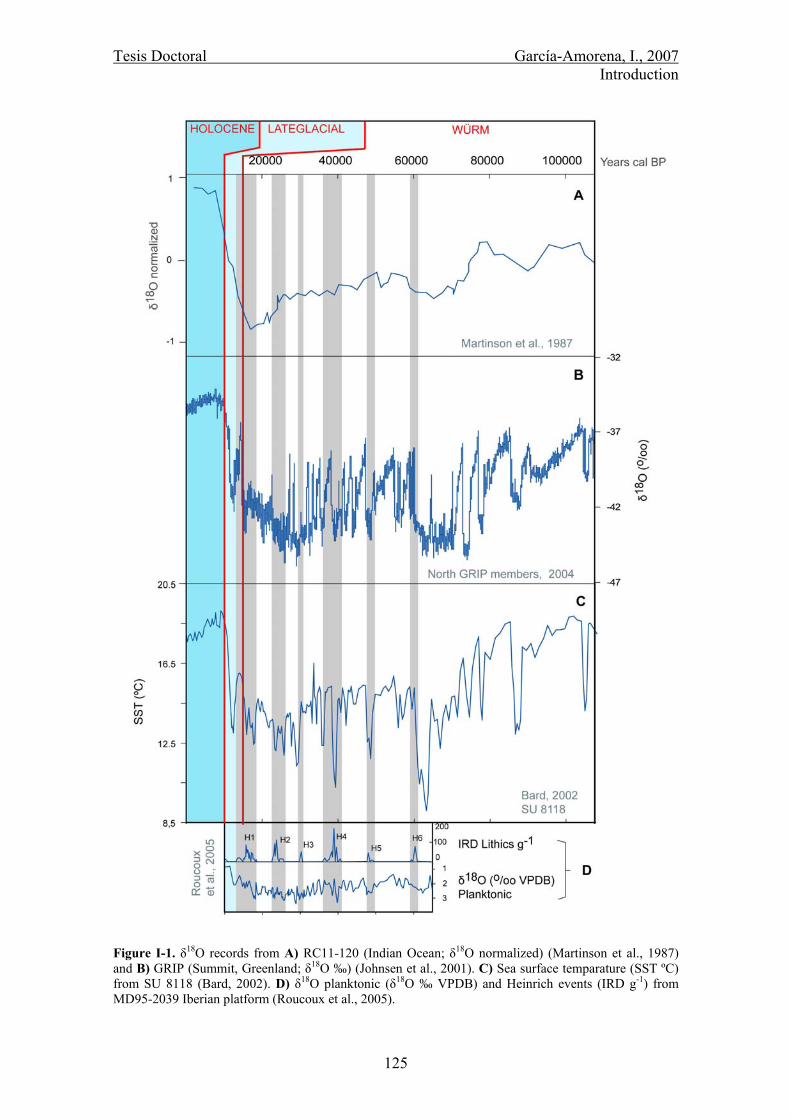
Tesis Doctoral García-Amorena, I., 2007 Introduction
125
Figure I-1. δ18O records from A) RC11-120 (Indian Ocean; δ18O normalized) (Martinson et al., 1987) and B) GRIP (Summit, Greenland; δ18O ‰) (Johnsen et al., 2001). C) Sea surface temparature (SST ºC) from SU 8118 (Bard, 2002). D) δ18O planktonic (δ18O ‰ VPDB) and Heinrich events (IRD g-1) from MD95-2039 Iberian platform (Roucoux et al., 2005).
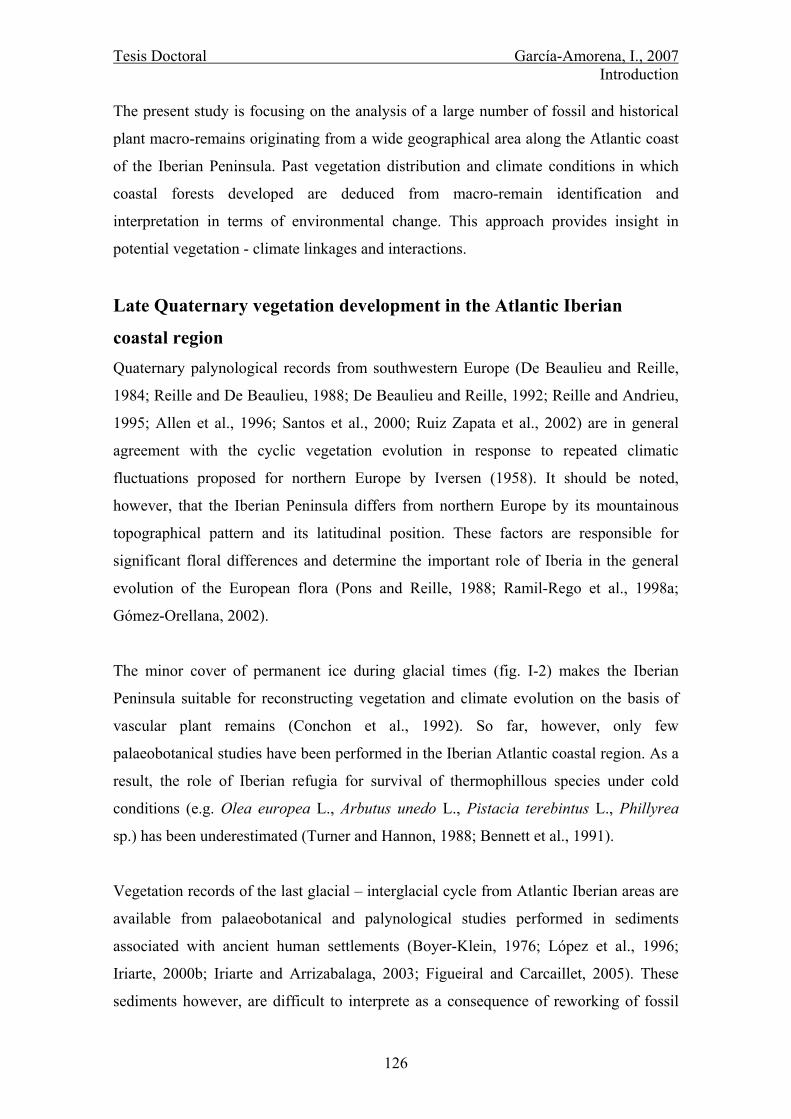
Tesis Doctoral García-Amorena, I., 2007 Introduction
126
The present study is focusing on the analysis of a large number of fossil and historical
plant macro-remains originating from a wide geographical area along the Atlantic coast
of the Iberian Peninsula. Past vegetation distribution and climate conditions in which
coastal forests developed are deduced from macro-remain identification and
interpretation in terms of environmental change. This approach provides insight in
potential vegetation - climate linkages and interactions.
Late Quaternary vegetation development in the Atlantic Iberian
coastal region Quaternary palynological records from southwestern Europe (De Beaulieu and Reille,
1984; Reille and De Beaulieu, 1988; De Beaulieu and Reille, 1992; Reille and Andrieu,
1995; Allen et al., 1996; Santos et al., 2000; Ruiz Zapata et al., 2002) are in general
agreement with the cyclic vegetation evolution in response to repeated climatic
fluctuations proposed for northern Europe by Iversen (1958). It should be noted,
however, that the Iberian Peninsula differs from northern Europe by its mountainous
topographical pattern and its latitudinal position. These factors are responsible for
significant floral differences and determine the important role of Iberia in the general
evolution of the European flora (Pons and Reille, 1988; Ramil-Rego et al., 1998a;
Gómez-Orellana, 2002).
The minor cover of permanent ice during glacial times (fig. I-2) makes the Iberian
Peninsula suitable for reconstructing vegetation and climate evolution on the basis of
vascular plant remains (Conchon et al., 1992). So far, however, only few
palaeobotanical studies have been performed in the Iberian Atlantic coastal region. As a
result, the role of Iberian refugia for survival of thermophillous species under cold
conditions (e.g. Olea europea L., Arbutus unedo L., Pistacia terebintus L., Phillyrea
sp.) has been underestimated (Turner and Hannon, 1988; Bennett et al., 1991).
Vegetation records of the last glacial – interglacial cycle from Atlantic Iberian areas are
available from palaeobotanical and palynological studies performed in sediments
associated with ancient human settlements (Boyer-Klein, 1976; López et al., 1996;
Iriarte, 2000b; Iriarte and Arrizabalaga, 2003; Figueiral and Carcaillet, 2005). These
sediments however, are difficult to interprete as a consequence of reworking of fossil
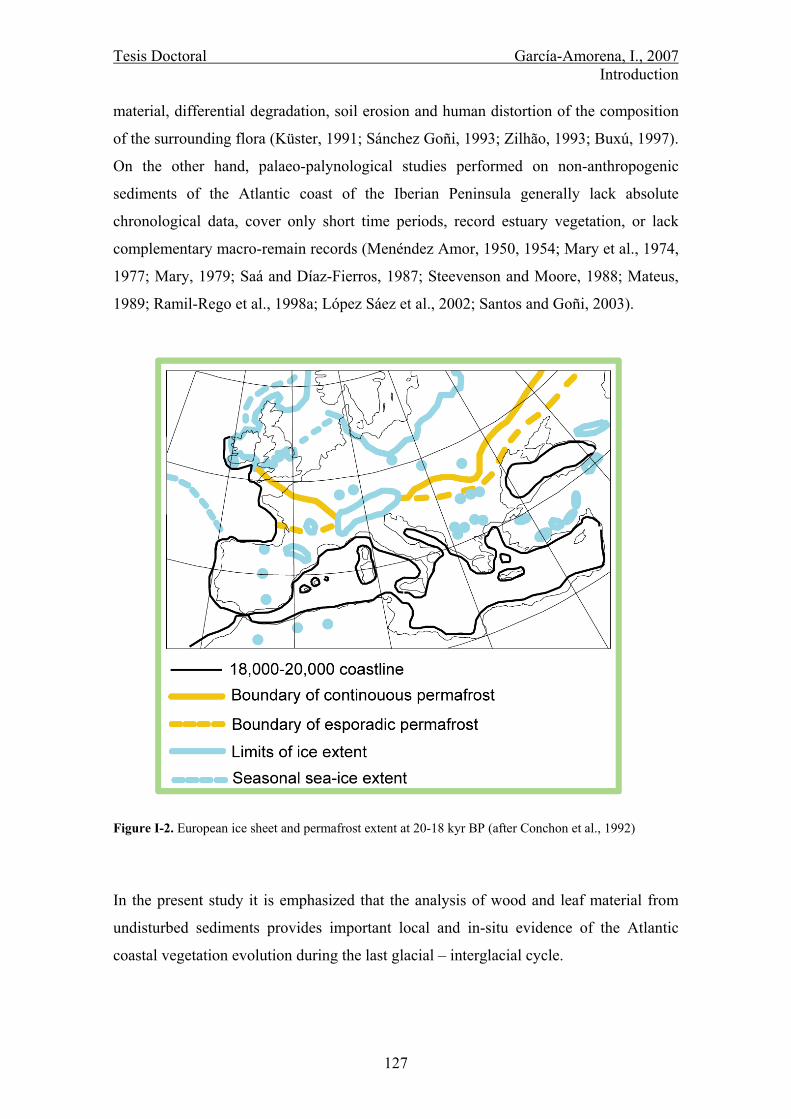
Tesis Doctoral García-Amorena, I., 2007 Introduction
127
material, differential degradation, soil erosion and human distortion of the composition
of the surrounding flora (Küster, 1991; Sánchez Goñi, 1993; Zilhão, 1993; Buxú, 1997).
On the other hand, palaeo-palynological studies performed on non-anthropogenic
sediments of the Atlantic coast of the Iberian Peninsula generally lack absolute
chronological data, cover only short time periods, record estuary vegetation, or lack
complementary macro-remain records (Menéndez Amor, 1950, 1954; Mary et al., 1974,
1977; Mary, 1979; Saá and Díaz-Fierros, 1987; Steevenson and Moore, 1988; Mateus,
1989; Ramil-Rego et al., 1998a; López Sáez et al., 2002; Santos and Goñi, 2003).
Figure I-2. European ice sheet and permafrost extent at 20-18 kyr BP (after Conchon et al., 1992)
In the present study it is emphasized that the analysis of wood and leaf material from
undisturbed sediments provides important local and in-situ evidence of the Atlantic
coastal vegetation evolution during the last glacial – interglacial cycle.
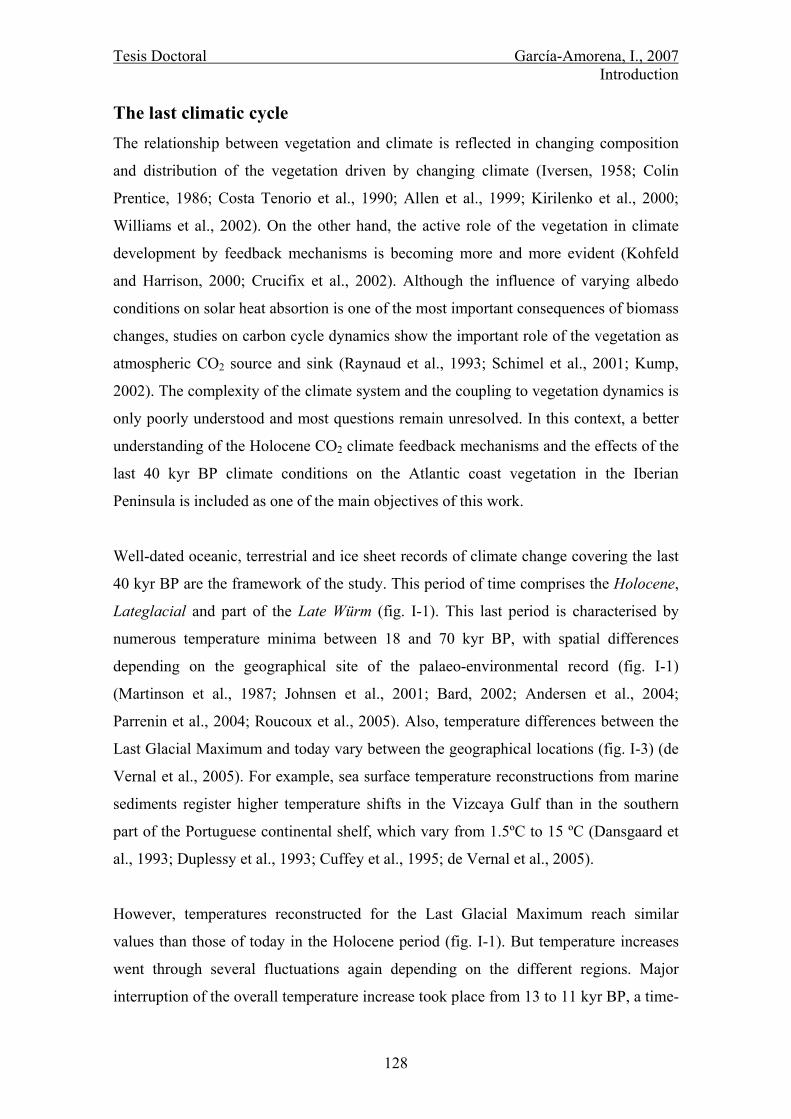
Tesis Doctoral García-Amorena, I., 2007 Introduction
128
The last climatic cycle The relationship between vegetation and climate is reflected in changing composition
and distribution of the vegetation driven by changing climate (Iversen, 1958; Colin
Prentice, 1986; Costa Tenorio et al., 1990; Allen et al., 1999; Kirilenko et al., 2000;
Williams et al., 2002). On the other hand, the active role of the vegetation in climate
development by feedback mechanisms is becoming more and more evident (Kohfeld
and Harrison, 2000; Crucifix et al., 2002). Although the influence of varying albedo
conditions on solar heat absortion is one of the most important consequences of biomass
changes, studies on carbon cycle dynamics show the important role of the vegetation as
atmospheric CO2 source and sink (Raynaud et al., 1993; Schimel et al., 2001; Kump,
2002). The complexity of the climate system and the coupling to vegetation dynamics is
only poorly understood and most questions remain unresolved. In this context, a better
understanding of the Holocene CO2 climate feedback mechanisms and the effects of the
last 40 kyr BP climate conditions on the Atlantic coast vegetation in the Iberian
Peninsula is included as one of the main objectives of this work.
Well-dated oceanic, terrestrial and ice sheet records of climate change covering the last
40 kyr BP are the framework of the study. This period of time comprises the Holocene,
Lateglacial and part of the Late Würm (fig. I-1). This last period is characterised by
numerous temperature minima between 18 and 70 kyr BP, with spatial differences
depending on the geographical site of the palaeo-environmental record (fig. I-1)
(Martinson et al., 1987; Johnsen et al., 2001; Bard, 2002; Andersen et al., 2004;
Parrenin et al., 2004; Roucoux et al., 2005). Also, temperature differences between the
Last Glacial Maximum and today vary between the geographical locations (fig. I-3) (de
Vernal et al., 2005). For example, sea surface temperature reconstructions from marine
sediments register higher temperature shifts in the Vizcaya Gulf than in the southern
part of the Portuguese continental shelf, which vary from 1.5ºC to 15 ºC (Dansgaard et
al., 1993; Duplessy et al., 1993; Cuffey et al., 1995; de Vernal et al., 2005).
However, temperatures reconstructed for the Last Glacial Maximum reach similar
values than those of today in the Holocene period (fig. I-1). But temperature increases
went through several fluctuations again depending on the different regions. Major
interruption of the overall temperature increase took place from 13 to 11 kyr BP, a time-
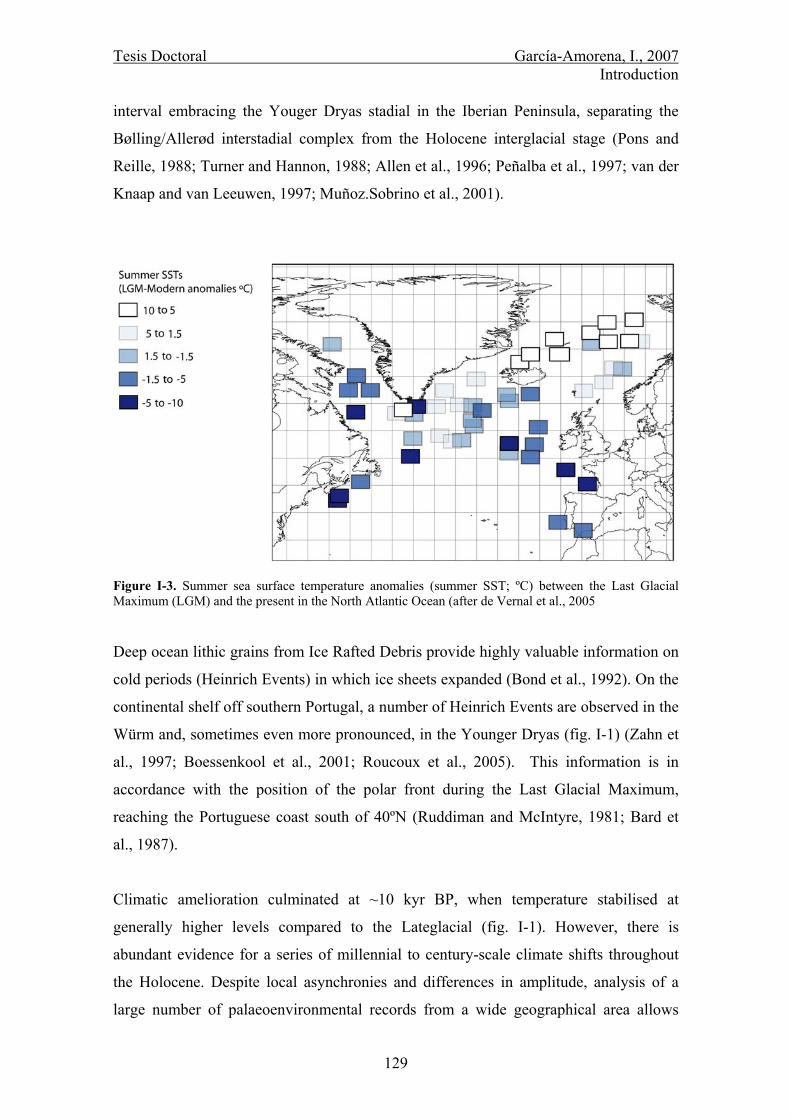
Tesis Doctoral García-Amorena, I., 2007 Introduction
129
interval embracing the Youger Dryas stadial in the Iberian Peninsula, separating the
Bølling/Allerød interstadial complex from the Holocene interglacial stage (Pons and
Reille, 1988; Turner and Hannon, 1988; Allen et al., 1996; Peñalba et al., 1997; van der
Knaap and van Leeuwen, 1997; Muñoz.Sobrino et al., 2001).
Figure I-3. Summer sea surface temperature anomalies (summer SST; ºC) between the Last Glacial Maximum (LGM) and the present in the North Atlantic Ocean (after de Vernal et al., 2005 Deep ocean lithic grains from Ice Rafted Debris provide highly valuable information on
cold periods (Heinrich Events) in which ice sheets expanded (Bond et al., 1992). On the
continental shelf off southern Portugal, a number of Heinrich Events are observed in the
Würm and, sometimes even more pronounced, in the Younger Dryas (fig. I-1) (Zahn et
al., 1997; Boessenkool et al., 2001; Roucoux et al., 2005). This information is in
accordance with the position of the polar front during the Last Glacial Maximum,
reaching the Portuguese coast south of 40ºN (Ruddiman and McIntyre, 1981; Bard et
al., 1987).
Climatic amelioration culminated at ~10 kyr BP, when temperature stabilised at
generally higher levels compared to the Lateglacial (fig. I-1). However, there is
abundant evidence for a series of millennial to century-scale climate shifts throughout
the Holocene. Despite local asynchronies and differences in amplitude, analysis of a
large number of palaeoenvironmental records from a wide geographical area allows
Tesis Doctoral García-Amorena, I., 2007 Introduction
130
recognition of a common temperature pattern (Bond et al., 1997; Masson et al., 2000;
Kaufman et al., 2004; Matewski et al., 2004; Kaplan and Wolfe, 2006).
Although often disturbed by the effects of local climate dynamics, a ~1500 years
quasiperiodic occurrence of cool pulses is observed in the Northern Hemisphere (Bond
et al., 1997; Masson-Delmonte et al., 2005). On longer timescales, a Thermal Maximum
in the first half of the Holocene is recognized (Kaufman et al,. 2004; Kaplan and Wolfe,
2006), which separates the 9-8 kyr cold phase and a Neoglacial cooling after the
Holocene Thermal Maximum (e.g. Peñalba et al., 1997; Heiri et al., 2003; Andersen et
al., 2004; Kaplan et al., 2006). Following these climatic shifts, the warm
Roman/Medieval period next to the Little Ice Age complete the Holocene temperature
framework (fig. I-4) (Duplessy et al., 1993; Kallel et al., 1997; Dahl-Jensen et al., 1998;
Martínez-Corizas et al., 1999).
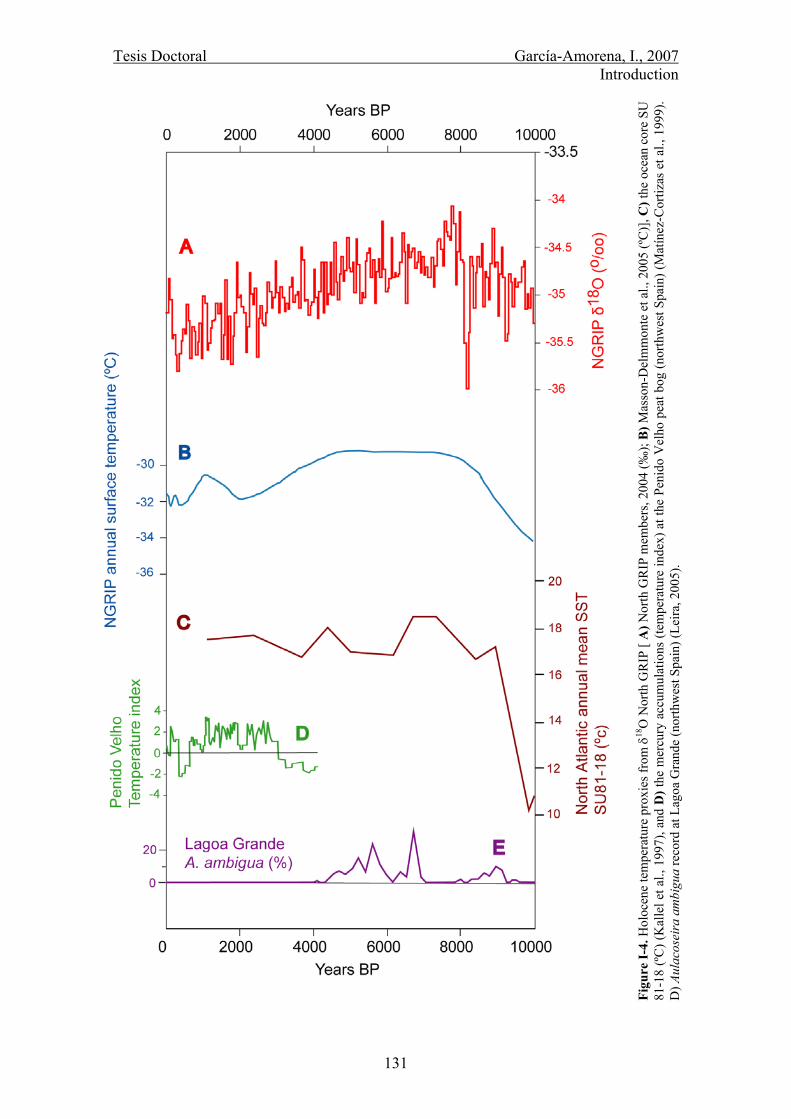
Tesis Doctoral García-Amorena, I., 2007 Introduction
131
Figu
re I-
4. H
oloc
ene
tem
pera
ture
pro
xies
from
δ18
O N
orth
GR
IP [
A) N
orth
GR
IP m
embe
rs, 2
004
(‰);
B) M
asso
n-D
elm
mon
te e
t al.,
200
5 (ºC
)], C
) the
oce
an c
ore
SU
81-1
8 (ºC
) (K
alle
l et a
l., 1
997)
, and
D) t
he m
ercu
ry a
ccum
ulat
ions
(tem
pera
ture
inde
x) a
t the
Pen
ido
Vel
ho p
eat b
og (n
orth
wes
t Spa
in) (
Mat
ínez
-Cor
tizas
et a
l., 1
999)
. D
) Aul
acos
eira
am
bigu
a re
cord
at L
agoa
Gra
nde
(nor
thw
est S
pain
) (Le
ira, 2
005)
.

Tesis Doctoral García-Amorena, I., 2007 Introduction
132
The observed temperature variations throughout the Holocene, however, are only
moderate. The Holocene Thermal Maximum, for example, is characterised on the
Northern Hemisphere by a 1 to 3ºC temperature anomaly compared to present-day
values (Huntley and Prentice, 1988; Martinez-Cortizas et al., 1999; Andersen et al.,
2004). Yet, forest expansion during the first half of the Holocene and subsequent retreat
during the second half seems to be related to climate responses to the changing
amplitude of solar insolation (Kallel et al., 1997; Tzedakis et al., 2005).
But if climate fluctuations are important to understand vegetal evolution, the causes that
drive climate fluctuations should be evaluated. Orbital variations are initially driving
long-term Quaternary climate fluctuations (Crucifix et al., 2002) and corresponding
atmospheric CO2 variations are one of the main factors that might modulate climate
shifts (Raynauld et al., 1993; Thomson, 1997). The striking temperature-atmospheric
CO2 parallelism shown by long-term ice-core records and historical data strongly
supports the important role of this greenhouse gas in climate change (fig. I-5) (Petit et
al., 1999; IPPC, 2001).
On a short-term scale however, temperature fluctuations often mismatch available CO2
records (Caillon et al., 2003). CO2 records from Greenland ice cores, which show
several fluctuations throughout the Holocene, have been claimed to be invalid due to
CO2 enrichment by chemical impurities in the snow (Raynaud et al., 1993). By contrast,
the Antarctic records are considered to be a reliable basis for proposing a stable pre-
industrial atmospheric CO2 regime for the Holocene (Indermühle et al., 1999; Ahn et
al., 2004).
In the present study Holocene CO2 levels are estimated by applying the alternative
stomatal-based method of atmospheric CO2 reconstruction (Beerling and Chaloner,
1993; Kürschner, 1996; Wagner, 1998; Kouwenberg, 2004; van Hoof; 2004; Jessen et
al., 2005; García-Amorena et al., 2006) to the well- preserved leaf assemblages
recovered from road cuts and cliffs in the northern part if the Iberian Peninsula.. Hence,
the feedback of Holocene CO2 on regional climate could be analysed.

Tesis Doctoral García-Amorena, I., 2007 Introduction
133
Figure I-5. Atmosferic CO2 and δ18O records from Dome C ice core (Antarctic) (Petit et al., 1999; Ahn et
al., 2004)
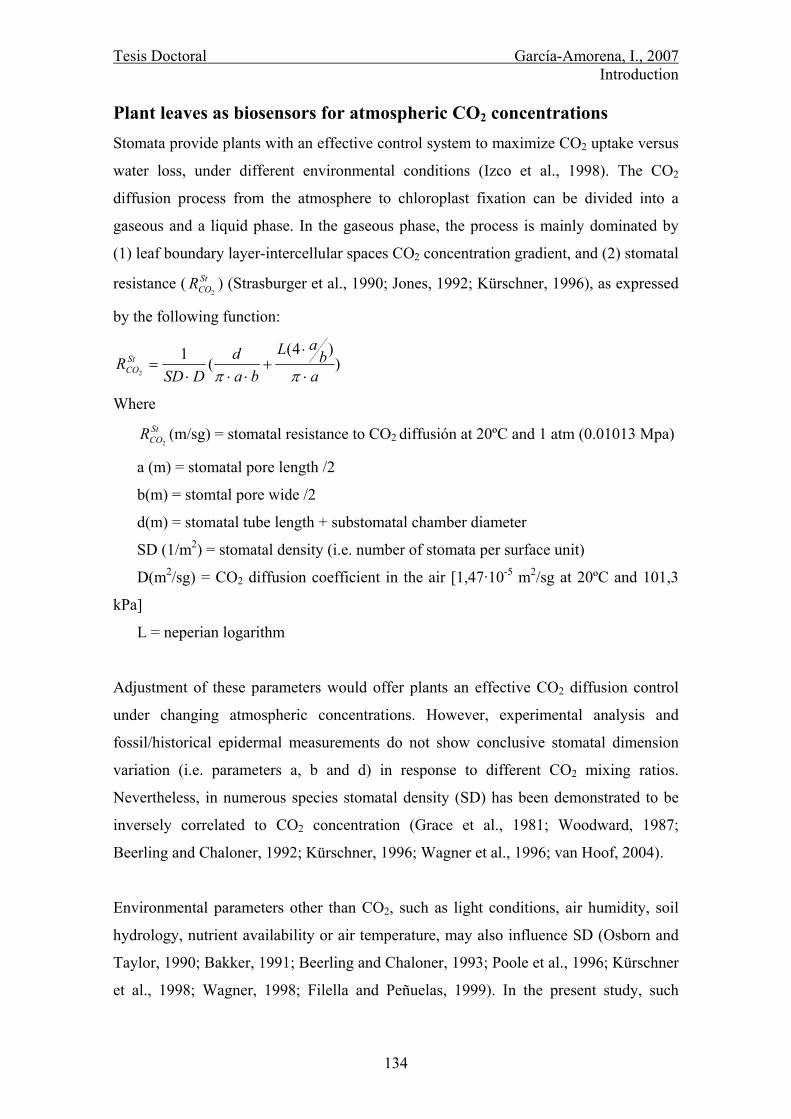
Tesis Doctoral García-Amorena, I., 2007 Introduction
134
Plant leaves as biosensors for atmospheric CO2 concentrations Stomata provide plants with an effective control system to maximize CO2 uptake versus
water loss, under different environmental conditions (Izco et al., 1998). The CO2
diffusion process from the atmosphere to chloroplast fixation can be divided into a
gaseous and a liquid phase. In the gaseous phase, the process is mainly dominated by
(1) leaf boundary layer-intercellular spaces CO2 concentration gradient, and (2) stomatal
resistance ( StCOR
2) (Strasburger et al., 1990; Jones, 1992; Kürschner, 1996), as expressed
by the following function:
))4(
(12 a
baL
bad
DSDR St
CO ⋅
⋅+
⋅⋅⋅=
ππ
Where StCOR
2(m/sg) = stomatal resistance to CO2 diffusión at 20ºC and 1 atm (0.01013 Mpa)
a (m) = stomatal pore length /2
b(m) = stomtal pore wide /2
d(m) = stomatal tube length + substomatal chamber diameter
SD (1/m2) = stomatal density (i.e. number of stomata per surface unit)
D(m2/sg) = CO2 diffusion coefficient in the air [1,47·10-5 m2/sg at 20ºC and 101,3
kPa]
L = neperian logarithm
Adjustment of these parameters would offer plants an effective CO2 diffusion control
under changing atmospheric concentrations. However, experimental analysis and
fossil/historical epidermal measurements do not show conclusive stomatal dimension
variation (i.e. parameters a, b and d) in response to different CO2 mixing ratios.
Nevertheless, in numerous species stomatal density (SD) has been demonstrated to be
inversely correlated to CO2 concentration (Grace et al., 1981; Woodward, 1987;
Beerling and Chaloner, 1992; Kürschner, 1996; Wagner et al., 1996; van Hoof, 2004).
Environmental parameters other than CO2, such as light conditions, air humidity, soil
hydrology, nutrient availability or air temperature, may also influence SD (Osborn and
Taylor, 1990; Bakker, 1991; Beerling and Chaloner, 1993; Poole et al., 1996; Kürschner
et al., 1998; Wagner, 1998; Filella and Peñuelas, 1999). In the present study, such
Tesis Doctoral García-Amorena, I., 2007 Introduction
135
influences are minimized by the selecting sun leaves above 3 m from the ground, and by
using the leaf-area independient Stomatal Index [SI% = 100·SD/(SD+ED); where ED
represents the number of epidermal cells. (Salisbury, 1927; Bazzaz and Williams, 1991;
Kürschner, 1996; Lockheart et al., 1998; García-Amorena et al, 2006).
Stomatal frequency analysis has demonstrated a consistant inverse SI-CO2 relationship
for a variety of species (i.e. Betula pendula, B. pubescens, Quercus robur, Q, petraea,
Salix herbacea, Pinus flexilis, Tsuga menziesii) (Woodward, 1987; Beerling and
Chaloner, 1992; van de Water et al,., 1994; Kürschner, 1996; Wagner, 1998; Rundgren
and Beerling, 1999; Wagner et al., 2000; Guy, 2003; Kouwenberg, 2004; van Hoof et
al., 2005). This relationship has been used to obtain past atmospheric CO2 levels
through the analysis of fossil leaves. For Q. robur and Q. petraea, for example, modern
calibration curves have successfully applied in the reconstruction of fragmentary CO2
records within the Neogene-Holocene time interval (Rundgren and Beerling, 1999;
Wagner et al., 1999; Kürschner 2001; Wagner et al., 2002; van Hoof et al., 2005b). Yet,
the applicability of such calibrations may be largely restricted to the geographical areas
for which the models were developed (Ferris and Taylor, 1994; Wang and Kellomäki,
1997; Hultine and Marshall, 2000; Royer, 2001; Wagner et al., 2004).
In this study it is aimed to achieve a CO2 inference model suitable for obtaining
atmospheric CO2 values from the epidermal parameters of fossil leaves of Q. robur and
Q. petraea from Iberia. Particular attention will be given to the question to what extent
the model is influenced by the specific topography and geographical location of the
Iberian Peninsula.

CHAPTER II: Aims of the study
Tesis Doctoral García-Amorena, I., 2007 Aims of the study
137
The principal objective of this study is the reconstruction of the composition and
dynamics of the Late Quaternary Atlantic coastal Iberian vegetation. The work is
focussing on the question how the climatic fluctuations that occurred in this period
affected the coastal forests. New palaeoclimatological and palaeobotanical data are used
to test concepts of coastal vegetation evolution.
Techniques applied in this work include the analysis of charcoal and sub-fossil macro-
remains, such as woods, branches, leaves, buds, fruits and seeds. The term sub-fossil is
used to refer to non-petrified remains, often with some degree of carbonification (humic
acids enriched material). Wood-anatomical and morphological comparison are the basis
of macro-remain identification. Stomatal frequency analysis is used to obtain CO2
values that characterised the atmosphere in past forests developed.
The aims of this study can be summarised as follows:
Identification of sediments exposed at the Atlantic coast of the Iberian
Peninsula, with late Quaternary plant macro-remains.
Extraction and analysis of the macro-remains with the appropriate techniques for
the best preservation of the fossil.
Identification of the collected fossils at the highest possible taxonomic level.
Trichomes and leaf morphological techniques are developed.
Establishment of an accurate chronology for the sites, based on 14C dating.
Development of a late Quaternary evolution model for vegetation of the Iberian
Atlantic coastal region based on the newly found macro-remains, the actual
palaeobotanical data and current plant distributions.
Extension of existing SI-CO2 models to the Iberian Peninsula for fossil leaves of
species found at the studied sites.

Tesis Doctoral García-Amorena, I., 2007 Aims of the study
138
Contribution to the knowledge of late Quaternary climatic conditions that
affected the Atlantic coastal vegetation of the Iberian Peninsula through
integration of the information provided by the collected macro-remains.
Analysis of potential relations between climate variation and Iberian Atlantic
coastal vegetation dynamics during the time period studied.
CHAPTER III
Stomatal responses in deciduous oaks from southern Europe to the
anthropogenic atmospheric CO2 increase; refining the stomatal-based
CO2 proxy

Tesis Doctoral García-Amorena, I., 2007 Stomatal response in deciduous oaks […] stomatal based CO2 proxy
Abstract
Herbarium specimens of Quercus robur L. from 25 localities on the Iberian Peninsula
covering the time period from 1901 to 2003 were studied to develop a suitable stomatal
index (SI) - atmospheric CO2 inference model that met the specific demands of the
abundant fossil material from this geographical region. Significant SI changes were
observed under the atmospheric CO2 increase since the onset of industrialization,
resembling a sigmoidal response. The highly comparable SI response rates of Iberian
and Northwest European data sets confirmed that Q. robur has reached its response
limit at 330 ppmv, and adaptation of Quercus to changing CO2 concentration is in
principal the same. A 3.5 % SI difference between both data sets is likely to be a result
of the differences in irradiation level at the high- and low- latitudes. An adjusted SI-CO2
calibration data set for the Northern Iberian Peninsula is provided for the CO2 range
from 295 ppmv to 330 ppmv, where the best statistical fit for the CO2 inference model
is achieved when data are restricted to an altitudinal range of 0-1000 m a.s.l.
Geographical extension of the model is attained by the incorporation of the month
irradiance average (W/m2) as an independent factor. Additional pore length increase
was observed over the same CO2 range. Usage of the Stomata-Pore Coefficient
(proportion of pore length over the Stomatal length) was introduced in order to give a
better description of the response of stomatal dimensions to the rising atmospheric CO2
concentrations.
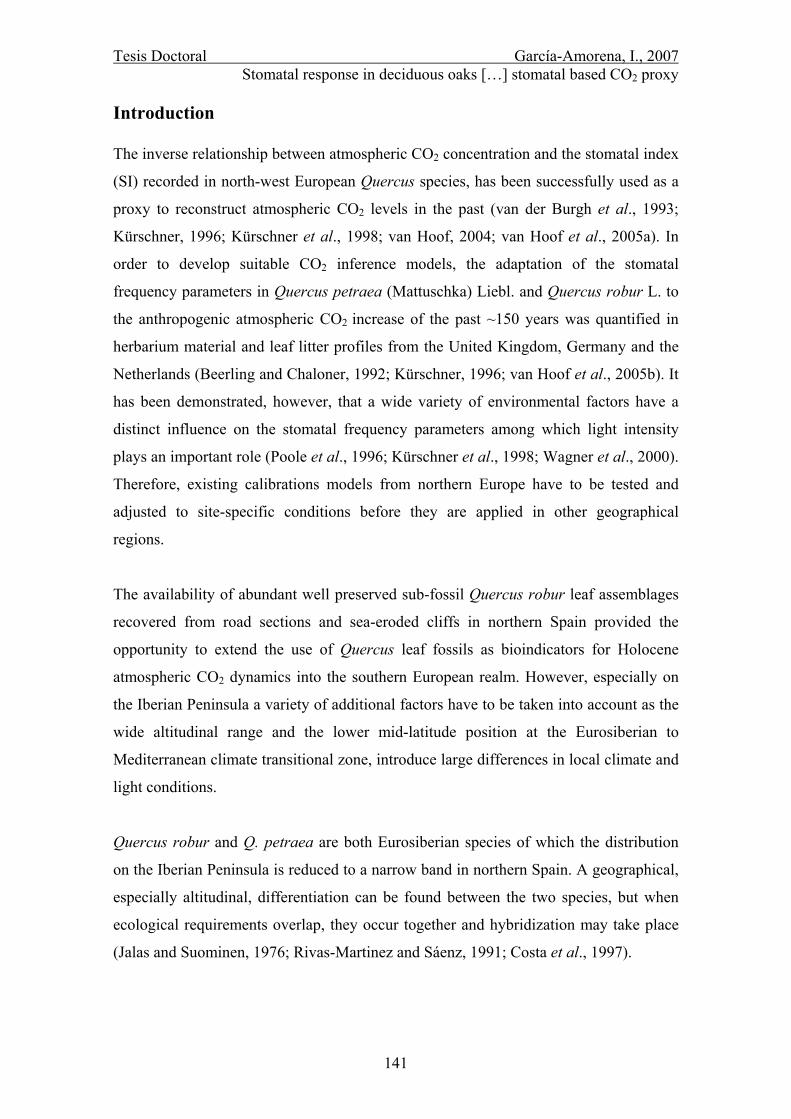
Tesis Doctoral García-Amorena, I., 2007 Stomatal response in deciduous oaks […] stomatal based CO2 proxy
141
Introduction
The inverse relationship between atmospheric CO2 concentration and the stomatal index
(SI) recorded in north-west European Quercus species, has been successfully used as a
proxy to reconstruct atmospheric CO2 levels in the past (van der Burgh et al., 1993;
Kürschner, 1996; Kürschner et al., 1998; van Hoof, 2004; van Hoof et al., 2005a). In
order to develop suitable CO2 inference models, the adaptation of the stomatal
frequency parameters in Quercus petraea (Mattuschka) Liebl. and Quercus robur L. to
the anthropogenic atmospheric CO2 increase of the past ~150 years was quantified in
herbarium material and leaf litter profiles from the United Kingdom, Germany and the
Netherlands (Beerling and Chaloner, 1992; Kürschner, 1996; van Hoof et al., 2005b). It
has been demonstrated, however, that a wide variety of environmental factors have a
distinct influence on the stomatal frequency parameters among which light intensity
plays an important role (Poole et al., 1996; Kürschner et al., 1998; Wagner et al., 2000).
Therefore, existing calibrations models from northern Europe have to be tested and
adjusted to site-specific conditions before they are applied in other geographical
regions.
The availability of abundant well preserved sub-fossil Quercus robur leaf assemblages
recovered from road sections and sea-eroded cliffs in northern Spain provided the
opportunity to extend the use of Quercus leaf fossils as bioindicators for Holocene
atmospheric CO2 dynamics into the southern European realm. However, especially on
the Iberian Peninsula a variety of additional factors have to be taken into account as the
wide altitudinal range and the lower mid-latitude position at the Eurosiberian to
Mediterranean climate transitional zone, introduce large differences in local climate and
light conditions.
Quercus robur and Q. petraea are both Eurosiberian species of which the distribution
on the Iberian Peninsula is reduced to a narrow band in northern Spain. A geographical,
especially altitudinal, differentiation can be found between the two species, but when
ecological requirements overlap, they occur together and hybridization may take place
(Jalas and Suominen, 1976; Rivas-Martinez and Sáenz, 1991; Costa et al., 1997).
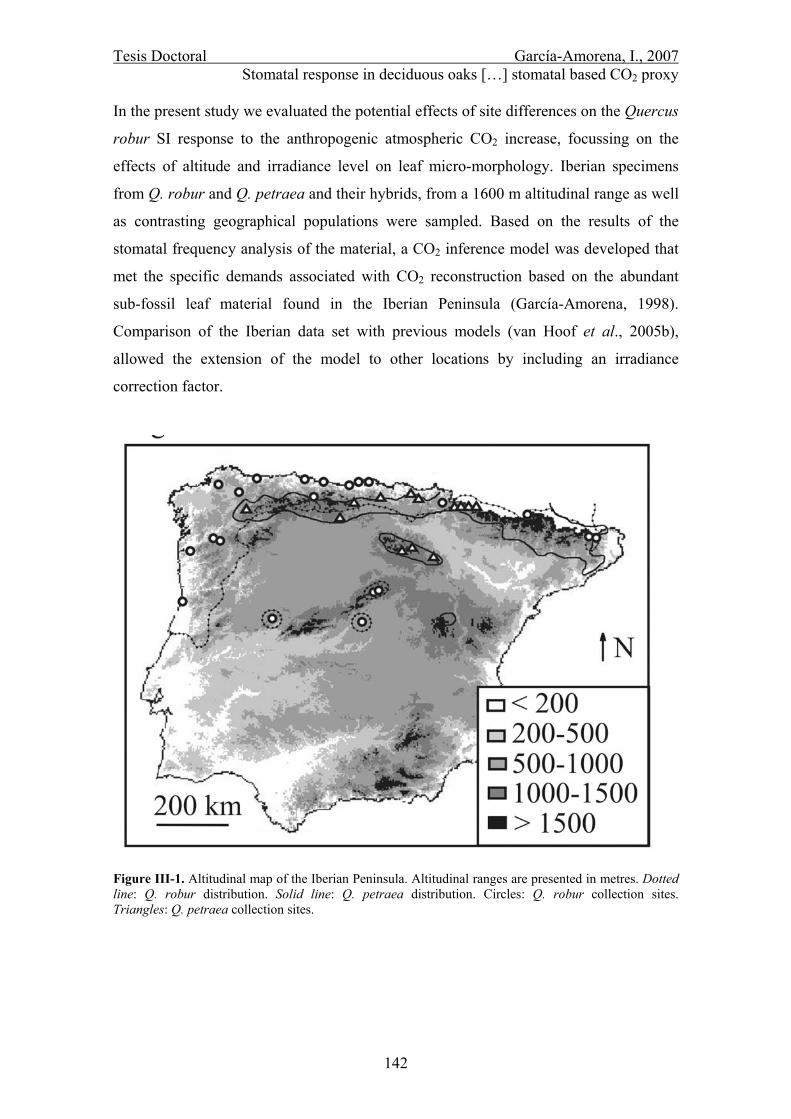
Tesis Doctoral García-Amorena, I., 2007 Stomatal response in deciduous oaks […] stomatal based CO2 proxy
142
In the present study we evaluated the potential effects of site differences on the Quercus
robur SI response to the anthropogenic atmospheric CO2 increase, focussing on the
effects of altitude and irradiance level on leaf micro-morphology. Iberian specimens
from Q. robur and Q. petraea and their hybrids, from a 1600 m altitudinal range as well
as contrasting geographical populations were sampled. Based on the results of the
stomatal frequency analysis of the material, a CO2 inference model was developed that
met the specific demands associated with CO2 reconstruction based on the abundant
sub-fossil leaf material found in the Iberian Peninsula (García-Amorena, 1998).
Comparison of the Iberian data set with previous models (van Hoof et al., 2005b),
allowed the extension of the model to other locations by including an irradiance
correction factor.
Figure III-1. Altitudinal map of the Iberian Peninsula. Altitudinal ranges are presented in metres. Dotted line: Q. robur distribution. Solid line: Q. petraea distribution. Circles: Q. robur collection sites. Triangles: Q. petraea collection sites.
Tesis Doctoral García-Amorena, I., 2007 Stomatal response in deciduous oaks […] stomatal based CO2 proxy
143
Material and methods
Leaf samples
Thirty-four Iberian Q. robur and Q. petraea specimens within a wide geographical
range (fig. III-1) were collected from different herbaria supplemented with modern leaf
material (table III-1) covering the last ~100 years. Modern leaves were taken from
above three meters height on the south exposition of the canopy.
Sun/shade morphotypes were determined by periclinal wall undulation analysis
(undulation index analysis-UI, see formula below) (Kürschner, 1997). Pilot
measurements on shade leaves resulted in a UI >1.5. All further measurements were
restricted to sun leaf morphotypes in order to avoid the potential effect of canopy
variations in humidity and CO2 on the leaf morphology (Bazzaz and Williams, 1991;
Kürschner, 1996; Poole et al., 1996; Lockheart et al., 1998).
Leaves were determined to species according to Flora Iberica (Castroviejo et al., 1990),
and the identification of each sample was confirmed by the presence of stellated
trichoms which characterize Q. petraea but are absent in Q. robur (Penas et al., 1994;
Uzunova et al., 1997). Because the exact altitudinal positions of the sampled herbarium
material were generally not recorded on herbarium sheets, samples were geo-referenced
and maximum and minimum altitudes (table III-1) were obtained from the forest and
topographic maps of the Iberian Peninsula (S.G.E., 1986 onwards; Ruiz de la Torre,
1990-1998).
Lower cuticle preparation and analysis
Squares of 5x5 mm were cut from the central area of the leaves, the most stable part in
terms of stomatal and epidermal cell densities (Tichá, 1982; Poole et al., 1996).
Fragments were boiled in water for one hour to remove wax enclosures, and were
bleached in 4 % sodium-hypochlorite (NaH ClO2) for 12 hours. After rinsing them
several times, upper cuticles and mesophyll were removed; the lower cuticles were
subsequently mounted on microscopic slides in glycerine jelly.
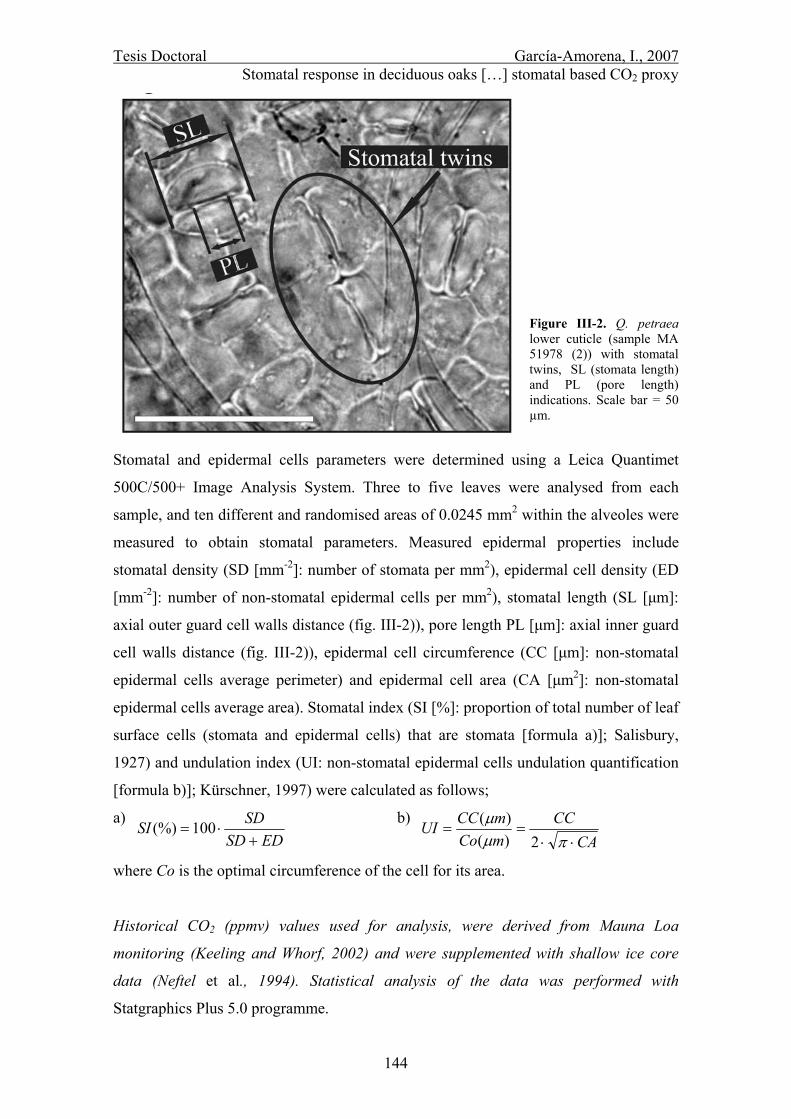
Tesis Doctoral García-Amorena, I., 2007 Stomatal response in deciduous oaks […] stomatal based CO2 proxy
144
Figure III-2. Q. petraea lower cuticle (sample MA 51978 (2)) with stomatal twins, SL (stomata length) and PL (pore length) indications. Scale bar = 50 µm.
Stomatal and epidermal cells parameters were determined using a Leica Quantimet
500C/500+ Image Analysis System. Three to five leaves were analysed from each
sample, and ten different and randomised areas of 0.0245 mm2 within the alveoles were
measured to obtain stomatal parameters. Measured epidermal properties include
stomatal density (SD [mm-2]: number of stomata per mm2), epidermal cell density (ED
[mm-2]: number of non-stomatal epidermal cells per mm2), stomatal length (SL [µm]:
axial outer guard cell walls distance (fig. III-2)), pore length PL [µm]: axial inner guard
cell walls distance (fig. III-2)), epidermal cell circumference (CC [µm]: non-stomatal
epidermal cells average perimeter) and epidermal cell area (CA [µm2]: non-stomatal
epidermal cells average area). Stomatal index (SI [%]: proportion of total number of leaf
surface cells (stomata and epidermal cells) that are stomata [formula a)]; Salisbury,
1927) and undulation index (UI: non-stomatal epidermal cells undulation quantification
[formula b)]; Kürschner, 1997) were calculated as follows;
a) EDSD
SDSI+
⋅= 100(%) b)
CACC
mComCCUI
⋅⋅==
πµµ
2)()(
where Co is the optimal circumference of the cell for its area.
Historical CO2 (ppmv) values used for analysis, were derived from Mauna Loa
monitoring (Keeling and Whorf, 2002) and were supplemented with shallow ice core
data (Neftel et al., 1994). Statistical analysis of the data was performed with
Statgraphics Plus 5.0 programme.
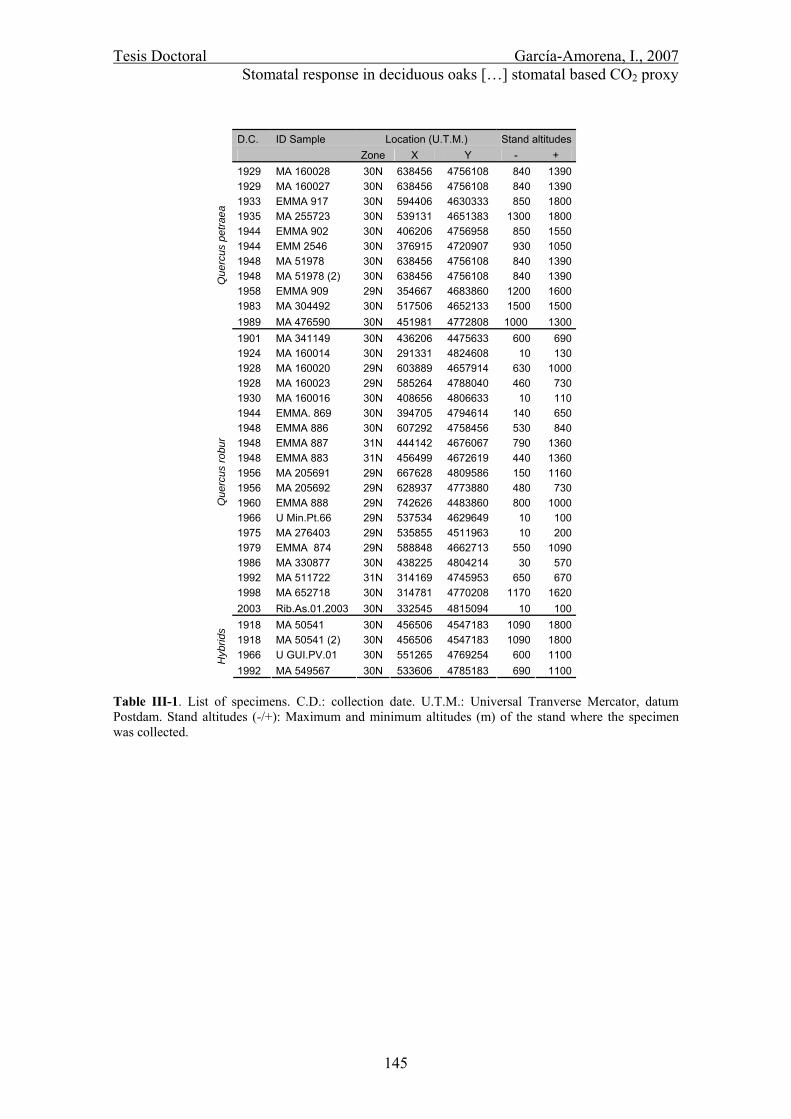
Tesis Doctoral García-Amorena, I., 2007 Stomatal response in deciduous oaks […] stomatal based CO2 proxy
145
D.C. ID Sample Location (U.T.M.) Stand altitudes Zone X Y - +
1929 MA 160028 30N 638456 4756108 840 1390 1929 MA 160027 30N 638456 4756108 840 1390 1933 EMMA 917 30N 594406 4630333 850 1800 1935 MA 255723 30N 539131 4651383 1300 1800 1944 EMMA 902 30N 406206 4756958 850 1550 1944 EMM 2546 30N 376915 4720907 930 1050 1948 MA 51978 30N 638456 4756108 840 1390 1948 MA 51978 (2) 30N 638456 4756108 840 1390 1958 EMMA 909 29N 354667 4683860 1200 1600 1983 MA 304492 30N 517506 4652133 1500 1500
Que
rcus
pet
raea
1989 MA 476590 30N 451981 4772808 1000 1300 1901 MA 341149 30N 436206 4475633 600 690 1924 MA 160014 30N 291331 4824608 10 130 1928 MA 160020 29N 603889 4657914 630 1000 1928 MA 160023 29N 585264 4788040 460 730 1930 MA 160016 30N 408656 4806633 10 110 1944 EMMA. 869 30N 394705 4794614 140 650 1948 EMMA 886 30N 607292 4758456 530 840 1948 EMMA 887 31N 444142 4676067 790 1360 1948 EMMA 883 31N 456499 4672619 440 1360 1956 MA 205691 29N 667628 4809586 150 1160 1956 MA 205692 29N 628937 4773880 480 730 1960 EMMA 888 29N 742626 4483860 800 1000 1966 U Min.Pt.66 29N 537534 4629649 10 100 1975 MA 276403 29N 535855 4511963 10 200 1979 EMMA 874 29N 588848 4662713 550 1090 1986 MA 330877 30N 438225 4804214 30 570 1992 MA 511722 31N 314169 4745953 650 670 1998 MA 652718 30N 314781 4770208 1170 1620
Que
rcus
robu
r
2003 Rib.As.01.2003 30N 332545 4815094 10 100 1918 MA 50541 30N 456506 4547183 1090 1800 1918 MA 50541 (2) 30N 456506 4547183 1090 1800 1966 U GUI.PV.01 30N 551265 4769254 600 1100 H
ybrid
s
1992 MA 549567 30N 533606 4785183 690 1100 Table III-1. List of specimens. C.D.: collection date. U.T.M.: Universal Tranverse Mercator, datum Postdam. Stand altitudes (-/+): Maximum and minimum altitudes (m) of the stand where the specimen was collected.
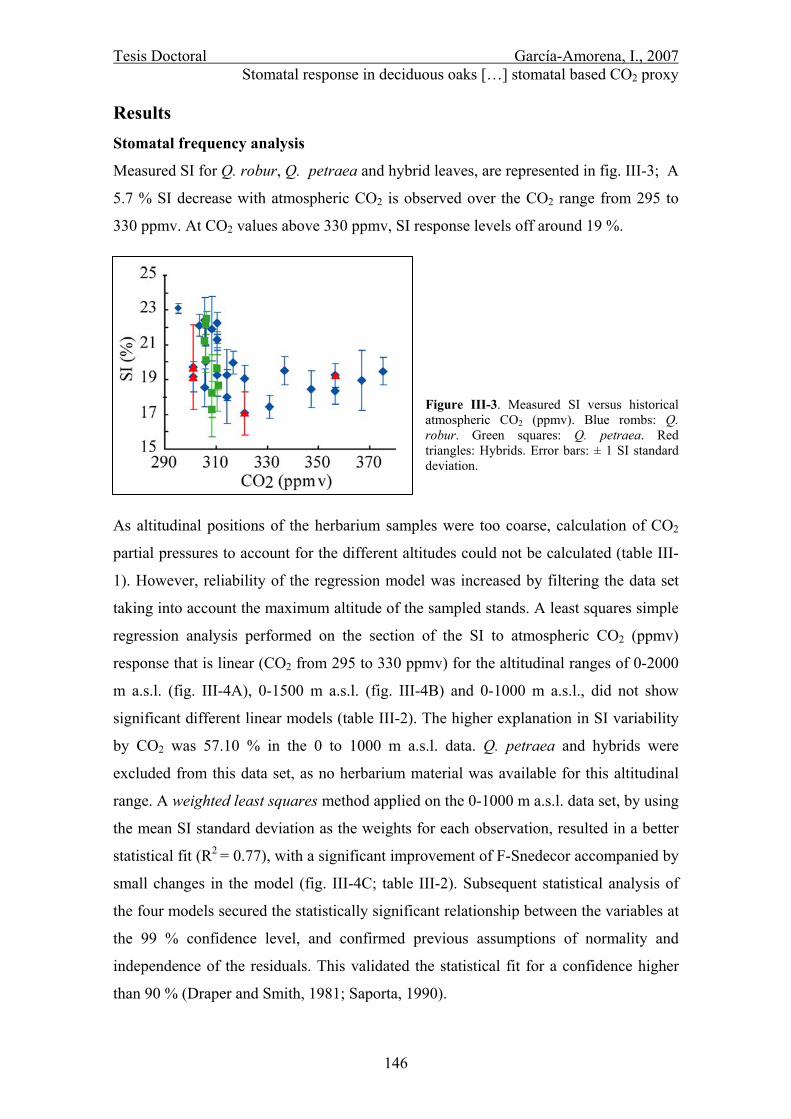
Tesis Doctoral García-Amorena, I., 2007 Stomatal response in deciduous oaks […] stomatal based CO2 proxy
146
Results Stomatal frequency analysis
Measured SI for Q. robur, Q. petraea and hybrid leaves, are represented in fig. III-3; A
5.7 % SI decrease with atmospheric CO2 is observed over the CO2 range from 295 to
330 ppmv. At CO2 values above 330 ppmv, SI response levels off around 19 %. Figure III-3. Measured SI versus historical atmospheric CO2 (ppmv). Blue rombs: Q. robur. Green squares: Q. petraea. Red triangles: Hybrids. Error bars: ± 1 SI standard deviation.
As altitudinal positions of the herbarium samples were too coarse, calculation of CO2
partial pressures to account for the different altitudes could not be calculated (table III-
1). However, reliability of the regression model was increased by filtering the data set
taking into account the maximum altitude of the sampled stands. A least squares simple
regression analysis performed on the section of the SI to atmospheric CO2 (ppmv)
response that is linear (CO2 from 295 to 330 ppmv) for the altitudinal ranges of 0-2000
m a.s.l. (fig. III-4A), 0-1500 m a.s.l. (fig. III-4B) and 0-1000 m a.s.l., did not show
significant different linear models (table III-2). The higher explanation in SI variability
by CO2 was 57.10 % in the 0 to 1000 m a.s.l. data. Q. petraea and hybrids were
excluded from this data set, as no herbarium material was available for this altitudinal
range. A weighted least squares method applied on the 0-1000 m a.s.l. data set, by using
the mean SI standard deviation as the weights for each observation, resulted in a better
statistical fit (R2 = 0.77), with a significant improvement of F-Snedecor accompanied by
small changes in the model (fig. III-4C; table III-2). Subsequent statistical analysis of
the four models secured the statistically significant relationship between the variables at
the 99 % confidence level, and confirmed previous assumptions of normality and
independence of the residuals. This validated the statistical fit for a confidence higher
than 90 % (Draper and Smith, 1981; Saporta, 1990).
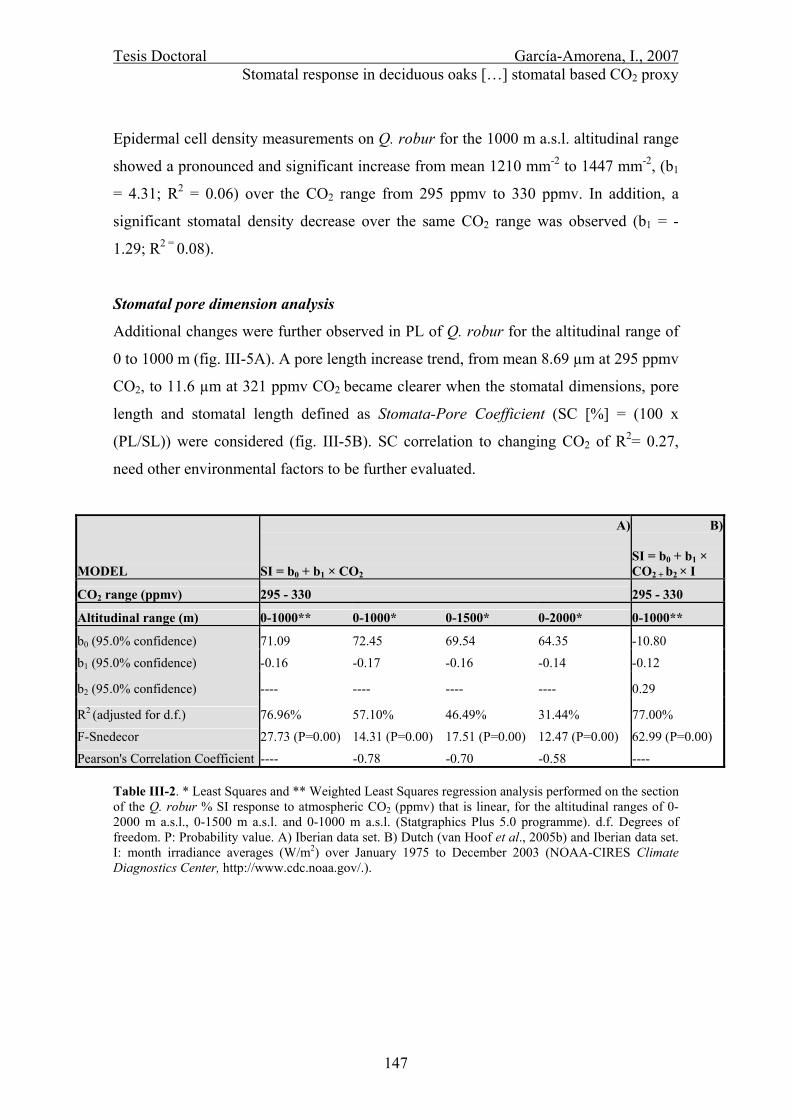
Tesis Doctoral García-Amorena, I., 2007 Stomatal response in deciduous oaks […] stomatal based CO2 proxy
147
Epidermal cell density measurements on Q. robur for the 1000 m a.s.l. altitudinal range
showed a pronounced and significant increase from mean 1210 mm-2 to 1447 mm-2, (b1
= 4.31; R2 = 0.06) over the CO2 range from 295 ppmv to 330 ppmv. In addition, a
significant stomatal density decrease over the same CO2 range was observed (b1 = -
1.29; R2 = 0.08).
Stomatal pore dimension analysis
Additional changes were further observed in PL of Q. robur for the altitudinal range of
0 to 1000 m (fig. III-5A). A pore length increase trend, from mean 8.69 µm at 295 ppmv
CO2, to 11.6 µm at 321 ppmv CO2 became clearer when the stomatal dimensions, pore
length and stomatal length defined as Stomata-Pore Coefficient (SC [%] = (100 x
(PL/SL)) were considered (fig. III-5B). SC correlation to changing CO2 of R2= 0.27,
need other environmental factors to be further evaluated.
MODEL
A) SI = b0 + b1 × CO2
B) SI = b0 + b1 × CO2 + b2 × I
CO2 range (ppmv) 295 - 330 295 - 330
Altitudinal range (m) 0-1000** 0-1000* 0-1500* 0-2000* 0-1000**
b0 (95.0% confidence) 71.09 72.45 69.54 64.35 -10.80
b1 (95.0% confidence) -0.16 -0.17 -0.16 -0.14 -0.12
b2 (95.0% confidence) ---- ---- ---- ---- 0.29
R2 (adjusted for d.f.) 76.96% 57.10% 46.49% 31.44% 77.00%
F-Snedecor 27.73 (P=0.00) 14.31 (P=0.00) 17.51 (P=0.00) 12.47 (P=0.00) 62.99 (P=0.00)
Pearson's Correlation Coefficient ---- -0.78 -0.70 -0.58 ---- Table III-2. * Least Squares and ** Weighted Least Squares regression analysis performed on the section of the Q. robur % SI response to atmospheric CO2 (ppmv) that is linear, for the altitudinal ranges of 0-2000 m a.s.l., 0-1500 m a.s.l. and 0-1000 m a.s.l. (Statgraphics Plus 5.0 programme). d.f. Degrees of freedom. P: Probability value. A) Iberian data set. B) Dutch (van Hoof et al., 2005b) and Iberian data set. I: month irradiance averages (W/m2) over January 1975 to December 2003 (NOAA-CIRES Climate Diagnostics Center, http://www.cdc.noaa.gov/.).
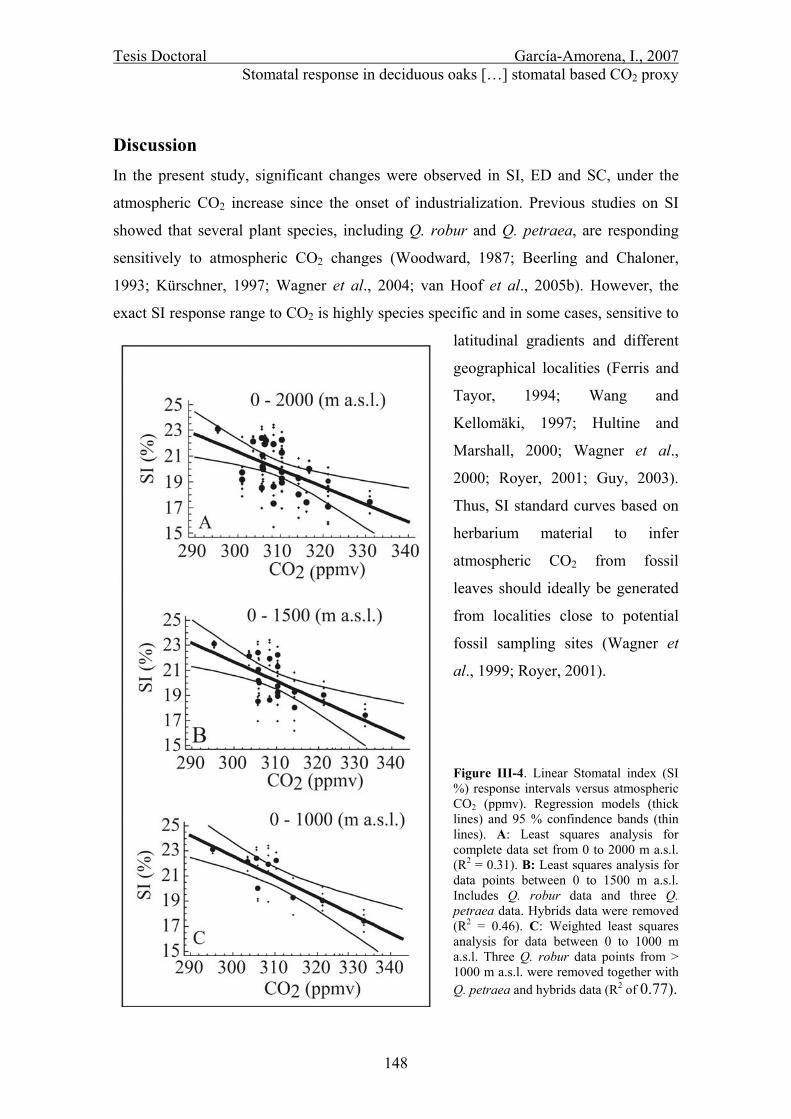
Tesis Doctoral García-Amorena, I., 2007 Stomatal response in deciduous oaks […] stomatal based CO2 proxy
148
Discussion In the present study, significant changes were observed in SI, ED and SC, under the
atmospheric CO2 increase since the onset of industrialization. Previous studies on SI
showed that several plant species, including Q. robur and Q. petraea, are responding
sensitively to atmospheric CO2 changes (Woodward, 1987; Beerling and Chaloner,
1993; Kürschner, 1997; Wagner et al., 2004; van Hoof et al., 2005b). However, the
exact SI response range to CO2 is highly species specific and in some cases, sensitive to
latitudinal gradients and different
geographical localities (Ferris and
Tayor, 1994; Wang and
Kellomäki, 1997; Hultine and
Marshall, 2000; Wagner et al.,
2000; Royer, 2001; Guy, 2003).
Thus, SI standard curves based on
herbarium material to infer
atmospheric CO2 from fossil
leaves should ideally be generated
from localities close to potential
fossil sampling sites (Wagner et
al., 1999; Royer, 2001). Figure III-4. Linear Stomatal index (SI %) response intervals versus atmospheric CO2 (ppmv). Regression models (thick lines) and 95 % confindence bands (thin lines). A: Least squares analysis for complete data set from 0 to 2000 m a.s.l. (R2 = 0.31). B: Least squares analysis for data points between 0 to 1500 m a.s.l. Includes Q. robur data and three Q. petraea data. Hybrids data were removed (R2 = 0.46). C: Weighted least squares analysis for data between 0 to 1000 m a.s.l. Three Q. robur data points from > 1000 m a.s.l. were removed together with Q. petraea and hybrids data (R2 of 0.77).
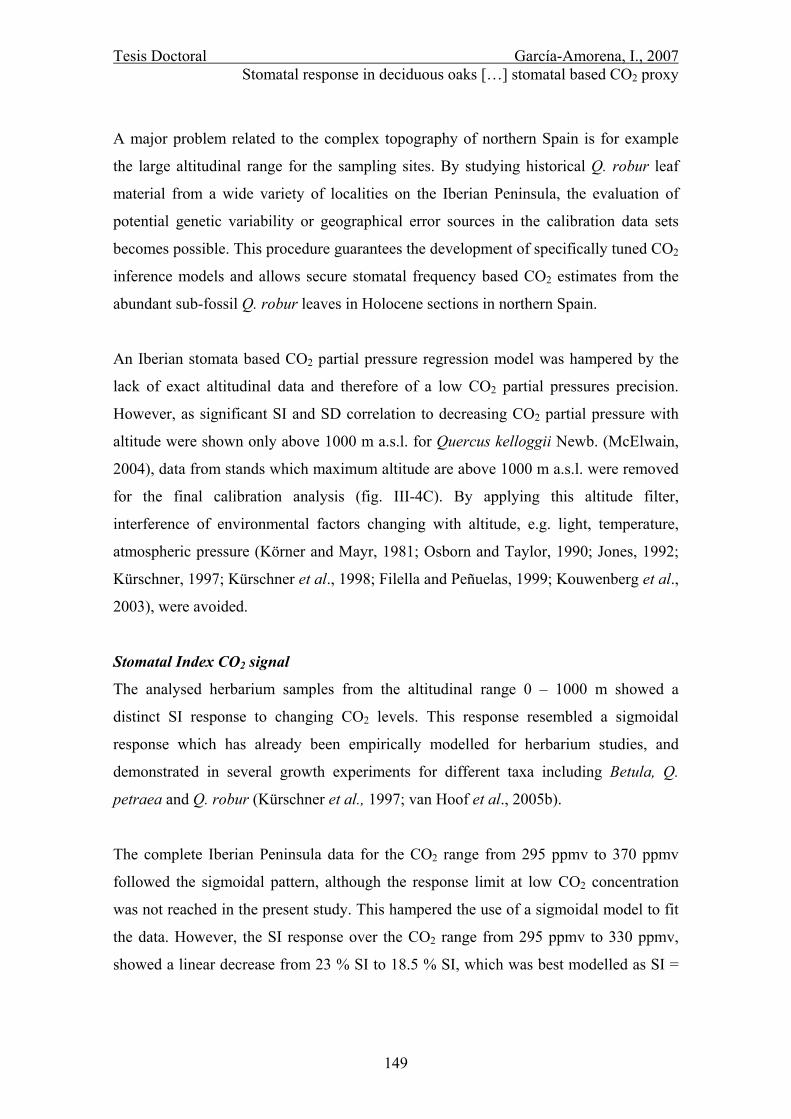
Tesis Doctoral García-Amorena, I., 2007 Stomatal response in deciduous oaks […] stomatal based CO2 proxy
149
A major problem related to the complex topography of northern Spain is for example
the large altitudinal range for the sampling sites. By studying historical Q. robur leaf
material from a wide variety of localities on the Iberian Peninsula, the evaluation of
potential genetic variability or geographical error sources in the calibration data sets
becomes possible. This procedure guarantees the development of specifically tuned CO2
inference models and allows secure stomatal frequency based CO2 estimates from the
abundant sub-fossil Q. robur leaves in Holocene sections in northern Spain.
An Iberian stomata based CO2 partial pressure regression model was hampered by the
lack of exact altitudinal data and therefore of a low CO2 partial pressures precision.
However, as significant SI and SD correlation to decreasing CO2 partial pressure with
altitude were shown only above 1000 m a.s.l. for Quercus kelloggii Newb. (McElwain,
2004), data from stands which maximum altitude are above 1000 m a.s.l. were removed
for the final calibration analysis (fig. III-4C). By applying this altitude filter,
interference of environmental factors changing with altitude, e.g. light, temperature,
atmospheric pressure (Körner and Mayr, 1981; Osborn and Taylor, 1990; Jones, 1992;
Kürschner, 1997; Kürschner et al., 1998; Filella and Peñuelas, 1999; Kouwenberg et al.,
2003), were avoided.
Stomatal Index CO2 signal
The analysed herbarium samples from the altitudinal range 0 – 1000 m showed a
distinct SI response to changing CO2 levels. This response resembled a sigmoidal
response which has already been empirically modelled for herbarium studies, and
demonstrated in several growth experiments for different taxa including Betula, Q.
petraea and Q. robur (Kürschner et al., 1997; van Hoof et al., 2005b).
The complete Iberian Peninsula data for the CO2 range from 295 ppmv to 370 ppmv
followed the sigmoidal pattern, although the response limit at low CO2 concentration
was not reached in the present study. This hampered the use of a sigmoidal model to fit
the data. However, the SI response over the CO2 range from 295 ppmv to 330 ppmv,
showed a linear decrease from 23 % SI to 18.5 % SI, which was best modelled as SI =
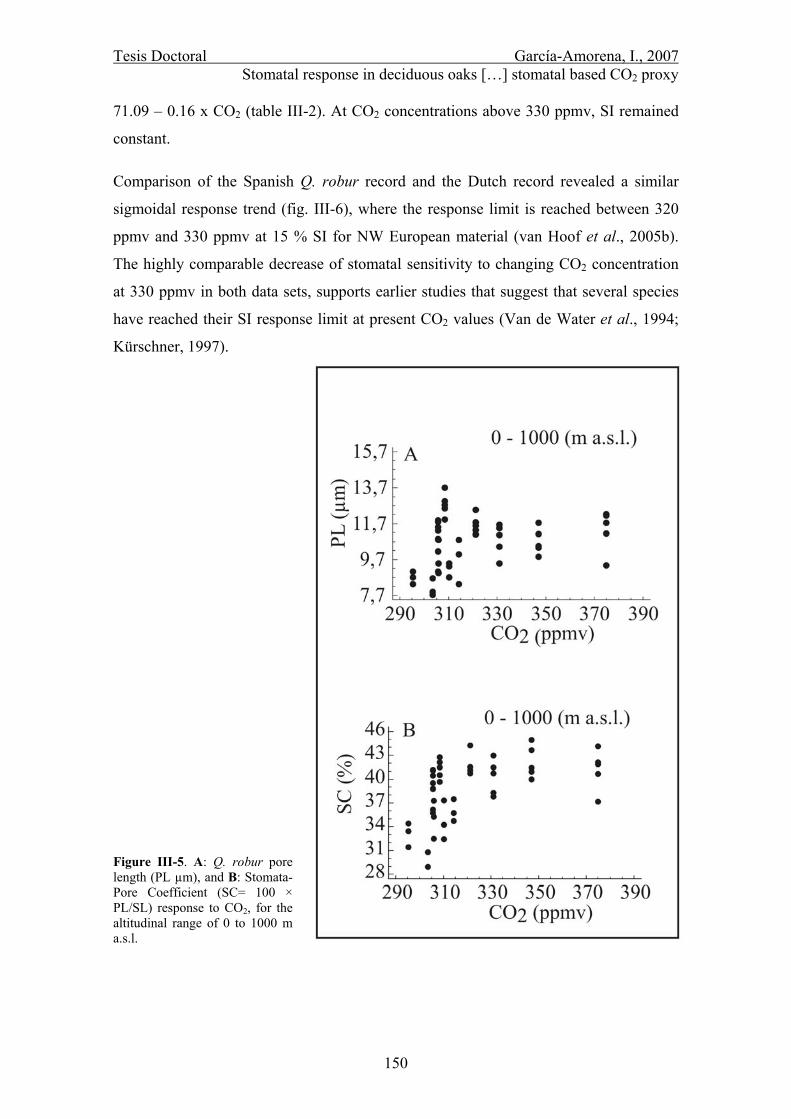
Tesis Doctoral García-Amorena, I., 2007 Stomatal response in deciduous oaks […] stomatal based CO2 proxy
150
71.09 – 0.16 x CO2 (table III-2). At CO2 concentrations above 330 ppmv, SI remained
constant. Comparison of the Spanish Q. robur record and the Dutch record revealed a similar
sigmoidal response trend (fig. III-6), where the response limit is reached between 320
ppmv and 330 ppmv at 15 % SI for NW European material (van Hoof et al., 2005b).
The highly comparable decrease of stomatal sensitivity to changing CO2 concentration
at 330 ppmv in both data sets, supports earlier studies that suggest that several species
have reached their SI response limit at present CO2 values (Van de Water et al., 1994;
Kürschner, 1997). Figure III-5. A: Q. robur pore length (PL µm), and B: Stomata-Pore Coefficient (SC= 100 × PL/SL) response to CO2, for the altitudinal range of 0 to 1000 m a.s.l.
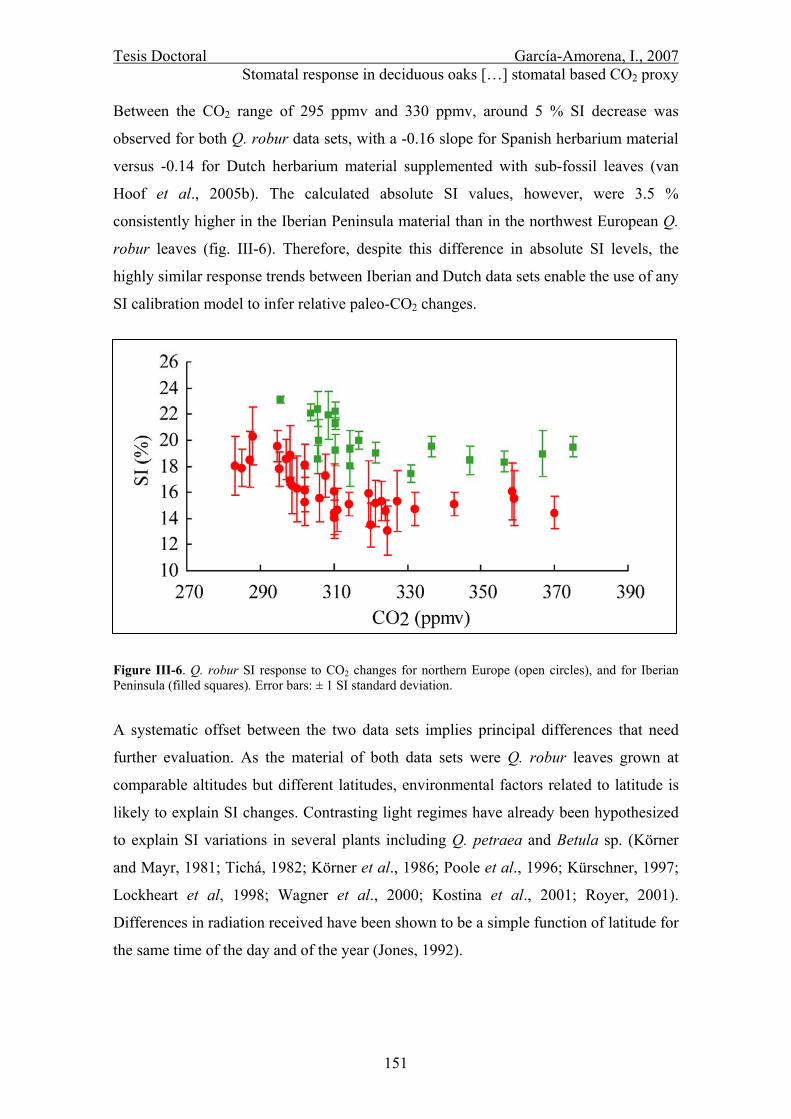
Tesis Doctoral García-Amorena, I., 2007 Stomatal response in deciduous oaks […] stomatal based CO2 proxy
151
Between the CO2 range of 295 ppmv and 330 ppmv, around 5 % SI decrease was
observed for both Q. robur data sets, with a -0.16 slope for Spanish herbarium material
versus -0.14 for Dutch herbarium material supplemented with sub-fossil leaves (van
Hoof et al., 2005b). The calculated absolute SI values, however, were 3.5 %
consistently higher in the Iberian Peninsula material than in the northwest European Q.
robur leaves (fig. III-6). Therefore, despite this difference in absolute SI levels, the
highly similar response trends between Iberian and Dutch data sets enable the use of any
SI calibration model to infer relative paleo-CO2 changes.
Figure III-6. Q. robur SI response to CO2 changes for northern Europe (open circles), and for Iberian Peninsula (filled squares). Error bars: ± 1 SI standard deviation.
A systematic offset between the two data sets implies principal differences that need
further evaluation. As the material of both data sets were Q. robur leaves grown at
comparable altitudes but different latitudes, environmental factors related to latitude is
likely to explain SI changes. Contrasting light regimes have already been hypothesized
to explain SI variations in several plants including Q. petraea and Betula sp. (Körner
and Mayr, 1981; Tichá, 1982; Körner et al., 1986; Poole et al., 1996; Kürschner, 1997;
Lockheart et al, 1998; Wagner et al., 2000; Kostina et al., 2001; Royer, 2001).
Differences in radiation received have been shown to be a simple function of latitude for
the same time of the day and of the year (Jones, 1992).

Tesis Doctoral García-Amorena, I., 2007 Stomatal response in deciduous oaks […] stomatal based CO2 proxy
152
Considering latitudinal positions of the Iberian (≈43 ºN) and northwest Europe (≈52 ºN)
material, the 3.5 % SI difference in SI shown in fig. III-6 could be a result of the 5.68 %
W/m2 annual irradiation increase at the northern Iberian Peninsula, compared to The
Netherlands (calculated from month averages over January-1975 to December-2003;
NOAA-CIRES Climate Diagnostics Center, Boulder, Colorado,
http://www.cdc.noaa.gov/.). A weighted multiple linear regression model performed on
the Dutch and <1000 m a.s.l. Iberian data over the CO2 range from 295 to 330 ppmv
resulted in a highly statistic significant relationship (R2 = 0.77; F-Snedecor = 63),
between SI and the two independent variables (NOAA-CIRES month irradiance average
(W/m2) and CO2 (ppmv)) (table III-2). This model permits the extension of the Q. robur
stomatal-based CO2 proxy to be used in low land regions where no calibration data set
is available. The highly comparable SI response to CO2 changes of Q. petraea (fig. III-
3, van Hoof et al., 2005b) suggests the applicability of this calibration model on Q.
petraea fossil leaves found below 1000 m a.s.l., for the CO2 range from 290 to 330
ppmv.
For further evaluation of the consistently higher SI values observed in the Spanish Q.
robur leaves compared to those from northwest Europe, a number of additional
anatomical parameters known to result from irradiance differences were analysed and
compared. The results indicated smaller alveole areas, the presence of a dense layer of
wax and more frequently occurring “stomatal twins” (fig. III-2) in Iberian Q. robur and
Q. petraea material. Higher SI and the presence of more dense epicuticular waxes have
already been reported as a low latitude and/or high luminosity adaptation (Kürschner,
1996; Osborn and Taylor, 1990). Early studies in 1904 by Zalenski (Tichá, 1982),
showed that upper canopy leaves of nearly 50 plant species had more xeromorphic
structures than lower leaves (e.g. smaller and more numerous stomata per unit leaf area,
more dense leaf venation, smaller epidermical cells and more developed wax layer).
Additional observations like higher Q. ilex L. specific leaf weight at higher locations
(Filella and Peñuelas, 1999), and different sun and shade periclinal cell wall undulation
in Q. petraea (Kürschner, 1997), also demonstrated that light environment during leaf
development affects leaf morphology. These observations support the hypothesis that
the presence of wax and the smaller alveole sizes are protection mechanisms from
increasing UV-B at lower latitudes and also at high altitudes (Rozema et al., 1997).

Tesis Doctoral García-Amorena, I., 2007 Stomatal response in deciduous oaks […] stomatal based CO2 proxy
153
Stomatal size responses
PL and SC, the indicative parameters for stomatal size, showed a clear increase for Q.
robur under the CO2 rise from 295 ppmv to 321 ppmv. Above 321 ppmv the response
leveled off, thus showing the same response range as the measured SI values (fig. III-5).
However, the increasing stomatal dimension response to increasing CO2, that parallels
SI reduction, needs further evaluation. So far, changing leaf cell dimensions have been attributed to several environmental
factors, e.g. irradiance, temperature and humidity or water availability, although some
studies also attributed stomatal dimension changes to CO2 concentrations (eg. Tichá,
1982; Bakker, 1991; Körner et al., 1986; Kostina et al., 2001; Royer, 2001). Evidence
that the size development of leaf stomata is linked to changing CO2 concentrations was
provided by observations in birch stomata, where pore length increased by
approximately 10 % over the CO2 range from 315 ppmv to 365 ppmv (Wagner et al.,
1996). In this case however, the response limits for stomatal frequency parameters and
pore dimension changes were not reached over the CO2 interval studied. Leaf
morphological analyzes of Myrtus communis L. and Juniperus communis L. grown
under elevated CO2 concentrations of 700 ppmv at natural CO2 springs revealed
significantly increasing pore dimensions (Tognetti et al., 2000).
In this study distinct changes in stomatal dimensions under continuously increasing CO2
concentrations are demonstrated for Q. robur for the first time. The significantly
improved correlation of SC data (fig. III-5), showed that the use of SC rather than SL or
PL minimizes the influence of environmental factors other than CO2 (water availability,
irradiance, etc.) that may cause stomatal size expansion. Whether this pattern is also
present in the Dutch Q. robur material is difficult to assess, since stomatal dimension
measurements were not available for this data set. Nevertheless, SC calculations from
PL and SL determinations provided for Q. petraea, M. communis and J. communis
(Kürschner, 1996; Tognetti et al., 2000), did not show significant differences at above
present CO2 values.
Stomatal resistance models showed that decreasing stomatal frequency leads to higher
stomatal resistance, while enlargement of stomatal pores has the opposite effect

Tesis Doctoral García-Amorena, I., 2007 Stomatal response in deciduous oaks […] stomatal based CO2 proxy
154
(Parlange and Waggoner, 1970; Jones, 1992; Guy, 2003). Therefore, increased stomatal
resistance caused by reduced stomatal frequency in response to CO2 increase is
compensated by simultaneously increased stomatal size in the Iberian Q. robur. An
index that combine both parameters [Stomatal Pore Area Index (SPI) = product of SD
and SL] was linearly correlated to leaf hydraulic conductance (Sack et al., 2003).
Hence, observed stability of SPI over the CO2 range from 290 to 330 ppmv suggested
that subsequent leaf hydraulic conductance is also constant. The product of SP and SI,
which better account for leaf transpiration surface (Guy, 2003), shows the same relative
stability. However, transpiration rates were demonstrated to increase with smaller but
higher number of stomata for a given transpiration surface (von Denffer et al., 1990, p
328). It can, thus, be hypothesized from observed changes on the anatomy (SC) and
distribution of stomata (SI) that plant benefits from reducing stomatal size and
increasing stomatal frequencies under low CO2 values by improving the timing and
efficiency of stomatal opening processes. Such argument is in good agreement with
previous observations that inversely related stomatal aperture and the size of guard cells
with changing CO2 (eg. Miglietta and Raschi, 1993). Since only few studies including
stomatal dimensions are available, and mostly provide data from experiments under
elevated CO2 concentrations, further testing of this hypothesis is required.
CHAPTER IV
Atmospheric CO2 radiative forcing during the Holocene Thermal
Maximum revealed by stomatal frequency analysis
Tesis Doctoral García-Amorena, I., 2007 Atmospheric CO2 radiative forcing […]
Abstract Epidermal properties of fossil oak (Quercus robur) leaf assemblages from northern
Spain have been analysed to obtain past atmospheric CO2 mixing ratios for the time
period 9-1 kyr BP. Normalized CO2 records show fluctuations of 20 ppmv during the
Holocene with minima at 8570 and 2830 cal BP, and a maximum at 5860 cal BP. The
calculated radiative forcing of CO2 parallels long-term palaeotemperature
reconstructions for the Northern Hemisphere, revealing an early Holocene cool period, a
Holocene Thermal Maximum from 7 to 4 kyr BP, and the neoglacial cooling ending at
2830 cal BP with a moderate increase towards the warm Roman/Medieval period.
Derived Northern Hemispheric air-temperature anomalies forced by atmospheric CO2
variation of up to 0.19ºC suggest an active role of this trace gas as an amplifier of initial
orbital forcing of Holocene climate. Orbital-independent dynamic mechanisms of CO2
exchange are considered to contribute to the millennial-scale Holocene climate shifts.
Tesis Doctoral García-Amorena, I., 2007 Atmospheric CO2 radiative forcing […]
157
Introduction Evidence of peak Holocene warmth is observed in an extensive number of continuous
palaeoenvironmental records from the Northern Hemisphere (NH) between 11 to 5 kyr
BP, giving name to the so-called Holocene Thermal Maximum (HTM) (Kaufman et al.,
2004). Earth’s orbital variation has been considered the fundamental cause of climate
change during the Holocene. Although precession and obliquity changes are responsible
for the NH insolation decrease during this period (Crucifix et al., 2002), these factors
cannot completely explain the spatial variation in timing and magnitude of the HTM.
Feedbacks of other factors that could exert important effects after an initial temperature
change, such as vegetation distribution, ocean and ice sheet dynamics, are not
sufficiently intense to explain the millennial-scale temperature changes observed
throughout the Holocene. Thus, changing atmospheric composition remains as one of
the most important climate driving forces (Raynauld et al., 1993). So far, variations in
water vapour content is considered to be the main radiative forcing feedback factor. A
role for atmospheric CO2 is generally denied since the Antarctic ice core records show
little variation in the concentration of this greenhouse gas during the Holocene
(Indermühle et al., 1999, Ahn et al., 2004, Kaufman et al., 2004).
Alternative CO2 records based on stomatal frequency analysis are questioning this
scenario of a decoupling of global temperature and atmospheric CO2 concentrations on
millennial to centennial time scales (Wagner et al., 2004; Kouwenberg et al., 2005, van
Hoof et al., 2005a). Numerous studies, in which the inverse relation between numbers
of gas pores on plant leaves and atmospheric CO2 levels is used to estimate past CO2
levels from fossil leaf remains, provide increasing evidence for a dynamic atmospheric
CO2 regime throughout the Holocene (Wagner et al. 1999; Kürschner 2001; McElwain
et al., 2002; Wagner et al. 2002; Rundgren and Björck, 2003; Wagner 2004; Jessen et
al., 2005; van Hoof et al., 2005a). So far, however, only few studies are available which
cover the entire Holocene (Rundgren and Beeling, 1999). Such records would
contribute to a better understanding of long-term Holocene CO2 changes and the
potential ocean-atmosphere feedback mechanisms during interglacial periods.
A recent study on the CO2 sensitivity of Quercus robur from northern Spain has shown
that reliable CO2 estimates can be derived from fossil oak leaves from mid-latitude sites
Tesis Doctoral García-Amorena, I., 2007 Atmospheric CO2 radiative forcing […]
158
(García-Amorena et al., 2006). Here we exploit well-preserved Holocene Q. robur leaf
assemblages, recovered from road cuts and sea-eroded cliffs in northern Spain. The
composite sequence provides a stomatal frequency based CO2 record for a considerable
part of the Holocene. From the radiative forcing of the reconstructed CO2 trends
between 9000 cal BP and 1000 cal BP potential temperature anomalies are calculated.
This procedure enables a direct comparison with existing proxy-based NH temperature
records and allows an evaluation of the potential role of CO2 as amplifying mechanism
of insolation-induced Holocene temperature anomalies.

Tesis Doctoral García-Amorena, I., 2007 Atmospheric CO2 radiative forcing […]
159
Study area Holocene leaf assemblages were collected at three locations, Villaviciosa, Pravia and
Merón, located at the Cantabrian coast of the Iberian Peninsula (fig. IV-1, table IV-1).
The Villaviciosa and Pravia estuaries are narrow incisions in a Jurassic basement filled
by fluvial-marine Holocene sediments. Infilling of the Villaviciosa channel took place
from the basement upwards in several pulses in which the river moved from east to west
(Pages et al., 2003). The lithology changes from gravels at the basements to sandy
matrix with rich organic matter intercalations, silty clays with plant remains and podzol
with roots at the top (fig. IV-1). These successions correspond to high-energy fluvial
channels, intertidal flats and marshes, and recent forest soil, respectively. The sixteen
available cores drilled in the Pravia estuary are similar to the Villaviciosa stratigraphic
evolution and sediment infill pattern, with a common high to low hydrological energy
discontinuity at 18 m (fig. IV-1).
Figure IV-1. Location of sampled sites on northern Iberia altitudinal map and geologic cross sections of the estuaries with location of 14C-datings.
At the third sampling site, Merón (fig. IV-1), peat deposits and clay sediments with
plant remains are exposed in an eroded cliff section. The deposits represent the infill of
a hydrologic incision in the Pleistocene beach basement. The abundant plant remains,
including rich leaf assemblages, originate from the surrounding forests drowned during
the Flandrian water table increase ~ 6000 – 7000 BP (Garzón et al., 1996).
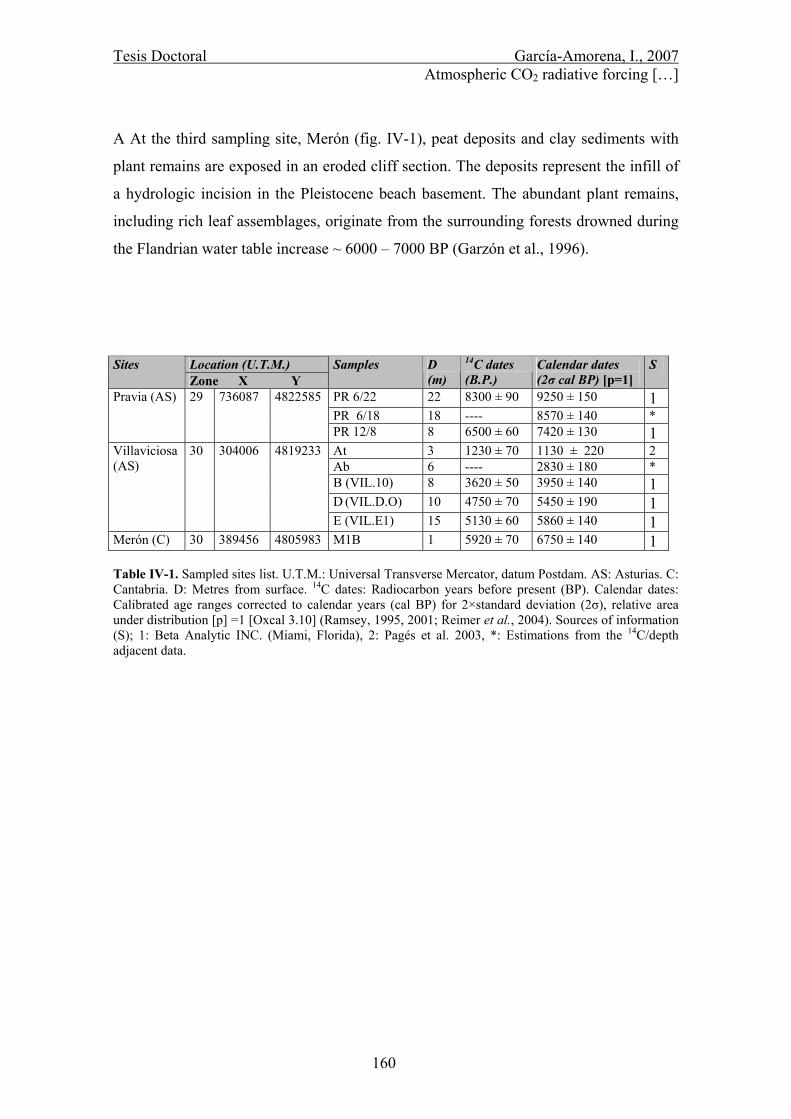
Tesis Doctoral García-Amorena, I., 2007 Atmospheric CO2 radiative forcing […]
160
A At the third sampling site, Merón (fig. IV-1), peat deposits and clay sediments with
plant remains are exposed in an eroded cliff section. The deposits represent the infill of
a hydrologic incision in the Pleistocene beach basement. The abundant plant remains,
including rich leaf assemblages, originate from the surrounding forests drowned during
the Flandrian water table increase ~ 6000 – 7000 BP (Garzón et al., 1996).
Table IV-1. Sampled sites list. U.T.M.: Universal Transverse Mercator, datum Postdam. AS: Asturias. C: Cantabria. D: Metres from surface. 14C dates: Radiocarbon years before present (BP). Calendar dates: Calibrated age ranges corrected to calendar years (cal BP) for 2×standard deviation (2σ), relative area under distribution [p] =1 [Oxcal 3.10] (Ramsey, 1995, 2001; Reimer et al., 2004). Sources of information (S); 1: Beta Analytic INC. (Miami, Florida), 2: Pagés et al. 2003, *: Estimations from the 14C/depth adjacent data.
Location (U.T.M.) Sites Zone X Y
Samples D (m)
14C dates (B.P.)
Calendar dates (2σ cal BP) [p=1]
S
PR 6/22 22 8300 ± 90 9250 ± 150 1 PR 6/18 18 ---- 8570 ± 140 *
Pravia (AS) 29 736087 4822585
PR 12/8 8 6500 ± 60 7420 ± 130 1 At 3 1230 ± 70 1130 ± 220 2 Ab 6 ---- 2830 ± 180 * B (VIL.10) 8 3620 ± 50 3950 ± 140 1 D (VIL.D.O) 10 4750 ± 70 5450 ± 190 1
Villaviciosa (AS)
30 304006 4819233
E (VIL.E1) 15 5130 ± 60 5860 ± 140 1 Merón (C) 30 389456 4805983 M1B 1 5920 ± 70 6750 ± 140 1
Tesis Doctoral García-Amorena, I., 2007 Atmospheric CO2 radiative forcing […]
161
Methods The age assessment for the nine studied leaf assemblages is based on conventional 14C
dating of fossil wood collected from each layer or core sampled. Conventional 14C ages
were calibrated and are given as cal BP. The ages of samples Ab and PR6/18 were
estimated from the 14C/depth adjacent data.
All sediment samples were sieved with 50 g/l tetra-sodium pyrophosphate (Na4P2O7
10H2O) to dilute the clay. Q. robur leaf fragments were extracted and identified by their
morphological and anatomical characters (Castroviejo et al., 1990; Westerkamp, 1997).
To exclude leaf fragments from hybrids with other Quercus species, only leaf remains
with simple glandulate trichomes were analysed (Peñas et al., 1994; Uzunova et al.,
1997). Identified Q. robur leaf fragments were carefully brushed and, where necessary,
immersed in 50% fluoric acid (HF) to remove remaining silica. Samples of
approximately 5 × 5 mm from the central part of the leaves, where stomatal and
epidermal parameters are more stable (Poole et al., 1996), were bleached in 4% sodium
hypochlorite (NaH ClO2) for 30 seconds. After rinsing them for 5 minutes, they were
mounted on microscopic slides with glycerine jelly. Epidermal parameters were
measured with a Leica Quantimet 500C/500+Image Analysis System.
Ten leaf fragments of each horizon were taken to obtain stomatal and epidermal cell
parameters as described by García-Amorena et al. (2006). On each leaf fragment
stomatal density (SD [mm-2]) and epidermal cell density (ED [mm-2]) was measured in
ten different and randomised areas of 0.0245 mm2 within the alveoles. For the stomatal
length (SL [µm]), pore length (PL [µm]), epidermal cell circumference (CC [µm]) and
epidermal cell area (CA [µm2]) measurements, ten different stomata or epidermal cells
per leaf fragment were randomly selected. From the measured parameters, the stomatal
index {SI [%] = 100×SD/(SD+ED); Salisbury, 1927}, undulation index {UI = CC/ 2π√
(CA/ π); Kürschner, 1997} and stomatal coefficient (SC [%] = 100·PL/SL; Garcia-
Amorena et al., 2006) were calculated.
All measurements were made on sun morphotypes to avoid the effect of canopy
variations in light, humidity and CO2 on the leaf morphology (Bazzaz and Williams,
1991; Kürschner, 1996; Poole et al., 1996; Lockheart et al., 1998); sun leaves were
Tesis Doctoral García-Amorena, I., 2007 Atmospheric CO2 radiative forcing […]
162
determined by the periclinal wall undulation analysis (UI < 1.5) (Kürschner, 1997;
Garcia-Amorena et al., 2006).
Atmospheric CO2 mixing ratios (ppmv) were calculated for each sample by converting
the SI average and 1×standard deviation with the CO2 inference model {CO2 [ppmv] = -
6.25×(SI-71.09); Garcia-Amorena et al., 2006}, specifically developed for Q. robur
grown within the range of 0 to 1000 m a.s.l. in mid- to low-latitude areas. Variation in
radiative forcing (dF [W/m2]) induced by the inferred CO2 shifts were calculated from
the following approach proposed by Myhre et al. (1998):
⎥⎦⎤
⎢⎣⎡⋅=COCLndF α
Where α = 5.35, CO represents the unperturbed CO2 base level of 278 ppmv as
recommended by the IPPC (2001), and C is the CO2 mixing ratio (ppmv) here taken as
the reconstructed normalised CO2 superimposed on the 278 ppmv base level.
The global temperature response to the calculated variations in radiative forcing was
assessed on the basis of calculations derived from the coupled ocean-atmospheric
climate model ECBilt-CLIO (Opsteegh et al., 1998; Goosse and Fichefet, 1999).

Tesis Doctoral García-Amorena, I., 2007 Atmospheric CO2 radiative forcing […]
163
Results 14C age assessments show that the Villaviciosa estuary records the major part of the
Holocene. The studied sequence is complimented by the older sediments from Merón
and Pravia (table IV-1). The collected fossil leaf assemblages accordingly cover the
time interval from 9250 to 1130 cal BP.
The measured SI values from which the atmospheric CO2 mixing ratios were inferred
are shown in figure IV-2A. Early Holocene values are characterized by high SI averages
of 19.2% to 19.5%, corresponding to CO2 levels of 322 ppmv to 324 ppmv. A
continuous SI decrease reaches a minimum with a mean value of 16.4% (342 ppmv
CO2) at 5860 cal BP. Following a SI rise to 19% (326 ppmv CO2) at 2830 cal BP, SI
successively decreases to a mean value of 17.8% (333 ppmv CO2) at 1130 cal BP.
This SI values are within the natural variability observed in the specific SI-CO2
calibration curve for the northern Iberian Peninsula 0-1000 m a.s.l. altitudinal range
(García-Amorena et al., 2006). This regression model was calculated for 17.5% to 23%
mean SI, corresponding to CO2 mixing ratios from 295 to 330 ppmv. Although some of
the measured SI values for fossil Q. robur are within the species-specific lower
response limit to atmospheric CO2 concentrations, relative CO2 changes can be
recognized by this model. Reconstructed CO2 levels are normalized in figure IV-2B in
order to facilitate comparison with other CO2 records.
Additional stomatal parameters were measured on the fossil leaves in order to provide
an independent CO2 proxy (Garcia-Amorena et al., 2006). The SC record (fig. IV-2C)
and the SI-based CO2 trends (fig. IV-2B) share a remarkable similarity pattern. Low SC
values at the beginning of the Holocene with a minimum of 30% SC at 7420 cal BP,
followed by a rapid increase to a SC maximum of 37.39% at 6750 cal BP, a decrease to
31.01 at 5450 cal BP, and a further stabilization fluctuating at around 32.32% with a
minimum at 2810 cal BP (31.26% SC), are in accordance with the reconstructed CO2
trend (fig. IV-2B).
Radiative forcing variations induced by the SI-inferred CO2 mixing ratios are plotted in
figure IV-2A. The reconstructed atmospheric CO2 changes throughout the Holocene

Tesis Doctoral García-Amorena, I., 2007 Atmospheric CO2 radiative forcing […]
164
explain up to 0.19ºC Northern Hemisphere temperature variation between the CO2
minimum at 8570 cal BP and the Holocene maximum at 5860 cal BP (fig. IV-2B). A
difference of 0.15ºC is observed in this figure between the Holocene CO2 peak value to
a secondary minimum at 2830 cal BP.
Figure IV-2. A) Mean stomatal index (SI %) values (dots) of fossil layers based on stomatal counts. B) Reconstructed normalized CO2 mixing ratios (ppmv) for 9250-1130cal PB, based on the Q. robur SI record and the CO2 inference model for northern Iberia {CO2 [ppmv] = -6.25×(SI-71.09); Garcia-Amorena et al., 2006}. C) Mean SC (%) (dots) based on pore dimension measurements on fossil leaves. Error bars: ± 1 standard deviation for SI, reconstructed CO2, SC and cal BP.
Tesis Doctoral García-Amorena, I., 2007 Atmospheric CO2 radiative forcing […]
165
Discussion
Although the intrinsic natural variability of stomatal frequency in tree leaves (Tichá,
1982; Poole et al., 1996) introduces certain scatter in the SI data set (fig. IV-2A), mean
values of numerous measurements have been demonstrated to be a reliable proxy of
ambient atmospheric CO2 mixing ratios in which the leaves were formed (Wagner et al.,
2004). Yet, the amplitudes of the long-term CO2 shifts recorded in the stomata record of
the northern Iberian fossil Q. robur leaf assemblages does not support the relatively
small Holocene variations as reconstructed from Antarctic ice-core records (fig. IV-2B,
Indermühle, 1999; Ahn et al., 2004). The relatively large uncertainties of the stomatal
frequency based CO2 reconstruction and the need to use response models to derive a
CO2 estimate from the measured stomatal indices are inherent to a proxy-based
methodology. This could result in a slight overestimation of the recorded amplitude of
CO2 changes. However, the discrepancies of 25 ppmv in amplitudes between ice-core
records and stomata-based CO2 records can be fully explained by firn-diffusion based
smoothing of the CO2 signal in ice-cores (van Hoof et al., 2005a).
Holocene CO2 reconstruction
Three major Holocene climatic events on the Northern Hemisphere appear to
correspond to trends in the normalized CO2 reconstruction: The early Holocene cool
period, characterized by CO2 levels of -9 ppmv below the Holocene mean at 8570 cal
BP; the Holocene Thermal Maximum (HTM), shown by the positive CO2 anomalies up
to +10.4 ppmv from ~7000 cal BP to ~4000 cal BP (shades area in fig. IV-3); and the
Neoglacial cooling (NC) revealed by -5.5 ppmv CO2 deviation at 2830 cal BP (Alley et
al., 1997; Kaufman et al., 2004; Kaplan et al., 2006). The return to mean Holocene CO2
values at 1230 cal BP might be related to the Roman/Medieval warm period (WRP)
(Martinez-Cortizas et al., 1999). Calculated irradiance forcing for these CO2
fluctuations, accounts for up to -0.09ºC decrease at the early Holocene cool period, for
0.1ºC during peak HTM warmth and for -0.05ºC at the NC (fig. IV-3B). 0.02ºC rise
from the NC minimum characterises the return to mean CO2 values.
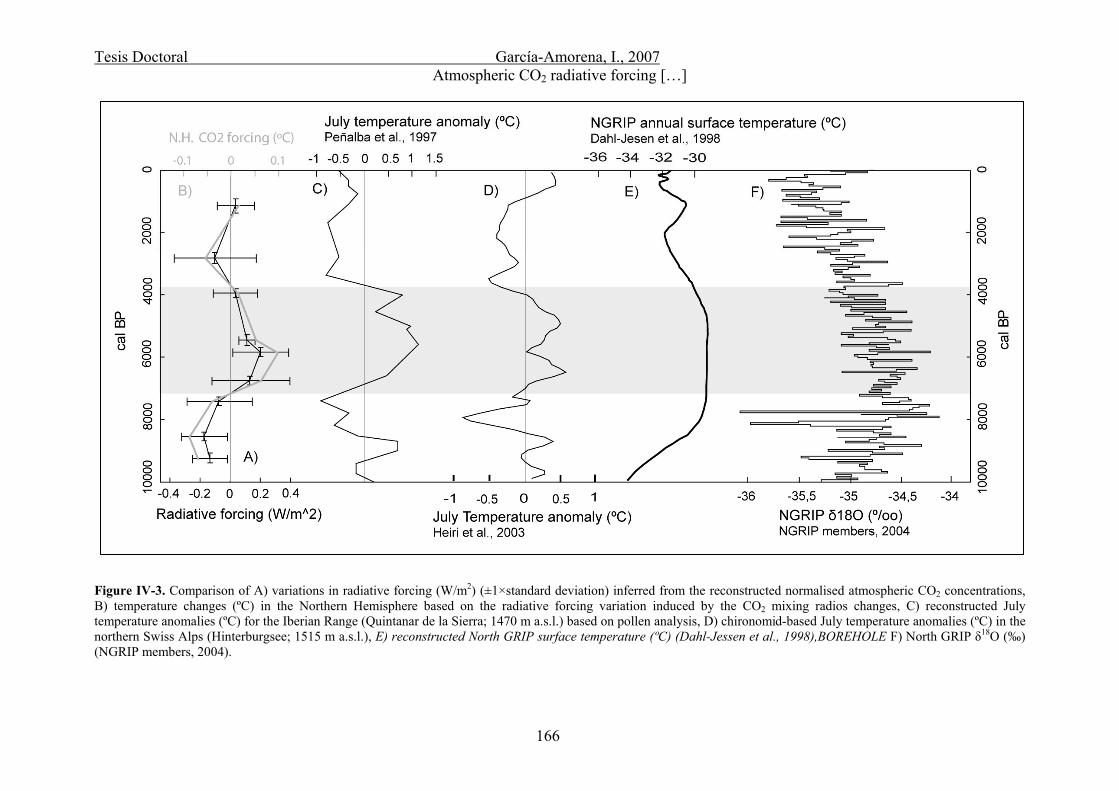
Tesis Doctoral García-Amorena, I., 2007 Atmospheric CO2 radiative forcing […]
166
Figure IV-3. Comparison of A) variations in radiative forcing (W/m2) (±1×standard deviation) inferred from the reconstructed normalised atmospheric CO2 concentrations, B) temperature changes (ºC) in the Northern Hemisphere based on the radiative forcing variation induced by the CO2 mixing radios changes, C) reconstructed July temperature anomalies (ºC) for the Iberian Range (Quintanar de la Sierra; 1470 m a.s.l.) based on pollen analysis, D) chironomid-based July temperature anomalies (ºC) in the northern Swiss Alps (Hinterburgsee; 1515 m a.s.l.), E) reconstructed North GRIP surface temperature (ºC) (Dahl-Jessen et al., 1998),BOREHOLE F) North GRIP δ18O (‰) (NGRIP members, 2004).

Tesis Doctoral García-Amorena, I., 2007 Atmospheric CO2 radiative forcing […]
The role of CO2 radiative forcing on Holocene climate change
Correlations between stomata-based CO2 records with existing local palaeotemperature
reconstructions during the Holocene are generally hampered by different response
times, sensitivity of individual records and spatial occurence to climate variations
(Kaufman et al., 2004). However, reconstructed summer temperature anomalies derived
from pollen and chironomid assemblages in the northern Iberian Range (Peñalba et al.,
1997) and in the northern Swiss Alps (Heiri et al., 2003) are both highly sensitive to
regional temperature changes. These records correlate well with our radiative forcing
estimates, reflecting respectively -0.9 and -0.87ºC anomalies during the early Holocene
cool period. The HTM peak is characterised in these records by +1.13 and +0.57ºC
deviation, and a -0.8 / -0.51ºC anomalies at the minimum NC are followed by an
increase to -0.33 / -0.23ºC at ~1100 cal BP (fig.s IV-3C, IV-3D).
Mean annual temperature reconstructions from boreholes (Dahl-Jensen et al., 1998) and
spatially averaged Holocene temperature records for the NH (Kaufman et al., 2004)
reveal the same temporal pattern of comparable shifts in temperature. Peak HTM is
reached at 7000 cal BP in the majority of the records (Kaplan et al., 2006), with 1.6 ±
0.8ºC mean positive anomaly (Kaufman et al., 2004). In some records, these high
temperatures are maintained for 2-3 kyr BP (fig. IV-3E) (Dahl-Jensen et al., 1998). A
steady temperature decrease following the HTM is observed in most of the NH
palaeotemperature reconstructions (fig. IV-3F) (NGRIP members, 2004; Kaplan et al.,
2006). Borehole minimum temperature is reached at 2000 cal BP paralleling the
stomatal CO2 reconstruction (fig.s IV-2B, IV-3E). The WRP temperature increase
recorded in NH sites and Borehole annual temperature reconstructions (fig. IV-3E)
(Dahl-Jensen et al., 1998; Kaplan et al., 2006) coincides with the return to Holocene
mean CO2 concentrations in the uppermost horizon studied.
The strong link between various Holocene palaeotemperature reconstructions for the
NH and our SI-derived CO2 data (fig. IV-3) suggests that the 20 ppmv CO2 shifts
observed for this period explain up to 0.2ºC variation. The amplitude of this forcing is
about 10% of the NH Holocene mean temperature anomalies.
Although it is agreed that climate is driven by Earth’s orbital variation (Kaufman et al.,
2004) the Holocene millennial-scale climatic shifts cannot solely be explained by the
Tesis Doctoral García-Amorena, I., 2007 Atmospheric CO2 radiative forcing […]
168
steady reduction of annual mean insolation during this period. For example, the 2 W/m2
reductions at 65ºN from 10 kyr BP to present could only explain 1ºC reduction
(Crucifix et al., 2002; Liu et al., 2003). Recent studies combining numerical climate
models with palaeoenvironmental records attribute Holocene climate events to a range
of forcing factors (e.g. Laurentide Ice Sheet albedo and melting, timing of plant
colonization, atmospheric-ocean circulation) (Kaufman et al., 2004). Yet, although
atmospheric trace gas concentrations have been considered in these works, CO2
concentrations have been discarded due to the apparent non-variability observed in the
widely used Antarctic ice cores smoothed CO2 reconstructions (Indermühle et al., 1999;
Van Hoof et al., 2005a).
In contrast, the 0.2ºC CO2 radiative forcing, estimated by the stomata-based 20 ppmv
CO2 shifts throughout the Holocene, accounts for ~20% of the variation in annual
insolation at 65ºN. This highlights the magnitude of the atmospheric CO2 forcing on the
millennial time scale Holocene climate system.
However, the different pattern observed between the CO2 trend and the steady annual
insolation decrease during the Holocene (Crucifix et al., 2002) indicates that the
atmospheric CO2 mechanisms operate independently from orbitally driven climate
mechanisms. Although changes in the terrestrial biosphere play a role in short-term
carbon cycle dynamics, their potential to change CO2 mixing ratios on longer terms
during the Holocene is limited (Kouwenberg et al., 2005). Thus, as a resuslt of surface
and subsurface changes in water temperatures and chemical properties, oceans remain
both the main source and the main sink of CO2 (Bacastow, 1996; Liu et al., 2003).
Therefore, it can be hypothesized that the atmospheric CO2 feedbacks and amplification
of orbital forcing had a strong influence on millennial-scale Holocene climate
variability. This is also supported by long-term Quaternary CO2 - temperature coupling
and model simulations of historical observations that indicated a positive feedback of
CO2 on temperature variations (Raynauld et al., 1993; Petit et al., 1999; Shackleton
2000; Stott et al., 2000).

CHAPTER V
Impact of the last glacial-interglacial cycle on the coastal forests of
western Iberia
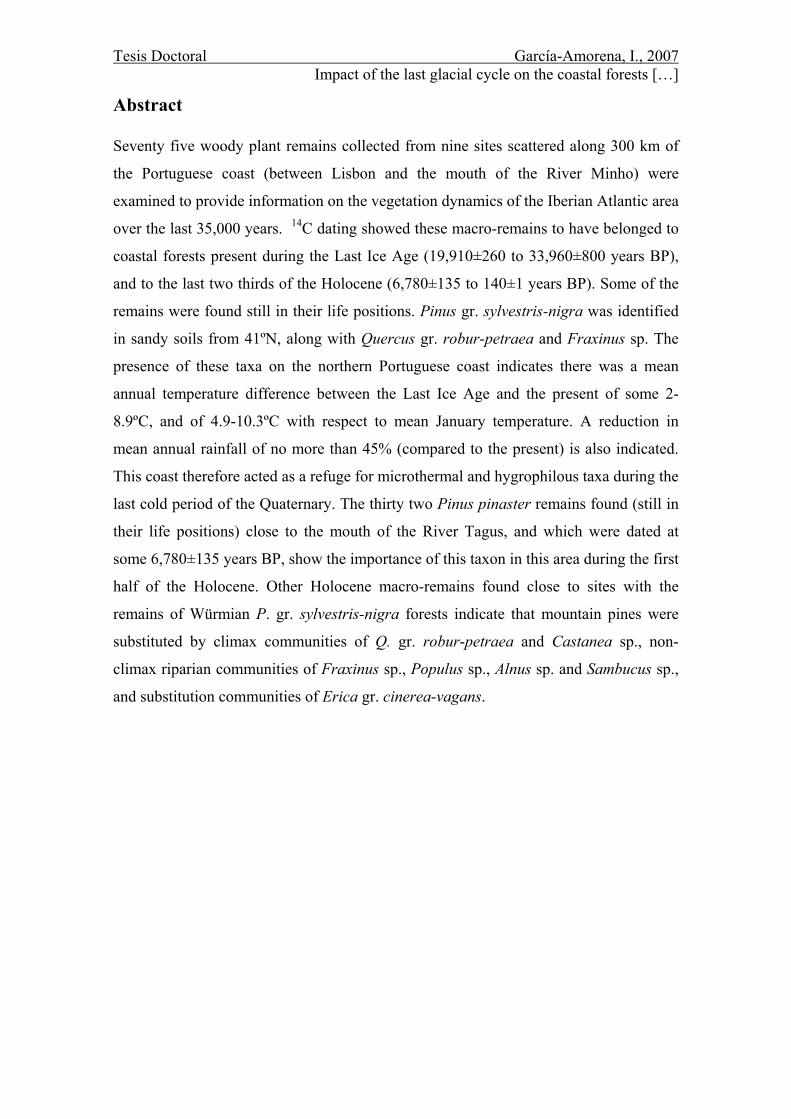
Tesis Doctoral García-Amorena, I., 2007 Impact of the last glacial cycle on the coastal forests […]
Abstract
Seventy five woody plant remains collected from nine sites scattered along 300 km of
the Portuguese coast (between Lisbon and the mouth of the River Minho) were
examined to provide information on the vegetation dynamics of the Iberian Atlantic area
over the last 35,000 years. 14C dating showed these macro-remains to have belonged to
coastal forests present during the Last Ice Age (19,910±260 to 33,960±800 years BP),
and to the last two thirds of the Holocene (6,780±135 to 140±1 years BP). Some of the
remains were found still in their life positions. Pinus gr. sylvestris-nigra was identified
in sandy soils from 41ºN, along with Quercus gr. robur-petraea and Fraxinus sp. The
presence of these taxa on the northern Portuguese coast indicates there was a mean
annual temperature difference between the Last Ice Age and the present of some 2-
8.9ºC, and of 4.9-10.3ºC with respect to mean January temperature. A reduction in
mean annual rainfall of no more than 45% (compared to the present) is also indicated.
This coast therefore acted as a refuge for microthermal and hygrophilous taxa during the
last cold period of the Quaternary. The thirty two Pinus pinaster remains found (still in
their life positions) close to the mouth of the River Tagus, and which were dated at
some 6,780±135 years BP, show the importance of this taxon in this area during the first
half of the Holocene. Other Holocene macro-remains found close to sites with the
remains of Würmian P. gr. sylvestris-nigra forests indicate that mountain pines were
substituted by climax communities of Q. gr. robur-petraea and Castanea sp., non-
climax riparian communities of Fraxinus sp., Populus sp., Alnus sp. and Sambucus sp.,
and substitution communities of Erica gr. cinerea-vagans.
Tesis Doctoral García-Amorena, I., 2007 Impact of the last glacial cycle on the coastal forests […]
171
Introduction
The many palaeobotanical studies performed in Europe have provided the information
necessary to establish a model of how the continent’s vegetation has changed in
response to fluctuations in climate over the last two million years (Turner and Hannon,
1988; Huntley, 1990a; Huntley, 1990b; Bennett et al., 1991; Willis and van Andel,
2004). However, the palaeobotanical sites of southwestern Europe are poorly
represented in these studies. The generalisation to the entire Iberian Peninsula of
conclusions drawn from findings at just a few sites (and generally at an altitude of over
1000 m) has, not surprisingly, led to a picture of a uniform vegetation quite unlike that
currently seen (Sainz and Moreno, 2002).
The model of succession for central Europe over the different climatic episodes of the
Quaternary, a succession of steppe, needle-leaved, and broadleaved deciduous
vegetation, broadly fits the pollen records of southwestern Europe (De Beaulieu and
Reille, 1992; Allen et al., 1996; Ramil-Rego et al., 1998a; Santos et al., 2000; Ruiz
Zapata et al., 2002). However, the topography of the Iberian Peninsula, its latitude, and
the extensive influence of the ocean are responsible for significant differences between
its landscapes and those of Central Europe – differences that favoured the presence of
thermophilous and temperate taxa along the coastline of southwestern Europe during the
cold phases of the Quaternary (García Antón et al., 1990; Ramil-Rego et al., 1998a;
Figueiral and Terral, 2002).
Despite the importance of the Iberian coastline in the development of European flora
during the Quaternary, palaeobotanical studies made at human dwelling sites have been
practically the only source of information regarding the palaeovegetation of the
Peninsula’s Atlantic face (Figueiral, 1995; Aura et al., 1998; Montes Barquín, 2003;
Figueiral and Carcaillet, 2005). The interpretation of remains found at archaeological
sites is limited by stratigraphic problems owed to animal and human-induced erosion,
contamination via percolation, and problems in representing the landscape given the
selection humans make of plants in their environment (Küster, 1991; Sánchez Goñi,
1993; Buxó, 1997). Palaeobotanical studies performed in non-anthropic sites – such as
the present work – are therefore an important source of information on past plant life.
On many occasions plant remains can be identified at the species level (Lowe and
Tesis Doctoral García-Amorena, I., 2007 Impact of the last glacial cycle on the coastal forests […]
172
Walker, 1997). In addition, the difficulty of their being naturally transported long
distances allows their origin to be confirmed, at least at the level of hydrographic basin;
they therefore represent the local vegetation (Birks and Birks, 2000). Macro-remains
found in their life positions over unaltered substrates provide the greatest information
since they have not moved since the death and burial of the original plants.
This work examines the role of the western coast zone of the Iberian Peninsula in the
vegetation dynamics of Europe during the Late Quaternary. Macro-remains were
collected from nine sites along more than 300 km of coastline over a period of two
decades; these remains were exposed on beaches or in cuttings caused by sea erosion
following storms. This is the first study to make a xylological analysis of the vegetation
between the mouths of the Rivers Minho and Tagus (fig. V-1) during the last glacial-
interglacial cycle. Many of these macro-remains were still in their life position and
provide important information on the origin, structure and dynamics of the plant
formations along this coast over the last 30,000 years. Particular attention was paid to
the dynamics of coastal pinewoods during the last climatic cycle. The numerous
reforestation campaigns undertaken with species of Pinus, especially P. pinaster,
hindered the interpretation of the origin of these populations. The similarity of the
pollen grains of the different pine species of the Iberian Peninsula makes it impossible
to resolve current debate surrounding the dynamics of these formations (Huntley and
Birks, 1983; Peinado and Rivas-Martínez, 1987; Figueiral, 1995; Costa et al., 1997;
Carrión et al., 2000). However, the identification of the macro-remains found, in
combination with information from palaeopalynological studies, reveals the
geobotanical history of this coast zone.
Tesis Doctoral García-Amorena, I., 2007 Impact of the last glacial cycle on the coastal forests […]
173
Description of the study area and materials
The coast where samples were collected has a complex history of tectonic and sea-level
evolution from the Pleistocene through Holocene, with relict Pleistocene aeolian and
wet aeolian deposits overlied by a podzol, on top of which are the Little Ice Age dunes
(Granja, 1999; Granja et al., submitted). On this substrate vegetation became
established, the remains of which are sometimes found.
The mountainous area of the northern half of Portugal is dissected by rivers that connect
the coast to the interior table lands. The proximity of the coast to areas with altitudes of
1,500-2,000 m (the Gerês and Estrela Ranges) offers the plants of these areas the
possibility to find, within less than 100 km, ecological conditions suitable for their
development during the reign of adverse climatic conditions.
Climatically, the western coast of the Iberian Peninsula occupies the transition zone
between the European Atlantic and Mediterranean climatic areas (Ozenda and Borel,
2001). The short period of summer drought experienced by the northwest of the
Peninsula becomes longer as one travels south, until eventually lasting some three
months. Similarly, the >1,000 mm rainfall received by the northwestern coast is reduced
to half this in the extreme southwest (Font Tullot, 1983; Allué, 1990).
Of the nine sites studied, eight are situated in the Minho and Douro Litoral regions (fig.
V-1, table V-1). This part of the coast is home to Plio-Pleistocene and Holocene
sediments which are at their widest in the most southerly part of this territory (Aveiro).
Here, there are dunes and coastal lakes at different stages of climax (Soares de Carvalho
and Granja, 1997; Granja, 1999). Both on the beach surface and in the cliffs between the
Rivers Minho and Espinho the remains of peat bog sediments, ancient lagoon bottoms
(locally known as tijucas) and the soils of ancient forests (podsoils) can be found.
Between 1986 and 2005, 27 tree trunks (five in their life positions) and 16 other woody
remains of lesser size were collected in these areas.
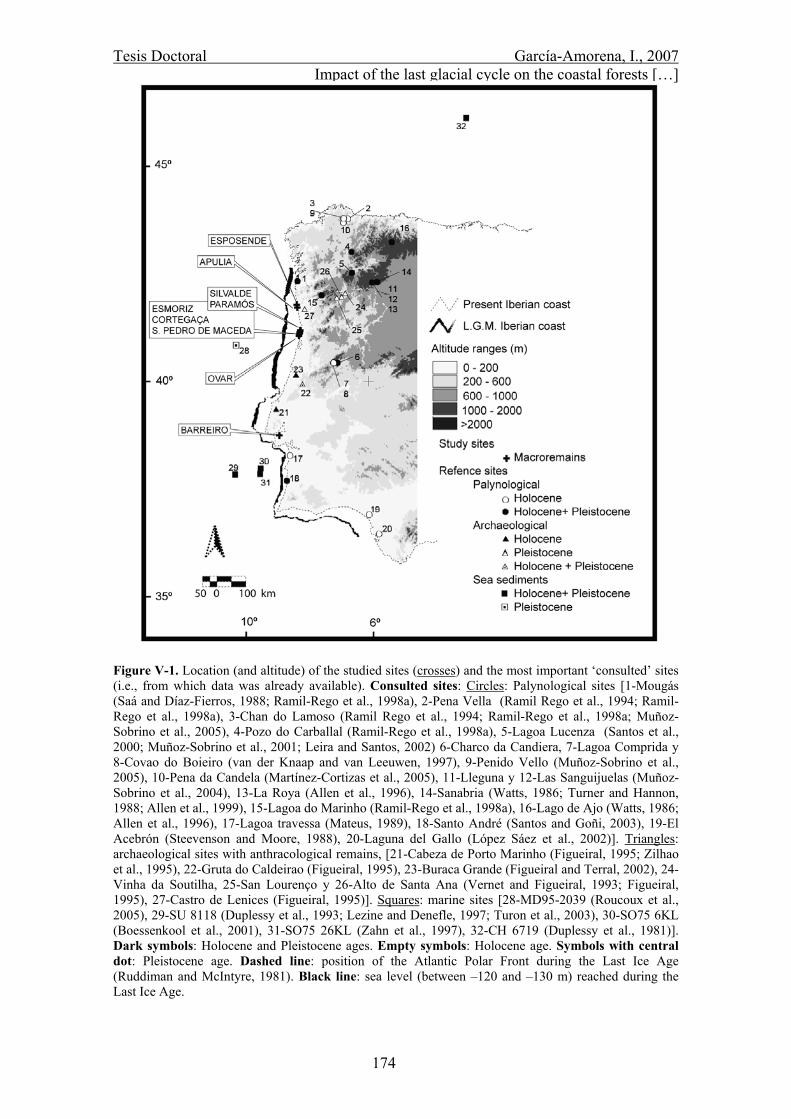
Tesis Doctoral García-Amorena, I., 2007 Impact of the last glacial cycle on the coastal forests […]
174
Figure V-1. Location (and altitude) of the studied sites (crosses) and the most important ‘consulted’ sites (i.e., from which data was already available). Consulted sites: Circles: Palynological sites [1-Mougás (Saá and Díaz-Fierros, 1988; Ramil-Rego et al., 1998a), 2-Pena Vella (Ramil Rego et al., 1994; Ramil-Rego et al., 1998a), 3-Chan do Lamoso (Ramil Rego et al., 1994; Ramil-Rego et al., 1998a; Muñoz-Sobrino et al., 2005), 4-Pozo do Carballal (Ramil-Rego et al., 1998a), 5-Lagoa Lucenza (Santos et al., 2000; Muñoz-Sobrino et al., 2001; Leira and Santos, 2002) 6-Charco da Candiera, 7-Lagoa Comprida y 8-Covao do Boieiro (van der Knaap and van Leeuwen, 1997), 9-Penido Vello (Muñoz-Sobrino et al., 2005), 10-Pena da Candela (Martínez-Cortizas et al., 2005), 11-Lleguna y 12-Las Sanguijuelas (Muñoz-Sobrino et al., 2004), 13-La Roya (Allen et al., 1996), 14-Sanabria (Watts, 1986; Turner and Hannon, 1988; Allen et al., 1999), 15-Lagoa do Marinho (Ramil-Rego et al., 1998a), 16-Lago de Ajo (Watts, 1986; Allen et al., 1996), 17-Lagoa travessa (Mateus, 1989), 18-Santo André (Santos and Goñi, 2003), 19-El Acebrón (Steevenson and Moore, 1988), 20-Laguna del Gallo (López Sáez et al., 2002)]. Triangles: archaeological sites with anthracological remains, [21-Cabeza de Porto Marinho (Figueiral, 1995; Zilhao et al., 1995), 22-Gruta do Caldeirao (Figueiral, 1995), 23-Buraca Grande (Figueiral and Terral, 2002), 24-Vinha da Soutilha, 25-San Lourenço y 26-Alto de Santa Ana (Vernet and Figueiral, 1993; Figueiral, 1995), 27-Castro de Lenices (Figueiral, 1995)]. Squares: marine sites [28-MD95-2039 (Roucoux et al., 2005), 29-SU 8118 (Duplessy et al., 1993; Lezine and Denefle, 1997; Turon et al., 2003), 30-SO75 6KL (Boessenkool et al., 2001), 31-SO75 26KL (Zahn et al., 1997), 32-CH 6719 (Duplessy et al., 1981)]. Dark symbols: Holocene and Pleistocene ages. Empty symbols: Holocene age. Symbols with central dot: Pleistocene age. Dashed line: position of the Atlantic Polar Front during the Last Ice Age (Ruddiman and McIntyre, 1981). Black line: sea level (between –120 and –130 m) reached during the Last Ice Age.
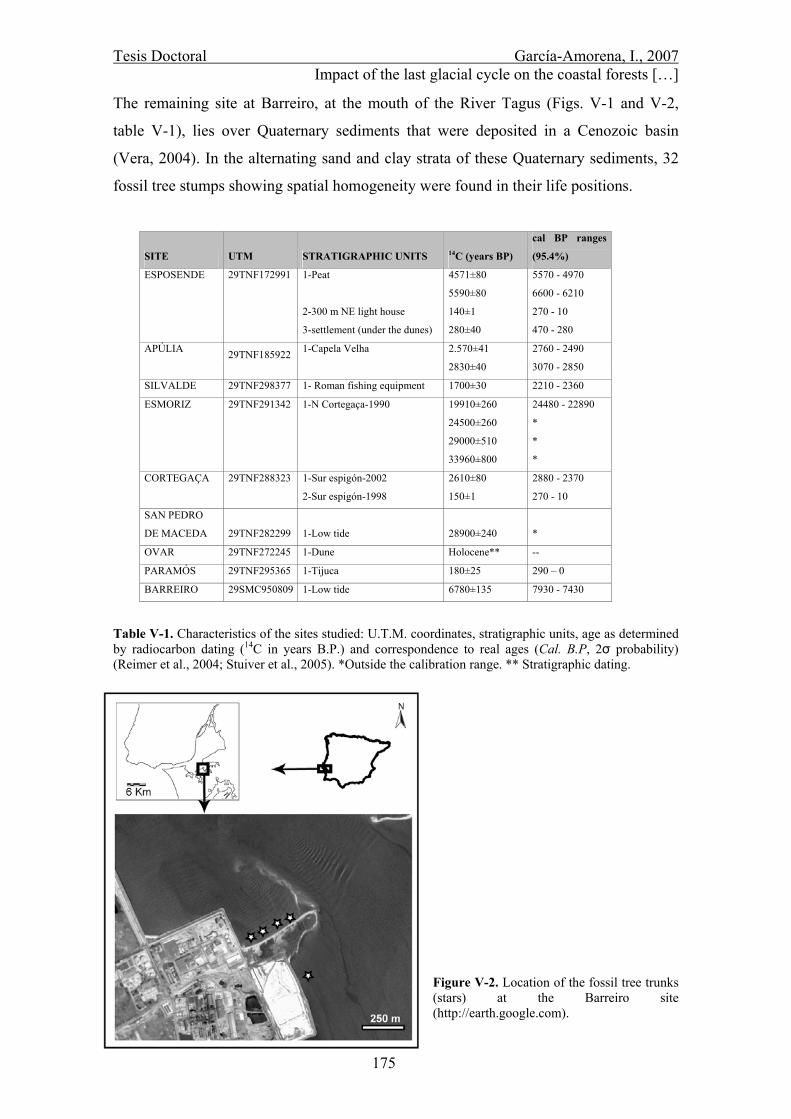
Tesis Doctoral García-Amorena, I., 2007 Impact of the last glacial cycle on the coastal forests […]
175
The remaining site at Barreiro, at the mouth of the River Tagus (Figs. V-1 and V-2,
table V-1), lies over Quaternary sediments that were deposited in a Cenozoic basin
(Vera, 2004). In the alternating sand and clay strata of these Quaternary sediments, 32
fossil tree stumps showing spatial homogeneity were found in their life positions.
Table V-1. Characteristics of the sites studied: U.T.M. coordinates, stratigraphic units, age as determined by radiocarbon dating (14C in years B.P.) and correspondence to real ages (Cal. B.P, 2σ probability) (Reimer et al., 2004; Stuiver et al., 2005). *Outside the calibration range. ** Stratigraphic dating.
Figure V-2. Location of the fossil tree trunks (stars) at the Barreiro site (http://earth.google.com).
SITE UTM STRATIGRAPHIC UNITS 14C (years BP)
cal BP ranges
(95.4%)
ESPOSENDE 29TNF172991 1-Peat 4571±80 5570 - 4970
5590±80 6600 - 6210
2-300 m NE light house 140±1 270 - 10
3-settlement (under the dunes) 280±40 470 - 280
APÚLIA 29TNF185922 1-Capela Velha 2.570±41 2760 - 2490
2830±40 3070 - 2850
SILVALDE 29TNF298377 1- Roman fishing equipment 1700±30 2210 - 2360
ESMORIZ 29TNF291342 1-N Cortegaça-1990 19910±260 24480 - 22890
24500±260 *
29000±510 *
33960±800 *
CORTEGAÇA 29TNF288323 1-Sur espigón-2002 2610±80 2880 - 2370
2-Sur espigón-1998 150±1 270 - 10
SAN PEDRO
DE MACEDA 29TNF282299 1-Low tide 28900±240 *
OVAR 29TNF272245 1-Dune Holocene** --
PARAMÓS 29TNF295365 1-Tijuca 180±25 290 – 0
BARREIRO 29SMC950809 1-Low tide 6780±135 7930 - 7430
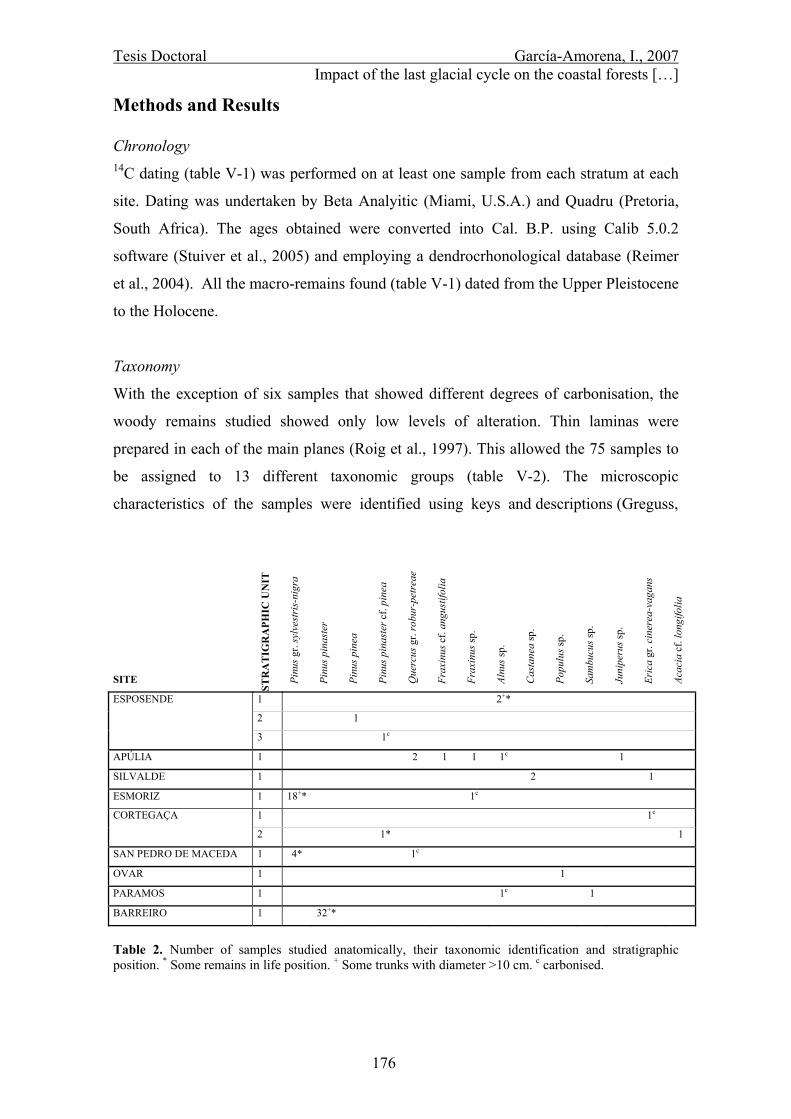
Tesis Doctoral García-Amorena, I., 2007 Impact of the last glacial cycle on the coastal forests […]
176
Methods and Results
Chronology 14C dating (table V-1) was performed on at least one sample from each stratum at each
site. Dating was undertaken by Beta Analyitic (Miami, U.S.A.) and Quadru (Pretoria,
South Africa). The ages obtained were converted into Cal. B.P. using Calib 5.0.2
software (Stuiver et al., 2005) and employing a dendrocrhonological database (Reimer
et al., 2004). All the macro-remains found (table V-1) dated from the Upper Pleistocene
to the Holocene.
Taxonomy
With the exception of six samples that showed different degrees of carbonisation, the
woody remains studied showed only low levels of alteration. Thin laminas were
prepared in each of the main planes (Roig et al., 1997). This allowed the 75 samples to
be assigned to 13 different taxonomic groups (table V-2). The microscopic
characteristics of the samples were identified using keys and descriptions (Greguss,
Table 2. Number of samples studied anatomically, their taxonomic identification and stratigraphic position. * Some remains in life position. + Some trunks with diameter >10 cm. c carbonised.
SITE
STR
AT
IGR
APH
IC U
NIT
Pinu
s gr.
sylv
estr
is-n
igra
Pinu
s pin
aste
r
Pinu
s pin
ea
Pinu
s pin
aste
r cf.
pine
a
Que
rcus
gr.
robu
r-pe
trea
e
Frax
inus
cf.
angu
stifo
lia
Frax
inus
sp.
Alnu
s sp.
Cas
tane
a sp
.
Popu
lus s
p.
Sam
bucu
s sp.
Juni
peru
s sp.
Eric
a gr
. cin
erea
-vag
ans
Acac
ia c
f. lo
ngifo
lia
ESPOSENDE 1 2+*
2 1
3 1c
APÚLIA 1 2 1 1 1c 1
SILVALDE 1 2 1
ESMORIZ 1 18+* 1c
CORTEGAÇA 1 1c
2 1* 1
SAN PEDRO DE MACEDA 1 4* 1c
OVAR 1 1
PARAMOS 1 1c 1
BARREIRO 1 32+*

Tesis Doctoral García-Amorena, I., 2007 Impact of the last glacial cycle on the coastal forests […]
177
1945; Greguss, 1955; Jacquiot, 1955; Greguss, 1959; Jacquiot et al., 1973; Core et al.,
1979; Wheeler et al., 1986; Guindeo and García, 1989; Schweingruber, 1990; Dallwitz
et al., 1993 onwards; García et al., 1996; Richter and Dallwitz, 2000 onwards; García et
al., 2002) and by comparison with present day material belonging to the wood
collection of the Escuela Técnica Superior de Ingenieros de Montes [ETSIM],
Universidad Politécnica, Madrid.
Figure V-3. Details of radial section of Pinus pinaster and P. gr. sylvestris-nigra, showing the teeth of the radial tracheid walls and the cross pits (A and B respectively). Scale bar = 30 µm.
Tesis Doctoral García-Amorena, I., 2007 Impact of the last glacial cycle on the coastal forests […]
178
The xylological characteristics of some pine species can be very similar, therefore the
following characteristics were used to distinguish the different taxa:
Pinus gr. sylvestris-nigra: This group includes the species P. nigra Arnold, P. sylvestris
L., and P. uncinata Mill. ex Mirb. Members are identified by their window-like cross
pits (Greguss, 1955) (fig. V-3). Some authors also report the shape of the teeth and
ramifications of the radial tracheids, and the position and morphology of the resin
canals as reliable features for distinguishing between P. nigra and P. sylvestris
(Jacquiot, 1955; Peraza, 1964; Guindeo and García, 1989; de Palacios, 1997; Vernet,
2001; García et al., 2002). In the present work, however, these features seemed unable
to differentiate test samples from different parts of Europe in the ETSIM collection; no
such distinctions were therefore drawn between the experimental samples.
Pinus pinaster Aiton: The shape and distribution of the teeth of the radial tracheids (fig.
V-3) distinguished between P. pinaster and P. pinea L. (Greguss, 1955; van der Burgh,
1973).
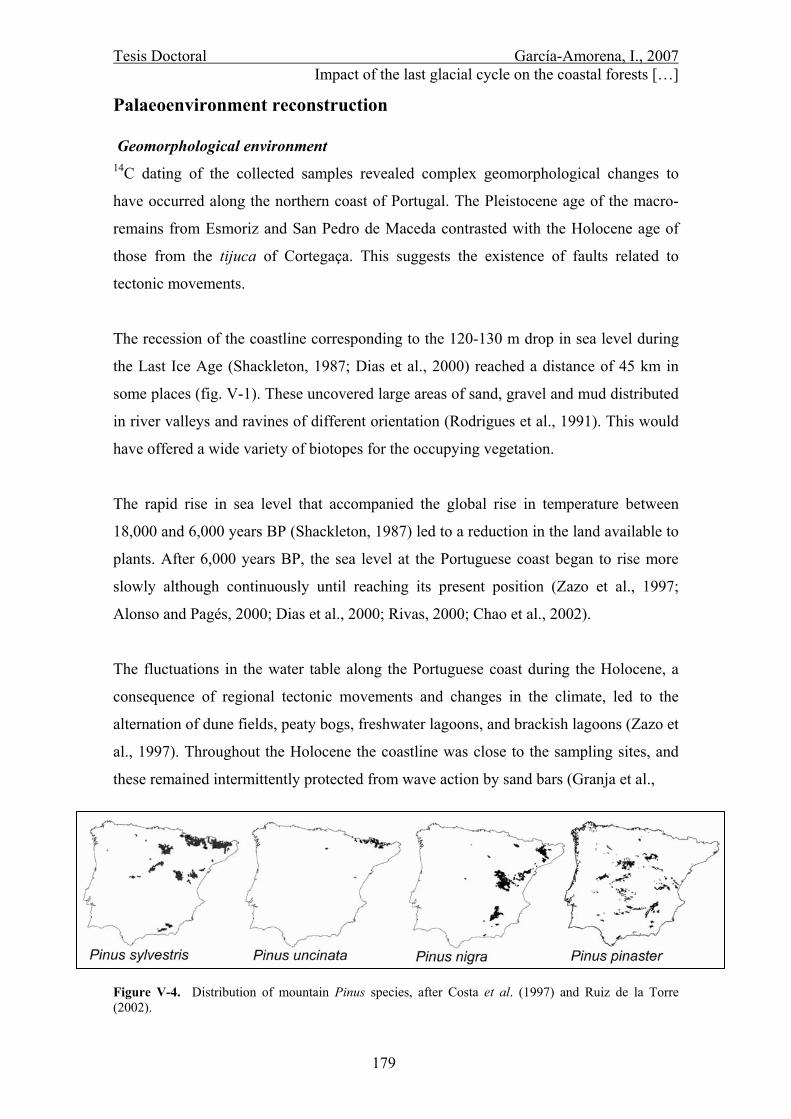
Tesis Doctoral García-Amorena, I., 2007 Impact of the last glacial cycle on the coastal forests […]
179
Palaeoenvironment reconstruction
Geomorphological environment 14C dating of the collected samples revealed complex geomorphological changes to
have occurred along the northern coast of Portugal. The Pleistocene age of the macro-
remains from Esmoriz and San Pedro de Maceda contrasted with the Holocene age of
those from the tijuca of Cortegaça. This suggests the existence of faults related to
tectonic movements.
The recession of the coastline corresponding to the 120-130 m drop in sea level during
the Last Ice Age (Shackleton, 1987; Dias et al., 2000) reached a distance of 45 km in
some places (fig. V-1). These uncovered large areas of sand, gravel and mud distributed
in river valleys and ravines of different orientation (Rodrigues et al., 1991). This would
have offered a wide variety of biotopes for the occupying vegetation.
The rapid rise in sea level that accompanied the global rise in temperature between
18,000 and 6,000 years BP (Shackleton, 1987) led to a reduction in the land available to
plants. After 6,000 years BP, the sea level at the Portuguese coast began to rise more
slowly although continuously until reaching its present position (Zazo et al., 1997;
Alonso and Pagés, 2000; Dias et al., 2000; Rivas, 2000; Chao et al., 2002).
The fluctuations in the water table along the Portuguese coast during the Holocene, a
consequence of regional tectonic movements and changes in the climate, led to the
alternation of dune fields, peaty bogs, freshwater lagoons, and brackish lagoons (Zazo et
al., 1997). Throughout the Holocene the coastline was close to the sampling sites, and
these remained intermittently protected from wave action by sand bars (Granja et al.,
Figure V-4. Distribution of mountain Pinus species, after Costa et al. (1997) and Ruiz de la Torre (2002).
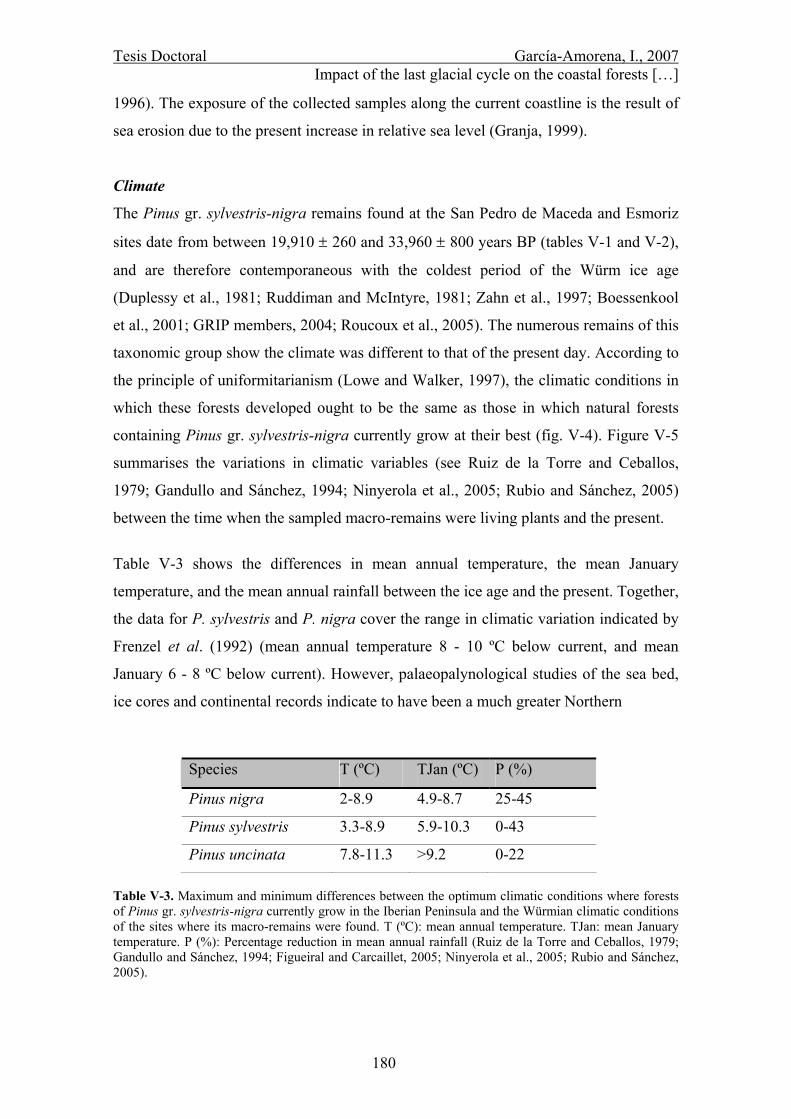
Tesis Doctoral García-Amorena, I., 2007 Impact of the last glacial cycle on the coastal forests […]
180
1996). The exposure of the collected samples along the current coastline is the result of
sea erosion due to the present increase in relative sea level (Granja, 1999).
Climate
The Pinus gr. sylvestris-nigra remains found at the San Pedro de Maceda and Esmoriz
sites date from between 19,910 ± 260 and 33,960 ± 800 years BP (tables V-1 and V-2),
and are therefore contemporaneous with the coldest period of the Würm ice age
(Duplessy et al., 1981; Ruddiman and McIntyre, 1981; Zahn et al., 1997; Boessenkool
et al., 2001; GRIP members, 2004; Roucoux et al., 2005). The numerous remains of this
taxonomic group show the climate was different to that of the present day. According to
the principle of uniformitarianism (Lowe and Walker, 1997), the climatic conditions in
which these forests developed ought to be the same as those in which natural forests
containing Pinus gr. sylvestris-nigra currently grow at their best (fig. V-4). Figure V-5
summarises the variations in climatic variables (see Ruiz de la Torre and Ceballos,
1979; Gandullo and Sánchez, 1994; Ninyerola et al., 2005; Rubio and Sánchez, 2005)
between the time when the sampled macro-remains were living plants and the present.
Table V-3 shows the differences in mean annual temperature, the mean January
temperature, and the mean annual rainfall between the ice age and the present. Together,
the data for P. sylvestris and P. nigra cover the range in climatic variation indicated by
Frenzel et al. (1992) (mean annual temperature 8 - 10 ºC below current, and mean
January 6 - 8 ºC below current). However, palaeopalynological studies of the sea bed,
ice cores and continental records indicate to have been a much greater Northern
Species T (ºC) TJan (ºC) P (%)
Pinus nigra 2-8.9 4.9-8.7 25-45
Pinus sylvestris 3.3-8.9 5.9-10.3 0-43
Pinus uncinata 7.8-11.3 >9.2 0-22 Table V-3. Maximum and minimum differences between the optimum climatic conditions where forests of Pinus gr. sylvestris-nigra currently grow in the Iberian Peninsula and the Würmian climatic conditions of the sites where its macro-remains were found. T (ºC): mean annual temperature. TJan: mean January temperature. P (%): Percentage reduction in mean annual rainfall (Ruiz de la Torre and Ceballos, 1979; Gandullo and Sánchez, 1994; Figueiral and Carcaillet, 2005; Ninyerola et al., 2005; Rubio and Sánchez, 2005).

Tesis Doctoral García-Amorena, I., 2007 Impact of the last glacial cycle on the coastal forests […]
181
Hemisphere temperature drop during the Last Ice Age – perhaps up to 15ºC (Duplessy
et al., 1993; Peyron et al., 1998; GRIP members, 2004). These extreme conditions might
suggest the presence of P. uncinata in this area at this time, but this would be
incompatible with that of Q. gr. robur-petraea and Fraxinus sp., detected in San Pedro
de Maceda and Esmoriz (table V-2) (Costa et al., 1997). Therefore, the Pleistocene
macro-remains of the San Pedro de Maceda and Esmoriz sites are probably those of P.
sylvestris or P. nigra.
Table V-3 shows that the rainfall of the Last Ice Age could have had 45% less than that
presently recorded for the San Pedro de Maceda and Esmoriz sites (table V-3).
However, some authors have indicated reductions of up to 60% for the Iberian
Peninsula compared to the present rainfall level (Frenzel et al., 1992; Peyron et al.,
1998). The insignificant proportion of xerophilic taxa recorded in the pollen diagrams
close to the coast for the Last Ice Age indicates that the littoral did not experience the
reduction in rainfall suffered by the interior (Allen et al., 1996; Peñalba et al., 1997; van
der Knaap and van Leeuwen, 1997; Ramil-Rego et al., 1998a; Muñoz-Sobrino et al.,
2001). Similarly, the macro-remains of Quercus gr. robur-petraea found at the San
Pedro de Maceda site, and the modern-day presence of Q. robur, show that water
availability during the Pleistocene was similar to that of today (Díaz-Fernández et al.,
1995).
The Holocene macro-remains found in the Esposende, Apúlia, Silvalde, Cortegaça,
Ovar, Paramos, and Barreiro sites, which are of the same species as inhabit these areas
today, show that the climate of that time was similar to that of the present (Ruiz de la
Torre and Ceballos, 1979; Costa et al., 1997). Indeed, oceanic, polar and continental
palaeoclimate records for the Holocene show that conditions only varied from those of
the present by 1-3ºC (Huntley and Prentice, 1988; Martinez-Cortizas et al., 1999; GRIP
members, 2004).

Tesis Doctoral García-Amorena, I., 2007 Impact of the last glacial cycle on the coastal forests […]
182
Figure V-5. Climatic conditions ranges of the actual forests of P. nigra, P. sylvestris and P. uncinata currently growing in optimum conditions. Division lines: optimum values of climatic conditions. Light blue: present day climatic conditions at the San Pedro de Maceda (S.P.M.) and Esmoriz sites (Ninyerola et al., 2005). T: mean annual temperature (ºC). Tjan: mean January temperature (ºC). P: mean annual rainfall (mm) (Ruiz de la Torre and Ceballos, 1979; Gandullo and Sánchez, 1994; Rubio and Sánchez, 2005).
Tesis Doctoral García-Amorena, I., 2007 Impact of the last glacial cycle on the coastal forests […]
183
The coastal forests of the Last Ice Age
The second half of the Würm is represented at the San Pedro de Maceda and Esmoriz
sites by numerous tree trunks, identified in large measure as Pinus gr. sylvestris-nigra.
These remains date from between 19,910 ± 260 and 33,960 ± 800 years BP. A trunk of
a deciduous Quercus (Q. gr. robur-petraea) was also found, as well as the remains of
branches some 6 cm in diameter belonging to Fraxinus sp. The life position of some
tree trunks found on soil remains, and the large number of Pinus woody macro-remains
with diameters of up to 26 cm (table V-2) indicate the presence of extensive pine
forests.
Pinus gr. sylvestris-nigra forests
The large number of Pinus gr. sylvestris-nigra trunks found with ages between ~20,000
and ~34,000 years BP indicate the success of this taxonomic group in its occupation of
the Portuguese coast during the Last Ice Age. The extension of this pioneering,
microthermal taxon (Costa et al., 1997) was favoured by the low temperatures and the
sandy soils that appeared after the ocean retreated some tens of kilometres (Dias et al.,
2000). A comparison of the chronology of the Würmian macro-remains with GRIP δ18O
records, ice raft debris, and the planktonic δ18O record of marine core MD95-2039 (fig.
V-6), confirms the existence of coastal pine forests during the colder conditions of the
Würmian period (GRIP members; Roucoux et al., 2005).
The chronological coincidence between the data from the San Pedro de Maceda and
Esmoriz sites and the only palynological Würmian site known along the same coast
(Mougás, fig. V-1) (Saá and Díaz-Fierros, 1988) shows the forests detected by the latter
authors to be of Pinus gr. sylvestris-nigra. The Würmian climatic conditions outlined
above and the flora present in the pollen record are coherent with the presence of P. gr.
sylvestris-nigra at the Mougás site. This pollen diagram proposed by Saá et al. shows
the development of a large mass of pines during the Heinrich H1 event (fig. V-6) at 42º
N, in a landscape co-dominated by Poaceae. At this time the Atlantic Polar Front
reached one of its most southerly positions, around 35ºN, which might have favoured
the expansion of these pine forests (Ruddiman and McIntyre, 1981; Muñoz-Sobrino et
al., 2001; Roucoux et al., 2005). This interpretation agrees with the findings of
archaeological studies performed on the central and northern Portuguese coast and
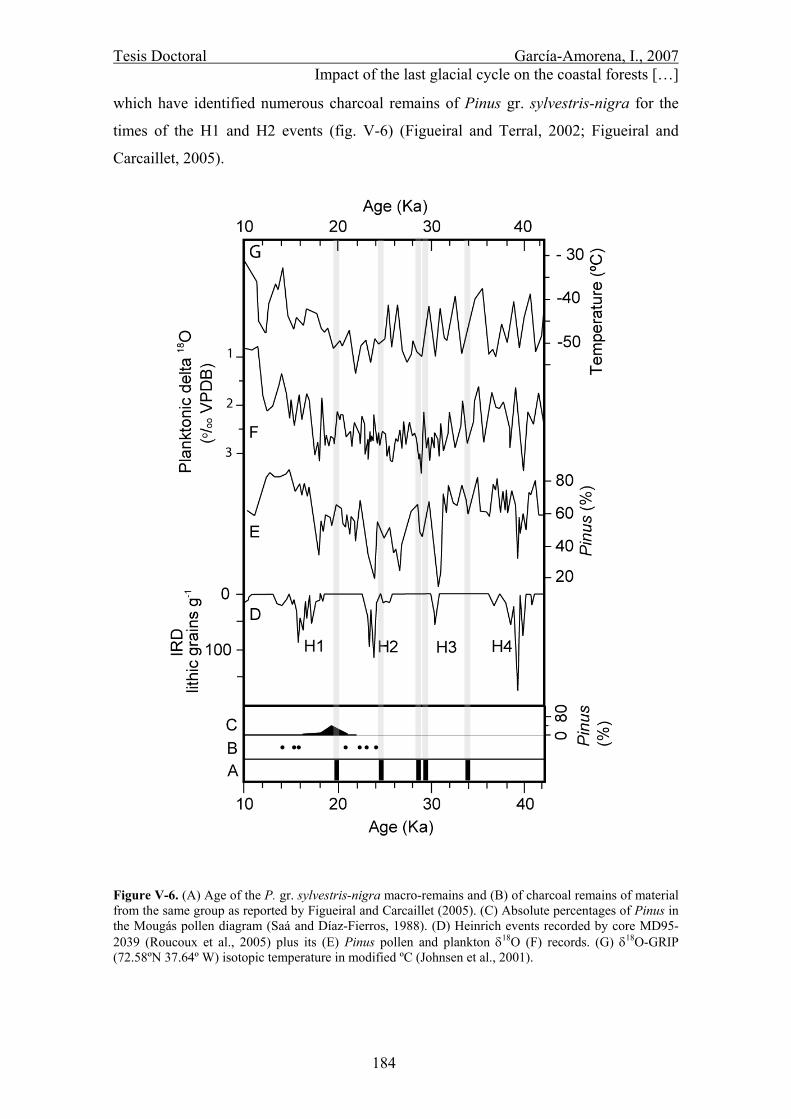
Tesis Doctoral García-Amorena, I., 2007 Impact of the last glacial cycle on the coastal forests […]
184
which have identified numerous charcoal remains of Pinus gr. sylvestris-nigra for the
times of the H1 and H2 events (fig. V-6) (Figueiral and Terral, 2002; Figueiral and
Carcaillet, 2005).
Figure V-6. (A) Age of the P. gr. sylvestris-nigra macro-remains and (B) of charcoal remains of material from the same group as reported by Figueiral and Carcaillet (2005). (C) Absolute percentages of Pinus in the Mougás pollen diagram (Saá and Díaz-Fierros, 1988). (D) Heinrich events recorded by core MD95-2039 (Roucoux et al., 2005) plus its (E) Pinus pollen and plankton δ18O (F) records. (G) δ18O-GRIP (72.58ºN 37.64º W) isotopic temperature in modified ºC (Johnsen et al., 2001).

Tesis Doctoral García-Amorena, I., 2007 Impact of the last glacial cycle on the coastal forests […]
185
Marine core MD95-2039 (fig. V-1) reveals the presence Pinus in a landscape dominated
by steppe taxa for the northwest of the Iberian Peninsula during the Last Ice Age (fig.
V-6) (Roucoux et al., 2005). The few pollen diagrams available for the Peninsula during
this period also suggest scant tree cover and the predominance of dry steppe species in
mountain areas and the interior of the Peninsula up until the Bølling-Allerød interstage
(Watts, 1986; Allen et al., 1996; Peñalba et al., 1997; van der Knaap and van Leeuwen,
1997; Muñoz-Sobrino et al., 2001; Muñoz-Sobrino et al., 2004). Therefore, the record
of Pinus from the ocean bed reflects the pines established on the coast.
Natural P. sylvestris woods are currently found in the Sierra de Gerês, and forests of P.
sylvestris and P. nigra grow in the Sierra de Gredos (Génova et al., 1988; Figueiral and
Carcaillet, 2005), areas that were devoid of trees during the Last Ice Age (fig. V-6)
(Watts, 1986; van der Knaap and van Leeuwen, 1997). This suggests that the
mountainous areas of the northern half of Portugal acted as an area of expansion for
these species during times of warming, as they do now. Pleistocene remains of this
group found in the coast of Portugal, 60 and 280 km from where its members currently
grow, suggests that, in response to temperature decline, a migration towards lower
altitudes took place (Colin Prentice, 1986; Huntley, 1990a; Williams et al., 2002).
Other formations
Along with the Würmian mountain pines discovered at the San Pedro de Maceda and
Esmoriz sites, the remains of Quercus robur-petraea and Fraxinus sp. were found. The
species belonging to the latter group are broad leaved, and Atlantic and Mediterranean
in nature (Costa et al., 1997). These species would have found an ideal environment for
their development in the wet soils of the valleys and plains that emerged after the ocean
retreated.
The landscape of the Würmian coastline of northern Portugal was also home to human
settlements at Buraca Grande and Cabeço de Porto Marinho (Figueiral, 1995; Figueiral
and Terral, 2002) (fig. V-1), where archaeological remains have been found. These sites
contain thermophilous elements of Mediterranean/Submediterranean affinity as well as
representatives of the Eurosiberian flora that formed spiny shrublands in the open
spaces of broad leaved deciduous woods of Atlantic affinity (Costa et al., 1997).
Tesis Doctoral García-Amorena, I., 2007 Impact of the last glacial cycle on the coastal forests […]
186
No macro-remains of Würmian P. pinaster were found at the present sampling sites.
However, at the Cabeço de Porto Marinho site (fig. V-1), charcoal remains of this
species dating from 33 k years BP can be found (they make up 93% of all the remains
present) (Figueiral, 1993). The importance of P. pinaster on the coastal sands of
Würmian Portugal has been reported by several authors (Mateus and Queiroz, 1993;
Figueiral, 1995). These formations would have made a mosaic with those of P. gr.
sylvestris-nigra, which occupied the colder areas.
Refuge areas
In this work refuge areas are defined as areas where species of boreal distribution have
survived glacial climatic conditions (Hewitt, 1999). The finding of a great many macro-
remains of taxa that currently grow in the mountains of the Iberian Peninsula (P. gr.
sylvestris-nigra), along with a smaller percentage of broadleaved species (Q. gr. robur-
petraea and Fraxinus sp.) at a time when there were no large tree formations in the
interior (García Antón et al., 2002), shows that the northern Portuguese coast behaved
as a refuge area. The rugged topography and the diversity of the soils that emerged after
the marine recession phases offered a great variety of ecological niches where even the
most thermophilous species (Figueiral, 1993; Figueiral, 1995) could survive the ice age.
The macro-remains found highlight the importance of the coast of Portugal in the
dynamics of southwestern Europe’s vegetation. Refuge areas such as this are largely
responsible for the Iberian Peninsula’s current great richness in plants (Sainz and
Moreno, 2002). Nonetheless, the refuge role played by the Iberian Peninsula during
glacial periods has been questioned by some authors (Huntley, 1990b; Bennett et al.,
1991). However, the absence of palaeobotanical findings at low altitude in these studies
is the reason why none of the Würmian microthermal Atlantic or Mediterranean species
cited in other studies (Costa Tenorio et al., 1990; García Antón et al., 1990; Hewitt,
1999; Figueiral and Terral, 2002; Petit et al., 2002; Cheddadi et al., 2006) were found.
Tesis Doctoral García-Amorena, I., 2007 Impact of the last glacial cycle on the coastal forests […]
187
The coastal forests of the Holocene
Holocene macro-remains were found over the 300 km distance between the mouths of
the Minho and Tagus (fig. V-1), their ages ranging from 7,000 until just 150 years BP.
(table V-1). Their taxonomic diversity and geographical distribution indicate a diverse
landscape (table V-2). During the first half of the Holocene, a mosaic of woods,
shrublands, marshlands and estuaries became established on the studied coast (Saá and
Díaz-Fierros, 1988; Steevenson and Moore, 1988; Ramil-Rego et al., 1998a). This type
of landscape agrees with the expansion of tree species reflected in the pollen diagrams
for the entire Atlantic region (Duplessy et al., 1981; Allen et al., 1996; Lezine and
Denefle, 1997; van der Knaap and van Leeuwen, 1997; Muñoz-Sobrino et al., 2001).
Pinus pinaster forests
The 32 stumps found in-situ at the Barreiro site (table V-2) correspond to a stand of
Pinus pinaster more than 7,000 years old. In fact these tree trunk remains in their life
positions are the best of all those that have been found in the Iberian Peninsula. The
sandy substrate in which these remains rest, which also contains clay strata, reflect the
adaptation of P. pinaster to poor, compact and non-compact soils that are difficult for
other species to colonise. The spatial distribution and size of the stumps, some of which
are over 25 cm in diameter, reflect an irregular, open forest, with trees of different age.
The Holocene pollen diagrams for Lake Travessa and Santo André reflect a vegetation
that grew on sandy soils similar to that of the Barreiro site (Mateus, 1989; Mateus and
Queiroz, 1993; Santos and Goñi, 2003). These diagrams show absolute percentages of
up to 70% for Pinus during the first half of the Holocene. The present results allow
these pollen grains to be assigned to formations of P. pinaster. The macro-remains at
Barreiro, plus the information in these pollen diagrams, suggests these plants formations
were well extended along the Portuguese coast during the first half of the Holocene.
The anthracological records for P. pinaster in human settlements of this coast agree
with the idea of the expansion of these formations along the sandy littoral and their
reaching into the interior northwest of Portugal (Ramil Rego et al., 1994; Figueiral,
1995; Turon et al., 2003; Figueiral and Carcaillet, 2005).
Tesis Doctoral García-Amorena, I., 2007 Impact of the last glacial cycle on the coastal forests […]
188
Marine cores that record the pollen production of the Tagus basin show a reduction in
the area occupied by Pinus during the Holocene (Lezine and Denefle, 1997;
Boessenkool et al., 2001; Turon et al., 2003), and, in the southern submeseta, the
dominance of leafy trees over the pine formations that became established during
Würmian period (Pons, Reille, 1988). The findings at the Barreiro site and the
information in the above pollen diagrams for the coast, which show that P. pinaster
expanded along the sandy Atlantic coast during the Holocene, contrast with the events
of the Peninsular interior.
Other formations
The remains of Alnus sp. dating from 6,000 - 180 years BP were found at Esposende,
Apúlia and Paramos (tables V-1 and V-2). Given the phreatophytic nature of this taxon,
its remains probably represent riverside vegetation that became established at different
points along the coast during the Holocene (Costa et al., 1997). Other riparian taxa such
as Sambucus sp. (at Apúlia) or Populus sp. (at Ovar) (table V-2) were also found.
Archaeological and palynological remains confirm the great importance of hygrophilous
taxa such as Alnus sp. and Salix sp. during the Mid Holocene (Oldfield, 1964; Saá and
Díaz-Fierros, 1988; Steevenson and Moore, 1988; Mateus, 1989; Vernet and Figueiral,
1993; Figueiral, 1995). However, in mountain sites, Alnus sp. became progressively less
important towards the interior of the Peninsula, in agreement with its thermophilous
nature (Ramil Rego et al., 1994; Allen et al., 1996; van der Knaap and van Leeuwen,
1997; Santos et al., 2000; Muñoz-Sobrino et al., 2001; Muñoz-Sobrino et al., 2005).
The presence of Populus sp. at Ovar (table V-2) also reflects the existence of habitats
with a high freshwater table. However, no anthracological remains of this genus have
been found in Holocene coastal sites, and palynological studies have only rarely
recorded this genus (Steevenson and Moore, 1988; Mateus, 1989; Allen et al., 1996;
Muñoz-Sobrino et al., 2001; Santos and Goñi, 2003). These records suggest it was
therefore of little importance along the Iberian Atlantic coast of the Holocene.
Evidence of hygrophilous mixed woods from 2,000 – 3,000 years BP was found at the
Apúlia site. Fraxinus sp. appears associated with Alnus sp. and Quercus gr. robur-
petraea (table V-2). The pollen of deciduous Quercus is well represented throughout the
Holocene at different coastal and marine sites (Oldfield, 1964; Duplessy et al., 1981;
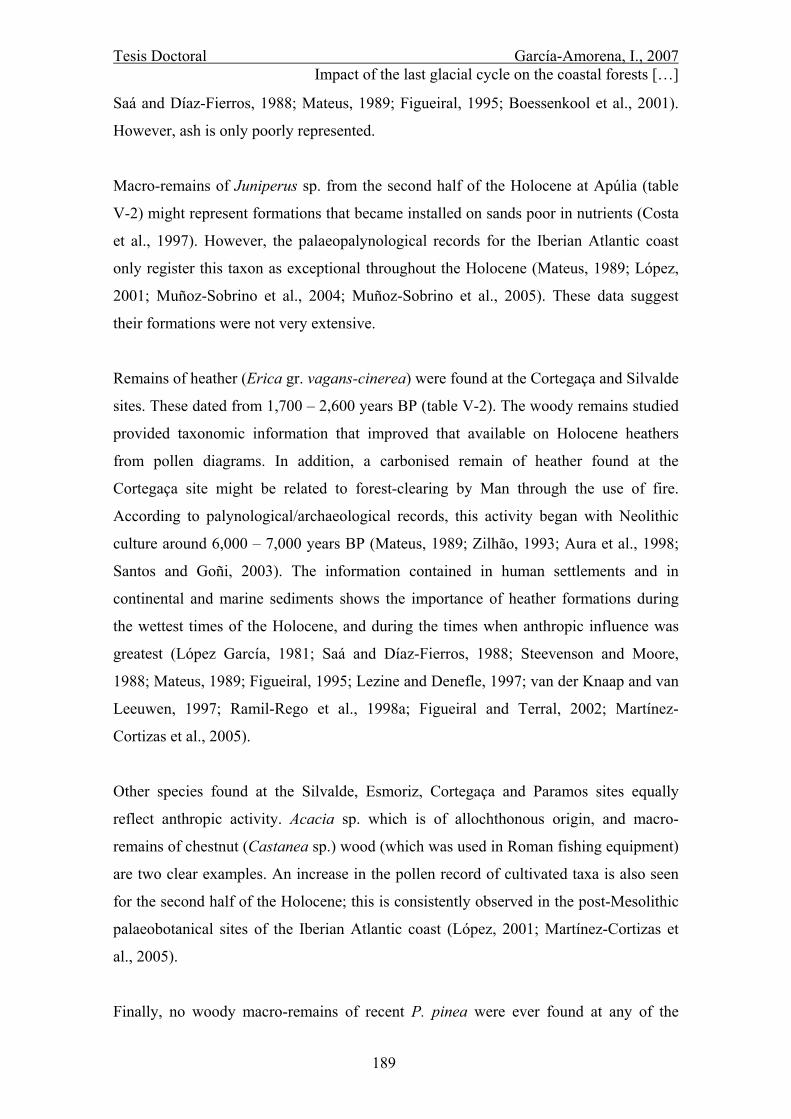
Tesis Doctoral García-Amorena, I., 2007 Impact of the last glacial cycle on the coastal forests […]
189
Saá and Díaz-Fierros, 1988; Mateus, 1989; Figueiral, 1995; Boessenkool et al., 2001).
However, ash is only poorly represented.
Macro-remains of Juniperus sp. from the second half of the Holocene at Apúlia (table
V-2) might represent formations that became installed on sands poor in nutrients (Costa
et al., 1997). However, the palaeopalynological records for the Iberian Atlantic coast
only register this taxon as exceptional throughout the Holocene (Mateus, 1989; López,
2001; Muñoz-Sobrino et al., 2004; Muñoz-Sobrino et al., 2005). These data suggest
their formations were not very extensive.
Remains of heather (Erica gr. vagans-cinerea) were found at the Cortegaça and Silvalde
sites. These dated from 1,700 – 2,600 years BP (table V-2). The woody remains studied
provided taxonomic information that improved that available on Holocene heathers
from pollen diagrams. In addition, a carbonised remain of heather found at the
Cortegaça site might be related to forest-clearing by Man through the use of fire.
According to palynological/archaeological records, this activity began with Neolithic
culture around 6,000 – 7,000 years BP (Mateus, 1989; Zilhão, 1993; Aura et al., 1998;
Santos and Goñi, 2003). The information contained in human settlements and in
continental and marine sediments shows the importance of heather formations during
the wettest times of the Holocene, and during the times when anthropic influence was
greatest (López García, 1981; Saá and Díaz-Fierros, 1988; Steevenson and Moore,
1988; Mateus, 1989; Figueiral, 1995; Lezine and Denefle, 1997; van der Knaap and van
Leeuwen, 1997; Ramil-Rego et al., 1998a; Figueiral and Terral, 2002; Martínez-
Cortizas et al., 2005).
Other species found at the Silvalde, Esmoriz, Cortegaça and Paramos sites equally
reflect anthropic activity. Acacia sp. which is of allochthonous origin, and macro-
remains of chestnut (Castanea sp.) wood (which was used in Roman fishing equipment)
are two clear examples. An increase in the pollen record of cultivated taxa is also seen
for the second half of the Holocene; this is consistently observed in the post-Mesolithic
palaeobotanical sites of the Iberian Atlantic coast (López, 2001; Martínez-Cortizas et
al., 2005).
Finally, no woody macro-remains of recent P. pinea were ever found at any of the
Tesis Doctoral García-Amorena, I., 2007 Impact of the last glacial cycle on the coastal forests […]
190
sampled sites, nor has it been reported at any coastal archaeological site north to
Barreiro. This species therefore probably never occupied large areas of this coast during
the Holocene (Figueiral, 1995; Figueiral and Terral, 2002). However, its presence in
pollen diagrams for the mouth of the River Guadalquivir, along with carpological
remains found in southern Portugal belonging to the Bronze and Copper Ages, suggest
this species formed extensive woods in the southwestern Peninsula during the Holocene
(Steevenson and Moore, 1988; Ramil Rego et al., 1994).

CHAPTER VI
The Holocene forests in the Cantabrian coast of the Iberian Peninsula

Tesis Doctoral García-Amorena, I., 2007 The Holocene forests in the Cantabrian coast fo the I.P.
Abstract
Eight sites along 400 km of the Cantabrian coast (northern Spain) provided 153 woods,
50 fruits and over 350 leaf remains from Holocene primeval forests. The high
taxonomic precision of the collected macro-remains, reaching in many cases the specie
level, and the accurate information about the original location of the plants from which
their remains were found, dispense new geobotanical information that contribute to
increase the history knowledge of the Atlantic coastal forests of northern Spain.
Radicarbon measurements on woody samples show the collected material to cover the
time period from 8,550 to 875 cal BP. Analysis of the macro-remains illustrates the
Holocene deciduous mixed forest to be dominated by Quercus robur and Corylus
avellana, where Acer pseudoplatanus, Ulmus minor, Castanea sp. and hygro-
thermophilous taxa (Arbutus, Laurus and Vitis sp.). Hygrophilous communities, where
Salix atrocinerea, Alnus glutinosa and Fraxinus sp. dominated, are shown to expand
during the Holocene. The absence of conifer macro-remains is interpreted as a
consequence of the progressive disappearance of the Würmian conifer populations
throughout the Holocene. Different taxa that survived the last glaciation in refugial
areas of the Atlantic coast of northern Spain (e.g. Ilex tp. aquifolium) are shown to
subsist in the same areas during the Holocene. A leaf sample of Ulmus minor dating
back to 3,950 ± 120 cal BP demonstrates for the first time the natural origin of this
specie in the Atlantic coast of Spain.

Tesis Doctoral García-Amorena, I., 2007 The Holocene forests in the Cantabrian coast fo the I.P.
193
Introduction
The original vegetation cover represents one of the main criteria in designing
biodiversity conservation policies. Since the last two decades, a significant number of
palaebotanical studies has considerably increased knowledge about the Quaternary
vegetation in the Euro-Siberian region of Spain (e.g. Peñalba, 1994; Ramil-Rego et al.,
1998a; Iriarte, 2003; Muñoz-Sobrino et al., 2005), except for the coastal areas where
just few records are available. This information gap did not allow until now to support
with solid scientific data the role of the Atlantic coast of northern Spain as a refugial
area for forest vegetation during cold stages, a hypothesis which has been questioned by
several authors (Turner and Hannon, 1988; Huntley, 1990; Bennett et al., 1991; Willis
and van Andel, 2004).
Palaeobotanical studies from prehistoric human settlements are the main basis for
reconstructing the vegetation history of the Atlantic coast of northern Spain (Cantabrian
region). They show the importance of broadleaf deciduous species and thermophilous
flora elements in the Iberian Atlantic facade during the last 15,000 years BP (Isturiz and
Sánchez, 1990; Mary, 1990; Sánchez Goñi, 1990; Uzquiano, 1992a; Iriarte, 2003).
However, these records are biased by stratigraphic problems (animal and human-
induced erosion; pollution via percolation) and by representation constraints (useful
plants for humans may provide a distorted reconstruction of the natural landscape)
(Küster, 1991; Sánchez Goñi, 1993; Buxó, 1997).
Only some palynological studies on non-archaeological sediments (Menéndez Amor,
1950; Mary, 1973; van Mourik, 1986; Gómez-Orellana, 2002; García Antón et al.,
2006) have provided more precise data about the natural palaeo-vegetation from this
region. It deserves special mention the palynological study from the estuary of
Villaviciosa (García Antón et al., 2006) with an exceptional continuous Holocene pollen
record of 7,000 years, representing a good stratigraphic basis for the history of the
Cantabrian coastal vegetation during large part of this period. However, the low
taxonomic precision provided by pollen records (Bradshaw, 1991; Birks and Birks,
2000; Faegri and Iversen, 1989) difficult the interpretation of the vegetation dynamics,
lacking information about the concrete vegetation types and their characteristic species.
Tesis Doctoral García-Amorena, I., 2007 The Holocene forests in the Cantabrian coast fo the I.P.
194
This paper shows for the first time results from the analysis of numerous plant macro-
remains (woods, branches, leaves and fruits and seeds) found in a 400 km coastal strip
of the Atlantic coast of northern Spain, which cover the major part of the Holocene.
Wood, fruit and cuticle-based identification provided high taxonomic precision of fossil
records, reaching in many cases the species level. Moreover, macro-remains found in
their life positions over unaltered substrates constituted an exceptional source of
geobotanical information, with very precise information about the species’ local
distribution (Birks, 2003). This becomes especially relevant when identifying refugial
areas. The combination of macro-remains with the available palynological data has
considerably improved the interpretation of the Holocene vegetation history in the
Atlantic coast of northern Spain.
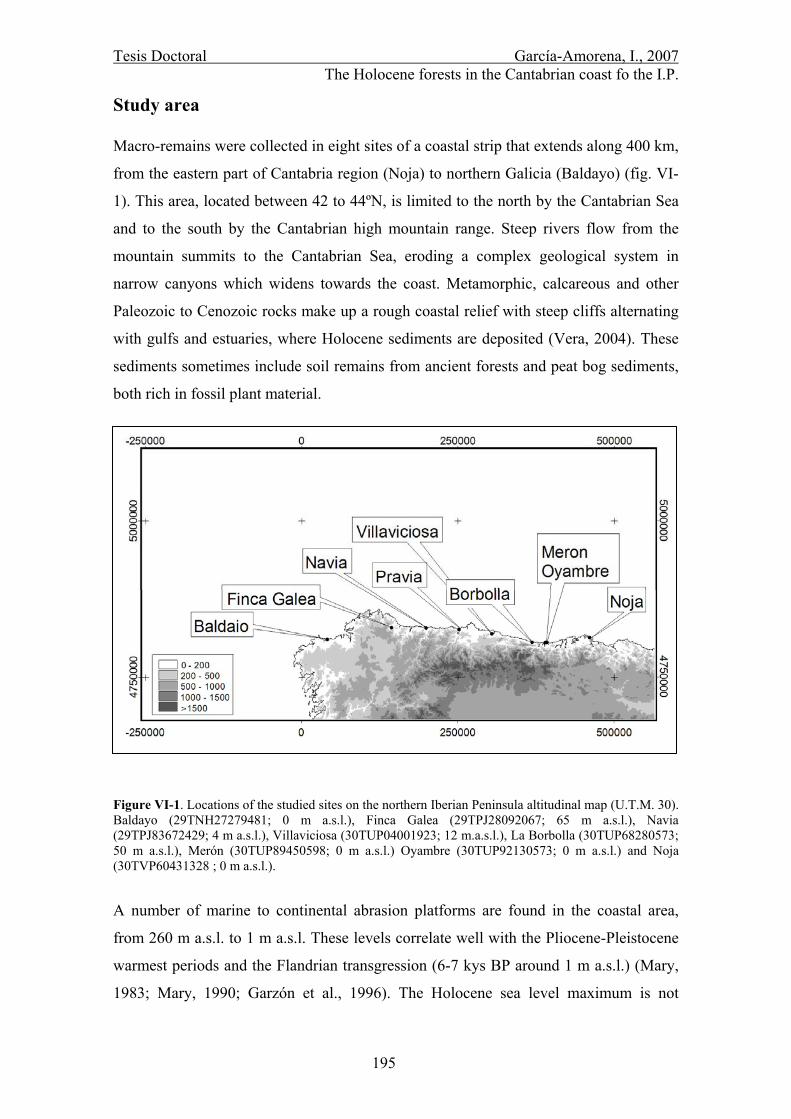
Tesis Doctoral García-Amorena, I., 2007 The Holocene forests in the Cantabrian coast fo the I.P.
195
Study area
Macro-remains were collected in eight sites of a coastal strip that extends along 400 km,
from the eastern part of Cantabria region (Noja) to northern Galicia (Baldayo) (fig. VI-
1). This area, located between 42 to 44ºN, is limited to the north by the Cantabrian Sea
and to the south by the Cantabrian high mountain range. Steep rivers flow from the
mountain summits to the Cantabrian Sea, eroding a complex geological system in
narrow canyons which widens towards the coast. Metamorphic, calcareous and other
Paleozoic to Cenozoic rocks make up a rough coastal relief with steep cliffs alternating
with gulfs and estuaries, where Holocene sediments are deposited (Vera, 2004). These
sediments sometimes include soil remains from ancient forests and peat bog sediments,
both rich in fossil plant material.
Figure VI-1. Locations of the studied sites on the northern Iberian Peninsula altitudinal map (U.T.M. 30). Baldayo (29TNH27279481; 0 m a.s.l.), Finca Galea (29TPJ28092067; 65 m a.s.l.), Navia (29TPJ83672429; 4 m a.s.l.), Villaviciosa (30TUP04001923; 12 m.a.s.l.), La Borbolla (30TUP68280573; 50 m a.s.l.), Merón (30TUP89450598; 0 m a.s.l.) Oyambre (30TUP92130573; 0 m a.s.l.) and Noja (30TVP60431328 ; 0 m a.s.l.).
A number of marine to continental abrasion platforms are found in the coastal area,
from 260 m a.s.l. to 1 m a.s.l. These levels correlate well with the Pliocene-Pleistocene
warmest periods and the Flandrian transgression (6-7 kys BP around 1 m a.s.l.) (Mary,
1983; Mary, 1990; Garzón et al., 1996). The Holocene sea level maximum is not
Tesis Doctoral García-Amorena, I., 2007 The Holocene forests in the Cantabrian coast fo the I.P.
196
evident all along the coast. Two transgressive pulses at 8 and 3 kyr BP are recorded in
some sites (Cearreta, 1994). In others, there are no evidences of higher sea level
compared to the present (Alonso and Pagés, 2000; Soares de Carvalho et al., 2002;
Pagés et al., 2003). Tectonic movements and eustatic processes have sometimes been
argued to explain such differences (Mary, 1990; Granja and De Groot, 1996; Zazo et al.,
1997; Rivas, 2000).
The studied area belongs to the Atlantic European biogeographic region (Ozenda and
Borel, 2001; Rivas-Martínez et al., 2002). As a consequence of the warm Gulf stream,
the coastal weather is characterised at present by mild conditions, with annual mean
temperatures ranging from 12ºC to 15ºC, and no freezing days throughout the year
(Font Tullot, 1983). Annual rainfall generally surpasses 1,000 mm, distributed equally
throughout the year. Summer drought with duration of less than two months only occurs
in the westernmost part of the coast (Allué, 1990).
The area is highly modified by intense anthropogenic activity. Agriculture crops,
pastures, tree plantations (i.e. Pinus pinaster, P. radiate and Eucalyptus sp.) and
urbanization spread all along the coast, where only few remnants of the original
vegetation can be found. The natural landscape is nowadays dominated by secondary
shrub formations (Ulex spp., Erica spp., Cytisus spp., and Pteridium aquilinum), as a
result of the abandonment of agriculture and cattle activities (Peinado and Rivas-
Martínez, 1987; Costa et al., 1997; Ruiz de la Torre, 2002).
Deciduous mixed forests can be found in the major part of the natural coastal landscape,
mainly on siliceous substrates of the western half. Common oak (Quercus robur) is the
dominant canopy species, while ash (Fraxinus excelsior), sycamore (Acer
pseudoplatanus), birch (Betula alba), chestnut tree (Castanea sativa), cherry tree
(Prunus avium), and hazel (Corylus avellana) frequently appear as companion species.
Pyrenean oak (Quercus pyrenaica) forests also occur in the most xeric areas. Well
preserved Mediterranean holm oak (Quercus ilex subsp. Ilex) woodlands are found on
limestone substrates, which predominate in the eastern half of the coast.
Mediterranean sclerophyllous small trees and shrubs (i.e. Laurus nobilis, Arbutus
unedo, Phillyrea spp., Olea europea, Viburnum tinus, Rhamnus alaternus) locally
Tesis Doctoral García-Amorena, I., 2007 The Holocene forests in the Cantabrian coast fo the I.P.
197
enrich the forest understorey all along the coast. Hygrophilous taxa (i.e. Alnus
glutinosa, Populus nigra, Salix spp.) are found along the estuaries and rivers. Elm
(Ulmus glabra), beech (Fagus sylvatica) and large-leaved linden (Tilia platyphillos)
trees increasingly appear in the inland landscape.
Tesis Doctoral García-Amorena, I., 2007 The Holocene forests in the Cantabrian coast fo the I.P.
198
Site descriptions
Eight coastal sites were sampled from 1994 to 2005 (fig. VI-1). Two types of sampling
were done: a “surface sampling”, by collecting all wood and fruit remains that excelled
of the surface of the entire outcrops; a number of stratigraphic columns were also
sampled in various rich - organic outcrops to further search for leaves and other small
remains (i.e. <5 mm plant remains) (fig. VI-2).
Sites under tidal flux or wave erosion
Remains of peat bog sediments were found on beach surfaces and cliffs at Noja,
Baldayo, Oyambre and Merón sites. Sampling was carried out after storm events when
tidal fluctuations were at their maximum amplitude.
Noja site (Cantabria), is a karst depression infilled with continental sands, silt and clay
sediments, in which several peat bog layers up to 100 cm of thickness are intercalated.
Wood and root remains were found in their living position between 0 to -4 m below sea
level. These remains were dated between ~3,000 and ~4,500 years BP (Cearreta, 1993;
Salas et al., 1996).
Living position stumps, logs, leaves, fruits and seeds were found in peat bog sediments
from Merón and Oyambre sites (Cantabria), that lie on a >70,000 years BP beach level
(Garzón et al., 1996). These macro-remains belong to forests that grew before 6-7 kyr
BP (Garzón et al., 1996).
Many ligneous remains were found in a peat bog layer from Baldayo site (La Coruña),
located in between the Quaternary sands that lie on a Precambrian granite basement
(Vera, 2004). Marine water tidal currents are responsible of the present peat bog
sediment erosion.
Estuaries
Although at present no marine water contact with these sites, their sedimentary
processes were highly influenced in the past by eustatic sea-level changes. For example,
the active channelling process in sandy tidal flats which predominated in the
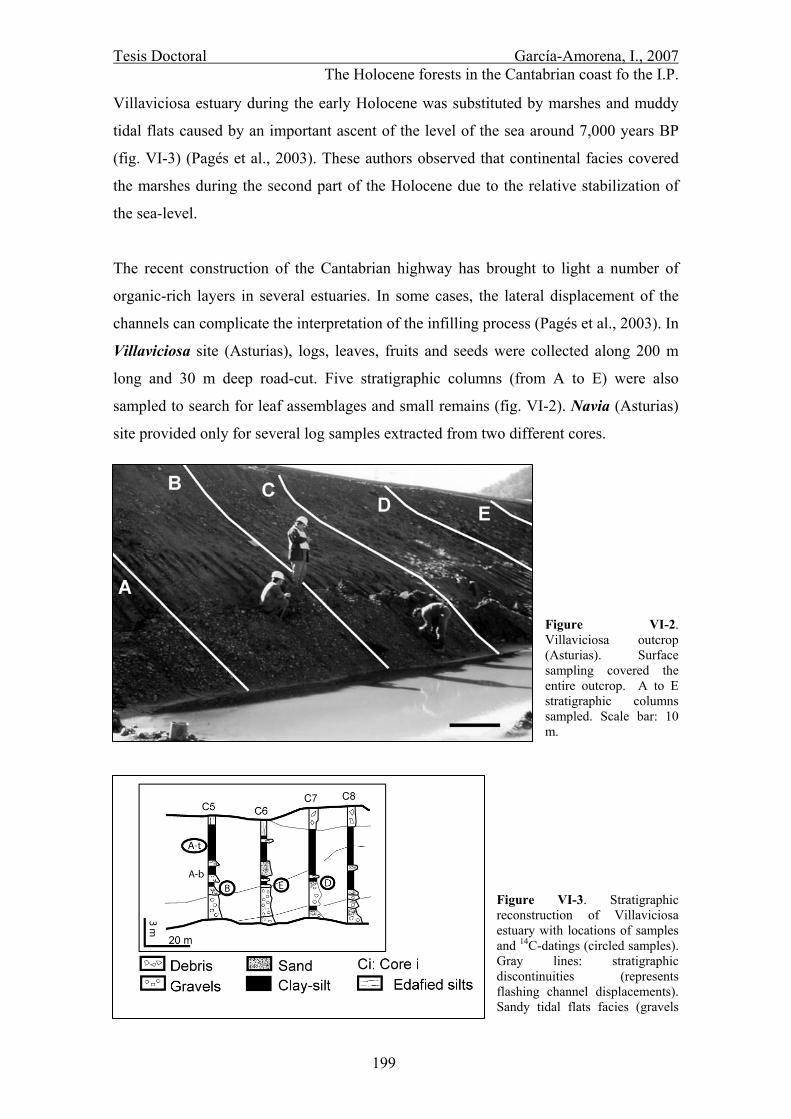
Tesis Doctoral García-Amorena, I., 2007 The Holocene forests in the Cantabrian coast fo the I.P.
199
Villaviciosa estuary during the early Holocene was substituted by marshes and muddy
tidal flats caused by an important ascent of the level of the sea around 7,000 years BP
(fig. VI-3) (Pagés et al., 2003). These authors observed that continental facies covered
the marshes during the second part of the Holocene due to the relative stabilization of
the sea-level.
The recent construction of the Cantabrian highway has brought to light a number of
organic-rich layers in several estuaries. In some cases, the lateral displacement of the
channels can complicate the interpretation of the infilling process (Pagés et al., 2003). In
Villaviciosa site (Asturias), logs, leaves, fruits and seeds were collected along 200 m
long and 30 m deep road-cut. Five stratigraphic columns (from A to E) were also
sampled to search for leaf assemblages and small remains (fig. VI-2). Navia (Asturias)
site provided only for several log samples extracted from two different cores.
Figure VI-2. Villaviciosa outcrop (Asturias). Surface sampling covered the entire outcrop. A to E stratigraphic columns sampled. Scale bar: 10 m.
Figure VI-3. Stratigraphic reconstruction of Villaviciosa estuary with locations of samples and 14C-datings (circled samples). Gray lines: stratigraphic discontinuities (represents flashing channel displacements). Sandy tidal flats facies (gravels

Tesis Doctoral García-Amorena, I., 2007 The Holocene forests in the Cantabrian coast fo the I.P.
200
and sands) at the bottom is substituted by marshes and muddy tidal flats facies to the top (sands to clay-silt sediment) (Pagés et al., 2003).
Inland sites
Several sites were sampled in inland areas where the ocean proximity can only be
noticed by its effect on climate. Mechanical excavations in the Holocene sediments that
cover granit (Finca Galea - Lugo), Jurassic sandstone and Carboniferous limestone
basements (La Borbolla valley - Asturias) provided a number of trunks from primeval
forests.
Tesis Doctoral García-Amorena, I., 2007 The Holocene forests in the Cantabrian coast fo the I.P.
201
Materials and methods
Thin laminas of the main planes (see fig. VI-4) were prepared from the ligneous
samples, which were identified by using keys and descriptions (Greguss, 1945; Greguss,
1959; Jacquiot et al., 1973; Core et al., 1979; Wheeler et al., 1986; Guindeo and García,
1989; Schweingruber, 1990; Dallwitz et al., 1993 onwards; Richter and Dallwitz, 2000
onwards). Identifications were assessed by comparing samples with present day
material belonging to the wood collection of the Escuela Técnica Superior de
Ingenieros de Montes [ETSIM], Universidad Politécnica de Madrid.
All sediment samples were sieved with 50 g/l tetra-sodium pyrophosphate (Na4P2O7
10H2O) to dilute the clay. Plant remains were carefully brushed and, when necessary,
immersed in 30% fluoric acid (HF) to remove remaining silica.
Five × five mm from the central part of the leaf samples, where epidermal parameters
are more stable (Poole et al., 1996), were cut and bleached in 4% sodium hypochlorite
(NaH ClO2) for 30 seconds. After rinsing them for 5 minutes, the remaining cuticles
were mounted on microscopic slides with glycerine jelly to be observed under the
transmitted light microscope. Microscopic cuticles characteristics were identified using
keys and descriptions (Wilkinson, 1979; Peñas et al., 1994; Uzunova et al., 1997;
Westerkamp and Demmelmeyer, 1997). Leaf samples were then determined to species
according to cuticle and morphological descriptions (Castroviejo et al., 1986-2004), and
by comparing them with present day material.
Age assessment
The age assessment, for all the eight sites, is based on conventional 14C dating of fossil
wood collected from layers or cores sampled. Conventional radiocarbon ages were
calibrated and are given as cal BP (Stuiver et al., 1998; Reimer et al., 2004). The age of
samples Ab (fig. VI-3) was estimated from the 14C/depth adjacent data. All dates are
given in calibrated scale unless otherwise stated as uncal BP.
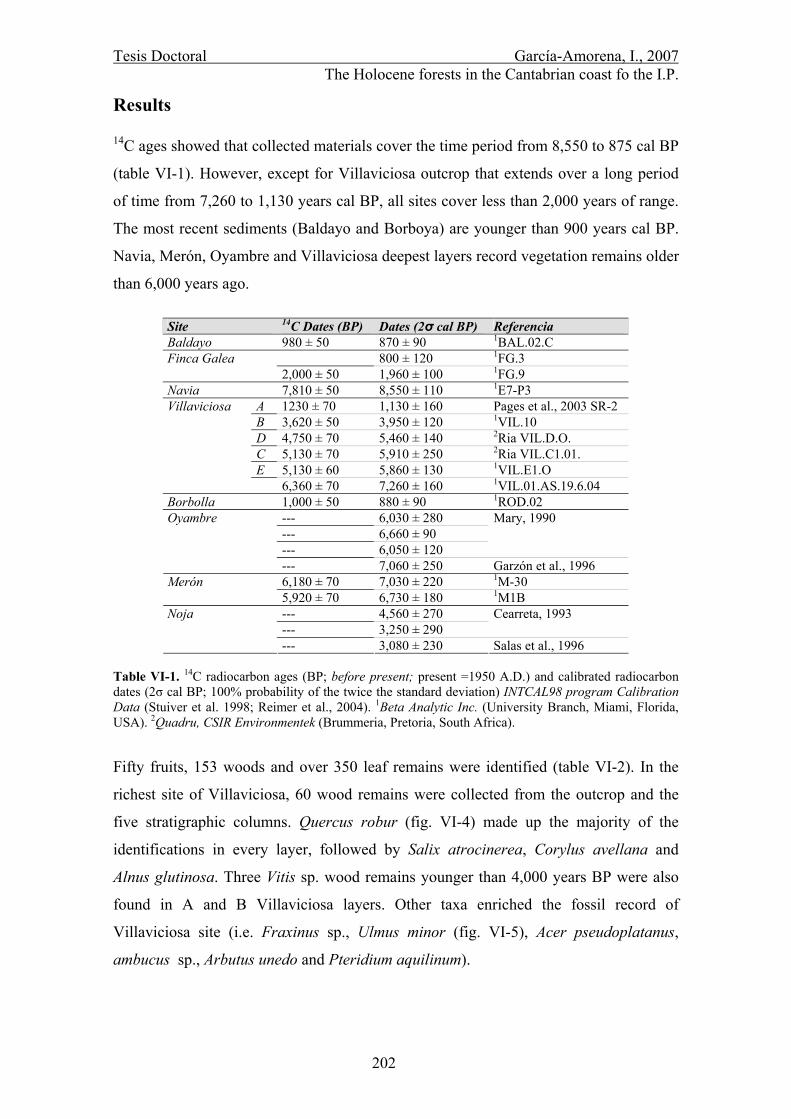
Tesis Doctoral García-Amorena, I., 2007 The Holocene forests in the Cantabrian coast fo the I.P.
202
Results
14C ages showed that collected materials cover the time period from 8,550 to 875 cal BP
(table VI-1). However, except for Villaviciosa outcrop that extends over a long period
of time from 7,260 to 1,130 years cal BP, all sites cover less than 2,000 years of range.
The most recent sediments (Baldayo and Borboya) are younger than 900 years cal BP.
Navia, Merón, Oyambre and Villaviciosa deepest layers record vegetation remains older
than 6,000 years ago. Table VI-1. 14C radiocarbon ages (BP; before present; present =1950 A.D.) and calibrated radiocarbon dates (2σ cal BP; 100% probability of the twice the standard deviation) INTCAL98 program Calibration Data (Stuiver et al. 1998; Reimer et al., 2004). 1Beta Analytic Inc. (University Branch, Miami, Florida, USA). 2Quadru, CSIR Environmentek (Brummeria, Pretoria, South Africa).
Fifty fruits, 153 woods and over 350 leaf remains were identified (table VI-2). In the
richest site of Villaviciosa, 60 wood remains were collected from the outcrop and the
five stratigraphic columns. Quercus robur (fig. VI-4) made up the majority of the
identifications in every layer, followed by Salix atrocinerea, Corylus avellana and
Alnus glutinosa. Three Vitis sp. wood remains younger than 4,000 years BP were also
found in A and B Villaviciosa layers. Other taxa enriched the fossil record of
Villaviciosa site (i.e. Fraxinus sp., Ulmus minor (fig. VI-5), Acer pseudoplatanus,
ambucus sp., Arbutus unedo and Pteridium aquilinum).
Site 14C Dates (BP) Dates (2σ cal BP) Referencia Baldayo 980 ± 50 870 ± 90 1BAL.02.C
800 ± 120 1FG.3 Finca Galea 2,000 ± 50 1,960 ± 100 1FG.9
Navia 7,810 ± 50 8,550 ± 110 1E7-P3 A 1230 ± 70 1,130 ± 160 Pages et al., 2003 SR-2 B 3,620 ± 50 3,950 ± 120 1VIL.10 D 4,750 ± 70 5,460 ± 140 2Ria VIL.D.O. C 5,130 ± 70 5,910 ± 250 2Ria VIL.C1.01. E 5,130 ± 60 5,860 ± 130 1VIL.E1.O
Villaviciosa
6,360 ± 70 7,260 ± 160 1VIL.01.AS.19.6.04 Borbolla 1,000 ± 50 880 ± 90 1ROD.02
--- 6,030 ± 280 --- 6,660 ± 90 --- 6,050 ± 120
Mary, 1990 Oyambre
--- 7,060 ± 250 Garzón et al., 1996 6,180 ± 70 7,030 ± 220 1M-30 Merón 5,920 ± 70 6,730 ± 180 1M1B --- 4,560 ± 270 --- 3,250 ± 290
Cearreta, 1993 Noja
--- 3,080 ± 230 Salas et al., 1996
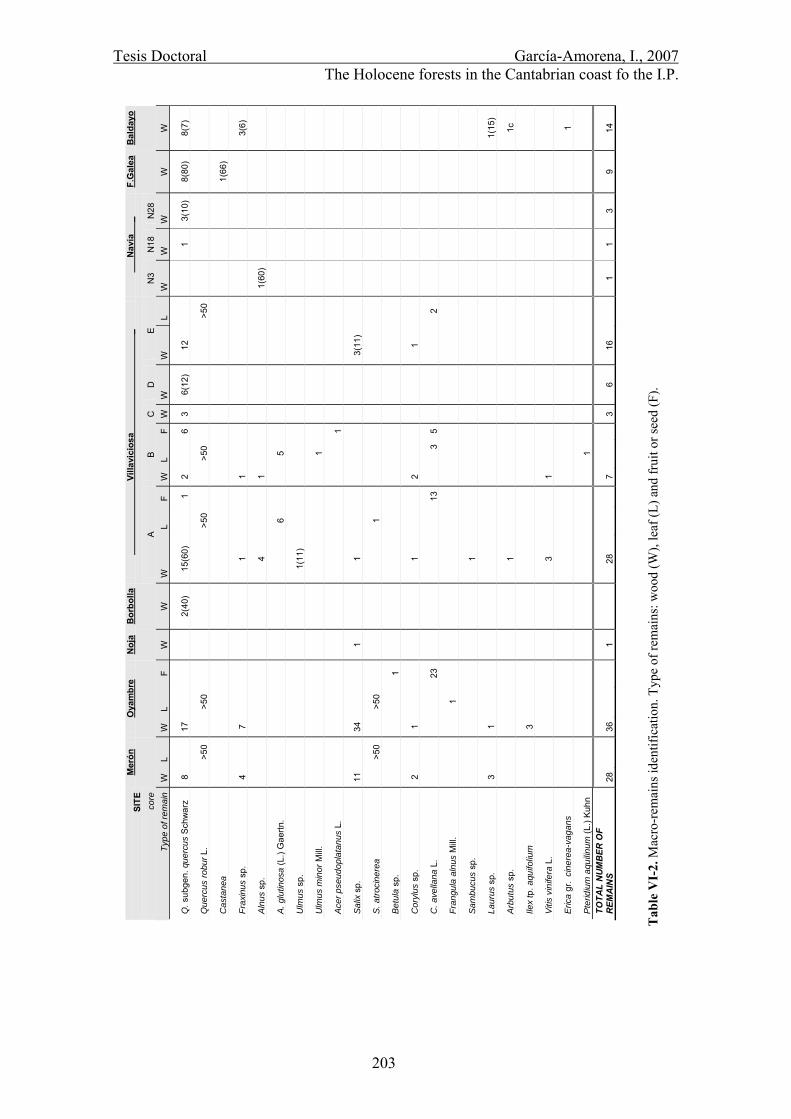
Tesis Doctoral García-Amorena, I., 2007 The Holocene forests in the Cantabrian coast fo the I.P.
203
Tab
le V
I-2.
Mac
ro-r
emai
ns id
entif
icat
ion.
Typ
e of
rem
ains
: woo
d (W
), le
af (L
) and
frui
t or s
eed
(F).
SITE
Vill
avic
iosa
_
Nav
ia
_
core
Mer
ón
Oya
mbr
e N
oja
Bor
bolla
A B
C
D
E N
3 N
18
N28
F.G
alea
B
alda
yo
Type
of r
emai
n W
L
W
L F
W
W
W
L F
W
L F
W
W
W
L W
W
W
W
W
Q. s
ubge
n. q
uerc
us S
chw
arz
8
17
2(
40)
15(6
0)
1
2
6 3
6(12
) 12
1
3(10
) 8(
80)
8(7)
Que
rcus
robu
r L.
>5
0
>50
>50
>50
>50
Cas
tane
a
1(
66)
Frax
inus
sp.
4
7
1
1
3(6)
Alnu
s sp
.
4
1
1(60
)
A. g
lutin
osa
(L.)
Gae
rtn.
6
5
Ulm
us s
p.
1(
11)
Ulm
us m
inor
Mill
.
1
Acer
pse
udop
lata
nus
L.
1
Salix
sp.
11
34
1
1
3(11
)
S. a
troci
nere
a
>50
>5
0
1
Betu
la s
p.
1
Cor
ylus
sp.
2
1
1
2
1
C. a
vella
na L
.
23
13
3 5
2
Fran
gula
aln
us M
ill.
1
Sam
bucu
s sp
.
1
Laur
us s
p.
3
1
1(
15)
Arbu
tus
sp.
1
1c
Ilex
tp. a
quifo
lium
3
Vitis
vin
ifera
L.
3
1
Eric
a gr
. cine
rea-
vaga
ns
1
Pter
idiu
m a
quilin
um (L
.) K
uhn
1
TOTA
L N
UM
BER
OF
REM
AIN
S 28
36
1
28
7
3
6 16
1 1
3 9
14
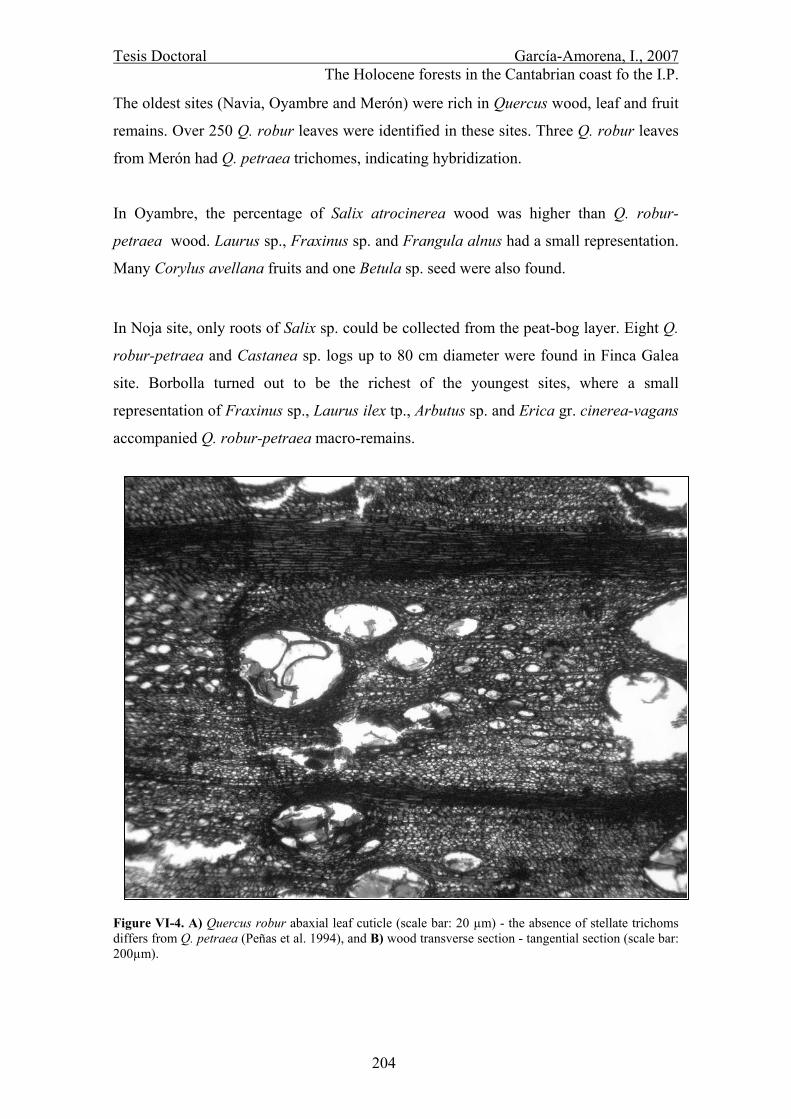
Tesis Doctoral García-Amorena, I., 2007 The Holocene forests in the Cantabrian coast fo the I.P.
204
The oldest sites (Navia, Oyambre and Merón) were rich in Quercus wood, leaf and fruit
remains. Over 250 Q. robur leaves were identified in these sites. Three Q. robur leaves
from Merón had Q. petraea trichomes, indicating hybridization.
In Oyambre, the percentage of Salix atrocinerea wood was higher than Q. robur-
petraea wood. Laurus sp., Fraxinus sp. and Frangula alnus had a small representation.
Many Corylus avellana fruits and one Betula sp. seed were also found.
In Noja site, only roots of Salix sp. could be collected from the peat-bog layer. Eight Q.
robur-petraea and Castanea sp. logs up to 80 cm diameter were found in Finca Galea
site. Borbolla turned out to be the richest of the youngest sites, where a small
representation of Fraxinus sp., Laurus ilex tp., Arbutus sp. and Erica gr. cinerea-vagans
accompanied Q. robur-petraea macro-remains.
Figure VI-4. A) Quercus robur abaxial leaf cuticle (scale bar: 20 µm) - the absence of stellate trichoms differs from Q. petraea (Peñas et al. 1994), and B) wood transverse section - tangential section (scale bar: 200µm).
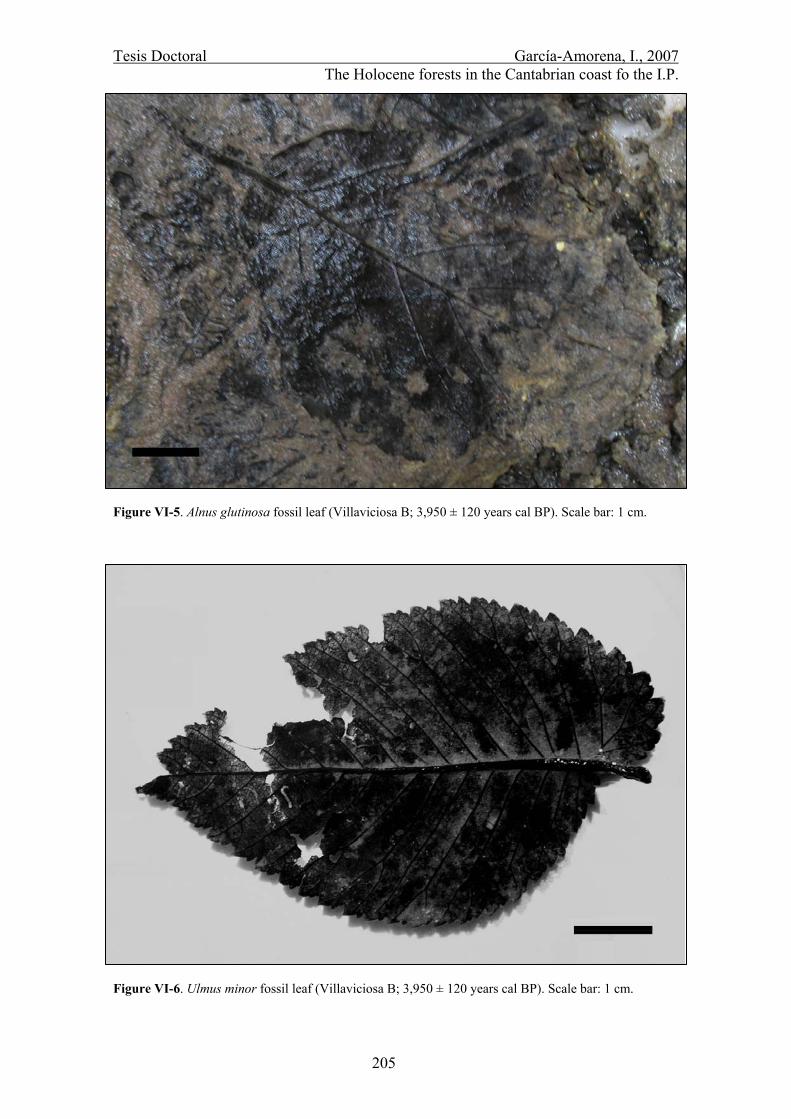
Tesis Doctoral García-Amorena, I., 2007 The Holocene forests in the Cantabrian coast fo the I.P.
205
Figure VI-5. Alnus glutinosa fossil leaf (Villaviciosa B; 3,950 ± 120 years cal BP). Scale bar: 1 cm.
Figure VI-6. Ulmus minor fossil leaf (Villaviciosa B; 3,950 ± 120 years cal BP). Scale bar: 1 cm.

Tesis Doctoral García-Amorena, I., 2007 The Holocene forests in the Cantabrian coast fo the I.P.
206
Discussion
The analysis of macro-remains undertaken in the eight studied sites along the Atlantic
coast of northern Spain (table VI-2) are consistent with existing palynological and
archaeological studies from the Cantabrian region. Our study has demonstrated the
important added value of macro-remains to provide precise information about the
Holocene vegetation in the Atlantic coast of northern Spain. We may highlight the
following features: a) for the first time in this region, this study has provided exact data
about the species composition of the Holocene forest types, allowing us to conclude that
they were similar to the natural forest remnants still present today; b) the numerous
leaves and fruits found have provided critical data to reach the species taxonomic level;
c) the precise location of the original distribution of the studied macro-remains have
demonstrated the persistence of the vegetation components that survived the previous
Würm period in the Cantabrian coastal refugia during the Holocene.
When comparing the Holocene macro-remain data analysed in this work with other
available palaeobotanical records, the following similarities are found: The
predominance of deciduous broadleaf forests (van Mourik, 1986; Costa Tenorio et al.,
1990; Sánchez Goñi, 1994; Iriarte, 2003); the relevance of hygrophilous communities
(Dupré Ollivier, 1980; Torras Troncoso et al., 1980; López, 1982; García Antón et al.,
2006); the remarkable presence of evergreen broadleaf thermophilous taxa (Uzquiano,
1994; Ramil-Rego et al., 1998b); and the little appearance of plant species from
secondary plant communities and the Coniferae group.
The Holocene deciduous mixed forest
The high number of Q. robur leaves found at altitudes below 20 m a.s.l. (table VI-2)
demonstrates its widespread presence in the coast during the Holocene. This oak specie
had to extend at the beginning of the Holocene, when deciduous broadleaf forests
expanded; occupying spaces where Juniperus, Pinus and Betula open woodlands
formerly grew (Oldfield, 1964; Saá and Díaz-Fierros, 1988; Mary, 1990; Iriarte, 2003;
García Antón et al., 2006).
The few Q. petraea trichomes observed in three Q. robur cuticles indicates a distant
position of Q. petraea forests from the coast at least since 8,550 years BP. At present
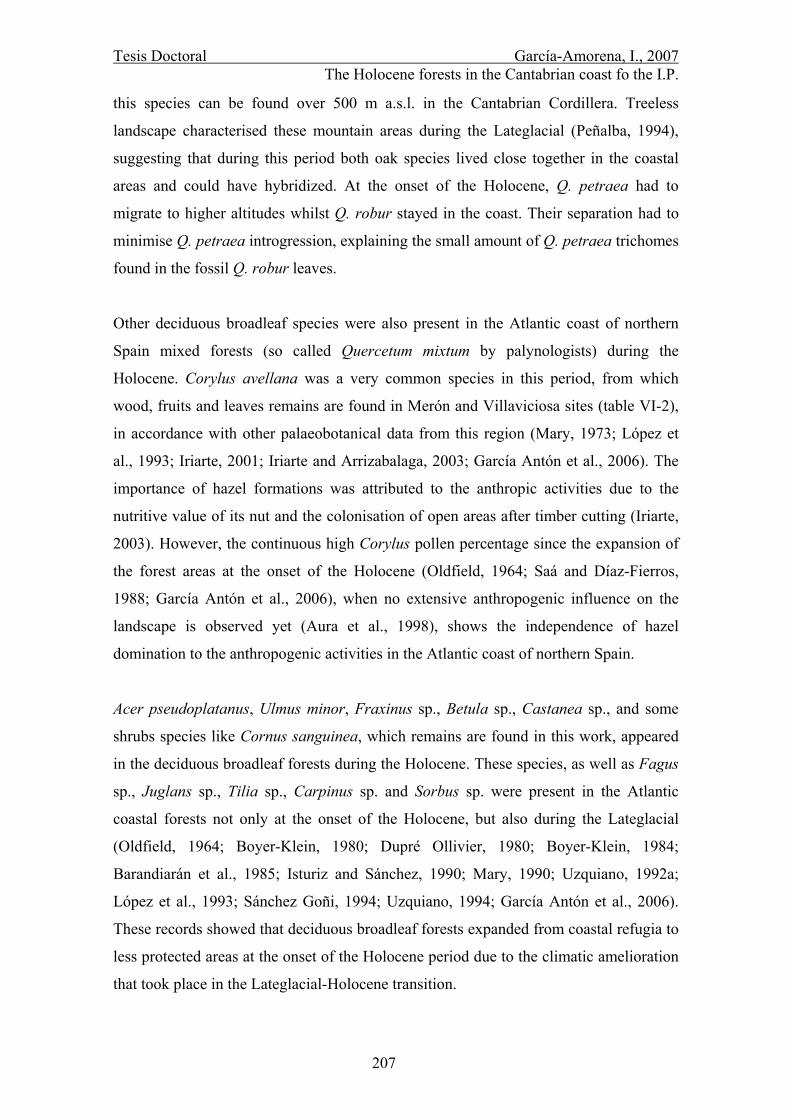
Tesis Doctoral García-Amorena, I., 2007 The Holocene forests in the Cantabrian coast fo the I.P.
207
this species can be found over 500 m a.s.l. in the Cantabrian Cordillera. Treeless
landscape characterised these mountain areas during the Lateglacial (Peñalba, 1994),
suggesting that during this period both oak species lived close together in the coastal
areas and could have hybridized. At the onset of the Holocene, Q. petraea had to
migrate to higher altitudes whilst Q. robur stayed in the coast. Their separation had to
minimise Q. petraea introgression, explaining the small amount of Q. petraea trichomes
found in the fossil Q. robur leaves.
Other deciduous broadleaf species were also present in the Atlantic coast of northern
Spain mixed forests (so called Quercetum mixtum by palynologists) during the
Holocene. Corylus avellana was a very common species in this period, from which
wood, fruits and leaves remains are found in Merón and Villaviciosa sites (table VI-2),
in accordance with other palaeobotanical data from this region (Mary, 1973; López et
al., 1993; Iriarte, 2001; Iriarte and Arrizabalaga, 2003; García Antón et al., 2006). The
importance of hazel formations was attributed to the anthropic activities due to the
nutritive value of its nut and the colonisation of open areas after timber cutting (Iriarte,
2003). However, the continuous high Corylus pollen percentage since the expansion of
the forest areas at the onset of the Holocene (Oldfield, 1964; Saá and Díaz-Fierros,
1988; García Antón et al., 2006), when no extensive anthropogenic influence on the
landscape is observed yet (Aura et al., 1998), shows the independence of hazel
domination to the anthropogenic activities in the Atlantic coast of northern Spain.
Acer pseudoplatanus, Ulmus minor, Fraxinus sp., Betula sp., Castanea sp., and some
shrubs species like Cornus sanguinea, which remains are found in this work, appeared
in the deciduous broadleaf forests during the Holocene. These species, as well as Fagus
sp., Juglans sp., Tilia sp., Carpinus sp. and Sorbus sp. were present in the Atlantic
coastal forests not only at the onset of the Holocene, but also during the Lateglacial
(Oldfield, 1964; Boyer-Klein, 1980; Dupré Ollivier, 1980; Boyer-Klein, 1984;
Barandiarán et al., 1985; Isturiz and Sánchez, 1990; Mary, 1990; Uzquiano, 1992a;
López et al., 1993; Sánchez Goñi, 1994; Uzquiano, 1994; García Antón et al., 2006).
These records showed that deciduous broadleaf forests expanded from coastal refugia to
less protected areas at the onset of the Holocene period due to the climatic amelioration
that took place in the Lateglacial-Holocene transition.

Tesis Doctoral García-Amorena, I., 2007 The Holocene forests in the Cantabrian coast fo the I.P.
208
Differences in Holocene forests’ composition among the Cantabrian coastal areas
cannot be deduced from our records. So far, Corylus sp. decreases in importance in
inland mountain areas, whereas Betula sp. becomes more important (Menéndez Amor
and Florschütz, 1961; Mary, 1973; Mariscal, 1993; Peñalba, 1994; Muñoz-Sobrino et
al., 2005).
The Holocene vegetation history of the Galician coast is the less known due to the very
scarce palaeobotanical information. In this area, Baldayo and Finca Galea macro-
remains (table VI-2) show the presence of Quercus robur-petraea, together with
Castanea sp., Fraxinus sp. and other thermo-hygrophilous species for the last 2,000
years. The closest inland Holocene fossil information, showed some similarities with
the coastal macro-remain data: the presence of Quercetum mixtum forests in the
Galician sub-coastal mountains during the Holocene, with insignificant appearance of
thermo and thermo-hygrophilous taxa (i.e. Olea europaea, Arbutus sp., Ilex sp.) (van
Mourik, 1986; Saá and Díaz-Fierros, 1988; López et al., 1993; Ramil-Rego et al.,
1998a; Muñoz-Sobrino et al., 2005). Unfortunately, the scarce pollen record of thermo
and thermo-hygrophilous taxa found in sub-coastal mountain areas do not allow to
conclude whether these taxa represent the coastal vegetation at that time, or just small
populations in refugial areas from the mountains.
Ulmus minor
A complete leaf sample of Ulmus minor found in the sediment B of Villaviciosa (fig.
VI-5), dating back to 3,950 ± 120 years cal BP, together with its fossil wood, allowed us
to demonstrate for the first time the natural origin of this specie in the Atlantic coast of
Spain. This specie is at present widely distributed throughout the riparian vegetation of
the Iberian Peninsula. However, it was claimed the alocthonous origin of this taxon in
the Iberian Peninsula (Huntley and Birks, 1983; Richens and Jeffers, 1986) based on
evidences of the Iberian U. minor to come from a clone imported by the Romans ~2,000
years ago (Gil et al., 2004), and on the historical links between humans and elm as an
important source for cattle feeding, agriculture tools and vineyards’ support. So far,
numerous palaeobotanical evidences have already demonstrated the Tertiary origin of
the genus Ulmus in the Iberian Peninsula (López, 2000) and its presence during the
Lateglacial and Holocene (Mary, 1973; Boyer-Klein, 1980; Mary, 1990; Mariscal,
1993; Ramil-Rego et al., 1998a; López, 2000).
Tesis Doctoral García-Amorena, I., 2007 The Holocene forests in the Cantabrian coast fo the I.P.
209
Hygrophilous taxa
The numerous Salix atrocinerea, Alnus glutinosa and Fraxinus sp. ligneous and leaf
remains found at the coastal sites (Noja, Merón, Oyambre, Villaviciosa and Navia)
showed the importance of the hygrophilous communities in the north Atlantic coast of
Spain during the Holocene (table VI-2). This agrees with the generalization of peat-bog
and hydrophytic deposits along the Atlantic coast of northern Spain at the lowering of
the sea level rise 7,000 years ago (Garzón et al., 1996; Dias et al., 2000). Hygrophilous
taxa such as Salix atrocinerea, Alnus glutinosa, Fraxinus sp. and Sambucus sp. had to
expand in these areas, from which macro- and micro-remains were found (table VI-2;
Oldfield, 1964; Saá and Díaz-Fierros, 1988; Isturiz and Sánchez, 1990; García Antón et
al., 2006). Cited pollen diagrams often report the importance of these taxa. However,
Salix pollen is generally absents, which highlights the importance of the macro-remain’s
studies to acquire a good knowledge of the concrete species composition of the past
vegetation and their local distribution significance.
Thermophilous and evergreen broadleaf taxa
As from the evergreen broadleaf taxa, Arbutus sp. and Laurus sp. were found to be
present in Merón, Oyambre, Villaviciosa y Baldayo sites (table VI-2). This remains
showed that higro-thermophilous taxa were present in the in the Cantabrian coast forests
at least since ~7,000 years BP. Macro-remains of Vitis sp. found in Villaviciosa also
support the existence of thermophilous species in this site during the Holocene. In
accordance with our records, there is extensive data that supports the presence of these
hygrophilous and thermophilous elements close to the Atlantic coast of northern Spain
since the beginning of the Holocene (Oldfield, 1964; Iriarte and Arrizabalaga, 2003;
García Antón et al., 2006).
Looking back to the Würm period, numerous thermophilous taxa remains are found
along the Atlantic coast in south-western Europe. Phillyrea sp., Olea europaea, Arbutus
sp., and Viburnum sp. are found in natural and archaeological human settlements in the
French and Spanish Vasque countries, Cantabria and Asturias (Oldfield, 1964;
Uzquiano, 1992a; Uzquiano, 1994; Iriarte and Arrizabalaga, 2003). Some of this species
are also found in the sub-coastal mountains of Galicia (Ramil-Rego et al., 1998b).
These records support the existence of habitats close to the Cantabrian coast, sheltered
Tesis Doctoral García-Amorena, I., 2007 The Holocene forests in the Cantabrian coast fo the I.P.
210
from cold winds and watered enough to allow thermophilous species to develop during
the cold stages.
The analysis of the macro-remains found in the Cantabrian coast (table VI-2) show that
thermo- and higro-thermophilous taxa were actually located in the Cantabrian coast
during the Holocene. It also suggests that the refugial areas where these plants survived
in the Würm period were present between the study sites and the Würmian coastal line.
The occurrence of Vitis sp. wood remains from Villaviciosa, dating back to ~4,000
years BP (table VI-2), together with other pollen remains older than 3,000 years BP
found in Le Moura and in Villaviciosa (Oldfield, 1964; García Antón et al., 2006),
confirm the natural origin of this specie in the Cantabrian coast.
In the other hand, Ilex tp. aquifolium was found in Oyambre site. The proximity of this
specie to the Cantabrian coast during the Pleistocene and Holocene was already
demonstrated by a number of pollen records from this region (Mary, 1973; Peñalba et
al., 1987; Uzquiano, 1995). The 7,000 years BP old macro-remain found in Villaviciosa
demonstrated that this specie was present in the Cantabrian coast in the first half of the
Holocene. As Ilex aquifolium grows at present in the mountain areas, where steppic
landscape dominated during the Würm period, it had to refugiate from the cold and dry
weather in the coastal areas. The finding of the 7,000 year BP I. tp. aquifolium macro-
remain shows one of the locations where this taxa refugiated and subsisted during the
first half of the Holocene.
Conifer taxa
The little significance of conifer taxa in the Cantabrian natural vegetation is in
accordance with the absence of conifer macro-remains in all the study sites. Pollen
records from other Atlantic coastal sites in the Iberian Peninsula show up a similar trend
with up to 15% Pinus sp. pollen percentage throughout the Holocene (Menéndez Amor
and Florschütz, 1961; Oldfield, 1964; van Mourik, 1986; Saá and Díaz-Fierros, 1988;
Mary, 1990; García Antón et al., 2006), corresponding to pollen concentration levels of
alloctonous origin (Huntley and Birks, 1983). We can conclude that there were no large
conifer populations near the study sites during the Holocene. However, Pinus sp. pollen
records appear to be dominant in certain areas during the first half of the Holocene, but
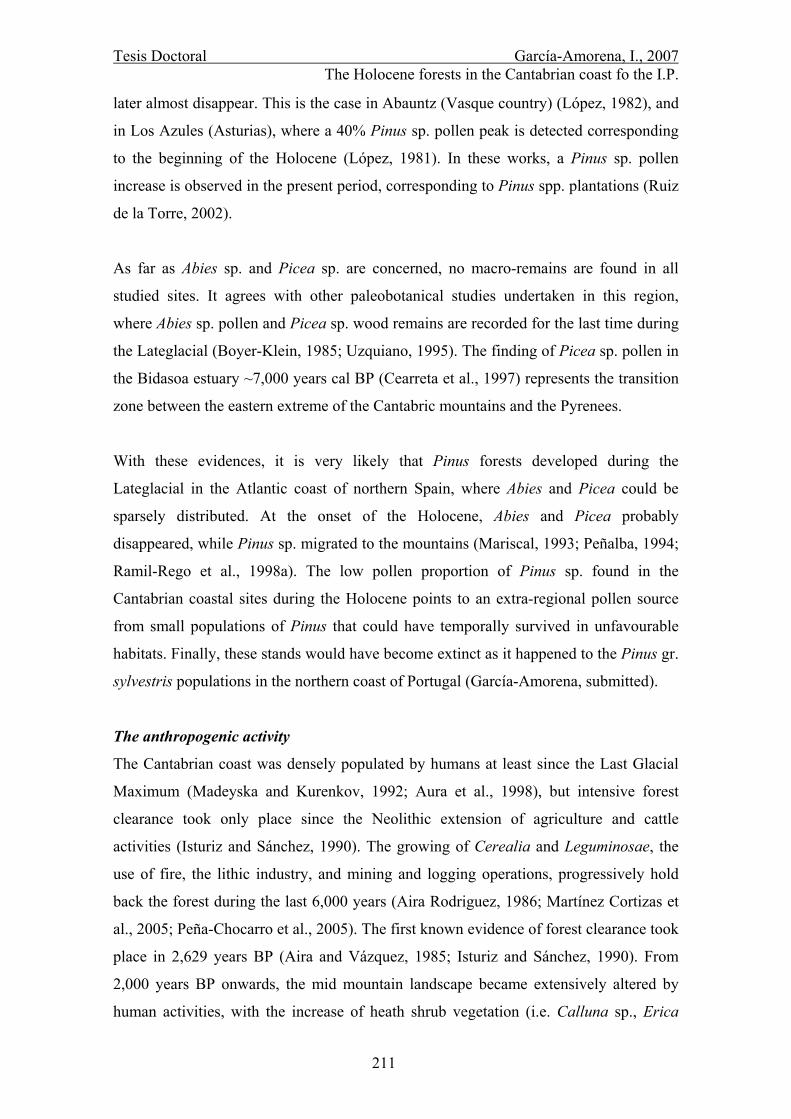
Tesis Doctoral García-Amorena, I., 2007 The Holocene forests in the Cantabrian coast fo the I.P.
211
later almost disappear. This is the case in Abauntz (Vasque country) (López, 1982), and
in Los Azules (Asturias), where a 40% Pinus sp. pollen peak is detected corresponding
to the beginning of the Holocene (López, 1981). In these works, a Pinus sp. pollen
increase is observed in the present period, corresponding to Pinus spp. plantations (Ruiz
de la Torre, 2002).
As far as Abies sp. and Picea sp. are concerned, no macro-remains are found in all
studied sites. It agrees with other paleobotanical studies undertaken in this region,
where Abies sp. pollen and Picea sp. wood remains are recorded for the last time during
the Lateglacial (Boyer-Klein, 1985; Uzquiano, 1995). The finding of Picea sp. pollen in
the Bidasoa estuary ~7,000 years cal BP (Cearreta et al., 1997) represents the transition
zone between the eastern extreme of the Cantabric mountains and the Pyrenees.
With these evidences, it is very likely that Pinus forests developed during the
Lateglacial in the Atlantic coast of northern Spain, where Abies and Picea could be
sparsely distributed. At the onset of the Holocene, Abies and Picea probably
disappeared, while Pinus sp. migrated to the mountains (Mariscal, 1993; Peñalba, 1994;
Ramil-Rego et al., 1998a). The low pollen proportion of Pinus sp. found in the
Cantabrian coastal sites during the Holocene points to an extra-regional pollen source
from small populations of Pinus that could have temporally survived in unfavourable
habitats. Finally, these stands would have become extinct as it happened to the Pinus gr.
sylvestris populations in the northern coast of Portugal (García-Amorena, submitted).
The anthropogenic activity
The Cantabrian coast was densely populated by humans at least since the Last Glacial
Maximum (Madeyska and Kurenkov, 1992; Aura et al., 1998), but intensive forest
clearance took only place since the Neolithic extension of agriculture and cattle
activities (Isturiz and Sánchez, 1990). The growing of Cerealia and Leguminosae, the
use of fire, the lithic industry, and mining and logging operations, progressively hold
back the forest during the last 6,000 years (Aira Rodriguez, 1986; Martínez Cortizas et
al., 2005; Peña-Chocarro et al., 2005). The first known evidence of forest clearance took
place in 2,629 years BP (Aira and Vázquez, 1985; Isturiz and Sánchez, 1990). From
2,000 years BP onwards, the mid mountain landscape became extensively altered by
human activities, with the increase of heath shrub vegetation (i.e. Calluna sp., Erica

Tesis Doctoral García-Amorena, I., 2007 The Holocene forests in the Cantabrian coast fo the I.P.
212
sp.), Castanea sativa, Ulmus minor, and Vitis sp. cultivation (Torras Troncoso et al.,
1980; van Mourik, 1986; Díaz Losada et al., 1990; Ramil-Rego et al., 1998a; Ezquerra
and Gil, 2004; Martínez Cortizas et al., 2005; Muñoz-Sobrino et al., 2005; García Antón
et al., 2006).
The Villaviciosa site (table VI-2) contains a 1,960 ± 100 years cal BP Castanea wood
and a 3,950 ± 120 to 1,130 ± 160 years cal BP Vitis sp. wood and Ulmus macro-
remains. These records show that Ulmus minor and Vitis vinifera were present before
the extensive human influence on the landscape, while Castanea sp. dates from a period
when humans had already highly influenced their environment. However, available
palaeobotanical information corroborates its natural origin in this region (van Mourik,
1986; Díaz Losada et al., 1990; Uzquiano, 1994; Uzquiano, 1995; Iriarte, 2003).

CHAPTER VII: Conclusions
Tesis Doctoral García-Amorena, I., 2007 Conclusions
214
CHAPTER III
Herbarium specimens of Quercus robur from the Iberian Peninsula covering the last
100 years and an altitudinal range of 1600 m enabled the development of a stomatal
index (SI) - atmospheric CO2 inference model that can be confidently used for
reconstructing past CO2 levels through stomatal frequency analysis of fossil leaf
material from this region. Regression analysis indicates that, within a restricted
altitudinal range of 0-1000 m a.s.l., 76.96 % of the SI decrease can be explained by a
CO2 sfift from 295 to 330 ppmv.
A comparison with Northwest European data shows that Spanish Q. robur leaves
typically have more epicuticular wax, smaller alveole areas and 3.5 % higher SI values.
These differences are likely to be a result of a latitudinally determined ~6% W/m2
difference in annual irradiation. Nevertheless, the good agreement between the SI
response rates of Iberian and Dutch training sets confirms that the adaptation of Q.
robur to changing atmospheric CO2 is essentially the same. The inclusion of the month
irradiance average (W/m2) in the model enabled incorporation of the Dutch data set
resulting in an improved model (R2=77; F-Snedecor = 63) that may be used over a wide
geographical extent.
With respect to CO2 reconstructions on the basis of SI values for (sub)fossil Q. robur
leaf material, the present data emphasize the need of adjusted calibration data sets
meeting the specific requirements of a geographical area. Regional SI -CO2 inference
models are useful within a restricted altitudinal and latitudinal range.
In addition to the SI decrease, both pore length (PL) and stomatal length (SL) show an
increase over the CO2 range of 295 ppmv to 321 ppmv, suggesting a relationship with
atmospheric CO2 conditions. In order to reduce the overprint of environmental factors
other than CO2, usage of the stomata-pore coefficient is introduced for describing the
response of stomatal dimensions to changing CO2 levels. No further stomatal response
to anthropogenic CO2 increase is to be expected for Iberian Q. robur, as response limits
were reached between 320 ppmv and 330 ppmv CO2 at 18.5 % SI and 41.8 % SC.

Tesis Doctoral García-Amorena, I., 2007 Conclusions
215
CHAPTER IV
Accurate atmospheric CO2 mixing ratios reconstructed by means of stomatal frequency
analysis of fossil oak leaves recovered from cliffs and road cuts in northern Spain
provide evidence of Holocene CO2 shifts of 20 ppmv, with minima at 8570 and 2830
BP, and a maximum at 5860 BP. Air-temperature anomalies of up to 0.2ºC forced by
these CO2 changes correspond to 20% of the variation in annual insolation at 65ºN and
10% of the Holocene mean temperature anomalies apparent from proxy temperature
records for the Northern Hemisphere. The amplitude and temporal pattern of the
reconstructed CO2 radiative forcing variations indicate that atmospheric CO2 is one of
the amplifying factors driving Holocene climate change. The variations clearly parallel
the long-term Northern Hemisphere temperature trends that characterize the early
Holocene cool period, the Holocene Thermal Maximum and the neoglacial cooling. The
strongly contrasting patterns of fluctuating CO2 levels and steady annual insolation
decrease during the Holocene indicate that orbital-independent mechanisms of CO2
exchange have contributed to millennial-scale Holocene climate variability.
Tesis Doctoral García-Amorena, I., 2007 Conclusions
216
CHAPTER V
The great variety of plant taxa identified at nine coastal sites shows the great floral
richness of the western Iberian coast during the Last Ice Age and Holocene – a
consequence of regional geological and climatic history. The regression of the sea
during the coldest parts of the Last Ice Age left a varied mosaic of environments open to
occupation by different plant formations, and provided a refuge for Eurosiberian,
Atlantic and Mediterranean species alike. The following environments were home to
different taxa:
→ Sandy soil environments; dominated by species of Pinus during the Last Ice Age
and the Holocene.
→ Riparian environments; characterised by the presence of Fraxinus sp., Alnus sp.,
and, to a lesser extent, Populus sp. and Sambucus sp., during the Holocene.
→ Nemoral environments with climax thermal communities; home to broadleaved,
deciduous Quercus during the Last Ice Age and the Holocene. Castanea sp.
would have reached this type of environment during this period.
→ Sands poor in nutrients or degraded soils: substitution formations of heather
(Erica gr. vagans-cinerea) during the Holocene.
The examined macroremains demonstrate the response of the vegetation to the changes
in the climate that took place over the past 20,000 years, and show that the mean
temperature of the study area during the Last Ice Age was some 2 - 8.9ºC cooler than it
is now. The mean January temperature was also cooler by some 4.9 – 10.3ºC. Compared
to the present, there could be also a maximum reduction in rainfall of some 45%.
During the Würmian period, populations of Pinus gr. sylvestris-nigra found refuge on
the northern Portuguese coast. Its formations became generalised, even during the
coldest phases, living alongside more thermophilous species such as ash and oak.
The rugged topography of the Iberian Peninsula facilitated the survival of plants during
the climatic variations of the Quaternary. Different species found adequate
environments at different altitudes that involved only small migrations. This study
shows that the Iberian Peninsula’s western coast acted as a refuge for both thermophiles
and species that required much more water during the coldest phases of the Quaternary.
Tesis Doctoral García-Amorena, I., 2007 Conclusions
217
During the Holocene, forests of Pinus gr. sylvestris-nigra became established in the
mountains towards the interior of the Peninsula and further north. The populations on
the coast gradually disappeared.
The many remains of P. pinaster found in their life position and with an age of some
7,000 years together represent the most important fossil forest of the Iberian coastline.
These remains bear witness to the substitution of the Pinus gr. sylvestris-nigra forests of
the Würmian Portuguese coast by P. pinaster.
The high taxonomic diversity of the Holocene sites studied agrees with the
establishment of warmer, damper climatic conditions that facilitated the expansion of
mesophilic species such as deciduous Quercus, Castanea sp. and Fraxinus sp. The
generalization of such an environment along the coast during the Holocene also
favoured the expansion of thermo-hygrophilous species such as Alnus sp.
The expansion of substitution taxa such as Erica gr. vagans-cinerea was favoured from
about 6,000 years BP, when the influence of Man on the coastal landscape became more
intense. Traces of fires, the remains of wood associated with Roman fishing equipment,
and the appearance of introduced allochthonous species in the last century, clearly
reflect human use of natural resources.
The absence of macroremains of P. pinea at the studied sites (and in the archaeological
sites of the area), except for their presence in southern Portugal, suggests that this
species occupied more southerly latitudes during the Last Ice Age and the Holocene.

Tesis Doctoral García-Amorena, I., 2007 Conclusions
218
CHAPTER VI
The analysis of fossil wood, leaves, fruits and seeds of eight sites along a 400 km
Cantabrian coastal tract demonstrates the important added value of macroremains for
obtaining high taxonomic precision, frequently even at the species level. Furthermore,
accurate information about the original habitat of the plants from which remains were
found provides new geobotanical information about the distribution of Iberian taxa.
Precise taxonomic and geographical information shows that during the Holocene the
forest composition in the Cantabrian coast was very similar to that of the natural forest
remnants present today. This study allows recognition the species composition and
biogeographic relevance of deciduous mixed forests mixed with hygrophilous and
hydro-thermophilous communities in coastal areas of northern Spain. The persistence of
different taxa that survived the last glaciation in this territory demonstrates the existence
of refugial areas for such plants during the Würm period.
Quercus robur is shown to be widespread along the Atlantic coast of northern Spain
during the Holocene. A small introgression of Q. petraea provides evidence that this
species migrated to the mountain area early in the Holocene. Corylus avellana was very
common in the coastal areas since the beginning of the Holocene, decreasing its
importance towards the mountains, where Betula sp. took over. Acer pseudoplatanus,
Ulmus minor, Fraxinus sp., Castanea sp., Betula sp., and shrubs like Cornus sanguinea
complete the Holocene deciduous forest composition. Pollen records indicate that these
taxa, together with elements like Fagus sp., Juglans sp., Carpinus sp., Tilia sp. and
Sorbus sp., were demonstrated to be present in the Atlantic coastal region of northern
Spain since the last glacial period.
Numerous macroremains of Salix atrocinerea, Alnus glutinosa and Fraxinus sp.
illustrate the importance of hygrophilous communities, in conjunction with the
Holocene sea level increase. The absence or little proportion of Salix sp. in the available
pollen records highlights the importance of the macroremain analysis.
Macroremains of Arbutus sp., Laurus sp. and Vitis sp. show the presence of
thermophilous taxa during the Holocene along the Cantabrian coast. This is consistent

Tesis Doctoral García-Amorena, I., 2007 Conclusions
219
with other records that report Olea europea, Phillyrea sp. and Viburnum sp. Ilex tp.
aquifolium woods complete the taxa that survived the last glaciation in the coastal
refugia.
The absence of Pinus macroremains, in line with the existing palynological studies,
shows that their populations almost disappeared in the first half of the Holocene,
although, unnoticed in paleobotanical studies, some relic stands could have survived at
the Cantabrian coast.
The presence of Ulmus minor and Vitis sp. macroremains, preceding the anthropogenic
spreading of these taxa, demonstrates natural occurrences along the Atlantic coast of
northern Spain. 1,960 ± 100 years BP old Castanea sp. wood shows the occurrence of
this taxon in Galicia during the Roman period. However, earlier palaeobotanical studies
have revealed its presence since the Lateglacial.