Estrategia de la empresa Ferris en el simulador de negocios CAPSIM
125
Instituto Tecnológico y de Estudios Superiores de Occidente 2015-02 Estrategia de la empresa Ferris en el simulador de negocios CAPSIM Sánchez-Guzmán, Jorge; Lechuga-Flores, Mariana; López-DelToro, Sara G.; Pardo-Hernández, Sinuhe Sánchez-Guzmán, J.; Lechuga-Flores, M.; López-DelToro, S. G.; Pardo-Hernández, S. (2015). Estrategia de la empresa Ferris en el simulador de negocios CAPSIM. Trabajo de obtención de grado, Maestría en Administración. Tlaquepaque, Jalisco: ITESO. Enlace directo al documento: http://hdl.handle.net/11117/3361 Este documento obtenido del Repositorio Institucional del Instituto Tecnológico y de Estudios Superiores de Occidente se pone a disposición general bajo los términos y condiciones de la siguiente licencia: http://quijote.biblio.iteso.mx/licencias/CC-BY-NC-ND-2.5-MX.pdf (El documento empieza en la siguiente página) Repositorio Institucional del ITESO rei.iteso.mx Departamento de Economía, Administración y Mercadología DEAM - Trabajos de fin de Maestría en Administración
Transcript of Estrategia de la empresa Ferris en el simulador de negocios CAPSIM

Instituto Tecnológico y de Estudios Superiores de Occidente
2015-02
Estrategia de la empresa Ferris en el
simulador de negocios CAPSIM
Sánchez-Guzmán, Jorge; Lechuga-Flores, Mariana; López-DelToro, Sara
G.; Pardo-Hernández, Sinuhe Sánchez-Guzmán, J.; Lechuga-Flores, M.; López-DelToro, S. G.; Pardo-Hernández, S. (2015).
Estrategia de la empresa Ferris en el simulador de negocios CAPSIM. Trabajo de obtención de
grado, Maestría en Administración. Tlaquepaque, Jalisco: ITESO.
Enlace directo al documento: http://hdl.handle.net/11117/3361
Este documento obtenido del Repositorio Institucional del Instituto Tecnológico y de Estudios Superiores de
Occidente se pone a disposición general bajo los términos y condiciones de la siguiente licencia:
http://quijote.biblio.iteso.mx/licencias/CC-BY-NC-ND-2.5-MX.pdf
(El documento empieza en la siguiente página)
Repositorio Institucional del ITESO rei.iteso.mx
Departamento de Economía, Administración y Mercadología DEAM - Trabajos de fin de Maestría en Administración

INSTITUTO TECNOLÓGICO Y DE ESTUDIOS
SUPERIORES DE OCCIDENTE
RECONOCIMIENTO DE VALIDEZ OFICIAL DE ESTUDIOS SEGÚN ACUERDO SECRETARIAL 15018, PUBLICADO EN EL DIARIO OFICIAL DE LA FEDERACIÓN EL 29 DE NOVIEMBRE DE 1976
DEPARTAMENTO DE ECONOMÍA, ADMINISTRACIÓN Y MERCADOLOGÍA
MAESTRÍA EN ADMINISTRACIÓN
ESTRATEGIA DE LA EMPRESA FERRIS EN EL SIMULADOR DE NEGOCIOS CAPSIM
TESIS DE MAESTRÍA QUE PARA OBTENER EL GRADO DE
MAESTRO EN ADMINISTRACIÓN
PRESENTA:
JORGE SÁNCHEZ GUZMÁN
MARIANA LECHUGA FLORES
SARA GEORGINA LÓPEZ DEL TORO
SINUHE PARDO HERNÁNDEZ
ASESOR: Dr. JOSÉ DE LA CERDA GASTÉLUM
Tlaquepaque, Jal. Diciembre de 2014

Agradecimientos
Al empezar no sabía hacia dónde ir, pero hoy, quiero agradecer de manera muy especial a todos mis maestros
por su apoyo y su entusiasmo, por apoyarme en cada momento para seguir adelante con este proyecto de vida. Cada
paso fue pesado, pero en cada uno de ellos me encontré con la dicha de tener detrás de mi muchos brazos que me
empujaron para que continuara con esta difícil tarea, quiero agradecer a todos ellos, mi familia, que sin ella no hubiera
podido seguir adelante.
Quiero agradecer a mi equipo, que sin ellos no hubiera podido lograr esta difícil tarea, su entusiasmo,
dedicación y esfuerzo hicieron posible superar todas las adversidades que se nos fueron presentando, ese equipo que
sin temor al fracaso dio individualmente lo mejor de sí, para lograr en conjunto una sinergia multiplicadora, que dio
como resultado un esfuerzo colectivo digno de ser mencionado.
Agradezco a nuestro asesor, el Dr. José De La Cerda Gastélum por su paciencia, su agradable trato, su calidez
como ser humano para atender a nuestras necesidades, y a sus valiosas aportaciones para poder continuar con el
desarrollo de esta materia de simulador, que el día de hoy nos honra con el grado de Maestros en administración.
Quiero dar gracias a Dios por permitirnos seguir adelante con esta misión, por darnos vida para poder concluir
a bien con el desarrollo de este proyecto. Quiero también agradecer a mis padres y a los padres de mis compañeros
por ser ellos los que nos dieron las herramientas básicas para poder estudiar, y por ser ellos los que en su humildad
han dado su vida al servicio de sus hijos, que el día de hoy de la manera más humilde quieren abrir sus brazos para
darles gracias por todo lo que son, aun contando sus defectos, porque sin ellos la vida no sería como lo es ahora, y sin
ellos simplemente no existiríamos.
A todos Gracias de corazón y que Dios los bendiga.
Jorge Sánchez Guzmán
Mariana Lechuga Flores
Sara Georgina López Del Toro
Sinuhe Pardo Hernández
1.1 Definición de la industria de semiconductores ...................................................................................................4
1.2 Participantes de la industria de semiconductores .............................................................................................4
1.3 Comportamiento y pronóstico del mercado de semiconductores.................................................................6
1.4 Industria de semiconductores por región.............................................................................................................8
1.5 Condiciones de la industria de sensores en CAPSIM....................................................................................... 11
1.6 Análisis de las cinco fuerzas de Porter en la industria de semiconductores y CAPSIM....................... 12
1.7 Conclusiones ................................................................................................................................................................ 18
2.1 Introducción................................................................................................................................................................. 21
2.2 Misión estratégica ...................................................................................................................................................... 22
2.3 Visión estratégica ....................................................................................................................................................... 22
2.4 ¿Por qué una estrategia? .......................................................................................................................................... 22
2.5 Clasificaciones de estrategias................................................................................................................................. 23
2.6 Modelo de Captura del Valor................................................................................................................................... 24
2.7 ¿Qué considerar para elegir una estrategia?..................................................................................................... 25
2.8 Estrategias Simulador CAPSIM............................................................................................................................... 28

2.9 Estrategias genéricas comparadas a las estrategias de CAPSIM ................................................................. 29
2.10 Estrategia seleccionada por la empresa Ferris para simulador CAPSIM............................................... 33
2.11 Acciones específicas por área de acuerdo a la estrategia de Diferenciador de Nicho ....................... 34
2.12 Objetivos estratégicos ............................................................................................................................................ 35
2.13 Perfil de la empresa Ferris.................................................................................................................................... 36
2.14 Valores y principios................................................................................................................................................. 37
2.15 Desglose de funciones, estructura y cultura organizacional ..................................................................... 38
2.16 Toma de decisiones ................................................................................................................................................. 42
2.17 Conclusiones.............................................................................................................................................................. 43
ANÁLISIS EJERCICIO 2015............................................................................................................................................... 45
3.1 Introducción................................................................................................................................................................. 46
3.2 Decisiones y resultados 2015................................................................................................................................. 46
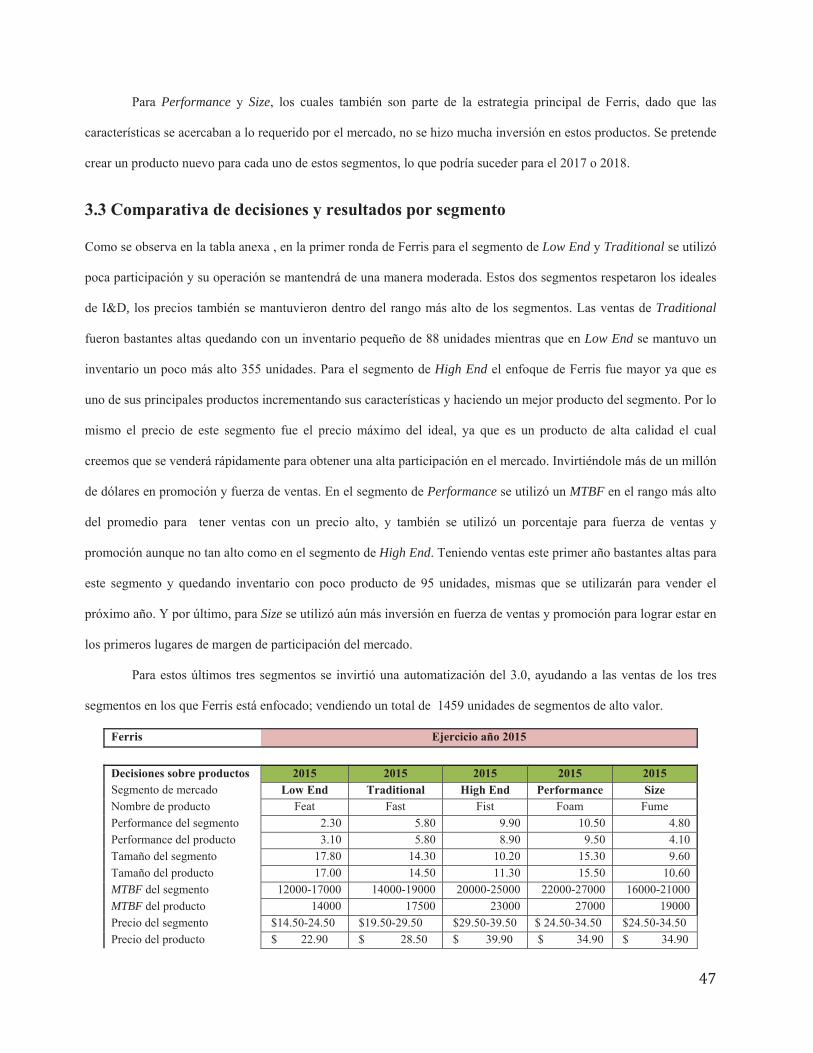
3.3 Comparativa de decisiones y resultados por segmento................................................................................. 47
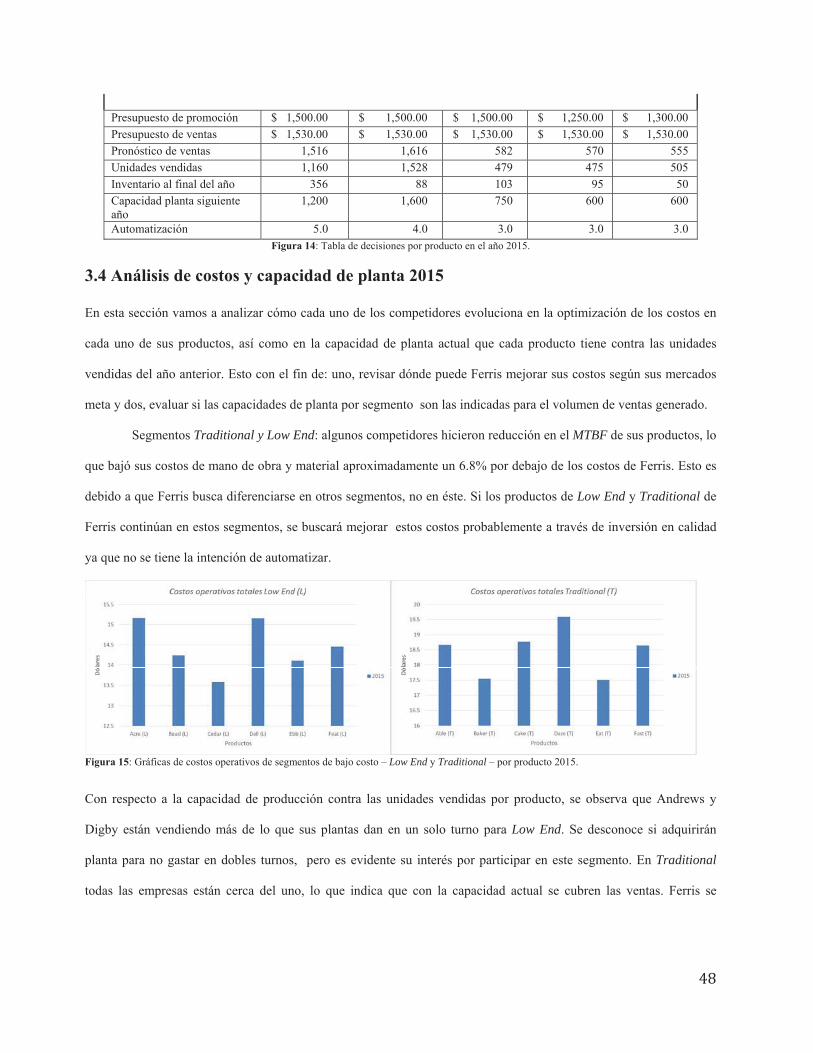
3.4 Análisis de costos y capacidad de planta 2015 ................................................................................................. 48
3.5 Resultados generales 2015 ..................................................................................................................................... 50
3.6 Resultados financieros y mercado de valores 2015........................................................................................ 51
3.7 Objetivos estratégicos Balanced Scorecard ........................................................................................................ 51
3.8 Estrategias de la competencia ................................................................................................................................ 52
3.9 Conclusiones y ajustes estratégicos...................................................................................................................... 53
ANÁLISIS EJERCICIO 2016 2017 ................................................................................................................................... 55
4.1 Introducción................................................................................................................................................................. 56
4.2 Decisiones y resultados 2016 2017 ..................................................................................................................... 56
4.3 Comparativa de decisiones y resultados por segmento................................................................................. 56
4.4 Análisis de costos y capacidad de planta 2016 2017...................................................................................... 57
4.5 Resultados financieros y mercado de valores 2016 2017 ............................................................................ 60
4.6 Objetivos estratégicos Balanced Scorecard 2016 2017 ................................................................................. 61
4.7 Estrategias de la competencia ................................................................................................................................ 62
4.8 Conclusiones y ajustes estratégicos...................................................................................................................... 63
ANÁLISIS EJERCICIO 2018 2019 ................................................................................................................................... 65
5.1 Introducción................................................................................................................................................................. 66
5.4 Análisis de costos y capacidad de planta 2018 2019...................................................................................... 68
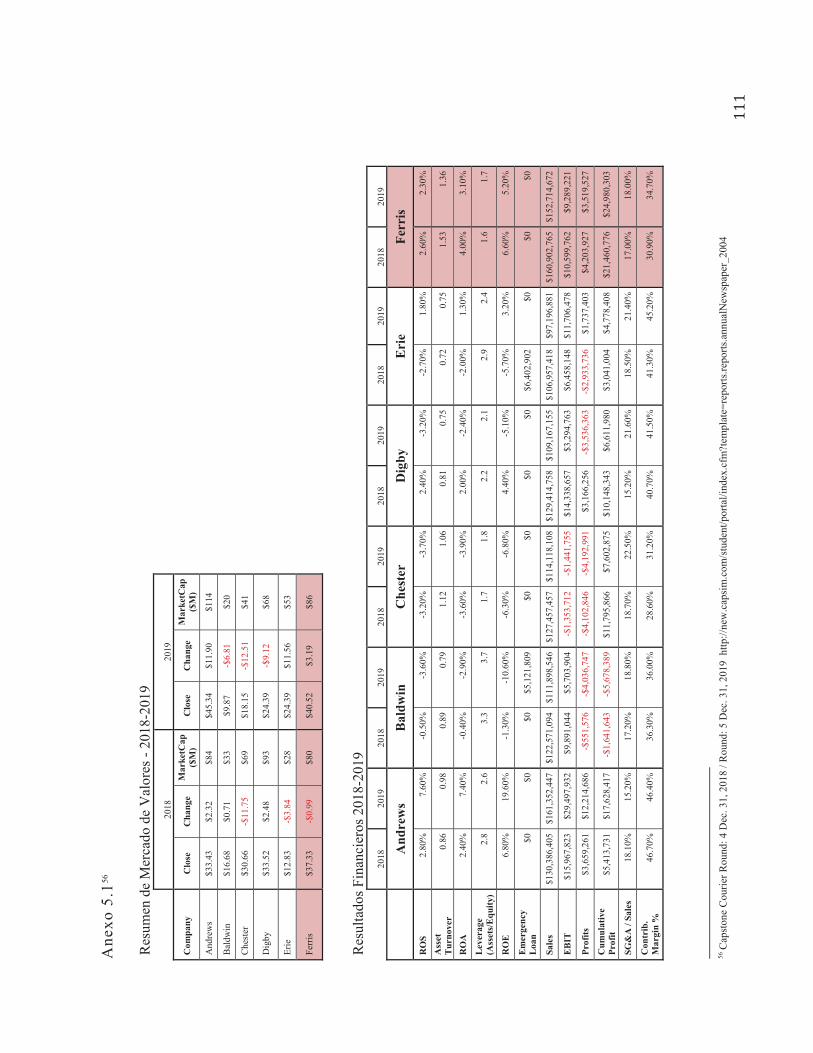
5.5 Resultados financieros y mercado de valores 2018 2019 .......................................................................... 70
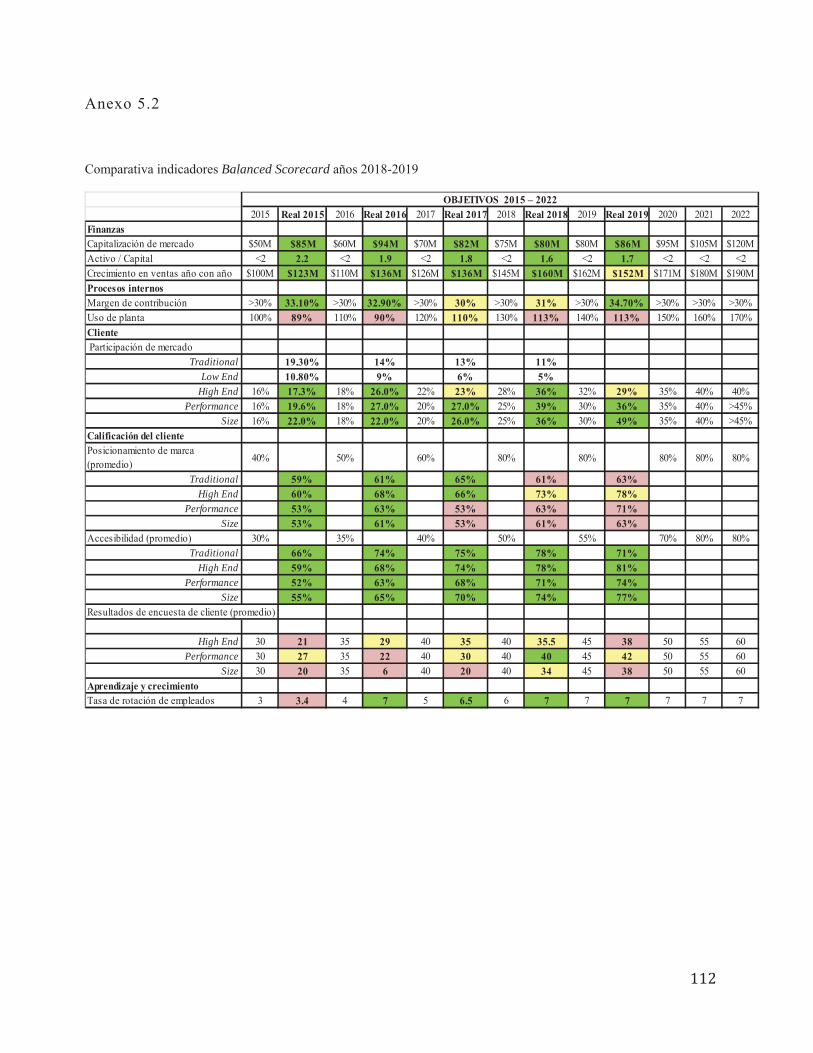
5.6 Objetivos estratégicos Balanced Scorecard 2018 2019 ................................................................................. 72
5.7 Estrategias de la competencia ................................................................................................................................ 73
ANÁLISIS EJERCICIO 2020 2021 ................................................................................................................................... 77
6.1 Introducción................................................................................................................................................................. 78
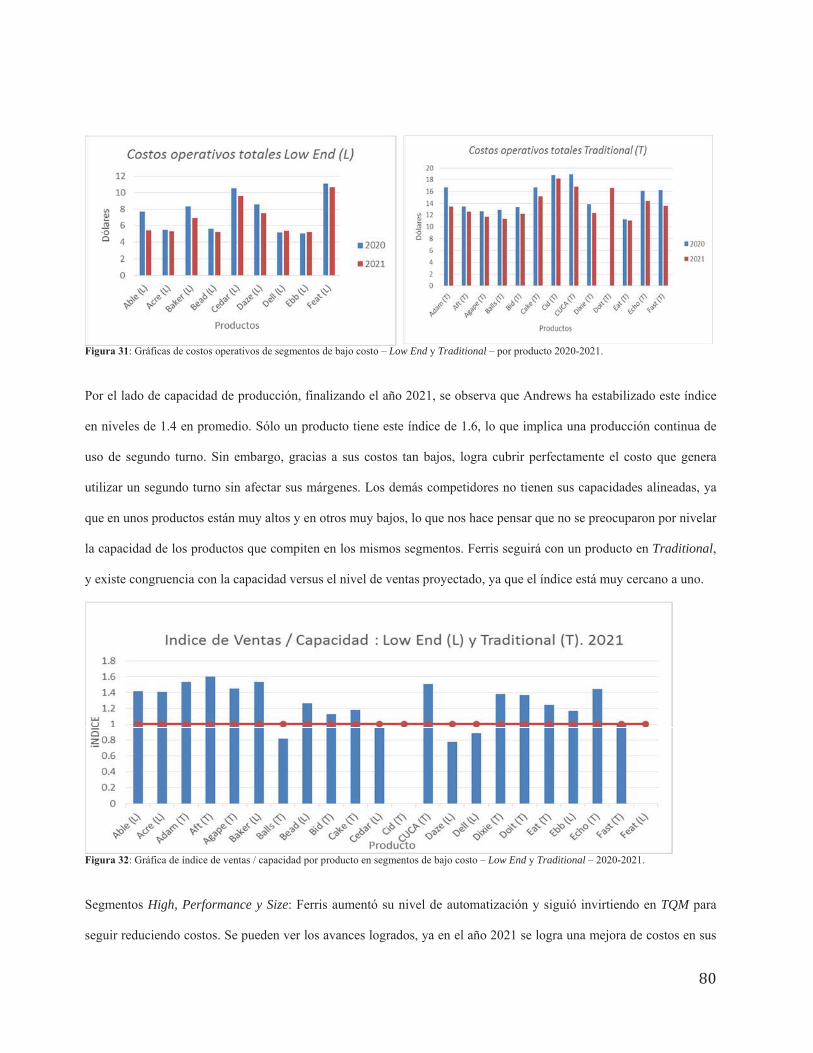
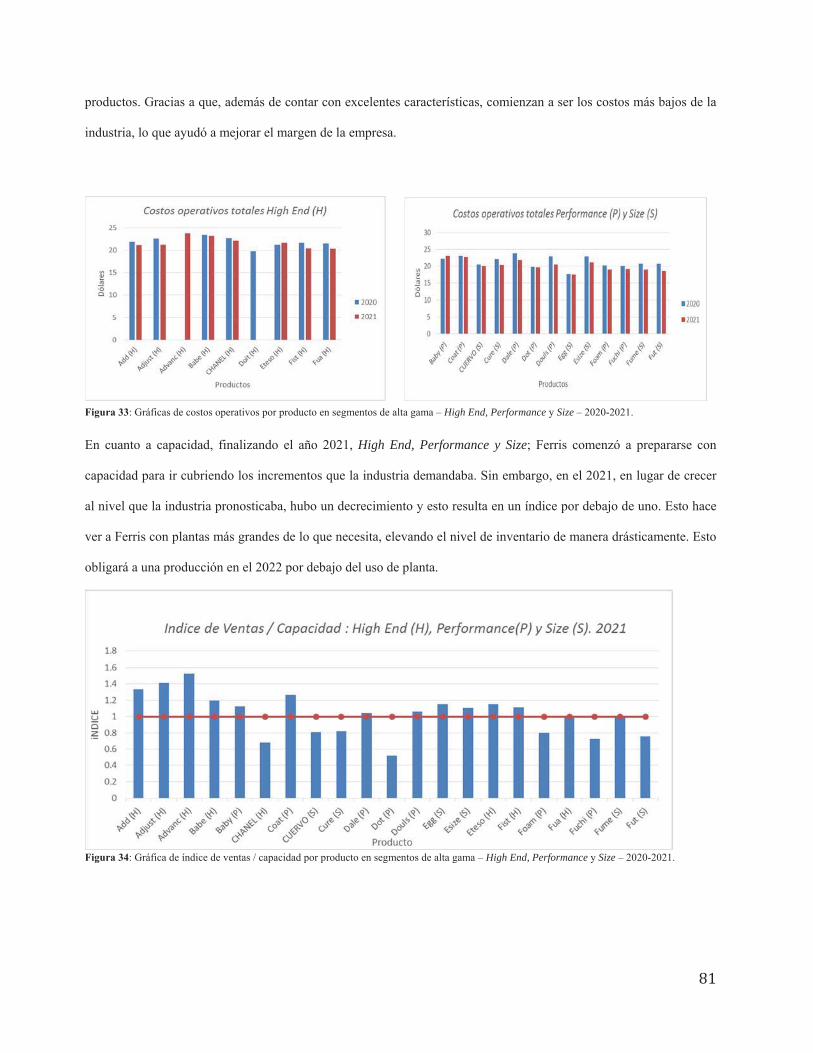
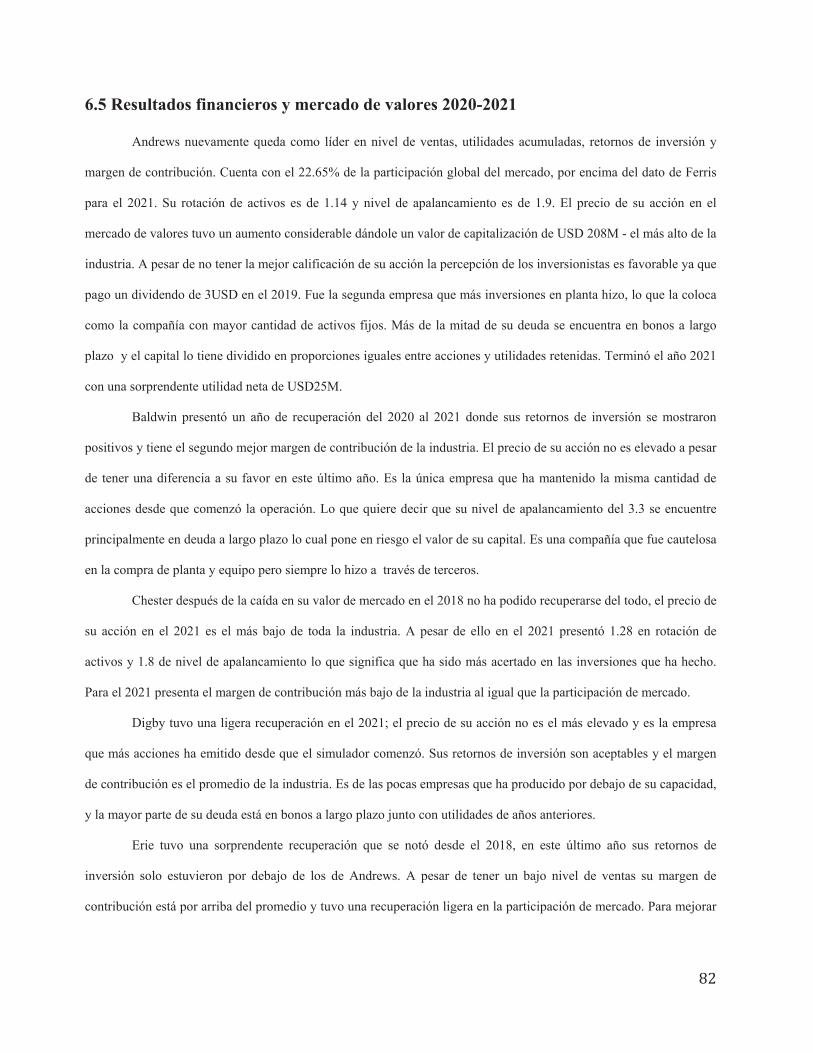
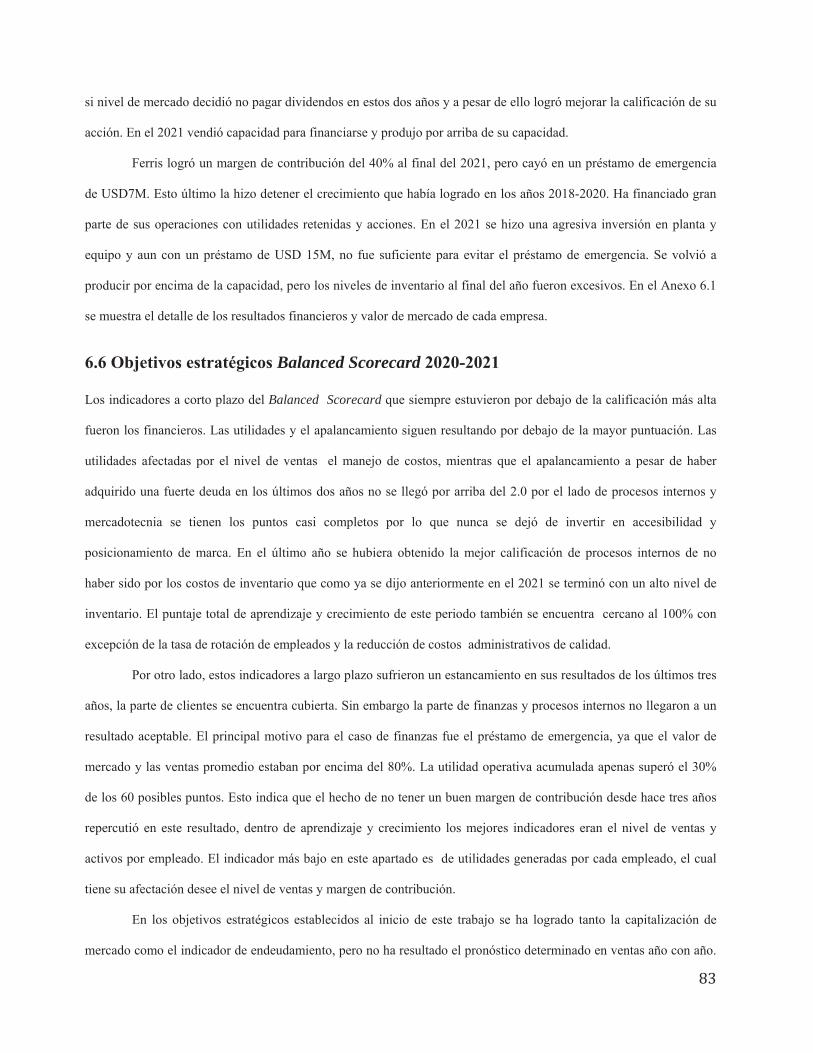
6.4 Análisis de costos y capacidad de planta 2020 2021...................................................................................... 79
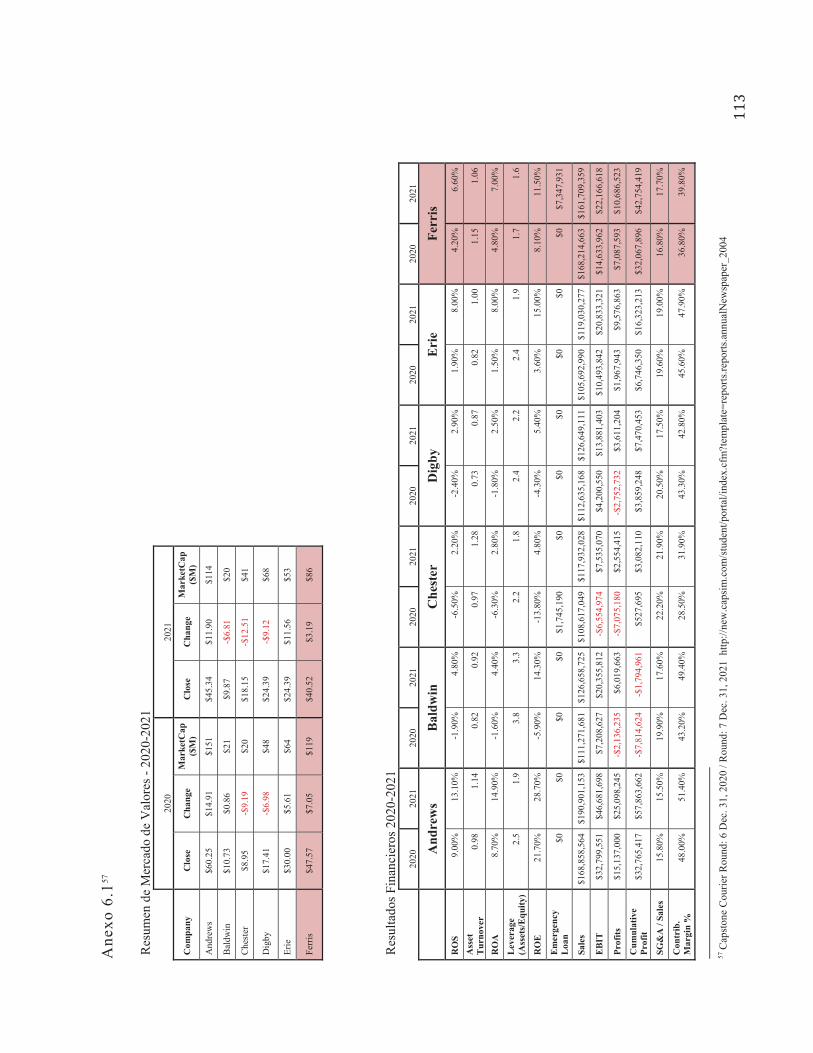
6.5 Resultados financieros y mercado de valores 2020 2021 ............................................................................ 82
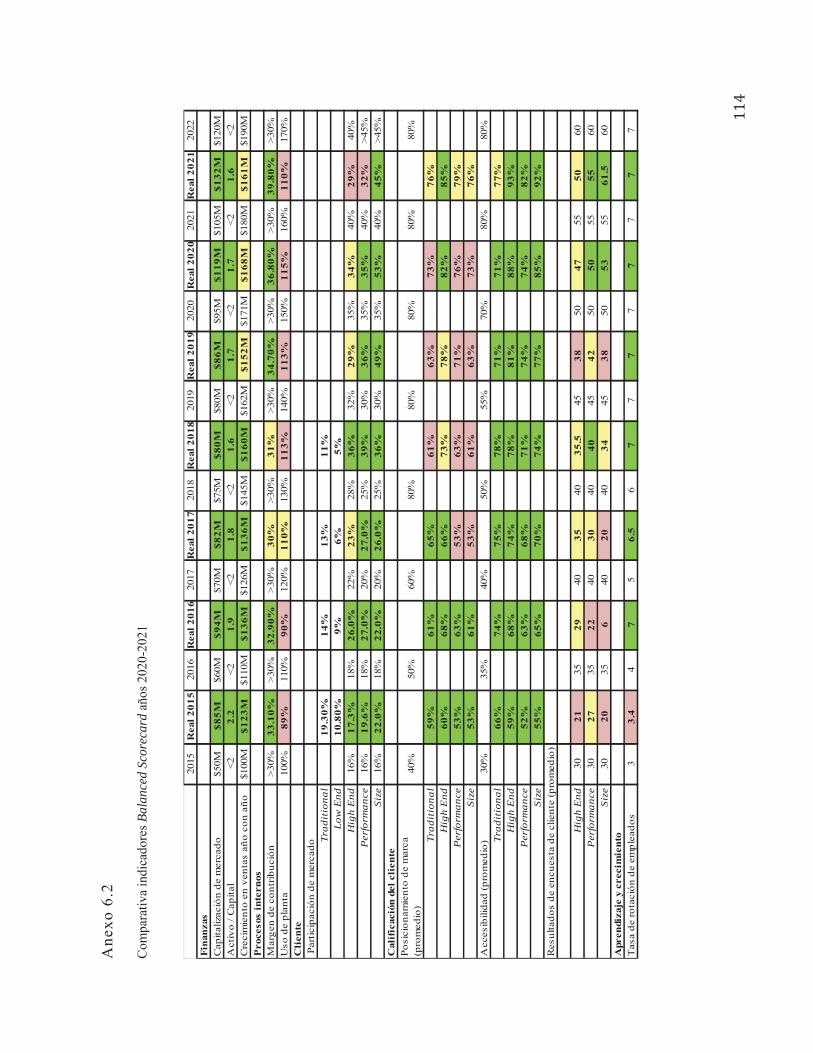
6.6 Objetivos estratégicos Balanced Scorecard 2020 2021 ................................................................................. 83
6.7 Estrategias de la competencia ................................................................................................................................ 84
6.8 Conclusiones y ajustes estratégicos...................................................................................................................... 85
7.1 Introducción................................................................................................................................................................. 88
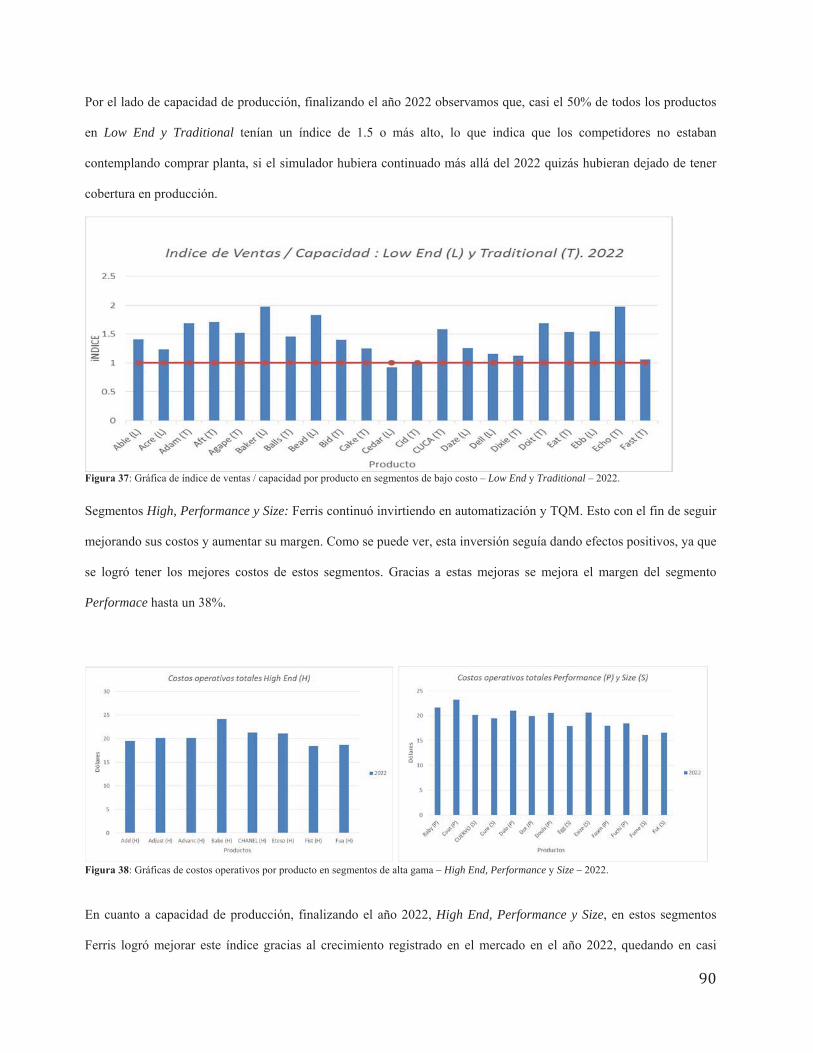
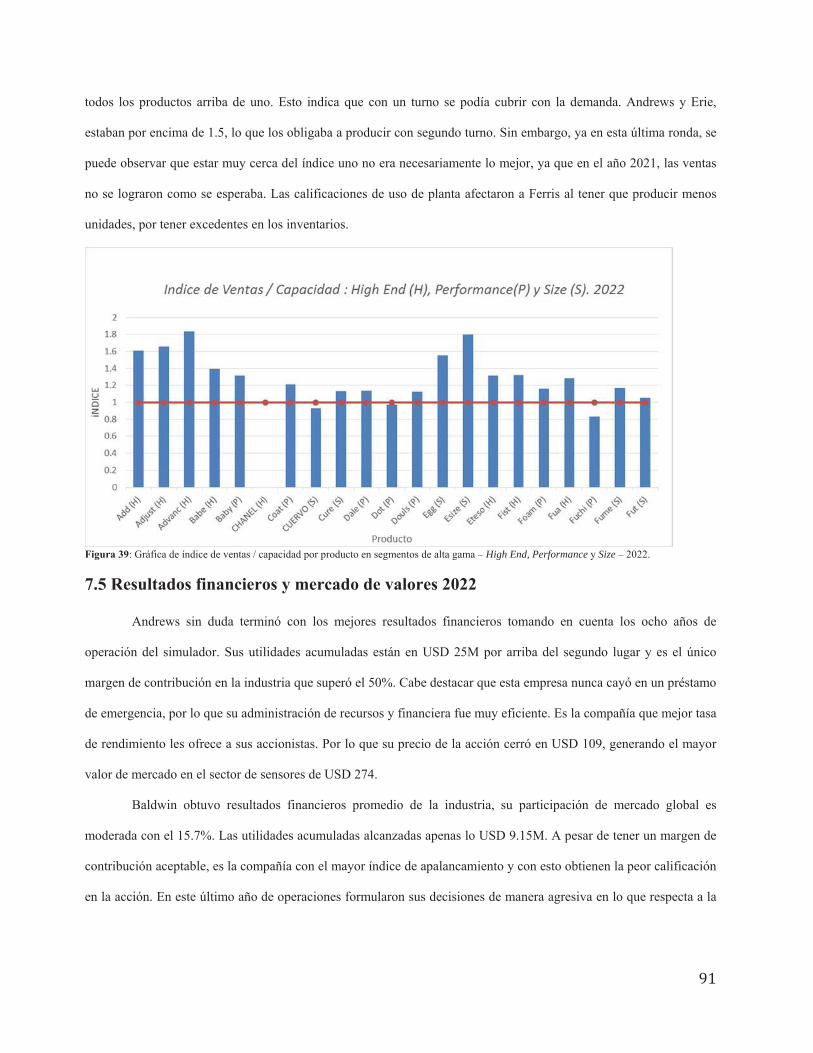
7.4 Análisis de costos y capacidad de planta 2022 ................................................................................................. 89
7.5 Resultados financieros y mercado de valores 2022........................................................................................ 91
7.6 Objetivos estratégicos Balanced Scorecard 2022............................................................................................. 92
7.7 Estrategias de la competencia ................................................................................................................................ 93
7.8 Conclusiones y ajustes estratégicos...................................................................................................................... 94
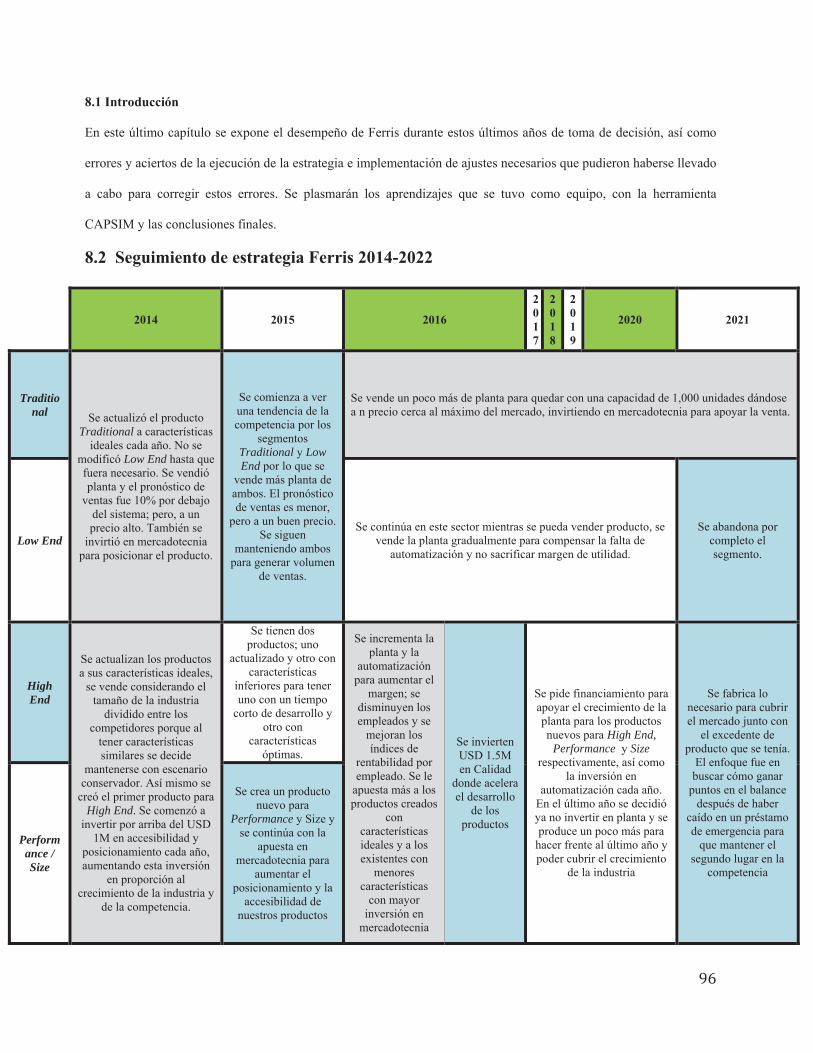
................................................................................................................................................................... 96
8.4 Toma de decisiones.................................................................................................................................................... 97
8.5 Aprendizajes ................................................................................................................................................................ 98
8.6 Conclusiones ................................................................................................................................................................ 98
8.7 Conclusiones generales ............................................................................................................................................ 99
Traditional, Low End, High End, Performance Size.
estregia


NAICS North American Industry Classification System,
North American Industry Classification System
Barnes Report Semi-conductor & Electronic Components Mfg. (NAICS 33441)
McKinsey on Semiconductors Number 3
Ibid
foundries
fabless
Electronic Components & Computers. U.S. Industry ReportSemiconductors
McKinsey on Semiconductors Number 3
Ibid
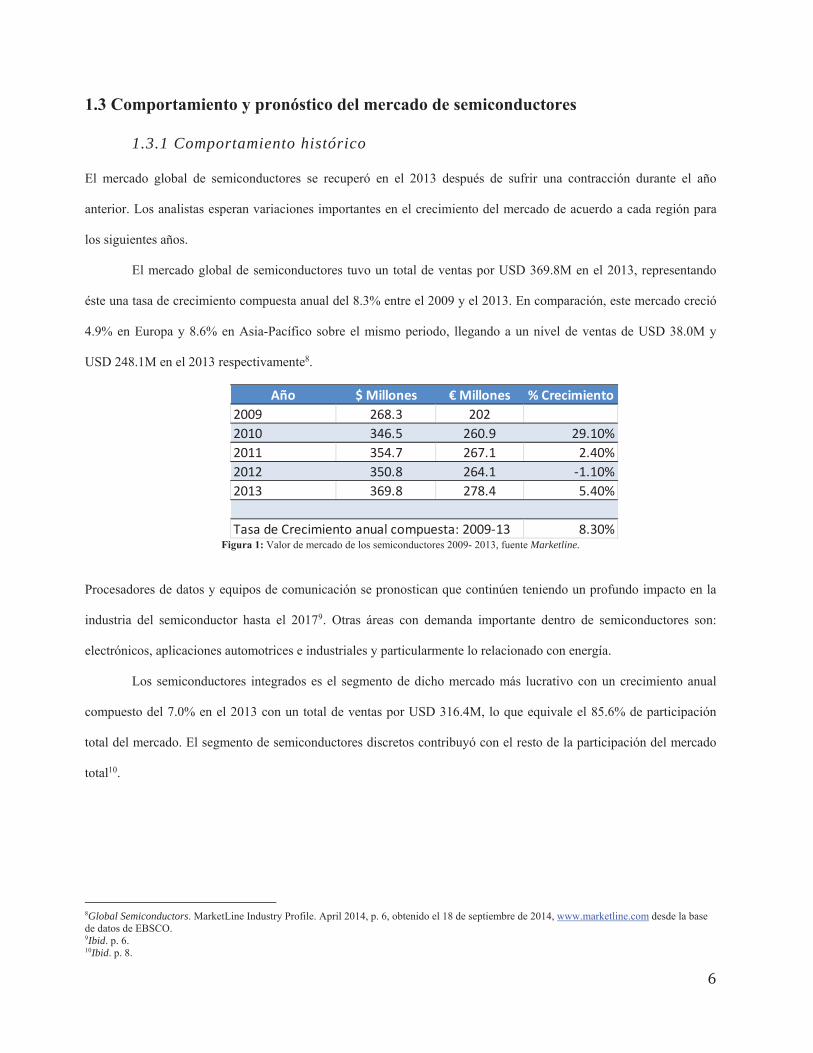
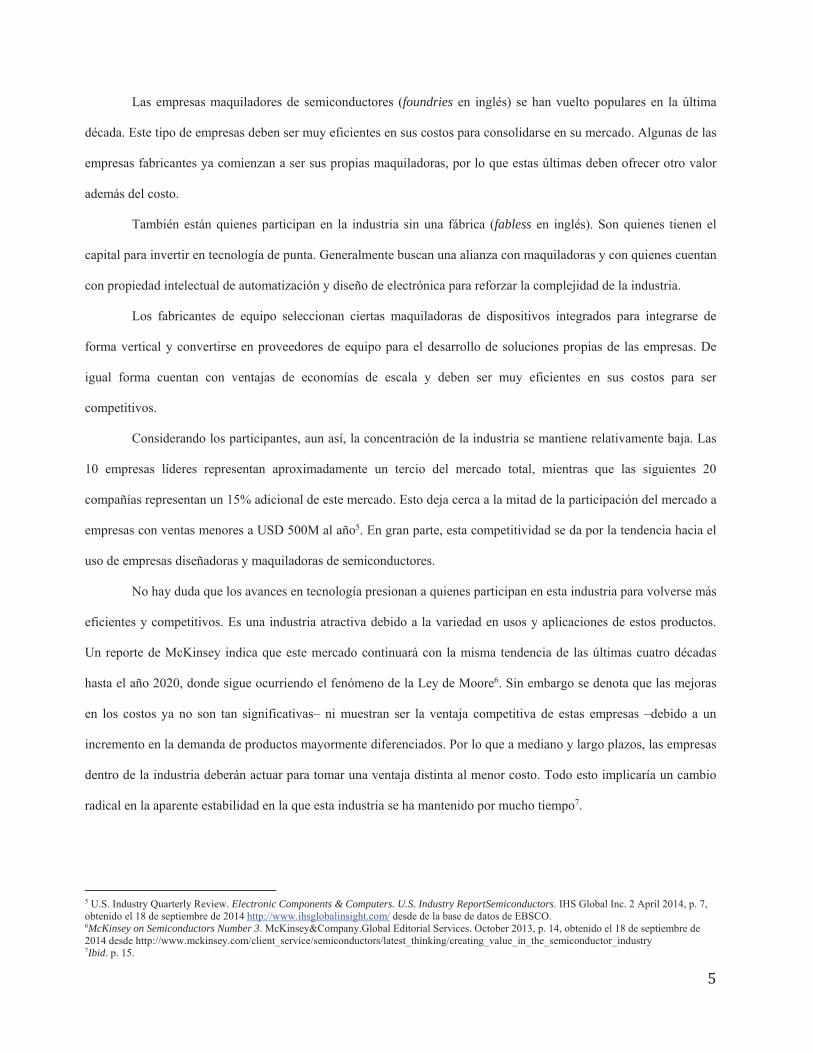
1.3.1 Comportamiento histórico
Marketline.
Global Semiconductors
IbidIbid
Año $ Millones € Millones % Crecimiento2009 268.3 2022010 346.5 260.9 29.10%2011 354.7 267.1 2.40%2012 350.8 264.1 1.10%2013 369.8 278.4 5.40%
Tasa de Crecimiento anual compuesta: 2009 13 8.30%
Marketline.
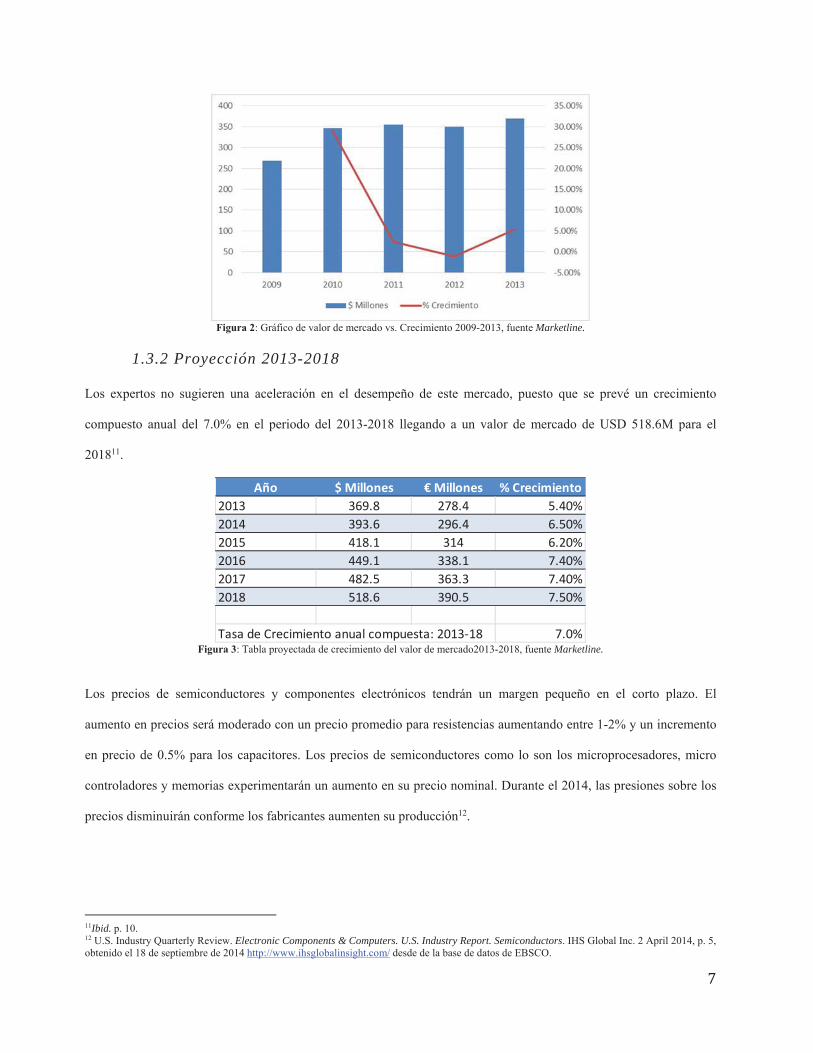
1.3.2 Proyección 2013-2018
Marketline.
Ibid.Electronic Components & Computers. U.S. Industry Report. Semiconductors
Año $ Millones € Millones % Crecimiento2013 369.8 278.4 5.40%2014 393.6 296.4 6.50%2015 418.1 314 6.20%2016 449.1 338.1 7.40%2017 482.5 363.3 7.40%2018 518.6 390.5 7.50%
Tasa de Crecimiento anual compuesta: 2013 18 7.0%
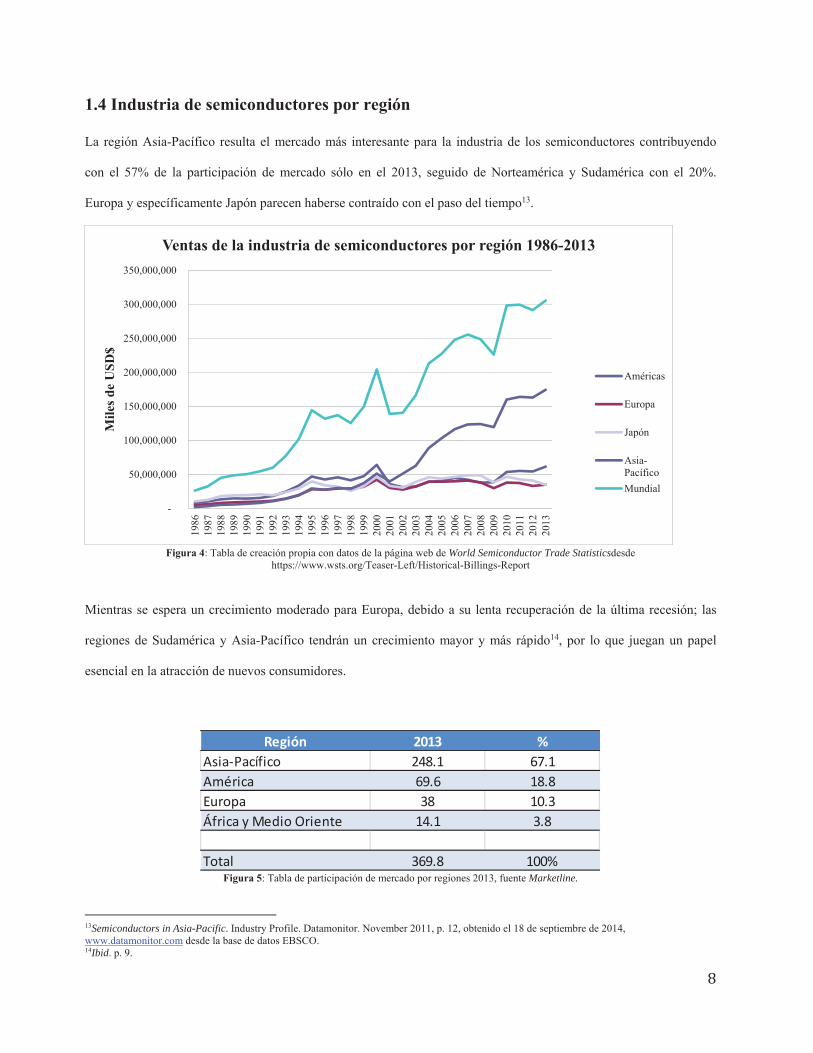
World Semiconductor Trade Statistics
Marketline.
Semiconductors in Asia-Pacific
Ibid
Región 2013 %Asia Pacífico 248.1 67.1América 69.6 18.8Europa 38 10.3África y Medio Oriente 14.1 3.8
Total 369.8 100%
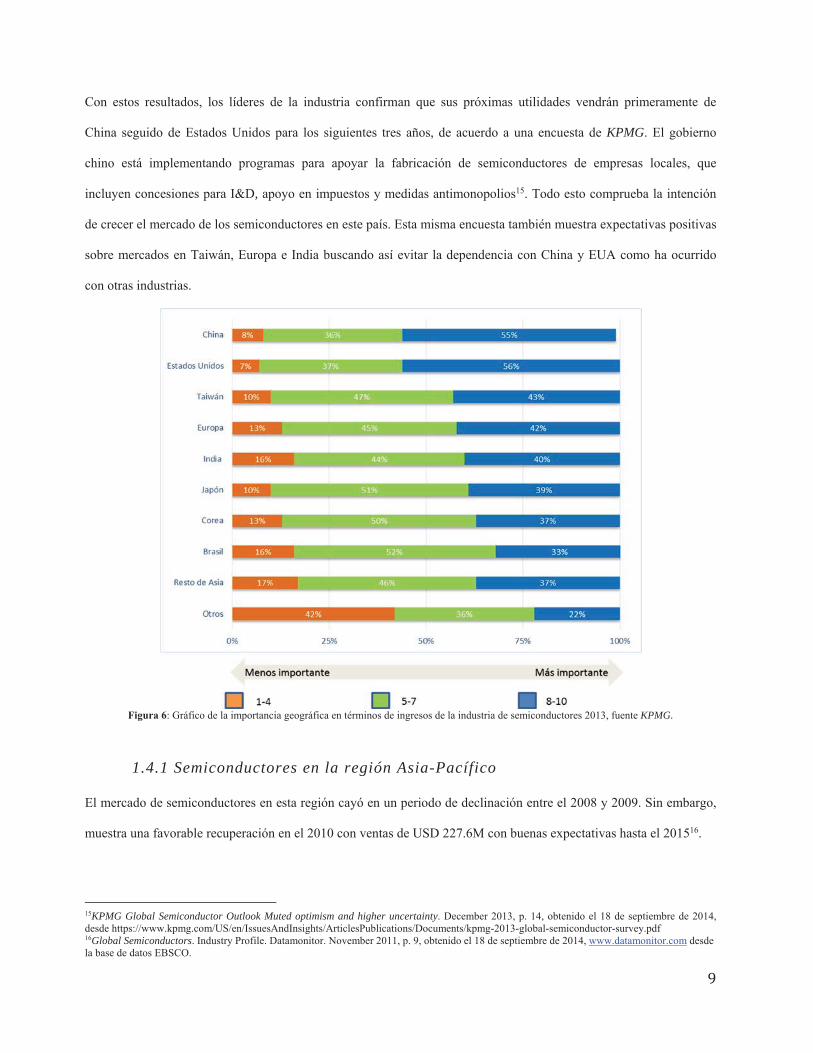
KPMG
,
KPMG.
1.4.1 Semiconductores en la región Asia-Pacífico
KPMG Global Semiconductor Outlook Muted optimism and higher uncertainty
Global Semiconductors

1.4.2 Semiconductores en la región Europea
Semiconductors in Asia-Pacific
Global Semiconductors
Semiconductors in Asia-Pacific
Semiconductors in Europe
Ibid.Ibid.

Industry Conditions
Report
Traditional Low End High End Performance Size.
MTBF Mean Time Between Failures
Capstone Courier
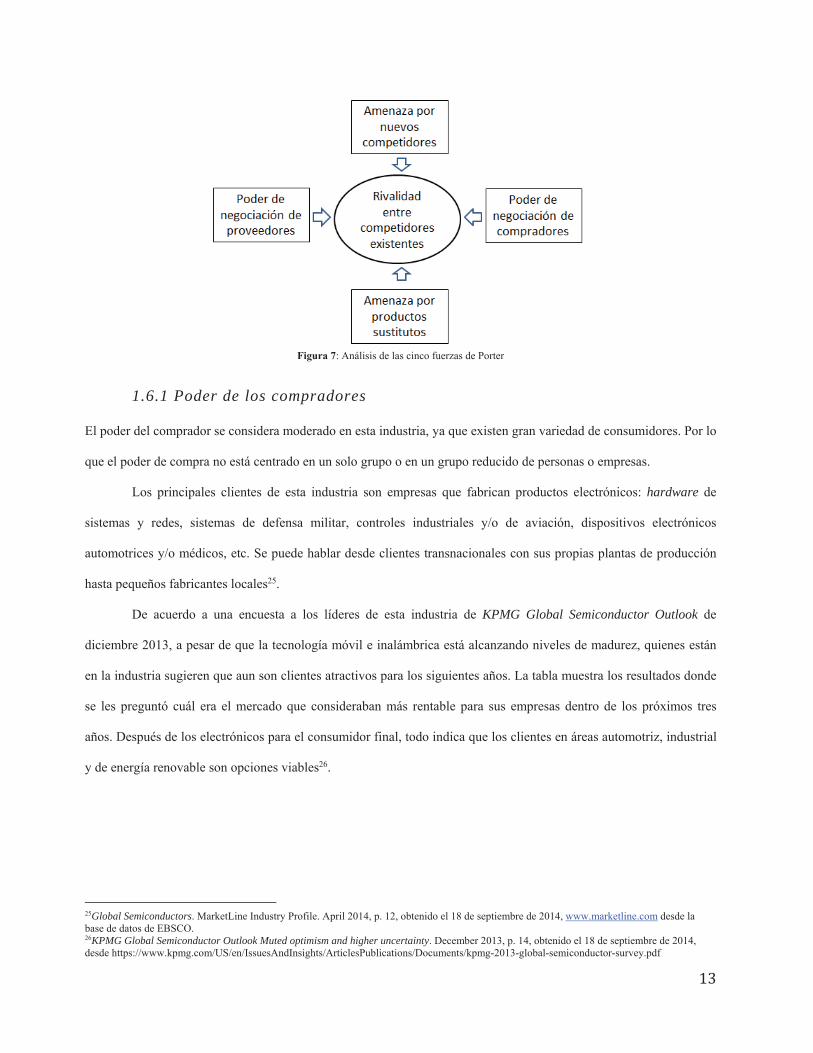
The Five Forces That Shape StrategyZach Investment Research
1.6.1 Poder de los compradores
hardware
KPMG Global Semiconductor Outlook
Global Semiconductors
KPMG Global Semiconductor Outlook Muted optimism and higher uncertainty

Low End Traditional
Performance, Size High End
Semiconductor Stock Outlook – Feb 2014 – Industry Outlook

ad hoc
1.6.2 Poder de los proveedores
foundry
1.6.3 Amenaza de nuevos competidores
Global Semiconductors
Ibid

KPMG
KPMG.
fabless fabless
IbidKPMG Global Semiconductor Outlook Muted optimism and higher uncertainty
McKinsey on Semiconductors Number 3.
1.6.4 Rivalidad entre competidores existentes
Global Semiconductors
IbidIbid

1.6.5 Amenaza de productos sustitutos
Global Semiconductors
McKinsey on Semiconductors Number 3


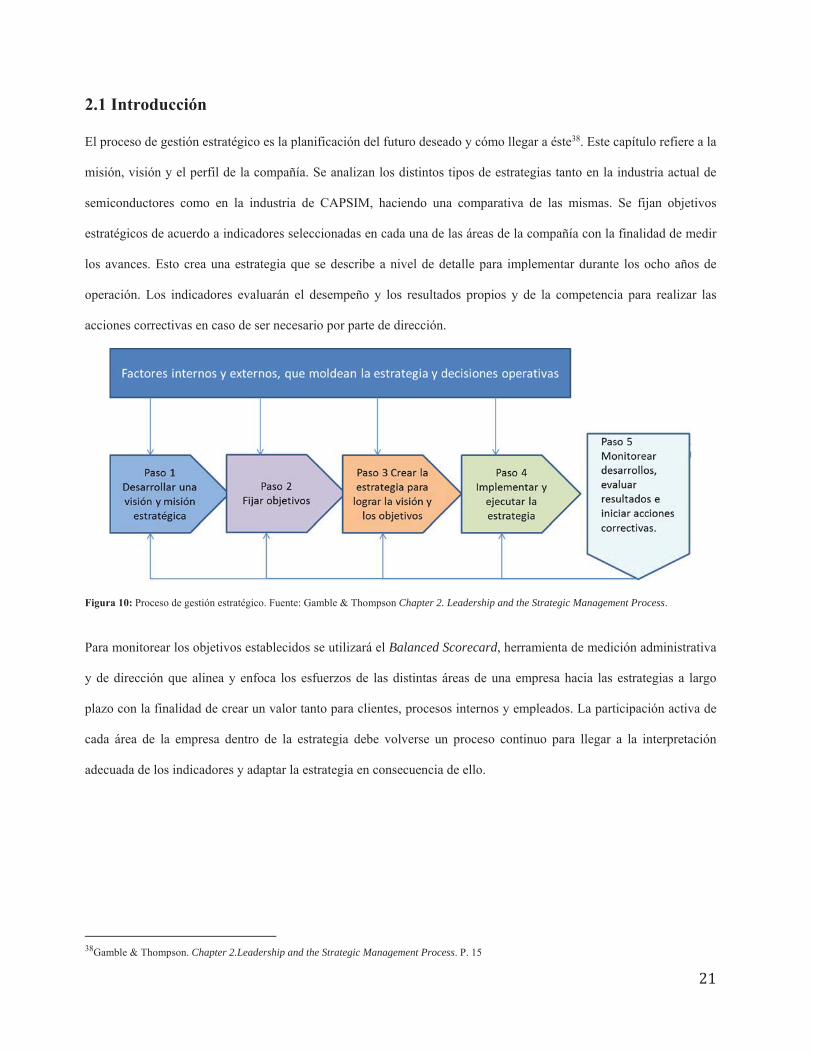
Chapter 2. Leadership and the Strategic Management Process
Balanced Scorecard
Chapter 2.Leadership and the Strategic Management Process

Chapter 2.Leadership and the Strategic Management ProcessIbid.
benchmarking
What is Strategy?IbidIbid
VCM
Value-Based Business Strategy
VCM
VCM
IbidIbid
IbidIbidIbid
VCM
gap
VCM
IbidIbid

How Industries
Change
2.7.1 Tipos de cambio en las industrias
Cambio radical
Cambio intermedio

Cambio creativo
Cambio progresivo
status quo
marketing
2.8.1 Líder en costos amplio Broad Cost Leader
2.8.2 Diferenciador amplio (Broad differentiator)
premium
2.8.3 Líder en costos de nicho Low Technology Traditional
Low End
Team Member Guide

2.8.4 Diferenciador en nicho High Technology High
End, Performance Size
premium
2.8.5 Líder en costos con enfoque en el ciclo de vida de producto Cost Leader with Product
Lifecyle Fo High End, Traditional Low End
High End High End, Traditional
Low End.
2.8.6 Diferenciador con enfoque en el ciclo de vida de producto Differentiator with Product
Lifecyle Focus High End, Traditional Low End
premium
The Five Generic Strategies
2.9.1 Estrategia del bajo costo
2.9.2 Estrategias de diferenciación amplia
Chapter 5.The Five Generic Strategies

2.9.3 Estrategia de nicho de bajo costo

2.9.4 Estrategia de nicho de diferenciación
2.9.5 Estrategia del mejor costo
– High Technology –
High End Performance Size
Traditional Low End
Low End Traditional
High End
High End
Low End
Traditional
Performance Size

Traditional Low End
High End Performance Size
Marketing
marketing

High End Performance
Size
High EndPerformance
Size
de Balanced Scorecard
Pasión por los clientes
Trabajo en equipo
Respeto
Responsabilidad
Cultura de calidad
Cultura de resultados

2.15.1 Estructura organizacional
2.15.2 Despliegue de funciones
High End Performance Size
Marketing
Marketing marketing
Marketing

marketing
marketing


marketing
marketing

marketing
High End, Performance Size.

Balanced
Scorecard
Capstone Courier


Balanced Scorecard
Traditional Low End
Balanced
Scorecard
High End
High End
Performance Size
Low End Traditional
, Traditional
Low End
High End
Performance MTBF
High End
Size
MTBFMTBF
Traditional y Low End MTBF
Low End Traditional
Low End Traditional
Low End
Traditional
Low End Traditional
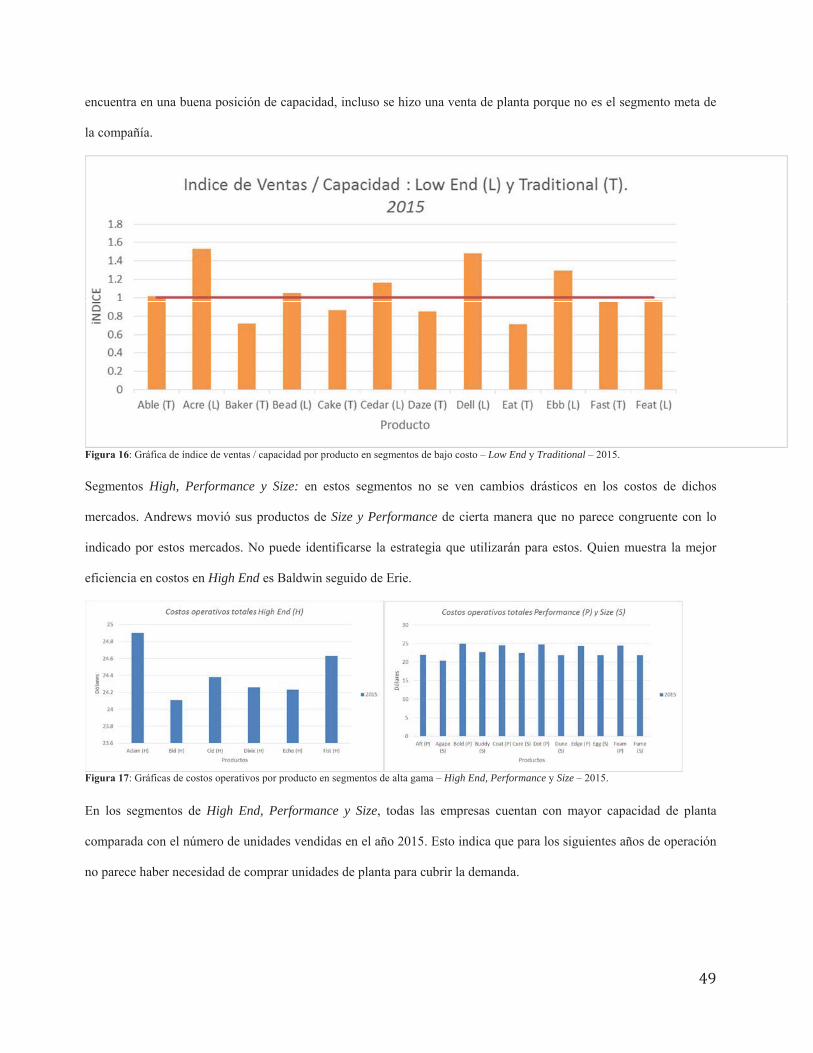
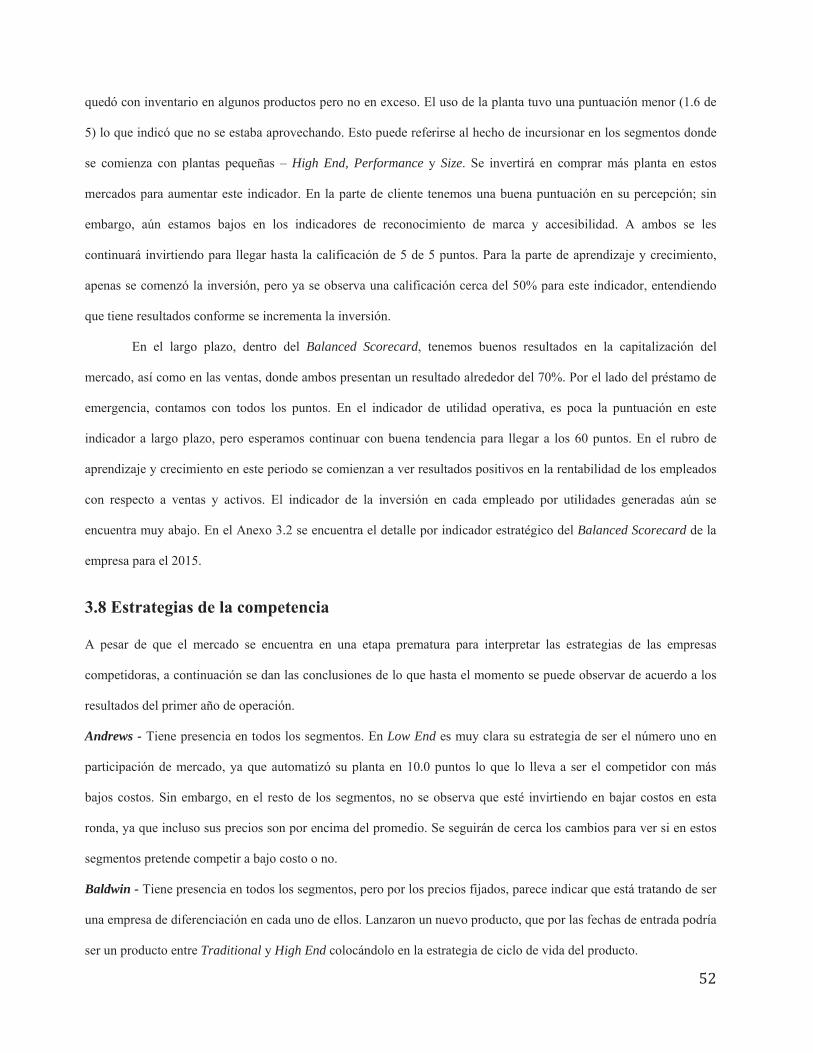
High, Performance y Size:
Size y Performance
High End
High End, Performance Size
High End, Performance y Size

High End, Performance Size
Traditional
Low End
High End
Performance,

Size,
Balanced Scorecard
Balanced Scorecard
Balanced Scorecard
High End, Performance Size
Balanced Scorecard
Balanced Scorecard
Andrews - Low End
Baldwin -
Traditional High End

Chester - Low End Traditional
Tradicional
High End Size Performance
Digby - Low End
Performance Low End
Size
Erie - Low End
Traditional High End Performance Size
Traditional Low End
Traditional

Size Performance

Traditional Low End
High End
High End
Performance Size
Low End
Traditional

High End
High End
Size
Traditional y Low End
Low End
Low End
Traditional,

Low End Traditional
Traditional
Low End Traditional
High, Performance y Size:
High End, Performance Size
High End, Performance y Size
High End
High End, Performance Size


Balanced Scorecard
Balanced Scorecard
Balanced Scorecard
Balanced Scorecard
Andrews- Traditional y Low End
High End,
High End
Baldwin- Low
End y Traditional High End
Low End
Performance y Size.
High End
Chester-
Traditional High End Traditional
Traditional y Low End
High End.
Digby-
Traditional y Low End
High End Performance,
Size
I&D Performance
High End
Traditional
Erie-
Low End Traditional
High End
Size,
.
Balanced Scorecard
High End, Performance y Size

Traditional Low End
High End Low End


Performance
Size. High End
Performance Size
Performance
Low End Tradiitonal High End.
Traditional
Low End Traditional
Low End
MTBF
Traditional
MTBF

Low End
High End
MTBF High End
High End
Performance High End
Size MTBF
Performance

Traditional y Low End
Low End
Low End
Traditional,
Low End
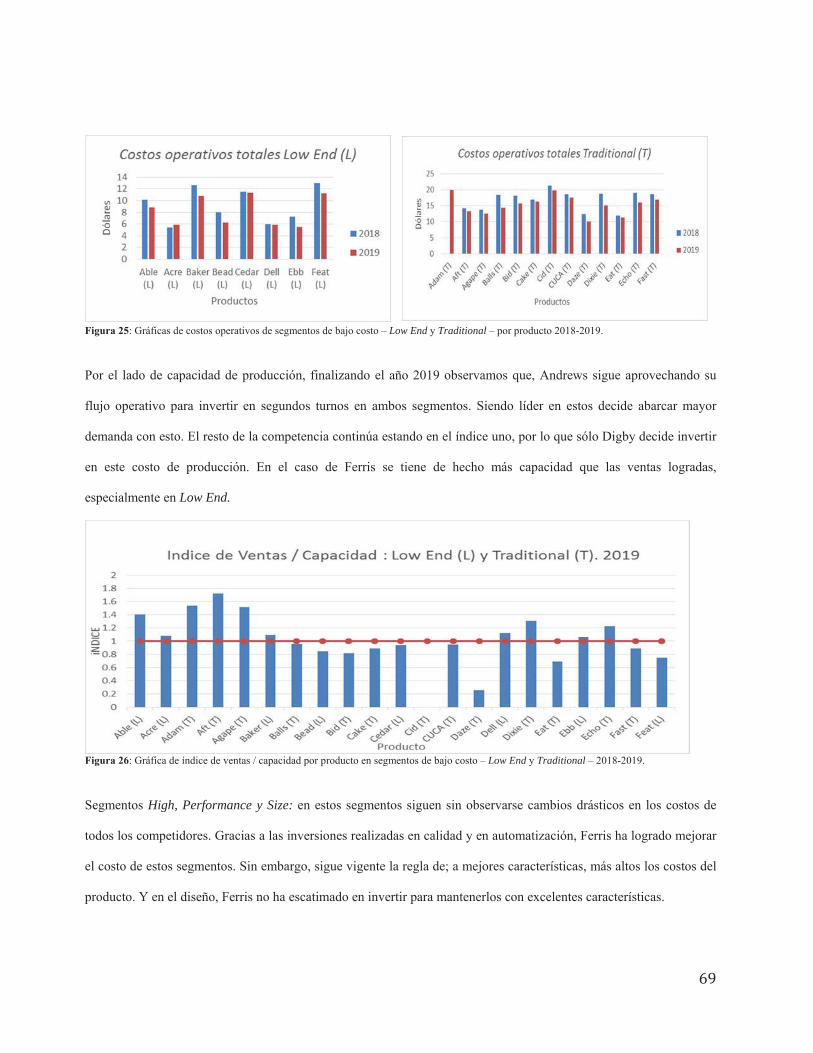
Low End Traditional
Low End.
Low End Traditional
High, Performance y Size:

High End, Performance Size
High End, Performance y Size
Size
High End, Performance Size
High End,
Low End y Traditional
Traditional Low End
Traditional Low End
Low End
High End
Low End y Traditional
Low End
Traditional y Performance
Size Traditional y Performance High
End y Performance I&D
Performance
Size Performance
I&D
Balanced Scorecard
Balance Scorecard de Ferris

Andrews- Low End y Traditional
Adam
Traditional Traditional
,
High End
Adjust
Performance Size
Baldwin-
Low End y Traditional
Low End Low End
Size y Performance
Chester-
Traditional
Traditional, Low End y High End Performance y Size
I&D Performance y Size
Digby-
Size
Traditional Low End,
High End, y Performance
Traditional
Performance
Erie-
Performance Traditional
Performance
High End Size
Low End
Performance y
Size. Traditional
High End
Traditional

Performance,
Performance Size

Traditional
Low End High End Performance Size.
Low End
Traditional
Traditional MTBF
High End

MTBF
High End
Performance
Size
Traditional y Low End Low End
Traditional,
Low End Traditional
Traditional
Low End Traditional
High, Performance y Size TQM
High End, Performance Size
High End, Performance y Size
High End, Performance Size
Balanced Scorecard
Balanced Scorecard
High End Performance Size
Performance Size
Andrews-
High End, Traditional y Low End.
en Low End y Traditional
High End
Low End
Traditional r
Baldwin- Low End
Performanc
Chester- Size Low End

Digby- Traditional y Low End
Traditional
Low End
Performance
Erie- High
End Size
Traditional y Low End
Low End.
benchmarking


Size Performance
High End Performance
High End Size
Low End
Traditional s
High End
Performance

Size
Traditional y Low End Low End
Traditional
Low End Traditional
Low End y Traditional
Low End Traditional
High, Performance y Size:
Performace
High End, Performance Size
High End, Performance y Size
High End, Performance Size

Traditional
Traditional
Performance
Traditional Size
Balanced Scorecard
Balanced Scorecard
Balanced Scorecard
High End y Performance
Balanced Scorecard
Traditional y Performance
Traditional y Size
Balanced Scorecard
Size Performance

Traditional
Traditional
Low End Traditional LowEnd
Low End
HighEnd
High End
High End, Performance Size
Performance / Size
Performance
Courier
Balance Scorecard

Traditional
Low End Size
Low End
High End Performance
Low End
Traditional

High End Performance Size
Traditional
Low End
Low End
High End
Size Performance

Low End, Balanced Scorecard
Performance
y Size
Traditional
Perfomance y Size
Low End,
Balanced Scorecard

Traditional
Low End
High End

Performance
Size


Balanced Scorecard
TraditionalLow End
High EndPerformance
Size
TraditionalHigh End
PerformanceSize
TraditionalHigh End
PerformanceSize
High EndPerformance
Size


Balanced Scorecard
Traditional
Low End
High End
Performance
Size
Traditional
High End
Performance
Size
Traditional
High End
Performance
Size
High End
Performance
Size
Balanced Scorecard
TraditionalLow End
High EndPerformance
Size
TraditionalHigh End
PerformanceSize
TraditionalHigh End
PerformanceSize
High EndPerformance
Size
Bala
nced
Sco
reca
rd
Trad
itio
nal
Low
End
Hig
h E
ndP
erfo
rman
ceSi
ze
Trad
itio
nal
Hig
h E
ndP
erfo
rman
ceSi
ze
Trad
itio
nal
Hig
h E
ndP
erfo
rman
ceSi
ze
Hig
h E
ndP
erfo
rman
ceSi
ze


Bala
nced
Sco
reca
rd
Trad
ition
alLo
w E
ndH
igh
End
Perfo
rman
ceSi
ze
Trad
ition
alH
igh
End
Perfo
rman
ceSi
ze
Trad
ition
alH
igh
End
Perfo
rman
ceSi
ze
Hig
h En
dPe
rform
ance
Size
Barnes Report Semi-conductor & Electronic Components Mfg. (NAICS 33441)
Capstone Courier
Chapter 5. The Five Generic Strategies
Chapter 2. Leadership and the Strategic Management Process
Global Semiconductors en Industry Profile
Global Semiconductors
KPMG Global Semiconductor Outlook Muted optimism and higher uncertainty
Harvard Business Review
McKinsey on Semiconductors Number 3
The Semiconductor Industry Is Changing Rapidly
The New Dynamics of Competition
Semiconductors in Asia-Pacific
Semiconductors in Europe
Semiconductor Stock Outlook – Feb 2014 – Industry Outlook
What is Strategy?
Team Member Guide
U.S. Industry Quarterly Review. Electronic Components & Computers
Marketline.Marketline.
Marketline.World Semiconductor Trade Statistics
Marketline.KPMG.
KPMG.Chapter 2. Leadership and the Strategic Management Process
de Balanced Scorecard
Low End TraditionalLow End Traditional
High End, Performance SizeHigh End, Performance Size
Low End TraditionalLow End Traditional
High End, Performance SizeHigh End, Performance Size
Low End TraditionalLow End Traditional
High End, Performance SizeHigh End, Performance Size
Low End TraditionalLow End Traditional
High End, Performance SizeHigh End, Performance Size
Low End TraditionalLow End Traditional
High End, Performance SizeHigh End, Performance Size