Esnd sept 2016 ir presentation
19
Investor Presentation September 2016
-
Upload
irresponse -
Category
Investor Relations
-
view
710 -
download
0
Transcript of Esnd sept 2016 ir presentation

Investor PresentationSeptember 2016

Forward-Looking Statements
This presentation contains forward-looking statements, including references to goals, plans, strategies, objectives, projected costs or savings, anticipatedfuture performance, results or events and other statements that are not strictly historical in nature. These statements are based on management’s currentexpectations, forecasts and assumptions. This means they involve a number of risks and uncertainties that could cause actual results to differ materiallyfrom those expressed or implied here. These risks and uncertainties include, but are not limited to the following: Essendant's reliance on key customers,and the risks inherent in continuing or increased customer concentration and consolidations; end-user demand for products in the office, technology, andfurniture product categories may continue to decline; the impact of Essendant's repositioning activities on Essendant's customers, suppliers, andoperations; Essendant's reliance on independent resellers for a significant percentage of its net sales and, therefore, the importance of the continuedindependence, viability and success of these resellers; prevailing economic conditions and changes affecting the business products industry and thegeneral economy; Essendant's ability to maintain its existing information technology systems and to successfully procure, develop and implement newsystems and services without business disruption or other unanticipated difficulties or costs; the impact of price transparency, customer consolidation,and changes in product sales mix on Essendant's margins; the impact on the company’s reputation and relationships of a breach of the company’sinformation technology systems; the risks and expense associated with Essendant's obligations to maintain the security of private information provided byEssendant's customers; Essendant's reliance on supplier allowances and promotional incentives; the creditworthiness of Essendant's customers;continuing or increasing competitive activity and pricing pressures within existing or expanded product categories, including competition from productmanufacturers who sell directly to Essendant's customers; the impact of supply chain disruptions or changes in key suppliers’ distribution strategies;Essendant's ability to manage inventory in order to maximize sales and supplier allowances while minimizing excess and obsolete inventory; Essendant'ssuccess in effectively identifying, consummating and integrating acquisitions; the costs and risks related to compliance with laws, regulations and industrystandards affecting Essendant's business; the availability of financing sources to meet Essendant's business needs; Essendant's reliance on keymanagement personnel, both in day-to-day operations and in execution of new business initiatives; and the effects of hurricanes, acts of terrorism andother natural or man-made disruptions.
Shareholders, potential investors and other readers are urged to consider these risks and uncertainties in evaluating forward-looking statements and arecautioned not to place undue reliance on the forward-looking statements. For additional information about risks and uncertainties that could materiallyaffect Essendant's results, please see the company’s Securities and Exchange Commission filings. The forward-looking information in this presentationis made as of this date only, and the company does not undertake to update any forward-looking statement. Investors are advised to consult any furtherdisclosure by Essendant regarding the matters discussed in this presentation in its filings with the Securities and Exchange Commission and in otherwritten statements it makes from time to time. It is not possible to anticipate or foresee all risks and uncertainties, and investors should not consider anylist of risks and uncertainties to be exhaustive or complete.
2
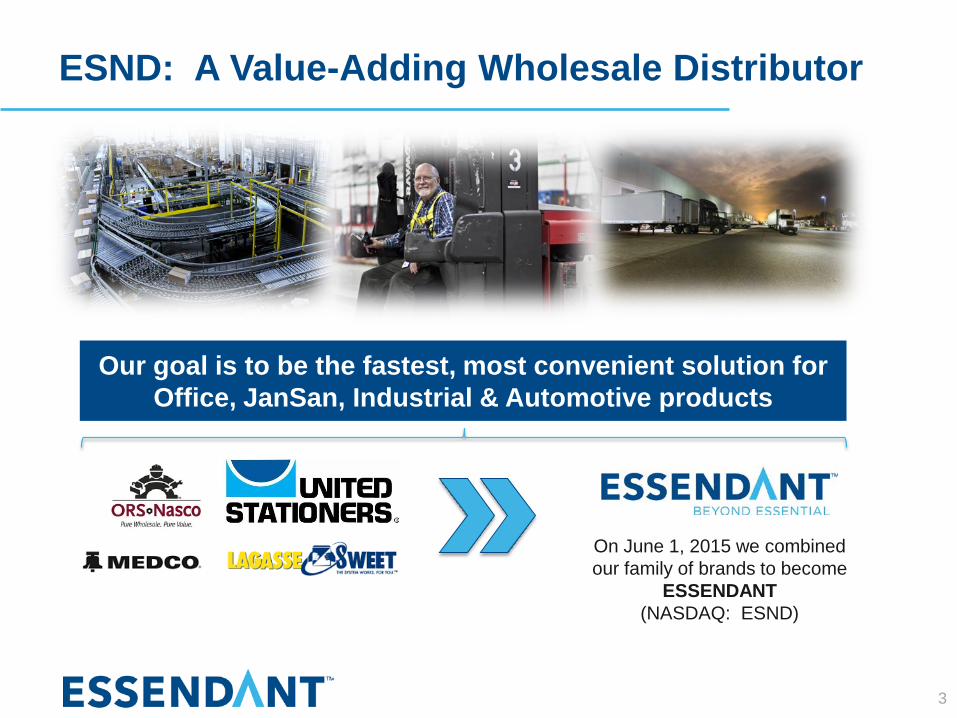
ESND: A Value-Adding Wholesale Distributor
Our goal is to be the fastest, most convenient solution for Office, JanSan, Industrial & Automotive products
On June 1, 2015 we combined our family of brands to become
ESSENDANT (NASDAQ: ESND)
3

Automotive Tools & Supplies
Essendant at a Glance
Each Category is a Large, Fragmented
Market Offering Potential to
Consolidate Share
4
Industrial Tools & Supplies
Office Products & Furniture
JanSan & Foodservice

180,000 ITEMS
30,000RESELLERS
1600+ Manufacturers
Independent Resellers eTailersNational
Accounts
Millions of Customers
Drive Profit by Enabling a Full Range of Resellers
5

Enhanced digital services
Broad assortment & geographic reach
Operating excellence
Our Three Channels Well-Positioned to Benefit From Shifting Consumer Demand
Independent Resellers
Ease of market entry
Broad assortment in one shipment
Rich item content
Operating excellence under their brand
eTailers
Category breadth including non-core items
Supplemental sourcing
Support contract business: limited exposure to retail
Highly integrated operating model
National Accounts
Key value drivers for channel:
6

Resellers Extending Category Range
7
Office Products & FurnitureESND Categories
ChannelInterest Level
JanSan & Foodservice Industrial Tools& Supplies
Auto Tools& Supplies
Independent Office Products Dealers
Independent JanSan Dealers
Independent Industrial and Auto Distributors
National Accounts
eTailers
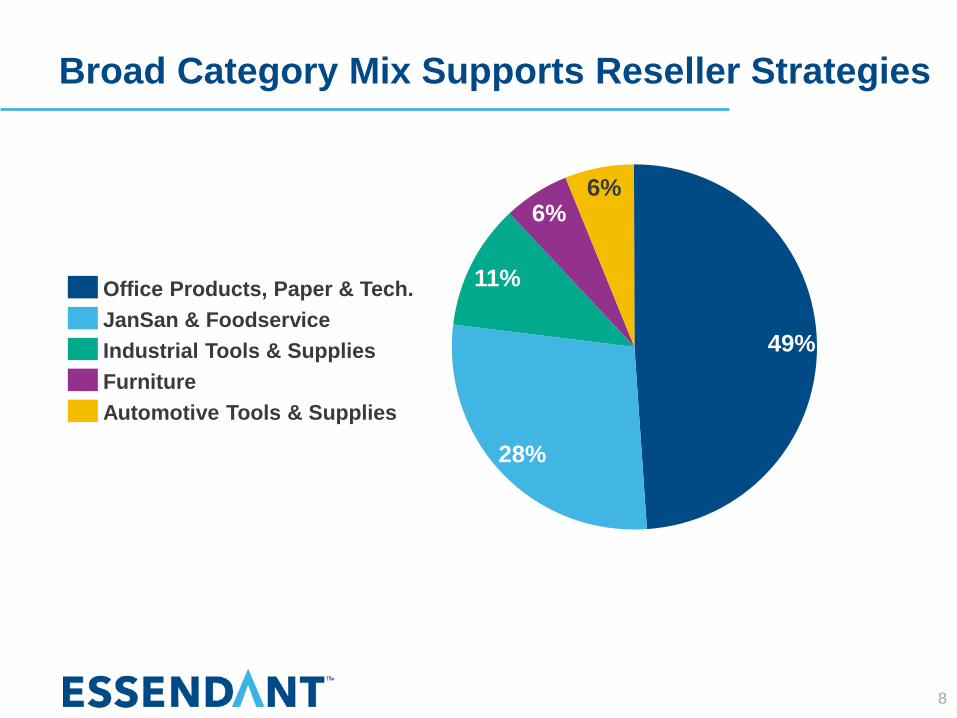
Broad Category Mix Supports Reseller Strategies
8
28%
6%6%
49%
11%JanSan & FoodserviceOffice Products, Paper & Tech.
FurnitureIndustrial Tools & Supplies
Automotive Tools & Supplies

Approx. FY15 Revenue (% of Total Sales): • Traditional Office Products – $875M (~16%)• Paper – $350M (~6%)• Technology – $1,375M (~27%)
Traditional Office Products – declining 1-2% per year Paper & Technology – declining 5%+ per year
Consolidating market—large independents buying and taking share from smaller dealers and “mom and pops”
Align with large dealers and grow our share/sales with them as they consolidate space
Focus on Traditional Office Products—slower category decline and highest margin
Office Products, Paper & Tech: Opportunity Under the Surface as Sub-Categories Have Differing Growth Rates and Margin
9
Office Products, Paper &
Technology
At Essendant:
Estimated Category Growth:
Industry Trend:
OUR STRATEGY:
Source: Company Data, 2015 10-K.

Approx. FY15 Revenue: $325M % of Total Sales: ~6%
GDP
Sensitive to macro-economic environment
Leverage inventory investment and quick-ship capabilities to be the leading distributor for mid-market furniture sales
Furniture: Growing Category with Attractive Margins
Source: Company Data, 2015 10-K. 10
Furniture
At Essendant:
Estimated Category Growth:
Industry Trend:
OUR STRATEGY:

Approx. FY15 Revenue: $1.5B % of Total Sales: ~28%
Approximately GDP
Fragmented market likely to coalesce around best players from digital and convenience perspective
Enhance customer value through “Common Platform”—cross-sell to OP, eTail and National Accounts
JanSan: Impressive Historical Growth With Long Runway
Source: Company Data, 2015 10-K. 11
JanSan & Foodservice
At Essendant:
Estimated Category Growth:
Industry Trend:
OUR STRATEGY:

Approx. FY15 Revenue: $600M % of Total Sales: ~11%
GDP with cyclical characteristics
Highly fragmented market facing headwinds that have impacted results and near-term expectations
Expand distributor customer set beyond energy, grow in eTail and government, optimize product assortment and advance digital capabilities
Industrial Tools & Supplies: Opportunity to Benefit From Leveraging Core Business
Source: Company Data, 2015 10-K. 12
Industrial
At Essendant:
Estimated Category Growth:
Industry Trend:
OUR STRATEGY:
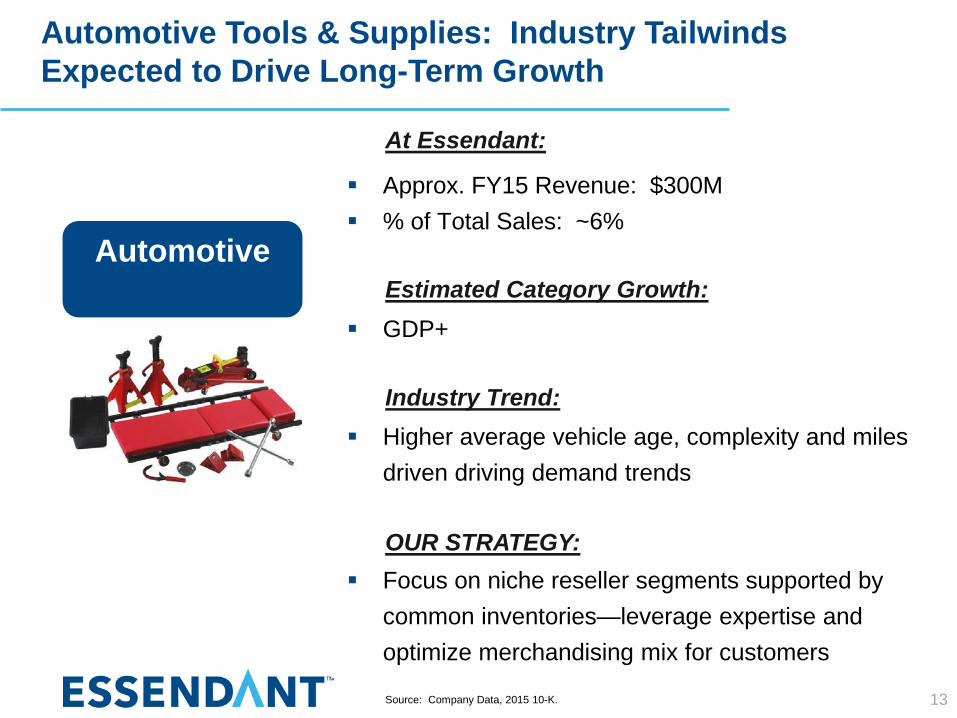
Approx. FY15 Revenue: $300M % of Total Sales: ~6%
GDP+
Higher average vehicle age, complexity and miles driven driving demand trends
Focus on niche reseller segments supported by common inventories—leverage expertise and optimize merchandising mix for customers
Automotive Tools & Supplies: Industry Tailwinds Expected to Drive Long-Term Growth
Source: Company Data, 2015 10-K. 13
Automotive
At Essendant:
Estimated Category Growth:
Industry Trend:
OUR STRATEGY:
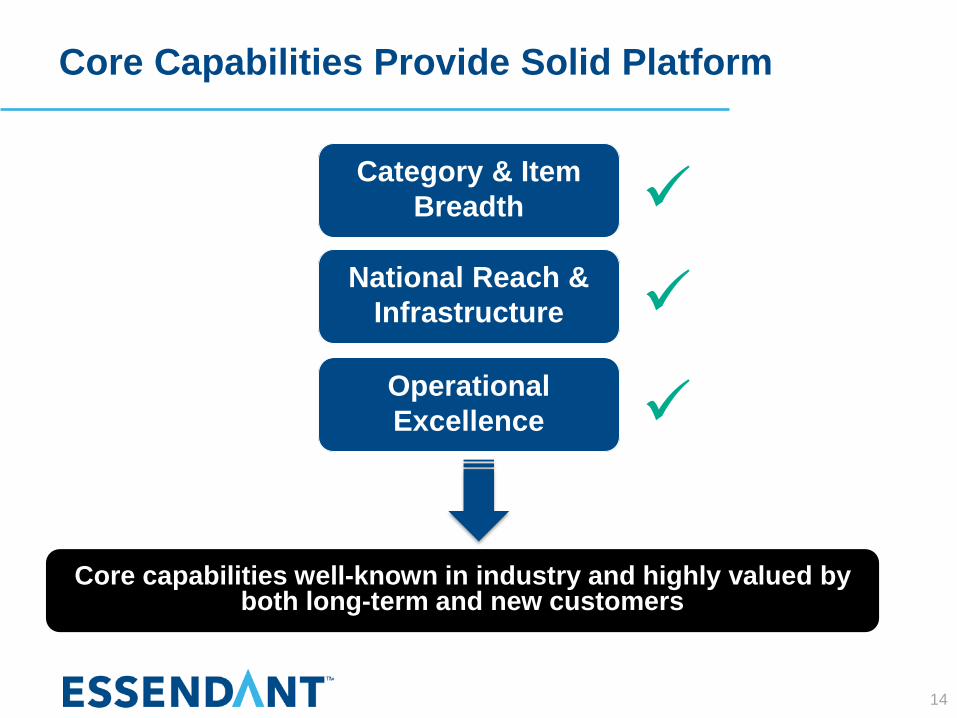
Core Capabilities Provide Solid Platform
Category & Item Breadth
14
National Reach & Infrastructure
Operational Excellence
Core capabilities well-known in industry and highly valued by both long-term and new customers

Differentiated Capabilities to Drive Growth
15
Differentiated offering supports customers in expanding their business
Digital Services
Deep Category Expertise
Tailored Channel Strategies

Challenging 1H 2016 Reflected in Stock Price
Net Sales($M)
Adjusted EBITDA(1)
($M)
1) For a definition and reconciliation of Adjusted EPS, please see appendix.
1H 2016
$97.0
1H 2015
$112.4
1H 2016
$1.00
1H 2015
$1.27
+1.2%
1H 2016
$2,707
1H 2015
$2,674
Adjusted EPS(1)
($/share)
16
Organic sales increase driven by recent customer wins
Adjusted EBITDA and EPS affected by gross margin decline– Increased sales of less profitable items – Shift to larger, less profitable customers– Disruptions in JanSan channel

Near-Term Objectives
1) Stabilize and return JanSan channel to profitable growth– Potential to be outsized driver of profit improvement
2) Align pricing with cost to serve– Obtain rates commensurate with value we bring– Reduce ongoing freight costs
3) Pursue merchandising excellence – Focus volume with key suppliers to shift share and reduce
cost of goods sold– Expand private brand portfolio
4) Pursue additional cost reduction activities– Reduce distribution center footprint– Further simplify organization
5) Reduce inventory purchases $100M by year-end– Drive free cash flow of $150M in 2H 2016
17

Appendix
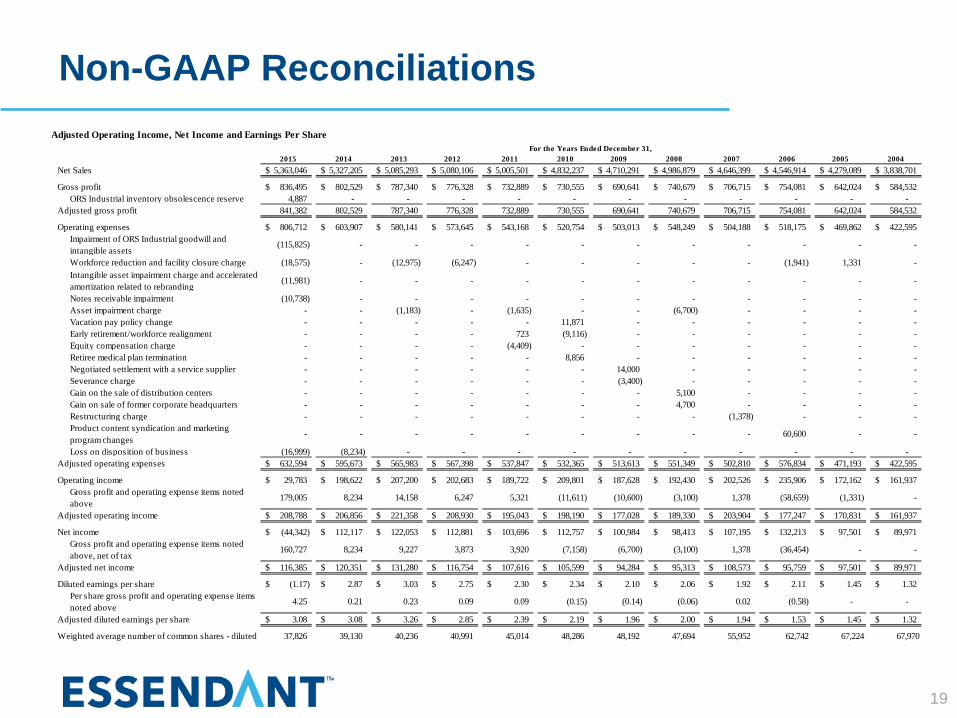
Non-GAAP ReconciliationsAdjusted Operating Income, Net Income and Earnings Per Share
2012 2009 2008 2005 2004Net Sales 5,363,046$ 5,327,205$ 5,085,293$ 5,080,106$ 5,005,501$ 4,832,237$ 4,710,291$ 4,986,879$ 4,646,399$ 4,546,914$ 4,279,089$ 3,838,701$
Gross profit 836,495$ 802,529$ 787,340$ 776,328$ 732,889$ 730,555$ 690,641$ 740,679$ 706,715$ 754,081$ 642,024$ 584,532$ ORS Industrial inventory obsolescence reserve 4,887 - - - - - - - - - - -
Adjusted gross profit 841,382 802,529 787,340 776,328 732,889 730,555 690,641 740,679 706,715 754,081 642,024 584,532
Operating expenses 806,712$ 603,907$ 580,141$ 573,645$ 543,168$ 520,754$ 503,013$ 548,249$ 504,188$ 518,175$ 469,862$ 422,595$ Impairment of ORS Industrial goodwill and intangible assets
(115,825) - - - - - - - - - - -
Workforce reduction and facility closure charge (18,575) - (12,975) (6,247) - - - - - (1,941) 1,331 - Intangible asset impairment charge and accelerated amortization related to rebranding
(11,981) - - - - - - - - - - -
Notes receivable impairment (10,738) - - - - - - - - - - - Asset impairment charge - - (1,183) - (1,635) - - (6,700) - - - - Vacation pay policy change - - - - - 11,871 - - - - - - Early retirement/workforce realignment - - - - 723 (9,116) - - - - - - Equity compensation charge - - - - (4,409) - - - - - - - Retiree medical plan termination - - - - - 8,856 - - - - - - Negotiated settlement with a service supplier - - - - - - 14,000 - - - - - Severance charge - - - - - - (3,400) - - - - - Gain on the sale of distribution centers - - - - - - - 5,100 - - - - Gain on sale of former corporate headquarters - - - - - - - 4,700 - - - - Restructuring charge - - - - - - - - (1,378) - - - Product content syndication and marketing program changes
- - - - - - - - - 60,600 - -
Loss on disposition of business (16,999) (8,234) - - - - - - - - - - Adjusted operating expenses 632,594$ 595,673$ 565,983$ 567,398$ 537,847$ 532,365$ 513,613$ 551,349$ 502,810$ 576,834$ 471,193$ 422,595$
Operating income 29,783$ 198,622$ 207,200$ 202,683$ 189,722$ 209,801$ 187,628$ 192,430$ 202,526$ 235,906$ 172,162$ 161,937$ Gross profit and operating expense items noted above
179,005 8,234 14,158 6,247 5,321 (11,611) (10,600) (3,100) 1,378 (58,659) (1,331) -
Adjusted operating income 208,788$ 206,856$ 221,358$ 208,930$ 195,043$ 198,190$ 177,028$ 189,330$ 203,904$ 177,247$ 170,831$ 161,937$
Net income (44,342)$ 112,117$ 122,053$ 112,881$ 103,696$ 112,757$ 100,984$ 98,413$ 107,195$ 132,213$ 97,501$ 89,971$ Gross profit and operating expense items noted above, net of tax
160,727 8,234 9,227 3,873 3,920 (7,158) (6,700) (3,100) 1,378 (36,454) - -
Adjusted net income 116,385$ 120,351$ 131,280$ 116,754$ 107,616$ 105,599$ 94,284$ 95,313$ 108,573$ 95,759$ 97,501$ 89,971$
Diluted earnings per share (1.17)$ 2.87$ 3.03$ 2.75$ 2.30$ 2.34$ 2.10$ 2.06$ 1.92$ 2.11$ 1.45$ 1.32$ Per share gross profit and operating expense items noted above
4.25 0.21 0.23 0.09 0.09 (0.15) (0.14) (0.06) 0.02 (0.58) - -
Adjusted diluted earnings per share 3.08$ 3.08$ 3.26$ 2.85$ 2.39$ 2.19$ 1.96$ 2.00$ 1.94$ 1.53$ 1.45$ 1.32$
Weighted average number of common shares - diluted 37,826 39,130 40,236 40,991 45,014 48,286 48,192 47,694 55,952 62,742 67,224 67,970
2015For the Years Ended December 31,
2014 2013 2011 2010 2007 2006
19


![API IR Presentation 11-16-06[1]](https://static.fdocuments.ec/doc/165x107/577d39921a28ab3a6b9a16c2/api-ir-presentation-11-16-061.jpg)

