ENDOCRINOLOGÍA Y NUTRICIÓN ISSN:1575-0922 · Noviembre 2009, Volumen 56, Monográfico 4, Páginas...
75
ENDOCRINOLOGÍA Y NUTRICIÓN Órgano de la Sociedad Española de Endocrinología y Nutrición Volumen 56, Monográfico 4, Noviembre 2009 Incluida en: EMBASE/Excerpta Medica y SCOPUS ENDOCRINOLOGÍA Y NUTRICIÓN Noviembre 2009, Volumen 56, Monográfico 4, Páginas 1-72 ISSN:1575-0922 14.º SIMPOSIO CIENTÍFICO DIABETES MELLITUS HOY Directores invitados: Manuel Serrano Ríos, Carlos Payá y José A. Gutiérrez-Fuentes www.elsevier.es/endo www.seenweb.org
Transcript of ENDOCRINOLOGÍA Y NUTRICIÓN ISSN:1575-0922 · Noviembre 2009, Volumen 56, Monográfico 4, Páginas...

ENDOCRINOLOGÍAY NUTRICIÓN
Órgano de la Sociedad Española de Endocrinología y Nutrición
Volumen 56, Monográfico 4, Noviembre 2009
Incluida en: EMBASE/Excerpta Medica y SCOPUS
EN
DO
CR
INO
LOG
ÍA Y
NU
TR
ICIÓ
NN
oviembre 2009, V
olumen 56, M
onográfico 4, Páginas 1-72
ISS
N:1
575-
0922
14.º SIMPOSIO CIENTÍFICO
DIABETES MELLITUS HOYDirectores invitados:
Manuel Serrano Ríos, Carlos Payá y José A. Gutiérrez-Fuentes
www.elsevier.es/endo www.seenweb.org

ENDOCRINOLOGÍAY NUTRICIÓN
Introducción 3 J.A. Gutiérrez-Fuentes
El arma de doble filo 5 R.N. Bergman
¿Es importante la glucosa posprandial y por qué? 8 A. Ceriello
Reactividad vascular en la diabetes mellitus 12 P. Dandona
Guías clínicas en diabetes mellitus tipo 1 15 F. Escobar-Jiménez
El riñón en la diabetes tipo 2: la estructura renal 18 M. Dalla Vestra, M. Arboit, como foco de atención M. Bruseghin y P. Fioretto
Nuevos hallazgos genéticos aplicados a la clínica 21 J.C. Florezen la diabetes tipo 2
Formas monogénicas de la diabetes mellitus: 26 M. Vaxillaire y P. Frogueluna actualización
Causas principales de mortalidad precoz y exceso 30 A. Gómez de la Cámara, M.A. Rubiode mortalidad en la población diabética española. Herrera, J.A. Gutiérrez Fuentes, Estudio DRECE III J.A. Gómez Gerique, C. Jurado Valenzuela y P. Cancelas Navia, en representación del Grupo DRECE
Una visión global de la genética en la diabetes tipo 2 34 L. Groop y V. Lyssenko
Obesidad y diabetes 38 K. Lois y S. Kumar
Trastornos lipídicos en la diabetes tipo 2 43 M. Laakso
Recomendaciones actuales en el tratamiento 46 H.E. Lebovitzde la diabetes tipo 2
Historia natural e inmunopatogénesis de la diabetes 50 P. Pozzilli, R. Strollo e I. Barchettatipo 1
Epidemiología de la diabetes tipo 1 infantil 53 G. Soltészen el ámbito mundial
Interacción entre el gen y el entorno en la diabetes 56 M. Truccomellitus tipo 1
Epidemiología de la diabetes tipo 2 60 N.J. Wareham
Hipertensión en la diabetes mellitus 63 P.K. Whelton
Síndrome metabólico. Declaración conjunta, 67 J.A. Gutiérrez Fuentesoctubre 2009
Premio a una Carrera Distinguida en Endocrinología 70y Nutrición 2008
Este suplemento ha sido patrocinado por la Fundación Lilly.
Esta publicación refleja conclusiones, hallazgos y comentarios propios de los autores y se mencionan estudios clínicos que podrían contener indicaciones/posologías/formas de administración de produc-tos no autorizadas actualmente en España. Se recuerda que cualquier fármaco mencionado deberá ser utilizado de acuerdo con la Ficha Técnica vigente en España.
Sumario
14.o SIMPOSIO CIENTÍFICO DIABETES MELLITUS HOY
Directores invitados:Manuel Serrano Ríos, Carlos Payá y José A. Gutiérrez-Fuentes
00 SUMARIO SUPL4.indd 200 SUMARIO SUPL4.indd 2 13/11/09 08:00:1513/11/09 08:00:15

ENDOCRINOLOGÍAY NUTRICIÓN
Introduction 1 J.A. Gutiérrez-Fuentes
The two-edged sword 5 R.N. Bergman
Does postprandial blood glucose matter and why? 8 A. Ceriello
Vascular reactivity in diabetes mellitus 12 P. Dandona
Clinical guidelines in type 1 diabetes mellitus 15 F. Escobar-Jiménez
The kidney in type 2 diabetes: focus 18 M. Dalla Vestra, M. Arboit, on renal structure M. Bruseghin and P. Fioretto
Novel genetic findings applied to the clinic 21 J.C. Florezin type 2 diabetes
Monogenic forms of diabetes mellitus: 26 M. Vaxillaire and P. Froguelan update
Main cuases of early mortality and excess 30 A. Gómez de la Cámara, M.A. Rubiomortality in the Spanish diabetic population. Herrera, J.A. Gutiérrez Fuentes, The DRECE III study J.A. Gómez Gerique, C. Jurado Valenzuela and P. Cancelas Navia, on behalf of DRECE Group
Genetics of type 2 diabetes. On overview 34 L. Groop and V. Lyssenko
Obesity and diabetes 38 K. Lois and S. Kumar
Lipid disorders in type 2 diabetes 43 M. Laakso
Present recommendations in type 2 46 H.E. Lebovitzdiabetes treatment
Natural history and immunopathogenesis 50 P. Pozzilli, R. Strollo and I. Barchettaof type 1 diabetes
Worldwide childhood type 1 diabetes 53 G. Soltészepidemiology
Gene-environment interaction in type 1 56 M. Truccodiabetes mellitus
Epidemiology of type 2 diabetes 60 N.J. Wareham
Hypertension in diabetes mellitus 63 P.K. Whelton
Metabolic syndrome. Joint Declaration, October 2009 67 J.A. Gutiérrez Fuentes
Distinguished Career Award Endocrinology 70& Nutrition 2008
This supplement has been sponsored by Fundación Lilly.
This publication shows the conclusions, findings and comments of the authors and mentions clinical studies that could have indications/dosages/administration forms of currently unauthorized medicinal products in Spain. It is stressed that any drug mentioned should be used in accordance with the Data Sheet in force in Spain.
Contents
14th SCIENTIFIC SYMPOSIUM DIABETES MELLITUS TODAY
Invited directors:Manuel Serrano Ríos, Carlos Payá and José A. Gutiérrez-Fuentes
00 SUMARIO SUPL4.indd 300 SUMARIO SUPL4.indd 3 13/11/09 08:00:1513/11/09 08:00:15

Endocrinol Nutr. 2009;56(Supl 4):1-2 1
IntroductionJOSÉ A. GUTIÉRREZ-FUENTES
TYPE 1 DIABETES MELLITUS
Type 1 diabetes results from cellular-mediated au-toimmune destruction of pancreatic islet beta-cells causing the loss of insulin production. It ranks as the most common chronic childhood disease in developed nations, but occurs at all ages and the clinical presen-tation can vary with age.
The predominant cause of hyperglycaemia in type 1 diabetes is the destruction of the beta cells, which leads to absolute dependence on insulin treatment and a high rate of complications typically occurring at relatively young ages. Type 1 diabetes, therefore, places a parti-cularly heavy burden on the individual, the family and the health services.
TYPE 2 DIABETES MELLITUS
Type 2 diabetes is characterized by insulin resistance and relative insulin deficiency, either of which may be present at the time that diabetes becomes clinically ma-nifest. The specific reasons for the development of the-se abnormalities are not yet known.
The diagnosis of type 2 diabetes usually occurs after the age of 40 years although the age of onset is often a decade earlier in populations with high diabetes preva-lence. People with type 2 diabetes may not show any symptoms for many years and the diagnosis is often made from associated complications or incidentally through an abnormal blood or urine glucose test.
Type 2 diabetes is often, but not always, associated with obesity, which itself can cause insulin resistance and lead to elevated blood sugar levels. It is strongly familial, but major susceptibility genes have not yet been identified. In contrast to type 1 diabetes, patients with type 2 diabetes are not dependent on exogenous insulin and are not ketosis-prone, but may require insu-lin for control of hyperglycaemia if this is not achieved with diet alone or with oral hypoglycaemic agents.
Type 2 diabetes constitutes about 85% to 95% of all diabetes in developed countries, and accounts for an even higher percentage in developing countries. It is now a common and serious global health problem, which, for most countries, has evolved in association with rapid cultural and social changes, ageing popula-
tions, increasing urbanization, dietary changes, redu-ced physical activity and other unhealthy lifestyle and behavioural patterns.
RELATED DISORDERS AND COMPLICATIONS
In virtually every developed society, diabetes is ranked among the leading causes of blindness, renal failure and lower limb amputation. It is also now one of the leading causes of death through its effects on cardiovascular disease (70%-80% of people with dia-betes die of cardiovascular disease). The main relevan-ce of diabetes complications in a public health perspec-tive is the relationship to human suffering and disability, and the huge socio-economic costs through premature morbidity and mortality.
Chronic elevation of blood glucose, even when no symptoms are present to alert the individual to the pre-sence of diabetes, will eventually lead to tissue dama-ge, with consequent, and often serious, disease. Whilst evidence of tissue damage can be found in many organ systems, it is the kidneys, eyes, peripheral nerves and vascular tree, which manifest the most significant, and sometimes fatal, diabetic complications. The mecha-nism by which diabetes leads to these complications is complex, and not yet fully understood, but involves the direct toxic effects of high glucose levels, along with the impact of elevated blood pressure, abnormal lipid levels and both functional and structural abnormalities of small blood vessels.
About half of all the money spent on diabetes care goes towards the costs of managing diabetic complica-tions. Cardiovascular complications frequently account for the bulk of the costs. The trend of escalating diabe-tes prevalence will no doubt lead to an immense finan-cial burden in many countries unless action is taken to prevent both diabetes and its complications.
DIABETES TREATMENT
The major goal in treating diabetes is controlling ele-vated blood sugar without causing abnormally low le-vels of blood sugar. Treatment for type 1 diabetes is

Gutiérrez-Fuentes JA. Introduction
2 Endocrinol Nutr. 2009;56(Supl 4):1-2
with insulin, exercise, and a diabetic diet. Treatment for type 2 diabetes is first treated with weight reduc-tion, a diabetic diet, and exercise. When these mea-sures fail to control the elevated blood sugar, oral medications are used. If oral medications are still in-sufficient, insulin medications are considered.
The 14th Lilly Foundation Scientific Symposium “Diabetes mellitus today” mixes scientists with di-fferent views and cultures in their approach to diabe-tes mellitus research and clinical practice. Aim of this symposium is to provide the participants with first-hand cutting-edge information on a crucial mor-bidity as diabetes, from molecular to genetic epide-miology, its pathophisiology, and the newer compo-nents such as nitric oxide, inflammation molecules,
prothrombotic state, endothelial dysfunction, or rela-ted disorders and complications such as dyslipide-mias, obesity or arterial hypertension.
It is the purpose of Fundación Lilly (www.funda-cionlilly.com), in accordance to its statutory objecti-ves, to help spread these concepts, and we are quite confident we have accomplished our aims thanks to the highly qualified personalities who accepted our invitation to contribute their knowledge and ideas in each of the programmed interventions.
Conflic of interest
The author declares he has no conflict of interest.

Endocrinol Nutr. 2009;56(Supl 4):3-4 3
IntroducciónJOSÉ A. GUTIÉRREZ-FUENTES
DIABETES MELLITUS TIPO 1
La diabetes mellitus tipo 1 es el resultado del déficit de insulina originado por la destrucción autoinmunita-ria de los islotes pancreáticos de células beta. Se trata de la enfermedad crónica más frecuente en la infancia en los países desarrollados, aunque puede iniciarse a cualquier edad y su presentación clínica ser variable.
La causa predominante de hiperglucemia en la dia-betes tipo 1 es la destrucción de las células beta que conduce a una dependencia absoluta del tratamiento con insulina y a una alta tasa de complicaciones en edades tempranas. Es por ello, que la diabetes tipo 1 supone una pesada carga para el paciente, su familia y los servicios de salud.
DIABETES MELLITUS TIPO 2
La diabetes tipo 2 se caracteriza por la resistencia a la insulina y un déficit relativo de la hormona. Cual-quiera de estas circunstancias puede estar presente en el momento que la enfermedad se inicia en la clínica. Sus causas aún no se conocen.
Se suele diagnosticar pasados los 40 años, aunque suele ser más precoz en las poblaciones con mayor pre-valencia de la enfermedad. Puede cursar asintomática-mente durante años, y con frecuencia el diagnóstico se hace a través de la aparición de sus complicaciones, o incidentalmente al practicar un análisis rutinario de sangre u orina.
Con frecuencia, aunque no siempre, se asocia a obe-sidad, que a su vez puede ser causa de resistencia insu-línica y motivar valores elevados de glucosa en sangre. Aunque se observa asociación familiar, no se han po-dido identificar los genes de susceptibilidad. En con-traste con la diabetes tipo 1, estos pacientes no son dependientes de la insulina ni propensos a la cetosis, pero pueden llegar a precisar insulina para el control de la hiperglucemia cuando éste no se logra con dieta y antidiabéticos orales.
La diabetes tipo 2 supone entre el 85 y el 95% de los diabéticos en los países desarrollados, y un porcentaje aún mayor en las regiones en desarrollo. Se trata de un serio problema global de salud que en la mayoría de los países se ha puesto de manifiesto asociado a los cambios culturales y sociales, el aumento de la expec-
tativa de vida, la urbanización, los cambios dietéticos, la reducción de la actividad física y otros patrones y estilos de vida no saludables.
ENFERMEDADES RELACIONADAS Y COMPLICACIONES
En la mayoría de las sociedades desarrolladas, la dia-betes se encuentra entre las principales causas de ce-guera, fracaso renal y amputación de extremidades in-feriores. Además, es una de las primeras causas de muerte a través de su efecto predisponente a las enfer-medades cardiovasculares (del 70 al 80% de los diabé-ticos fallece de enfermedades cardiovasculares). Sin embargo, desde una perspectiva de salud pública, al-canzan especial relevancia el sufrimiento y las discapa-cidades en los pacientes y los grandes costes socioeco-nómicos, así como la morbimortalidad prematura ocasionada por las complicaciones de la diabetes.
La elevación crónica de la glucemia, aun en ausen-cia de síntomas, puede conducir a la aparición de daño tisular y originar complicaciones importantes. Aunque los daños causados pueden afectar a diferentes tejidos, las complicaciones diabéticas más notables afectan a riñones, ojos, nervios periféricos y árbol vascular. El mecanismo por el que estas complicaciones se origi-nan es complejo e insuficientemente entendido aún, pero incluye los efectos tóxicos directos de la glucosa elevada, junto a la elevación de la presión arterial, el aumento de los lípidos en sangre, y alteraciones fun-cionales y estructurales de los vasos sanguíneos me-nores.
Alrededor de la mitad del gasto empleado en el tra-tamiento de la diabetes lo absorbe el de sus complica-ciones, siendo las cardiovasculares responsables de la mayor parte. El crecimiento de la prevalencia de la diabetes supondrá en muchos países una muy elevada carga financiera a menos que se pongan en marcha acciones tendentes a prevenir la enfermedad y sus complicaciones.
TRATAMIENTO DE LA DIABETES MELLITUS
El objetivo principal del tratamiento de la diabetes es el control de las concentraciones de glucosa en sangre sin

Gutiérrez-Fuentes JA. Introducción
4 Endocrinol Nutr. 2009;56(Supl 4):3-4
caer en situaciones de hipoglucemia. El tratamiento de la diabetes tipo 1 es con insulina, ejercicio y dieta. En la diabetes tipo 2, el tratamiento procurará, en primer lu-gar, controlar el peso corporal, una dieta diabética ade-cuada y el ejercicio físico. Cuando con estas recomen-daciones no se consigan los objetivos terapéuticos se utilizarán antidiabéticos orales, y sólo cuando éstos re-sulten insuficientes se considerará administrar insulina.
El 14.º Simposio Científico de la Fundación Lilly “Diabetes mellitus hoy” incluye una mezcla de cien-tíficos con diferentes culturas y puntos de vista en su aproximación a la investigación y la práctica clínica de la diabetes. Es objetivo del simposio acercar a los participantes una información novedosa y de primera mano acerca de una enfermedad prevalente, como es la diabetes, referida a su epidemiología genética y molecular, su fisiopatología, los nuevos componentes
como el óxido nítrico, las moléculas inflamatorias, el estado protrombótico, la disfunción endotelial, o al-teraciones relacionadas como las dislipemias, la obe-sidad o la hipertensión arterial.
Es propósito de la Fundación Lilly (www.funda-cionlilly.com), en consonancia con sus objetivos es-tatutarios, colaborar al mejor conocimiento de estos conceptos, y confiamos en lograrlo gracias al notable plantel de personalidades que han aceptado nuestra invitación para compartir sus conocimientos e ideas en cada una de las intervenciones programadas.
Conflicto de intereses
El autor declara no tener ningún conflicto de inte-reses.

Endocrinol Nutr. 2009;56(Supl 4):5-7 5
The two-edged swordRICHARD N. BERGMAN
Keck Professor of Medicine. University of Southern California. Los Angeles CA. USA.
Unlike most chronic illnesses which have been declining or sta-bilizing in prevalence, incidence of type 2 diabetes has been increa-sing in the Western Hemisphere, and is now increasing at alarming rates in Asia1. While all causes of these increases cannot be identi-fied, without question the increase in adiposity is an important con-tributor. The latter is due to increased caloric intake and reduced energy expenditure, although other factors may contribute2. Adipo-sity leads to insulin resistance, which in normal individuals elicits an hyperinsulinemic response, which compensates for the insulin resistance. Unresolved questions relate to whether fat storage in specific depots is particularly egregious, what mechanisms are res-ponsible for the pancreatic islet-cell compensation, and why said compensation can fail, leading to diabetes in some, but not all indi-viduals. Epidemiological studies suggest that visceral fat is particu-larly detrimental to metabolic health. Direct evidence favoring the importance of visceral fat is the result of surgical extirpation of the superior omentum in the canine model. While eliminating only 7% of total visceral fat in the dog, insulin sensitivity increased over 50%. This study compliments human data from Klein et al that evisceration of subcutaneous fat did not alter insulin resistance3.
Why is visceral fat detrimental? Induction of visceral adiposity by feeding of an hypercaloric high fat diet leads to insulin resistan-ce for several reasons: a) increase of stored visceral fat in adipo-cytes which are themselves insulin resistant resulting in flux of free fatty acids (FFA) from viscera to liver and extrasplanchnic tissues; b) action of the sympathetic nervous system (SNS) which favors lipolysis and causes pulsatile release of FFA from visceral fat into the portal circulation; c) effects of pulsatile release of FFA which results in hepatic insulin resistance, associated with upregulation of liver gluconeogenic enzymes (fig. 1). Interestingly, the resultant insulin resistance of liver can be successfully reversed by antago-nism of the cannabanoid system with rimonabant.
The role of FFA in pathogenesis of insulin resistance has been questioned, as evidence was lacking for increased fasting FFA in obese individuals. Recently we reported a powerful circadian rhythm in FFA levels, with a peak in levels between 2 and 4 AM4. We propose that it is the nocturnal surge in plasma FFA which is responsible for onset of insulin resistance in the overweight subject (fig. 2). This surge is due at least in part to a night-time outpouring of FFA from the visceral fat depot. We propose that omentectomy reduces this outpouring and increases insulin sensitivity.
Not all insulin obese, insulin resistant individuals develop Type 2 diabetes, and induction of insulin resistance per se does not cause
Diabetes mellitus hoy
Correspondence: Dr. R.N. Bergman.Keck Professor of Medicine. University of Southern California.90033 Los Angeles CA. USA.E-mail: [email protected]
01 ENDO4 (05-07).indd 501 ENDO4 (05-07).indd 5 13/11/09 08:40:4013/11/09 08:40:40

Bergman RN. The two-edged sword
6 Endocrinol Nutr. 2009;56(Supl 4):5-7
diabetes5. Type 2 diabetes occurs when the ability of the beta-cells of the pancreatic islets fail to compensate for diet-induced insulin resistance. It is only recently that it has been widely accepted that type 2 diabetes is usually due to a combination of insulin resistance and failed pancreatic compensation. This failure of compensation can be most well understood in terms of the hyperbolic relationship between insulin resistance and islet com-
pensation (fig. 3). Normally resistance results in upregu-lation of beta-cell function which is described by a rec-tangular hyperbola6: insulin sensitivity x insulin secretion = constant (disposition index, “DI”). A higher value of DI is protective, a reduced DI portends conversion to type 2 diabetes mellitus. In fact, at this juncture, the va-lue of DI is the most powerful predictor of conversion from prediabetes to frank diabetes mellitus, and this pre-dictive power of DI far outweighs predictability of genes for type 2 diabetes so far identified. Interestingly, all ge-nes for type 2 diabetes so far identified are related to beta-cell failure, rather than insulin resistance.
What is responsible for the hyperbolic relationship between insulin action and insulin secretion? It is wide-ly believed that insulin resistance results in increased glycemia, which in turn increases secretory potential of the pancreatic islets. But, recent evidence from our la-boratory shows that hyperinsulinemic compensation for insulin resistance can occur even in the absence of increased fasting glucose levels. Thus, it is unknown what the signal or signals are which account for hype-rinsulinemic compensation. Because it is such compen-sation which fails as an initial step in progress to diabe-tes, it is important to understand beta-cell compensation. We hypothesize that nocturnal FFA, not only responsi-ble for insulin resistance, may also mediate islet cell compensation. Thus, we are reminded of the importan-ce of battle by sword here in El Escorial; by analogy, nocturnal FFA secondary to visceral lipolysis may not only cause insulin resistance, but may function as a two-edged sword, also mediating the islet cell response to compensate for insulin resistance. It is only in the modern world with a plethora of foodstuffs that such a
Night-timepathogenesis
of themetabolicsyndrome
Muscle
CNS
Mesentericfat depot Nocturnal,
pulsatile FFA
Other hormone?
Hyperinsulinemia
Fig. 1. Pathogenesis of insulin resistance syndrome. Sympathetic nervous system drives FFA release from visceral fat depot; insulin resistance results as does hyperinsulinemia. FFA: free fatty acids; CNS: central nervous system.
1,0
0,8
0,6
0,4
0,2
0,0
FFA
(m
M)
6 am 12 pm 6 pm 12 pm 6 am
After fat
Before fat
Week 0Week 6
Following a high fat diet, overnight FFFA are elevated
1,0
0,8
0,6
0,4
0,2
0,0Week 0 Week 6
Fasting
1,0
0,8
0,6
0,4
0,2
0,0Week 0 Week 6
Fasting
*1,0
0,8
0,6
0,4
0,2
0,0Week 0 Week 6
Fasting
*
FFA
(m
M) p = 24
Fig. 2. Nocturnal increase in plas-ma fatty free acids. FFFA: flux of free fatty acids.
01 ENDO4 (05-07).indd 601 ENDO4 (05-07).indd 6 13/11/09 08:40:4113/11/09 08:40:41

Bergman RN. The two-edged sword
Endocrinol Nutr. 2009;56(Supl 4):5-7 7
two-edged sword has turned towards the owner to re-sult in an international epidemic of type 2 diabetes.
1.000
500
0
Sec
retio
n by
pan
crea
s
50 100Insulin sensitivity of tissues
Patient at risk
Secretion x sensitivity= constant (DI)
“DI-perbola”
Fig. 3. DI: disposition index.
Conflict of interest
The author declares he has no conflict of interest.
REFERENCES
1. Yoon KH, Lee JH, Kim JW, Cho JH, Choi YH, Ko SH, et al.
Epidemic obesity and type 2 diabetes in Asia. Lancet. 2006;368:
1681-8.
2. Ludvigsson, J. Why diabetes incidence increases—a unifying
theory. Ann NY Acad Sci. 2006;1079;374-82.
3. Klein S, Fontana L, Young VL, Coggan AR, Kilo C, Patterson BW, et
al. Absence of an effect of liposuction on insulin action and risk fac-
tors for coronary heart disease. N Engl J Med. 2004;350:2549-57.
4. Kim SP, Catalano IR, Hsu JD, Chiu JM, Richey J, Bergman RN.
Nocturnal free fatty acids are uniquely elevated in the longitudi-
nal development of diet-induced insulin resistance and hyperin-
sulinemia. Am J Physiol. 2007;292:E1590-8.
5. Yechoor VK, Patti ME, Ueki K, Laustsen PG, Saccone R, Rau-
niyar R, et al. Distinct pathways of insulin-regulated versus dia-
betes-regulated gene expression: an in vivo analysis in MIRKO
mice. Proc Natl Acad Sci USA. 2004;101:16525-30.
6. Bergman RN, Ader M, Huecking K, Van Citters G. Accurate as-
sessment of beta-cell function: the hyperbolic correction. Diabe-
tes. 2002;51 Suppl 1:S212-20.
01 ENDO4 (05-07).indd 701 ENDO4 (05-07).indd 7 13/11/09 08:40:4113/11/09 08:40:41

8 Endocrinol Nutr. 2009;56(Supl 4):8-11
Does postprandial blood glucose matter and why?ANTONIO CERIELLO
Warwick Medical School. Clinical Science Research Institute. University of Warwick. UK.
Type 2 diabetes is characterized by a gradual decline in insu-lin secretion in response to nutrient loads; hence, it is primarily a disorder of postprandial glucose (PPG) regulation. However, physicians continue to rely on fasting plasma glucose (FPG) and glycosylated hemoglobin (HbA1c) to guide management. There is a linear relationship between the risk of cardiovascular (CV) death and the 2-hour oral glucose tolerance test (OGTT), while a recent study confirms postprandial hyperglycemia as indepen-dent risk factor for CVD in type 2 diabetes. At the same time, several intervention studies show that treating postprandial hy-perglycemia may reduces the incidence of new CV events. Evi-dence supports the hypothesis postprandial hyperglycemia may favour the appearance of the CV disease trough the generation of an oxidative stress. Furthermore, clinical data suggest that postprandial hyperglycemia is a common phenomenon even in patients who may be considered in “good metabolic control”. Therefore, physicians should consider monitoring and targeting PPG, as well as HbA1c and FPG, in patients with type 2 diabe-tes.
Over the last several years, diabetes organisations around the world have begun to recognise that prandial glucose regulation (PGR) leads to improved outcomes in patients with diabetes. As a result, they have strengthened their recommendations for monitoring and trea-ting postprandial glucose (PPG)1 (reviewed in reference 1).
These recommendations are supported by an increasing body of evidence.
Many epidemiological data support this concept, showing that the value of glucose after 2h during an oral glucose tolerance test (OGTT) is an independent risk factor for cardiovascular disease, while fasting glucose is not2-7.Clearly, the OGTT is highly non-physiological and can not be considered as a meal. However two studies have confirmed that PPG is an independent risk factor for CVD in type 2 diabetes in the clinical setting: “The Diabetes Inter-vention Study”, which showed that in type 2 diabetics 1h PPG pre-dicts myocardial infarction8, and, more recently, a prospective stu-dy, with a mean follow-up of 5 years, able to show that PPG is an independent CVD risk factor, particularly in women, in patients with type 2 diabetes9.
Intervention studies are also coming and support the relevance of PPG in the development of CVD.
Diabetes mellitus hoy
Correspondence: Dr. A. Criello.Warwick Medical School.Clinical Science Research Institute.University of Warwick, UK.E-mail: [email protected]
02 ENDO4 (08-11).indd 802 ENDO4 (08-11).indd 8 13/11/09 08:44:4713/11/09 08:44:47

Ceriello A. Does postprandial blood glucose matter and why?
Endocrinol Nutr. 2009;56(Supl 4)::8-11 9
The STOP-NIDDM Trial has shown that treatment of subjects with IGT with the ·-glucosidase inhibitor acar-bose, a compound which specifically reduces postpran-dial hyperglycemia, is associated not only with a 36% reduction in the risk of progression to diabetes10, but also a 34% risk reduction in the development of new cases of hypertension and a 49% risk reduction in cardiovascular events11, particularly of silent myocardial infarction12. In addition, in a subgroup of patients from this study, caro-tid intima media thickness was measured before rando-misation and at the end of the study13. Acarbose treatment was associated with a significant decrease in the progre-ssion of intima media thickness, an accepted surrogate for atherosclerosis13. Furthermore, in a recent meta-analysis in type 2 diabetic patients, acarbose treatment was associated with a significant reduction in cardiovas-cular events relative to placebo treatment, even after ad-justing for other risk factors14. Finally, the effects of two insulin secretagogues, repaglinide and glyburide, known to have different efficacy on postprandial hyperglycemia, on carotid intima-media thickness (CIMT) and markers of systemic vascular inflammation in type 2 diabetic pa-tients has been evaluated15. Although a similar reduction in A1c was observed in both groups (–0.9%), CIMT, in-terleukin-6 and C-reactive protein decreased more in the repaglinide group than in the glyburide group. The re-duction in CIMT was associated with changes in pos-tprandial but not fasting hyperglycemia15.
The mechanisms through which PPG exerts its effects may be identified in the production of free radi-cals, which, in turn, can induce an endothelial dysfunc-tion and the production of an inflammation16 (revised in reference 16). Studies confirm that after a meal an oxidative stress is generated17,18 (fig. 1) and that it is related to the level of hyperglycemia reached19, and, particularly, as very recently demonstrated, to the level of glucose fluctuations20. In parallel, the production of
this oxidative stress induces an endothelial dysfunction and the release of cytokines21,22, convincingly related to the activation of the transcription factor NF-kB, which plays a key role on endothelial function and inflamma-tion23. Therefore, it is not surprising that controlling PPG with various different compounds specifically working on PPG, such as, fast acting insulin analogues, hypoglycaemic agents improving the first phase of in-sulin secretion, an amylin analogue and acarbose, is accompanied by a significant improvement not only of the oxidative stress18,24-26, but also of endothelial dys-function26-29, myocardial blood flow30, inflammation15 and NF-kB activation31.
However, also dyslipidaemia is a recognized risk factor for cardiovascular disease in diabetes32 and to-day the contribution of postprandial hyperlipidaemia to this risk is well-recognized33.
In non-obese type 2 diabetic patients with moderate fasting hypertriglyceridaemia, atherogenic lipoprotein profile is amplified in the postprandial state34. These evidences have frequently raised the question that be-ing postprandial hyperglycemia accompanied by a concomitant increase of postprandial hyperlipidaemia, the latter was the true risk factor35.
It is today well recognized that endothelial dysfunc-tion is an early factor involved in the development of cardiovascular disease36. Evidence suggests that both postprandial hypertriglyceridemia and hyperglycemia induce an endothelial dysfunction, through an oxidati-ve stress21,37.
Finding shows an independent and cumulative effect of postprandial hypertriglyceridemia and hyperglyce-mia on endothelial function, suggesting oxidative stress as common mediator of such effect21,22. Therefore, evi-dence exists to support a specific and direct role of pos-prandial hyperglycemia, independent from lipids, in favouring cardiovascular disease.
The production of an oxidative stress in postprandial state, due to postprandial hyperglycemia, is of particular relevance because recent studies demonstrate that a sin-gle hyperglycemia-induced process of overproduction of superoxide by the mitochondrial electron-transport chain seems to be the first and key event in the activation of all other pathways involved in the pathogenesis of diabetic complications38 (fig. 2). Interestingly enough, it has very recently been shown that hyperlipidemia works in generating an oxidative stress in the mitochondria through the same pathway of hyperglycemia39.
The evidence described up to now proves that hyper-glycemia can acutely induce alterations of normal hu-man homeostasis. It should be noted that acute increa-ses of glucose levels cause alterations even in healthy —normoglycemic— subjects16. Diabetic subjects also have basal hyperglycemia and it can be hypothesized that the acute effects of mealtime hyperglycemia can exacerbate those produced by chronic hyperglycemia, thus contributing to the final picture of complicated diabetes. The precise relevance of PPG in the daily life of diabetic patients has recently been quantified40.
1.40
1.20
1.00
0.80
0.60
0.40
0.20
0.00
NT
(µ
mol
/l)
t 0 1 h 2 h 4 h 6 hTime
Fig. 1. Nitrotyrosine (a marker of oxidative stress) before and after a mixed meal: regular insulin, insulin aspart and control. From: Ceriello et al18.
02 ENDO4 (08-11).indd 902 ENDO4 (08-11).indd 9 13/11/09 08:44:4813/11/09 08:44:48

Ceriello A. Does postprandial blood glucose matter and why?
10 Endocrinol Nutr. 2009;56(Supl 4):8-11
and cardiovascular mortality in the Hoorn population : the Ho-
orn Study. Diabetologia. 1999;42:926-31.
3. Donahue RP, Abbott RD, Reed DM, Yano K. Postchallenge glu-
cose concentration and coronary heart disease in men of Japa-
nese ancestry. Honolulu Heart Program. Diabetes. 1987;36:689-
92.
4. Lowe LP, Liu K, Greenland P, Metzger BE, Dyer AR, Stamler
J. Diabetes, asymptomatic hyperglycemia, and 22-year mortali-
ty in black and white men. The Chicago Heart Association De-
tection Project in Industry Study. Diabetes Care. 1997;20:163-
9.
5. The DECODE study group, on behalf of the European Diabetes
Epidemiology Group. Glucose tolerance and mortality: compa-
rison of WHO and American Diabetes Association diagnostic
criteria. Lancet. 1999;354:617-21.
6. Coutinho M, Gerstein HC, Wang Y, Yusuf S. The relationship
between glucose and incident cardiovascular events: a metare-
gression analysis of published data from 20 studies of 95,783
individuals followed fro 12.4 years. Diabetes Care. 1999;22:233-
40.
7. Balkau B, Shipley M, Jarrett RJ, Pyörälä K, Pyörälä M, Forhan
A, et al. High blood glucose concentration is a risk factor for
mortality in middle-aged nondiabetic men. 20-year follow-up in
the Whitehall Study, the Paris Prospective Study, and the Hel-
sinki Policemen Study. Diabetes Care. 1998;21:360-7.
8. Hanefeld M, Fischer S, Julius U, Schulze J, Schwanebeck U,
Schmechel H, et al; The DIS Group. Risk factors for myocardial
infarction and death in newly detected NIDDM: the Diabetes
Intervention Study, 11-year follow-up. Diabetologia. 1996;39:
1577-83.
9. Cavalot F, Petrelli A, Traversa M, Bonomo K, Fiora E, Conti M,
et al. Postprandial blood glucose is a stronger predictor of cardio-
vascular events than fasting blood glucose in type 2 diabetes me-
llitus, particularly in women: lessons from the San Luigi Gonzaga
Diabetes Study. J Clin Endocrinol Metab. 2006;91:813-9.
10. Chiasson JL, Josse RG, Gomis R, Hanefeld M, Karasik A, La-
akso M; STOP-NIDDM Trail Research Group. Acarbose for
prevention of type 2 diabetes mellitus: the STOP-NIDDM ran-
domised trial. Lancet. 2002;359:2072-7.
11. Chiasson JL, Josse RG, Gomis R, Hanefeld M, Karasik A, La-
akso M; STOP-NIDDM Trial Research Group. Acarbose treat-
ment and the risk of cardiovascular disease and hypertension in
patients with impaired glucose tolerance: the STOP-NIDDM
trial. JAMA. 2003;290:486-94.
Three self-assessed daily blood glucose profiles over a 1-week period, including 18 glucose readings before and 2 h after meals, were obtained from 3,284 unselec-ted outpatients with non-insulin-treated type 2 diabetes mellitus attending 500 different diabetes clinics opera-ting throughout Italy. A PPG blood glucose value > 8.89 mmol/l (160 mg/dl) was recorded at least once in 84% of patients, and 81% of patients had at least one deltaglucose (the difference between pre and post-prandial glucose) ≥ 2.22 mmol/l (40 mg/dl). Among patients with apparently good metabolic control, 38% had > 40% of PPG blood glucose readings > 8.89 mmol/l, and 36% had > 40% deltaglucose ≥ 2.22 mmol/l. These results indicate that PPG is a very fre-quent phenomenon in patients with type 2 diabetes me-llitus on active treatment and can occur even when metabolic control is apparently good40.
Therefore, at the present time, given the tendency to rapid variations of hyperglycemia throughout the life of diabetic patients —above all in the postprandial phase—, it is proper to think that this may exert an important influence on the onset of complications. Thus correcting postprandial hyperglycemia should form part of the strategy for the prevention and mana-gement of cardiovascular diseases in diabetes.
Conflict of interest
The author declares he has no conflict of interest.
REFERENCES
1. Ceriello A, Hanefeld M, Leiter L, Monnier L, Moses A, Owens
D, et al. Postprandial glucose regulation and diabetic complica-
tions. Arch Intern Med. 2004;164:2090-5.
2. De Vegt F, Dekker JM, Ruhè HG, Stehouwer CDA, Nijpels
GBLM, Heine RJ. Hyperglycaemia is associated with all-cause
NAD+
1,3-Diphosphoglycerate
NADH
GAFT
Gln Glu
NADH NAD+
Protein kinase C pathway
ACE pathway
Glucose
Glucose-6-P
Fructose-6-P
Glyceraldehyde-3-P
Glucosamine-6-P UDP-GlcNAc
a-Glycerol-P DAG PKCDHAP
Methyglyoxal AGEsO2–GAPDH
Fig. 2. Superoxide formation and its relationship to other key me-chanisms of hyperglycemia-indu-ced damage. From: Brownlee M38.
02 ENDO4 (08-11).indd 1002 ENDO4 (08-11).indd 10 13/11/09 08:44:4813/11/09 08:44:48

Ceriello A. Does postprandial blood glucose matter and why?
Endocrinol Nutr. 2009;56(Supl 4)::8-11 11
12. Zeymer U, Schwarzmaier-D’Assie A, Petzinna D, Chiasson JL;
STOP-NIDDM Trial Research Group. Effect of acarbose treat-
ment on the risk of silent myocardial infarctions in patients with
impaired glucose tolerance: results of the randomised STOP-
NIDDM trial electrocardiography substudy. Eur J Cardiovasc
Prev Rehabil. 2004;11:412-5.
13. Hanefeld M, Chiasson JL, Koehler C, Henkel E, Schaper F, Te-
melkova-Kurktschiev T. Acarbose slows progression of intima-
media thickness of the carotid arteries in subjects with impaired
glucose tolerance. Stroke. 2004;35:1073-8.
14. Hanefeld M, Cagatay M, Petrowitsch T, Neuser D, Petzinna D,
Rupp M. Acarbose reduces the risk for myocardial infarction in
type 2 diabetic patients: meta-analysis of seven long-term stu-
dies. Eur Heart J. 2004;25:10-6.
15. Espósito K, Giugliano D, Nappo F, Marfella R. Regression of
carotid atherosclerosis by control of postprandial hyperglyce-
mia in type 2 diabetes mellitus. Circulation. 2004;29:2978-
84.
16. Ceriello A. Postprandial hyperglycemia and diabetes complica-
tions: is it time to treat? Diabetes. 2005;54:1-7.
17. Ceriello A, Bortolotti N, Motz E, Crescentini A, Lizzio S, Russo
A, et al. Meal-generated oxidative stress in type 2 diabetic pa-
tients. Diabetes Care. 1998;21:1529-33.
18. Ceriello A, Quagliaro L, Catone B, Pascon R, Piazzola M, Bais
B, et al. Role of hyperglycemia in nitrotyrosine postprandial
generation. Diabetes Care. 2002;25:1439-43.
19. Ceriello A, Bortolotti N, Motz E, Pieri C, Marra M, Tonutti L,
et al. Meal-induced oxidative stress and low-density lipoprotein
oxidation in diabetes: the possible role of hyperglycemia. Meta-
bolism. 1999;48:1503-8.
20. Monnier L, Mas E, Ginet C, Michel F, Villon L, Cristol JP, et al.
Activation of oxidative stress by acute glucose fluctuations
compared with sustained chronic hyperglycemia in patients
with type 2 diabetes. JAMA. 2006;295:1681-7.
21. Ceriello A, Taboga C, Tonutti L, Quagliaro L, Piconi L, Bais B,
et al. Evidence for an independent and cumulative effect of pos-
tprandial hypertriglyceridemia and hyperglycemia on endothe-
lial dysfunction and oxidative stress generation: effects of short-
and long-term simvastatin treatment. Circulation. 2002;106:
1211-8.
22. Ceriello A, Quagliaro L, Piconi L, Assaloni R, Da Ros R, Maier
A, et al. Effect of postprandial hypertriglyceridemia and hyper-
glycemia on circulating adhesion molecules and oxidative stress
generation and the possible role of simvastatin treatment. Dia-
betes. 2004;53:701-10.
23. Ceriello A. New insights on oxidative stress and diabetic com-
plications may lead to a “causal” antioxidant therapy. Diabetes
Care. 2003;26:1589-96.
24. Assaloni R, Da Ros R, Quagliaro L, Piconi L, Maier A, Zuodar
G, et al. Effects of S21403 (mitiglinide) on postprandial genera-
tion of oxidative stress and inflammation in type 2 diabetic pa-
tients. Diabetologia. 2005;48:1919-24.
25. Ceriello A, Piconi L, Quagliaro L, Wang Y, Schnabel CA, Ru-
ggles JA, et al. Effects of pramlintide on postprandial glucose
excursions and measures of oxidative stress in patients with type
1 diabetes. Diabetes Care. 2005;28:632-7.
26. Manzella D, Grella R, Abbatecola AM, Paolisso G. Repaglinide
administration improves brachial reactivity in type 2 diabetic
patients. Diabetes Care. 2005;28:366-71.
27. Ceriello A, Cavarape A, Martinelli L, Da Ros R, Marra G, Quaglia-
ro L, et al. The post-prandial state in type 2 diabetes and endothelial
dysfunction: effects of insulin aspart. Diabet Med. 2004;21:171-5.
28. Shimabukuro M, Higa N, Takasu N, Tagawa T, Ueda S. A single
dose of nateglinide improves post-challenge glucose metabo-
lism and endothelial dysfunction in Type 2 diabetic patients.
Diabet Med. 2004;21:983-6.
29. Shimabukuro M, Higa N, Chinen I, Yamakawa K, Takasu N.
Effects of a single administration of acarbose on postprandial
glucose excursion and endothelial dysfunction in type 2 diabetic
patients: a randomized crossover study. J Clin Endocrinol Me-
tab. 2006;91:837-42.
30. Scognamiglio R, Negut C, De Kreutzenberg SV, Tiengo A, Avo-
garo A. Effects of different insulin regimes on postprandial
myocardial perfusion defects in type 2 diabetic patients. Diabe-
tes Care. 2006;29:95-100.
31. Rudofsky G Jr, Reismann P, Schiekofer S, Petrov D, Eynatten
M, Humpert PM, et al. Reduction of postprandial hyperglyce-
mia in patients with type 2 diabetes reduces NF-kappaB activa-
tion in PBMCs. Horm Metab Res. 2004;36:630-8.
32. Taskinen MR, Lahdenpera S, Syvänne M. New insights into li-
pid metabolism in non-insulin-dependent diabetes mellitus. Ann
Med. 1996;28:335-40.
33. Hamsten A, Björkegren J, Boquist S, Nilsson L, Ruotolo G,
Eriksson P, et al. Postprandial lipaemia and coronary heart di-
sease. Atherosclerosis. 1998;11:141-9.
34. Cavallero E, Dachet C, Neufcou D, Wirquin E, Mathe D, Jaco-
tot B. Postprandial amplification of lipoprotein abnormalities in
controlled type II diabetic subjects: relationship to postprandial
lipemia and C-peptide/glucagon levels. Metabolism. 1994;43:
270-8.
35. Heine RJ, Dekker JM. Beyond postprandial hyperglycaemia:
metabolic factors associated with cardiovascular disease. Diabe-
tologia. 2002;45:461-5.
36. De Caterina R. Endothelial dysfunctions: common denomina-
tors in vascular disease. Curr Opin Lipidol. 2000;11:9-23.
37. Bae JH, Bassenge E, Kim KB, Kim YN, Kim KS, Lee HJ, et al.
Hypertriglyceridemia impairs endothelial function by enhanced
oxidant stress. Atherosclerosis. 2001;155:517-23.
38. Brownlee M. Biochemistry and molecular cell biology of diabe-
tic complications. Nature. 2001;414:813-20.
39. Du X, Edelstein D, Obici S, Higham N, Zou MH, Brownlee M.
Insulin resistance reduces arterial prostacyclin synthase and
eNOS activities by increasing endothelial fatty acid oxidation. J Clin Invest. 2006;116:1071-80.
40. Bonora E, Corrao G, Bagnardi V, Ceriello A, Comaschi M,
Montanari P, et al. Prevalence and correlates of post-prandial
hyperglycaemia in a large sample of patients with type 2 diabe-
tes mellitus. Diabetologia. 2006;49:846-54.
02 ENDO4 (08-11).indd 1102 ENDO4 (08-11).indd 11 13/11/09 08:44:4813/11/09 08:44:48

12 Endocrinol Nutr. 2009;56(Supl 4):12-4
Vascular reactivity in diabetes mellitusPARESH DANDONA
Division of Endocrinology and Metabolism. State University of New York at Buffalo. USA. Diabetes-Endocrinology Center of Western New York. Kaleida Health/Millard Fillmore Hospital. Buffalo. New York. USA.
INTRODUCTION
A patient with type 2 diabetes carries a cardiovascular risk simi-lar to that of a non-diabetic with a prior history of myocardial in-farction. Endothelial dysfunction, an early event in the pathogene-sis of atherosclerosis is present in diabetes mellitus in the absence of clinical cardiovascular disease. The assessment of the endothe-lium dependent vasodilatory effect in response to various stimuli known to increase NO (nitric oxide) production is termed vascular reactivity1,2.
Vascular reactivity has been assessed in conduit arteries, fo-rearm resistance vessels capillaries and vein in diabetes. The ce-rebral, myocardial, skeletal muscle, renal, skin and penile blood vessels in type 1 and type 2 diabetes have been shown to have abnormal vascular reactivity. It is possible that impaired vascular reactivity may contribute to the clinical manifestations of cardio-vascular disease, the pathogenesis of nephropathy, diastolic dys-function, foot ulcers and erectile dysfunction in subjects with diabetes mellitus2,3.
MEDIATORS OF VASODILATION
There are two major vasodilators that are secreted by the en-dothelium (fig. 1). Endothelial cells express nitric oxide syntha-se that generates NO in response to a variety of stimuli inclu-ding acetyl-choline, nor-epinephrine and insulin. Glucose suppresses the expression of e-NOS and NO release while insu-lin increases it. Therefore in diabetes the combination of hyper-glycemia, insulin lack and insulin resistance results in diminis-hed NOS expression and secretion and thus to impaired vasodilation1,3.
NO exerts its vasodilatory effect through the stimulation of guan-ylate cyclase, which induces an increase in cGMP (cyclic guanosi-ne monophosphate) which is a vascular smooth muscle relaxant. In diabetes, NOS may undergo alterations due to the binding of N-acetyl glucosamine which prevents the essential serine phos-phorylation necessary for its action. Furthermore, there may be a reduction in the availability of tetrahydro-biopterin necessary for NO to be generated by NOS. THB levels are reduced in diabetes
Diabetes mellitus hoy
Correspondence: Dr. P. Dandona. Diabetes-Endocrinology Center of Western NY. State University of New Jork at Buffalo. Buffalo. New York 14209. USA. E-mail: [email protected]

Dandona P. Vascular reactivity in diabetes mellitus
Endocrinol Nutr. 2009;56(Supl 4):12-4 13
because it is destroyed by oxidative stress. In oxidative stress states, NOS can also cause nitration of prosta-cyclin synthase and impair its ability to generate PGI2 (prostacyclin 2)1,3.
Similarly, there is a diminution in the ability of the endothelium to generate PGI2 in diabetes. This again contributes to an overall pro-constrictor state in diabe-tes. Glucose inhibits PGI2 production by endothelial cells and arteries obtained from animals rendered dia-betic generate less PGI23.
MEDIATORS OF VASOCONSTRICTION
The major vasoconstrictors are norepinephrine, an-giotensin II, endothelin, thromboxane A2 and 5- hydroxyeicosatetraenoic acid. Endothelin –1 is increa-sed in type 2 diabetes mellitus, however vascular response to endothelin is decreased in this disease. In the obese, angiotensinogen secretion is increased since the adipocyte expresses this protein and secretes it. Thus, the basic substrate for angiotensin generation is in excess. Its conversion to angiotensin I and II would thus lead to a proconstrictor state. Angiotensin II can increase free radical generation; impair NO generation and cause smooth muscle contraction. Moreover an-giotensin receptor blockers and ace inhibitors have been associated with improved endothelial function and better cardiovascular outcomes in clinical studies of subjects with type 2 diabetes3.
VASODILATORY EFFECT OF INSULIN: ARTERIAL, VENOUS AND CAPILLARY
The increase in leg and forearm blood flow by insu-lin is NO mediated since this is inhibited by L-NAME, an inhibitor of NOS. The flow enhancing effect of in-sulin is diminished in the obese and in type 2 diabe-tics4. This vascular ‘insulin resistance’ may contribute to metabolic insulin resistance since the availability of macronutrients and insulin to insulin sensitive end or-gans post prandially may be dependent upon an enhan-ced blood flow.
Physiologically relevant concentration of insulin exerts a direct vasodilatory effect in the veins of the dorsum of the hand and the cephalic vein at the wrist in normal subjects5. This vasodilatory effect of insulin is mediated by the NO-cGMP pathway and is impaired in the obese and type 2 diabetics.
Insulin increases endothelial cell NO release and the expression of NOS in human endothelial cells at phy-siologically relevant concentrations. Clearly, the im-pairment of the vasodilatory effect of insulin in type 2 diabetes and obesity is likely to have significant effect on NO release and vasodilatory reserve particularly in the post prandial period when insulin concentrations increase and macronutrients need to be distributed and taken up at the tissue level6.
OXIDATIVE AND INFLAMMATORY STRESS
Oxidative stress reduces the bio-availability of NO since NO binds avidly to the superoxide radical to form peroxynitrate. This is likely to have an effect on vascular reactivity. With oxidative stress following a fast food meal, normal post ischemic vasodilation changes to a markedly impaired one. Elevated plasma free fatty acid concentration induces abnormal vascu-lar reactivity within two hours in association with a marked increase in NADPH oxidase dependent ROS generation. Inflammatory stress is also associated with impaired vascular reactivity. Indeed, there is an inverse relationship between plasma CRP concentra-tion and post ischemic brachial vasodilation. Pro-in-flammatory cytokines like TNFα are known to reduce the expression of NOS in the endothelium and to lead to a reduction in the generation of NO by the endo-thelium1.
RELATIONSHIP OF VASCULAR REACTIVITY WITH ATHEROSCLEROSIS
The positive predictive value of abnormal brachial artery dilation (< 3%) in predicting coronary endothe-lial dysfunction is 95%. FMD% is also predictive of coronary artery disease. Post-ischemic brachial arterial vasodilation is impaired in diabetes and is therefore predictive of cardiovascular events2.
Vasoconstrictors
Endothelial cell
Vascular smooth
muscle cell
Vasodilators
NOPGI2HPF
Arginine Arachidonic acid
eNOS
NO PGI2
Guanylate cyclase
Adenylate cyclase
cAMPcGMP
TXA2FFAs
ROS (O2–)
NESerotonin
Fig. 1. Nitric oxide (NO) and PGI2 (prostacyclin 2) mediated vaso-dilation. The endothelium-dependent NO mediated vasodilation is exerted through the activation of guanylate cyclase and the forma-tion of cGMP (cyclic guanosine monophosphate). PGI2 exerts its effect through the activation of adenyl cyclase and the formation of cAMP which causes the relaxation of VSMC. Adapted from referen-ce 3.

Dandona P. Vascular reactivity in diabetes mellitus
14 Endocrinol Nutr. 2009;56(Supl 4):12-4
Endothelial dysfunction occurs early, can be measured noninvasively and improvement of glycemic control and lowering of cholesterol shown to decrease cardiovascular events in clinical studies have also improved endothelial dysfunction in diabetes and dyslipidemic conditions. This technique could thus be used as an additional marker for assessing the risk of CAD in this population. As endothe-lial function can be impaired by factors other than hyper-glycemia, the choice of antihyperglycemic, antihyperten-sive, lipid lowering therapy and the goals of these therapy could be determined on this assessment.
EFFECTS OF INSULIN AND THIAZOLIDENEDIONE ON VASCULAR REACTIVITY AND ATHEROSCLEROSIS
While the abnormality of post ischemic brachial vaso-dilation is well established, it has also been shown that following thiazolidenedione therapy, there is a restoration towards normality. This reversal occurs over a period of only four weeks and hence the abnormality of vascular reactivity in obesity and type 2 diabetes is not due to a structural change. Thiazolidenediones are known to su-ppress ROS generation and thus to reduce superoxide. In addition, they also exert an anti-inflammatory effect, whi-ch suppresses pro-inflammatory cytokines. Both of these effects are likely to induce an enhancing affect on NO bioavailability and thus to potentially contribute to the im-provement in vascular reactivity3.
Since insulin also exerts a profound suppressive effect on NADPH oxidase dependent superoxide generation and NFkB dependent inflammation, it should be expected to improve post ischemic vasodilatory responses in the obese and type 2 diabetics. While insulin is known to exert a de-finitive vasodilatory effect its ability reverse abnormalities in vascular reactivity in the obese and type 2 diabetics needs to be investigated. The profound ROS suppressive and anti-inflammatory effects of insulin have been demonstrated also in patients with acute myocardial infarction and those undergoing coronary artery bypass grafts6.
CONCLUSIONS
Impaired vascular reactivity by invasive and non-invasive methods has been shown in different vascu-lar beds in type 1 and type 2 diabetes mellitus. It is
probable that impaired vascular reactivity contribu-tes to atherosclerosis and the pathogenesis and prog-nosis of the clinical manifestations of cardiovascular disease like acute coronary syndrome and stroke. It may also play a role in the pathogenesis of diastolic dysfunction, nephropathy, foot ulcers and erectile dysfunction. Resistance to the beneficial vasodila-tory effects of insulin and increased reactive oxygen species generation due to various factors are proba-bly responsible for the decreased bioavailability of NO and impaired vascular reactivity seen in diabe-tes. Improved glycemic control, insulin sensitizers, HMG CoA reductase inhibitors, fibric acid derivati-ves, ACE inhibitors and angiotensin receptor bloc-kers, improve endothelial function and have also improved cardiovascular outcomes in clinical stu-dies. Non-invasive assessment of vascular reactivity can thus be used, as a surrogate marker of coronary endothelial dysfunction, is reproducible and could reflect a treatment benefit if an intervention impro-ves brachial dilatation.
Conflict of interest
The author declares he is supported by:– Department of Citrus, State of Florida.– NIH - R01DK069805-02; RO-1DK.– NIH - 1 R01 DK075877-01A2.– American Diabetes Association- Award No: 7-
08-CR-13.
REFERENCES
1. Dandona P. Endothelium, inflammation, and diabetes. Curr Diab Rep. 2002;2:311-5.
2. Chaudhuri A. Vascular reactivity in diabetes mellitus. Curr Diab Rep. 2002;2:305-10.
3. Dandona P, Aljada A, Chaudhuri A. Vascular reactivity and thia-zolidinediones. Am J Med. 2003;115 Suppl 8A:81S-6S.
4. Steinberg HO, Chaker H, Leaming R, Johnson A, Brechtel G, Baron AD. Obesity/insulin resistance is associated with endothe-lial dysfunction. Implications for the syndrome of insulin resis-tance. J Clin Invest. 1996;97:2601-10.
5. Grover A, Padginton C, Wilson MF, Sung BH, Izzo JL Jr, Dan-dona P. Insulin attenuates norepinephrine-induced venoconstric-tion. An ultrasonographic study. Hypertension. 1995;25:779-84.
6. Dandona P, Chaudhuri A, Ghanim H, Mohanty P. Effect of hy-perglycemia and insulin in acute coronary syndromes. Am J Car-diol. 2007;99:12H-8H.
Endocrinol Nutr. 2009;56(Supl 4):15-7 15
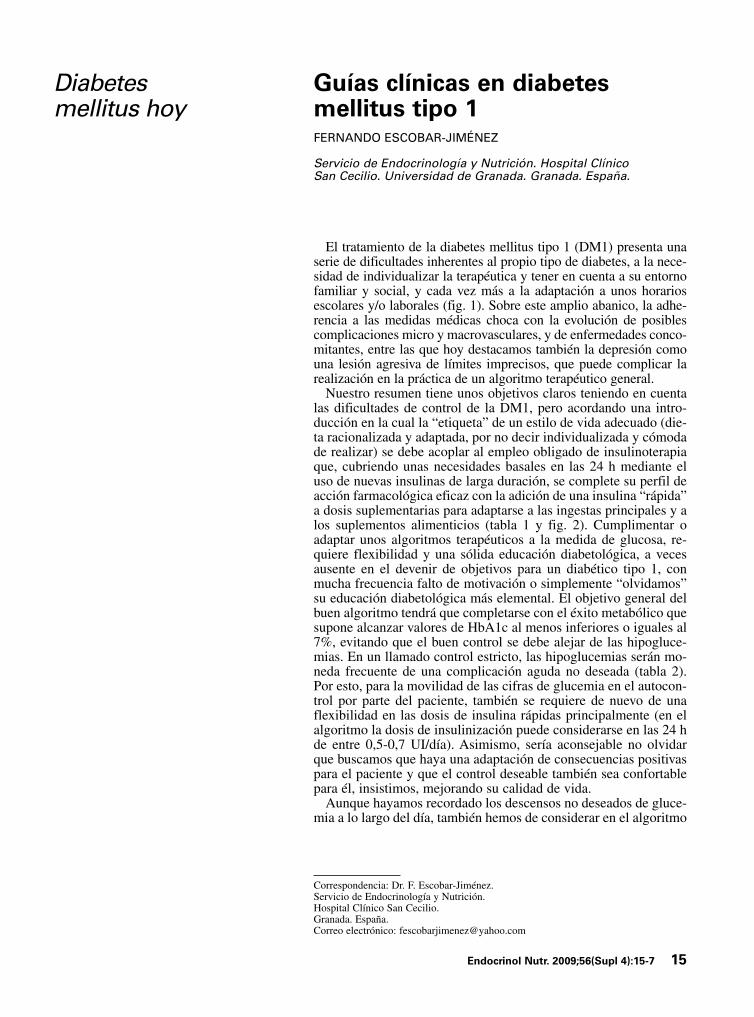
Guías clínicas en diabetes mellitus tipo 1FERNANDO ESCOBAR-JIMÉNEZ
Servicio de Endocrinología y Nutrición. Hospital Clínico San Cecilio. Universidad de Granada. Granada. España.
El tratamiento de la diabetes mellitus tipo 1 (DM1) presenta una serie de dificultades inherentes al propio tipo de diabetes, a la nece-sidad de individualizar la terapéutica y tener en cuenta a su entorno familiar y social, y cada vez más a la adaptación a unos horarios escolares y/o laborales (fig. 1). Sobre este amplio abanico, la adhe-rencia a las medidas médicas choca con la evolución de posibles complicaciones micro y macrovasculares, y de enfermedades conco-mitantes, entre las que hoy destacamos también la depresión como una lesión agresiva de límites imprecisos, que puede complicar la realización en la práctica de un algoritmo terapéutico general.
Nuestro resumen tiene unos objetivos claros teniendo en cuenta las dificultades de control de la DM1, pero acordando una intro-ducción en la cual la “etiqueta” de un estilo de vida adecuado (die-ta racionalizada y adaptada, por no decir individualizada y cómoda de realizar) se debe acoplar al empleo obligado de insulinoterapia que, cubriendo unas necesidades basales en las 24 h mediante el uso de nuevas insulinas de larga duración, se complete su perfil de acción farmacológica eficaz con la adición de una insulina “rápida” a dosis suplementarias para adaptarse a las ingestas principales y a los suplementos alimenticios (tabla 1 y fig. 2). Cumplimentar o adaptar unos algoritmos terapéuticos a la medida de glucosa, re-quiere flexibilidad y una sólida educación diabetológica, a veces ausente en el devenir de objetivos para un diabético tipo 1, con mucha frecuencia falto de motivación o simplemente “olvidamos” su educación diabetológica más elemental. El objetivo general del buen algoritmo tendrá que completarse con el éxito metabólico que supone alcanzar valores de HbA1c al menos inferiores o iguales al 7%, evitando que el buen control se debe alejar de las hipogluce-mias. En un llamado control estricto, las hipoglucemias serán mo-neda frecuente de una complicación aguda no deseada (tabla 2). Por esto, para la movilidad de las cifras de glucemia en el autocon-trol por parte del paciente, también se requiere de nuevo de una flexibilidad en las dosis de insulina rápidas principalmente (en el algoritmo la dosis de insulinización puede considerarse en las 24 h de entre 0,5-0,7 UI/día). Asimismo, sería aconsejable no olvidar que buscamos que haya una adaptación de consecuencias positivas para el paciente y que el control deseable también sea confortable para él, insistimos, mejorando su calidad de vida.
Aunque hayamos recordado los descensos no deseados de gluce-mia a lo largo del día, también hemos de considerar en el algoritmo
Diabetes mellitus hoy
Correspondencia: Dr. F. Escobar-Jiménez.Servicio de Endocrinología y Nutrición. Hospital Clínico San Cecilio. Granada. España.Correo electrónico: [email protected]
04 ENDO4 (15-17).indd 1504 ENDO4 (15-17).indd 15 13/11/09 08:47:3913/11/09 08:47:39

Escobar-Jiménez F. Guías clínicas en diabetes mellitus tipo 1
16 Endocrinol Nutr. 2009;56(Supl 4):15-7
recomendado para la DM1 las complicaciones agudas por glucemias progresivamente elevadas, la omisión de dosis de insulina, las infecciones no controladas, etc., que conducen a la presentación de situaciones de preco-ma diabético-acidosis o que rayan en sus límites, natu-ralmente muy peligrosos, así como la presentación no tan infrecuente de comas cetoacidóticos, en la que se rompe un círculo de estabilidad con el que no se contaba ni se deseaba en el cumplimiento general de un algorit-mo para un buen control metabólico.
Por tanto, en el esquema de considerandos que puede ofrecer de la figura 1, también se resumen las conside-raciones generales que recogen un amplio escenario para llegar a un consenso de trabajo que, por ahora, no se puede ofrecer tan minucioso en la DM1 como lo que le exigimos a un algoritmo completo. Por esto, ya seña-
lábamos anteriormente en el desarrollo de la figura 2, el variado pero ordenado potencial terapéutico que abarca en este seminario el tratamiento englobado, desde la dieta a la insulinoterapia, y hacia unos objetivos de intercambio entre insulina intermedia (“protami-na más rápida”) con “rápidas” preprandiales, o bien el empleo frecuente en la práctica de especialistas actual-mente derivado del uso de una insulina tipo glargina, que cubriendo prácticamente las 24 h, permita la intro-ducción de una insulina tipo lispro, o una aspartato o una glulisina (posiblemente la más “corta” en su espec-tro biológico-clínico), como simulación fisiológica de una insulinización continuada para las 24 h del día de un diabético.
Los algoritmos que las distintas sociedades aconse-jan para las cifras de glucosa (fig. 2) son muy varia-bles, deben de adaptarse individualmente con flexibili-dad “inteligente” y buscar evitar las hipoglucemias, repetimos, debe ser un requisito importante, y como decíamos, llegando a ese valor deseable de HbA1c < 7% como meta final e ideal para el binomio paciente-especialista. La ganancia de peso debe vigilarse en la insulinoterapia y, por esto, el fallo de las guías, que cuesta que se acerquen a la vez a una individualización del tratamiento según algunos, más que el deseo y ten-tación de ejercer como “glucemiólogos” que cada vez se presenta como un defecto general olvidando que el control de la DM1 es algo más que una cifra de gluce-mia puntual. La American Diabetes Association alerta de otras importantes recomendaciones, que no algorit-
Según la edad y el comienzo de la enfermedad
Según la actividad escolar y la motivación
Según el medio laboral y familiar
Coincidencia con las complicaciones estudiadas y tratadas precozmente
Y así añadimos:– El medio hospitalario– El deporte, o las salidas– Los viajes– Las enfermedades intercurrentes
Fig. 1. Consideraciones generales en el entorno terapéutico para la insulini-zación en la diabetes mellitus tipo 1.
TABLA 1. Recomendaciones generales para la insulinoterapia que se debe acercar a la individualización
Dieta variada, horarios, suplementosEjercicio “no asfixiante y adaptable”Insulinas premezcladas Insulinas con más de 12 a 24 h de acción efectiva Intercalar insulinas “rápidas” para simular los “picos”
prandialesBuscar una conducta clínica que se acerque a la fisiológica: “rápidas” pre o postalimento y secreción basal continuaEvitar las posibles hipoglucemias, pero estabilizando la HbA1c y la calidad de vida
*2:00-4:00 h si se sospecha hipoglucemia nocturna.
TABLA 2. Guía de consejo y movilidad de los límites del autocontrol para el paciente y de vigilancia por el especialista
Objetivos Sincronización
Ayuno 80-120 md/dl (…> 70 y < 100) Comprobar durante una marcha para evaluar la insulina basalAntes de la comida 70-130 mg/dl Comprobar antes de cada comida para evaluar la dosis en boloMáximo tras comida < 180 mg/dl Comprobar 2 h después de una comida para confirmar el bolo correcto22:00-6:00 h 80-120 mg/dl (madrugada > 70) Comprobar a la hora de acostarse o de madrugada para realizar ajustes
a la insulina basal*
04 ENDO4 (15-17).indd 1604 ENDO4 (15-17).indd 16 13/11/09 08:47:3913/11/09 08:47:39

Escobar-Jiménez F. Guías clínicas en diabetes mellitus tipo 1
Endocrinol Nutr. 2009;56(Supl 4):15-7 17
mos, acerca de la atención y cuidados hacia niños y adolescentes diabéticos escolarizados. De nuevo, el cambio de estilo de vida y trabajo escolar debe adap-tarse con individualizaciones que mantengan el control metabólico y atiendan a la constante educación diabe-tológica, en la difícil integración de estos pacientes hacia una casi normalización de calidad en el trata-miento global.
Educación diabetológica, repetimos, y el no aislacio-nismo, pueden contrarrestar con hiperglucemias man-tenidas, abandonos de pautas y dosis aconsejadas y mayor frecuencia de las situaciones de cetoacidosis, por otra parte no deseadas, que hoy son cada vez más frecuentes en nuestros sistemas hospitalarios de urgen-cias. Marcados por una insulinización intensiva, que no agresiva, se sucede en la evolución clínica con la aparición de complicaciones micro y macrovasculares de curso progresivo (estudio EDIT). Aunque en este seminario no hayamos considerado a este tipo tan es-pecial de paciente, él se encuentra como muy cercano y en muchas de las fases de lesión a nivel de microan-giopatía que podrían ser objetivo terapéutico para una remisión real.
Las dificultades de un algoritmo universal para el tratamiento de la DM1, es un hecho real y de difícil ejecución por profesionales y sociedades científicas. El trabajo y la formación práctica de especialistas en el tratamiento de la DM1 considerarán grandes líneas de actuación con los pacientes, pero la individualización dificultará esa norma que muchas veces queremos abarcar en el llamado concepto del algoritmo.
Diagnósticode DM tipo 1
Mezclas de intermedia y rápidas Rápidas y muy rápidasBasales
“Autocontroles no dramáticos”
Refuerzo asistencial ambulatorio continuado 15... 30 días... más
Educación diabetológica a diabéticos y a padres
Insulinación precozAproximación: 0,5-0,7 Ul/día
Fundamentos de la dieta,ejercicio y ordenación delestilo de vida y adaptación
Fig. 2. Esquema general de aproxima-ción terapéutica práctica a la insulini-zación. DM: diabetes mellitus.
Conflicto de intereses
El autor declara no tener ningún conflicto de intere-ses.
BIBLIOGRAFÍA RECOMENDADA
American Diabetes Association. Position Statement. Diabetes care
in the school and day care settings. Diabetes Care. 2009;32:S68-
72.
American Diabetes Association. Position Statement. Insulin admi-
nistration. Diabetes Care. 2004;27:S106-7.
American Diabetes Association. Position Statement. List of Posi-
tion Statements. Diabetes Care. 2009;32:S98.
Eisenbarth GS. Update on type 1 diabetes. J Clin Endocrinol Metab.
2007;92:2403-7
Pickup JC, Renard E. Long-acting insulin analogs versus insulin
pump therapy for the treatment of type 1 and type 2 diabetes.
Diabetes Care. 2008;31:S140-5.
Skrodeniené E, Marciulionyté D, Padaiga Z, Jasinskiene E, Sadaus-
kaitè-Kuehne V, Ludvigsson J. Evironmental risk factors in predic-
tion of childhood prediabetes. Medicina (Kaunas). 2008;44:56-
63.
Tamas G, Marre M, Astorga R, Dedow I, Jacobsen J, Lindholm A.
Glycaemic control in type 1 diabetic patients using optimized
insulin aspart or human insulin in a ramdomized multinational
study. Diab Res Clin Pract. 2001;54:105-14.
Van den Berghe G, Wilmer A, Hermans G, Meersseman W, Wouters
PJ, Milants I, et al. Intensive insulin therapy in the medical ICU.
N Engl J Med. 2006;354:449-61.
White NH, Skor DA, Cryer PE, Levandosky L, Bier DM, Santiago
JV. Identification of type I diabetic patients at increased risk for
hypoglycemia during intensive therapy. N Engl J Med. 1983;
308:485-9.
04 ENDO4 (15-17).indd 1704 ENDO4 (15-17).indd 17 13/11/09 08:47:3913/11/09 08:47:39

18 Endocrinol Nutr. 2009;56(Supl 4):18-20
The kidney in type 2 diabetes: focus on renal structureMICHELE DALLA VESTRAa, MARCO ARBOITb, MARINO BRUSEGHINb AND PAOLA FIORETTOb
aHospital of Cittadella. Italy.bDepartment of Medical and Surgical Sciences. University of Padova. Italy.
INTRODUCTION
The renal lesions underlying renal dysfunction are different in type 2 and type 1 diabetes. Renal structure is heterogeneous in type 2 diabetic patients, with only a subset presenting typical diabetic glo-merulopathy, as in type 1 diabetes. The remaining patient have more advanced tubulo-interstitial and vascular than glomerular lesions, or normal/near normal renal structure. The clinical manifestations of diabetic nephropathy are significantly related with glomerular struc-tural changes, especially with the degree of mesangial expansion; however these relationships are less precise than in patients with type 1 diabetes. Probably several other important structural changes are involved, including tubular, interstitial and vascular lesions. Indeed, in the last years, changes in the structure and number of podocytes have been demonstrated to be involved in the pathogenesis of diabe-tic nephropathy; recently is emerging that also proximal tubular structural abnormalities might contribute to increasing albuminuria in type 2 diabetic patients. This review summarizes the renal structu-ral abnormalities and the structural–functional relationships in type 2, compared to type 1, diabetic patients.
RENAL LESIONS IN DIABETES
The majority of studies on renal structure in diabetes have been performed in patients with type 1 diabetes, and assumptions have been made that renal pathology in type 2 diabetes is the same as in type 1 diabetes. However, renal lesions in type 2 diabetes are much more complex. In type 1 diabetic patients, glomerulopathy is cha-racterised by thickening of glomerular basement membrane (GBM) and mesangial expansion, leading to a progressive reduction in the filtration surface of the glomerulus1,2. Although the most important structural changes occur in the glomeruli1,2, concomitantly the arte-rioles, tubules and interstitium also develop morphological lesio-ns3. These extraglomerular lesions usually become severe only in presence of advanced glomerulopathy, typically in patients with overt proteinuria and/or decreasing glomerular filtration rate (GFR).
Diabetes mellitus hoy
Correspondence: Dra. P. Fioretto.Department of Medical and Surgical Sciences. Clinica Medica I.Via Giustiniani, 2. 35128 Padova. Italy.University of Padova. Italy.E-mail: [email protected]
05 ENDO4 (18-20).indd 1805 ENDO4 (18-20).indd 18 13/11/09 08:50:4813/11/09 08:50:48

Dalla Vestra M et al. The kidney in type 2 diabetes: focus on renal structure
Endocrinol Nutr. 2009;56(Supl 4):18-20 19
Studies of the relationships between structural and functional parameters have demonstrated that the cri-tical lesion of diabetic nephropathy, leading to pro-gressive loss of renal function, is mesangial expan-sion1. However, in advanced stages of the disease, interstitial, tubular and glomerulo-tubular junction in-juries drive the progression towards ESRD4. In con-trast with type 1 diabetes, in type 2 diabetic patients we have described marked heterogeneity in renal structure. Indeed, only a minority had histopathologi-cal patterns resembling those typically present in type 1 diabetes. The remaining had very mild or absent diabetic glomerulopathy, with or without tubulo-in-terstitial, arteriolar and global glomerulosclerosis changes. Based on these findings we proposed a clas-sification system that included three major catego-ries4:
– Category I: normal or near-normal renal structure. These patients (30% of those with microalbuminuria and 10% of those with proteinuria) had biopsies that were normal or showed very mild lesions.
– Category II: typical diabetic nephropathology. These patients (30% of those with microalbuminuria and 50% of those with proteinuria) had established dia-betic lesions with an approximately balanced severi-ty of glomerular, tubulo-interstitial and arteriolar changes. This picture is typical of that seen in type 1 diabetes.
– Category III: atypical patterns of renal injury. These patients (40% of those with microalbuminuria and proteinuria) had relatively mild glomerular diabetic changes considering the disproportionately severe changes in other renal structures, including tubular atrophy, TBM thickening and reduplication, intersti-tial fibrosis, advanced glomerular arteriolar hyalino-sis commonly associated with atherosclerosis of lar-ger vessels, and global glomerular sclerosis.
Thus, the renal lesions leading to renal dysfunction differ in type 2 and type 1 diabetes. It is possible that the heterogeneity in renal structure might reflect the hetero-geneous nature of type 2 diabetes itself. Interestingly, all patients with ‘typical’ (category II) lesions had diabetic retinopathy (50% background, 50% proliferative). In contrast, none of the patients in categories I and III had proliferative retinopathy, and background retinopathy was observed only in 50% of category I and 57% of category III patients4. This suggests the possibility that the different underlying pathophysiological mechanisms responsible for type 2 diabetes in these groups of pa-tients may also underlie different renal and retinal pa-thophysiological mechanisms or responses. Moreover the tubulo-interstitial and vascular changes are likely to be related not only to hyperglycaemia, but also to age-ing, atherosclerosis and systemic hypertension, which often pre-dates the onset of type 2 diabetes. This hetero-geneity in renal structure affects renal prognosis, as pa-tients with typical DN (category II) have a faster GFR
decline than patients with very mild glomerulopathy, with or without tubulo-interstitial and vascular lesions (categories I and III)5.
Moreover a significant prevalence of non-diabetic renal lesions in proteinuric type 2 diabetic patients has been reported. Indeed it has been described that a sig-nificant proportion of type 2 diabetic patients with ne-phropathy has a variety of glomerulopathy including minimal change nephropathy, IgA nephropathy, chro-nic glomerulonephritis and mesangial proliferative glomerulonephritis alone or superimposed to diabetic structural abnormalities.
STRUCTURAL-FUNCTIONAL RELATIONSHIPS
The data on structural–functional relationships in type 2 diabetes based on quantitative morphometric analysis are less abundant than in type 1 diabetes. In Japanese type 2 diabetic patients, morphometric mea-sures of diabetic glomerulopathy showed correlations with renal functional parameters similar to those ob-served in type 1 diabetes6. Similar structural–functio-nal relationships have also been reported by White et al7 in a small number of white diabetic individuals with overt nephropathy. In this latter study, creatinine clea-rance was correlated with both mesangial and intersti-tial expansion, suggesting an important role of intersti-tial lesions in determining loss of renal function in patients with advanced DN. These findings differ from those of a previous study by Osterby et al8 on type 2 diabetic patients with overt nephropathy, in which a great variability in glomerular injury has been reported and the authors outlined that type 2 diabetic patients tended to have less marked glomerular changes than type 1 with similar renal function. We have analysed research kidney biopsy samples, obtained from a large group of type 2 diabetic patients, using electron mi-croscopic morphometric analysis, and found that the degree of glomerular structural lesions increased with increasing albuminuria. However, several patients, des-pite persistent microalbuminuria or proteinuria, had normal glomerular structure. The relationships bet-ween renal function and glomerular structural varia-bles were significant, but less precise than in patients with type 1 diabetes; interestingly the rate of GFR de-cline was significantly correlated with the severity of diabetic glomerulopathy lesions in a large cohort of type 2 diabetic patients, who underwent precise GFR determinations over a follow-up period of 4 years9. Thus, renal lesions different from those typical of dia-betic glomerulopathy should be considered when in-vestigating the nature of an abnormal AER in type 2 diabetes. These lesions include changes in the structure of renal tubules, interstitium, arterioles and, within the glomeruli, podocytes. Pima Indians with type 2 diabe-tes and proteinuria have fewer podocytes per glomeru-lus than those without nephropathy10. Also, over a
05 ENDO4 (18-20).indd 1905 ENDO4 (18-20).indd 19 13/11/09 08:50:4913/11/09 08:50:49

Dalla Vestra M et al. The kidney in type 2 diabetes: focus on renal structure
20 Endocrinol Nutr. 2009;56(Supl 4):18-20
4 year follow-up period, a lower number of podocytes per glomerulus at baseline was the strongest predictor of greater increases in AER and a higher risk of progre-ssion to overt nephropathy in microalbuminuric pa-tients11. These observations suggest that podocyte loss is important in the progression to overt nephropathy, rather than in its genesis and early development. In a large cohort of type 2 diabetic patients with AER va-lues ranging from normoalbuminuria to proteinuria12, we described that the density of podocytes per glo-merulus was significantly decreased in all diabetic pa-tients compared with controls, and it was lower in mi-croalbuminuric and proteinuric patients than in normoalbuminuric patients. The absolute number of podocytes per glomerulus was also lower in microalbu-minuric and proteinuric patients compared with con-trols; however, only the density was significantly and inversely correlated with AER. In addition, microalbu-minuric and proteinuric patients had increased foot process width compared with normoalbuminuric pa-tients, and this was directly related to AER. These re-sults suggest that, in white type 2 diabetic patients, changes in podocyte structure and density occur in the early stages of DN and might contribute to increasing albuminuria in these patients. Moreover, podocyte structural changes could in part explain abnormal albu-minuria in patients without diabetic glomerulopathy. Podocytes probably have a limited capacity for replica-tion, such that when they are lost they cannot be easily replaced by new cells. Thus, the loss of podocytes, to-gether with the increase in glomerular volume caused by diabetes, necessarily requires the residual cells to cover a larger area of GBM. This could cause foot pro-cess widening and detachment, resulting in bare GBM areas with consequent proteinuria. Moreover, these areas of detachment could initiate adhesions and be potential starting points for abnormalities in glomeru-lo-tubular junctions and focal or global glomerular sclerosis. Recently we also analyzed the proximal tu-bular basement membrane width (TBM width) and the degree of interstitial expansion [Vv(Int/cortex)] in a group of type 2 diabetic patients. Preliminary, unpu-blished data suggested that, as in type 1 diabetes, TBM thickening is present in type 2 diabetic patients and probably plays a role in the pathogenesis of AER. Vv(Int/cortex) was not related to renal functional para-meters. Different courses of renal function in type 2 diabetic patients are probably related to different pat-terns of renal structural abnormalities, and these diffe-
rent renal lesions might have different impacts on AER and GFR.
Conflict of interest
The authors declare they have no conflict of in-terest.
REFERENCES
1. Mauer SM, Steffes MW, Ellis EN, Sutherland DE, Brown DM,
Goetz FC. Structural functional relationships in diabetic ne-
phropathy. J Clin Invest. 1984;74:1143-55.
2. Fioretto P, Mauer M. Histopathology of diabetic nephropathy.
Semin Nephrol. 2007;27:195-207.
3. Mauer M, Fioretto P, Woredekal Y, Friedman E. Diabetic nephro-
pathy. In: Schrier RW, editor. Disease of the kidney and urinary
tract, Philadelphia: Lippincott Williams and Wilkins; 2001. p.
2083-127.
4. Najafian B, Crosson JT, Kim Y, Mauer M. Glomerulotubular
junction abnormalities are associated with proteinuria in type 1
diabetes. J Am Soc Nephrol. 2006;17:S53-60.
5. Fioretto P, Mauer M, Brocco E, Velussi M, Frigato F, Muollo B,
et al. Patterns of renal injury in type 2 (non-insulin dependent)
diabetic patients with microalbuminuria. Diabetologia. 1996;39:
1569-76.
6. Hayashi H, Karasawa R, Inn H, Saitou T, Ueno M, Nishi S, et
al. An electron microscopic study of glomeruli in Japanese pa-
tients with non-insulin dependent diabetes mellitus. Kidney Int.
1992;41:749-57.
7. White KE, Bilous RW. Type 2 diabetic patients with nephropa-
thy show structural-functional relationships that are similar to
type 1 disease. J Am Soc Nephrol. 2000;11:1667-73.
8. Østerby R, Gall MA, Schmitz A, Nielsen FS, Nyberg G, Parving
HH. Glomerular structure and function in proteinuric type 2
(non insulin dependent) diabetic patients. Diabetologia. 1993;36:
1064-70.
9. Nosadini R, Velussi M, Brocco E, Bruseghin M, Abaterusso C,
Saller A, et al. Course of renal function in type 2 diabetic pa-
tients with abnormalities of albumin excretion rate. Diabetes.
2000;49:476-84.
10. Pagtalunan ME, Miller PL, Jumping-Eagle S, Nelson RG,
Myers BD, Rennke HG, et al Podocyte loss and progressive
glomerular injury in type 2 diabetes. J Clin Invest. 1997;99:342-
8.
11. Meyer TW, Bennett PH, Nelson RG. Podocyte number predicts
long-term urinary albumin excretion in Pima Indians with type
II diabetes and microalbuminuria. Diabetologia. 1999;42:1341-
4.
12. Dalla Vestra M, Masiero A, Roiter AM, Saller A, Crepaldi G, Fio-
retto P. Is podocyte injury relevant in diabetic nephropathy? Stu-
dies in patients with type 2 diabetes. Diabetes. 2003;52:1031-5.
05 ENDO4 (18-20).indd 2005 ENDO4 (18-20).indd 20 13/11/09 08:50:4913/11/09 08:50:49

Endocrinol Nutr. 2009;56(Supl 4):21-5 21
Novel genetic findings applied to the clinic in type 2 diabetesJOSE C. FLOREZ
Center for Human Genetic Research and Diabetes Center (Diabetes Unit). Massachusetts General Hospital. Program in Medical and Population Genetics. Broad Institute. Department of Medicine. Harvard Medical School. USA.
Genome-wide association studies (GWAS) have both validated known loci and introduced several novel type 2 diabetes genes (ta-ble 1; fig. 1). Interestingly, many of the newly discovered variants appear to influence insulin secretion rather than insulin resistance1. This rapid pace of novel discoveries can elicit a variety of different reactions. By addressing the various questions that arise. I will at-tempt to place these findings in the appropriate context.
The skeptic may argue that “we have not learned anything new”. Nothing is further from the truth: most of the loci uncovered by GWAS were not in any investigator’s short list of candidate genes, and thus these results have opened new pathways of physiological investigation. Furthermore, areas of the genome of unknown func-tion (e.g. so-called “gene deserts”) have been unquestionably asso-ciated with a higher risk of disease, challenging molecular biolo-gists to determine how such genomic regions can have functional effects at the level of the organism. An intriguing link between diabetes and cancer has emerged, where an allele that increases risk of prostate cancer protects from diabetes and vice versa2, possibly implicating cellular proliferation in the pathogenesis of both disea-ses3. Finally, genetic associations have also provided a potential molecular basis for epidemiological observations, as illustrated by the putative involvement of circadian genes in glycemic regula-tion4-6.
The absolutist may conclude that “all of the genetic contribution to type 2 diabetes leads to β-cell dysfunction”. While it is true that the heritability of insulin resistance measures is generally lower than that of insulin secretion measures, the former still display a sizeable heritable component7. Loci discovered via GWAS of type 2 diabetes as a categorical trait are sensitive to study design: when such scans deliberately focus on enrolling leaner cases so as to find genes that cause type 2 diabetes without the mediation of obesity8,9, their ability to detect genes that increase insulin resistance via adi-posity is impaired. Thus, GWAS that intend to discover insulin re-sistance genes must be designed with that goal in mind, either ac-counting for the effect of obesity or searching for insulin resistance as a quantitative trait in population cohorts that display enough of a variance in this phenotype1. It is also possible that the genetic architecture of insulin resistance may differ from that of β-cell function, that our current genotyping arrays do not cover the rele-
Diabetes mellitus hoy
Correspondence: Dr. J.C. Florez.Simches Research Center.CPZN 5250 Massachusetts General Hospital 185.Cambridge Street. Boston, MA 02114. USA.E-mail: [email protected]
06 ENDO4 (21-25).indd 2106 ENDO4 (21-25).indd 21 13/11/09 08:52:4613/11/09 08:52:46

Florez JC. Novel genetic findings applied to the clinic in type 2 diabetes
22 Endocrinol Nutr. 2009;56(Supl 4):21-5
vant variants, or that our measures of insulin resistance in population samples are too crude to reflect insulin action at the tissue level.
The impatient may declare that “most of the genetic basis of type 2 diabetes has been explained”, and urge policy makers to devote resources to alternative research directions. However, the current working list of convin-cing type 2 diabetes loci may explain as little as 5-10% of the genetic basis of type 2 diabetes. Furthermore, the variants found to date merely flag areas of the geno-me—which can be very far away from known genes—that appear overrepresented in disease versus health: while they may be statistically correlated with the true causal SNP (single nucleotide polymorphism) they do not necessarily play a functional role themselves. Thus, fine-mapping and molecular studies are needed before the true contribution of these loci to type 2 diabetes can be assessed accurately. Moreover, the genotyping arrays utilized thus far do a poor job of assaying structural va-riants (e.g. copy number polymorphisms such as dele-tions and duplications), do not capture rare variants, and in the best case scenario only cover 80% of common SNPs in the European genome (with a lower percentage
of covered regions in the more diverse African popula-tion)10. In sum, the genetic basis of type 2 diabetes re-mains largely unexplored, and significant gaps must yet be filled.
The cynic may state that “larger and larger sample sizes are just going to uncover smaller and smaller effects”. Indeed, higher numbers do raise statistical power; but the power to detect the genetic associations discovered so far was also quite low in the studies pu-blished to this point. That is to say, if a study only has 10% power to detect an effect size of 20% for a given allele frequency, then larger samples will typically dis-cover many more polymorphisms that increase diabe-tes risk by the very same odds ratio. As an illustration of this phenomenon, the DIAGRAM Consortium, comprising approximately 10,000 samples of Euro-pean descent, constitutes the largest discovery panel in type 2 diabetes published to date11. That sample size had nearly 100% power to identify genetic variants that increase type 2 diabetes risk by 40%, but much lower power for effect sizes of the modest magnitude (odds ratio: 1.1-1.2) that seem to underlie type 2 diabe-tes.
TABLE 1. Genetic variants associated with type 2 diabetes at genome-wide levels of statistical signicance, ordered by chromosome (Chr)
Marker Chr Description Gene region Function Risk Odds P Reference allele ratio value
rs10923931 1 Intronic NOTCH2 Transmembrane receptor T 1.13 4.1 × 10⁻⁸ 11 implicated in pancreatic organogenesisrs7578597 2 Missense: T1187A THADA Thyroid adenoma; T 1.15 1.1 × 10⁻⁹ 11 associates with PPARrs4607103 3 38 kb upstream ADAMTS9 Secreted metalloprotease C 1.09 1.2 × 10⁻⁸ 11 expressed in musle and pancreasrs4402960 3 Intronic IGF2BP2 Growth factor binding protein; T 1.14 8.9 × 10⁻¹⁶ 28 pancreatic developmentrs1801282 3 Missense: P12A PPARG Transcription factor involved C 1.19 1.5 × 10⁻⁷ 29 in adipocyte developmentrs10010131 4 Intron-exon junction WFS1 Endoplasmic reti culum G 1.15 4.5 × 10⁻⁵ 28 transmembrane proteinrs7754840 6 Intronic CDKAL1 Homologous to CDK5RAP1, CDK5 C 1.12 4.1 × 10⁻¹¹ 28 inhibitor; islet glucotoxicity sensorrs864745 7 Intronic JAZF1 Transcriptional repressor; T 1.10 5.0 × 10⁻¹⁴ 11 associated with prostate cancerrs13266634 8 Missense: R325W SLC30A8 β-cell zinc transporter ZnT8; insulin C 1.12 5.3 × 10⁻⁸ 28 storage and secretionrs10811661 9 125 kb upstream CDKN2A/B Cyclin-dependent kinase inhibitor T 1.20 7.8 × 10⁻¹⁵ 28 and p15 tumor suppressor; islet developmentrs12779790 10 Intergenic region CDC123- Cell cycle/protein kinase G 1.11 1.2 × 10⁻¹⁰ 11 CAMK1Drs7903146 10 Intronic TCF7L2 Transcription factor; transactivates T 1.37 1.0 × 10–48 30 proglucagon and insulin genesrs1111875 10 7.7 kb downstream HHEX Transcription factor involved C 1.13 5.7 × 10⁻¹⁰ 28 in pancreatic developmentrs5219 11 Missense: E23K KCNJ11 Kir6.2 potassium channel; T 1.14 6.7 × 10⁻¹¹ 31 risk allele impairs insulin secretionrs2237892 11 Intronic KCNQ1 Encodes the pore-forming α subunit C 1.42 2.5 × 10–40 32 of IKsK
+ channelrs7961581 12 Intronic TSPAN8- Cell surface glycoprotein C 1.09 1.1 × 10⁻⁹ 11 LGR5 implicated in GI cancersrs8050136 16 Intronic FTO Alters BMI in general population A 1.17 1 × 10–12 28rs757210 17 Intronic HNF1B Transcription factor involved A 1.12 5 × 10⁻⁶ 28 in pancreatic development
06 ENDO4 (21-25).indd 2206 ENDO4 (21-25).indd 22 13/11/09 08:52:4613/11/09 08:52:46

Florez JC. Novel genetic findings applied to the clinic in type 2 diabetes
Endocrinol Nutr. 2009;56(Supl 4):21-5 23
The pessimist may announce, “these genetic effects are so small that they cannot possibly be clinically re-levant”. Here, it should be noted that effect sizes com-puted as allele frequency differences between cases and controls say nothing about biological or clinical relevance. The evolutionary constraints imposed by na-tural selection may be expected to prevent strongly de-leterious mutations from rising to high frequencies in the population; but genetic variants that have modest effects on human physiology may indeed shed light on specific molecules or pathways which could be targe-ted for therapeutic intervention. This concept is illus-trated by two polymorphisms of very modest effects (PPARG P12A and KCNJ11 E23K) which lie in genes that encode targets for routine anti-diabetic medicatio-ns, thiazolidinediones and sulfonylureas respectively. In another relevant example, a polymorphism in the gene that encodes HMG-CoA (3-hydroxy-3 methyl-glutaryl coenzyme A) reductase explains a small pro-portion of the variance in LDL-cholesterol12; but this minor effect does not imply that HMG-CoA reductase is not an adequate target for LDL-cholesterol lowering, and suggests that this validated target for statin therapy would have been identified by GWAS even if nothing had been known about its mode of action.
The optimist, in turn, may naively proclaim that “the variants identified will be useful in individual clinical prediction”, heralding a quick and successful imple-mentation of personalized medicine. While these dis-
coveries may indeed illuminate biology and highlight opportunities for therapeutic intervention, their clinical use as risk factors in diabetes prediction is much less clear. Current simple clinical tools developed to predict risk of type 2 diabetes perform quite well, with an area under the receiver-operator characteristics curve as high as 85-90%13. Recent publications evaluating the ability of a genotype score composed of an aggregate of known risk variants to predict diabetes prospectively have shown marginal, clinically insignificant improve-ments over routinely tested risk factors14,15. The geno-type score improved its predictive power when applied to subjects under 50 years of age, allowing for 12% of this group to be “correctly” reclassified into a high-risk group. This supports the notion that genetic factors may be useful in early detection of at-risk groups befo-re clinical risk factors such as obesity or hyperglyce-mia manifest themselves, allowing practitioners to re-commend effective long-term preventive interventions at earlier stages.
Finally, the pragmatist simply asks whether “genetic information will help guide therapeutic decisions”. While genetic data has proven invaluable in the treat-ment of monogenic forms of diabetes, such as MODY (maturity onset diabetes of the young)16 and neonatal diabetes17, the pharmacogenetics of complex disease is still very much in its infancy. In a retrospective study, Pearson et al showed that patients with the risk variants at TCF7L2 were more likely to fail sulfonylurea thera-py than metformin18. The lifestyle intervention of the Diabetes Prevention Program has been particularly effective in carriers of the risk alleles at TCF7L219 and ENPP120. In contrast, the PPARG P12A variant does not seem to impact the individual response to thiazoli-dinediones21-23. In one of the few prospective studies published to date, carriers of the risk Ala allele at ABCC8 A1369S showed a heightened response to sul-fonylurea therapy, a finding that must be replicated24. Examination of drug metabolism genes may also prove fruitful: the OCT1 transporter responsible for metfor-min uptake harbors variants which influence the hu-man response to an oral glucose tolerance test25. In sum, whether this emerging body of genetic knowled-ge will direct response to different classes of therapeu-tics must be empirically tested.
In conclusion, widespread clinical genetic testing for common variants associated with type 2 diabetes is premature26. It is not yet clear that any single variant or a set that includes all of them can predict diabetes on-set at the individual level. Furthermore, the impact of this genetic knowledge on the response of patients or clinicians has not been formally tested: it is quite pos-sible that a negative test may provide false reassurance and discourage healthy behaviors. Until such testing demonstrates a beneficial effect on outcomes and is proven to be cost effective, it should only be conducted in the setting of clinical trials.
A number of genetic variants have already been re-producibly associated with type 2 diabetes; the list is
20002001200220032004200520062007
2008
Other
TCF7L2
ENPP1CAPN10HNF1A
HNF4AMTNR1B
KCNQ1NOTCH2
ADAMTS9THADA
TSPAN8-LGR5CDC123-CAMK1D
JAZF1WFS1
HNF1BFTO
IGF2BP2CDKN2A/B
CDKAL1HHEX-IDESLC30A8
KCNJ11
PPARG
1.00 1.10 1.20 1.30 1.40 1.50Approximate effect size
Genetic Loci Associated with Type 2 DiabetesYe
ar o
f con
firm
atio
n
Fig. 1. Type 2 diabetes-associated loci, plotted by year of definitive publication and approximate effect size. Genes implicated in type 2 diabetes by functional and genetic evidence but short of genome-wide significance are shown at the bottom.
06 ENDO4 (21-25).indd 2306 ENDO4 (21-25).indd 23 13/11/09 08:52:4713/11/09 08:52:47

Florez JC. Novel genetic findings applied to the clinic in type 2 diabetes
24 Endocrinol Nutr. 2009;56(Supl 4):21-5
only expected to grow. As large datasets of genome-wide data become available, distinguishing true asso-ciations from spurious findings due to statistical fluc-tuations will be essential to guide future work. Testing novel associations prospectively, measuring their pre-cise effects on glycemic traits and assessing whether they affect response to therapy is a key step in their experimental validation. Thus, it is crucial to harness this novel genetic knowledge so that it can refine our understanding of the pathophysiology of diverse forms of diabetes, enhance our prognostic ability and direct our choice of appropriate therapies27. The discovery that some of these variants may have measureable effects on glycemic parameters opens the door to tar-geted pharmacogenetic studies. The information obtai-ned from such experiments should provide the founda-tion needed to design and implement genome-based clinical trials, with the hope that these new genetic in-sights will translate into improved medical care and preventive measures for public health.
Conflict of interest
Jose C. Florez has received consulting honoraria from Merckz, Pfizer, bioStrategies, XOMA and Publi-cis Healthcare Communications Group, a global adver-tising agency engaged by Amylin Pharmaceuticals.
REFERENCES
1. Florez JC. Newly identified loci highlight beta cell dysfunction
as a key cause of type 2 diabetes: Where are the insulin resistan-
ce genes? Diabetologia. 2008;51:1100-10.
2. Gudmundsson J, Sulem P, Steinthorsdottir V, Bergthorsson JT,
Thorleifsson G, Manolescu A, et al. Two variants on chromoso-
me 17 confer prostate cancer risk, and the one in TCF2 protects
against type 2 diabetes. Nat Genet. 2007;39:977-83.
3. Frayling TM, Colhoun H, Florez JC. A genetic link between
type 2 diabetes and prostate cancer. Diabetologia. 2008;51:1757-
60.
4. Prokopenko I, Langenberg C, Florez JC, Saxena R, Soranzo N,
Thorleifsson G, et al. Variants in MTNR1B influence fasting glu-
cose levels. Nat Genet. 2009;41:77-81.
5. Lyssenko V, Nagorny CL, Erdos MR, Wierup N, Jonsson A,
Spegel P, et al. Common variant in MTNR1B associated with
increased risk of type 2 diabetes and impaired early insulin se-
cretion. Nat Genet. 2009;41:82-8.
6. Bouatia-Naji N, Bonnefond A, Cavalcanti-Proenca C, Sparso T,
Holmkvist J, Marchand M, et al. A variant near MTNR1B is
associated with increased fasting plasma glucose levels and type
2 diabetes risk. Nat Genet. 2009;41:89-94.
7. Panhuysen CIM, Cupples LA, Wilson PWF, Herbert AG, Myers
RH, Meigs JB. A genome scan for loci linked to quantitative
insulin traits in persons without diabetes: the Framingham Offs-
pring Study. Diabetologia. 2003;46:579-87.
8. Sladek R, Rocheleau G, Rung J, Dina C, Shen L, Serre D, et al.
A genome-wide association study identifies novel risk loci for
type 2 diabetes. Nature. 2007;445:828-30.
9. Diabetes Genetics Initiative of Broad Institute of Harvard and
MIT, Lund University and Novartis Institutes for BioMedical
Research: Genome-wide association analysis identifies loci for
type 2 diabetes and triglyceride levels. Science. 2007;316:1331-
6.
10. Pe’er I, De Bakker PIW, Maller J, Yelensky R, Altshuler D, Daly
MJ. Evaluating and improving power in whole-genome associa-
tion studies using fixed marker sets. Nat Genet. 2006;38:663-7.
11. Zeggini E, Scott LJ, Saxena R, Voight BF, Marchini JL, Hu T, et
al. Meta-analysis of genome-wide association data and large-
scale replication identifies additional susceptibility loci for type
2 diabetes. Nat Genet. 2008;40:638-45.
12. Kathiresan S, Melander O, Guiducci C, Surti A, Burtt NP, Rie-
der MJ, et al. Six new loci associated with blood low-density
lipoprotein cholesterol, high-density lipoprotein cholesterol or
triglycerides in humans. Nat Genet. 2008;40:189-97.
13. Wilson PW, Meigs JB, Sullivan L, Fox CS, Nathan DM,
D’Agostino RB. Prediction of incident diabetes mellitus in
middle-aged adults: the Framingham Offspring Study. Arch In-
tern Med. 2007;167:1068-74.
14. Meigs JB, Shrader P, Sullivan LM, McAteer JB, Fox CS, Du-
puis J, et al. Genotype score in addition to common risk factors
for prediction of type 2 diabetes. N Engl J Med. 2008;359:2208-
19.
15. Lyssenko V, Jonsson A, Almgren P, Pulizzi N, Isomaa B, Tuomi
T, et al. Clinical risk factors, DNA variants, and the develop-
ment of type 2 diabetes. N Engl J Med. 2008;359:2220-32.
16. Pearson ER, Liddell WG, Shepherd M, Corrall RJ, Hattersley
AT. Sensitivity to sulphonylureas in patients with hepatocyte
nuclear factor-1a gene mutations: evidence for pharmacogene-
tics in diabetes. Diabet Med. 2000;17:543-5.
17. Pearson ER, Flechtner I, Njolstad PR, Malecki MT, Flanagan
SE, Larkin B, et al; for the Neonatal Diabetes International Co-
llaborative Group. Switching from insulin to oral sulfonylureas
in patients with diabetes due to Kir6.2 mutations. N Engl J Med.
2006;355:467-77.
18. Pearson ER, Donnelly LA, Kimber C, Whitley A, Doney ASF,
McCarthy MI, et al. Variation in TCF7L2 influences therapeutic
response to sulfonylureas: A GoDARTs study. Diabetes. 2007;
56:2178-82.
19. Florez JC, Jablonski KA, Bayley N, Pollin TI, De Bakker PIW,
Shuldiner AR, et al, for the Diabetes Prevention Program Re-
search Group: TCF7L2 polymorphisms and progression to dia-
betes in the Diabetes Prevention Program. N Engl J Med. 2006;
355:241-50.
20. Moore AF, Jablonski KA, Mason CC, McAteer JB, Arakaki RF,
Goldstein BJ, et al. The association of ENPP1 K121Q with dia-
betes incidence is abolished by lifestyle modification in the Dia-
betes Prevention Program. J Clin Endocrinol Metab. 2009;94:
449-55.
21. Bluher M, Lubben G, Paschke R. Analysis of the relationship
between the Pro12Ala variant in the PPAR-γ2 gene and the res-
ponse rate to therapy with pioglitazone in patients with type 2
diabetes. Diabetes Care. 2003;26:825-31.
22. Snitker S, Watanabe RM, Ani I, Xiang AH, Marroquin A, Ochoa
C, et al. Changes in insulin sensitivity in response to troglitazo-
ne do not differ between subjects with and without the common,
functional Pro12Ala peroxisome proliferator-activated receptor-
γ2 gene variant: results from the Troglitazone in Prevention of
Diabetes (TRIPOD) study. Diabetes Care. 2004;27:1365-8.
23. Florez JC, Jablonski KA, Sun MW, Bayley N, Kahn SE, Sha-
moon H, et al, for the Diabetes Prevention Program Research
Group: effects of the type 2 diabetes-associated PPARG P12A
polymorphism on progression to diabetes and response to trogli-
tazone. J Clin Endocrinol Metab. 2007;92:1502-9.
24. Feng Y, Mao G, Ren X, Xing H, Tang G, Li Q, et al. Ser1369Ala
variant in sulfonylurea receptor gene ABCC8 is associated with
antidiabetic efficacy of gliclazide in Chinese type 2 diabetic pa-
tients. Diabetes Care. 2008;31:1939-44.
25. Shu Y, Sheardown SA, Brown C, Owen RP, Zhang S, Castro
RA, et al. Effect of genetic variation in the organic cation trans-
06 ENDO4 (21-25).indd 2406 ENDO4 (21-25).indd 24 13/11/09 08:52:4713/11/09 08:52:47

Florez JC. Novel genetic findings applied to the clinic in type 2 diabetes
Endocrinol Nutr. 2009;56(Supl 4):21-5 25
porter 1 (OCT1) on metformin action. J Clin Invest. 2007;117:
1422-31.
26. Hunter DJ, Khoury MJ, Drazen JM. Letting the genome out of
the bottle--will we get our wish? N Engl J Med. 2008;358:105-
7.
27. Moore AF, Florez JC. Genetic susceptibility to type 2 diabetes
and implications for antidiabetic therapy. Annu Rev Med.
2008;59:95-111.
28. Frayling TM. Genome-wide association studies provide new
insights into type 2 diabetes aetiology. Nat Rev Genet. 2007;
8:657-62.
29. Ludovico O, Pellegrini F, Di Paola R, Minenna A, Mastroianno
S, Cardellini M, et al. Heterogeneous effect of peroxisome pro-
liferator-activated receptor γ2 Ala12 variant on type 2 diabetes
risk. Obesity. 2007;15:1076-81.
30. Florez JC. The new type 2 diabetes gene TCF7L2. Curr Opin
Clin Nutr Metab Care. 2007;10:391-6.
31. Florez JC, Burtt N, De Bakker PIW, Almgren P, Tuomi T, Hol-
mkvist J, et al. Haplotype structure and genotype-phenotype
correlations of the sulfonylurea receptor and the islet ATP-sen-
sitive potassium channel gene region. Diabetes. 2004;53:1360-
8.
32. Yasuda K, Miyake K, Horikawa Y, Hara K, Osawa H, Furu-
ta H, et al. Variants in KCNQ1 are associated with suscep-
tibility to type 2 diabetes mellitus. Nat Genet. 2008;40:1092-
7.
06 ENDO4 (21-25).indd 2506 ENDO4 (21-25).indd 25 13/11/09 08:52:4713/11/09 08:52:47

26 Endocrinol Nutr. 2008;56(Supl 4):26-9
Monogenic forms of diabetes mellitus: an updateMARTINE VAXILLAIRE AND PHILIPPE FROGUEL
Genomics and Molecular Physiology of Metabolic Diseases. CNRS UMR8090. Lille Institute of Biology. Lille. France.
There are several monogenic disorders of pancreatic β-cell func-tion, characterized by various degrees of chronic hyperglycemia. They are usually diagnosed early in life, in neonates or during in-fancy, in childhood and even in young adulthood1-3. The identifica-tion of causal mutations in a dozen of different genes has already proven to have a great clinical impact opening new avenues in ge-nomic medicine and pharmacogenetics4,5. These diseases comprise a broad spectrum of diabetic phenotypes including neonatal diabe-tes mellitus, non auto-immune diabetes in infancy, dominantly in-herited forms of early-onset diabetes (also named Maturity-Onset Diabetes of the Young [MODY], and first recognised by Tattersall in 1975) and very rare diabetes-associated syndromes1-3,6.
Both Neonatal Diabetes Mellitus (NDM) and Monogenic Diabe-tes of Infancy (MDI, as diabetes may be silent in the first couple of months of life) are rare (∼1:300,000 live births) but potentially devastating diseases as causing low, or even undetectable levels of insulin2,3. Two forms are recognized on clinical grounds, either transient (TNDM) or permanent (PNDM), which differ in the du-ration of insulin dependence early in the disease, and to some ex-tent in their genetic and molecular origins2,3 (fig. 1). In most instan-ces, early-infancy diabetes is unrelated to auto-immunity3. NDM/MDI are indeed genetically heterogeneous disorders mainly caused by heterozygous mutations in KCNJ11, ABCC8 and INS genes7-10. Ra-rer genetic aetiologies which may include extra-pancreatic features have been reported, including recessive mutations in IPF1 (causing pancreas agenesis and exocrine pancreatic insufficiency), PTF1A (in association with cerebellar hypoplasia), GLIS3 (in association with congenital hypothyroidism) and in EIF2AK3 (causing Wolcott Rallison syndrome)1-3.
The MODY subtype, a group of clinically heterogeneous, often non-insulin-dependent forms of diabetes, usually develops in childhood or in thin young adults (before age 25 years) and may represent 1-2% of all diabetes cases1,6. So far, heterozygous mu-tations or chromosome rearrangements in seven genes have been identified as responsible for MODY (fig. 2). These genes encode the enzyme glucokinase (GCK, MODY2), the transcription fac-tors hepatocyte nuclear factor-4α (HNF4A, MODY1), hepatocyte nuclear factor-1α (HNF1A, MODY3), insulin promoter factor-1 (IPF1, MODY4), hepatocyte nuclear factor-1β (HNF1B, MODY5)
Diabetes mellitus hoy
Correspondence: Dr. M. Vaxillaire.Genomics and Molecular Physiology of Metabolic Diseases. CNRS UMR8090. Lille Institute of Biology. Institut Pasteur. 1, rue PR. Calmette. B.P. 24559019 Lille. France.E-mail: [email protected]; [email protected]
07 ENDO4 (26-29).indd 2607 ENDO4 (26-29).indd 26 13/11/09 08:53:5913/11/09 08:53:59

Vaxillaire M and Froguel P. Monogenic forms of diabetes mellitus: an update
Endocrinol Nutr. 2008;56(Supl 4):26-9 27
and NEUROD1/beta2 (MODY6), and the preproinsu-lin (INS, MODY7)1,6,11,12.
The most recent discoveries within the last 5 years, with important clinical and therapeutic implications, are:
– The activating mutations in the β-cell KATP channel. This channel is a hetero-octamer assembled from the pore-forming KIR6.2 (KCNJ11) subunit and the regu-latory, high affinity sulfonylurea receptor SUR1 (ABCC8)13, which links nutrient metabolism with membrane electrical activity by responding to chan-ges in ATP/ADP levels that reflect the energy status of the β-cell13. Therefore, it plays a key role in the regulation of insulin release. These gain-of-function KCNJ11 or ABCC8 mutations are indeed responsible for 30-to-40% of the NDM cases7,9. Heterogeneity in the symptoms associated with the KATP channel mu-tations has been reported, notably neuromotor and neuropsychological abnormalities with distinctive degrees of severity may be present4,5,7,9. Moreover, some ABCC8 mutations resulted in vertical transmis-sion of neonatal and apparent adult-onset diabetes in
the same family7, or rare forms of insulin secretion deficiency in adults14.
The most striking clinical implication of these studies is the radical change in the treatment of the patients with a KATP channel mutation. A switch from insulin therapy to oral sulfonylurea drugs (glibenclamide or glipizide) provides a good metabolic control in both PNDM and relapsing TNDM cases with separate KCNJ11 or ABCC8 mutations4,5,7.
– The heterozygous mutations in the preproinsulin (INS) gene are also a cause of isolated permanent NDM/MDI, accounting for 15-20% of permanent MDI. The age of diabetes onset ranges from the neo-natal period through childhood and adulthood8,10,15. One common feature in patients with an INS muta-tion is the absence of autoantibodies8,10,15, clinically implying that children with autoantibody–negative diabetes diagnosed in the first years should be inves-tigated for monogenic diabetes (instead of being con-sidered type 1 diabetes). As demonstrated in the dia-
Distribution of the MODY subtypes
22%45%
66%25%
< 1%< 1%
11%25-30%
Transcription factors
Glucokinase(GCK)
MODY2)
30-60%HNF1α(TCF1/
MODY3)
2-5%HNF4α
(HNF4A/MODY1)
1-3%HNF1ß(TCF2/
MODY5)
< 1%IPF1
(PDX1/MODY4)
< 1%NeuroD1/
Beta2(MODY6)
INS MODY-X
BritishFrenchFig. 2. Distribution of the genetic
subtypes in Maturity Onset diabe-tes of the Young (MODY). Overall data from two representative co-horts of patients (British and Fren-ch MODY cohorts), adapted from previous reports1,6,12. HNF: hepa-tocyte nuclear factor; INS: pre-proinsulin; IPF: insulin promoter factor.
54% PNDM/MDI 46% TNDM
ABCC8KCNJ11GCK
INSchr6q24 aberrationsUnelucidated cases
51%
35%
5%
8%49%
24%24%
Fig. 1. Distribution of the genetic subtypes in Neonatal Diabetes Mellitus/Monogenic Diabetes of Infancy (NDM/MDI). Data from the French NDM Study group5,7,8. GCK: glucokinase; INS: preproin-sulin.
07 ENDO4 (26-29).indd 2707 ENDO4 (26-29).indd 27 13/11/09 08:54:0013/11/09 08:54:00

Vaxillaire M and Froguel P. Monogenic forms of diabetes mellitus: an update
28 Endocrinol Nutr. 2008;56(Supl 4):26-9
betic Akita mouse, INS mutants causing NDM/MDI were found to promote proinsulin misfolding, endo-plasmic reticulum stress and β–cell failure suppor-ting a proteotoxic, apoptotic mechanism10. These data still expand the pathogenic mechanisms of β-cell dysfunction in NDM/MDI, and evidence the po-tential phenotypic heterogeneity of these rare forms of non auto-immune diabetes.
Altogether, the discovery of genes that are highly ex-pressed in the pancreatic β-cell and involved in these monogenic subtypes of diabetes has revealed several ae-tiological mechanisms of β-cell dysfunction: a reduced β-cell number or maturation (as for mutations in IPF1, PTF1A, HNF1B), a decreased glucose sensing and me-tabolism (mutations in GCK, INS, HNF1A, HNF4A), a failure of the membrane depolarization (mutations in KCNJ11, ABCC8) or an increased destruction rate of the β-cell (mutations in INS, HNF4A, EIF2AK3, WFS1), which all result in inadequate insulin secretion despite
chronic hyperglycemia1-3,6,10. Additional MODY genes, that are yet to be identified, may be responsible for 20-30% of early-onset diabetes cases with a dominant pat-tern of inheritance1, and a proportion of ∼50% of the NDM/MDI patients are still unelucidated, suggesting that defects in further pathways in the insulin-secreting β-cell are involved in monogenic diabetes.
The recent discoveries in the field of NDM/MDI, in addition to the previous studies in MODY1,6,11,12 stron-gly support the hypothesis that different mutations affecting a same gene may cause a wide spectrum of clinical phenotypes ranging from NDM to inherited diabetes with a lower penetrance appearing in childho-od or adulthood. Furthermore, there is rising evidence that common polymorphisms in the genes previously implicated in monogenic diabetes can modestly increa-se the risk for common adult type 2 diabetes (such as GCK and HNF4A promoter variants, intronic variants in HNF1B, or coding and non coding variants in WFS1/Wolfram syndrome gene)1.
Glucoseincrease
Glucose
Glucose
Ca 2+
Low glucoseconcentration
K +
Kr 6.2SURI
– 70 mV
K +
Hyperpolarization
ATPMgADP
Glucose
Glucose
ATPMgADP
Ca 2+ Ca 2+
Depolarization
KATP channelNormal subject
Insulinsecetion
Glucose
Glucose
Ca2+
K+ATPMgADP
Glucoseincrease
No insulin exocytosis
Channels withreduced ATPsensitivity or
steric mediatedincrease in
opening probability
Permanent neonatal diabetesK+
Hyperpolarization
Fig. 3. KATP channels coupling cell me-tabolism to electrical activity in pan-creatic β-cell. A) In presence of low glucose and low ATP/ADP ratio, the KATP channels are opened and the cell membrane hyperpolarized. When glu-cose concentration and therefore ATP/ADP ratio increase, the KATP channels close, provoking membrane depolari-sation, opening of the voltage-gated Ca2+ channels and insulin exocytosis. B) Abnormal insulin secretion by KCNJ11 or ABCC8 activating muta-tions. An activating mutation is res-ponsible for an increase in the opening probability of the channel, which inhi-bits the release of insulin when gluco-se increases.
07 ENDO4 (26-29).indd 2807 ENDO4 (26-29).indd 28 13/11/09 08:54:0013/11/09 08:54:00

Vaxillaire M and Froguel P. Monogenic forms of diabetes mellitus: an update
Endocrinol Nutr. 2008;56(Supl 4):26-9 29
Identifying the precise genetic causes and molecular mechanisms that explain the clinical features of each subtype of early-infancy or childhood diabetes has sig-nificant implications in: a) our molecular understan-ding of these monogenic β-cell disorders; b) how these discoveries may be translated to novel pharmacogeno-mic approaches to improve diabetes care in these sub-groups of very young patients, and c) a better predic-tion of disease progression and useful genetic counselling.
Conflict of interest
The authors declare they have no conflict of in-terest.
REFERENCES
1. Vaxillaire M, Froguel P. Monogenic diabetes in the young, phar-
macogenetics and relevance to multifactorial forms of type 2
diabetes. Endocr Rev. 2008;29:254-64.
2. Polak M, Shield J. Neonatal and very-early-onset diabetes me-
llitus. Seminars in Neonatalogy. 2004;9:59-65.
3. Barbetti F. Diagnosis of neonatal and infancy-onset diabetes.
Endocr Dev. 2007;11:83-93.
4. Pearson ER, Flechtner I, Njølstad PR, Malecki MT, Flanagan
SE, Larkin B, et al. Switching from insulin to oral sulfonylureas
in patients with diabetes due to Kir6.2 mutations. N Engl J Med.
2006;355:467-77.
5. Flechtner I, Vaxillaire M, Cavé H, Scharfmann R, Froguel P,
Polak M. Diabetes in very young children and mutations in the
insulin-secreting cell potassium channel genes: therapeutic con-
sequences. Endocr Dev. 2007;12:86-98.
6. Murphy R, Ellard S, Hattersley AT. Clinical implications of a
molecular genetic classification of monogenic beta-cell diabe-
tes. Nat Clin Pract Endocrinol Metab. 2008;4:200-13.
7. Babenko AP, Polak M, Cavé H, Busiah K, Scharfmann R, Bryan
J, et al. Activating mutations in the ABCC8 gene in neonatal
diabetes mellitus. N Engl J Med. 2006;355:456-66.
8. Polak M, Dechaume A, Cavé H, Nimri R, Crosnier H, Sulmont
V, et al. Heterozygous missense mutations in the insulin gene
are linked to permanent diabetes appearing in the neonatal pe-
riod or in early infancy: a report from the French ND (Neonatal
Diabetes) Study Group. Diabetes. 2008;57: 1115-9.
9. Gloyn AL, Pearson ER, Antcliff JF, Proks P, Bruining GJ, Slin-
gerland AS, et al. Activating mutations in the gene encoding the
ATP-sensitive potassium-channel subunit Kir6.2 and permanent
neonatal diabetes. N Engl J Med. 2004;350:1838-49.
10. Stoy J, Edghill EL, Flanagan SE, Ye H, Paz VP, Pluzhnikov A,
et al. Insulin gene mutations as a cause of permanent neonatal
diabetes. Proc Natl Acad Sci USA. 2007;104:15040-4.
11. Bellanne-Chantelot C, Chauveau D, Gautier JF, Dubois-Lafor-
gue D, Clauin S, Beaufils S, et al. Clinical spectrum associated
with hepatocyte nuclear factor-1beta mutations. Ann Intern
Med. 2004;140:510-7.
12. Froguel P, Zouali H, Vionnet N, Velho G, Vaxillaire M, Sun F,
et al. Familial hyperglycemia due to mutations in glucokinase.
Definition of a subtype of diabetes mellitus. N Engl J Med.
1993;328:697-702.
13. Aguilar-Bryan L, Bryan J. Molecular biology of adenosine tri-
phosphate-sensitive potassium channels. Endocr Rev. 1999; 20:
101-35.
14. Tarasov AI, Nicolson TJ, Riveline JP, Taneja TK, Baldwin SA,
Baldwin JM, et al. A rare mutation in ABCC8/SUR1 leading to
altered ATP-sensitive K+ channel activity and beta-cell glucose
sensing is associated with type 2 diabetes in adults. Diabetes.
2008;57:1595-604.
15. Colombo C, Porzio O, Liu M, Massa O, Vasta M. Salardi S, et
al. Seven mutations in the human insulin gene linked to perma-
nent neonatal/infancy-onset diabetes mellitus. J Clin Invest.
2008;118:2148-56.
07 ENDO4 (26-29).indd 2907 ENDO4 (26-29).indd 29 13/11/09 08:54:0013/11/09 08:54:00

30 Endocrinol Nutr. 2008;56(Supl 4):30-3
Causas principales de mortalidad precoz y exceso de mortalidad en la población diabética española. Estudio DRECE III AGUSTÍN GÓMEZ DE LA CÁMARAa, MIGUEL A. RUBIO HERRERAb, JOSÉ A. GUTIÉRREZ FUENTESc, JUAN A. GÓMEZ GERIQUEd, CÉSAR JURADO VALENZUELAa y PILAR CANCELAS NAVIAa; EN REPRESENTACIÓN DEL GRUPO DRECE*
aServicio de Epidemiología Clínica. Hospital Universitario 12 de Octubre. Unidad de Investigación. CIBER de Epidemiología y Salud Pública. Madrid. España. bServicio de Endocrinología y Nutrición. Hospital Clínico San Carlos. Madrid. España. cInstituto DRECE de Estudios Biomédicos. Madrid. España. dServicio de Bioquímica Clínica. Hospital Marqués de Valdecilla. Santander. España.
INTRODUCCIÓN
El estudio DRECE (Dieta y Riesgo Cardiovascular en España) III se basa en el seguimiento de una cohorte de población general representativa de la sociedad española. El objetivo es analizar las tasas de mortalidad y mortalidad precoz en una subpoblación de pacientes diabéticos perteneciente a dicha cohorte tras 15 años de seguimiento y describir las tasas de mortalidad de diabéticos frente a no diabéticos.
La cohorte DRECE se compone de 4.783 sujetos seleccionados mediante un muestreo estratificado polietápico, de los cuales 215 eran diabéticos siguiendo los criterios de la American Diabetes As-sociation (ADA) 2003 y cuya evolución se ha seguido desde 1991 hasta 2006 (edad actual, 20 a 75 años). Su estatus vital y causa de mortalidad han sido proporcionados por el Instituto Nacional de Estadística (INE). Las tasas se calcularon mediante regresión de Poisson y la identificación de factores de riesgo mediante la regre-sión de riesgos proporcionales de Cox.
Fallecieron 35 pacientes diabéticos, lo que se corresponde con una tasa de mortalidad total de 11,0 (intervalo de confianza [IC] del 95%, 7,9-15,32) por 1.000 habitantes. En el subgrupo no diabético fallecieron 120 sujetos, cuya tasa de mortalidad total es de 1,67 (IC del 95%, 1,39-1,99) por 1.000 habitantes. La distribución por causa de muerte en población global fue: 68 pacientes por cáncer, de los cuales 10 eran diabéticos, y 37 por causas circulatorias, siendo dia-béticos 13. Y los 53 sujetos restantes se englobaron dentro de la categoría CIE (Clasificación Internacional de Enfermedades) 10 de “otras”, de los cuales 12 eran diabéticos. La distribución por sexo
Diabetes mellitus hoy
Correspondencia: Dr. A. Gómez de la Cámara.Servicio de Epidemiología Clínica. Hospital Universitario 12 de Octubre.Avda. Córdoba, s/n. 28041 Madrid. España.Correo electrónico: [email protected]
*La relación de miembros del estudio DRECE se encuentra al final del artículo.

Gómez de la Cámara A et al. Causas principales de mortalidad precoz y exceso de mortalidad en la población diabética española. Estudio DRECE III
Endocrinol Nutr. 2008;56(Supl 4):30-3 31
de los 215 diabéticos era de 115 varones y 100 muje-res, de los que han fallecido 25 varones y 10 mujeres.
Se obtiene un patrón de mortalidad en el que predo-mina el cáncer como causa más frecuente. La diabetes es el principal factor de riesgo de mortalidad cardio-vascular precoz en nuestra cohorte DRECE.
La American Diabetes Association identifica a la dia-betes mellitus (DM) como una enfermedad de alto ries-go cardiovascular1. La DM tipo 2 se considera como uno de los mayores problemas de salud pública mun-dial por su elevada prevalencia, morbimortalidad y, por tanto, elevado impacto social y sanitario2. Dado el im-portante componente de pacientes diabéticos en la co-horte DRECE se pretende analizar en este estudio el impacto de la diabetes en la cohorte y el comportamien-to clínico-epidemiológico del subgrupo de diabéticos.
MATERIAL Y MÉTODOS
Diseño del estudio
Se trata de un estudio observacional y descriptivo tipo cohorte histórica. El ámbito del estudio es la po-blación general representativa de distintos puntos de la geografía española participantes en el estudio DRECE I. Se reclutó a 4.783 sujetos cuya evolución se siguió desde 1991 hasta 2006, y a esta fecha tienen unas eda-des comprendidas entre 20 y 75 años. Su estatus vital y causa de mortalidad han sido proporcionados por el Instituto Nacional de Estadística (INE).
Procedimientos
En 1991, a todos los integrantes de la cohorte DRE-CE se les realizó una exploración médica, una anamne-sis familiar y personal con cuestionario nutricional y sobre actividad física, y pruebas complementarias de laboratorio3,4. Datos de mortalidad fueron aportados por el INE.
Plan de análisis
La información obtenida se depositó en un soporte in-formático mediante procedimientos estandarizados. Las variables cualitativas se describieron mediante frecuen-cias absolutas y relativas, las variables cuantitativas con
distribución normal se resumieron mediante su media, desviación estándar, valores mínimo y máximo, mientras que las variables claramente no normales se resumieron mediante su mediana y cuartiles. Además, el análisis des-criptivo se realizó de manera estratificada por sexo y es-tratos de edad, y se hicieron comparaciones mediante análisis de la varianza (ANOVA) y test χ2 de acuerdo a la naturaleza de la variable. Las tasas de mortalidad se esti-maron mediante regresión de Poisson con ajustes por edad, sexo y años de seguimiento. Para valorar la rela-ción entre los distintos factores o características y la su-pervivencia de los sujetos de estudio se utilizó la técnica de regresión de riesgos proporcionales de Cox.
RESULTADOS.
De un total de 4.783 sujetos que formaban la cohorte DRECE entre 1991 y 2006, fallecieron 158. Del total de individuos que formaban la cohorte DRECE, 215 cum-plían criterios de diabetes, 115 (53,48%) eran varones y 100 (46,51%) mujeres. El total de pacientes diabéticos fallecidos fue de 35, de los cuales 25 fueron varones y 10 mujeres, con una edad media de fallecimiento de 55,31 años, según datos aportados por el INE. La distri-bución por causa de muerte en el subgrupo DM frente a no DM fue la siguiente del total de muertes producidas por cáncer, 10 eran diabéticos y 58 no diabéticos. De 35 casos de fallecimiento debido a causas circulatorias, 13 se produjeron en pacientes diabéticos frente a 22 casos de sujetos no diabéticos y, por último, 12 y 40, respecti-vamente, se englobaron dentro de la categoría de “otras”. En el grupo de diabéticos el mayor porcentaje de muer-te, un 37,14%, se produjo por causas circulatorias, más concretamente por causas cardiovasculares.
La tasa de mortalidad para el período de seguimien-to en el grupo de diabéticos fue de 11 por 1.000 habi-tantes/año. La mortalidad entre los varones, 25 casos, es más del doble que entre las mujeres, 10 casos, con tasas de 15,18 y 6,51 por 1.000 habitantes/año, res-pectivamente. Dicha tasa en el subgrupo de no DM fue de 1,67 por 1.000 habitantes/año. La mortalidad entre los varones no diabéticos, 86 casos, es más del doble que entre las mujeres, 34 casos, con tasas de 2,46 y 0,92 por 1.000 habitantes/año, respectivamente (tabla 1).
TAbLA 1. Tasas de mortalidad
Subgrupos Número de muertes Tasa de mortalidad (1.000 personas/año) IC del 95%
DRECE (cohorte) 158 2,09 1,79-2,44 Subgrupo DM 35 11,0 7,9-15,32 Subgrupo no DM 120 1,67 1,39-1,99Mujer cohorte DRECE 45 1,16 0,86-1,55 Mujer DM 10 6,51 3,5-12,1 Mujer no DM 34 0,92 0,65-1,29Varón cohorte DRECE 113 3,07 2,55-3,69 Varón DM 25 15,18 10,26-22,47 Varón no DM 86 2,46 1,99-3,04
DM: diabetes mellitus; IC: intervalo de confianza.

Gómez de la Cámara A et al. Causas principales de mortalidad precoz y exceso de mortalidad en la población diabética española. Estudio DRECE III
32 Endocrinol Nutr. 2008;56(Supl 4):30-3
Los factores independientes después del ajuste mul-tivariable se muestran en la tabla 2. Para la mortalidad total, las variables independientes asociadas fueron la creatinina > 1,5 mg/dl, hazard ratio (HR) 2,39 (inter-valo de confianza [IC] del 95%, 0,913-6,256); la glu-cemia, HR 1,008 (IC del 95%, 1,004-1,011); el sexo masculino, HR 1,992 (IC del 95%, 1,314-3,020), y la edad, HR 1,089 (IC del 95%, 1,071-1,106). Para la mortalidad específica cardiovascular, los factores de riesgo fueron la creatinina > 1,5 mg/dl, HR 11,986 (IC del 95%, 3,934-36,52); la glucemia, HR 1,011 (IC del 95%, 41,006-1,017)); la edad, HR 1,125 (IC del 95%, 1,083-1,168), y apo A1, HR 0,981 (IC del 95%, 0,967-0,995).
DISCUSIÓN
Los factores de riesgo asociados a la mortalidad ge-neral que emergen en el análisis multivariable son prácticamente los reconocidos como factores de riesgo clásicos. La mortalidad total y cardiovascular compar-ten 4 factores de riesgo cardiovascular conocidos, edad, sexo y, de manera muy destacada, por la elevada mag-nitud de la asociación, creatinina y diabetes. Pensamos que la creatinina, fundamentalmente, expresa el daño renal presente en la diabetes o hipertensión arterial avanzada, y también se ha considerado factor de riesgo cardiovascular per se5.
Para este grupo, de 5 a 60 años de edad, durante es-tos 15 años de seguimiento el cáncer es la principal causa de muerte. Esta circunstancia ya ha sido recogi-da en estudios previos y se ratifica en el nuestro6. Aho-ra bien, si se abarcara un rango de edad mayor, la mor-talidad cardiovascular podría ocupar la primera posición.
El informe de 2003 de la Sociedad Española de Ar-teriosclerosis sobre la mortalidad en la sociedad espa-ñola7, señalaba que la tasa de mortalidad cardiovascu-
lar aumenta más intensamente a medida que se incrementa la edad, siendo superior a 1.000 por 100.000 habitantes en las personas mayores de 70 años y pro-voca que, para el conjunto de la población, las enfer-medades del aparato circulatorio ocupen todavía el primer lugar como causa de muerte.
Según datos del Ministerio de Sanidad y Consumo, la DM fue la causa del 2,6% del total de fallecimientos ocurridos en el año 2006 en España, lo que supuso una tasa de mortalidad de 22 por 100.000 habitantes. Según este informe, la proporción de fallecimientos por dia-betes se ha mantenido prácticamente estable desde 1990 (alrededor de un 2,6% de las defunciones), incre-mentándose ligeramente en los varones. Lo que sí se observa es un incremento notable en la proporción de fallecidos por diabetes con más de 74 años de edad8. Es por ello que esperamos que en el seguimiento de nues-tra cohorte la tasa de mortalidad en el grupo de diabé-ticos irá en aumento a medida que vaya envejeciendo la población.
Sin embargo, hay que resaltar que los diabéticos muestran un patrón diferente de mortalidad con res-pecto a la población no diabética del estudio, siendo las enfermedades cardiovasculares la primera causa de muerte en lugar de cáncer. De los 35 diabéticos falleci-dos en estos 15 años un 37,1% falleció debido a causas cardiovasculares y un 28,5% debido al cáncer. En la bibliografía hay numerosos estudios, tanto de segui-miento como transversales, que coinciden en que la mortalidad en individuos diabéticos es más alta que en individuos no diabéticos. Aunque no todos los estudios identifican los mismos factores de riesgo para la mor-talidad9,10.
El riesgo de mortalidad de los pacientes diabéticos es el mismo que el de los no diabéticos que han presen-tado un infarto de miocardio (alrededor del 20%) y este riesgo se triplica entre los diabéticos que sufren un in-farto. Por esto, no resulta sorprendente que la expecta-tiva de vida de un paciente al que se le diagnostica de diabetes tipo 2 se reduzca en un 30%. Además, cuando contraen una patología cardiovascular, la mortalidad es mucho mayor entre los diabéticos que entre los no dia-béticos11.
Estos datos ponen de manifiesto que el individuo diabético presenta un riesgo mayor de muerte cardio-vascular y que ésta es precoz, ya que la edad de falle-cimiento en estos sujetos es muy temprana con respec-to a la población general.
RELACIÓN DE MIEMbROS DEL GRUPO DRECE
E. Juncadella i García (Centro de Salud ABC de L’Hospitalet); E. Melús Palazón, M.J. Morales Grego-rio, P. Pitarque Cargallo, E. Mayayo Castillejo, I Gon-zález Gómez de Segura, M.I. Sancho Giner, A.M. Az-nárez García, F. Ibáñez García, M.E. Marco Gayarre, P. Sebastián Villán, E. Muñoz Novella, M.A. Montañés
TAbLA 2. Análisis multivariable. Factores de riesgo para mortalidad general y cardiovascular
Variable Hazard ratio (IC del 95%) Pr > χ2
Factores de riesgo de mortalidad total Sexo (varón) 1,992 (1,314-3,02) 0,0012 Edad 1,089 (1,071-1,106) < 0,0001 PAS 1,019 (1,007-1,031) 0,0016 Tabaco 1,343 (0,951-1,897) 0,0945 Glucemia 1,008 (1,004-1,011) < 0,0001 Creatinina 2,390 (0,913-6,256) 0,0761Causa de mortalidad circulatoria Edad 1,125 (1,083-1,168) < 0,0001 Glucemia 1,011 (1,006-1,017) < 0,0001 Apolipoproteína A1 0,981 (0,967-0,995) 0,0074 Creatinina 11,986 (3,934-36,52) < 0,0001Causa de mortalidad cardiovascular Edad 1,117 (1,068-1,169) < 0,0001 Glucemia 1,014 (1,009-1,019) < 0,0001 Creatinina 22,875 (7,157-73,117) < 0,0001
IC: intervalo de confianza; PAS: presión arterial sistólica.

Gómez de la Cámara A et al. Causas principales de mortalidad precoz y exceso de mortalidad en la población diabética española. Estudio DRECE III
Endocrinol Nutr. 2008;56(Supl 4):30-3 33
Gracia, S. Murciano González y V. Peg Rodríguez (Centro de Salud Actur-Sur); R. Saénz Guallar, A. Abos Zueco, J. Pastor Espinosa, J.J. Berlanga Rubio, A. García García, M.E. Estopiñán Estupiñán, B. Altaba Sanz, I. Castellano Juste y C. Burgues Valero (Centro de Salud de Alcañiz); A. Aguiar Bautista, V. del Rosa-rio Sánchez, M.C. Gómez Medina, M. Martel López y D. Ruano López (Centro de Salud de Agüimes); A. García Barrientos, E. Hernández Hernández, M. Badia Savidó y S. Puerto Balete (Centro de Salud Bañeres); J. Boned Izued, J. Codes Gómez, M.C. Ortega Calleja y F. Sancho Durán (Centro de Salud Calatayud Sur); R. Provencio Hernando y F.J. Peiró Cifuentes (Centro de Salud de Budia-Guadalajara); M.A. Díez García, M. Cáceres Hernández (Centro de Salud Casa del Barco, Valladolid); J.B. Gómez Castaño y F. Fernández (Cen-tro de Salud Cieza-Murcia); E. Peréz Calzada, M.V. Alonso Pérez de Ágreda, M.Y. del Campo Ciruelos, M.T. Díaz Benito, M.A. González Ramos y C. Gonzá-lez Ramos (Centro de Salud Federico García Lorca); C. Sánchez Arce y T. Casaseca Calvo (Centro de Salud General Ricardos); O. Pascual Gil (Centro de Salud Guadalajara Sur); C. Lasa Unzúe y J.D. García Díaz (Hospital Universitario Príncipe de Asturias, Alcalá de Henares); F. Almagro Múgica, E. Yetano Larrazabal, e I. Hernández (Centro de Salud Lasarte-Hospital Gui-púzcua); I.M. Socias Buades, M. Campo Vázquez, M. Garau Miquel, F. Ramón Roselló, M.J. Barea Mestre y M. Barceló Morey (Centro de Salud de Manacor); F. López Simarro, S. Miravet Jiménez, J. Fortea López e I. Verges Macario (C.S. de Martorell); M.I. del Cura González y C. Reverte Asuero (Centro de Salud Men-diguchia-Carriche); J.I. Sedano García, E. Angulo Va-llejo, M.A. Martínez Solórzano y M. Santos Lago (Centro de Salud Miranda-Este); J. Isasia Ballestero, M.J. Martín Martín, M. Monasterio Bazán, C. Alonso Canosa, Y. Zorraquino Muñoz y L.E. Gómez Rodrí-guez (Centro de Salud Pobo de Dueñas-Guadalajara); F. San Juan García, A. Cruz Macías y S. Vilariño Ro-mán (Centro de Salud Plaza de Argel); A. Serrano Cumplido, J.A. Ortega, J. del Río Fernández, L. Uribe-Etxebarría García, N. López Miguel, E. Borobio del Campo, J. Marín Vieites y A. García García (Centro de Salud de Portugalete-Osakidetza); M.J. Castellanos Alonso y M. Pellitero Espina (Centro de Salud Reina Sofía); H. Cardona Castellano, M.D. Carrascosa Ferre-ra y J. Marrero Brito (Centro de Salud San Gregorio-Telde); L.M. Fontenla Devesa, M.C. Luna Barrós, M.C. Paz Silva, R. Rubianes Soto, M.D. Durán Perei-ra, R.D. Martínez Meijide y N. Silva García (Centro de Salud de San Roque-Villagarcía de Arosa); M.C. Veli-cia Peña, M. Domínguez Sardiña, J. Mosquera Nogueira, M. Rodríguez Ríos, V.J. Diéguez Pereira, C. Gabián Pereira, M. Velhas Pereira, X.M. Parente Mo-jón, J.A. Río Orgueira, C. Cruces Artero y M.A. Rio-negro López (Centro de Salud Sardoma); P. González Aído, S. Baleato González y A. Álvarez Caride (Centro
de Salud Vite); C. Lamas (Subdirección de Atención Sanitaria, SAS); P. Ferrando, D. Lora, J. de la Cruz, P. Cancelas y P. Magán (Unidad de Investigación. Hospi-tal Universitario 12 de Octubre, Madrid).
Conflicto de intereses
Los autores declaran no tener ningún conflicto de intereses.
Financiación
Estudio financiado en parte por ayuda FIS 03/0014 y Grupo SOS.
bIbLIOGRAFÍA
1. The expert committee on the diagnosis on clasification of Dia-betes Mellitus. Report of the Expert committee on the diagnosis and classification of Diabetes Mellitus. Diabetes Care. 2003;26 Suppl 1:S5-20.
2. Boyle JP, Honeycutt AA, Narayan KM, Hoerger TJ, Geiss LS, Chen H, et al. Projection of diabetes burden through 2050: im-pact of changing demography and disease prevalence in the U.S. Diabetes Care. 2001;24:1936-40.
3. Gómez-Gerique JA, Gutiérrez-Fuentes JA, Montoya MT, Porres A, Rueda A, Avellaneda A, et al. Perfil lipídico en la población Española: estudio DRECE (Dieta y Riesgo de Enfermedad Car-diovascular en España). Grupo Estudio DRECE. Med Clin (Barc). 1999;113:730-5.
4. Ballesteros-Pomar MD, Rubio-Herrera MA, Gutiérrez-Fuentes JA, Gómez-Gerique JA, Gómez de la Cámara A, Pascual O, et al. Dietary habits and cardiovascular risk in the Spanish popula-tion: the DRECE study. Ann Nutr Metab. 2000;44:108-14.
5. Gerstein HC, Mann JF, Yi Q, Ziman B, Dinneen SF, Hoogwerf B, et al. Albuminuria and risk of cardiovascular events, death, and heart failure in diabetic and non-diabetic individuals, JAMA. 2001;286:421-6.
6. Gómez de la Cámara, Rubio-Herrera MA, Gutiérrez-Fuentes JA, Gómez-Gerique, Del Campo J, Jurado Valenzuela C, et al. Seguimiento de 1991 a 2004 de la mortalidad y los factores de riesgo emergentes en una cohorte de población general españo-la. Estudio DRECE III (Dieta y Riesgo de Enfermedades Car-diovasculares en España). Rev Esp Salud Pública. 2008;82:415-23.
7. Villar Álvarez F, Banegas JR, Donado Campos JM. Las enfer-medades cardiovasculares y sus factores de riesgo en España: hechos y cifras. Informe SEA. 2003.
8. Instituto de información sanitaria. Mortalidad por cáncer, por enfermedades isquémicas del corazón, por enfermedad cerebro-vascular y por diabetes mellitus en España. Disponible en: http://www msc.es
9. Gu K, Cowie CC, Harris MI. Mortality in adults with and without diabetes in national cohort of th U.S. population, 1997-1993. Diabetes Care. 1998;21:1138-45.
10. O’Sullivan JB, Hahan CM. Mortality related to diabetes melli-tus and blood glucose levels in comunity study. Am J Epide-miol. 1982;116:678-84.
11. Pyörälä K. Ensayos cardiovasculares en la diabetes: pasado y presente. Rev Esp Cardiol. 2000;53:1553-60.

34 Endocrinol Nutr. 2008;56(Supl 4):34-7
Genetics of type 2 diabetes. On overviewLEIF GROOP AND VALERIYA LYSSENKO
Department of Clinical Sciences/Diabetes & Endocrinology and Lund University Diabetes Centre. Lund University. University Hospital Malmoe. Malmoe. Sweden.
INTRODUCTION
While the genetic causes of monogenic disorders have been suc-cessfully identified in the past, the success in dissecting the gene-tics of complex polygenic diseases has until now been limited. The picture has dramatically changed in 2007 with the introduction of whole genome wide association studies (WGAS) and today va-riants in at least 18 genes are consitently been associated with T2D.This probably only represents the tip of the iceberg and refined tools will over the next few years provide a more complete picture of the genetic complexity of T2D.
TYPE 2 DIABETES IS AN INHERITED DISEASE
There is ample evidence that type 2 diabetes (T2D) is an inheri-ted disease. The life-time risk of developing T2D is about 40% in offspring of one parent with the disease. A first-degree relative of a patient with T2D has a 3-fold increased risk of developing the di-sease, this value is often referred to as the sibling-relative risk (λs)1.
It is clear that the change in the environment towards a more affluent Western life style plays a key role in the epidemic increase in the prevalence of T2D worldwide. This change has occurred du-ring the last 50 years, during which period our genes have not chan-ged. This does not exclude an important role for genes in the rapid increase in T2D, since genes or variation in them explain how we respond to changes in the environment and the environment always imposes a selective pressure on genes.
Low level of physical activity, abdominal obesity and presence of the metabolic syndrome also confer an increased risk of T2D. In addition, elevated glucose concentrations per se are strong predic-tors of future T2D. In a prospective study of 2115 non-diabetic individuals followed for 6 years within the Botnia study we could show that individuals with a family-history of T2D, body mass in-dex (BMI) ≥ 30, and fasting plasma glucose concentration ≥ 5.5 mmol/l had a 16-fold increased risk of developing T2D1. In the Botnia study, presence of a family history of T2D was confirmed
Diabetes mellitus hoy
Correspondence: Prof. Dr. L. Groop.Department of Clinical Sciences/Diabetes & Endocrinology.Lund University. University Hospital Malmoe.20502 Malmoe. Sweden.E-mail: [email protected]

Groop L and Lyssenko V. Genetics of type 2 diabetes. On overview
Endocrinol Nutr. 2008;56(Supl 4):34-7 35
by oral glucose tolerance tests in the parents. In gene-ral practice this is rarely the case and the value of a family history of T2D for predicting future diabetes is attenuated. Whether a family history of diabetes can be replaced by genetic testing in the prediction of T2D will be discussed later.
MAPPING GENETIC VARIABILITY
Linkage
The traditional way of mapping a disease gene has been to search for linkage between a chromosomal re-gion and a disease by genotyping a large number (about 400-500) of polymorphic markers (microsatellites) in affected family members. If the affected family mem-bers would share an allele more often than expected by non-random Mendelian inheritance, there is evidence of excess allele sharing. The most likely explanation for excess allele sharing is that a disease-causing gene is in close proximity to the genotyped marker.
The first and thus far the only T2D gene identified by a linkage study in families was the calpain 10 (CAPN10) gene2. Calpain 10, a cystein protease with largely unk-nown functions in glucose metabolism, is no obvious candidate gene for T2D. Despite a number of subse-quent negative studies, several meta-analyses have shown consistent association of SNPs 43 and 44 with T2D3. Carriers of the risk G allele of SNP43 show de-creased expression of the gene in skeletal muscle and insulin resistance. How this translates into increased risk of T2D is not known. Unfortunately none of the WGAS could find association between T2D and va-riants in the CAPN10 gene. One reason might be that association studies detect common variants with mo-dest effects while linkage most likely detects rare va-riants with stronger effects–such variants are rarely shared between a large number of patients with T2D.
Association studies and candidate genes
A number of studies have reported on association (or lack of it) between functional or positional candidate genes for T2D. Until 2007 only 3 genes could be con-sistently associated with T2D, namely PPARG, KCJN11 and TCF7L2.
– PPPARG: the gene encodes for a nuclear receptor PPARγ, which is predominantly expressed in adipose tissue where it regulates transcription of genes invol-ved in adipogenesis. In the 5’ untranslated end of the gene is an extra exon B that contains a SNP changing a proline in position 12 of the protein to alanine. The rare Ala allele is seen in about 15% of Europeans and was in an initial study shown to be associated with increased transcriptional activity, increased insulin sensitivity and protection against T2D4. Subsequent-ly, there were a number of studies, which could not replicate the initial finding. Using a family-based as-
sociation approach (transmission disequilibrium test, TDT) we could show excess transmission of the Pro allele to the affected offspring5. We thereafter perfor-med a meta-analysis combining the results from all published studies showing a highly significant asso-ciation with type 2 diabetes. The individual risk re-duction conferred by the Ala allele is moderate, about 15% but since the risk allele Pro is so common, it
12
10
8
6
4Insu
linog
enic
inde
x (m
U/m
mol
)
CC CT/TT
p = 0.0006A
9
8
7
6
5
4
Dis
posi
tion
inde
x (m
U2 )
CC CT/TT
p = 0.005B
1.0
0.5
0.0
–0.5
Iog
disp
ositi
on in
dex
p = 0.003
C
0 5 10 15Years from screening
rs7903146-CCrs7903146-CT or TT
Fig. 1. Insulin secretion according to different TCF7L2 rs 7903146 genotypes. A) Insuliniogenic index, i.e. incremental insulin response to oral glucose. B) Disposition index represents the insulinogenic index adjusted for insulin sensitivity. C) Change in insulin secretion (disposition index) over time in subjects who converted to T2D in the Botnia cohort. (Lyssenko et al9.)

Groop L and Lyssenko V. Genetics of type 2 diabetes. On overview
36 Endocrinol Nutr. 2008;56(Supl 4):34-7
translates into a population attributable risk of 25%. – KCNJ11: the ATP-sensitive potassium channel Kir
6.2 (KCNJ11) forms together with the sulfonylurea receptor SUR1 (ABCC8) an octamer protein that re-gulates transmembrane potential and thereby gluco-se-stimulated insulin secretion in pancreatic beta-ce-lls. Closure of the K- channel is a prerequisite for insulin secretion. A Glu23Lys polymorphism (E23K) has been associated with T2D and a modest impair-ment in insulin secretion6. In addition, an activating mutation in the gene causes a severe form of neonatal diabetes7. Whereas these neonatal mutations result in a 10-fold activation of the ATP-dependent potassium channel, the E23K variant results in only a 2-fold increase in activity.
– TCF7L2: by far the strongest association with T2D is seen for SNPs in the gene encoding for the transcrip-tion factor-7-like 2 (TCF7L2)8. TCF7L2 encodes for a transcription factor involved in Wnt signalling. He-terodimerization of TCF7L2 with β-catenin induces transcription of a number of genes including intesti-nal proglucagon. Risk variants in TCF7L2 are asso-ciated with impaired insulin secretion, possibly due to an impaired incretin effect, i.e. impaired stimula-tory effect of incretin hormones like GLP-1 and GIP on insulin secretion9. It is also possible that the gene is involved in proliferation of β-cells in response to increased demands.
WHOLE GENOME ASSOCIATION STUDIES
The rapid improvement in high throughput techno-logy for single nucleotide polymorphism (SNP) ge-notyping and thereby decreasing costs per genotype (in 10 years the cost has decreased by a factor of 10) has open new possibilities for both linkage and asso-ciation studies. In 2007 several WGAS using DNA chips with > 500,000 SNPs in a large number of pa-
tients with T2D and controls have been performed and published10. In our collaborative study with the Broad Institute and Novartis (Diabetes Genetic Initia-tive, DGI) we performed a WGAS in 1,464 patients with T2D and 1,467 non-diabetic control subjects from Finland and Sweden. Prior to publication we shared the results with researchers from the FUSION (Finnish USA Study of NIDDM) and WTCCC (Well-come Trust Case Control Consortium) groups. We only considered positive results, which were seen and replicated in all three studies, i.e. together with repli-cation samples the results were based upon DNA from 32,000 individuals! In a follow-up meta-analy-sis of more than 60,000 individuals another 6 variants were identified11.
Together these studies identified 16 genes/loci for T2D. Notably, TCF7L2 was on top of each WGAS with a joint p value in the three scans of 10–50. Several of the new genes seem to influence β-cell prolifera-tion by interfering with the cell cycle e.g.CDKAL1 and CDKN2A/CDKN2B on chromosome 9. Carriers of high-risk genotypes cannot increase their insulin secretion to meet the demands imposed by insulin re-sistance12. Intriguingly, the same region on chromo-some 9, which showed association with T2D, was associated with increased risk of myocardial infarc-tion in three independent WGAS13. However, there are most likely different SNPs operative for T2D and myocardial infarction. FTO is an obesity gene, which increases the risk of T2D through obesity14. It is the-refore not surprising that FTO was not detected as associated with T2D in the WGAS, which matched for BMI.
A Japanese WGAS identified variants in another ATP dependent potassium channel gene, KCNQ1 as being associated with T2D15. Mutations in the same gene are known to cause the long QT syndrome. We could show that it was associated with impaired insulin secretion and T2D also in Europeans. The main reason
180
160
140
120
ISI (
[mm
ol/L
]2 ×
([m
U/L
]2 )
Baseline Follow-up
A
< 8>12
Number of risk alleles 30,000
25,000
20,000
DI (
mU
3 /L3 )
Baseline Follow-up
B
Fig. 2. Change in, insulin sensitivity (ISI) and glucose-stimulated insulin secretion adjusted for insulin sensitivity (ISI), i.e. disposition index (DI) over time in carriers of top and bottom 20% of risk genotypes for T2D.

Groop L and Lyssenko V. Genetics of type 2 diabetes. On overview
Endocrinol Nutr. 2008;56(Supl 4):34-7 37
why it was missed in the WGAS was that the risk alle-le was not very polymorphic in Caucasians.
More recently, focus has been on analyzing interme-diate traits like glucose and insulin. Surprisingly, a va-riant in the melatonin receptor B1 (MTNRB1) was associated with elevated fasting glucose, impaired in-sulin secretion and risk of T2D16. Risk genotype ca-rriers had increased expression of MTNR1B in islets and treatment of beta-cells with melatonin resulted in impaired insulin secretion. Therapeutic inhibition of melatonin effects in islets could thus represent a novel approach to treat T2D.
CLINICAL IMPLICATIONS AND FUTURE DIRECTIONS
Genetics of T2D is still complicated but no longer the nightmare once proposed. The WGAs in 2007 re-presented an important milestone and were by Science called Breakthrough of the Year.
However, the 18 T2D genes explain only a small proportion (∼ 0.3) of the individual risk of T2D (λs of 3). Although we now seem to cover approximately 75% of the genetic map of T2D, the genetic variants detected represent common variants shared by a large number of individuals but with modest effects. It is premature to start to use these genetic variants for in-dividual predictions12. However, it may be possible to use them to reduce the number of individuals needed to be included in trials aiming at prevention of T2D
Conflict of interest
The authors declare they have no conflict of in-terest.
REFERENCES
1. Lyssenko V, Almgren P, Anevski D, Perfekt R, Lahti K, Nissén M, et al. Predictors and longitudinal changes in insulin sensiti-vity and secretion preceding onset of type 2 diabetes. Diabetes. 2005;54;166-74.
2. Horikawa Y, Oda N, Cox NJ, Li X, Orho-Melander M, Hara M, et al. Genetic variation in the gene encoding calpain-10 is asso-ciated with type 2 diabetes mellitus. Nat Genet. 2000;26;163-75.
3. Parikh H, Groop L. Candidate genes for type 2 diabetes. Re-views in Endocrine and Metabolic Disorders. 2004;5;151-76.
4. Deeb SS, Fajas L, Nemoto M, Pihlajamäki J, Mykkänen L, Kuu-sisto J, et al. A Pro12Ala substitution in PPARgamma2 associated with decreased receptor activity, lower body mass index and im-proved insulin sensitivity. Nat Genet. 1998;20:284-7.
5. Altshuler D, Hirschhorn JN, Klannemark M, Lindgren CM, Vohl MC, Nemesh J, et al. The common PPARgamma Pro12Ala polymorphism is associated with decreased risk of type 2 diabe-tes. Nat Genet. 2000;26:76-80.
6. Florez JC, Burtt N, De Bakker PIW, Almgren P, Tuomi T, Hol-mkvist J, et al: Haplotype structure and genotype-phenotype correlations of the sulfonyulrea receptor (SUR1) and the islet ATP- sensitive potassium channel (kir 6.2) gene region. Diabe-tes. 2004;53:1360-8.
7. Gloyn AL, Pearson ER, Antcliff JF, Proks P, Bruining GJ, Slin-gerland AS, et al. Activating mutations in the gene encoding the ATP-sensitive potassium channel subunit Kir6.2 and permanent neonatal diabetes. N Engl J Med. 2004;350;1838-49.
8. Grant SF, Thorleifsson G, Reynisdottir I, Benediktsson R, Ma-nolescu A, Sáinz J, et al. Variant of transcription factor 7-like 2 (TCF7L2) gene confers risk of type 2 diabetes. Nat Genet. 2006; 38:320-3.
9. Lyssenko V, Lupi R, Marchetti P, Del Guerra S, Orho-Melander M, Almgren P, et al. Mechanisms by which common variants in the TCF7L2 gene increase risk of type 2 diabetes. J Clin Invest. 2007;117:2155-63.
10. Saxena R, Voigt B, Lyssenko V, Burtt NP, de Bakker PI, Chen H, et al. Diabetes Genetics Initiative: Genome wide association analysis identifies loci for type 2 diabetes and triglyceride le-vels. Science. 2007:316;1331-6.
11. Zeggini E, Scott LJ, Saxena R, Voight BF, Marchini JL, Hu T, et al; for the Diabetes Genetics Replication and Meta-analysis (DIAGRAM) Consortium. Meta-analysis of genome-wide associa-tion data and large-scale replication identifies several additional sus-ceptibility loci for type 2 diabetes. Nat Genet. 2008;40;638-45.
12. Lyssenko V, Jonsson A, Pulizzi N, Almgren P, Isomaa B, Tuomi T, et al. Clinical risk factors, DNA variants and the development of type 2 diabetes. New Engl J Med. 2008;359;2220-32.
13. McPherson R, Pertsemilidis A, Kavaslar N, Stewart A, Roberts R, Cox DR, et al. A common allele on chromosome 9 associated with coronary heart disease. Science. 2007;316:14888-91.
14. Frayling T, Timpson Nj, Weedon MN, Zeggini E, Freathy RM, Lindgren CM, et al. A common variant in the FTO gene is asso-ciated with body mass index and predisposes to childhood and adult obesity. Science. 2007;316:889-94.
15. Yasuda K, Miyake K, Horikawa Y, Hara K, Osawa H, Furuta H, et al. Multistage genome-wide SNP association study re-vealed KCNQ1 as a novel susceptibility gene for type 2 dia-betes mellitus in multiple ethnic groups: a report of the Mi-llennium Genome Project of Japan. Nat Genet. 2008;40; 1092-7.
16. Lyssenko V, Nagorny CLF, Erdos MR, Wierup N, Jonsson A, Spégel P, et al. A common variant in the melatonin receptor gene (MTNR1B) is associated with increased risk of future type 2 diabetes and impaired early insulin secretion. Nat Genet. 2008;41:82-8.
38 Endocrinol Nutr. 2008;56(Supl 4):38-42
Obesity and diabetesKONSTANTINOS LOIS AND SUDHESH KUMAR
Warwickshire Institute of Diabetes, Endocrinology & Metabolism (WISDEM). University Hospital Coventry & Warwickshire. Warwick Medical School Coventry. UK.
Obesity and diabetes are closely linked to each other and are cau-satively associated with an atherogenic milieu that increases the risk of adverse cardiovascular events and mortality from all causes. The scope of this article is to describe the most widely accepted theories that link the two diseases, cast light on the unifying metabolic defect and highlight the current and future therapeutic management.
INTRODUCTION
Obesity is a serious growing global health problem affecting more than 400 million people worldwide. It is associated with more than 45 comorbidities and a cluster of atherogenic disorders that compo-se the metabolic syndrome; the later is recognized by the Internatio-nal Diabetes Federation guidelines as a progressive condition that contributes to the development of diabetes, increases the risk of ad-verse cardiovascular events and the mortality from all causes. Al-though intensively researched, a clear answer to why some people are obese and some lean has not been given yet. Analysis of wealth of data support the interaction between genetic, cultural and envi-ronmental-behavioral factors with relative impact accounted for 30%, 10% and 60%, respectively as underlying causes of obesity1. The resultant imbalance between energy intake and expenditure re-sults eventually in excess energy storage in the form of fat.
The prevalence of diabetes has also taken a sharp and unexpected upward turn the late few years. Large epidemiologic studies reveal the parallel escalation of the obesity and diabetes epidemics. Both these metabolic disorders are characterized by defects of insulin action; the term ‘diabesity’ express their close relationship to each other. Up to date, several theories linking different pathogenic me-chanisms that make obese individuals resistant to insulin and their pancreatic β-cells to fail leading eventually to frank diabetes have been suggested. A unifying hypothesis however, still remains elu-sive.
POTENTIAL MECHANISMS LINKING OBESITY TO DIABETES
Most of the suggested theories that link obesity to diabetes re-cognize insulin resistance (IR) as the unifying metabolic defect that
Diabetes mellitus hoy
Correspondence: Prof. S. Kumar. Warwickshire Institute of Diabetes, Endocrinology & Metabolism (WISDEM).University Hospital Coventry & Warwickshire. Warwick Medical School Coventry. UK. E-mail: [email protected]
10 ENDO4 (38-42).indd 3810 ENDO4 (38-42).indd 38 13/11/09 09:02:0813/11/09 09:02:08

Lois K and Kumar S. Obesity and diabetes
Endocrinol Nutr. 2008;56(Supl 4):38-42 39
links obesity to diabetes (fig. 1). Vague et al first in 1956 identified the heterogeneity of obesity with res-pect to regional distribution and biological properties of fat tissue2. Kissebah and Krakower in 19943 and la-ter on many other researchers showed that central adi-posity represents an independent risk factor for the development of IR and diabetes later in life (fig. 2).
“Randle’s glucose-fatty acid’’ hypothesis
For many years, the views on metabolic derange-ments of diabetes have been largely “glucocentric”, considering hyperglycemia the main underlying cause. Philip Randle however in 1963 proposed one set of metabolic pathways by which carbohydrate and fat metabolism interact4. The so called “Randle’s cycle“ provides the reciprocal relationship between fatty acid oxidation and glucose oxidation, according to which the enhanced non-esterified fatty acid (NEFA) oxida-tion inhibits glucose metabolism. Thus, in body situa-tions with lipid excess, as in obesity, the increased plasma NEFAs augment by mass action their cellular uptake and induce their mitochondrial β-oxidation, blocking at the level of substrate competition, interme-diates accumulation, enzyme regulation, intracellular signaling and/or gene transcription the glucose meta-bolism. Clinical studies in healthy volunteers with acu-te elevation of plasma NEFAs resulted in whole body IR, confirming the proposed metabolic model5. Source of the NEFA excess in obese individuals are conside-red the meal-derived fatty acids and lipolysis of the adipose tissue. The visceral fat in particular is of con-siderable significance in the NEFA flux to the liver as according to Frayn6 in obese individuals the omental fat fails to switch from a negative to a positive NEFA balance during the transition from fasting to the pos-tprandial state resulting in enhanced NEFAs mobiliza-
tion even postprandially. Furthermore, in comparison to the peripheral-gluteal adipose tissue, central-abdo-minal fat is metabolically and lipolytically more active, releasing more NEFAs in the bloodstream7; regional differences in the number and sensitivity of adrenore-ceptors8, the activity of 11β-HSD19 and the response of adipocytes to lipogenic/anti-lipolytic effects of insu-lin are considered the underlying pathogenic mecha-nisms.
Ectopic fat storage hypothesis
Although until recently, adipose tissue was conside-red the only tissue in the human body that stores fat, Ravussin et al10 showed that when the diet-derived fat intake is increased, fat storage within and around other tissues and organs including liver, skeletal muscle and pancreatic β-cells, which under normal conditions do not store lipids, takes place. This in turn results in ex-cessive mitochondrial production of toxic reactive lipid species that cause organ-specific oxidative damage and cellular dysfunction, leading progressively to the deve-lopment of IR, impaired glucose metabolism and fina-lly to diabetes (Ectopic fat storage hypothesis)11. The accumulation of toxic metabolites within the pancrea-tic islet β-cells in particular affects insulin secretion and enhances β-cell apoptosis accelerating the progre-ssion to overt diabetes.
Oxidative stress
Oxidative stress refers to a condition in which imba-lance between oxidant generation and antioxidant pro-tection or repair of oxidative damage exists. Normally, during the aerobic cellular metabolic processes, seve-
Lipoproteins
LPLCETPApoE
NEFA Complement factorsAdipsin, C3
Growth factorsTGF-bIGF-1VEGFFGF
Angiogenicfactors
CytokinesTNF-a
IL-6
PeptidesAdiponectin
ResistinPAI-1, relaxin
AngiotensinogenAgouti, RBP-4, vaspin
Visfatin, omentinNPY, Ghrelin
HormonesLeptin
CortisolE1/E2
Fig 1. Cytokines, chemokines, acute phase proteins and other in-flammation-related proteins secreted from adipose tissue.
21
18
15
12
9
6
3
0
RR
Decile (WC, WHR, or BMI)
WCWHRBMI
Fig. 2. Age-adjusted relative risk (RR) of type 2 diabetes by baseline waist circumference (WC), waist-to-hip ratio (WHR), and body mass index (BMI) deciles19.
10 ENDO4 (38-42).indd 3910 ENDO4 (38-42).indd 39 13/11/09 09:02:0813/11/09 09:02:08

Lois K and Kumar S. Obesity and diabetes
40 Endocrinol Nutr. 2008;56(Supl 4):38-42
ral reactive oxygen species (ROS) are produced which act as necessary messengers in biological systems (Re-dox signaling). A currently favored hypothesis sets oxidative stress as the common pathogenic factor lea-ding to IR, β-cell dysfunction, impaired glucose tole-rance and eventually to diabetes in obese individuals. The supporters of this theory suggest that the peroxiso-mal‚ β-oxidation of NEFA excess, leads to excessive intracellular ROS production which in turn activate multiple stress-sensitive signaling cascades that even-tually inactivate insulin receptor and inhibit insulin ac-tion. In β-cells, which seem to be very sensitive to oxi-dative stress due to deficiency in antioxidant enzymes, the accumulating free radicals damage the mitochon-dria and thus blunt the glucose-induced insulin secre-tion and enhance the cellular apoptosis.
The role of adipose tissue as an endocrine organ
The recognition of humoral and neuronal cross-talk between adipocytes, as well as between adipose tissue and distant organs via various receptors that are expres-sed in the fat tissue and of a vast array of adipocyte-de-rived bioactive factors (adipocytokines) with local and systemic effects changed the previous consideration of fat tissue as inert storage depot (table 1). Adipose tissue is nowadays considered a very active endocrine organ which seems to play an essential role in the regulation of whole body’s metabolism and energy homeostasis12. It is suggested that altered secretion of adipocytokines by the extremely enlarged adipocytes in obesity, profoun-dly affects insulin sensitivity and might potentially link obesity with diabetes. The increased plasma resistin along with the decreased concentration of adiponectin is compatible with this suggestion.
Further to its role as endocrine organ that produces bioactive agents which affect whole body’s metabo-lism, studies have also proven that adipose tissue mo-difies the metabolism of circulating hormones. The well defined increased concentration of glucocorti-coids in the visceral fat tissue of obese individuals pro-vides another mechanism of the detrimental effects of central obesity on glucose metabolism, as glucocorti-coids antagonize insulin effects. The enhanced expres-sions of 11β-HSD1 within the visceral fat tissue9 as well as the increasing expression of 5-alpha reductase type 1 with increasing obesity13 provide the biochemi-cal background of the persistently elevated glucocorti-coid effect in obese individuals.
Obesity as a low-grade inflammatory state
In the last decade, scientists have come to view obe-sity as a low-grade inflammatory state. The increased plasma circulating mononuclear cells and lympho-cytes in obese individuals, as well as the adipose tis-sue and whole body’s increased concentration of C-reactive protein (CRP), tumour necrosis factor (TNF)-α, interleukin (IL)-1 and IL-6 are compatible with this suggestion. Adipose tissue per se is considered the ini-tial site of the pro-inflammatory state generation whi-ch eventually expands to the whole body. Visceral fat appears to produce pro-inflammatory markers more actively than subcutaneous adipose tissue, confirming the crucial role of central obesity in the pathogenesis of the obesity-associated morbidities (fig. 3). The su-ggested pathogenic mechanism involves several hete-rogeneous factors in the generation of inflammation within the adipose tissue including tissue hypoxia, toxic effects of the excessive fat storage, gut derived
TABLE 1. Differences between adipocytes from subcutaneous (Sc) and visceral depots18
Factor Regional difference Reference
Leptin mRNA and protein Visceral < Sc Lefebvre et al, 1998; Montague et al, 1997; Harmalen et al, 1998TNF-α Visceral < Sc Hube et al, 1999IL-6 Visceral > Sc Fried et al, 1998PAI-1 Visceral > Sc Shimomura et al, 1996Angiotensinogen mRNA Visceral > Sc Van Harmalen et al, 2000Resistin Visceral = Sc McTernan et al, 2002aAdiponectin Visceral < Sc Fisher et al, 2002Androgen receptor mRNA Visceral > Sc Dieudonne et al, 1998PPARγ visceral = Sc Montague et al, 1998TZD stimulated pre-adipocyte differentiation Visceral < Sc Adams et al, 1997Lipolytic response to catecholamines Visceral > Sc Rebuffé-Scrive M et al, 1989Antilipolytic effect of insulin Visceral < Sc Zierath et al, 1998 Lefebvre et al, 1998β1 and β2-Adrenergic receptor binding and mRNA Visceral > Sc Hellmér et al, 1992; Arner et al, 1990Dexamethasone-induced increase in LPL Visceral > Sc Fried et al, 1993α2-Adrenergic receptor agonist inhibition of cAMP Visceral < Sc Vikman et al, 1996Insulin receptor affinity Visceral < Sc Zierath et al, 1998IRS-1 protein expression Visceral < Sc Zierath et al, 1998Insulin receptor (exon 11 deleted) Visceral > Sc Lefebvre et al, 1998Glucocorticoid receptor mRNA Visceral > Sc Rebuffé-Scrive et al, 1990
IL: interleukin; TNF: tumour necrosis factor.
10 ENDO4 (38-42).indd 4010 ENDO4 (38-42).indd 40 13/11/09 09:02:0813/11/09 09:02:08

Lois K and Kumar S. Obesity and diabetes
Endocrinol Nutr. 2008;56(Supl 4):38-42 41
pathogen-associated molecular patterns (PAMPs), ma-crophages infiltration and increased adipocytes necro-sis. An overlap between metabolic and inflammatory signaling pathways that impair insulin effect in peri-pheral tissues has been demonstrated14,15 linking the obesity-related pro-inflammatory state to IR and dia-betes. Meanwhile the local, within the fat tissue infla-mmation affects the adipocytes which become less insulin sensitive; the resultant suppressed pre-adipo-cytes differentiation and the increased NEFA efflux to the bloodstream enhances the ectopic fat storage and affects peripheral glucose metabolism. Initially, the adipocytes have been exclusively blamed for the fat tissue-derived pro-inflammatory cytokines16. Recent studies however17 revealed that obesity is associated with increased infiltration of adipose tissue with ma-crophages which also secrete in high concentrations inflammatory bioactive agents that fuel systemic in-flammation.
Therapies targeting adipose tissue and insulin resistance
Strategies that reduce fat mass are the cornerstone for the prevention, amelioration and treatment of obe-sity and the associated IR. Increased physical activity and healthy diet with controlled calorie intake remain the first line treatment, while anti-obesity drugs (orlis-tat, siutramine) and bariatric surgery work additionally to lifestyle changes for loss of the excessive body weight.
In current clinical practice drugs such as metformin and PPAR-γ agonists as well as glucagon-like peptide (GLP)-1 analogues and dipeptidylpeptidase (DPP)-4
inhibitors are the main pharmaceutical interventions for the treatment of established IR. Several novel me-dications that target specific molecules and biochemi-cal pathways implicated in the pathogenesis of IR in-cluding INT131 besylate, metaglidasen and MBX-2044, as well as 11β-HSD1 inhibitors (arylsulfonamidothia-zole and adamantyltriazoles), glucocorticoid receptor inhibitors and factors that reverse endoplasmic reticu-lum stress and restore its function (salubrinal, 4-Phenyl butyric acid and taurine-conjugated ursodeoxycholic acid) promise more effective treatment of IR in the fu-ture. The late few years the administration of nutritio-nal supplements (e.g. chromium, magnesium, vitamin D) and pre-/pro-biotics that alter gut flora to ‘lean’ type for the amelioration of IR and diabetes gains many supporters. Similarly do the centrally acting insulin sensitizers including leptin and dopamine D2 receptor agonists. Their role however in clinical practice re-mains to be proved.
CONCLUSION
Obesity and the associated IR are causatively related to an atherogenic metabolic milieu that increases the cardiovascular risk and mortality from all causes ma-king the need of effective treatment more than impera-tive. Although several drugs with anti-obesity proper-ties and insulin sensitizing effects are currently used in clinical practice and much more will come on the mar-ket the following few years, the clinical practitioners should keep in mind that prevention is always better than treatment. Thus, the importance of healthy lifes-tyle in preventing the development of metabolic disor-
Fig. 3. Role of obesity in inflammation-dependent insulin resistance20. ER: endoplasmic reticulum; IR: insulin resistance.
IR
Adipose– Adipocyte hypertrophy– Macrophage recruitment– Macrophage polarity switch– Increased cytokine production–Increased lipolysis– ER stress
Liver– Increased lipid content– Steatosis– Kupffer cell activation/recruitment– Increased cytokine production– ER stress
Skeletal muscle– Increased FFA uptake– Increased extramyocellular adipose– Macrophage activation/recruitment– ER stress
Systemic insulinResistance and inflammation
Obesity
Endocrine crosstalk
10 ENDO4 (38-42).indd 4110 ENDO4 (38-42).indd 41 13/11/09 09:02:0913/11/09 09:02:09

Lois K and Kumar S. Obesity and diabetes
42 Endocrinol Nutr. 2008;56(Supl 4):38-42
ders should be emphasized and more intensive actions for the information of the public should be taken by the medical community and authorities.
Conflict of interest
The authors declare they have no conflict of in-terest.
REFERENCES
1. Greenstein B, Wood D. The endocrine system at a glance. 2nd
ed. Wiley. 2006. p. 92.
2. Vague J. The degree of masculine differentiation of obesities: a
factor determining predisposition to diabetes, atherosclerosis,
gout and uric calculous disease. Am J Clin Nutr. 1956;4:20-34.
3. Kissebah AH, Krakower GR. Regional adiposity and morbidity.
Physiological Reviews. 1994;74:761-809.
4. Randle P J, Garland PB, Hales CN, Newsholme EA. The gluco-
se fatty-acid cycle: its role in insulin sensitivity and the metabo-
lic disturbances of diabetes mellitus. Lancet. 1963;1:785-9.
5. Ferrannini E, Barrett EJ, Bevilacqua S, DeFronzo RA. Effect of
fatty acids on glucose production and utilization in man, J Clin
Invest. 1983;72:1737-47.
6. Frayn K, Humphreys S, Coppack S. Net carbon flux across sub-
cutaneous adipose tissue after a standard meal in normal weight
and and insulin resistant obese subjects. Int J Obes Rel Metab
Disord. 1996;20:795-800.
7. Lönnqvist F, Thörne A, Nilsell K, Hoffstedt J, Arner P. A patho-
genic role of visceral β3-adrenoceptors in obesity. J Clin Invest.
1995;95:1109-16.
8. Van Harmelen V, Lonnqvist F, Thorne A, Wennlund A, Large
V, Reynisdottir S, et al. Noradrenaline-induced lipolysis in
isolated mesenteric, omental and subcutaneous adipocytes
from obese subjects. Int J Obes Relat Metab Disord. 1997;21:
972-9.
9. Stewart PM, Boulton A, Kumar S, Clark PMS, Shackleton CHL.
Cortisol metabolism in human obesity: impaired cortisone–cor-
tisol conversion in subjects with central adiposity. J Clin Endo-
crinol Metab. 1999;84:1022-7.
10. Ravussin E, Smith SR. Increased fat intake, impaired fat oxida-
tion, and failure of fat cell proliferation result in ectopic fat sto-
rage, insulin resistance, and type 2 diabetes mellitus. Ann N Y
Acad Sci. 2002;967:363-78.
11. Lewis GF, Carpentier A, Adeli K, Giacca A. Disordered fat sto-
rage and mobilization in the pathogenesis of insulin resistance
and type 2 diabetes. Endocr Rev. 2002;23:201-29.
12. Ahima RS, Flier JS. Adipose tissue as an endocrine organ.
Trends Endocrinol Metab. 2000;11:327-32.
13. Westerbacka J, Yki-Järvinen H, Vehkavaara S, Häkkinen AM,
Andrew R, Wake DJ, et al. Body fat distribution and cortisol
metabolism in healthy men: enhanced 5beta-reductase and lo-
wer cortisol/cortisone metabolite ratios in men with fatty liver,
J Clin Endocrinol Metab. 2003;88:4924-31.
14. Senn JJ, Klover PJ, Nowak IA, Mooney RA. Interleukin-6 indu-
ces cellular insulin resistance in hepatocytes. Diabetes. 2002;51:
3391-9.
15. Hirosumi J, Tuncman G, Chang L, Görgün CZ, Uysal KT, Mae-
da K, et al. A central role for JNK in obesity and insulin resis-
tance. Nature. 2002;420:333-6.
16. Xu, H, Barnes, GT, Yang, Q, Tang G, Yang D, Chou CJ, et al.
Chronic inflammation in fat plays a crucial role in the develop-
ment of obesity-related insulin resistance J Clin Invest.
2003;112:1821-30.
17. Weisberg SP, Mc Cann D, Desai M, Rosenbaum M, Leibel RL,
Ferrante AWJ. Obesity is associated with macrophage accumu-
lation in adipose tissue, J Clin Invest. 2003;112:1796-808.
18. Montague CT, Prins JB, Sanders L, Zhang J, Sewter CP, Digby
J, et al. Depot-related gene expression in human subcutaneous
and omental adipocytes. Diabetes. 1998;47:1384-91.
19. Wang Y, Rimm EB, Stampfer MJ, Willett WC, Hu FB. Compari-
son of abdominal adiposity and overall obesity in predicting risk
of type 2 diabetes among men. Am J Clin Nutr. 2005;81:555-63.
20. De Luca C, Olefsky JM. Inflammation and insulin resistance.
FEBS Lett. 2008;582:97-105.
10 ENDO4 (38-42).indd 4210 ENDO4 (38-42).indd 42 13/11/09 09:02:0913/11/09 09:02:09
Endocrinol Nutr. 2008;56(Supl 4):43-5 43
Lipid disorders in type 2 diabetesMARKKU LAAKSO
Department of Medicine. University of Kuopio. Kuopio. Finland.
INTRODUCTION
Diabetes affects currently about 5% of world’s populations, and its prevalence is rapidly increasing particularly in elderly sub-jects. Because over 80% of all diabetic subjects have type 2 dia-betes, the increase in the number of diabetic individuals implies an epidemic of type 2 diabetes. Although microvascular disease is also common in patients with type 2 diabetes, cardiovascular di-sease (CVD), particularly coronary heart disease (CHD), is a ma-jor complication of this disease, and over 50% of all patients die of CHD1.
Type 2 diabetes is usually preceded by a long period of asympto-matic hyperglycemia which may last for years. Both insulin resis-tance and type 2 diabetes are characterized by dyslipidemia, which increases the risk for CVD2. Although several mechanisms are like-ly to contribute to accelerated atherosclerosis and increased risk of CVD observed in patients with type 2 diabetes mellitus, dyslipide-mia is perhaps the most important single risk factor among all risk factors3.
DIABETIC DYSLIPIDEMIA
Type 2 diabetes is associated with several changes in lipids and lipoproteins as presented in table 14. The most typical feature of diabetic dyslipidemia is the abundance of triglyceride-rich lipopro-teins. Patients with type 2 diabetes usually have normal levels of total and LDL (low-density lipoprotein) cholesterol, but composi-tional changes in LDL particles occur frequently (small, dense LDL, high triglyceride content and oxidative modification of LDL particles)4.
Triglyceride levels are inversily correlated with HDL (high-den-sity lipoprotein) cholesterol levels. Therefore, it is difficult to in-vestigate the independent role of triglyceride-rich lipoproteins with respect to atherosclerosis and CVD events. HDL in patients with type 2 diabetes is characterized by decreased particle number, and several qualitative changes in particle composition.
The United Kingdom Prospective Diabetes Study (UKPDS) showed that the most important risk factor for fatal and non-fatal MI (myocardial infarction) was high LDL cholesterol5. We also demonstrated in 1059 Finnish patients with type 2 diabetes that
Diabetes mellitus hoy
Correspondence: Dr. M. LaaksoDepartment of Medicine. University of Kuopio. Kuopio and Kuopio University Hospital.Puijonlaaksontie 2. 70210 Kuopio. Finland.E-mail: [email protected]
11 ENDO4 (43-45).indd 4311 ENDO4 (43-45).indd 43 13/11/09 09:03:4713/11/09 09:03:47

Laakso M. Lipid disorders in type 2 diabetes
44 Endocrinol Nutr. 2008;56(Supl 4):43-5
dyslipidemia (high total and LDL cholesterol, high to-tal triglycerides, and low HDL cholesterol) was a sig-nificant contributor to CHD events6.
MECHANISMS FOR THE DEVELOPMENT OF DIABETIC DYSLIPIDEMIA
Triglyceride-rich lipoproteins
Very-low-density lipoproteins (VLDL) and meta-bolites of VLDL, and chylomicron remnants are the triglyceride-rich lipoproteins in patients with type 2 diabetes. The fundamental defect in diabetic dyslipi-demia is hepatic overproduction of large VLDL parti-cles, particularly VLDL1
7. This process is tightly linked to insulin resistance, although it is unclear, what is the causal role of insulin resistance in this process. Overproduction of VLDL particles initiates a series of other changes in lipoproteins and lead to higher levels of remnant particles, small dense LDL, and secondarily to low HDL cholesterol levels. In a recent study fasting insulin, plasma glucose, intra-ab-dominal fat, liver fat and insulin resistance were pre-dictors of VLDL1-apoB and VLDL1-triglyceride pro-duction8.
LOW-DENSITY LIPOPROTEINS
LDL cholesterol level is not elevated in patients with type 2 diabetes. However, for any LDL choleste-rol level, type 2 diabetic individuals generally have increased number of LDL particles indicating that they have more small, dense lipid-poor LDL parti-cles4. Because each LDL particle contains one apoli-poprotein B molecule, patients with type 2 diabetes also have increased levels of apolipoprotein B. An in-creased number of LDL particles might contribute to atherogenesis and cardiovascular disease risk9. Small, dense LDL particles are atherogenic. These particles rapidly enter the arterial wall and can be toxic to en-dothelial cells, cause greater production of procoagu-lant factors, and can be oxidised more readily than the
large buoyant particles. The formation of small dense LDL is closely associated with insulin resistance and hypertriglyceridemia7. Therefore, it is not surprising that the VLDL1 triglyceride level is the major predic-tor of LDL size in individuals with or without type 2 diabetes.
HIGH-DENSITY LIPOPROTEINS
Reduced levels of HDL cholesterol and apolipoprotein AI, the major apolipoprotein in HDL cholesterol, are ty-pical to patients with type 2 diabetes3. In addition, there are abnormalities in the size and composition of the HDL particles7. The function of HDL and apolipoprotein AI is to remove excess cholesterol from atherosclerotic pla-ques. Therefore, their reduced concentrations promote the accumulation of cholesterol in the vessel wall, and lead to atherosclerosis. Furthermore, HDL has anti-infla-mmatory and antioxidant properties4. Compositional ab-normalities in HDL in patients with type 2 diabetes may lead to impaired antiatherogenic properties.
MANAGEMENT OF DYSLIPIDEMIA
The cornerstone of the management of CVD in dia-betes is the use of LDL cholesterol-lowering drugs, statins, even though patients with type 2 diabetes do not have increased concentrations of LDL cholesterol. Several trials have been published on the effects of sta-tin treatment to reduce CVD events. The main report of the Cholesterol Treatment Trialists’ Collaboration10 showed that statin therapy safely reduced the 5-year incidence of major coronary events, coronary revascu-larization, and stroke by about 20% per 1 mmol/l re-duction in LDL cholesterol, largely irrescpective of initial lipid profile or other baseline characteristics.
In a subsequent report the Cholesterol Treatment Trialists’ Collaborators11 analyzed data from 18 686 individuals with diabetes (1466 with type 1 and 17 220 with type 2) in the context of a further 71 370 without diabetes in 14 randomised trials of statin therapy. Du-ring a mean follow-up of 4·3 years, there were 3247 major vascular events in people with diabetes. There was a 9% proportional reduction in all-cause mortality per mmol/L reduction in LDL cholesterol in partici-pants with diabetes, which was similar to the 13% re-duction in those without diabetes. This finding reflec-ted a significant reduction in vascular mortality (0·87, 0·76-1·00; p = 0·008) and no effect on non-vascular mortality (0·97, 0·82-1·16; p = 0·7) in participants with diabetes. There was a significant 21% proportional re-duction in major vascular events per mmol/L reduction in LDL cholesterol in people with diabetes (0·79, 0·72-0·86; p < 0·0001), which was similar to the effect ob-served in those without diabetes (0·79, 0·76-0·82; p < 0·0001). In diabetic participants there were reductions in myocardial infarction or coronary death (0·78, 0·69-
TABLE 1. Diabetic dyslipidemia
Triglyceride-rich lipoproteinsIncreased particle numbers Increased postprandial concentrationsTriglyceride-enriched and cholesterol-enriched particlesLDLIncreased particle numbers Small, dense particlesHDLDecreased particle numbers Several changes in particle composition
HDL: high-density lipoprotein; LDL: low-density lipoprotein.
11 ENDO4 (43-45).indd 4411 ENDO4 (43-45).indd 44 13/11/09 09:03:4813/11/09 09:03:48

Laakso M. Lipid disorders in type 2 diabetes
Endocrinol Nutr. 2008;56(Supl 4):43-5 45
0·87; p < 0·0001), coronary revascularisation (0·75, 0·64-0·88; p < 0·0001), and stroke (0·79, 0·67-0·93; p = 0·0002). The authors concluded that statin therapy should be considered for all diabetic individuals who are at sufficiently high risk of vascular events.
Fibrates have been used since the 1970s in the treat-ment of dyslipidemia. These drugs especially lower plasma triglycerides and increase HDL cholesterol and lower moderately LDL cholesterol. Therefore, it was anticipated that these drugs may significantly reduce CVD event rate. However, the results from the Fenofi-brate Intervention and Event Lowering in Diabetes (FIELD) study were not as favorable as expected11. The FIELD study was designed to assess the effect of fenofibrate on cardiovascular disease events in patients with type 2 diabetes12. The study was a multinational, randomised controlled trial with 9795 participants aged 50-75 years, with type 2 diabetes mellitus, and not ta-king statin therapy at study entry. Patients (2131 with previous cardiovascular disease and 7664 without) with a total-cholesterol concentration of 3·0-6·5 mmol/L and a total-cholesterol/HDL-cholesterol ratio of 4·0 or more or plasma triglyceride of 1·0-5·0 mmol/L were randomly assigned to micronised fenofibrate 200 mg daily (n = 4895) or matching placebo (n = 4900). The primary outcome was coronary events (coronary heart disease death or non-fatal myocardial infarction). The outcome for prespecified subgroup analyses was total cardiovascular events (the composite of cardiovascular death, myocardial infarction, stroke, and coronary and carotid revascularisation).
Analysis was by intention to treat. Averaged over the 5 years’ study duration, 5·9% (n = 288) of patients on placebo and 5·2% (n = 256) of those on fenofibrate had a coronary event (relative reduction of 11%; hazard ra-tio [HR] 0·89, 95% CI 0·75-1·05; p = 0·16). This fin-ding corresponds to a significant 24% reduction in non-fatal myocardial infarction (0·76, 0·62-0·94; p=0·010) and a non-significant increase in coronary heart disease mortality (1·19, 0·90-1·57; p = 0·22). To-tal cardiovascular disease events were significantly re-duced from 13·9% to 12·5% (0·89, 0·80-0·99; p = 0·035). This finding included a 21% reduction in coro-nary revascularisation (0·79, 0·68-0·93; p = 0·003). To-tal mortality was 6·6% in the placebo group and 7·3% in the fenofibrate group (p = 0·18). Fenofibrate was associated with less albuminuria progression (p = 0·002), and less retinopathy needing laser treatment (5·2% vs 3·6%, p = 0·0003). There was a slight increa-se in pancreatitis (0·5% vs 0·8%, p = 0·031) and pul-monary embolism (0·7% vs 1·1%, p = 0·022), but no other significant adverse effects.
Fenofibrate did not significantly reduce the risk of the primary outcome of coronary events. It did reduce
total cardiovascular events, mainly due to fewer non-fatal myocardial infarctions and revascularisations. The higher rate of starting statin therapy in patients allocated placebo might have masked a moderately lar-ger treatment benefit.
Conflict of interest
The author declares he has no conflict of interest.
REFERENCES
1. Haffner SM, Lehto S, Rönnemaa T, Pyörälä K, Laakso M. Mor-
tality from coronary heart disease in subjects with type 2 diabe-
tes and in nondiabetic subjects with and without prior myocar-
dial infarction. N Engl J Med. 1998;339:229-34.
2. Laakso M, Lehto S. Epidemiology of macrovascular disease in
diabetes. Diabetes Rev. 1997;5:294-315.
3. Laakso M. Epidemiology of diabetic dyslipidemia. Diabetes
Rev. 1995;3:408-22.
4. Mazzone T, Chait A, Plutzky J. Cardiovascular disease risk in
type 2 diabetes mellitus: insights from mechanistic studies. Lan-
cet. 2008;371:1800-9.
5. Turner RC, Millns H, Neil HA, Stratton IM, Manley SE, Ma-
tthews DR, et al. for the United Kingdom Prospective Diabetes
Study Group. Risk factors for coronary artery disease in non-
insulin dependent diabetes mellitus: United Kingdom Prospec-
tive Diabetes Study (UKPDS 23). BMJ. 1998;316:823-8.
6. Lehto S, Rönnemaa T, Haffner SM, Pyörälä K, Kallio V, Laakso
M. Dyslipidemia and hyperglycemia predict coronary heart di-
sease events in middle-aged patients with NIDDM. Diabetes.
1997;48:1354-9.
7. Adiels M, Olofsson SO, Taskinen MR, Boren J. Overproductio-
nof very low-density lipoproteins is the hallmark of the dyslipi-
demia in the metabolic syndrome. Arterioscler Thomb Vasc
Biol. 2008;28:1225-36.
8. Adiels M, Taskinen MR, Packard C, Caslake MJ, Soro-Paavo-
nen A, Westerbacka J, et al. Overproduction of large VLDL par-
ticles is driven by increased liver fat content in man. Diabetolo-
gia. 2006;49:755-65.
9. Austin MA, King M-C, Vranizan KM, Krauss RM. Atherogenic
lipoprotein phenotype. A proposed genetic marker for coronary
heart disease risk. Circulation. 1990;82:495-506.
10. Baigent C, Keech A, Kearney PM, Blackwell L, Buck G, Polli-
cino C, et al, for Cholesterol Treatment Trialists’ (CTT) Colla-
borators. Efficacy and safety of cholesterol-lowering treatment:
prospective meta-analysis of data from 90,056 participants in 14
randomised trials of statins. Lancet. 2005;366:1267-78.
11. Kearney PM, Blackwell L, Collins R, Keech A, Simes R, Peto
R, et al; for the Cholesterol Treatment Trialists’ (CTT) Collabo-
rators. Efficacy of cholesterol-lowering therapy in 18,686 people
with diabetes in 14 randomised trials of statins: a meta-analysis.
Lancet. 2008;371:117-25.
12. Keech A, Simes RJ, Barter P, Best J, Scott R, Taskinen MR, et
al. Effects of long-term fenofibrate therapy on cardiovascular
events in 9795 people with type 2 diabetes mellitus (the FIELD
study): randomised controlled trial. Lancet. 2005;366:1849-61.
11 ENDO4 (43-45).indd 4511 ENDO4 (43-45).indd 45 13/11/09 09:03:4813/11/09 09:03:48

46 Endocrinol Nutr. 2008;56(Supl 4):46-9
Present recommendations in type 2 diabetes treatmentHAROLD E. LEBOVITZ
State University of New York Health Science in Brooklyn. Brooklyn. New York. USA.
Recommendations for the treatment of type 2 diabetes have been made by many organizations and expert committees. The so-called “ADA/EASD Consensus Algorithm on the Treatment of Type 2 Diabetes” after several revisions shows two tiers of treatment: Tier 1 based on a “well validated core therapy” and Tier 2 “less well validated therapies”1. Tier 1 uses lifestyle, metformin, sulfonylu-reas, and basal or intensive insulin therapy all of which were in use during 1970s through the 1990s and were neither supported by lar-ge, well controlled clinical trials nor shown to result in long-term glycated hemoglobine (A1C) < 7 %2. Tier 2 allows the use of pio-glitazone but not rosiglitazone; glucagon-like peptide 1 (GLP-1) agonist but not dipeptidyl peptidase 4 (DPP-4) inhibitors; no glitini-des and no alpha-glucosidase inhibitors. An algorithm proposed for Korea suggests testing patients with type 2 diabetes for insulin re-sistance by a short insulin tolerance test and insulin secretion by plasma C-peptide levels3. Patients with predominately insulin defi-ciency are recommended for treatment with lifestyle + insulin pro-ducing regimens and patients with predominately insulin resistant with lifestyle + insulin-sensitizing regimens. The Canadian Guide-lines for Diabetes Management recommend treatment based on A1C < 9.0 %; ≥ 9.0 %; and symptomatic hyperglycemia with me-tabolic decompensation4. First step therapy is lifestyle + metformin; lifestyle + metformin + another agent; lifestyle + metformin + insu-lin respectively. If step 1 does not achieve target A1C then any other pharmacologic agents can be added depending on the advantages and disadvantages for the individual patient. The American Associa-tion of Clinical Endocrinologist have created three roadmaps depen-ding on whether the patient has prediabetes, newly diagnosed dia-betes or established diabetes5. Within each roadmap, the specific treatment recommendations are based on presenting A1C, and the degree of fasting and postprandial glucose excursions.
It is obvious that all of the algorithms proposed are based on the expert opinions of the members of the various panels making the recommendations. When the literature is carefully examined it be-comes apparent that there are relatively few long-term, randomi-zed, controlled comparative trials of the treatment of patients with type 2 diabetes. An additional complication which has recently been identified is that the clinical benefits of therapy are dissocia-ted from surrogate markers of benefits such as A1C by duration of known diabetes6,7, previous clinical vascular complications8 and history of previous glycemic control8-10.
Diabetes mellitus hoy
Correspondence: Dr. H.E. Lebovitz.Department of Medicine, División of Endocrinology.State University of New York Health Science in Brooklyn. 450 Clarkson Avenue. Brooklyn. New York 11203. USA.E-mail: [email protected]
12 ENDO4 (46-49).indd 4612 ENDO4 (46-49).indd 46 13/11/09 09:04:4713/11/09 09:04:47

Lebovitz HE. Present recommendations in type 2 diabetes treatment
Endocrinol Nutr. 2008;56(Supl 4):46-9 47
Thus, it would appear that a treatment scheme based on matching the patient’s pathophysiology with the pharmacology of the various therapeutic agents might provide a better guide to the treatment of type 2 diabe-tes than the various expert committee’s opinions.
Figure 1 illustrates that type 2 diabetes is a disease of the beta cell. The underlying abnormalities appear to be genetically-mediated and are likely to involve combinations of multiple predisposing genes that in-fluence fundamental cellular processes of the beta cell. The result is an increase in beta cell apoptosis without a compensatory increase in beta cell replication lea-ding to a decrease in beta cell mass. Additionally, there appear to be defects in insulin biosynthesis and secre-tion from the remaining beta cells. This overall decrea-se in beta cell function results in fasting and postpran-dial hyperglycemia. Long standing hyperglycemia causes microvascular disease. Poor glycemic control and the development of diabetic nephropathy increase cardiovascular risk factors and the development of ma-crovascular disease late in the course of the disease. Such a sequence occurs in type 2 diabetes in which there is no primary insulin resistance. A similar se-quence of events occurs in another primary beta cell disease, type 1 diabetes.
Another independent metabolic abnormality which has assumed epidemic characteristics in our society is the metabolic syndrome (fig. 1). It is due to an increa-se in ectopic fat in such organs as the visceral fat de-pot, liver, pericardium, muscle, etc. The metabolic consequence of this ectopic fat is the development of insulin resistance, activation of the inflammatory cas-cade, dyslipidemia, endothelial dysfunction, and a
procoagulant state. The aggregate of these associated abnormalities comprise the metabolic syndrome. The metabolic syndrome is a cardiovascular risk syndro-me and is associated with an increase in macrovascu-lar disease. When the metabolic syndrome occurs in the individual with the genetic predisposition to beta cell functional loss, the insulin resistant component markedly accelerates the decreasing beta cell func-tion and will bring about the expression of clinical diabetes at an earlier age and in persons who ordina-rily would not express the disease in a normal life span.
Thus, we can look upon type 2 diabetes as two enti-ties, one relatively uncommon with only a beta cell problem and one increasingly more common with both insulin resistance and a beta cell defect. Obviously, the management of the two different types requires diffe-rent therapeutic strategies11; an insulin providing stra-tegy and an insulin sensitization strategy which may at some stage also require endogenous or exogenous in-sulin supplementation (fig. 2).
Insulin providing therapies11 include drugs that can directly close the beta cell ATP-dependent potassium channel and stimulate insulin secretion independent of glucose-mediated ATP production and agents that acti-vate the GLP-1 beta cell receptor and modulate hyper-glycemia-mediated insulin secretion through a cyclic AMP-mediated pathway (fig. 2). The former agents in-clude the sulfonylureas and meglitinides and the later the GLP-1 receptor agonists and the DPP-4 inhibitors. In the absence of adequate numbers of functioning beta cells, insulin provision can be provided by the various insulin and insulin analogs available. The major side
Defective energy balance Genetic beta cell abnormalities
Metabolic abnormalities
Visceral obesity
Insulin resistanceOrgan triglycerides
Cardiovascular risk factors
Macrovascular disease
Microvascular disease
Hyperglycemia
Deficient insulin secretion
Metabolic syndrome Diabetes mellitus
Fig. 1. Pathogenesis of insulin-re-sistant type 2 diabetes. Beta cell mass and function decrease at an increased rate because of pre-dis-posing genetic abnormalities. In the absence of insulin resistance the number of individuals who will lose sufficient beta cell mass to cause hyperglycemia is rather small (1 to 2% of the adult popu-lation). The metabolic syndrome is a cardiovascular risk syndrome due to an increase in visceral and ectopic fat. This leads to insulin resistance in muscle, liver, adipo-se tissue and endothelial cells. When the metabolic syndrome oc-curs in individuals with the gene-tic predisposition to lose beta cell mass and function, the loss is greatly accelerated and a much larger percentaage of the adult population (10-30%) will develop hyperglycemia within the normal lifespan.
12 ENDO4 (46-49).indd 4712 ENDO4 (46-49).indd 47 13/11/09 09:04:4713/11/09 09:04:47

Lebovitz HE. Present recommendations in type 2 diabetes treatment
48 Endocrinol Nutr. 2008;56(Supl 4):46-9
effects of sulfonylureas and particularly intensive insu-lin therapy are hypoglycemia and weight gain11. The DPP-4 inhibitors are weight neutral and are not prone to significant hypoglycemia11. The GLP-1 receptor agonists cause weight loss and are also not prone to significant hypoglycemia11. The meglitinides are given
prior to each meal and have a major action in reducing meal-mediated hyperglycemia11.
Insulin sensitizing therapies include metformin (bi-guanide class) and thiazolidinediones (peroxisome pro-liferator-activated receptor-gamma (PPARγ) agonists) (fig. 3). Metformin reduces hepatic insulin resistance. Its
Fig. 2. Treatment options for the con-sequences of the beta cell abnormali-ties. These include decreasing the rate of beta cell apoptosis, increasing insulin secretion and directly decrea-sing hyperglycemia. DPP-4: dipepti-dyl peptidase 4; GLP-1: glucagon-like peptide 1.
Genetic beta cell abnormalities
Microvascular disease
Hyperglycemia
Deficient insulin secretion
TreatmentKATP channel closers Sulfonylureas Meglitinides Nateglinide GLP-1 receptor agonistsDPP-4 inhibitors Insulin
TreatmentDecrease apoptosis Thiazolidinediones GLP-1 receptor agonists? Beta cell neogenesis ???
TreatmentAlpha-glucosidase inhibitors Glucagon suppressors DPP-4 Inhibitors, GLP-1 rec. agonists Metformin
Defective energy balance
Visceral obesity
Insulin resistanceOrgan triglycerides
Cardiovascular risk factors
Macrovascular disease
Treatment
Statins Other lipid lowering agents Renin-angiotensin blockers Other antihypertensives Aspirin
Treatment Thiazolidinediones Metformin
TreatmentWeight loss
Treatment
Decrease hunger Increase satiety Increase energy expediture
Fig. 3. Treatment options for the metabolic syndrome. Correcting energy balance and decreasing vis-ceral obesity would be ideal but not readily effective at the present time. Insulin resistence is decrea-sed by metformin and thiazolidine-diones. The specific cardiovascular risk factors (hypertension, dyslipi-demia, procoagulant state) are ma-naged by the appropriate pharma-cologic agents.
12 ENDO4 (46-49).indd 4812 ENDO4 (46-49).indd 48 13/11/09 09:04:4813/11/09 09:04:48

Lebovitz HE. Present recommendations in type 2 diabetes treatment
Endocrinol Nutr. 2008;56(Supl 4):46-9 49
mechanism is unclear though several involving intrace-llular metabolism have been proposed. The thiazolidine-diones reduce both hepatic and peripheral insulin resis-tance11. Their mechanism appears to be in reducing the metabolic effects of the ectopic fat deposits, i.e. decrea-sing plasma free fatty acids, decreasing tumor necrosis factor alpha and interleukin 6 production, increasing adiponectin production and reducing hepatic steatosis11. The choice of insulin sensitizers depends on the degree and site of the insulin resistance to be treated. Metfor-min therapy is associated with a small weight loss, can-not be used in the presence of decreased renal function and is associated with gastrointestinal discomfort, diarr-hea and decreased vitamin B12 levels11. Thiazolidinedio-nes are associated with weight gain, fluid retention (in-frequently precipitating heart failure) and bone fractures involving peripheral extremities and mostly occurring in women11. Thiazolidinediones appear to decrease the rate of loss of beta cell function (fig. 2).
Several studies have demonstrated that the greatest re-duction in vascular complications in type 2 diabetic pa-tients is achieved by a multifactorial approach to treating all of the metabolic abnormalities including hyperglycemia, obesity, hypertension, hyperlipidemia and the pro-coagu-lant state7,12. A proposed strategy is depicted in figure 3.
Conflict of interest
Advisory Boards: Amylin, Biocon, Glaxo SmithKli-ne, Novo-Nordisk, Sanofi-Aventis. Speaker: Glaxo SmithKline, Lilly. Shareholder: Amylin, Merck.
REFERENCES
1. Nathan DM, Buse JB, Davidson MB, Ferranninni E, Holman
RR, Sherwin R, et al. Medical management of hyperglyce-
mia in type 2 diabetes: A consensus algorithm for the initia-
tion and adjustment of therapy. Diabetes Care. 2009;32:193-
203.
2. UK Prospective Diabetes Study Group: Effect of intensive blood
glucose control with metformin on complications in overweight
patients with type 2 diabetes (UKPDS 34). Lancet. 1998;352:854-
65.
3. Choi SH, Hur KY, Kim DJ, Ahn CW, Kang ES, Cha BS, et al.
Staged diabetes management according to individual patient in-
sulin resistance and β-cell function ameliorates glycaemic con-
trol in type 2 diabetes mellitus. Clin Endocrinol(Oxf). 2008;69:
549-55.
4. Canadian Diabetes Association 2008. Clinical Practice Gui-
delines for the Prevention and Management of Diabetes in
Canada. Canadian Journal of Diabetes. 2008;32 Suppl 1:S1-
201.
5. Jellinger PS, Davidson JA, Blonde L, Einhorn D, Grunberger G,
Handelsman Y. Road maps to achieve glycemic control in type
2 diabetes mellitus: ACE/AACE Diabetes Road Map Task For-
ce. Endocr Pract. 2007:13:260-8.
6. Duckworth W. Veterans Affairs Diabetes Trial: Results. Presen-
ted at the 68th Annual Scientific Sessions of the American Dia-
betes Association 2008 Annual Meeting.
7. Duckworth W, Abraira C, Moritz T, Reda D, Emanuele N,
Reaven PD, et al. Glucose control and vascular complications in
veterans with type 2 diabetes. N Engl J Med. 2009;360:129-
39.
8. Gerstein HC, Miller ME, Byington RP, Goff DC Jr, Bigger JT,
Buse JB, et al. ACCORD study group. Effects of intensive glu-
cose lowering in type 2 diabetes. N Engl J Med. 2008;358:2545-
59.
9. DCCT/EDIC Research Group. Sustained effect of intensive
treatment of type 1 diabetes mellitus on development and pro-
gression of diabetic nephropathy. The Epidemiology of Diabe-
tes Interventions and Complications (EDIC) Study. JAMA.
2003;290:2159-67.
10. Holman RR, Paul SK, Bethel A, Matthews DR, Neil HAW. Ten
year follow-up of intensive glucose control in type 2 diabetes. N
Engl J Med. 2008;359:1565-76.
11. Lebovitz HE. Present recommendations in type 2 diabetes me-
llitus treatment. Chapter 15. Lilly Book on Type 2 Diabetes.
12. Gaede P, Lund-Andersen H, Parving H-H, Pedersen O. Effect of
a multifactorial intervention on mortality in type 2 diabetes. N
Engl J Med. 2008;358:580-91.
12 ENDO4 (46-49).indd 4912 ENDO4 (46-49).indd 49 13/11/09 09:04:4813/11/09 09:04:48

50 Endocrinol Nutr. 2008;56(Supl 4):50-2
Natural history and immunopathogenesis of type 1 diabetesPAOLO POZZILLI, ROCKY STROLLO AND ILARIA BARCHETTA
Department of Endocrinology and Diabetes. University Campus Bio-Medico of Rome. Rome. Italy.
INTRODUCTION
Type 1 diabetes (T1D) develops in the majority of cases as result of chronic progressive β-cell destruction. This inflammatory dama-ge depends on a selective loss of immune tolerance, that leads to an extensive infiltration of both helper and cytotoxic T-lymphocytes in the pancreatic islets. The autoimmune mechanism is proven by the presence of a pool of autoantibodies (Abs) against structural and secretory β-cell proteins even before the disease onset (anti gluta-mic acid decarboxylase [GAD], anti-tyrosine phosphatase [IA 2], anti-insulin). This process, once started, and in presence of 2 or more Abs, leads to the disease in almost every subject. Different pathogenic components participate in the development of T1D, considered, therefore, a typical multifactorial autoimmune disease. Genetic features, immunological aspects and environmental factors have a different weight in determining the onset of type 1 diabetes depending on the age at the diagnosis. The genetic susceptibility extends from a marked effect in childhood-onset T1D to the relati-vely limited effect detected in LADA (Latent Autoimmune Diabe-tes of the Adult)1, as shown, for example, by the age-dependent diminishing twin concordance. It is clear, therefore, that there is a continuum in the pathological factors that lead to an age-related increased influence of immunological and environmental compo-nents despite the reduction in genetics weight. It is interesting to note that new elements are emerging in the natural history and im-munopathogenesis of T1D including epidemiology, genetics, im-munology and the effect of environment on clinical presentation.
EPIDEMIOLOGY
During past years, an increase in incidence and earlier age of onset of T1D have been observed worldwide2. In a 10-years (1996-2005) prospective study of T1D incidence among Moscow young population (age: 0-14 yrs) a significantly higher incidence of T1D than 1970s and 1980s has been shown (average incidence: 12.9 per 100,000 vs 5 and 9 per 100,000 during the previous decades, res-pectively)3. This was the first study to report on validated incidence
Diabetes mellitus hoy
Correspondence: Dr. P. Pozzilli.Department of Endocrinology and Diabetes. University Campus Bio-Medico of Rome. Via Alvaro del Portillo, 21. 00128 Rome. Italy.E-mail: [email protected]
Pozzilli P et al. Natural history and immunopathogenesis of type 1 diabetes
Endocrinol Nutr. 2008;56(Supl 4):50-2 51
data for T1D in Russia and also show that incidence of T1D in Moscow is comparable to that of those Euro-pean countries having an intermediate incidence rates. It should also be noted that the average incidence rate increased during the years, reaching a peak in 2005; it could be justify by the arising diffusion of environmen-tal risk factors even in Eastern Europe population4.
GENETICS
The greatest susceptibility to T1D is determined by genes involved in immune response. In particular, the HLA complex gene region (short arm of chromosome 6) determines about 40% of the familiar clustering of the disease. HLA molecules play a major role in con-trolling immune responses by binding antigenic pepti-des of foreign and endogenous origin and presenting them to T-lymphocytes. Other genes (INS, PTPN22, CTLA4, etc.) are involved in the determination of ge-netic susceptibility but they play a minor role5. The HLA complex locus is the most polymorphic gene re-gion. The HLA-encoded risk of diabetes is determined by the HLA genotype (HLA haplotypes of both chro-mosomes) and there is a spectrum of risk: the highest risk is associated with heterozygous DR3/4 genotype, which is found in over one third of patients, but only in 2-3% of healthy individuals. Other genotypes are clas-sified as moderate and low risk HLA haplotypes. Re-cent studies demonstrate that the genetic contribution in individuals diagnosed with T1D has changed over the last five decades. The incidence of childhood-onset of T1D has been increasing progressively over the last half century and it is accounted for by individuals with lower-risk HLA genotype who, in the past, would not have developed diabetes in childhood6. As demonstra-tion of the major role of HLA genotype in disease de-velopment, recent studies identify a relationship bet-ween the HLA-encoded risk and titers of beta cell autoantibodies.
IMMUNOLOGY
The titer of autoantibodies against beta cells repre-sent an index of immune system activity and may re-flect the degree and speed of beta cell destruction. Recently, Buzzetti et al7 demonstrate that in adult on-set autoimmune diabetes GADA titer follows a bimo-dal distribution: this type of distribution identifies two groups of patients: a) patients with a high GADA titer in which the autoimmune process is presumably strong, and b) patients with low GADA titer reflec-ting a less intense autoimmune process. The hetero-geneity based on the GADA titer was supported by genetic analysis: DRB1*03 – DQB1*0201 was found with the highest frequency in patients with high GADA titers, with a decreasing trend in patients with low GADA titers. These data confirm that genetics is
a major determinant of autoimmunity. However, adult onset autoimmune diabetes is a particular form of diabetes that differs from classical childhood T1D, being often characterized by a slowly progressive au-toimmune process with a phenotype indistinguishable from classical type 2 diabetes (T2D). In these pa-tients, GADA titer may be used to stratify the risk of progression to insulin dependence. Subjects with low GADA titer have less prominent characteristics of in-sulin deficiency. In these subjects factors other than genetic susceptibility may have a major role in disea-se development. In fact, patients with low GADA titer show intermediate values between patients with high GADA titers and those with T2D. In addition, these subjects present features of a mild insulin resistance phenotype, suggesting that new factors or modified classical factors are needed for the development of diabetes in association with a low-grade autoimmuni-ty response. These studies indicate that both autoim-munity and insulin resistance may contribute to the pathogenesis of autoimmune diabetes with a variable degree of synergism. Therefore, other factors can ex-plain the new features of autoimmune diabetes (in-crease of forms associated with a low/intermediate HLA-risk and increase of slowly progressive forms of autoimmune diabetes).
CLINICAL PRESENTATION AND THE ENVIRONMENT
Recently, Hekkala et al8 observed a decreased fre-quency of diabetic ketoacidosis among under 15 sub-jects with T1D, but children younger than 2 years, in association with an increased rate of incidence in Fin-land and in almost every European State. In addition, an increased prevalence of overweight children has been reported in Europe, especially in the Southern countries9. Several “obesogenic” factors have been considered to explain this critical and unhealthy si-tuation: a sedentary life-style, lack of physical activi-ty, even because of the absence of parks and play areas, consumption of energy-dense foods and soft drinks in place of fruit and vegetables. Sandhu et al10 have demonstrated a higher prevalence of overweight among T1D children than normal subjects. The diffe-rence increases in females and during the years, ac-cording to previous studies that showed a pubertal-but not pre-pubertal-difference in body mass index (BMI) between T1D patients and healthy children. In this unhealthy setting of increased obesity, a new en-tity of diabetes has been described: double diabetes (DD)11. DD is the result of the interaction between obese/overweight phenotype and β-cell autoimmuni-ty and could be defined as the presence of obesity or overweight in patients with basal C-peptide levels > 0.3 nmol and GADA positivity. In our pilot study, de-signed to evaluated the prevalence of DD in a Cauca-sian population of 5-20 yrs diabetic patients, we found
Pozzilli P et al. Natural history and immunopathogenesis of type 1 diabetes
52 Endocrinol Nutr. 2008;56(Supl 4):50-2
ACKNOWLEDGMENTS
We wish to thank Fondazione Alberto Sordi (Rome) which constantly supports studies in our Department.
REFERENCES
1. Leslie RD, Williams R, Pozzilli P. Clinical review: type 1 diabe-tes and latent autoimmune diabetes in adults: one end of the rainbow. J Clin Endocrinol Metab. 2006;91:1654-9.
2. Onkamo P, Väänänen S, Karvonen M, Tuomilehto J. Worldwide increase in incidence of type I diabetes--the analysis of the data on published incidence trends. Diabetologia. 1999;42:1395-403.
3. Pronina EA, Petraikina EE, Antsiferov MB, Duchareva OV, Pe-trone A, Buzzetti R, et al. A 10-year (1996-2005) prospective study of the incidence of Type 1 diabetes in Moscow in the age group 0-14 years. Diabet Med. 2008;25:956-9.
4. Rogacheva A, Laatikainen T, Tossavainen K, Vlasoff T, Pante-leev V, Vartiainen E. Changes in cardiovascular risk factors among adolescents from 1995 to 2004 in the Republic of Kare-lia, Russia. Eur J Public Health. 2007;17:257-62.
5. Eisenbarth GS, Jeffrey J. The natural history of type 1A diabe-tes. Arq Bras Endocrinol Metabol. 2008;52:146-55.
6. Fourlanos S, Varney MD, Tait BD, Morahan G, Honeyman MC, Colman PG, et al. The rising incidence of type 1 diabetes is accounted for by cases with lower-risk human leukocyte antigen genotypes. Diabetes Care. 2008;31:1546-9.
7. Buzzetti R, Di Pietro S, Giaccari A, Petrone A, Locatelli M, Suraci C, et al; Non Insulin Requiring Autoimmune Diabetes Study Group. High titer of autoantibodies to GAD identifies a specific phenotype of adult-onset autoimmune diabetes. Diabe-tes Care. 2007;30:932-8.
8. Hekkala A, Knip M, Veijola R. Ketoacidosis at diagnosis of type 1 diabetes in children in northern Finland: temporal changes over 20 years. Diabetes Care. 2007;30:861-6.
9. Lobstein T, Frelut ML. Prevalence of overweight among chil-dren in Europe. Obes Rev. 2003;4:195-200.
10. Sandhu N, Witmans MB, Lemay JF, Crawford S, Jadavji N, Pa-caud D. Prevalence of overweight and obesity in children and adolescents with type 1 diabetes mellitus. J Pediatr Endocrinol Metab. 2008;21:631-40.
11. Pozzilli P, Buzzetti R. A new expression of diabetes: double dia-betes. Trends Endocrinol Metab. 2007;18:52-7.
12. Guglielmi C, Astorri E, Portuesi R, Bombardieri M, Valorani M, Pozzilli P. A diet rich in protein and poor in starch with reduced food intake prevents diabetes in the NOD mouse: the significan-ce of Reg gene expression in the pancreas. Diabetologia. 2008;51Suppl 1:abstract 561.
a prevalence of 4.96% of subjects with DD. This new expression of diabetes, and its relatively high preva-lence among autoimmune diabetic population, may be explained by the “accelerator hypothesis”. Based on this theory, fatty mass may contribute β-cell au-toimmunity and apoptosis in the process that leads to the loss of β-cells and, finally, to the development of T1D. The study of Guglielmi et al12 which has evalua-ted the effects of a dietary restriction vs “ad libitum” diet on the development of diabetes in non-obese dia-betic (NOD) mice, showed a significantly reduced onset of diabetes in mice using a low-calories and high protein-content diet.
CONCLUSION
T1D is a multifactorial autoimmune disease resul-ting of synergistic effects of genetic, environmental and immunological factors. Genetic susceptibility ac-counts for at least half of the lifetime risk, and the weight of genetic component could predict the early onset of disease. In recent years the incidence of T1D has been increasing progressively, particularly in ear-ly age. However, the rising incidence of T1D was ac-companied by changes in clinical presentation. Parti-cularly, a new form of diabetes, DD, with childhood onset, signs of autoimmunity (typical of T1D) and characterised by obesity and insulin resistance (typi-cal of T2D) is appearing, suggesting that the weight of environmental component on the genesis of au-toimmune diabetes may have a progressively increa-sing role and may contribute to trigger autoimmunity also in individuals with lower-risk genotype who, in the past, would not have developed diabetes in child-hood.
Conflict of interest
The authors declare they have no conflict of in-terest.

Endocrinol Nutr. 2008;56(Supl 4):53-5 53
Worldwide childhood type 1 diabetes epidemiologyGYULA SOLTÉSZ
Department of Paediatrics. Pecs University. Pecs. Hungary.
CLINICAL AND PUBLIC HEALTH SIGNIFICANCE OF CHILDHOOD TYPE 1 DIABETES
Type 1 diabetes is one of the most common endocrine and meta-bolic conditions in childhood. Treatment is life-saving and lifelong, it is painful and time-consuming, it interferes with daily life, requi-res self-discipline and a balanced diet.
Many children and adolescents are unable to cope emotionally with their diabetes, diabetes causes them embarrasment, results in discrimination and limits social relationships. It may impact on school performance, on family functioning and it can lead to fami-ly disruption and divorce.
Parents experience financial burden, they may have to reduce their working hours or give up work entirely in order to care for the child. The financial burden may be enhanced by the expenses of new treatment and monitoring modalities such as insulin pumps and continuous, real time (interstitial) glucose monitoring, the cost- effectiveness of which are less well-documented as compared to adults with type 1 diabetes.
MAPPING THE GLOBAL TRENDS IN INCIDENCE OF TYPE 1 DIABETES
Two international collaborative projects, the Diabetes Mondiale study (DiaMond) and the Europe and Diabetes study (EURODIAB) began in the 1980s and have been instrumental in monitoring trends in incidence through the establishment of population-based regio-nal or national registries using standardized definitions, data co-llection forms and methods for validation.
GLOBAL VARIATION IN INCIDENCE
The first important result of the establishment of the internatio-nal (and national/regional) registries was the recognition of the extremely wide global variation in the incidence of childhood type 1 diabetes. The overall standardized incidence varies from 0.1/100 000 per year in the Zunyi region within China to more than 40/100 000 per year in Finland1. This represents an approxi-mately 400-fold variation inincidence in the over 100 populations/countries studied2.
Diabetes mellitus hoy
Correspondence: Dr. G. Soltész.Department of Pediatrics. Pecs University. 7 Jozsef Attila St. 7623 Pecs. Hungary.E-mail: [email protected]
14 ENDO4 (53-55).indd 5314 ENDO4 (53-55).indd 53 13/11/09 09:07:4813/11/09 09:07:48

Soltész G. Worldwide childhood type 1 diabetes epidemiology
54 Endocrinol Nutr. 2008;56(Supl 4):53-5
Europe has by far the most complete and reliable data. Many countries have registries that either are na-tionwide or cover several different parts of the country. European countries show the broadest range of inci-dence rates. The incidence rate is highest in populatio-ns in Europe or in populations of European origin (e.g., USA, Canada, Australia, and New Zealand)1.
In Europe, a north–south gradient has been descri-bed3,4, with Sardinia as an outlier being 3000 km south of Finland and having a similarly high incidence rate.
– Africa. Published rates are available only in very few countries in Africa. Furthermore, tropical and malnu-trition diabetes may account for a proportion of ca-ses. The incidence in this region is generally low.
– Eastern Mediterranean and Middle East. The inci-dence varies between 1/100 000 per year (Pakistan) and 8/100 000 per year (Egypt)2.
– North America. Rates for only a few countries are available, but these provide estimates for the three largest countries. USA (16.1/100 000 per year) and Canada (21.7/100 000 per year) have incidence rates similar to Northern Europe, but the incidence in Mexico is low (1.5/100 000 per year)2.
– South and Central America. The incidence in this region is generally low except for some South Ame-rican countries, e.g., Argentina (6.8/100 000 per year) and Uruguay (8.3/100 000 per year)2.
– Southeast Asia. Only two countries, India and Mau-ritius, have published rates. Two sources for India are available, both from Urban Madras, and therefore not representative of the country as a whole. The first study showed an incidence rate of 4.2/100 000 per year, and the rate in the second study was more than double as compared with that in the first2. The inci-dence in Mauritius was low (1.4/100 000 per year)2.
– Western Pacific. With the exception of Australia and New Zealand, the incidence in this region is unifor-mly low. China, the world’s most populous country, has one of the lowest incidence rates in the world1.
Detailed tabulation of the worldwide incidence ratescan be found in the IDF ATLAS2 and DIAMOND report1.
The explanation for the wide disparities in incidence between populations and ethnic groups could be the differences in the distribution of genetic susceptibility markers, differences in the distribution of environmen-tal disease determinants, or the combination of both.
WITHIN-COUNTRY VARIATION IN INCIDENCE
In many countries having data from more than two registries, a marked within-country variation in inciden-ce has been reported. The variation in incidence in the four Italian regions participating in EURODIAB was more than fivefold4. This large difference was mainly because of the very high incidence in the Mediterranean
island of Sardinia as opposed to other mainland Italian regions. The important within-country differences in in-cidence have been reported for other countries as well. In Spain, the variaton in incidence among the regions are more than threefold5,6 (table 1).
AGE-SPECIFIC INCIDENCE
In general, the incidence increases with age, the in-cidence peak is at puberty with the associated gender effect1. The pooled data of the DIAMOND group have demonstrated that the 5 to 9-yr olds had 1.62 (95% confidence intervals 1.57-1.66) times higher risk, and the 10 to 14-yr olds had 1.94 (1.89-1.98) times higher risk as compared with the 0 to 4-yr olds1. After the pubertal years, the incidence rate significantly drops in young women but remains relatively high in young adult males up to the 29-35 yr of age7.
SEX-SPECIFIC INCIDENCE
Unlike the other common autoimmune diseases of childhood such as thyrotoxicosis and Hashimoto’s thyroiditis, which affect mainly girls, type 1 childhood diabetes does not show a female bias. The overall sex ratio is roughly equal in children. A minor male excess in incidence have been reported in Europe and in po-pulations of European origin and a slight female excess in populations of African or Asian origin1. There is a weak association between male sex and high inciden-ce: populations with an incidence higher than 23/100 000 year have a male excess and populations with an incidence lower than 4.5/100 000 per year have a fe-male excess.In contrast to children, however, male ex-cess is a constant finding in type 1 diabetes populations of European origin 15-40 yr of age7.
INCREASING INCIDENCE AMONG THE YOUNG
The incidence of childhood onset type 1 diabetes is increasing in many countries in the world. There are clear indications of geographic differences in trends but the overall annual increase is estimated around 3%. There is some indication that incidence is increasing more steeply in some of the low prevalence countries
TABLE 1. The incidence of childhood type 1 diabetes in Spain (per 100 000 per year)5,6
Navarra 9.5Catalonia 11.5Galicia 17.6Castilla-León 22.1Ciudad Real 26.0La Palma island 31.6
14 ENDO4 (53-55).indd 5414 ENDO4 (53-55).indd 54 13/11/09 09:07:4913/11/09 09:07:49

Soltész G. Worldwide childhood type 1 diabetes epidemiology
Endocrinol Nutr. 2008;56(Supl 4):53-5 55
2. Soltész G, Patterson C, Dahlquist G. Global trends in childhood
type 1 diabetes. In: Diabetes Atlas. chapter 2.1. 3rd ed. Interna-
tional Diabetes Federation; 2006. p. 153-90.
3. Green A, Gale E, Patterson C; for The EURODIAB ACE Stu-
dy Group. Incidence of childhood-onset insulin-dependent
diabetes mellitus: the EURODIAB ACE study. Lancet. 1992;
339:905-9.
4. EURODIAB ACE Study Group. Variation and trends in inci-
dence of childhood diabetes in Europe. Lancet. 2000;355:873-
6.
5. Bahillo MP, Hermoso F, Ochoa C, García-Fernández JA, Rodri-
go J, Marugán JM, et al. Incidence and prevalence of type 1
diabetes in children aged <15 yr in Castilla-Leon (Spain). Pe-
diatr Diabetes. 2007;8:369-73.
6. Belichón S. Somoza BM, Hernández Bayo JA, Cabrera Rodrí-
guez R. Incidence of childhood type 1 diabetes (0-14 years) in
La Palma Island:1993-2007. Diabetologia. 2008;51 Suppl 1:
S158.
7. Kyvik K, Nystrom L, Gorus F, Songini M, Oestman J, Castell
C, et al. The epidemiology of type 1 diabetes mellitus is not the
same in young adults as in children. Diabetologia. 2004;47:377-
84.
8. Patterson C, Dahlquist G, Gyurus E, Green A, Soltész G;
EURODIAB Study Group. Incidence trends for childhood type
1 diabetes in Europe during 1989-2003 and and predicted new
cases 2005-20: a multicentre prospective registration study.
Lancet. 2009;373:2027-33.
such as those in Central and Eastern Europe. Moreover, several European studies have suggested that in relati-ve terms, increases are greatest in young children8.
The clinical implications of a decreasing age at diag-nosis are severalfold. Diagnosis may be delayed or missed because of the subtle ad misleading symptoms. Ambulatory initiation of treatment may not be possible leading to more costly hopitalisation. Presentation ke-toacidosis is more frequent as compared to older age groups and these children face long prepubertal years with hyperglycemia with the risk of early development of micro- and macrovascular complications.
Conflict of interest
The author declares he has not conflict of interest.
REFERENCES
1. The DIAMOND Project Group. Incidence and trends of child-
hood type 1 diabetes worldwide 1990-1999. Diabet Med. 2006;
23:857-66.
14 ENDO4 (53-55).indd 5514 ENDO4 (53-55).indd 55 13/11/09 09:07:4913/11/09 09:07:49

56 Endocrinol Nutr. 2008;56(Supl 4):56-9
Gene-environment interaction in type 1 diabetes mellitusMASSIMO TRUCCO
Division of Immunogenetics. Children’s Hospital of Pittsburgh. Rangos Research Center. Pittsburgh, Pa. USA.
Type 1 diabetes (T1D) mellitus can best be characterized as a disorder of gluco-regulation due to the insufficient production of a single critical hormone: insulin. Since the middle of the last cen-tury the most efficient pharmacologic solution has been to adminis-ter the hormone to the patient daily. Increasingly sophisticated do-sing schedules together with the availability of recombinant variants of the hormone have succeeded in granting normal lifespan to type 1 diabetics. Nevertheless, no matter the degree of sophistication, current even aggressive regimens have not proven capable of fai-thfully recapitulating the normal performance of the endogenous insulin producing beta cells in response to glucose. This limit leads to the inevitable principal causes of morbidity and mortality asso-ciated with T1D, namely the complications of kidney and heart together with ocular and neural diseases.
While insulin replacement continues to be the primary treatment, the need to establish physiologic gluco-regulation in order to avoid complications has led to multiple avenues of alternative interven-tions, most of which are at the experimental stage. What all of these interventions have in common, however, is the hurdle impo-sed by the immune system at the level of ongoing autoimmunity and, in some cases, at the level of transplant rejection by the host1,2. Autoimmunity in T1D is characterized by an inflammatory respon-se against the insulin-producing beta cells of the pancreas, a chro-nic inflammation around and in the pancreatic islets of Langerhans termed “peri-insulitis” and “insulitis”, respectively. As studied in the two classic rodent models of the disease (diabetes-prone Bio-Breeding, DP-BB, rat and non obese diabetic, NOD, prone mouse), early on in the acute phase of the immune attack the islets exhibit an abundant cell infiltration by mononuclear cells, macrophages and dendritic cells (DC). With time, T-cells become the major cons-tituent of the insulitis and are responsible for the greatest beta cell damage and destruction. The clinical onset manifests once the number of surviving beta cells cannot secrete sufficient insulin to satisfy the body’s needs.
A strong genetic predisposition is a conditio sine qua non of T1D and a large body of studies support that key genetic susceptibility loci affect the genesis, function and survival of immune cell sub-sets. To understand the critical role played by the genetic predispo-sition in T1D, it is necessary to consider the processes that shape
Diabetes mellitus hoy
Correspondence: Dr. M. Trucco.Hillman Professor of Pediatric Immunology.Head, Division of Immunogenetics.Children’s Hospital of Pittsburgh.Rangos Research Center.Pittsburgh, Pa, USA.E-mail: [email protected]
15 ENDO4 (56-59).indd 5615 ENDO4 (56-59).indd 56 13/11/09 09:09:0613/11/09 09:09:06

Trucco M. Gene-environment interaction in type 1 diabetes mellitus
Endocrinol Nutr. 2008;56(Supl 4):56-9 57
the immune system: A randomized pool of immature cells continuously generated in the bone marrow (BM) eventually reach the thymus. Once in the thymus, these immature cells, individually expressing unique recep-tors, undergo positive and negative selection through receptor interaction with fragments of proteins (pepti-des) present in our bodies (the “self”) by antigen-pre-senting cells (APC) once properly inserted in the pep-tide-binding groove of Major Histocompatibility Complex (MHC) molecules. Indeed, the epithelial thy-mus is now known to express a wide array of self-anti-gens, including insulin, all of which are normally pro-duced by cells targeted in a number of autoimmune disorders. Human leukocyte antigens (HLA), the hu-man MHC molecules, anchored in the membrane of thymic epithelial cells and other APC, display HLA/self-peptide complexes for T-cell receptor (TCR) inte-raction. A cell that interacts strongly with the HLA/self-peptide complex dies in the thymus and is thus eliminated, i.e., negatively selected. On the contrary, cells that interact poorly with the complex do not pro-liferate sufficiently or become unable to function (i.e., anergic) and are eventually lost. The cells showing affi-nities between these two extremes proliferate modest-ly, receive a positive signal (positive selection), survive and emerge from the thymus to circulate in the peri-phery. Once in the periphery, the cells that matured in the thymus (T cells) can be engaged by circulating APC. DC are extremely powerful APC that collect fo-reign or “ignored” (i.e., not previously exposed to the immune system) material, to present it as “new” anti-gens to T cells through their HLA molecule. These T cells interact with these new antigens promoting the phenomenon of epitope spreading (i.e., the expansion of newly recognized antigens) observed in the islet in-flammation. The pathologic vicious circle of continuo-us presentation of old and new antigens, collected by the DC from the newly destroyed beta cells, to naive T cells in the pancreatic lymph nodes that eventually go back to the pancreas to kill other beta cells, is what eventually brings to clinically-overt diabetes3,4.
The reduced expression of certain self-antigens, like insulin, at the thymus epithelium cell surface may inter-fere with a successful negative selection. Also, even in the case in which self-antigens are normally expressed, allelic forms of the HLA class II molecules (like the HLA-DQ that lack a charged amino acid at position 57 of its beta chain) were shown to be strongly correlated with the development of T1D. Conversely, resistance to the disease was found to be associated with the inheri-tance of an HLA-DQ allelic form with an aspartic resi-due at the same position (Asp57).The importance of this amino acid change has to do with the physical structure of the non-Asp57 alleles constituting class II molecules with a suboptimal functional groove. In fact, the mole-cular interactions that normally drive positive and nega-tive selection are altered by the disease-associated HLA molecules so that even strongly self-reactive T cell clo-nes are allowed to escape to the periphery5-7.
Evidence of beta cell regeneration promoted by bone marrow or stem cell allo-transplantation in new-onset disease NOD mice has been observed by several groups. On this basis we were not surprised to see that in the NOD mouse as well, abrogation of autoimmuni-ty is sufficient to promote regeneration or rescue of the insulin-producing beta cells in the host endocrine pan-creas even after the onset of the disease8. These studies suggest that, although the physiological state of islet cells tends towards a fully differentiated phenotype, the lack of autoimmune aggression, together with the “danger” signals generated by massive beta cell des-truction may trigger processes inside progenitors (whe-ther islet-resident or ductal epithelium-resident) that result in some degree of islet cell regeneration9-12. T1D pathogenesis is then a dynamic process. Once self to-lerance is lost and beta cells begin to be destroyed, the system reaches a new equilibrium in which the newly-differentiated beta cells are in turn eliminated by the ongoing autoimmune process.
Interestingly, we have recently shown that the in vi-tro treatment of DC with CD40, CD80, and CD86 an-tisense oligodeoxyribonucleotides (AS-ODN), reduce co-stimulatory molecule levels at their surface, produ-cing functionally-immature DC capable of preventing or reversing new onset diabetes in the NOD mouse13. This was accomplished while maintaining T-cell res-ponsiveness to alloantigens in animals that received repeated injections of modified DC. Co-stimulatory depleted DC also augmented the number of T regula-tory cells (Treg) that were CD4+ CD25+ Foxp3+ through short-range IL-7 signaling14. We also are cu-rrently conducting an NIH-funded, FDA-approved phase I clinical trial that is designed to test the safety of AS-ODN-treated autologous DC into T1D patients with established disease (fig. 1). Leukocytes of the pa-tient are obtained by apheresis and DC are generated in vitro from them and engineered in GMP facilities with the addition of AS-ODN. In turn, these DC, which ex-press low levels of CD40, 80, and CD86, are injected into the patient by intradermal administration at an anatomical site proximal to the pancreas13-15. DC will migrate to the nearest, i.e., pancreatic, lymph nodes, where they are able to interrupt the vicious circle that maintains islet-specific inflammation, i.e., insulitis. In the pancreas, DC acquire beta cell specific antigens from apoptotic cells, leading to the eventual display of these antigens to naïve T-cells in the pancreas-draining lymph nodes. The lack of co-stimulatory molecules will result in an anergizing signal to the T-cells, induce regulatory immune cells (like Foxp3+ Treg), and inte-rrupt the T-cell mediated anti-beta cell epitope-sprea-ding phenomenon. Within the endocrine pancreas, once the insult of autoimmunity is abrogated, the phy-siologic process of regeneration might continue effi-ciently, eventually replenishing the population of insu-lin-producing cells to a number sufficient to maintain euglycemia, thus curing the diabetic recipient.
Thus far, we have not observed adverse events of any
15 ENDO4 (56-59).indd 5715 ENDO4 (56-59).indd 57 13/11/09 09:09:0713/11/09 09:09:07

Trucco M. Gene-environment interaction in type 1 diabetes mellitus
58 Endocrinol Nutr. 2008;56(Supl 4):56-9
sort, nor did the patients experience even subjective dis-comforts; the hematological and immunologic profiles after DC administration in all of the first six treated diabe-tic patients are similar if not identical to those measured at baseline pre-screening; there is no evidence of latent viral activation; there is no evidence of induction of any additio-nal autoimmune reaction; there is no worsening of glyce-mia or increased insulin requirements; physical examina-tions and all biochemistry is within the normal range.
Conflict of interest
The author declares he has no conflict of interest.
REFERENCES
1. Bottino R, Balamurugan AN, Trucco M, Starzl TE. Pancreas
and islet cell transplantation. Best Pract Res Clin Gastroenterol.
2002;16:457-74.
2. Rood PPM, Bottino R, Balamurugan AN, Fan Y, Cooper DKC,
Trucco M. Facilitating physiologic selfregeneration: a step be-
yond islet cell replacement. Pharm Res. 2006;23:227-42.
3. Pasquali L, Giannoukakis N, Trucco M. Induction of immune
tolerance to facilitate beta cell regeneration in type 1 diabetes.
Adv Drug Deliv Rev. 2008;60:106-11.
4. Giannoukakis N, Phillips B, Trucco M. Towards a cure for type
1 diabetes mellitus: diabetes-suppressive dendritic cells and be-
yond. Part II. Pediatric Diabetes. 2008;9:4-13.
5. Morel PA, Dorman JS, Todd J, McDevitt H, Trucco M. Aspartic
acid at position 57 of the HLA-DQ beta chain protects against
type I diabetes: a family study. PNAS. 1988;85:8111-5.
6. Trucco M, Giannoukakis N. MHC tailored for diabetes cell the-
rapy. Gene Ther. 2005;12:553-4.
7. Ge X, Piganelli JD, Tse HM, Bertera S, Mathews CE, Trucco
M, et al. The modulatory role of DR4 to DQ8-restricted CD4 T
cell responses and type 1 diabetes susceptibility. Diabetes. 2006;
55:3455-62.
8. Zorina TD, Subbotin VM, Bertera S, Alexander A, Haluszczak
C, Styche A, et al. Recovery of the endogenous beta cell func-
tion in the NOD model of autoimmune diabetes. Stem Cells.
2003;21:377-88.
9. Trucco M. Regeneration of the beta cell. J Clin Invest. 2005;
115:5-12.
10. Trucco M. Is facilitating pancreatic beta cell regeneration a valid
option for clinical therapy? Cell Transplantation. 2006;15:S75-84.
11. Casu A, Bottino R, Balamurugan AN, Hara H, Van der Windt D,
Campanile N, et al. Metabolic aspects of pig-to-monkey islet
xenotransplantation: implications for translation into clinical
practice. Diabetologia. 2008;51:120-9.
NIH-funded, IRB –and FDA– approved Safety Study
To confirm that intradermal administration of autologous diabetes suppressivedendritic cells (DC) is safe, non-toxic and without side-effects.
1. Obtain leukocytes via apheresis
2. Engineer DC towards a “diabetes-suppressive” capacity under GMP/GLP conditions; provide mixture of AS-ODN (CD40/CD80/CD86)
3. Test potency, sterility and divide into individual administration aliquots
4. Administer to volunteer intradermaly
5. Inmunological, biochemical, physiologic monitoring to establish safety
Study started July 2007
Fig. 1. Clinical trial for type 1 diabe-tes. Schematic of the procedures invol-ved in the phase I of the trial, current-ly underway at the University of Pittsburgh, to prove the safety of the living DC-based vaccine. (Used by permission of Pediatric Diabetes, Giannoukakis et al4.) AS-ODN: anti-sense oligodeoxyribonucleotides; DC: dendritic cells; GLP: good laboratory practices; GMP: good manufacturing practice.
15 ENDO4 (56-59).indd 5815 ENDO4 (56-59).indd 58 13/11/09 09:09:0713/11/09 09:09:07

Trucco M. Gene-environment interaction in type 1 diabetes mellitus
Endocrinol Nutr. 2008;56(Supl 4):56-9 59
12. Bottino R, Casu A, Criscimanna A, He J, Van der Windt DJ,
Rudert WA, et al. Recovery of endogenous beta cell func-
tion in non-human primates following chemical diabetes
induction and islet transplantation. Diabetes. 2009;58:442-
7.
13. Machen J, Harnaha J, Lakomy R, Styche A, Trucco M, Gian-
noukakis N. Antisense oligo-nucleotides down-regulating cos-
timulation confer diabetes-preventive properties to nonobese
diabetic mouse dendritic cells. J Immunol. 2004;173:4331-7.
14. Harnaha J, Machen J, Wright M, Lakomy R, Styche A, Trucco
M, et al. Interleukin-7 is a survival factor for CD4+ CD25+ T-
cells and is expressed by diabetes-suppressive dendritic cells.
Diabetes. 2006;55:158-65.
15. Phillips B, Nylander K, Harnaha J, Machen J, Lakomy R,
Styche A, et al. A microsphere-based vaccine prevents and re-
verses new-onset autoimmune diabetes. Diabetes. 2008;57:1544-
55.
15 ENDO4 (56-59).indd 5915 ENDO4 (56-59).indd 59 13/11/09 09:09:0713/11/09 09:09:07
60 Endocrinol Nutr. 2008;56(Supl 4):60-2
Epidemiology of type 2 diabetesNICHOLAS J. WAREHAM
MRC Epidemiology Unit. Institute of Metabolic Science. Addenbrooke’s Hospital. Cambridge. UK.
The rising prevalence of type 2 diabetes is a public health pro-blem as it is a major cause of coronary heart disease, end-stage renal disease, non-traumatic amputations and preventable visual loss. Epidemiology can contribute to understanding and dealing with this emerging epidemic in a number of different ways. Firstly, it can provide the basic descriptive data that allow the epidemic to be tracked. Secondly, it can contribute to understanding the aetio-logy and pathogenesis of the condition. Finally it can contribute to efforts to identify risk sub-groups and inform preventive action. The extent and rapidity of the rising prevalence of the condition is dramatic, but it does not affect all parts of the world equally. Wild et al estimated in 2004 that the prevalence of diabetes for all age-groups would rise from 171 million in 2000 to 366 million in 20301. In absolute terms, the rise is greatest in developing countries among people aged 45-64 years. In developed countries most people with diabetes are in the >65 year category and as this population group is projected to rise over the next 20 years, this is also the stratum in which the prevalence of diabetes will also increase most. Overall the growing epidemic hits most dramatically those countries least able to cope with the costs of dealing with the large numbers of people with the condition.
The global distribution of the prevalence of type 2 diabetes sug-gest that this disorder originates from a complex interaction bet-ween genetic susceptibility, early growth and programming and lifestyle behaviours throughout life2. The quality of our informa-tion about the variation of prevalence and incidence of type 2 dia-betes by place and person is in marked contrast to the clear gaps in our knowledge about variation of diabetes incidence over time. The apparent changes in prevalence3,4 and future population prevalence projections1 are dramatic and the public media is full of reports of the increasing problems associated with diabetes. However, some authorities have surprisingly questioned whether there is truly an epidemic of diabetes5. In one sense, the demonstration of a rising absolute number of people with the condition over time in many countries is sufficient justification of the use of the term epidemic by virtue of its pressure on medical services. However, absolute prevalence estimates are driven by a number of factors, most parti-cularly the age structure of the population. As the number of older people is rising in most countries, it follows that the absolute num-ber of people with age-related disorders, of which type 2 diabetes is a clear example, will also rise. In order to remove the effect of ageing in the population as a cause for the epidemic, one needs to examine temporal trends in age and sex specific stratum prevalence
Diabetes mellitus hoy
Correspondence: Prof. N.J. WarehamMRC Epidemiology Unit. Institute of Metabolic Science.Addenbrooke's Hospital, Box 285. Cambridge, CB2 0QQ. UK.E-mail: [email protected]
16 ENDO4 (60-62).indd 6016 ENDO4 (60-62).indd 60 13/11/09 09:10:1813/11/09 09:10:18

Wareham NJ. Epidemiology of type 2 diabetes
Endocrinol Nutr. 2008;56(Supl 4):60-2 61
rates6. These too clearly indicate a rising prevalence over time7. However, prevalence is also affected by other factors such as improved survival among the dia-betic population and outward migration of healthy in-dividuals and inward migration of at-risk groups6. Even if these explanations are discounted, most estimates of prevalence are based on clinical register rather than the true prevalence of the condition. The likelihood of be-ing on a registers is a function of the completeness of that register as a record of all those with clinically re-cognised diabetes. It is possible that the advent of fi-nancial incentives linked to the number of people with diabetes as a part of a process of quality improvement in primary care in some countries has led to a greater proportion of people with clinically recognised diabe-tes being registered. The proportion of people who truly have diabetes who are clinically recognised is also subject to change and might have altered with the advent of early detection programmes. Early data from the 1960s and 70s8 suggests that only 50% of those with detectable diabetes are clinically recognised. More recent estimates from the 1990s9 and 2000s sug-gest that this proportion has not changed much.
Perhaps the clearest form of evidence of an epidemic of diabetes would come from repeated measurement of the incidence of the disease in the same population over time. There is some evidence in the United States to suggest that incidence has increased10, but it is sur-prisingly difficult to find such data. One issue relates to definitions as studies differ as to whether they study the true incidence of the disease, both biochemical and clinical, or more usually just the clinically detected di-sease. Studies with repeated oral glucose tolerance tes-ting (OGTT) which are often described as being the optimal way of measuring true incidence have an addi-tional complexity related to the frequency of testing. An OGTT is a poorly reproducible test and even in studies with short-term repeat testing, there is a high degree of variability11. As with all physiological varia-bles that are measured with error, such imprecision leads to regression to the mean. If we superimpose this day-to-day variability on an overall upward trajectory as in figure 1, we can readily see that the interval bet-ween repeat OGTTs will influence the incidence of disease if people are censored or classified as diabetic on the first occasion that they have a result beyond the diagnostic threshold. Thus we tend to observe higher incidence rates in studies using more frequent OGTTs as the way of assessing progression to diabetes. This is common in trials but the estimates of incidence will not be generalisable to the real world where repeat tes-ting is much less frequent. This phenomenon is parti-cularly important for those people with “pre-diabetes” defined as those with either impaired glucose tolerance or impaired fasting glucose. In trials of high risk sub-groups who are tested frequently, high rates of progre-ssion are seen12. More population-based studies with a longer interval between repeats tend to observe lower incidence rates. Indeed, in the Ely population-based
study only a small proportion of people with pre-dia-betes progressed onto to get diabetes over 10 years with the majority reverting to normal glucose toleran-ce13. Overall the quality of the population-level infor-mation about the changing patterns of the incidence of type 2 diabetes over time is relatively poor and there has been an undue reliance on small scale cohort stu-dies whose primary focus has been on the investigation of aetiological hypotheses rather than the production of high quality descriptive epidemiological data. Future population monitoring systems need to take into ac-count multiple forms of data to allow the pattern of the emerging epidemic to be more accurately described.
The traditional epidemiological paradigm of inciden-ce and prevalence is driven by an underlying notion that people can be classified as being normal or abnormal and that there is a clear point at which someone crosses that boundary. The variability issues of the standard measures of hyperglycaemia described above already show that it is difficult to determine when someone mo-ves across the boundary. However, even the existence of a boundary at all is in question. Diabetes is typically defined as a distinct entity because of the threshold effect seen in the relationship between measures of hy-perglycaemia and microvascular complications. Howe-ver, no such threshold is demonstrable for the cardiovas-cular complications of hyperglycaemia14 and more recent studies have even questioned whether there is a threshold at all for microvascular disease15. As glucose is normally distributed in the population and the relatio-nship between glucose levels and cardiovascular disease is linear, it follows that the greatest impact on public health will come from shifting the population mean of glucose levels rather than focusing on the relatively small group of people with high levels. In this sense, glucose is similar to blood pressure and cholesterol and the approach to prevention follows the principles outli-ned by Geoffrey Rose (fig. 2)16. Moving the emphasis away from individuals to populations also concentrates attention onto the determinants of glucose levels at the
12
11
10
9
2 ho
ur g
luco
se (
mm
ol/l)
Time (years)0 1 2 3 4 5
Fig. 1. Theoretical variation and upward shift of glucose levels over time showing how frequent testing with censoring at the diabetic threshold would result in higher incidence.
16 ENDO4 (60-62).indd 6116 ENDO4 (60-62).indd 61 13/11/09 09:10:1913/11/09 09:10:19

Wareham NJ. Epidemiology of type 2 diabetes
62 Endocrinol Nutr. 2008;56(Supl 4):60-2
population level17, an understanding of the wider deter-minants of dietary and physical activity behaviour and on developing strategies for prevention that recognise the societal influences on these behaviours.
Conflict of interest
The author declares he has no conflict of interest.
REFERENCES
1. Wild S, Roglic G, Green A, Sicree R, King H. Global prevalen-
ce of diabetes: estimates for the year 2000 and projections for
2030. Diabetes Care. 2004;27:1047-53.
2. Franks PW, Mesa JL, Harding AH, Wareham NJ. Gene-lifestyle
interaction on risk of type 2 diabetes. Nutr Metab Cardiovasc
Dis. 2007;17:104-24.
3. Mokdad AH, Ford ES, Bowman BA, Nelson DE, Engelgau
MM, Vinicor F, et al. Diabetes trends in the US: 1990-1998.
Diabetes Care. 2000;23:1278-83.
4. González EL, Johansson S, Wallander MA, Rodríguez LA.
Trends in the prevalence and incidence of diabetes in the
UK: 1996-2005. J Epidemiol Community Health. 2009;63:
332-6.
5. Green A, Støvring H, Andersen M, Beck-Nielsen H. The epide-
mic of type 2 diabetes is a statistical artefact. Diabetologia.
2005;48:1456-8.
6. Wareham NJ, Forouhi NG. Is there really an epidemic of diabe-
tes? Diabetologia. 2005;48:1454-5.
7. Dunstan DW, Zimmet PZ, Welborn TA, De Courten MP, Came-
ron AJ, Sicree RA, et al. The rising prevalence of diabetes and
impaired glucose tolerance: the Australian Diabetes, Obesity
and Lifestyle Study. Diabetes Care. 2002;25:829-34.
8. Keen H, Jarrett RJ, McCartney P. The ten-year follow-up of the
Bedford survey (1962-1972): glucose tolerance and diabetes.
Diabetologia. 1982;22:73-8.
9. Williams DR, Wareham NJ, Brown DC, Byrne CD, Clark PM,
Cox BD, et al. Undiagnosed glucose intolerance in the communi-
ty: the Isle of Ely Diabetes Project. Diabet Med. 1995;12:30-5.
10. Centers for Disease Control and Prevention (CDC). Trends in
the prevalence and incidence of self-reported diabetes mellitus
– United States, 1980-1994. MMWR Morb Mortal Wkly Rep.
1997;46:1014-8.
11. Balion CM, Raina PS, Gerstein HC, Santaguida PL, Morrison
KM, Booker L, et al. Reproducibility of impaired glucose tole-
rance (IGT) and impaired fasting glucose (IFG) classification: a
systematic review. Clin Chem Lab Med. 2007;45:1180-5.
12. Tuomilehto J, Lindström J, Eriksson JG, Valle TT, Hämäläinen
H, Ilanne-Parikka P, et al; Finnish Diabetes Prevention Study
Group. Prevention of type 2 diabetes mellitus by changes in li-
festyle among subjects with impaired glucose tolerance. N Engl
J Med. 2001;344:1343-50.
13. Forouhi NG, Luan J, Hennings S, Wareham NJ. Incidence of
Type 2 diabetes in England and its association with baseline
impaired fasting glucose: the Ely study 1990-2000. Diabet Med.
2007;24:200-7.
14. Khaw KT, Wareham N, Bingham S, Luben R, Welch A, Day N.
Association of hemoglobin A1c with cardiovascular disease and
mortality in adults: the European prospective investigation into
cancer in Norfolk. Ann Intern Med. 2004;141:413-20.
15. Wong TY, Liew G, Tapp RJ, Schmidt MI, Wang JJ, Mitchell P,
et al. Relation between fasting glucose and retinopathy for diag-
nosis of diabetes: three population-based cross-sectional stu-
dies. Lancet. 2008;371:736-43.
16. Rose GA. The strategy of preventive medicine. Oxford: Oxford
Medical Publications; 1994.
17. Wareham NJ, Unwin N, Borch-Johnsen K. Descriptive epide-
miology short reports in Diabetic Medicine – an opportunity to
present data with the population as the unit of variation. Diabet
Med. 2000;17:691-2.
Fig. 2. Contrasting high risk and population approaches to prevention.
High risk approach Population approach
16 ENDO4 (60-62).indd 6216 ENDO4 (60-62).indd 62 13/11/09 09:10:1913/11/09 09:10:19

Endocrinol Nutr. 2008;56(Supl 4):63-6 63
Hypertension in diabetes mellitusPAUL K. WHELTON
President and Chief Executive Officer. Loyola University Health System. Loyola University Medical Center. Maywood, IL. USA.
Hypertension and diabetes mellitus (DM) are two of the most important risk factors for cardiovascular disease (CVD) and are commonly found in the same patient. Often, they are accompanied by other elements of the metabolic syndrome, further increasing the risk of CVD and renal disease. Worldwide, the prevalence of hypertension is projected to increase from less than 1 billion to approximately 1.5 billion by 2025 and the prevalence of DM is expected to rise from approximately 170 million to almost 400 mi-llion by 20301,2.
Weight loss and increased physical activity are effective in pre-vention and treatment of both hypertension and DM. They should be combined with reduced sodium intake, moderation in alcohol consumption, and increased potassium intake3.
Compared to placebo, blood pressure (BP) lowering with diure-tics, calcium channel blockers (CCB), angiotensin-converting en-zyme inhibitors (ACEI), and angiotensin receptor blockers (ARB) reduces the risk of CVD in persons with and without DM4,5. The pattern for diuretics versus placebo is displayed in figure 1.
Compared to placebo or CCB, ACEI and ARB are more effec-tive in reducing the incidence of microalbuminuria during the treatment of hypertension in patients with DM6. However, it is unclear whether this provides any special benefit in preventing CVD. With a sample size of 42,418 participants, including 15,297 participants with DM, experience in the Antihypertensive and Li-pid-Lowering to Prevent Heart Attack Trial (ALLHAT) provides the largest comparison of treatment with representative agents from four classes of antihypertensive drug therapy (diuretics-chlorthalidone, ACEI-lisinopril, CCB-amlodipine and α-receptor blockers-doxazosin). The diuretic versus α-receptor blocker the-rapy comparison was discontinued prematurely because of a hig-her relative risk of CVD in the α-receptor blocker group. There was no evidence of superiority for treatment with ACEI or CCB compared to diuretic in the overall group or in subgroups with DM, impaired fasting glucose, or normoglycemia7 (fig. 2). In contrast, CVD (especially heart failure) was more common during treatment with CCB and ACEI compared to diuretic, overall and in the subgroups with or without DM. In the subgroup with DM, the relative risk (95% confidence interval [CI]) for incidence of heart failure in those treated with CCB vs. diuretic was 1.42 (1.23-1.64) and in those treated with ACEI vs. diuretic was 1.22 (1.05-1.42).
Diabetes mellitus hoy
Correspondence: Dr. P.K. Whelton.Loyola University Health System. Loyola University Medical Center.2160 South First Avenue.Maywood, IL 60153. USA.E-mail: [email protected]
17 ENDO4 (63-66).indd 6317 ENDO4 (63-66).indd 63 13/11/09 09:11:2813/11/09 09:11:28

Whelton PK. Hypertension in diabetes mellitus
64 Endocrinol Nutr. 2008;56(Supl 4):63-6
Metabolic consequences, including a tendency for hyperglycemia and hypokalemia, are a recognized consequence of diuretic therapy. In ALLHAT, the 4 and 6-year cumulative incidence of DM (fasting blood sugar ≥ 126 mg/dl) in study participants without DM (<126 mg/dl) at baseline was 11.0 and 13.8% for those assigned to diuretic, 9.3 and 12.0% for those assigned to CCB, and 7.8 and 11.0% for those assigned to ACEI. If one assumes the CCB to be metabolically neutral, only about 15% of the DM associated with diuretic use in ALLHAT was due to the drug itself. Meta-analysis has demonstrated a consistent pattern for a higher inci-dence of hyperglycemia during diuretic therapy com-pared to placebo and ACEI or ARB8,9. Whether diuretic induced hyperglycemia and DM has the same CVD risk implications as non drug induced DM is uncertain. In ALLHAT, the relative risk (RR) of coronary heart disease (CHD) in study participants who developed new onset DM was lower in those assigned to diuretic (1.46; 95% CI, 0.88-2.42) compared to their counter-parts assigned to CCB (1.71; 95% CI, 0.87-3.34) or ACEI (2.23; 95% CI, 1.07-4.62), albeit an interaction term yielded no statistically significant difference bet-ween the three treatment assignments8. The Systolic Hypertension in the Elderly Program (SHEP) follow up study provides experience from a long-term (avera-ge = 14.3 years) follow-up in which those treated with diuretic were relatively “uncontaminated” by addition of other agents10. SHEP participants with prevalent DM at baseline assigned to diuretic treatment expe-rienced a lower RR of CVD mortality compared to their counterparts assigned to placebo (0.69; 95% CI, 0.68-0.95). Those assigned to placebo who developed new onset DM during the 5 years of treatment in the trial experienced a significant increase in RR of CVD
(1.56; 1.11-2.18) during follow up. In contrast, those assigned to diuretic did not (1.04; 95% CI, 0.75-1.46). In the Diabetes Reduction Assessment with Ramipril and Rosiglitazone Medication (DREAM) trial, rosigli-tazone was associated with a 60% reduction in DM or death whereas treatment with an ACEI improved post-challenge 2 hour glucose levels but failed to have a positive impact on the primary outcome. Compared with placebo, ACEI treatment lowered fasting glucose by < 1 mg/dl, an effect that would not be expected to influence CVD risk.
Hypokalemia, leading to reduced insulin secretion, may be an important causative mechanism for diuretic induced hyperglycemia and DM. In a quantitative re-view of 20 placebo-controlled and 39 active-controlled trials, there was a linear relationship between decrease in potassium and increase in blood glucose, with an approximately 10 mg/dl increase in glucose for every 1 mEq/l decrease in potassium11. A US National Heart, Lung, and Blood Institute Working Group recommen-ded conduct of a short-term clinical trial to determine whether prevention of hypokalemia can minimize or prevent diuretic induced hyperglycemia12.
Most patients with DM and hypertension require 2 or more antihypertensive medications to control their BP. Combination of a diuretic and ACEI or ARB is logical and can be supplemented by a CCB or other drugs to attain the desired level of BP control. Achie-vement of good BP control may be more important than choice of the agents needed to reach that goal. Compared to their counterparts assigned to a BP goal < 180/105 mmHg, study participants in the United Kingdom Prospective Diabetes Study (UKPDS) with DM and hypertension assigned to a goal BP < 150/85 mmHg experienced a 44% lower incidence of stroke, a 21% reduction in myocardial infarction, and a 47% de-crease in microvascular complications13. The clinical trial was conducted over a 10 year period from 1987 to 1997. During the next 10 years, from 1997 to 2007, between-group differences in BP disappeared gradua-lly and the previously noted benefits were lost14. These findings underscore the importance of not only achie-ving but maintaining good BP control to attain the ex-pected benefits of antihypertensive therapy. More re-cently designed clinical trials have documented the benefit of BP lowering in DM patients with hyperten-sion who have a lower starting level of BP. For exam-ple, in the ADVANCE trial 11,140 patients with type 2 diabetes and treated hypertension (average systolic/diastolic BP = 145/81 mmHg) were randomized to treatment with a fixed combination of perindopril and indapamide or matching placebo, in addition to their current antihypertensive drug therapy. Compared with those assigned to placebo, study participants assigned to active therapy had a mean reduction in systolic BP of 5·6 mmHg and diastolic BP of 2·2 mmHg. Relative risk of a major macrovascular or microvascular event was 0.91 in the active treatment group compared to placebo (95% CI, 0·83-1·00). The ACCORD trial is
Fig. 1. Incidence of major cardiovascular events by treatment group for adults with hypertension who did or did not have diabetes me-llitus at baseline. RR: relative risk. (Adapted from Curb et al4.)
35
30
25
20
15
10
5
0
5 ye
ar r
ate/
100%
DiureticPlacebo
Diabetes No diabetes
13.316.4
31.5
21.4
RR = 0.66 RR = 0.66RR = 0.66RR = 0.66RR = 0.66
Systolic Hypertension in the Elderly Program (SHEP)
17 ENDO4 (63-66).indd 6417 ENDO4 (63-66).indd 64 13/11/09 09:11:2813/11/09 09:11:28

Whelton PK. Hypertension in diabetes mellitus
Endocrinol Nutr. 2008;56(Supl 4):63-6 65
Amlodipine better
Lisinopril better
Chlorthalidone better
Lisinopril/chlorthalidoneAmlodipine/chlorthalidone
0.50 1 2 0.50 1 2
Chlorthalidone better
CHD 0.97 (0.86-1.10)
All cause mortality 0.95 (0.86-1.05)
Combined CHD 1.02 (0.93-1.12)
Stroke 0.89 (0.74-1.06)
Heart failure 1.39 (1.22-1.59)
Combined CVD 1.06 (0.98-1.14)
ESRD 1.27 (0.97-1.67)
A. Diabetes mellitus (n = 13,512)
0.97 (0.85-1.10)
0.99 (0.89-1.09)
1.03 (0.94-1.13)
1.06 (0.89-1.26)
1.15 (1.00-1.32)
1.07 (0.99-1.15)
1.09 (0.82-1.46)
Fig. 2. Relative risks (95% CI) for nondiuretic compared with diuretic treatment of hypertension in ALLHAT participants with diabetes mellitus (A), impaired fasing glucose (B), and normoglycemia (C) at baseline. CHD: coronary heart disease (CHD death and nonfatal myocardial infarction); combined CHD: CHD, coronary revascularization, or hospitalized angina; combined CVD: combined CHD, stroke, other treated angina, heart failure, or peripheral arterial disease; ESRD: end-stage renal disease. (Adapted from Whelton et al7.)
CHD 1.73 (1.10-2.72)
All cause mortality 0.93 (0.66-1.34)
Combined CHD 1.37 (1.00-1.87)
Stroke 0.68 (0.35-1.29)
Heart failure 1.66 (0.98-2.80)
Combined CVD 1.13 (0.88-1.45)
ESRD 0.52 (0.11-2.60)
Amlodipine better
Lisinopril better
Chlorthalidone better
Lisinopril/chlorthalidoneAmlodipine/chlorthalidone
0.25 1 3
Chlorthalidone better
0.17 0.50 2 0.50 1 30.33 2 4 5
1.16 (0.71-1.89)
1.07 (0.76-1.50)
1.12 (0.82-1.55)
0.91 (0.52-1.61)
1.20 (0.69-2.09)
1.09 (0.85-1.39)
1.50 (0.48-4.66)
B. Impaired fasting glucose (n = 1,399)
CHD 0.94 (0.82-1.07)
All cause mortality 0.95 (0.86-1.05)
Combined CHD 0.95 (0.86-1.05)
Stroke 1.03 (0.85-1.25)
Heart failure 1.30 (1.12-1.51)
Combined CVD 1.02 (0.95-1.10)
ESRD 0.85 (0.55-1.31)
1.02 (0.89-1.16)
1.02 (0.92-1.13)
1.05 (0.96-1.16)
1.31 (1.10-1.57)
1.19 (1.02-1.39)
1.13 (1.05-1.22)
0.99 (0.65-1.50)
Amlodipine better
Lisinopril better
Chlorthalidone better
Lisinopril/chlorthalidoneAmlodipine/chlorthalidone
C. Normoglycemia (n = 17,012)
0.50 1 2 0.50 1 2
Chlorthalidone better
17 ENDO4 (63-66).indd 6517 ENDO4 (63-66).indd 65 13/11/09 09:11:2813/11/09 09:11:28

Whelton PK. Hypertension in diabetes mellitus
66 Endocrinol Nutr. 2008;56(Supl 4):63-6
evaluating the benefit of intensive (systolic BP < 120 mmHg) versus standard (systolic BP < 140 mmHg) BP control in approximately 5,000 study participants with DM and hypertension. Results are expected in 2010. At this time, the scientific evidence in favor of the Joint National Committee for Prevention, Detection and Treat-ment of Hypertension recommendation that the BP goal for treatment of hypertension in patients with DM and/or chronic renal disease be < 130/80 mmHg is incomplete. However, the recommendation seems reasonable in the context of existing knowledge from observational pros-pective studies as well as clinical trials.
In summary, hypertension is common in persons with DM and is often accompanied by other compo-nents of the metabolic syndrome. Lifestyle change should be a starting point for prevention and treatment of hypertension, especially in persons with DM. Diure-tics, alone or in combination with other antihypertensi-ve agents, are effective for treatment of uncomplicated hypertension in persons with or without DM. ACEI and ARBs are good choices for treatment of hyperten-sion in individuals with DM and heavy proteinuria. Most patients with DM and hypertension require 2 or more antihypertensive medications and inclusion of a diuretic in such combinations makes good sense. The modest hyperglycemia that is sometimes encountered during diuretic therapy may be due to hypokalemia and does not appear to carry the same risk implications as non-drug induced hyperglycemia and DM. Increasin-gly, clinical trial and observational evidence favors in-tensive treatment of hypertension in adults with DM aimed at achieving lower levels of BP than is warran-ted in their counterparts without DM.
Conflict of interest
The author declares he has no conflict of interest.
REFERENCES
1. Kearney PM, Whelton M, Reynolds K, Muntner P, Whelton PK,
He J. Global burden of hypertension: analysis of worldwide
data. Lancet. 2005;365:217-23.
2. Wild S, Roglic G, Green A, Sicree R, King H. Global prevalen-
ce of Diabetes: estimates for the year 2000 and projections for
2030. Diabetes Care. 2004;27:1047-53.
3. Whelton PK, He J, Appel LJ, Cutler JA, Havas S, Kotchen TA,
et al. Primary prevention of hypertension: Clinical and public
health advisory from the national high blood pressure education
program. JAMA. 2002;288:1882-8.
4. Curb JD, Pressel SL, Cutler JA. Effect of diuretic-based antihy-
pertensive treatment on cardiovascular disease risk in older dia-
betic patients with isolated systolic hypertension. JAMA. 1996;
276:1886-92.
5. Turnbull F, Neal B, Algert C, Chalmers J, Chapman N, Cutler
J, et al; Blood Pressure Lowering Treatment Trialists’ Colla-
boration. Effects of different blood pressure-lowering regi-
mens on major cardiovascular events in individuals with and
without diabetes mellitus. Arch Intern Med. 2005;165:1410-
9.
6. Kunz R, Friedrich C, Wolbers M, Mann JFE. Meta-analysis:
effect of monotherapy and combination therapy with inhibitors
of the renin-angiotensin system on proteinuria in renal disease.
Ann Intern Med. 2008;148:30-48.
7. Whelton PK, Barzilay J, Cushman WC, Davis BR, Iiamatchi
E, Kostis JB, et al. Clinical outcomes in antihypertensive treat-
ment of type 2 diabetes, impaired fasting glucose concentra-
tion, and normoglycemia. Arch Intern Med. 2005;165:1401-
9.
8. Barzilay JI, Cutler JA, David BR. Antihypertensive medications
and risk of diabetes mellitus. Nephrol Hypertens. 2007;16:256-60.
9. Gillespie EL, White CM, Kardas M, Lindberg M, Coleman CI.
The impact of ACE inhibitors or angiotensin II type I receptor
blockers on the development of new-onset type 2 diabetes. Dia-
betes Care. 2005;28:2261-6.
10. Kostis JB, Wilson AC, Freudenberger RS, Cosgrove NM,
Pressel SL, Davis BR. Long-term effect of diuretic-based
therapy on fatal outcomes in subjects with isolated systolic
hypertension with and without diabetes. Am J Cardiol. 2005;
95:29-35.
11. Zillich AJ, Garg J, Basu S, Bakris GL, Carter BL. Thiazide diu-
retics, potassium, and the development of diabetes: a quantitati-
ve review. Hypertension. 2006;48:219-24.
12. Carter BL, Einhorn PT, Brands M, He J, Cutler JA, Whelton PK,
et al. Thiazide-induced dysglycemia: Call for research from a
working group from the National Heart, Lung and Blood Insti-
tute. Hypertension. 2008;52:30-6.
13. UK Prospective Diabetes Study Group. Tight blood pressure
control and risk of macrovascular and microvascular compli-
cations in type 2 diabetes: UKPDS 38. BMJ. 1998;317:703-
13.
14. Holman RR, Sanjoy KP, Bethel MA, Neil HAW, Matthews DR.
Long-term follow-up after tight control of blood pressure in
type 2 diabetes. N Engl J Med. 2008;359;15:1565-76.
17 ENDO4 (63-66).indd 6617 ENDO4 (63-66).indd 66 13/11/09 09:11:2913/11/09 09:11:29

Endocrinol Nutr. 2008;56(Supl 4):67-9 67
Síndrome metabólico. Declaración conjunta, octubre 2009JOSÉ A. GUTIÉRREZ FUENTES
Instituto DRECE de Estudios Biomédicos. Madrid. España.Fundación Lilly. Madrid. España.
Una nueva declaración conjunta de varias organizaciones profe-sionales identifica los criterios específicos para el diagnóstico clí-nico del síndrome metabólico, ajustando la definición de éste, que previamente difería de una organización a otra.
La declaración, hecha pública en la revista Circulation el pasado mes de octubre1, con participación de la International Diabetes Fe-deration (IDF), el National Heart, Lung and Blood Institute (NHL-BI), la World Heart Federation, la International Atherosclerosis Society y la American Heart Association (AHA), representa un in-tento de eliminar parte de la confusión relativa a cómo identificar los pacientes con síndrome metabólico.
Concretamente, la nueva definición para el síndrome metabólico trata de minimizar las diferencias relacionadas con la obesidad ab-dominal definida a través de la medida del perímetro abdominal (cintura). Hasta ahora, persistían diferencias sustanciales (hasta de 8 cm) entre las definiciones de la IDF y del NHLBI (National Cho-lesterol Education Program Adult Treatment Panel –ATP III–) para la medición del perímetro abdominal, que ahora se han visto corre-gidas. En la actual definición, la medida de la cintura intenta ajus-tarse a las diferentes poblaciones o regiones y podrá irse ajustando según se conozcan mejor las características antropométricas de cada una de ellas y su relación con el riesgo de presentar diabetes o cardiopatía isquémica.
Debe hacerse notar que la American Diabetes Association y la European Association for the Study of Diabetes no se han sumado a esta declaración al no aceptar que se considere el síndrome meta-bólico como un factor de riesgo para la diabetes mellitus o la car-diopatía isquémica, y respaldar que el énfasis debe hacerse en el tratamiento decidido de los factores de riego individuales. Ambas asociaciones publicaron en 2005 su propia declaración conjunta al respecto, mostrándose críticas incluso con el concepto de síndrome metabólico y su utilidad clínica2.
En realidad, el síndrome metabólico no representa una enferme-dad, sino el agregado de una serie de factores de riesgo, y la inten-ción primaria de definirlo como tal no fue otra que atraer la aten-ción de médicos y pacientes sobre la importancia de unos hábitos correctos de vida. No obstante, el concepto ha arraigado y recibido notable atención dado que los que lo presentan son portadores de una situación proinflamatoria, junto con alteraciones lipídicas (tri-glicéridos elevados, colesterol unido a lipoproteínas de alta densi-dad disminuido, y frecuentemente apoB y lipoproteínas de baja densidad aumentadas), que conjuntamente pueden duplicar el ries-go de presentar cardiopatía isquémica en un plazo de 5 a 10 años,
Diabetes mellitus hoy
Correspondencia: Dr. J.A. Gutiérrez Fuentes.Correo electrónico: [email protected]
18 ENDO4 (67-69.indd 6718 ENDO4 (67-69.indd 67 13/11/09 09:17:1613/11/09 09:17:16

Gutiérrez JA. Síndrome metabólico. Declaración conjunta, octubre 2009
68 Endocrinol Nutr. 2008;56(Supl 4):63-9
o multiplicar por 5 el de presentar diabetes mellitus tipo 2.
La actual declaración científica intenta clarificar la definición de síndrome metabólico. Los factores pri-marios para el diagnóstico de síndrome metabólico han sido la dislipemia aterogénica, la hipertensión arterial y la hiperglucemia, centrándose la controversia en la inclusión de la obesidad abdominal. La definición de obesidad abdominal permanece controvertida y los cri-terios predictores (perímetro abdominal) de riesgo car-diovascular o diabetes mellitus varían con el sexo o la etnia del sujeto. En regiones extensas (Oriente Medio o África) el problema es mayor, centrándose en la ca-rencia de información propia al respecto.
Haciendo uso de las recomendaciones de diferentes organizaciones, los autores de esta nueva declaración científica definen 5 criterios y puntos de corte para el diagnóstico clínico del síndrome metabólico, admitien-do que los sujetos que cumplan al menos 3 de ellos deben ser diagnosticados (tabla 1). En las poblaciones o regiones en que se disponga de información suficien-te, se adecuará el riesgo atribuido a la obesidad abdomi-nal según la medida del perímetro abdominal (tabla 2).
Conflicto de intereses
El autor declara no tener ningún conflicto de intere-ses.
Para más información sobre el síndrome metabólico: Serrano-Ríos M, Caro JF, Carraro R, Gutiérrez-Fuen-tes JA. The metabolic syndrome at the beginning of the XXIst century. A genetic and molecular approach. Elsevier (Fundación Lilly); 2005. ISBN: 84-8174-892-7. Disponible en: www.fundacionlilly.com > Bi-blioteca.
BIBLIOGRAFÍA
1. Alberti KGMM, Eckel RH, Grundy SM, Zimmet PZ, Cleeman
JI, Donato KA, et al. Harmonizing the metabolic syndrome. A
joint interim statement of the International Diabetes Federation
Task Force on Epidemiology and Prevention; National Heart,
Lung, and Blood Institute; American Heart Association; World
Heart Federation; International Atherosclerosis Society; and In-
ternational Association for the Study of Obesity. Circulation.
2009;120:1640-5.
TABLA 1. Criterios para el diagnóstico clínico de síndrome metabólico
Medición Puntos de corte
Perímetro abdominal aumentado Definiciones específicas según población/región*Triglicéridos elevados (o en tratamiento por triglicéridos elevados) ≥ 150 mg/dlcHDL reducido (o en tratamiento por cHDL reducido) < 40 mg/dl para varones y < 50 mg/dl para mujeresPresión arterial elevada (o en tratamiento por presión arterial elevada) Sistólica > 130 mmHg y/o diastólica > 85 mmHgGlucosa en ayunas elevada (o en tratamiento por glucosa en ayunas elevada) > 100 mg/dl
cHDL: colesterol unido a lipoproteínas de alta densidad.*Véase tabla 2.
TABLA 2. Perímetros abdominales actualmente recomendados para la consideración de obesidad abdominal por diferentes organizaciones
Población Organización
Dintel recomendado de perímetro abdominal para obesidad abdominal
Varones Mujeres
Europea IDF3 ≥ 94 cm ≥ 80 cmCaucásica Whorld Health Organization4 ≥ 94 cm (riesgo elevado) ≥ 80 cm (riesgo elevado) ≥ 102 cm (riesgo más elevado) ≥ 88 cm (riesgo más elevado)Norteamericana AHA/National Cholesterol Education ≥ 102 cm ≥ 88 cm Program Adult Treatment Panel –ATP III–5* Canadiense Health Canada6,7 ≥ 102 cm ≥ 88 cmEuropea European Cardiovascular Societies8 ≥ 102 cm ≥ 88 cmAsiática (incluye IDF3 ≥ 90 cm ≥ 80 cm población japonesa) Asiática WHO9 ≥ 90 cm ≥ 80 cmJaponesa Japanese Obesity Society10,11 ≥ 85 cm ≥ 90 cmChina Cooperative Task Force12 ≥ 85 cm ≥ 80 cmOriente Medio, International Diabetes Federation3 ≥ 94 cm ≥ 80 cm mediterráneaÁfrica Sub-Sahariana International Diabetes Federation3 ≥ 94 cm ≥ 80 cmEtnias centro International Diabetes Federation3 ≥ 90 cm ≥ 80 cm y sudamericanas
AHA: American Heart Association. *Las guías recientes para el síndrome metabólico (AHA/NHLBI) reconocen un incremento del riesgo para enfermedad cardiovascular y diabetes mellitus para dinteles de perímetro abdominal de ≥ 94 cm en varones y ≥ 80 cm en mujeres, e identifican a éstos como puntos de corte para individuos o poblaciones con aumento de la resistencia insulínica.
18 ENDO4 (67-69.indd 6818 ENDO4 (67-69.indd 68 13/11/09 09:17:1713/11/09 09:17:17

Gutiérrez JA. Síndrome metabólico. Declaración conjunta, octubre 2009
Endocrinol Nutr. 2008;56(Supl 4):67-9 69
Education Program recommendations for the management of
hypertension, part II: therapy. Can J Cardiol. 2006;22:583-93.
8. Graham I, Atar D, Borch-Johnsen K, Boysen G, Burell G, Ci-
fkova R, et al. ESC Committee for Practice Guidelines. Euro-
pean guidelines on cardiovascular disease prevention in clinical
practice: executive summary. Atherosclerosis. 2007;194:1-45.
9. WHO Expert Consultation. Appropriate body-mass index for
Asian populations and its implications for policy and interven-
tion strategies. Lancet. 2004;363:157-63 [published correction
appears in Lancet. 2004;363:902].
10. Oka R, Kobayashi J, Yagi K, Tanii H, Miyamoto S, Asano A, et
al. Reassessment of the cutoff values of waist circumferen-
ce and visceral fat for identifying Japanese subjects at risk for
the metabolic syndrome. Diabetes Res Clin Pract. 2008;79:
474-81.
11. Examination Committee of Criteria for “Obesity Disease” in
Japan; Japan Society for the Study of Obesity. New criteria for
“obesity disease” in Japan. Circ J. 2002;66:987-92.
12. Zhou BF; Cooperative Meta-Analysis Group of the Working
Group on Obesity in China. Predictive values of body mass in-
dex and waist circumference for risk factors of certain related
diseases in Chinese adults: study on optimal cut-off points of
body mass index and waist circumference in Chinese adults.
Biomed Environ Sci. 2002;15:83-96.
2. Kahn R, Buse J, Ferrannini E, Stern M. The metabolic syndro-
me: time for a critical appraisal: Joint statement from the Ame-
rican Diabetes Association and the European Association for the
Study of Diabetes. Diabetes Care. 2005;28:2289-304.
3. Grundy SM, Cleeman JI, Daniels SR, Donato KA, Eckel RH,
Franklin BA, et al. American Heart Association; National Heart,
Lung, and Blood Institute. Diagnosis and management of the
metabolic syndrome: an American Heart Association/National
Heart, Lung, and Blood Institute Scientific Statement. Circula-
tion. 2005;112:2735-52 [published corrections appear in Circu-
lation. 2005;112:e297 and e298].
4. World Health Organization. Obesity: preventing and managing
the global epidemic: report on a WHO consultation (WHO Te-
chnical Report Series 894). Geneva, Switzerland: World Health
Organization; 2000.
5. National Institutes of Health. Clinical guidelines on the identifi-
cation, evaluation, and treatment of overweight and obesity in
adults: the evidence report. Obes Res. 1998;6 Suppl 2:51S–209S
[published correction appears in Obes Res. 1998;6:464].
6. Health Canada. Canadian Guidelines for Body Weight Classifi-
cation in Adults. Ottawa, Canada: Health Canada Publications
Centre; 2003.
7. Khan NA, McAlister FA, Rabkin SW, et al. Canadian Hyperten-
sion Education Program. The 2006 Canadian Hypertension
18 ENDO4 (67-69.indd 6918 ENDO4 (67-69.indd 69 13/11/09 09:17:1713/11/09 09:17:17

Distinguished Career Award Endocrinology & Nutrition 2008
70 Endocrinol Nutr. 2008;56(Supl 4):70-1
Distinguished Career Award Endocrinology & Nutrition 2008EL PROFESOR MANUEL SERRANO RÍOS RECIBE EL PREMIO FUNDACIÓN LILLY A UNA CARRERA DISTINGUIDA POR SU CONTRIBUCIÓN A LA INVESTIGACIÓN DE LA DIABETES MELLITUS EN ESPAÑA
Ante más de 300 compañeros asistentes, el profesor Manuel Serrano Ríos, catedrático y jefe de servicio de medicina interna y actualmente en la Fundación para la Investigación del Hospital Clínico San Carlos de Ma-drid, a propuesta de la Sociedad Española de Diabetes, ha recibido el Premio Fundación Lilly a una Carrera Distinguida en la especialidad de Endocrinología y Nutrición en el marco del 14.º Simposio Científico “Diabetes mellitus hoy”, por su trayectoria profesional y su contribución a la investigación en el campo de la diabetes.
El Premio Fundación Lilly a una Carrera Distingui-da, que en su segunda edición ha sido entregado por el doctor Salvador Moncada, pretende reconocer trayec-torias científicas ejemplares como la del profesor Ma-nuel Serrano Ríos. Del premiado destacó el doctor José Antonio Gutiérrez, director de la Fundación Lilly, su dimensión científica, su vocación investigadora y su contribución al conocimiento de los mecanismos de resistencia a la insulina, entre otros muchos, “sin olvi-dar su vertiente humana que siempre ha transmitido a sus pacientes”. Asimismo, ha recordado que el profe-sor Serrano Ríos ha sido pionero en España en el estu-dio de la genética de la diabetes mellitus.
Durante su discurso, el profesor Serrano Ríos mani-festó la satisfacción que le produce ver que “la investi-gación en nuestro país está alcanzando un nivel muy estimable y cada vez más alto”, y añadió que “en la actualidad la investigación española en el campo de la diabetología compite dignamente en los ámbitos euro-peo e internacional”. Asimismo, recordó la enorme ilu-sión con la que comenzó su carrera en medicina (“en medicina académica”, aclaró), cuando en la década de los sesenta la financiación para investigación era prác-ticamente inexistente.
AUTORIDAD EN EL ESTUDIO DE LA DIABETES MELLITUS
La comunidad científica ha reconocido hoy al profe-sor Manuel Serrano Ríos como “una de las máximas autoridades en el estudio de la diabetes en nuestro país”, tanto por su prolífica carrera investigadora como por la calidad de ésta. Catedrático de Medicina Interna de la Universidad Complutense de Madrid, es autor de más de 250 trabajos originales en revistas nacionales e internacionales. Miembro de Asociaciones Internacio-nales de diabetes: Estados Unidos (ADA), Europa
19 ENDO4 (70-71).indd 7019 ENDO4 (70-71).indd 70 13/11/09 09:17:5313/11/09 09:17:53

Distinguished Career Award Endocrinology & Nutrition 2008
Endocrinol Nutr. 2008;56(Supl 4):70-1 71
(EASD), Latinoamérica (ALAD), y asociaciones na-cionales de diabetes, endocrinología, obesidad, nutri-ción básica y clínica y arteriosclerosis; y ha sido Presi-dente de Honor de la Sociedad Española de Diabetes
(SED) y del Grupo Mediterráneo para el Estudio de la Diabetes, y Presidente de Honor de la Federación In-ternacional de Diabetes. Preside además el Instituto Danone-España.
Profesor visitante en numerosos centros de investi-gación y universidades de Europa, Latinoamérica y Estados Unidos. Miembro de los comités editoriales de numerosas revistas científicas internacionales y nacio-nales. Doctor Honoris Causa en varias universidades españolas y latinoamericanas.
Merecedor de innumerables premios y reconoci-mientos dentro y fuera de España, y, finalmente, Aca-démico de la Real Academia de Medicina.
Sus líneas de investigación se han centrado en los estudios en prediabetes, en la patología molecular de síndromes genéticos con resistencia insulínica extre-ma, genética de la diabetes mellitus tipo 1, la relación entre genes no HLA y diabetes tipo 1, la epidemiología genética del síndrome de insulinorresistencia y la pre-valencia del síndrome de insulinorresistencia en pobla-ción urbana y rural.
19 ENDO4 (70-71).indd 7119 ENDO4 (70-71).indd 71 13/11/09 09:17:5413/11/09 09:17:54

María de Molina 3, 1.o – 28006 Madrid – Tel.: 91 781 50 70Fax 91 781 50 79 – Correo electrónico: [email protected] – www.fundacionlilly.com