Distribución espacial y temporal del fitoplancton en el ... · evaluó la distribución espacial y...
20
63 Instituto de Investigaciones Marinas y Costeras “José Benito Vives de Andréis” ISSN 0122-9761 Santa Marta, Colombia, 2018 Boletín de Investigaciones Marinas y Costeras Bulletin of Marine and Coastal Research 47 (2), 63-82 Distribución espacial y temporal del fitoplancton en el golfo de Cariaco, estado Sucre, Venezuela, febrero 2014 – enero 2015 Spatial and temporal phytoplankton distribution in the Gulf of Cariaco, Sucre State, Venezuela, February 2014 - January 2015 Asdrúbal Calvo-Trujillo 1 , Karla Rincones-Reyes 1 , José Rafael Díaz-Ramos 1 , Brightdoom Márquez-García 1 , Sonia Subero-Pino 2 ; Estefanía Elista-Ramírez 2 and Luis Troccoli-Ghinaglia 3,4 1 Departamento de Biología Marina, Instituto Oceanográfico de Venezuela, Universidad de Oriente. Apdo. Postal 126, Cumaná, Sucre. Venezuela 6101. [email protected]. 2 Departamento de Biología, Escuela de Ciencias, Universidad de Oriente. Apdo. Postal 245, Cumaná, Sucre. Venezuela 6101. 3 Instituto de Investigaciones Científicas. Universidad de Oriente, Boca de Río, Nueva Esparta, Venezuela. 4 Facultad de Ciencias del Mar, Universidad Estatal Península de Santa Elena, Ecuador. RESUMEN E l fitoplancton costero es afectado por procesos naturales y antrópicos. Para analizar la influencia de algunos de estos procesos se evaluó la distribución espacial y temporal del fitoplancton en el golfo de Cariaco, estado Sucre. Las muestras (0-10 m) fueron recolectadas con botellas Niskin (5 L) en siete estaciones entre febrero de 2014 y enero de 2015. Se midió transparencia (m), salinidad (UPS), temperatura (°C), concentración de clorofila a (mg m -3 ) y abundancia del fitoplancton (org ml -1 ). Se utilizó un análisis de varianza no paramétrico y métodos multivariados (ACP, ACC y nMDS) para analizar los resultados. El estrato 0 - 10 m fue homogéneo con respecto a todas las variables excepto la temperatura cuyo intervalo fue 20.1 – 29.1 °C (marzo y octubre, respectivamente). Temporalmente, las variables fueron heterogéneas. La biomasa fluctuó entre no detectable (ND) y 17.5 mg m -3 (marzo y diciembre). Mientras que, la abundancia microalgal osciló entre 0.24 y 1.85 x 10 3 org mL -1 (abril y febrero). La comunidad fue dominada por diatomeas, nanoflagelados y cocolitofóridos. Los primeros dos grupos estuvieron asociados a aguas turbulentas ricas en nutrientes. El nMDS separó la comunidad en tres épocas descritas previamente para la región. Asimismo, el ACC detectó que la variable más influyente sobre la comunidad fitoplanctónica fue la velocidad del viento en la época de surgencia y la temperatura en la de calmas; en la de transición, ninguna de las variables estudiadas afectó la comunidad. Esta es la primera vez que se informa sobre la dominancia de los cocolitofóridos en la comunidad fitoplanctónica del golfo de Cariaco. Este cambio sugiere modificaciones en las condiciones oceanográficas del área de estudio. PALABRAS CLAVE: Surgencia costera, Mar Caribe suroriental, Comunidad planctónica, Microalgas marinas tropicales, Cocolitofóridos. ABSTRACT C oastal phytoplankton is affected by natural and anthropic processes. To analyze the influence of some of these processes, the spatial and temporal distribution of phytoplankton in the Gulf of Cariaco, Sucre state, was evaluated. Samples (0-10 m) were collected with Niskin bottles (5 L) in seven stations between February 2014 and January 2015. Transparency (m), salinity (UPS), temperature (° C), chlorophyll concentration a (mg m -3 ), and phytoplankton abundance (org mL -1 ) were measured. A nonparametric analysis of variance and multivariate methods (PCA, CCA, and nMDS) were used to analyze the results. The 0 - 10 m stratum was homogeneous with respect to all variables except temperature which ranged from 20.1 to 29.1 °C (March and October, respectively). Temporally, the variables were heterogeneous. Biomass fluctuated between undetectable (ND) and 17.5 mg m -3 (December and March). While microalgal abundance oscillated between 0.24 and 1.85 x 10 3 org mL -1 (April and February). The community was dominated by diatoms, nanoflagellates, and coccolithophorids. The first two groups were associated with turbulent, nutrient-rich waters. The nMDS separated the community into the three periods previously described for the region. Likewise, the CCA detected that wind speed and temperature were the most influential variables on the phytoplankton community during upwelling and relaxation period, respectively. In the transition period, none of the variables studied affected the community. This is the first time that coccolithophores are reported as part of the dominant flora in the Gulf of Cariaco. This change suggests modifications in the oceanographic conditions of the study area. KEYWORDS: Coastal upwelling, Southeastern Caribbean Sea, Planktonic community, Marine tropical microalgae, Coccolithophorids. 0000-0003-2288-4874 0000-0002-1506-1792 0000-0002-3562-5604 0000-0002-1920-317X 0000-0001-8684-6741 0000-0002-0167-6665 0000-0002-2703-8696 Published by INVEMAR This is an open Access article under the CC BY-NC-SA DOI: 10.25268/bimc.invemar.2018.47.2.747 Publicado por INVEMAR Este es un manuscrito de acceso abierto bajo la licencia CC Reconocimiento-No Comercial-Compartir Igual
Transcript of Distribución espacial y temporal del fitoplancton en el ... · evaluó la distribución espacial y...
63
Instituto de Investigaciones Marinas y Costeras“José Benito Vives de Andréis”
ISSN 0122-9761Santa Marta, Colombia, 2018
Boletín de Investigaciones Marinas y CosterasBulletin of Marine and Coastal Research
47 (2), 63-82
Distribución espacial y temporal del fitoplancton en el golfo de Cariaco, estado Sucre, Venezuela, febrero 2014 – enero 2015
Spatial and temporal phytoplankton distribution in the Gulf of Cariaco, Sucre State, Venezuela, February 2014 - January 2015
Asdrúbal Calvo-Trujillo1, Karla Rincones-Reyes1, José Rafael Díaz-Ramos1, Brightdoom Márquez-García1,
Sonia Subero-Pino2; Estefanía Elista-Ramírez2 and Luis Troccoli-Ghinaglia3,4
1 Departamento de Biología Marina, Instituto Oceanográfico de Venezuela, Universidad de Oriente. Apdo. Postal 126, Cumaná, Sucre. Venezuela 6101. [email protected].
2 Departamento de Biología, Escuela de Ciencias, Universidad de Oriente. Apdo. Postal 245, Cumaná, Sucre. Venezuela 6101. 3 Instituto de Investigaciones Científicas. Universidad de Oriente, Boca de Río, Nueva Esparta, Venezuela.4 Facultad de Ciencias del Mar, Universidad Estatal Península de Santa Elena, Ecuador.
RESUMEN
El fitoplancton costero es afectado por procesos naturales y antrópicos. Para analizar la influencia de algunos de estos procesos se evaluó la distribución espacial y temporal del fitoplancton en el golfo de Cariaco, estado Sucre. Las muestras (0-10 m) fueron recolectadas con botellas Niskin (5 L) en siete estaciones entre febrero de 2014 y enero de 2015. Se midió transparencia (m),
salinidad (UPS), temperatura (°C), concentración de clorofila a (mg m-3) y abundancia del fitoplancton (org ml-1). Se utilizó un análisis de varianza no paramétrico y métodos multivariados (ACP, ACC y nMDS) para analizar los resultados. El estrato 0 - 10 m fue homogéneo con respecto a todas las variables excepto la temperatura cuyo intervalo fue 20.1 – 29.1 °C (marzo y octubre, respectivamente). Temporalmente, las variables fueron heterogéneas. La biomasa fluctuó entre no detectable (ND) y 17.5 mg m-3 (marzo y diciembre). Mientras que, la abundancia microalgal osciló entre 0.24 y 1.85 x 10³ org mL-1 (abril y febrero). La comunidad fue dominada por diatomeas, nanoflagelados y cocolitofóridos. Los primeros dos grupos estuvieron asociados a aguas turbulentas ricas en nutrientes. El nMDS separó la comunidad en tres épocas descritas previamente para la región. Asimismo, el ACC detectó que la variable más influyente sobre la comunidad fitoplanctónica fue la velocidad del viento en la época de surgencia y la temperatura en la de calmas; en la de transición, ninguna de las variables estudiadas afectó la comunidad. Esta es la primera vez que se informa sobre la dominancia de los cocolitofóridos en la comunidad fitoplanctónica del golfo de Cariaco. Este cambio sugiere modificaciones en las condiciones oceanográficas del área de estudio.
PALABRAS CLAVE: Surgencia costera, Mar Caribe suroriental, Comunidad planctónica, Microalgas marinas tropicales, Cocolitofóridos.
ABSTRACT
Coastal phytoplankton is affected by natural and anthropic processes. To analyze the influence of some of these processes, the spatial and temporal distribution of phytoplankton in the Gulf of Cariaco, Sucre state, was evaluated. Samples (0-10 m) were collected with Niskin bottles (5 L) in seven stations between February 2014 and January 2015. Transparency (m), salinity (UPS), temperature (° C), chlorophyll
concentration a (mg m-3), and phytoplankton abundance (org mL-1) were measured. A nonparametric analysis of variance and multivariate methods (PCA, CCA, and nMDS) were used to analyze the results. The 0 - 10 m stratum was homogeneous with respect to all variables except temperature which ranged from 20.1 to 29.1 °C (March and October, respectively). Temporally, the variables were heterogeneous. Biomass fluctuated between undetectable (ND) and 17.5 mg m-3 (December and March). While microalgal abundance oscillated between 0.24 and 1.85 x 10³ org mL-1 (April and February). The community was dominated by diatoms, nanoflagellates, and coccolithophorids. The first two groups were associated with turbulent, nutrient-rich waters. The nMDS separated the community into the three periods previously described for the region. Likewise, the CCA detected that wind speed and temperature were the most influential variables on the phytoplankton community during upwelling and relaxation period, respectively. In the transition period, none of the variables studied affected the community. This is the first time that coccolithophores are reported as part of the dominant flora in the Gulf of Cariaco. This change suggests modifications in the oceanographic conditions of the study area.
KEYWORDS: Coastal upwelling, Southeastern Caribbean Sea, Planktonic community, Marine tropical microalgae, Coccolithophorids.
0000-0003-2288-4874 0000-0002-1506-1792
0000-0002-3562-5604 0000-0002-1920-317X 0000-0001-8684-6741
0000-0002-0167-6665 0000-0002-2703-8696
Published by INVEMARThis is an open Access article under the CC BY-NC-SA
DOI: 10.25268/bimc.invemar.2018.47.2.747Publicado por INVEMAREste es un manuscrito de acceso abierto bajo la licencia CCReconocimiento-No Comercial-Compartir Igual

64
Boletín de Investigaciones Marinas y Costeras • Vol. 47 (2) • 2018
INTRODUCCIÓN
En las zonas costeras la abundancia del fitoplancton está controlada por los cambios naturales y las modificaciones que experimenta el ambiente marino por causas antrópicas (Martínez-López et al., 2001). Esto se debe a que las aguas neríticas están expuestas a la contaminación generada por residuos sólidos y líquidos, provenientes de las actividades comerciales, domésticas, industriales, portuarias, marítimas y turísticas (Pinzón-Bedoya et al., 2007). En este sentido, la actividad humana altera los cambios espaciales y temporales que presenta el fitoplancton debido a factores y procesos naturales que ocurren a escalas temporales que varían de femtosegundos a milenios (Reynolds, 1990; Gallegos y Neale, 2015). Además, en los trópicos, la dinámica del fitoplancton es controlada principalmente por el suministro de nutrientes a las capas superficiales (Lewis, 1992; Lewandoska et al., 2014).
Estos ambientes marinos son considerados tradicionalmente como oligotróficos con muy baja variabilidad estacional (Burford et al., 1995). Sin embargo, en las desembocaduras de los ríos (Cloern et al., 2014; Davis et al., 2014) o donde se produce el fenómeno de surgencia costera (Philips y Badylak, 1996) la entrada de nutrientes es alta y las aguas pueden catalogarse como mesotróficas o eutróficas. También puede existir alta variabilidad estacional.
Esta situación se presenta en el golfo de Cariaco (estado Sucre, Venezuela) donde la biomasa y abundancia del fitoplancton pueden aumentar en la época de calma (lluvias) cuando la escorrentía, la descarga de los ríos y el aumento del flujo de las aguas subterráneas juegan un papel importante en la incorporación de nutrientes (Novoa et al., 1998) y durante la época de surgencia costera cuando los vientos alisios propician el ascenso de aguas subsuperficiales ricas en nutrientes (Ferraz-Reyes, 1983; Alvera-Azcárate et al., 2009, 2011). El golfo es un cuerpo de agua influenciado por los vientos alisios del noreste durante la primera parte del año y por la Zona de Convergencia Intertropical (ZCIT) durante la segunda mitad del año (Quintero et al., 2004; López-Monroy y Troccoli-Ghinaglia, 2014). Considerando su alta productividad, se plantea evaluar la variación espacio-temporal en composición, abundancia y diversidad del fitoplancton en el golfo de Cariaco.
MATERIALES Y MÉTODOS
El golfo de Cariaco está ubicado en la región nororiental de Venezuela, entre 10° 36' 00" - 10° 26'
INTRODUCTION
In coastal areas, the abundance of phytoplankton is controlled by natural changes and anthropogenic activities that affect the marine environment (Martínez-López et al., 2001). This is because the neritic zone is exposed to pollution generated by solid and liquid wastes from commercial, domestic, industrial, port, maritime and tourist activities (Pinzón-Bedoya et al., 2007). In this sense, human activity alters the spatial and temporal dynamics of phytoplankton caused by natural factors and processes that occur at temporal scales that vary from femtoseconds to millennia (Reynolds, 1990; Gallegos and Neale, 2015). In addition, in the tropics, phytoplankton dynamics is controlled mainly by the supply of nutrients to surface layers (Lewis, 1992; Lewandoska et al., 2014).
These marine environments are traditionally considered oligotrophic with very low seasonal variability (Burford et al., 1995). However, in river mouths (Cloern et al., 2014; Davis et al., 2014) or where coastal upwelling phenomenon occurs (Philips and Badylak, 1996), the input of nutrients is high, and waters can be classified as mesotrophic or eutrophic. There may also be high seasonal variability.
This is the case of the Gulf of Cariaco (Sucre state, Venezuela), where biomass and phytoplankton abundance may increase in the calm season (rainfall), when surface runoff, river discharge and increased groundwater flow play an important role as nutrient sources (Novoa et al., 1998); as well as during the coastal upwelling season, when trade winds promote the upward movement of nutrient-rich subsurface waters (Ferraz-Reyes, 1983; Alvera-Azcárate et al., 2009, 2011). The Gulf is a water body that is influenced by the Northeast trade winds during the first part of the year and, is influenced by the Intertropical Convergence Zone (ITCZ) during the second half of the year (Quintero et al., 2004; López-Monroy and Troccoli-Ghinaglia, 2014). Considering its high productivity, this study proposes to evaluate the spatio-temporal variation in phytoplankton composition, abundance and, diversity in the Gulf of Cariaco.
MATERIALS AND METHODS
The Gulf of Cariaco is located in the northeastern region of Venezuela, between 10° 36' 00" - 10° 26' 20"

65
Instituto de Investigaciones Marinas y Costeras
20" N y 64° 13' 40'' - 63° 38' 20" O (Caraballo, 1982a). Sus características generales han sido descritas en Caraballo (1982a, 1982b). Los muestreos se realizaron mensualmente en la superficie y a 10 m con una botella Niskin (5 L) en siete estaciones (georreferenciadas con un GPS marca Garmin), desde febrero de 2014 hasta enero de 2015 (Figura 1, Tabla 1). Se midió in situ la transparencia del agua con un disco de Secchi (m) y la salinidad (UPS) y temperatura (ºC) con una sonda multiparamétrica (Jenway 970 DO2 Meter). La medición de clorofila a (clor. a) y feopigmentos se realizó según el método de Lorenzen, descrito y mejorado por Parsons et al. (1984). Mientras que la determinación de abundancia microalgal se realizó según el método de sedimentación de Utermöhl descrito por Edler y Elbrächter (2010). La identificación del fitoplancton se hizo según los trabajos de Cupp (1943), Tomas (1997), Berard-Thierrault et al. (1999) y Rivera-Tenenbaum (2006). Las figuras de abundancia fitoplanctónica son presentadas en escala logarítmica (Log10) para una mejor visualización. Los cocolitofóridos Emiliania huxleyi y Gephyrocapsa oceanica se denominaron Emiliania-Gephyrocapsa porque la microscopía óptica no permite la diferenciación de sus cocolitos.
Por otro lado, la diversidad de las especies se calculó con el índice de Shannon (Krebbs, 1999). Los datos de velocidad del viento (promedio del día de muestreo y los tres días anteriores) fueron suministrados por la estación meteorológica del aeropuerto Antonio José de Sucre, Cumaná, estado Sucre.
Las épocas oceanográficas fueron establecidas modificando las propuestas por Rivas-Rojas et al. (2007). Las muestras correspondientes a la época surgencia (febrero-mayo) presentaron temperatura ≤ 24 °C, concentraciones de nitrito + nitrato entre 1 y 7.5 µmol L-1 aproximadamente y de fosfato entre 0.5 y 1.2 µmol L-1. Las muestras de la época de transición (junio-agosto) se caracterizaron por valores de temperatura en el intervalo 24 < X ≤ 26 °C, concentraciones de nitrito + nitrato desde 0.5 hasta 4 µmol L-1 aproximadamente y de fosfato de nd a 0.8 µmol L-1. Por último, en la época de calma (septiembre -enero) la temperatura fue ≥ 26 °C, las concentraciones de nitrito + nitrato variaron entre 0.5 – 1 µmol L-1 aproximadamente y las de fosfato de 0.3 a 1 µmol L-1. La época de transición corresponde al periodo en el cual ocurre la surgencia secundaria descrito por Rueda-Roa et al. (2018).
N and 64° 13' 40'' - 63° 38' 20" W (Caraballo, 1982a). Its general characteristics are described in Caraballo (1982a, 1982b). Samples were taken monthly at seven stations (georeferenced, using a Garmin GPS), on the surface and at 10 m depth using a Niskin bottle (5L) from February 2014 to January 2015 (Figure 1, Table 1). Water transparency was measured in situ with a Secchi disc (m), and salinity (UPS) and temperature (ºC) were measured with a multiparameter probe (Jenway 970 DO2 Meter). Measurements of chlorophyll a (chlor. a) and phaeopigments was performed according to the Lorenzen method, described and improved by Parsons et al. (1984), whereas the determination of microalgal abundance was carried out according to the Utermöhl sedimentation method that is described by Edler and Elbrächter (2010). Phytoplankton species were identified according to the works of Cupp (1943), Tomas (1997), Berard-Thierrault et al. (1999) and Rivera-Tenenbaum (2006). Figures of phytoplankton abundance are presented on a logarithmic scale (Log10) for better visualization. The coccolithophores Emiliania huxleyi and Gephyrocapsa oceanica are hereafter named Emiliania-Gephyrocapsa because optical microscopy does not allow for differentiation of their coccoliths.
In addition, species diversity was calculated with the Shannon index (Krebbs, 1999). Wind speed data (average of the sampling day and the three previous days) were supplied by the meteorological station of the Antonio José de Sucre Airport, Cumaná, Sucre State.
Oceanographic periods were established by modifying the periods proposed by Rivas-Rojas et al. (2007). Samples corresponding to the upwelling period (February-May) presented a temperature of ≤ 24 °C, nitrite + nitrate concentrations between 1 and 7.5 µmol L-1 and phosphate concentrations between 0.5 and 1.2 µmol L-1. Samples from the transition period (June-August) were characterized by temperature values in the range 24 < X ≤ 26 °C, nitrite + nitrate concentrations from 0.5 to 4 µmol L-1 and phosphate concentrations from ND to 0.8 µmol L-1. Finally, during the calm season (September-January) the temperature was ≥ 26 °C, approximate nitrite + nitrate concentrations varied between 0.5 - 1 µmol L-1 and phosphate concentrations ranged from 0.3 to 1 µmol L-1. The transition period corresponds to the secondary upwelling period that is described by Rueda-Roa et al. (2018).

66
Bulletin of Marine and Coastal Research • Vol. 47 (2) • 2018
Golfo de CariacoGulf of Cariaco
Golfo de MéxicoGulf of Mexico
Mar CaribeCaribbean Sea
Mar CaribeCaribbean Sea
Figura 1. Ubicación de las estaciones de muestreo en el golfo de Cariaco. Figure 1. Locations of sampling stations in the Gulf of Cariaco.
Estaciones de muestreoSampling stations
Coordenadas geográficasGeographical coordinates
Desembocadura del río Manzanares / Manzanares river mouth 10° 28' 108" N - 64° 11' 954" O
Turpialito 10° 26' 768" N - 64° 02' 065" O
Estación 22 / Station 22 10° 28' 300" N - 63° 58' 000" O
San Antonio 10° 26' 666" N - 63° 47' 614" O
Guacarapo 10° 29' 525" N - 63° 44' 629" O
Ensenada Grande del Obispo 10° 34' 339" N - 64° 03' 134" O
Manicuare 10° 32' 017" N - 64° 11' 717" O
Tabla 1. Ubicación geográfica de las estaciones de muestreo. Table 1. Geographic locations of the sampling stations.

67
Marine and Coastal Research Institute
Las diferencias temporales y espaciales de las variables se escrutaron con el análisis de varianza no paramétrico propuesto por Kruskall-Wallis (Boyer et al., 1997) debido a que la distribución de los datos no cumplió con los supuestos de normalidad y homocedasticidad. Las relaciones entre las variables se determinaron con un Análisis de Componentes Principales (ACP) a partir de una matriz de correlación múltiple (Johnson y Wichern, 1992). La relación entre el fitoplancton y resto de las variables para cada época se interpretó con un Análisis de Correspondencia Canónica (ACC; Ter Braak y Verdonschot, 1995). Para establecer diferencias en la estructura de la comunidad del fitoplancton con respecto a las épocas se aplicó un Análisis Escalamiento Multidimensional no paramétrico (nMDS, siglas en inglés; Clarke y Warwick, 2001).
RESULTADOS
En la Tabla 2 se muestran los estadísticos básicos de las variables medidas en el Golfo de Cariaco desde febrero de 2014 hasta enero de 2015. La velocidad promedio del viento más baja (1.67 m s-1) se detectó en octubre (época de calma) y la más alta (6.67 m s-1) en abril (época de surgencia), ambas en 2014. Se observaron diferencias significativas de esta variable con respecto a los meses y las épocas (KW= 90 y 27.85; p <
The temporal and spatial differences in the variables were analyzed with the nonparametric variance analysis proposed by Kruskall-Wallis (Boyer et al., 1997) because the distribution of the data did not meet the assumptions of normality and homocedasticity. The relationships between variables were determined using Principal Components Analysis (PCA) from a multiple correlation matrix (Johnson and Wichern, 1992). The relationships between phytoplankton and the other variables for each period were interpreted using Canonical Correspondence Analysis (CCA, Ter Braak and Verdonschot, 1995). With respect to seasons, differences in the structure of the phytoplankton community were stablished with non-parametric Multidimensional Scaling (nMDS, Clarke and Warwick, 2001).
RESULTS
Table 2 shows the basic statistics of the variables measured in the Gulf of Cariaco from February 2014 to January 2015. The lowest average wind speed (1.67 m s-1) was detected in October (calm season), while the highest (6.67 m s-1) was detected in April (upwelling season), both in 2014. Significant differences in this variable were observed with respect to months and seasons (KW =
Variables N PromedioAverage S Mín Máx
Velocidad promedio del viento (m s-1) Average wind speed 12 5.851 1.718 3.34 9.17
Transparencia (m) Transparency 81 7.226 3.494 1.50 19.50
Salinidad (UPS) Salinity 165 36.316 2.698 11.00 38.86
Temperatura del agua (°C) Water temperature 166 24.300 2.285 20.06 29.10
Conc. O2 disuelto (mg L-1) Dissolved O2 Conc. (mg L-1) 116 4.342 2.357 0.85 12.83
Conc. clor. a (mg m-3)Chlor. a conc. (mg m-3) 158 2.934 3.020 nd 17.52
Feopigmentos (mg m-3) Feopigments (mg m-3) 156 0.789 0.705 nd 4.64
Abund. total (org mL-1) Total abund. (org mL-1) 166 242 272 24 1847
H´(bits ind-1) H´(bits ind-1) 166 2.116 0.764 0.38 3.74
Equidad Equity 166 0.615 0.175 0.13 0.99
Tabla 2. Estadísticos básicos de las variables físicas, químicas y biológicas medidas en el golfo de Cariaco desde febrero de 2014 hasta enero de 2015. N: tamaño de la muestra; S: desviación estándar; H´: diversidad de Shannon-Wiener. La velocidad promedio del viento representa el promedio del día de muestreo y los tres días anteriores.
Table 2. Basic statistics of the physical, chemical and biological variables measured in the Gulf of Cariaco from February 2014 to January 2015. N: sample size; S: standard deviation; H': Shannon-Wiener (diversity) index. The average wind speed represents the average of the sampling day and the three previous days.

68
Boletín de Investigaciones Marinas y Costeras • Vol. 47 (2) • 2018
0.05; respectivamente. Figura 2 A y B). La temperatura del agua exhibió un comportamiento similar a la velocidad promedio del viento, mostrando diferencias con respecto a los meses y las épocas (KW= 136.41 y 127.66; p < 0.05; respectivamente. Figura 2 C); además, varió significativamente con respecto a la profundidad y las localidades (KW= 8.14 y 13.03; p < 0.05; respectivamente. Figura 2 D; localidades). El valor más bajo de temperatura (20.1 ºC) se midió a 10 m en Guacarapo (marzo de 2014; época de surgencia) y el más alto (29.1 ºC) se midió en la superficie en Ensenada Grande del Obispo (noviembre de 2014; época de calma). El resto de las variables no presentó diferencias significativas con respecto a la profundidad y la localidad (Tabla 3).
90 and 27.85, p < 0.05; respectively Figure 2 A and B). Water temperature exhibited a behavior similar to the average wind speed, showing differences with respect to months and seasons (KW = 136.41 and 127.66, p < 0.05; respectively Figure 2 C); in addition, it varied significantly in relation to depth and localities (KW = 8.14 and 13.03, p < 0.05; respectively, Figure 2D, localities). The lowest temperature value (20.1 ºC) was measured at 10 m in Guacarapo (March 2014; upwelling period), while the highest (29.1 ºC) was measured at the surface in Ensenada Grande del Obispo (November 2014; calm season). The other variables presented no significant differences correlated to depth or location (Table 3).
Vel.
Prom
edio
del
vie
nto
(m s-1
)Av
erag
e w
ind
spee
d (m
s-1)
Tem
pera
tura
(ºC
)Te
mpe
ratu
re (º
C)
Tiempo (Épocas) / Time (Seasons) Tiempo (meses) / Time (Months)
Tiempo (meses) / Time (Months) Localidades / Locations
Figura 2. Distribución temporal y espacial de la velocidad promedio del viento (m s-1; A y B) y la temperatura (°C; C y D) en el golfo de Cariaco, febrero 2014 - enero 2015. Manz: desembocadura del río Manzanares; Turp: Turpialito; E. 22: Estación 22; S. An: San Antonio; Gua: Guacarapo, E. Gr: ensenada Grande del Obispo; Mani: Manicuare.
Figure 2. Temporal and spatial distribution of the average wind speed (m s-1; A and B) and temperature (°C; C and D) in the Gulf of Cariaco, February 2014 - January 2015. Manz: Manzanares River mouth; Turp: Turpialito; E. 22: Station 22; S. An: San Antonio; Gua: Guacarapo; E. Gr: Ensenada Grande del Obispo; Mani: Manicuare.
VariableVariable
FactorFactor
Valor del análisis (KW)Analysis value (KW)
Concentración de clorofila a Chlorophyll a concentration
Profundidad / DepthLocalidades / Locations
0.6611.63
Abundancia fitoplanctónica Phytoplankton abundance
Profundidad / DepthLocalidades / Locations
0.644.49
Diversidad Diversity
Profundidad / DepthLocalidades / Locations
0.400.11
Tabla 3. Variables que no mostraron diferencias espaciales significativas (p > 0.05).
Table 3. Variables that presented no significant spatial differences (p > 0.05).

69
Instituto de Investigaciones Marinas y Costeras
Con relación a la concentración de clorofila a, el valor más bajo se halló (nd) en Turpialito (superficie) y Manicuare (10 m) en diciembre y en la desembocadura del río Manzanares (superficie), en San Antonio (10 m) y Ensenada Grande (superficie) en enero de 2015; mientras que el más alto (17.52 mg m-3) se obtuvo en San Antonio (10 m) en marzo (época de surgencia). Este valor máximo coincidió con una floración de Guinardia striata. Esta variable presentó diferencias significativas con respecto a los meses y las épocas (KW= 68.78 y 46.35; p < 0.05; respectivamente. Figuras 3 A y B), pero no varió con respecto a la profundidad ni localidades.
Regarding chlorophyll α concentrations, the lowest value (ND; the calm period, was observed in December at Turpialito (surface) and Manicuare (10 m), as well as at the Manzanares River mouth (surface), San Antonio (10 m) and Ensenada Grande (surface) in January 2015. The highest value (17.52 mg m-3) was obtained at San Antonio (10 m) in March (upwelling season). The maximum value coincided with a bloom of of Guinardia striata. This variable presented significant differences in relation to months and seasons (KW = 68.78 and 46.35, p < 0.05; respectively, Figure 3 A and B), but showed no variation in relation to depth or localities.
Tiempo (épocas) / Time (seasons)Tiempo (meses) / Time (Months)
Con
c. C
lor.a
(mgm
-3)
Chl
or a
. con
cent
ratio
n (M
g m
-3)
Log
10 a
bund
. tot
alTo
tal A
bund
ance
(org
mL
-1)
Figura 3. Distribución temporal de la concentración de clor. a (mg m-3; A y B) y la abundancia total (org mL-1; C y D) en el golfo de Cariaco, febrero 2014 - enero 2015.
Figure 3. Temporal distribution chlor. α concentration (mg m-3; A and B) and total abundance (org mL-1; C and D) in the Gulf of Cariaco, February 2014 - January 2015.
La abundancia fitoplanctónica mostró un comportamiento similar a la concentración de clorofila, variando significativamente con respecto a los meses y épocas (KW= 59.23 y 26.46; p < 0.05; respectivamente. Figuras 3 C y D), pero no con respecto a las localidades ni profundidades. El intervalo de valores de abundancia fue 0.2 – 1.8 x 10³ org mL-1. El valor más bajo se detectó a 10 m en San Antonio (abril de 2014) y el más alto en la superficie de la desembocadura del río Manzanares (febrero de 2014), ambos valores durante la época de surgencia.
La abundancia relativa de los grupos funcionales presentó el siguiente orden de importancia: diatomeas
Phytoplankton abundance showed a similar trend that chlorophyll concentration, varying significantly in relation to months and seasons (KW = 59.23 and 26.46, p < 0.05; respectively. Figures 3 C and D), but not by locality or depth. The range of abundance values was 0.2 - 1.8 x 10³ org mL-1. The lowest value was detected at depth of 10 m in San Antonio (April 2014), whereas the highest value was detected on the surface at the Manzanares River mouth (February 2014), both during the upwelling season.
The relative abundance of functional groups presented the following order of importance: diatoms

70
Bulletin of Marine and Coastal Research • Vol. 47 (2) • 2018
> nanoflagelados > cocolitofóridos > dinoflagelados > cianobacterias > “otros” (Figura 4 A). Las diatomeas (42% de los individuos) y los nanoflagelados (35% de los individuos) dominaron alternadamente. Los nanoflagelados dominaron la comunidad desde febrero hasta abril de 2014 y fueron sustituidos por las diatomeas entre mayo y julio del mismo año. Seguidamente los nanoflagelados volvieron a dominar desde agosto hasta noviembre y de nuevo fueron sustituidos por las diatomeas al final del estudio. Los cocolitofóridos representaron una importante fracción del total de organismos y ocuparon el segundo lugar en cuanto a abundancia en marzo, junio y septiembre de 2014 (32% a 24%) y en enero de 2015 (30%). Por otro lado, las cianobacterias y “otros” presentaron la menor abundancia y no mostraban una clara tendencia, por lo que se combinaron en el grupo denominado “Otros”.
> nanoflagellates > coccolithophores > dinoflagellates > cyanobacteria > "others" (Figure 4 A). Diatoms (42% of individuals) and nanoflagellates (35% of individuals) dominated alternately. Nanoflagellates dominated the community from February to April 2014 and were replaced by diatoms between May and July of the same year. Then, nanoflagellates dominated again from August to November and again were replaced by diatoms at the end of the study. Coccolithophores represented an important fraction of the total organisms and ranked second in terms of abundance in March, June and September 2014 (32% to 24%), as well as in January 2015 (30%). On the other hand, cyanobacteria and "others" presented the lowest abundance and showed no clear trend, thus they were combined in "Others".
Abu
ndan
cia
rela
tiva
%R
elat
ive
abun
danc
e
Tiempo (meses) / Time (months)
Nanoflagelados / Nanoflagellates
Otros / Others
Cocolitoforidos / Coccolithophores
Dinoflagelados / Dinoflagellate
Diatomeas / Diatoms
Div
ersi
dad
(bits
ind-1
)D
iver
sity
(bits
ind-1
)
Tiempo (meses) / Time (months) Tiempo (épocas) / Time (Seasons)
Figura 4. Distribución temporal de la abundancia relativa (%, A) y de la diversidad (bits ind-1; B y C) del fitoplancton en el golfo de Cariaco, febrero 2014 - enero 2015.
Figure 4. Temporal distribution of the relative abundance (%, A) and diversity (bits ind-1, B and C) of phytoplankton in the Gulf of Cariaco, February 2014 - January 2015.
Se identificaron 249 especies, de las cuales 120 fueron diatomeas, 90 dinoflagelados, 13 cocolitofóridos, 6 cianobacterias y 20 “otros”. De los taxones identificados, 23 formaron parte de las especies residentes (Tabla 4).
A total of 249 species were identified, of which 120 were diatoms, 90 dinoflagellates, 13 coccolithophorids, 6 cyanobacteria and 20 "others". Twenty-three of the identified taxa belonged to the resident species (Table
71
Marine and Coastal Research Institute
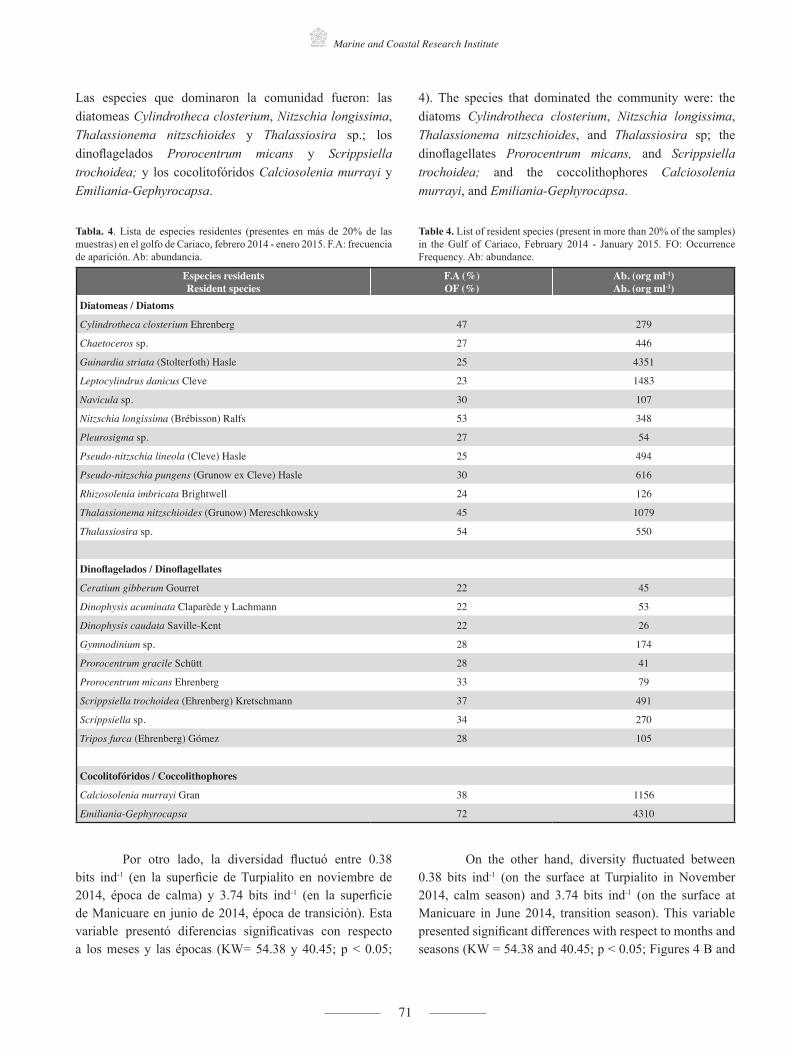
Las especies que dominaron la comunidad fueron: las diatomeas Cylindrotheca closterium, Nitzschia longissima, Thalassionema nitzschioides y Thalassiosira sp.; los dinoflagelados Prorocentrum micans y Scrippsiella trochoidea; y los cocolitofóridos Calciosolenia murrayi y Emiliania-Gephyrocapsa.
4). The species that dominated the community were: the diatoms Cylindrotheca closterium, Nitzschia longissima, Thalassionema nitzschioides, and Thalassiosira sp; the dinoflagellates Prorocentrum micans, and Scrippsiella trochoidea; and the coccolithophores Calciosolenia murrayi, and Emiliania-Gephyrocapsa.
Especies residentsResident species
F.A (%)OF (%)
Ab. (org ml-1)Ab. (org ml-1)
Diatomeas / Diatoms
Cylindrotheca closterium Ehrenberg 47 279
Chaetoceros sp. 27 446
Guinardia striata (Stolterfoth) Hasle 25 4351
Leptocylindrus danicus Cleve 23 1483
Navicula sp. 30 107
Nitzschia longissima (Brébisson) Ralfs 53 348
Pleurosigma sp. 27 54
Pseudo-nitzschia lineola (Cleve) Hasle 25 494
Pseudo-nitzschia pungens (Grunow ex Cleve) Hasle 30 616
Rhizosolenia imbricata Brightwell 24 126
Thalassionema nitzschioides (Grunow) Mereschkowsky 45 1079
Thalassiosira sp. 54 550
Dinoflagelados / Dinoflagellates
Ceratium gibberum Gourret 22 45
Dinophysis acuminata Claparède y Lachmann 22 53
Dinophysis caudata Saville-Kent 22 26
Gymnodinium sp. 28 174
Prorocentrum gracile Schütt 28 41
Prorocentrum micans Ehrenberg 33 79
Scrippsiella trochoidea (Ehrenberg) Kretschmann 37 491
Scrippsiella sp. 34 270
Tripos furca (Ehrenberg) Gómez 28 105
Cocolitofóridos / Coccolithophores
Calciosolenia murrayi Gran 38 1156
Emiliania-Gephyrocapsa 72 4310
Tabla. 4. Lista de especies residentes (presentes en más de 20% de las muestras) en el golfo de Cariaco, febrero 2014 - enero 2015. F.A: frecuencia de aparición. Ab: abundancia.
Table 4. List of resident species (present in more than 20% of the samples) in the Gulf of Cariaco, February 2014 - January 2015. FO: Occurrence Frequency. Ab: abundance.
Por otro lado, la diversidad fluctuó entre 0.38 bits ind-1 (en la superficie de Turpialito en noviembre de 2014, época de calma) y 3.74 bits ind-1 (en la superficie de Manicuare en junio de 2014, época de transición). Esta variable presentó diferencias significativas con respecto a los meses y las épocas (KW= 54.38 y 40.45; p < 0.05;
On the other hand, diversity fluctuated between 0.38 bits ind-1 (on the surface at Turpialito in November 2014, calm season) and 3.74 bits ind-1 (on the surface at Manicuare in June 2014, transition season). This variable presented significant differences with respect to months and seasons (KW = 54.38 and 40.45; p < 0.05; Figures 4 B and

72
Boletín de Investigaciones Marinas y Costeras • Vol. 47 (2) • 2018
Figure4 B y C, respectivamente), pero no varió con respecto a las localidades ni las profundidades.
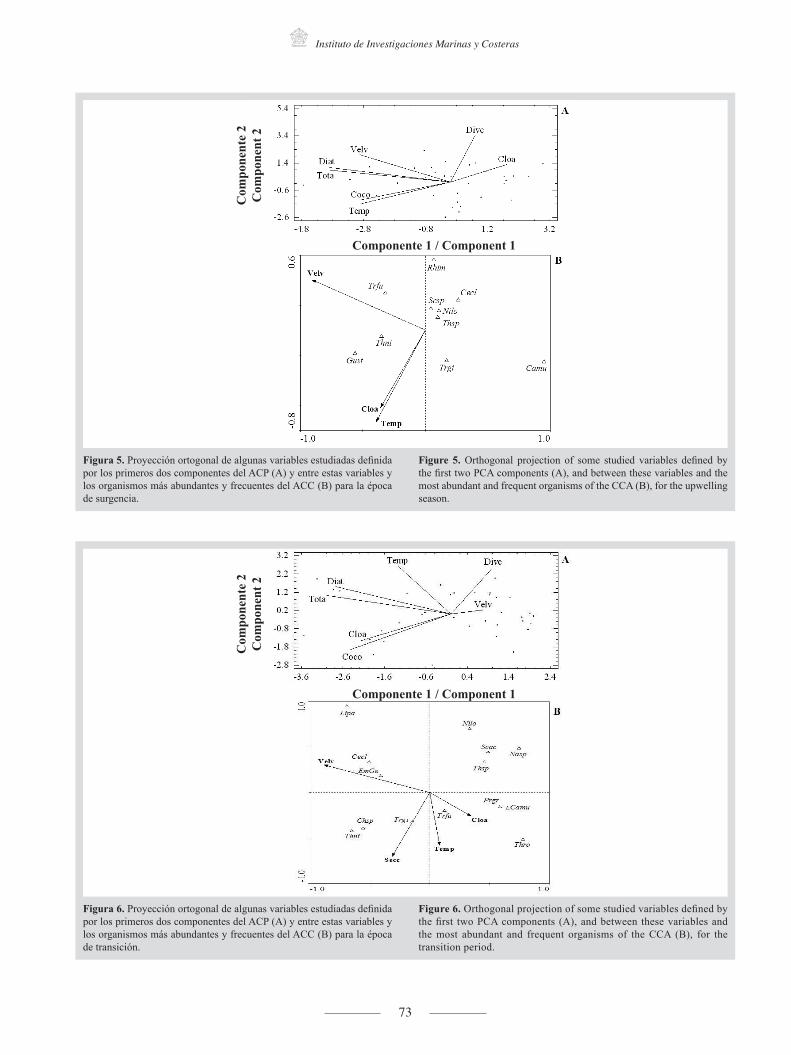
La varianza acumulada de valores de las variables en los primeros tres componentes del ACP durante la época de surgencia fue 72% del total (Tabla 5). En el primer componente se demostró la existencia de una correlación positiva entre la velocidad promedio del viento, la temperatura, la abundancia de diatomeas, la abundancia de cocolitofóridos y la abundancia total; estas variables se correlacionaron de manera negativa con la concentración de clor. a (Fig. 5 A). Así mismo, el ACC de esa época evidenció que la velocidad promedio del viento fue una de las variables que tuvo mayor incidencia sobre la estructura comunitaria (Fig. 5 B); le siguen, en orden de importancia, la temperatura y la concentración de clor. a. A estas variables se asoció la presencia de las diatomeas G. striata y Th. nitzschiodes y el dinoflagelado Tripos furca.
C, respectively), but showed no variation with respect to localities or depths.
The cumulative variance of the values of the variables in the first three PCA components during the upwelling period was 72% of the total (Table 5). The first component showed a positive correlation between average wind speed, temperature, diatom abundance, abundance of coccolithophores and total abundance; these variables correlated negatively with chlor. α concentration (Fig. 5 A). Likewise, the CCA of that period showed that the average wind speed had one the greatest impacts on the community structure (Fig. 5 B), followed by temperature and the chlor. α concentration in order of importance. The presence of diatoms G. striata and Th. nitzschiodes and the dinoflagellate Tripos furca was associated with these variables.
Tabla 5. Porcentajes de varianza total explicada por los tres primeros componentes del Análisis de Componentes Principales (ACP) aplicados a las variables medidas en el golfo de Cariaco, febrero 2014 - enero 2015.
Table 5. Percentages of total variance explained by the first three components of the Principal Component Analysis (PCA) applied to the variables measured in the Gulf of Cariaco, February 2014 - January 2015.
ÉpocaSeason
N° de componenteComponent N°
ValorValue
Porcentaje de varianzaVariance Percentage
Porcentaje acumuladoAccumulated percentage
SurgenciaUpwelling
1 2.6820 38.315 38.315
2 1.3530 19.329 57.644
3 0.9788 13.983 71.627
Transición Transition
1 2.0192 28.847 28.847
2 1.7792 25.418 54.265
3 1.1841 16.917 71.182
CalmaCalm
1 2.6656 33.320 33.320
2 2.4845 31.057 64.377
3 1.1256 14.071 78.448
En cambio, durante la época de transición (junio-agosto de 2014), se determinó que la varianza acumulada de valores de las variables en los primeros tres componentes del ACP fue 71% del total (Tabla 5). En el primer componente, se presentó una correlación positiva entre la concentración de clor. a, la abundancia de diatomeas, cocolitofóridos y total (Figura 6 A). Mientras que en el segundo componente se observó una correlación positiva entre la velocidad promedio del viento y la diversidad. Estas variables se correlacionaron de manera negativa con la temperatura. En la época de transición, la concentración de clor. a y la temperatura se asociaron positivamente a la abundancia del cocolitóforido C. murrayii y los dinoflagelados P. gracile y T. fusus en el componente 1 (Figura 6 B). La velocidad promedio del viento se asoció de forma negativa con la variable y las especies mencionadas anteriormente.
On the other hand, during the transition period (June-August 2014), it was determined that the cumulative variance of the values of the variables in the first three PCA components was 71% of the total (Table 5). The first component showed a positive correlation between the chlor. α concentration, diatoms, coccolithophores, and total abundance (Figure 6 A). The second component showed a positive correlation between the average wind speed and diversity. These variables correlated negatively with temperature. In the transition period, the concentration of chlor. α and temperature were positively associated with the abundance of the coccolithophore C. murrayi and dinoflagellates P. gracile and T. fusus in component 1 (Figure 6 B). The average wind speed was negatively associated with the variable and the species mentioned above.
73
Instituto de Investigaciones Marinas y Costeras
Componente 1 / Component 1C
ompo
nent
e 2
Com
pone
nt 2
Componente 1 / Component 1
Com
pone
nte
2C
ompo
nent
2
Figura 5. Proyección ortogonal de algunas variables estudiadas definida por los primeros dos componentes del ACP (A) y entre estas variables y los organismos más abundantes y frecuentes del ACC (B) para la época de surgencia.
Figura 6. Proyección ortogonal de algunas variables estudiadas definida por los primeros dos componentes del ACP (A) y entre estas variables y los organismos más abundantes y frecuentes del ACC (B) para la época de transición.
Figure 5. Orthogonal projection of some studied variables defined by the first two PCA components (A), and between these variables and the most abundant and frequent organisms of the CCA (B), for the upwelling season.
Figure 6. Orthogonal projection of some studied variables defined by the first two PCA components (A), and between these variables and the most abundant and frequent organisms of the CCA (B), for the transition period.
74
Bulletin of Marine and Coastal Research • Vol. 47 (2) • 2018
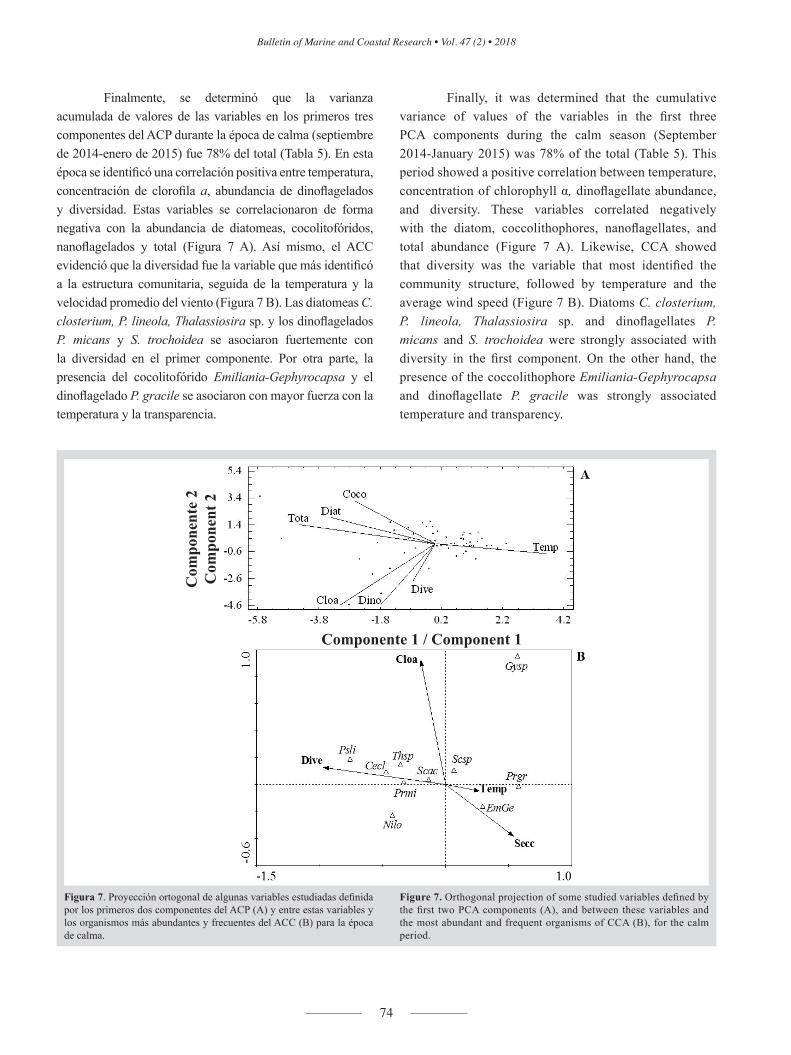
Finalmente, se determinó que la varianza acumulada de valores de las variables en los primeros tres componentes del ACP durante la época de calma (septiembre de 2014-enero de 2015) fue 78% del total (Tabla 5). En esta época se identificó una correlación positiva entre temperatura, concentración de clorofila a, abundancia de dinoflagelados y diversidad. Estas variables se correlacionaron de forma negativa con la abundancia de diatomeas, cocolitofóridos, nanoflagelados y total (Figura 7 A). Así mismo, el ACC evidenció que la diversidad fue la variable que más identificó a la estructura comunitaria, seguida de la temperatura y la velocidad promedio del viento (Figura 7 B). Las diatomeas C. closterium, P. lineola, Thalassiosira sp. y los dinoflagelados P. micans y S. trochoidea se asociaron fuertemente con la diversidad en el primer componente. Por otra parte, la presencia del cocolitofórido Emiliania-Gephyrocapsa y el dinoflagelado P. gracile se asociaron con mayor fuerza con la temperatura y la transparencia.
Finally, it was determined that the cumulative variance of values of the variables in the first three PCA components during the calm season (September 2014-January 2015) was 78% of the total (Table 5). This period showed a positive correlation between temperature, concentration of chlorophyll α, dinoflagellate abundance, and diversity. These variables correlated negatively with the diatom, coccolithophores, nanoflagellates, and total abundance (Figure 7 A). Likewise, CCA showed that diversity was the variable that most identified the community structure, followed by temperature and the average wind speed (Figure 7 B). Diatoms C. closterium, P. lineola, Thalassiosira sp. and dinoflagellates P. micans and S. trochoidea were strongly associated with diversity in the first component. On the other hand, the presence of the coccolithophore Emiliania-Gephyrocapsa and dinoflagellate P. gracile was strongly associated temperature and transparency.
Componente 1 / Component 1
Com
pone
nte
2C
ompo
nent
2
Figura 7. Proyección ortogonal de algunas variables estudiadas definida por los primeros dos componentes del ACP (A) y entre estas variables y los organismos más abundantes y frecuentes del ACC (B) para la época de calma.
Figure 7. Orthogonal projection of some studied variables defined by the first two PCA components (A), and between these variables and the most abundant and frequent organisms of CCA (B), for the calm period.

75
Marine and Coastal Research Institute
Surgencia / Upwelling
Transición / Transition
Calma / Calm
Epoca / Season
Figura 8. Ordenación MDS de las similitudes de Bray-Curtis (transformados a raíz cuadrada) de la comunidad fitoplanctónica en las épocas de surgencia, transición y calma en el golfo de Cariaco, febrero 2014 - enero 2015.
Figure 8. MDS ordering of Bray-Curtis similarities (transformed to square root) of the phytoplankton community in the upwelling, transition, and calm seasons in the Gulf of Cariaco, February 2014 - January 2015.
A pesar de que el MDS-ANOSIM detectó diferencias significativas entre las épocas (R = 0.216; p < 0.05), no se observó una clara separación entre ellas (Tabla 6; Figura 8). Este resultado obedeció al hecho de que los resultados de la época de transición forman un subconjunto de las épocas de surgencia y la calma.
Although the MDS-ANOSIM detected significant differences among seasons (R = 0.216; p < 0.05), no evident difference was found (Table 6, Figure 8). This may be explained because the transition period is a subset of the upwelling and calm periods.
Tabla 6. Resumen del Análisis de Similaridad (ANOSIM) aplicado a los datos multivariados, empleando como factor las épocas en el golfo de Cariaco, entre febrero 2014 y enero 2015.
Table 6. Summary of the Analysis of Similarity (ANOSIM) applied to the multivariate data; seasons in the Gulf of Cariaco between February 2014 and January 2015 were considered as a factor.
GruposGroups
Estadístico RStatistic R
Nivel de significanciaSignificance level
PermutacionesPermutations
Numero >= observadoObserved number ≥
Surgencia – Transición Upwelling - Transition 0.109 < 0.05 999 0
Surgencia – Calma Upwelling - Calm 0.282 < 0.05 999 0
Transición – Calma Transition - Calm 0.217 < 0.05 999 0
DISCUSIÓN
A pesar de que los registros de los datos hidrográficos y del fitoplancton en la época de transición formaron un subconjunto de las mediciones realizadas en las épocas de surgencia y calma, la distribución de los datos evidenció la
DISCUSSION
Although the records of the hydrographic and phytoplankton data in the transition period formed a subset of the measurements carried out in the upwelling and calm periods, the data distribution was suggestive of

76
Boletín de Investigaciones Marinas y Costeras • Vol. 47 (2) • 2018
existencia de estacionalidad. Esto quedó comprobado por: las diferencias entre la relación de las variables expresadas por el ACP, lo que ocasionó cambios en la estructura comunitaria; y la diferencia entre épocas mostrada por el ACC, el cual demostró diferencias en la relación entre las variables y las especies dominantes en cada época.
Durante la época de surgencia se presentó la mayor celeridad del viento, menor temperatura y mayor abundancia fitoplanctónica. Estas características han sido señaladas por autores como Alvera-Azcárate et al. (2009, 2011), Jury (2017) y Rueda-Roa et al. (2018) como típicas de los primeros meses del año cuando los vientos alisios actúan con mayor intensidad y se produce la surgencia costera.
La concentración de los pigmentos y los valores de abundancia fitoplanctónica medidos en este estudio se encuentran dentro del intervalo informado para el área como típicos de esta época (0.01 – 43.06 mg clor. a. m-3 y 0.02 – 2.32 x 10³ org mL-1; Ferraz-Reyes, 1983 y Rivas-Rojas et al., 2007; La Barbera-Sánchez et al., 1999 y Pirela-Ochoa et al., 2008). Sin embargo, la composición fitoplanctónica no coincide con lo registrado por Ferraz-Reyes (1976), Gómez-Carvajal et al. (2000), Rivas-Rojas et al. (2007) y Pirela-Ochoa et al. (2008), quienes mencionan que las diatomeas dominaron de forma exclusiva la comunidad durante la época de surgencia. Además, estos autores establecieron que los cocolitofóridos eran miembros ocasionales de la comunidad. Sin embargo, en este estudio se determinó que los cocolitofóridos C. murrayi y el complejo Emiliania-Gephyrocapsa formaron parte de los organismos dominantes.
El cambio en la conformación del grupo dominante durante la época de surgencia de diatomeas a diatomeas/cocolitofóridos concuerda con lo indicado por Taylor et al. (2012) para la estación de serie de tiempo CARIACO, ubicada a unos 50 km al este del golfo de Cariaco. Los autores establecieron que en esta época durante el período 1996 – 2004 las diatomeas superaron en número al resto de los grupos, mientras que a partir de 2004, las diatomeas y los cocolitofóridos fueron codominantes y exhibieron números similares.
Astor et al. (2013) cuantificaron una fluctuación del pH de 8.113 a 8.014 en CARIACO durante el período 1996 – 2008. A pesar de que los autores informaron que el pH tendió a disminuir durante ese período, se considera que el cambio de pH (0.099 unidades) es muy reducido para explicar la dominancia compartida entre diatomeas y cocolitofóridos durante la época de surgencia. En este sentido, Beaufort et al. (2011) señalaron que la respuesta de los cocolitofóridos
seasonality. This was demonstrated by the differences between the relation of the variables expressed in the PCA, which caused variations in the community structure, as well as by the difference between seasons shown in the CCA, which showed differences in the relationships between the variables and the dominant species in each season.
During the upwelling period, the highest wind speed, lowest temperature, and phytoplankton abundance were observed. Authors including Alvera-Azcárate et al. (2009, 2011), Jury (2017) and Rueda-Roa et al. (2018) have noted that these characteristics are common during the first months of the year when trade winds act with greater intensity, causing coastal upwelling to occur.
Pigment concentration and phytoplankton abundance values measured in this study are within the usual range reported for this season (0.01 - 43.06 mg Chlor. α m-3 and 0.02 - 2.32 × 10³ org mL-1; Ferraz-Reyes, 1983 and Rivas-Rojas et al., 2007; La Barbera-Sánchez et al., 1999 and Pirela-Ochoa et al., 2008). However, the phytoplankton composition is different with that recorded by Ferraz-Reyes (1976), Gómez-Carvajal et al. (2000), Rivas-Rojas et al. (2007), and Pirela-Ochoa et al. (2008), who found that diatoms dominated the community exclusively during the upwelling season. In addition, those authors established that coccolithophores were occasional members of the community. However, this study determined that coccolithophore C. murrayi and the Emiliania-Gephyrocapsa complex accounted for a portion of the dominant organisms.
The change in the conformation of the dominant group from diatoms to diatoms/coccolithophores during the upwelling period agrees with Taylor et al. (2012) for the CARIACO time-series station (CARIACO), located approximately 50 km east of the Gulf of Cariaco. The authors established that at this period during 1996-2004, diatoms outnumbered the other groups, whereas from to 2004 onwards, diatoms and coccolithophores were co-dominant and exhibited similar numbers.
Astor et al. (2013) quantified a pH fluctuation from 8.113 to 8.014 in CARIACO from 1996 - 2008. Although the authors reported that pH tended to decrease during this period, it is considered that the variation of pH (0.099 units) is much reduced to explain co-dominance of diatoms and coccolithophorids during the upwelling season. In this sense, Beaufort et al. (2011) noted that the response of coccolithophorids to the increase in partial pressure of CO2 in the Chilean upwelling zone is contradictory. The reduction

77
Instituto de Investigaciones Marinas y Costeras
ante el aumento de la presión parcial de CO2 en aguas de surgencia chilenas es contradictoria. La reducción de hasta 0.4 unidades de pH resultó en la sustitución de especímenes de Emiliania huxleyi ligeramente calcificados por otros altamente calcificados. Además, Alvites Gutiérrez (2016) indicó que en aguas peruanas el grado de calcificación y distribución de cocolitofóridos está relacionado con la intensidad del afloramiento costero y la distribución de las masas de agua que modifican factores claves como la temperatura, pH, oxígeno y nutrientes. Según la autora, la abundancia de los cocolitofóridos se incrementó hacia las estaciones intermedias y oceánicas donde el pH alcanzó valores más alcalinos, la columna de agua presentó una mayor estratificación y aguas más cálidas y se incrementaron los valores de N/P.
Ante lo anteriormente expuesto, se concuerda con Taylor et al. (2012) y se atribuye el cambio de la estructura comunitaria del fitoplancton durante la época de surgencia al calentamiento de las aguas superficiales y al debilitamiento de la intensidad de esta. Estas condiciones resultan en una disminución del suministro de nutrientes a la capa eufótica impactando negativamente el crecimiento de las diatomeas. La presencia de aguas turbulentas con un contenido menor de nutrientes favorecería el aumento de la abundancia de los cocolitofóridos a expensas de las anteriores. Para demostrar esto es necesario realizar una investigación que comprare las concentraciones actuales de nutrientes con las realizadas en las décadas de los años 70 y 80 del siglo pasado.
Además, se ha sugerido que el drenaje continental durante la época de lluvias tiene un impacto significativo sobre la entrada del sílice necesario para el crecimiento de las diatomeas durante la época de surgencia (Elguezabal Méndez, M. A. Universidad de Oriente. Cumaná, Venezuela. 2003. Com. Pers.). Por lo cual es necesario investigar la relación existente entre la precipitación y la presencia de las diatomeas. La región nororiental de Venezuela es semiárida y el drenaje terrestre podría representar un aporte de sílice significativo al sistema. Tal información podría evidenciar otro impacto del calentamiento global en la región.
Aun cuando los dinoflagelados contribuyeron en menor grado a la composición fitoplanctónica del golfo durante la época de surgencia, P. micans y S. trochoidea formaron parte de las especies más abundantes al final de dicho periodo. Al respecto, Ferraz-Reyes et al. (1987) señalaron que varias especies de dinoflagelados pueden ser abundantes en el golfo de Cariaco durante la época de surgencia.
La correlación positiva observada entre la velocidad promedio del viento, la temperatura, la abundancia de
of up to 0.4 pH units resulted in the substitution of slightly calcified Emiliania huxleyi specimens for other highly calcified specimens. Likewise, Alvites Gutiérrez (2016) indicated that in Peruvian waters, the level of calcification and distribution of coccolithophores is related to the intensity of coastal upwelling and the distribution of water masses that modify key factors such as temperature, pH, oxygen, and nutrients. According to the author, the abundance of coccolithophores increased toward the intermediate and oceanic stations where the pH reached more alkaline values; the water column presented a greater stratification and warmer waters and the N/P values increased.
Therefore, consistent with Taylor et al. (2012), the change in the community structure of phytoplankton during the upwelling period is attributed to the warming of surface water and the weakening of its intensity. These conditions decrease the supply of nutrients to the euphotic layer, negatively impacting diatom growth. The presence of turbulent waters with a lower nutrient content would favor the increase in abundance of coccolithophores at the expense of diatoms. However, it is necessary to perform a study to compare the current concentrations of nutrients with those of the 1970s and 1980s in order to obtain validation.
In addition, it has been suggested that continental drainage during the rainy season has a significant impact on the contribution of the silica that is necessary for diatom growth during the upwelling season (Elguezabal Méndez, M. A. Universidad de Oriente, Cumaná, Venezuela. 2003. Pers. Com.). Therefore, it is necessary to investigate the relationship between precipitation and the presence of diatoms. The northeastern region of Venezuela is semiarid and land drainage could represent a significant contribution of silica to the system. Such information could show another impact of global warming in the region.
Even though dinoflagellates contributed less to the phytoplankton composition of the gulf during the upwelling period, P. micans and S. trochoidea accounted for part of the most abundant species at the end of that period. In relation to this, Ferraz-Reyes et al. (1987) noted that several species of dinoflagellates were abundant in the Gulf of Cariaco during the upwelling season.
The positive correlation between average wind speed, temperature, diatoms, coccolithophorids and total abundance not only showed that both groups of microalgae provided the highest numeric contribution but also that both were favored by the presence of turbulent subsurface waters of lower temperature, as mentioned by Rivas-Rojas et al.

78
Bulletin of Marine and Coastal Research • Vol. 47 (2) • 2018
diatomeas, de cocolitofóridos y la abundancia total no sólo constató que ambos grupos de microalgas fueron los que más contribuyeron numéricamente sino también que ambos fueron favorecidos por la presencia de aguas subsuperficiales de menor temperatura y turbulentas, como lo mencionaron Rivas-Rojas et al. (2007). Por otro lado, la asociación negativa de estas variables con respecto a la clor. a, sugiere que el aumento en la concentración de clorofila fue la respuesta al ingreso de una mayor cantidad de nutrientes causado principalmente por la surgencia (Shang et al., 2004; Goschen et al., 2015).
El hecho de que la velocidad del viento fuera una de las variables más influyente sobre la comunidad fitoplanctónica se debió al efecto de profundización de la capa mezcla. Esto controla la entrada de nutrientes a la columna de agua y la permanencia del fitoplancton en la capa iluminada, entre otros aspectos (Raymont, 2014; Zhang et al., 2016). La asociación detectada entre la diatomea G. striata y la concentración de clor. a sugiere que esta diatomea, cuya abundancia total durante esta época alcanzó un valor alto, fue la que aportó la mayor cantidad de la clor. a.
En la época de transición, la velocidad promedio del viento disminuyó progresivamente y la temperatura aumentó. Este comportamiento ha sido descrito por diversos investigadores (Gómez-Carvajal et al., 2000; Quintero et al., 2004; Rueda-Roa et al., 2018) quienes, a pesar de no señalar la existencia de un periodo de transición, sí afirman que esta tendencia es típica durante la segunda mitad del año en el nororiente del país. Los valores de clor. a medidos en este periodo están dentro del intervalo (nd –17.34 mg clor. a. m-3, Rivas-Rojas et al., 2007; Soto et al., 2015) registrado para esta época, mostrando el mismo patrón que las variables antes descritas.
También, la abundancia fitoplanctónica está dentro del intervalo (0.05 – 3.27 x 10³ org.mL-1) descrito para la época por Rivas-Rojas et al. (2007) y Calvo-Trujillo et al. (2015). La comunidad estuvo integrada principalmente por diatomeas, nanoflagelados y cocolitofóridos. Esta composición es similar a la descrita para la época anterior, lo que sugiere que aun durante el periodo de transición, la intensidad del viento fue suficiente para mantener a las diatomeas en la columna de agua. Esto es corroborado por la inclusión de diatomeas como N. longissima y Th. nitzschiodes dentro de las especies dominantes. Gómez-Carvajal et al. (2000), Rivas-Rojas et al. (2007) y Pirela-Ochoa et al. (2008) establecieron que estas diatomeas formaron parte del grupo funcional dominante a lo largo del año en playa San Luís y en la isla de Cubagua. Esta diferencia en el rol de N. longissima y Th. nitzschiodes podría
(2007). On the other hand, the negative association of these variables in relation to chlor. α suggests that the increase in chlorophyll concentration was the response to the entry of a greater amount of nutrients, caused mainly by upwelling (Shang et al., 2004; Goschen et al., 2015).
The fact that wind speed was one of the most influential variables on phytoplankton community was due to the deepening of the mixed layer. This controls the entrance of nutrients into the water column and the permanence of phytoplankton in the illuminated layer, among other variables (Raymont, 2014; Zhang et al., 2016). The association between G. striata and the concentration of chlor. α suggests that this diatom, whose total abundance during this season was high, provided the greatest amount of chlor. α.
In the transition period, the average wind speed decreased progressively, whereas the temperature increased. This behavior has been described by several researchers (Gómez-Carvajal et al., 2000; Quintero et al., 2004; Rueda-Roa et al., 2018) who, despite not indicating the existence of a transition period, stated that this trend is typical during the second half of the year in the northeast part of the country. The values of chlor. α measured during this period are within the range (ND -17.34 mg chlor. α m-3, Rivas-Rojas et al., 2007; Soto et al., 2015) registered for this season, showing the same pattern as the variables that were previously described.
Likewise, phytoplankton abundance is within the range (0.05 - 3.27 × 10³ org.mL-1) described by Rivas-Rojas et al. (2007) and Calvo-Trujillo et al. (2015) for this season. The community was mainly composed of diatoms, nanoflagellates, and coccolithophores. This composition is similar to that described for the previous season, which suggests that even during the transition period, the wind intensity was sufficient to maintain diatoms suspended in the water column. This is corroborated by the inclusion of diatoms such as N. longissima and Th. nitzschiodes within the dominant species. Gómez-Carvajal et al. (2000), Rivas-Rojas et al. (2007), and Pirela-Ochoa et al. (2008) established that these diatoms were part of the dominant functional group throughout the year at San Luis beach and at the island of Cubagua. This difference in the role of N. longissima and Th. nitzschiodes could represent a variation in the prevailing environmental conditions in the northeast of Venezuela in the last decade. Such variation could only be confirmed with the implementation of a time-series station in the gulf.
79
Marine and Coastal Research Institute
Diversity not only presented the maximum values of the study during this season, but the values were also higher than those reported by Margalef (1972) for neritic waters and higher than the intervals reported in Los Roques archipelago and San Luis beach (Sánchez- Suárez, 1994 and Rivas-Rojas et al., 2007, respectively). The decrease in wind speed allows the coexistence of species that grow in turbulent waters with species that grow in stratified waters, and therefore diversity was greater. This was corroborated by the PCA that was applied to the season in question.
On the other hand, CCA showed that even though the average wind speed did not directly influence the community, the turbulence produced was sufficient to maintain a well-mixed water column. Likewise, the fact that dinoflagellates P. gracile and T. furca were strongly associated with the chlor. α concentration suggests that the locomotive capacity of these species allowed for a greater permanence in the illuminated area for their growth (Balech, 1977; Harrison et al., 2015).
Finally, during the calm season, the environmental variables exhibited a behavior typical of the Venezuelan northeast (Rueda-Roa et al., 2018). The period is characterized by weakening of the trade winds and passage of the ITCZ over the region, both of which control rain patterns in the north part of the country (Quintero et al., 2004).
Concentration of chlorophyll (ND - 12.39 mg chlor. α m-3; Pirela-Ochoa et al., 2008 and Salazar-Gómez et al., 2011, respectively), abundance (0.05 - 2.37 x 10³ org mL-1; Rivas-Rojas et al., 2007 and La Barbera-Sánchez et al., 1999; respectively) and diversity (0.29 - 3.8 bits ind-
1, Sánchez-Suárez 1994 and Rodríguez-Centeno et al., 2010, respectively) are typical for the season. Likewise, the dominance of nanoflagellates was observed from the beginning to the middle part of this season. This dominance is attributed to its various forms of nutrition as indicated by Rivas-Rojas et al. (2007), and more recently by Calvo-Trujillo et al. (2015). In addition, flagella provide it a certain locomotion in the stable water column, which allows it to migrate and thus obtain a greater quantity of nutrients (Tomas, 1997).
Between December 2014 and January 2015 a change community composition occurred. Numerically, diatoms dominated the community again, which was caused by the increase in wind intensity and turbulence that occurred during the upwelling season. However, the concentration of nutrients available should have been low, which explains the
indicar un cambio en las condiciones ambientales imperantes en el nororiente de Venezuela en la última década. Tal cambio sólo podría ser confirmado con la fijación de una estación de series de tiempo en el golfo.
La diversidad, no sólo presentó los máximos valores del estudio durante esta época sino que además estos valores fueron superiores al establecido por Margalef (1972) para aguas neríticas y a los intervalos informados en el archipiélago Los Roques y playa San Luis (Sánchez-Suárez, 1994 y Rivas-Rojas et al., 2007, respectivamente). La disminución en la velocidad del viento permite la coexistencia de especies que proliferan en aguas turbulentas con especies que proliferan en aguas estratificadas y por eso la diversidad fue mayor. Esto fue corroborado por el ACP aplicado a la época en cuestión.
Por otro lado, el ACC demostró que aun cuando la velocidad promedio del viento no influyó directamente sobre la comunidad, la turbulencia que esta generó fue suficiente para mantener una columna de agua bien mezclada. Asimismo, el hecho de que los dinoflagelados P. gracile y T. furca se asociaran fuertemente a la concentración de clor. a, sugiere que la capacidad locomotora de estas especies permitió una mayor permanencia en la zona iluminada para su crecimiento (Balech, 1977; Harrison et al., 2015).
Finalmente, durante la época de calma las variables ambientales exhibieron un comportamiento típico para el nororiente venezolano (Rueda-Roa et al. 2018). La época se caracteriza por el debilitamiento de los vientos Alisios y el paso de la ZCIT sobre la región, los cuales controlan los patrones de lluvia en el norte del país (Quintero et al., 2004).
La concentración de clorofila (nd – 12.39 mg clor. a m-3; Pirela-Ochoa et al., 2008 y Salazar-Gómez et al., 2011, respectivamente), abundancia (0.05 – 2.37 x 10³ org mL-1; Rivas-Rojas et al., 2007 y La Barbera-Sánchez et al., 1999; respectivamente) y diversidad (0.29 – 3.8 bits ind-
1, Sánchez-Suárez 1994 y Rodríguez-Centeno et al., 2010; respectivamente) son típicos para la época. Así mismo, se observó desde el inicio y hasta mediados de esta época la dominancia de los nanoflagelados. Esta dominancia se atribuye a: sus diversas formas de nutrición tal como lo han señalado Rivas-Rojas et al. (2007) y más recientemente Calvo-Trujillo et al. (2015); además, los flagelos le confieren cierta locomoción en la columna de agua estable lo que permite migrar y así obtener una mayor cantidad de nutrientes (Tomas, 1997).
Entre diciembre 2014 y enero 2015 se produjo un cambio en la composición comunitaria. Numéricamente, las diatomeas dominaron la comunidad nuevamente lo cual

80
Boletín de Investigaciones Marinas y Costeras • Vol. 47 (2) • 2018
fue causado por el incremento en la intensidad del viento y la turbulencia tal como ocurrió en la época de surgencia. Sin embargo, la concentración de nutrientes disponibles debió ser baja lo que explica la correlación positiva entre la temperatura y la abundancia de dinoflagelados, un evento común para la época de calma. Además, la asociación entre la concentración de clor. a y los dinoflagelados sugiere que estos aportaron la mayor fracción del pigmento en este periodo. Por otro lado, el hecho de que estas variables se asociaran de manera opuesta a la abundancia de diatomeas, cocolitofóridos y el total de organismos, confirma la presencia de aguas pobres en nutrientes con una baja abundancia y biomasa fitoplanctónica. En la región, este evento ha sido informado por Ferraz-Reyes et al. (1987).
Los resultados indicaron que los procesos oceanográficos y atmosféricos a los cuales está sujeto el golfo de Cariaco permiten la separación del estudio en tres épocas diferentes: surgencia, transición (surgencia y calma) y calma. Cada época presenta características fisicoquímicas y biológicas (fitoplancton en general) propias que resultan de la variación en la intensidad de estos procesos. Es posible que incluso pueda diferenciarse una cuarta época, transición entre calma y surgencia, pero esto requiere de un estudio más prolongado.
CONCLUSIONES
Los cambios temporales de las variables hidrográficas corresponden a lo que se considera como típico para el golfo de Cariaco y fueron ocasionados por la acción de los vientos Alisios durante la primera parte del año y el aporte de agua dulce y nutrientes durante la época de lluvias en la segunda mitad del año. Aun cuando las especies dominantes identificadas en el presente trabajo concuerdan con lo establecido en investigaciones anteriores en el golfo de Cariaco, se ha detectado un cambio en la dominancia durante la época de surgencia. Los cocolitofóridos C. murrayi y Emiliania-Gephyrocapsa no sólo estuvieron presentes en todos los muestreos sino que también llegaron a dominar la comunidad fitoplanctónica durante la época de surgencia.
AGRADECIMIENTOS
Esta investigación fue financiada por el FONACIT como parte del proyecto titulado “Evaluación del fitoplancton y el posible efecto del calentamiento global sobre su composición en la zona litoral del golfo de Cariaco, Venezuela” (PEII N°2013001650). Los autores quieren agradecer la colaboración de Lina Charzeddine y Jesús Sulbarán cuya participación hizo posible la ejecución de este trabajo.
positive correlation between temperature and the abundance of dinoflagellates, a common event during the calm season. In addition, the association between the concentration of chlor. α and the dinoflagellates suggest that these contributed the largest fraction of the pigment in this period. Moreover, the fact that these variables are associated in an opposite way to the abundance of diatoms, coccolithophorids and total organisms confirms the presence of nutrient-poor waters with low abundance and phytoplankton biomass. In the area, this event has been reported by Ferraz-Reyes et al. (1987).
The results indicated that the oceanographic and atmospheric processes of the Gulf of Cariaco allow for dividing the study into three different seasons: upwelling, transition (upwelling and calm) and calm. Each period features its own physicochemical and biological characteristics (phytoplankton in general) that result from variation in the intensity of these processes. It may be possible to distinguish a fourth season, the transition between calm and upwelling, but this requires a more prolonged study.
CONCLUSIONS
The temporary changes in the hydrographic variables corresponded to what is considered typical for the Gulf of Cariaco. These changes were caused by the action of the trade winds during the first part of the year, as well as by the contribution of fresh water and nutrients during the rainy season in the second half of the year. Even though the dominant species identified in the present work agrees with that established in previous investigations in the Gulf of Cariaco, a change in hegemony during the upwelling season was detected. The coccolithophorids C. murrayi and Emiliania-Gephyrocapsa were not only present in all samples but also dominated the phytoplankton community during the upwelling season.
ACKNOWLEDGMENTS
This research was funded by FONACIT as part of the project entitled "Evaluation of phytoplankton and the possible effect of global warming on its composition in the littoral zone of the Gulf of Cariaco, Venezuela" (PEII N° 2013001650). The authors would like to thank Lina Charzeddine and Jesús Sulbarán, whose collaboration made the execution of this work possible.

81
Instituto de Investigaciones Marinas y Costeras
BIBLIOGRAFÍA / LITERATURE CITED
Alvera-Azcárate, A., A. Barth and R.H. Weisberg. 2009. A nested model of the Cariaco Basin (Venezuela): description of the basin’s interior hydrography and interactions with the open ocean. Ocean Dynamics, 59: 97-120.
Alvera-Azcárate, A., A. Barth, R.H. Weisberg, J.J. Castañeda, L. Vandenbulcke and J.M. Beckers. 2011. Thermocline characterization in the Cariaco basin: A modeling study of the thermocline annual variation and its relation with winds and chlorophyll-a concentration. Cont. Shelf Res., 31: 73-84.
Alvites Gutiérrez, D.A. 2016. Variabilidad espacial y calcificación de las comunidades de cocolitofóridos en el sistema de afloramiento costero frente al Callao-Perú. Tesis Ciencias del Mar, Univ. Peruana Cayetano Heredia, Perú. 150 p.
Astor, Y.M., L. Lorenzoni, R. Thunell, R. Varela, F. Muller-Karger, L. Troccoli, G.T. Taylor, M.I. Scranton, E. Tappa and D. Rueda. 2013. Interannual variability in sea surface temperature and fCO2 changes in the Cariaco Basin. Deep-Sea Res. II, 93: 33-43.
Balech, E. 1977. Introducción al fitoplancton marino. Editorial Universitaria de Buenos Aires, Buenos Aires. 211 p.Beaufort, L., I. Probert, T. de Garidel-Thoron, E.M. Bendif, D. Ruiz-Pino, N. Metzl, C. Goyet, N. Buchet, P. Coupel, M. Grelaud, B. Rost, R.E.M. Rickaby
and C. de Vargas. 2011. Sensitivity of coccolithophores to carbonate chemistry and ocean acidification. Nature, 476: 80-83.Bérard-Therriault, L., M. Poulin y L. Bossé. 1999. Guide d'identification du phytoplancton marin de l' estuaire et du Golfe du Saint-Laurent. CNRC.
Ottawa. 387 p.Boyer, J., R. Fourqurean and R. Jones. 1997. Spatial characterization of the water quality in Florida Bay and Whitewater Bay by multivariate analyses: Zones
of similar influence. Estuaries, 20: 743-758.Burford, M., R. Rothlisberg and Y. Wang. 1995. Spatial and temporal distribution of tropical phytoplankton species and biomass in the Gulf of Carpentaria,
Australia. Mar. Ecol. Progr. Ser., 118: 255-266.Calvo-Trujillo, A., J. Díaz-Ramos, S. Subero-Pino, L. Charzeddine-Charzeddine, K. Rincones-Reyes, L. Troccoli-Ghinaglia, M. Elguezabal-Méndez, B.
Marín y B. Márquez. 2015. Variación a corto plazo del fitoplancton en la bahía de Turpialito, Golfo de Cariaco, Venezuela, durante la época de lluvias. Bol. Inst. Oceanogr. Ven., 54: 13-24.
Caraballo, M. 1982a. El golfo de Cariaco. Parte I. Morfología y batimetría. Estructura y tectonismo reciente. Bol. Inst. Oceanogr. Ven., 21: 13-35.Caraballo, M. 1982b. El golfo de Cariaco. Parte IV: Los cambios del nivel del mar. La actividad tectónica y el origen del Golfo. Tipos de costas, perspectivas
de hidrocarburos. Bol. Inst. Oceanogr. Ven., 21: 85-99.Clarke, K.R. and R.M. Warwick. 2001. Change in marine communities: An approach to statistical analyses and interpretation. 2nd ed. Primer-E, Plymouth,
UK. 120 p.Cloern, J.E., S.Q. Foster and A.E. Kleckner. 2014. Phytoplankton primary production in the world's estuarine-coastal ecosystems. Biogeosciences, 11:
2477-2501.Cupp, E. 1943. Marine plankton diatoms of North America. Bull. Scripps Inst. Oceanogr., 5, 283 p.Davis, K.A., N.S. Banas, S.N. Giddings, S.A. Siedlecki, P. MacCready, E.J. Lessard, R.M. Kudela and B.M. Hickey. 2014. Estuary-enhanced upwelling of
marine nutrients fuels coastal productivity in the US Pacific Northwest. J. Geophys. Res. Oc., 119: 8778-8799.Edler, L. and M. Elbrächter. 2010. The Utermöhl method for quantitative phytoplankton analysis: 13-20. In: Bengt, K., C. Cusack and E. Bresnan (Eds.).
Microscopic and molecular methods for quantitative phytoplankton analysis. UNESCO, Paris. 110 p.Ferraz-Reyes, E. 1976. Ciclo anual del fitoplancton en zonas de bancos naturales y de cultivo de mejillón Perna perna en el oriente de Venezuela. Bol. Inst.
Oceanogr. Ven., 15: 119-132.Ferraz-Reyes, E. 1983. Estudio del fitoplancton de la Cuenca Tuy-Cariaco, Venezuela. Bol. Inst. Oceanogr. Ven., 22:111-124.Ferraz-Reyes, E., E. Mandelli y G. Reyes. 1987. Fitoplancton de La Laguna Grande del Obispo, Venezuela. Bol. Inst. Oceanogr. Ven., 26: 111-124.Gallegos, C.L. and P.J. Neale. 2015. Long-term variations in primary production in a eutrophic sub-estuary: contribution of short-term events. Est. Coast.
Shelf Sci., 162: 22-34.Gómez-Carvajal, E., J. Díaz-Ramos e I. Sánchez-Suárez. 2000. Abundancia y biomasa del fitoplancton de la playa San Luis, Cumaná, Venezuela (Junio
1995 – Mayo 1996). Ciencia, 8: 41-52.Goschen, W.S., T.G. Bornman, S.H. Deyzel and E.H. Schumann. 2015. Coastal upwelling on the far eastern Agulhas Bank associated with large meanders
in the Agulhas Current. Cont. Shelf Res., 101: 34-46.Harrison, P.J., A. Zingone, M.J. Mickelson, S. Lehtinen, N. Ramaiah, A.C. Kraberg and H. Jakobsen. 2015. Cell volumes of marine phytoplankton from
globally distributed coastal data sets. Est. Coast. Shelf Sci., 162: 130-142.Johnson, R. and D. Wichern. 1992. Applied multivariate statistical analysis. Prentice-Hall, New York, 642 p.Jury, M.R. 2017. Eastern Venezuela coastal upwelling in context of regional weather and climate variability. Reg. Stud. Mar. Sci., 18: 219-228.Krebs, C. 1999. Ecological methodology. 2nd ed. Benjamin Cumming, San Francisco. 624 p.La Barbera-Sánchez, A., J. Gamboa-Márquez y W. Senior. 1999. Fitoplancton del golfo de Cariaco, estado Sucre, Venezuela. Rev. Biol. Trop., 47: 57-63.
82
Bulletin of Marine and Coastal Research • Vol. 47 (2) • 2018
Lewandowska, A.M., D.G. Boyce, M. Hofmann, B. Matthiessen, U. Sommer and B. Worm. 2014. Effects of sea surface warming on marine plankton. Ecol. Let., 17: 614-623.
Lewis, M.R. 1992. Satellite ocean color observations of global biogeochemical cycles: 139-153. In: Falkowski, P.G., A.D. Woodhead and K. Vivirito (Eds.). Primary productivity and biogeochemical cycles in the sea. Springer Science, New York, 550 p.
López-Monroy, F. y L. Troccoli-Ghinaglia. 2014. Aproximación sobre la climatología de la isla de Margarita y su importancia en los procesos oceánicos. Saber, 26: 465-471.
Margalef, R. 1972. Regularidades en la distribución de la diversidad del fitoplancton en un área del mar Caribe. Inv. Pesq., 36: 241-264.Martínez-López, A., R. Cervantes-Duarte, A. Reyes-Salinas y J. Valdez-Holguín. 2001. Cambio estacional de la clorofila “a” en la Bahía de la Paz, B.C.S.,
México. Hidrobiológica, 11: 45-52.Novoa, D., J. Mendoza, L. Marcano y J. Cárdenas. 1998. El atlas pesquero marítimo de Venezuela. MAC-SARPA. VECEP. Caracas, 197 p.Parsons, T., Y. Maita and C. Lally. 1984. A manual of chemical and biological methods of seawater analysis. Pergamon Press. Oxford, 173 p.Philips, E. and S. Badylak. 1996. Spatial variability in phytoplankton standing crop and composition in a shallow inner-shelf lagoon, Florida Bay. Bull. Mar.
Sci., 58: 203-216.Pinzón-Bedoya, M., A. García-Castellanos y R. Casanova-Rosero. 2007. Seguimiento de la influencia de la marea, condiciones meteorológicas y factores
antropogénicos sobre la variabilidad diaria de parámetros fisicoquímicos en la bahía de Tumaco (Colombia). Bistua: Rev. Fac. Cienc. Bás., 5: 5-16.Pirela-Ochoa, E., L. Troccoli e I. Hernández-Ávila. 2008. Hidrografía y cambios en la comunidad del fitoplancton en la bahía de Charagato, isla de Cubagua,
Venezuela. Bol. Inst. Oceanogr. Ven., 47: 3-16.Quintero, A., J. Bonilla, L. Serrano, M. Amaro, B. Rodríguez, G. Terejova e Y. Figueroa. 2004. Características ambientales de la bahía de Mochima y
adyacencias de la cuenca de Cariaco, Venezuela. Bol. Inst. Oceanogr. Ven., 44: 123-132.Raymont, J.E. 2014. Phytoplankton: 203-258. In: Raymont, J.E. (Ed.). Plankton and productivity in the oceans. Oxford, New York, 496 p.Reynolds, C. 1990. Temporal scales of variability in pelagic environments and the response of phytoplankton. Freshw. Biol., 23: 25-53.Rivas-Rojas, T., J. Díaz-Ramos, L. Troccoli-Ghinaglia, S. Subero-Pino y A. Márquez. 2007. Variación diaria de algunas variables físico-químicas y de la
biomasa del fitoplancton en una playa tropical, Cumaná, estado Sucre, Venezuela. Bol. Inst. Oceanogr. Ven., 46: 13-21.Rivera-Tenenbaum, D. 2006. Dinoflagelados e tintinídeos da região central da Zona Econômica Exclusiva Brasileira: guia de identificação. Mus. Nac., Rio
de Janeiro, 287 p.Rodríguez-Centeno, M., J. Díaz-Ramos, L. Charzeddine-Charzeddine, S. Subero-Pino y L. Troccoli-Ghinaglia. 2010. Biomasa y abundancia del fitoplancton
en la isla La Tortuga, Dependencia Federal, Venezuela. Bol. Inst. Oceanogr. Ven., 49: 77-86.Rueda-Roa, D.T., T. Ezer and F.E. Muller-Karger. 2018. Description and mechanisms of the mid-year upwelling in the Southern Caribbean Sea from remote
sensing and local data. J. Mar. Sci. Eng., 6(2): 36.Rueda-Roa, D.T., T. Ezer and F.E. Muller-Karger. 2018. Description and mechanisms of the mid-year upwelling in the Southern Caribbean Sea from remote
sensing and local data. J. Mar. Sci. Eng., 6(2): 36.Salazar-Gómez, I., J. Díaz-Ramos, K. Rincones-Reyes, L. Charzeddine-Charzeddine, S. Subero-Pino, L. Troccoli-Ghinaglia, B. Márquez, B. Marín, A.
Márquez y D. Hernández. 2011. Cambios diarios de la biomasa fitoplanctónica en la bahía de Mochima, Venezuela, durante la época de lluvias. Bol. Inst. Oceanogr. Ven., 50: 69-77.
Sánchez-Suárez, I. 1994. Ecología y dinámica del fitoplancton en un arrecife coralino. Un estudio en los islotes Dos Mosquises, Parque Nacional Archipiélago Los Roques, Venezuela. Tesis. Doctorado. Facultad de Ciencias. Escuela de Biología. Universidad Central de Venezuela, Caracas, 152 p.
Shang, S.L., C.Y. Zhang, H.S. Hong, S.P. Shang and F. Chai. 2004. Short-term variability of chlorophyll associated with upwelling events in the Taiwan Strait during the southwest monsoon of 1998. Deep Sea Res. Part II: Trop. Stud. Oceanogr., 51: 1113-1127.
Soto P.G., L. Troccoli, J.R. Díaz, G. Martínez y R. Crescini. 2015. Variabilidad a corto plazo de la hidrografía y fitoplancton en la Ensenada de Turpialito, Venezuela. Bol. Inst. Oceanogr. Ven., 54: 125-137.
Taylor, G., F. Muller-Karger, R.C. Thunell, M.I. Scranton, Y. Astor, R. Varela, L. Troccoli-Ghinaglia, L. Lorenzoni, K. A. Fanning, S. Hameed and O. Doherty. 2012. Ecosystem responses in the southern Caribbean Sea to global climate change. Proc. Nat. Acad. Sci., 109: 19315-19320.
Ter Braak, C. and P. Verdonschot. 1995. Canonical correspondence analysis and related multivariate methods in aquatic ecology. Aq. Sci., 57: 255-289.Tomas, C. 1997. Identifying marine diatoms and dinoflagellates. Academic Press, New York. 858 p.Zhang, Z., R. Lowe, G. Ivey, J. Xu and J. Falter. 2016. The combined effect of transient wind-driven upwelling and eddies on vertical nutrient fluxes and
phytoplankton dynamics along Ningaloo Reef, Western Australia. J. Geophys. Res. Oc., 121: 4994-5016.
RECIBIDO / RECEIVED: 12/12/2017 ACEPTADO / ACCEPTED: 11/07/2018