Corruption and Wealth: Unveiling a national prosperity ... and Wealth: Unveiling a national...
23
Corruption and Wealth: Unveiling a national prosperity syndrome in Europe Juan C. Correa 1, 2, * and Klaus Jaffe 3 1 Departamento de Ciencia y Tecnología del Comportamiento, Universidad Simón Bolívar, Caracas, Venezuela 2 Facultad de Psicología, Fundación Universitaria Konrad Lorenz, Bogotá, Colombia 3 Centro de Estudios Estratégicos, Universidad Simón Bolívar, Caracas, Venezuela * [email protected] Abstract Data mining revealed a cluster of economic, psychological, social and cultural indicators that in combination predicted corruption and wealth of European nations. This prosperity syndrome of self-reliant citizens, efficient division of labor, a sophisticated scientific community, and respect for the law, was clearly distinct from that of poor countries that had a diffuse relationship between high corruption perception, low GDP/capita, high social inequality, low scientific development, reliance on family and friends, and languages with many words for guilt. This suggests that there are many ways for a nation to be poor, but few ones to become rich, supporting the existence of synergistic interactions between the components in the prosperity syndrome favoring economic growth. No single feature was responsible for national prosperity. Focusing on synergies rather than on single features should improve our understanding of the transition from poverty and corruption to prosperity in European nations and elsewhere. INTRODUCTION During the past decade public interest in corruption has grown [1–4]. Roughly speaking, corruption occurs when public officials unlawfully enrich their social network as well as themselves by misusing the power entrusted to them [5]. This phenomenon can be studied by the perception of citizens who participate in household surveys [6]. An important part of the literature has focused on the relationship between corruption and a variety of economic, social and cultural indicators. For instance, it is known that: i) corruption and the economic wealth of a nation are correlated [4–6]; ii) public and private investment are affected by the perception of corruption [7–17]; iii) corruption affects economic growth [18–21], and it is related to income inequality [22] and trade [23–27]; iv) taxation levels are related to economic performance and corruption [8]; v) corruption and inflation interact [28]; vi) nations with high levels of corruption have citizens with characteristic personality traits [29,30]; vi) corruption relates to weak institutions [31]; vii) is linked with pollution [32]; viii) many aspects of societies, such as psychological characteristics of its citizens, and its feelings of well-being [33] are related to corruption perception; ix) corruption is correlated with the physical and human capital of a nation [31]; x) and with important cultural aspects [28,34–39]. Due to the large number of inter-correlated variables that are associated with corruption, a corruption syndrome has been proposed [40–42] that would explain why many countries are poor and have difficulties in engaging in socio-economic development that would allow their citizens to become wealthy. The idea behind this approach is that national welfare is affected by corruption, not only indirectly through GDP, but also directly through non-material factors like the time and effort required to cope with corrupt behavior, or psychological costs associated with a general climate of
Transcript of Corruption and Wealth: Unveiling a national prosperity ... and Wealth: Unveiling a national...

Corruption and Wealth: Unveiling a national prosperity syndrome in Europe
Juan C. Correa1, 2, * and Klaus Jaffe3
1 Departamento de Ciencia y Tecnología del Comportamiento, Universidad Simón Bolívar, Caracas,
Venezuela 2 Facultad de Psicología, Fundación Universitaria Konrad Lorenz, Bogotá, Colombia 3 Centro de Estudios Estratégicos, Universidad Simón Bolívar, Caracas, Venezuela
Abstract Data mining revealed a cluster of economic, psychological, social and cultural indicators that in combination
predicted corruption and wealth of European nations. This prosperity syndrome of self-reliant citizens,
efficient division of labor, a sophisticated scientific community, and respect for the law, was clearly distinct
from that of poor countries that had a diffuse relationship between high corruption perception, low
GDP/capita, high social inequality, low scientific development, reliance on family and friends, and languages
with many words for guilt. This suggests that there are many ways for a nation to be poor, but few ones to
become rich, supporting the existence of synergistic interactions between the components in the prosperity
syndrome favoring economic growth. No single feature was responsible for national prosperity. Focusing on
synergies rather than on single features should improve our understanding of the transition from poverty and
corruption to prosperity in European nations and elsewhere.
INTRODUCTION
During the past decade public interest in corruption has grown [1–4]. Roughly speaking, corruption
occurs when public officials unlawfully enrich their social network as well as themselves by
misusing the power entrusted to them [5]. This phenomenon can be studied by the perception of
citizens who participate in household surveys [6]. An important part of the literature has focused on
the relationship between corruption and a variety of economic, social and cultural indicators. For
instance, it is known that: i) corruption and the economic wealth of a nation are correlated [4–6]; ii)
public and private investment are affected by the perception of corruption [7–17]; iii) corruption
affects economic growth [18–21], and it is related to income inequality [22] and trade [23–27]; iv)
taxation levels are related to economic performance and corruption [8]; v) corruption and inflation
interact [28]; vi) nations with high levels of corruption have citizens with characteristic personality
traits [29,30]; vi) corruption relates to weak institutions [31]; vii) is linked with pollution [32]; viii)
many aspects of societies, such as psychological characteristics of its citizens, and its feelings of
well-being [33] are related to corruption perception; ix) corruption is correlated with the physical
and human capital of a nation [31]; x) and with important cultural aspects [28,34–39]. Due to the
large number of inter-correlated variables that are associated with corruption, a corruption
syndrome has been proposed [40–42] that would explain why many countries are poor and have
difficulties in engaging in socio-economic development that would allow their citizens to become
wealthy.
The idea behind this approach is that national welfare is affected by corruption, not only
indirectly through GDP, but also directly through non-material factors like the time and effort
required to cope with corrupt behavior, or psychological costs associated with a general climate of

unlawfulness [33]. Diener, Diener and Diener [43] found evidence that high income, individualism,
human rights, and societal equality correlated strongly with each other and with subjective well-
being across surveys; but only individualism persistently correlated with well-being when other
predictors were controlled. Corruption and poverty are treated as pathological syndromes that need
to be cured [40–42]. Specifically, corruption has often been pinpointed as the major single factor
hindering economic progress as it affects economic freedom, socio-political stability and tradition
of law abidance.
The socio-cultural characteristics of nations are related with their economic performances.
For instance, Chen [44] observed that countries with languages that do not require the future events
to be grammatically marked when making predictions (like German) save on average 6% more of
their GDP per year and this result is unaffected by the addition of life-cycle-savings controls, it
holds in every major region of the world, and appears stable across time. Jaffe and colleagues [45]
found that countries with languages that use many synonyms for “guilt” (i.e., “guilt societies”) are
also countries with high levels of corruption, low governance, difficulties in doing business, low life
expectancy and low income per capita. There is no doubt that these and other socio-cultural
indicators are linked with the economic performance of countries. Therefore, it is imperative for
economists and policy makers to understand the relative importance regarding its effect on
corruption, of cultural, psychological and other key indicators and/or predictors of a nation’s
economic wealth.
There is an important consensus in the literature that economic prosperity is related to trust
[31], property rights and the rule of law [46]. These elements in turn are strongly related to the
economic complexity [47] and scientific development of a nation [48]. These last two elements,
especially the last one, are easy to measure and showed to be highly significant and reliable
statistical predictors of the working of national institutions [49]. These studies suggest that an
important general predictor of economic wealth is the rationality of a country which is also reflected
in the proper working of its institutions. For example, Jaffe et al [48] reported strong correlations
between GDP per capita, religious tolerance, and scientific development as estimated by the
scientific productivity per capita, whereas in another paper [50] strong correlations between the rule
of law, the human development index, scientific productivity, ease of doing business, economic
freedoms, transparency and wealth, among other indices, were evidenced. Welsch [33] estimated
the total amount of scientists and engineers per population and detected statistically significant
relationships between the rationality of countries and the subjective and economic well-being of its
inhabitants. Another approach was developed by Hidalgo and Hausmann [49] who estimated the
amount of practical knowledge in a society by using the diversity and complexity measures of the
products a country exports. These metrics of economic complexity correlated strongly with
economic wealth. Studies inspired by this calculus of economic complexity proposed alternative
indicators that capture this rationality even better [51]. Employing the scientific productivity of
countries, Jaffe et al. [51] developed an indicator called “S-Share”, which considers the relative
research effort of each scientific subject area as the percentage of the total number of publications
of a country, published in journals of that area in a year. This indicator provides robust correlations
between scientific productivity in basic sciences with economic growth during the following five
years in middle income countries. These studies suggest that scientific development affects multiple
aspects of the economy, in such a way that “rationally-governed societies” achieve more wealth for

their citizens, and more wealth, in turn, allows for more and better investment in education, science
and economic development, increasing wealth further. Yet, several countries have not engaged in
this virtuous economic cycle, which suggests that a possible reason for these differences could be
related to the predominant psychological, social and cultural idiosyncrasies. If so, existing data
related to these characteristics could make it possible to observe human drives that are related with
the corruption and wealth of a state.
Clearly then, economic wealth and corruption are manifest covariates. We know that there
is a relationship between wealth, measured as GDP per capita, scientific-technological
developments and institutions, estimated through the scientific production, measured as publications
per capita, and corruption [50]. Here we want to untangle a bit more of this relationship by
incorporating into the analysis other psycho-socio-cultural indicators that affect it. To simplify this
very complex problem, we restrict our analysis to Europe, where more reliable data is available,
economies and cultures are diverse but not too much, and history has fomented high level of
information exchange between countries.
METHODS
We built a database composed of several indicators of the European countries. These
indicators capture the behavior of nations at different scales ranging from the individual and the
societal to the cultural and the economic level. We initially considered the six rounds of the
“European Social Survey” (ESS) between 2002 and 2012, both included
(http://www.europeansocialsurvey.org/). The ESS is an academically driven cross-national survey
that has been conducted every two years across Europe (participant countries in this survey are
listed in table A1 in the appendix). The survey offers the possibility to analyze the stability and
change in social structure, conditions and attitudes in Europe, allowing inferences on changes in
Europe’s social, political and moral fabric based on citizens’ perceptions and judgments of key
aspects of their societies.
We specifically focus on the analysis of the human values that were assessed in the ESS
through a modified version of the “Portrait Values Questionnaire” [52]. This questionnaire includes
a series of short verbal portraits of different people and each portrait describes a person’s goals,
aspirations, or wishes that point implicitly to the importance of a single basic value. For instance,
“Thinking up new ideas and being creative is important to him. He likes to do things in his own
original way” describes a person for whom self-direction values are important. “It is important to
him to be rich. He wants to have a lot of money and expensive things” describes a person who
cherishes power values. By describing each person in terms of what is important to him or her, the
verbal portraits capture the person’s values without explicitly identifying values as the topic of
investigation. For each portrait, respondents answer: “How much like you is this person?” The
response alternatives are; “very much like me”, “like me”, “somewhat like me”, “a little like me”,
“not like me”, and “not like me at all”. For each portrait, respondents choose their response by
checking one of six boxes labeled with the response alternatives. Thus, respondents’ own values are
inferred from their self-reported similarity to people who are described in terms of particular values.
The similarity judgments are transformed into a 6-point numerical scale. This set of values is listed
in Table A4 in the appendix. Along with this set of human values, we also considered the responses
to the question of “How happy are you?” included in the ESS as a proxy of subjective well-being of
citizens.
The original databases for these rounds have at least 40,000 individual responses per round.
In order to have a single tractable database, we followed the “macro approach” used by Welsch
[33] who analyzed the aggregate (average) response per country. This approach is similar to that
employed by the World Bank in the cross-country analysis of the Governance indicators (see also
[53]) and proved to be justified because these human values are seen stable across time and within
each society with few exceptions [52]. Thus, our analysis consisted in the national average
responses given to the human values in each round of the ESS.
In addition, we considered the “corruption perception index”, as measured by
“Transparency International” (http://www.transparency.org/) for each participant state in each
round of the ESS. We reversed the original records of this index to re-adapt its statistical range from
0.1 (“very clean country”) to 9.6 (“very corrupt nation”). In our database we also included the
annual GDP per capita, the population size of nations and the taxes paid to the central government
as percentage of GDP from the “World Development Indicators” of the World Bank
(http://databank.worldbank.org/data/databases.aspx). We obtained the total academic productivity
of each nation from SCImago (http://www.scimagojr.com/), and divided that number by its total
population as given by World Bank, in order to obtain publications per capita. We also obtained the
“Human Inequality Index” for 2012 from the online available data provided by the “United Nations
Development Program” (https://data.undp.org/).
A conspicuous set of cultural values was assessed through the language spoken in the
country. By using Google Translate we quantified the number of synonyms each language provides
for “guilt” as the best indicator for separating guilt-shame societies [45]. The resulting database was
finally composed by a hundred socio-cultural-economic indicators of the 36 countries that
participated in at least one of the six rounds of the ESS.
RESULTS
Table 1 shows the Spearman correlations between corruption perception, wealth measured
as GDP per capita, and scientific productivity, in European countries and in the world. The
correlation between corruption perception and wealth (GDP per capita) was -0.905 in Europe. The
Spearman correlation between corruption perception and publications per capita for European
countries was very significant although slightly less strong than the former correlation. The
correlation between wealth and publication per capita was also very strong in Europe. Interestingly
this correlation using data for all countries in the world with populations above 5 million was even
slightly stronger (0.897). That is, wealth and publications per capita was the strongest correlation
found among countries worldwide, whereas in Europe the strongest correlation found was between
wealth and corruption perception.

Table 1: Non-parametric correlations of corruption perception, wealth and academic publications per
capita in Europe and in the whole World.
Corruption
Perception GDP per capita
Data for Europe World Europe World
GDP per capita -0.905*** -0.763*** 1 1
Publications per capita -0.889*** -0.801*** 0.887*** 0.897***
NOTE: The correlations included in this table are estimated through Spearman’s Rho non-parametric correlation
coefficient. Original data of GDP per capita and corruption perception are available in the web pages of The World Bank
and Transparency International. The data for publications per capita was estimated using the available data of academic
productivity provided by SCImago and divided by the population of each nation as provided by The World Bank. *
Correlation is significant at p < 0.05; ** significant at p < 0.01; *** significant at p < 0.001
The Spearman correlation between corruption perception in Europe and the Human
Inequality Index of the UNDP was also highly statistically significant: 0.588 (p < 0.0001). The
correlation between Corruption Perception and the % of GDP paid in taxes was not (p = 0.14)
Figure 1 depicts the association between wealth (GDP per capita) and perceived corruption
in Europe. The relationship between both variables is practically linear. Two countries, Russia and
Norway, deviated somewhat from the linear regression, having higher perceptions of corruption
than expected from their levels of wealth. Both are largely dependent on oil exports. The rest of the
countries adjust neatly to the inverse relation between corruption perception and wealth: poor
countries are perceived as more corrupt than rich ones.
Figure 1. Association between economic wealth and perceived corruption in 36 European countries. This
figure depicts the scatterplot of the relationship between economic wealth (captured as GDP per capita provided by The
World Bank) and the corruption perception (captured as the corruption perception index provided by Transparency
International) for the participating countries of the “European Social Survey” (ESS).

Table 2 presents two stepwise regression models explaining corruption perception. The set
of human values listed in Model 3 works as important predictors of perceived corruption in
European countries (R2 = 0.951; p < 0.001), but only a small set of them proved to be statistically
significant when GDP per capita is included as a predictor in Model 2 (R2 = 0.908; p < 0.001). GDP
per capita alone (Model 1) explains a large amount of the variance but statistical significance was
somewhat lower than that calculated with non-parametric tests such as those used in Table I. Table
II shows the relationships between the prevailing individual values of the citizens in the country,
their wealth, and perceived corruption are intimately entangled and statistically not different.
Table 2: Multivariate relationship of corruption perception, economic wealth and human values
Best predictors
Model 1 Model 2 Model 3
GDP per capita (current US$) 0.87***
(0.08)
-0.43***
(0.09)
Strong government that ensures safety
-0.36***
(0.09)
-0.25***
(0.11)
To make own decisions and be free
0.31***
(0.07)
0.38***
(0.09)
To try new and different things in life
-0.23***
(0.08)
To get respect from others
-0.27***
(0.07)
-0.41***
(0.07)
To be rich, have money and expensive things
-0.26***
(0.08)
To think new ideas and being creative
0.35***
(0.08)
To seek adventures and have an exciting life
0.24***
(0.05)
To be loyal to friends and devote to people close
-0.30***
(0.09)
R-Squared
0.77***
0.91***
0.95*** NOTE: Each column reports the beta coefficients from stepwise multiple regression models along with its standard errors
reported in parentheses. The multivariate association R-squared for each model is presented at the bottom of the table.
* Correlation is significant at p < 0.05; ** significant at p < 0.01; *** significant at p < 0.001
Yet, relationships between the variables studied are strongly non-linear. Thus, non-
parametric statistics might be better in unveiling interesting relationships. In Table 3 we present
Spearman’s correlation between individuals’ values surveyed in the ESS and perceived corruption,
GDP per capita, synonyms of guilt, publications per capita and the indicator of individual subjective
happiness. The values which came out as most statistically significantly correlated were “To follow
traditions and customs” and “To have a good time”. These, and other questions mainly related to
giving importance to individual achievements were negatively correlated to perceived corruption.
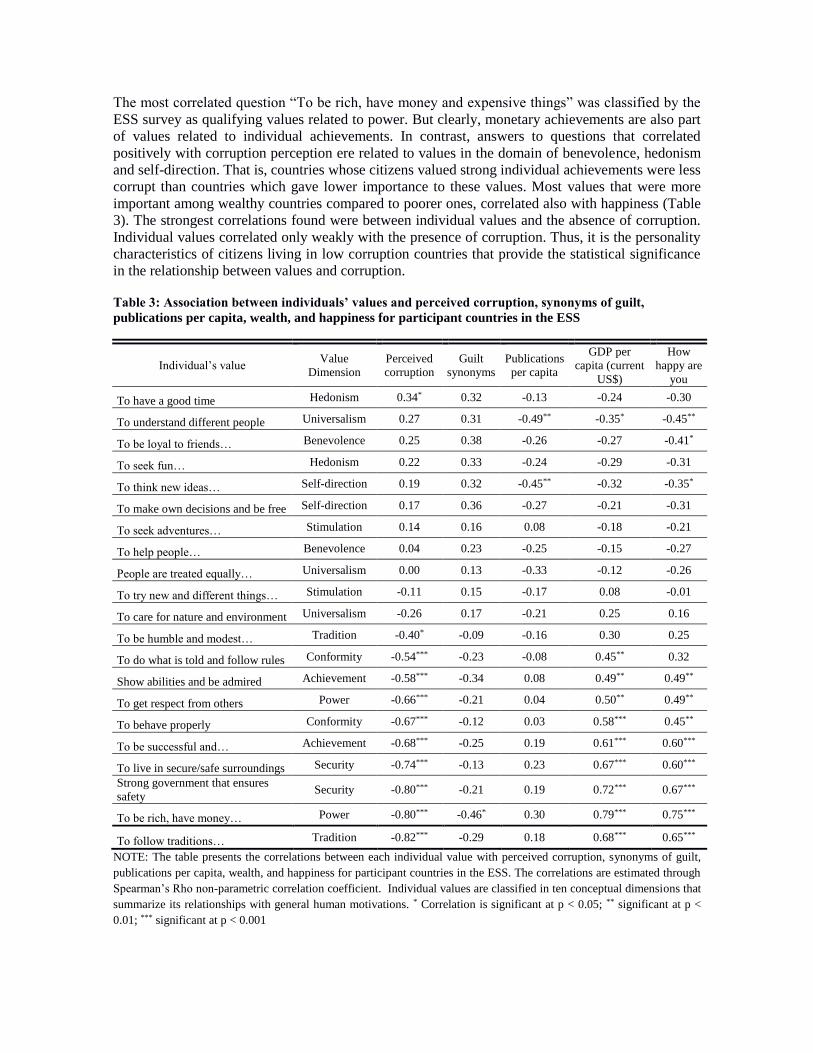
The most correlated question “To be rich, have money and expensive things” was classified by the
ESS survey as qualifying values related to power. But clearly, monetary achievements are also part
of values related to individual achievements. In contrast, answers to questions that correlated
positively with corruption perception ere related to values in the domain of benevolence, hedonism
and self-direction. That is, countries whose citizens valued strong individual achievements were less
corrupt than countries which gave lower importance to these values. Most values that were more
important among wealthy countries compared to poorer ones, correlated also with happiness (Table
3). The strongest correlations found were between individual values and the absence of corruption.
Individual values correlated only weakly with the presence of corruption. Thus, it is the personality
characteristics of citizens living in low corruption countries that provide the statistical significance
in the relationship between values and corruption.
Table 3: Association between individuals’ values and perceived corruption, synonyms of guilt,
publications per capita, wealth, and happiness for participant countries in the ESS
Individual’s value Value
Dimension
Perceived
corruption
Guilt
synonyms
Publications
per capita
GDP per
capita (current
US$)
How
happy are
you
To have a good time Hedonism 0.34* 0.32 -0.13 -0.24 -0.30
To understand different people Universalism 0.27 0.31 -0.49** -0.35* -0.45**
To be loyal to friends… Benevolence 0.25 0.38 -0.26 -0.27 -0.41*
To seek fun… Hedonism 0.22 0.33 -0.24 -0.29 -0.31
To think new ideas… Self-direction 0.19 0.32 -0.45** -0.32 -0.35*
To make own decisions and be free Self-direction 0.17 0.36 -0.27 -0.21 -0.31
To seek adventures… Stimulation 0.14 0.16 0.08 -0.18 -0.21
To help people… Benevolence 0.04 0.23 -0.25 -0.15 -0.27
People are treated equally… Universalism 0.00 0.13 -0.33 -0.12 -0.26
To try new and different things… Stimulation -0.11 0.15 -0.17 0.08 -0.01
To care for nature and environment Universalism -0.26 0.17 -0.21 0.25 0.16
To be humble and modest… Tradition -0.40* -0.09 -0.16 0.30 0.25
To do what is told and follow rules Conformity -0.54*** -0.23 -0.08 0.45** 0.32
Show abilities and be admired Achievement -0.58*** -0.34 0.08 0.49** 0.49**
To get respect from others Power -0.66*** -0.21 0.04 0.50** 0.49**
To behave properly Conformity -0.67*** -0.12 0.03 0.58*** 0.45**
To be successful and… Achievement -0.68*** -0.25 0.19 0.61*** 0.60***
To live in secure/safe surroundings Security -0.74*** -0.13 0.23 0.67*** 0.60*** Strong government that ensures
safety Security -0.80*** -0.21 0.19 0.72*** 0.67***
To be rich, have money… Power -0.80*** -0.46* 0.30 0.79*** 0.75***
To follow traditions… Tradition -0.82*** -0.29 0.18 0.68*** 0.65***
NOTE: The table presents the correlations between each individual value with perceived corruption, synonyms of guilt,
publications per capita, wealth, and happiness for participant countries in the ESS. The correlations are estimated through
Spearman’s Rho non-parametric correlation coefficient. Individual values are classified in ten conceptual dimensions that
summarize its relationships with general human motivations. * Correlation is significant at p < 0.05; ** significant at p <
0.01; *** significant at p < 0.001

Richest citizens living in counties with low corruption perception gave high priorities to the
highly negatively correlated values that relate to: tradition, conformity, security, achievement, and
power. Figure 2 depicts the association between perceived corruption and importance assigned to
the two values surveyed by ESS that predict perceived corruption positively and negatively.
FIGURE 2: Association between human values and perceived corruption in 36 European countries. Scatter plots of the relationship between individual values and perceived corruption for participant countries in the
“European Social Survey”. Bubble size indicates per capita GDP (the bigger the bubble the wealthier the country).
Countries in red have numerous synonyms for the word “guilt”.
Table 4 presents two stepwise regression models for predicting corruption perception based
on the prevailing division of labor in the production of knowledge. Model 3 shows the indicators of
academic productivity that work as significant predictors of perceived corruption when GDP per
capita is not included in the model’s predictors (R2 = 0.867; p < 0.001). Model 2 shows that only
one of these predictors proved to be statistically significantly for predicting corruption perception
along with GDP per capita (R2 = 0.846; p < 0.001). Table 4 shows that the relationships between
wealth, corruption and the form of division of labor used in the production of knowledge are
intimately entangled and statistically not different.
IS CH
FR
AL
AT
IL
DE
BE
HU
TR
DK
SI
LV
GR
EEPT
ES
NL
FI
SE
HR
RO
RU
CY
XK
LU
CZ
BG
NO
LT
GB
IE
PL
IT
UA
SK
1,8 2,0 2,2 2,4 2,6 2,8 3,0 3,2 3,4 3,6 3,8 4,0
To have a good time
1
2
3
4
5
6
7
8
9
Pe
rce
ive
d c
orr
up
tio
n
IS CH
FR
AL
AT
IL
DE
BE
HU
TR
DK
SI
LV
GR
EEPT
ES
NL
FI
SE
HR
RO
RU
CY
XK
LU
CZ
BG
NO
LT
GB
IE
PL
IT
UA
SK
XK
CY
GRTR BG
PL
AL
IT
HR
RO
SK
LV
RUUA
HU
IE
SILU
LT
IL ES
DK
BE
PT
CZ
NL
CH
GB
AT
DE
NO
EE
FI SE
FR
IS
1,6 1,8 2,0 2,2 2,4 2,6 2,8 3,0 3,2 3,4
To follow traditions and customs
1
2
3
4
5
6
7
8
9
Pe
rce
ive
d c
orr
up
tio
n
XK
CY
GRTR BG
PL
AL
IT
HR
RO
SK
LV
RUUA
HU
IE
SILU
LT
IL ES
DK
BE
PT
CZ
NL
CH
GB
AT
DE
NO
EE
FI SE
FR
IS
XK
ROTR
LV
AL
RU
IL
GR
LT
SK
UA
CZ
HU
AT
PL
LU CY
BG
EE
IE
HR
PT
ES
SI
BE
IT
DE
GB
DK
NL
CH
IS
SEFI
NO
FR
2,6 2,8 3,0 3,2 3,4 3,6 3,8 4,0 4,2 4,4 4,6 4,8 5,0
To be rich, have money and expensive things
1
2
3
4
5
6
7
8
9
Pe
rce
ive
d c
orr
up
tio
n
XK
ROTR
LV
AL
RU
IL
GR
LT
SK
UA
CZ
HU
AT
PL
LU CY
BG
EE
IE
HR
PT
ES
SI
BE
IT
DE
GB
DK
NL
CH
IS
SEFI
NO
FR

Table 4: Multivariate relationship of corruption perception, economic wealth and academic
productivity
Best predictors Model 1 Model 2 Model 3
GDP per capita (current US$) -0.87
-0.50
(0.12)
S-Share Biochemistry, genetics and molecular biology
-0.38
(0.10)
-0.79***
(0.11)
S-Share Business, management & accounting
-0.26
(0.08)
-0.43***
(0.11)
S-Share chemical engineer
-0.35**
(0.13)
S-share chemistry
0.43***
(0.18)
S-Share Earth & planetary sciences
-0.30*
(0.11)
S-Share Materials science
-0.83***
(0.22)
S-Share Nursing
-0.46***
(0.11)
S-Share Physics & astronomy
0.43**
(0.19)
R-Squared 0.77 0.85*** 0.87*** NOTE: Each column reports the beta coefficients from stepwise multiple regression models along with its standard errors
reported in parentheses. The multivariate association R-squared for each model is presented at the bottom of the table.
* Correlation is significant at p < 0.05; ** significant at p < 0.01; *** significant at p < 0.001
The scientific areas whose relative productivity correlated with perceived corruption were
those identified for rich countries in a worldwide study [36]. Interestingly, the share of publications
in neuroscience correlated with corruption perception even after filtering out the effect of GDP per
capita. This result might be explained by the fact that countries like Iceland and Hungary showed a
high S-share in neuroscience despite having relatively low wealth but have lower corruption
perception than what is expected for their GDP per capita (See Figure 3). The relative productivity
in business sciences did not correlate with perceived corruption or wealth (Figure 3).
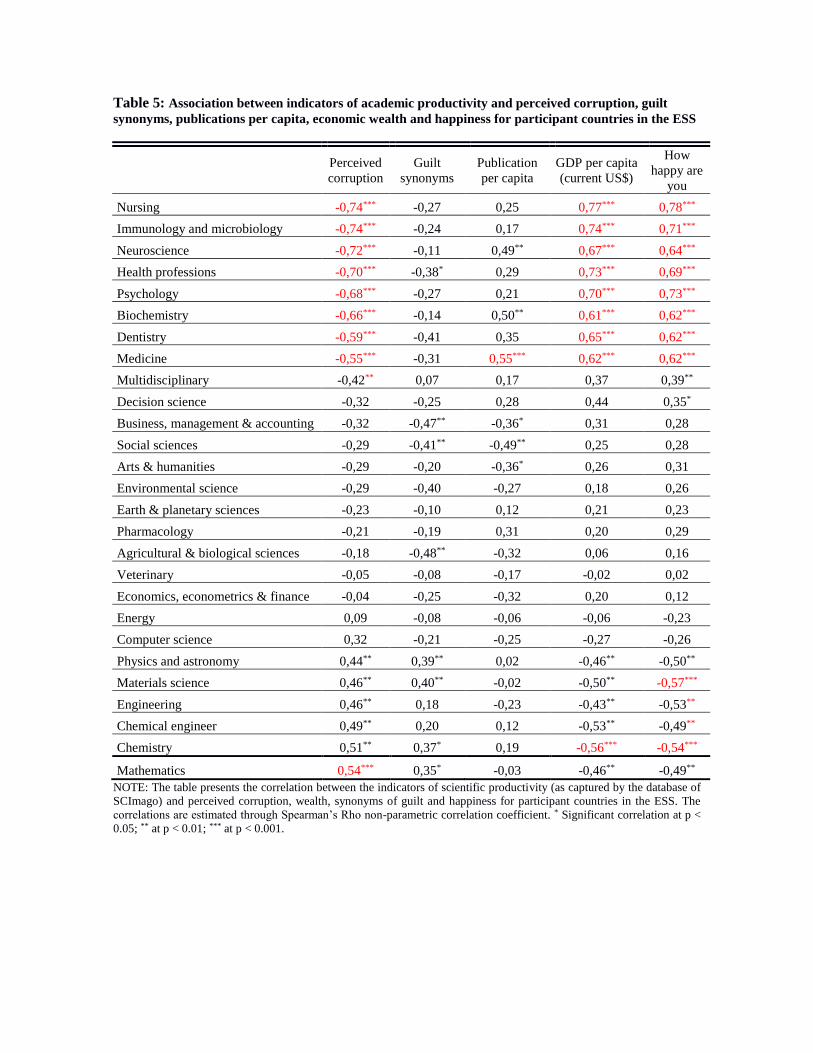
Table 5: Association between indicators of academic productivity and perceived corruption, guilt
synonyms, publications per capita, economic wealth and happiness for participant countries in the ESS
Perceived
corruption
Guilt
synonyms
Publication
per capita
GDP per capita
(current US$)
How
happy are
you
Nursing -0,74*** -0,27 0,25 0,77*** 0,78***
Immunology and microbiology -0,74*** -0,24 0,17 0,74*** 0,71***
Neuroscience -0,72*** -0,11 0,49** 0,67*** 0,64***
Health professions -0,70*** -0,38* 0,29 0,73*** 0,69***
Psychology -0,68*** -0,27 0,21 0,70*** 0,73***
Biochemistry -0,66*** -0,14 0,50** 0,61*** 0,62***
Dentistry -0,59*** -0,41 0,35 0,65*** 0,62***
Medicine -0,55*** -0,31 0,55*** 0,62*** 0,62***
Multidisciplinary -0,42** 0,07 0,17 0,37 0,39**
Decision science -0,32 -0,25 0,28 0,44 0,35*
Business, management & accounting -0,32 -0,47** -0,36* 0,31 0,28
Social sciences -0,29 -0,41** -0,49** 0,25 0,28
Arts & humanities -0,29 -0,20 -0,36* 0,26 0,31
Environmental science -0,29 -0,40 -0,27 0,18 0,26
Earth & planetary sciences -0,23 -0,10 0,12 0,21 0,23
Pharmacology -0,21 -0,19 0,31 0,20 0,29
Agricultural & biological sciences -0,18 -0,48** -0,32 0,06 0,16
Veterinary -0,05 -0,08 -0,17 -0,02 0,02
Economics, econometrics & finance -0,04 -0,25 -0,32 0,20 0,12
Energy 0,09 -0,08 -0,06 -0,06 -0,23
Computer science 0,32 -0,21 -0,25 -0,27 -0,26
Physics and astronomy 0,44** 0,39** 0,02 -0,46** -0,50**
Materials science 0,46** 0,40** -0,02 -0,50** -0,57***
Engineering 0,46** 0,18 -0,23 -0,43** -0,53**
Chemical engineer 0,49** 0,20 0,12 -0,53** -0,49**
Chemistry 0,51** 0,37* 0,19 -0,56*** -0,54***
Mathematics 0,54*** 0,35* -0,03 -0,46** -0,49** NOTE: The table presents the correlation between the indicators of scientific productivity (as captured by the database of
SCImago) and perceived corruption, wealth, synonyms of guilt and happiness for participant countries in the ESS. The
correlations are estimated through Spearman’s Rho non-parametric correlation coefficient. * Significant correlation at p <
0.05; ** at p < 0.01; *** at p < 0.001.
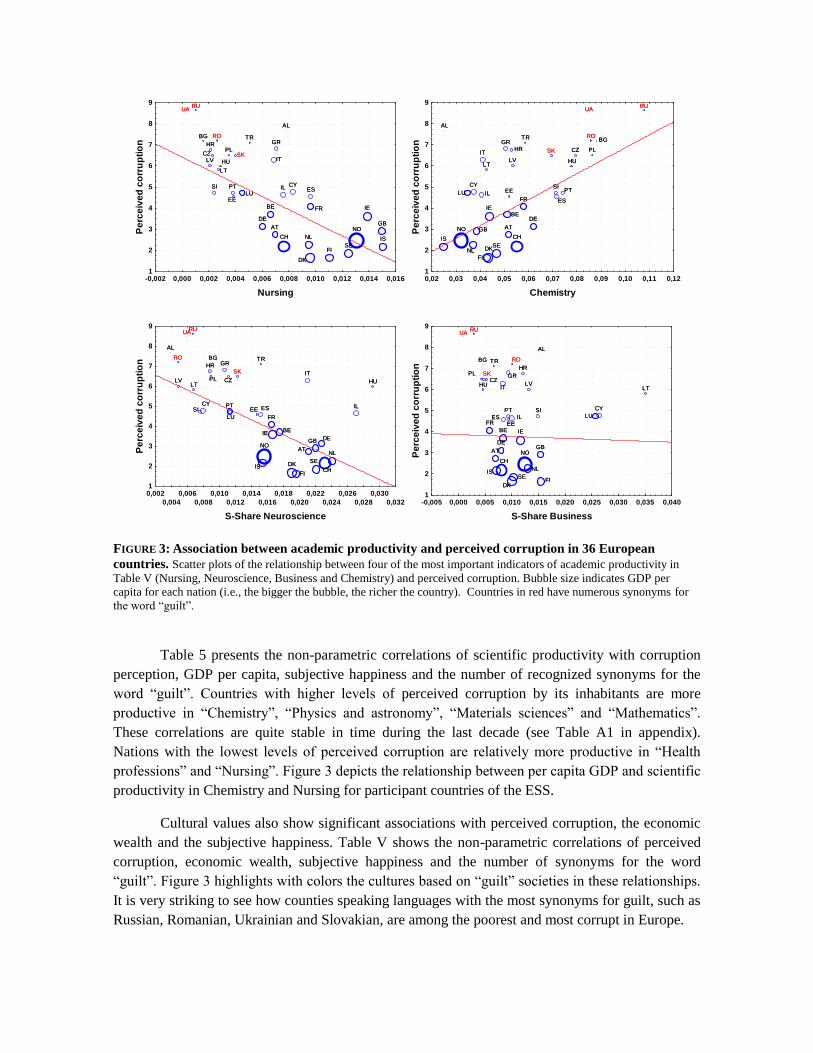
FIGURE 3: Association between academic productivity and perceived corruption in 36 European
countries. Scatter plots of the relationship between four of the most important indicators of academic productivity in
Table V (Nursing, Neuroscience, Business and Chemistry) and perceived corruption. Bubble size indicates GDP per
capita for each nation (i.e., the bigger the bubble, the richer the country). Countries in red have numerous synonyms for
the word “guilt”.
Table 5 presents the non-parametric correlations of scientific productivity with corruption
perception, GDP per capita, subjective happiness and the number of recognized synonyms for the
word “guilt”. Countries with higher levels of perceived corruption by its inhabitants are more
productive in “Chemistry”, “Physics and astronomy”, “Materials sciences” and “Mathematics”.
These correlations are quite stable in time during the last decade (see Table A1 in appendix).
Nations with the lowest levels of perceived corruption are relatively more productive in “Health
professions” and “Nursing”. Figure 3 depicts the relationship between per capita GDP and scientific
productivity in Chemistry and Nursing for participant countries of the ESS.
Cultural values also show significant associations with perceived corruption, the economic
wealth and the subjective happiness. Table V shows the non-parametric correlations of perceived
corruption, economic wealth, subjective happiness and the number of synonyms for the word
“guilt”. Figure 3 highlights with colors the cultures based on “guilt” societies in these relationships.
It is very striking to see how counties speaking languages with the most synonyms for guilt, such as
Russian, Romanian, Ukrainian and Slovakian, are among the poorest and most corrupt in Europe.
UARU
BG
LV
HR
CZ
SI
RO
LT
HU
PL
PT
EE
SK
LU
TR
DE
BE
IT
AT
GR
IL
CH
AL
CY
NL
FR
DK
ES
FISE
NO
IE
GB
IS
-0,002 0,000 0,002 0,004 0,006 0,008 0,010 0,012 0,014 0,016
Nursing
1
2
3
4
5
6
7
8
9
Pe
rce
ive
d c
orr
up
tio
n
UARU
BG
LV
HR
CZ
SI
RO
LT
HU
PL
PT
EE
SK
LU
TR
DE
BE
IT
AT
GR
IL
CH
AL
CY
NL
FR
DK
ES
FISE
NO
IE
GB
IS IS
AL
NO
LU
NL
CY
GB
IL
IT
LT
FI
DK
IE
SE
GR
BE
AT
EE
HR
LV
CH
FR
TR
DE
SK
SI
ES
PT
HU
CZ
UA
RO
PL
BG
RU
0,02 0,03 0,04 0,05 0,06 0,07 0,08 0,09 0,10 0,11 0,12
Chemistry
1
2
3
4
5
6
7
8
9
Pe
rce
ive
d c
orr
up
tio
n
IS
AL
NO
LU
NL
CY
GB
IL
IT
LT
FI
DK
IE
SE
GR
BE
AT
EE
HR
LV
CH
FR
TR
DE
SK
SI
ES
PT
HU
CZ
UA
RO
PL
BG
RU
AL
RO
LV
UARU
LT
SICY
HR
PL
BGGR
CZ
PT
LU
SK
EE
TR
ES
IS
NO
FR
IEBE
DK
FI
IT
AT
GB
SE
DE
CH
NL
IL
HU
0,002
0,004
0,006
0,008
0,010
0,012
0,014
0,016
0,018
0,020
0,022
0,024
0,026
0,028
0,030
0,032
S-Share Neuroscience
1
2
3
4
5
6
7
8
9
Pe
rce
ive
d c
orr
up
tio
n
AL
RO
LV
UARU
LT
SICY
HR
PL
BGGR
CZ
PT
LU
SK
EE
TR
ES
IS
NO
FR
IEBE
DK
FI
IT
AT
GB
SE
DE
CH
NL
IL
HU
UARU
PL
BG
HU
SKCZ
FR
TR
AT
IS
DE
CH
IT
BE
ES
GR
PT
EEIL
RO
DK
SE
IE
HR
NO
NL
LV
SI
GB
FI
AL
LU
CY
LT
-0,005 0,000 0,005 0,010 0,015 0,020 0,025 0,030 0,035 0,040
S-Share Business
1
2
3
4
5
6
7
8
9
Pe
rce
ive
d c
orr
up
tio
n
UARU
PL
BG
HU
SKCZ
FR
TR
AT
IS
DE
CH
IT
BE
ES
GR
PT
EEIL
RO
DK
SE
IE
HR
NO
NL
LV
SI
GB
FI
AL
LU
CY
LT

DISCUSSION
Our analysis confirmed that most of the covariates to corruption that had been reported in
the literature as a result of comparisons between the countries of the world, are also acting among
the European countries, except that with taxations, which our data did not captured. This study
revealed the existence of a complex web of relationships between the personal values of individuals
in different societies with perceived corruption, subjective happiness, economic wealth and the
linguistic importance assigned to the concept of guilt. The relationship between these variables is
very strong and intimate and difficult to untangle statistically. We have no way to determine the
causal link among these variables through their statistical relationships. We have indications,
however, that wealth changes faster than corruption perception. Countries like Norway and Russia
increased their wealth in the last decades thanks to oil-exports. Their level of perceived corruption,
however, has not decreased correspondingly. Historic data from ESS also show very stable
outcomes of European surveys on individual values (see appendix). Clearly enough, perceived
corruption and the economic performance of a nation are part of a syndrome that includes
individual values of economic agents and the way labor in knowledge production is divided in a
country. The most likely causal relationship between these variables is mutual reinforcement, where
for example corrupt countries are poor, enhance values that are compatible with this situation,
fomenting corruption further, and thus have undeveloped scientific and economic ecosystems.
The role of rational knowledge production, best estimated through the way scientific
productivity is organized in a country, is a key predictor of economic wealth. The structure of
knowledge, however, changes as the scientific system becomes more mature. Countries with
incipient scientific establishments vary greatly in the emphasis they place in different areas of
knowledge. Middle income countries that develop relatively stronger basic sciences produce faster
economic growth compared to countries that do not [50]. In Europe, however, all countries have
rather old scientific establishments and have fluent contact among them. Joining the insight gained
in this study with previous ones, we can postulate that at least three different evolutionary phases in
the relationship of wealth and the structure of scientific system of a country exist. i) Very poor
societies have no or very incipient scientific research activities. ii) Societies eventually start to
develop a scientific research community. Those nations with incipient scientific systems that give
more emphasis to basic sciences are more successful than countries putting their research efforts
elsewhere. iii) Countries with well-established scientific communities, start developing science by
focusing on novel and more diverse aspects, diluting the relative research efforts made in basic
sciences (as shown here). The last two of these phases can be identified in Figure 4.

FIGURE 4: Association between Publications per capita and the share of publications in the area of
chemistry in a large selection of countries of the world. This scatterplot depicts the relationship between the
share of publications in chemistry in countries with different overall rates of scientific productivity as measured by
publications per capita in a large selection of countries in the world. Only European countries are indicated with their two
letter abbreviation.
This explains why corrupt countries in Europe emphasize more basic sciences than less
corrupt and wealthier nations. These countries are also the ones with the lowest scientific
development in Europe. This interesting correlation is very likely related to the fact that in more
developed countries scientific rationality is more dominant, leading to an increasing overall
productivity and increased well-being of its inhabitants, through evidence-based public policies
[54]. In Europe, more scientifically and more developed nations like Norway, Denmark or Finland
have higher scientific productivity in health-related disciplines compared to Russia, Romania,
Slovakia and Ukraine. This difference in the division of labor in the production of knowledge is a
reflection of differences in overall scientific development. It also shows that for prosperous
countries it is important to maintain and develop institutions with scientific research purposes that
eventually benefit society by providing the scientific base that is required for creating useful
technology in business activities [55].
If one accepts that prevalent social values affect the quality of public institutions, its norms
and prosecutors [52], then it is easier to understand the occurrence of corrupt behaviors like
nepotism and bribes that are clearly linked with the importance of being rich, or being loyal to
friends, that we observed strongly associated with corruption perception, economic wealth and
subjective happiness. Most of the human values assessed in the ESS do not differentiate statistically
“corrupt” and “non-corrupt” countries. Only those related with Achievement and Security are
clearly correlated with a lack of corruption. This is in accordance with previous results cited above
that suggested that bureaucracies where corruption is higher are less likely to provide a strong
bulwark against infringements on property rights, producing distortions in investment and trade that
may reduce the quantity and efficiency of capital investment and foreign technology introduced into
the country [56]. This finding is also related with recent observations regarding the role of trust of
citizens in public institutions; more specifically that corruption can inhibit economic development
by eroding confidence in public institutions.
ATBE
BU
CZ
DK
EE
FI
FR
DE
GR
HU
IL
IE
IS
IT
LV
LT
NLNO
PLPT
RO
RU
SIES
SE
CH
TR
UA
GB
0 100 200 300 400 500
Publications per capita
0,0
0,5
1,0
1,5
2,0
2,5
3,0
S-S
ha
re C
he
mis
try
ATBE
BU
CZ
DK
EE
FI
FR
DE
GR
HU
IL
IE
IS
IT
LV
LT
NLNO
PLPT
RO
RU
SIES
SE
CH
TR
UA
GB
Previous studies found a strong relationship between corruption, culture and language.
Coincidentally, we found that countries with several synonyms for the word “guilt” (five or more)
also proved to be the ones with higher levels of perceived corruption, while nations with only one
synonym for this word were among the cleanest states. This result might be interpreted as evidence
that support the relationship between language and future-oriented economic behaviors that was
recently observed [44]. Future works should be extended to other regions of the world (Latin-
American and/or Asian nations) in order to evaluate the consistency of our results.
Accepting that corruption is part of a socio-cultural-economic phenomenon forces us to
recognize that optimal policies to foment economic growth should be different in poor, corrupt
countries with low scientific-technological development than in countries with highly developed
industries that have shown their own ability to produce wealth. Our findings corroborate that this
difference includes individual, social and cultural values. Thus, policies that do not take into
account these differences are doomed to fail. Experimentation at small scales, addressing values and
attitudes, together with the implementation of economic policies, should help by improving the
success rate of economic policies. This recommendation seems to be especially pertinent for
international efforts in triggering economic growth that have failed spectacularly so far, in Haiti,
Afghanistan, Iraq and other countries; as well as for nations like Ukraine where such efforts are
being initiated.
The most conspicuous finding, however, is that that economic prosperity is the derived state
of a nation, whereas corruption and poverty is the original state. Economic evolution in human
history went from poverty to prosperity [57], although examples of countries that went through the
inverse route also exist, such as the recent history of Zimbabwe and Venezuela [58]. This general
trend can be deduced from the fact that the strongest correlations between prevailing individual
values and corruption is a negative one for value dimensions related to personal achievements and
security. Positive correlations between individual values and corruption were very feeble. That is,
countries that educate its citizens to value security and personal achievements are more prone to
assemble complex interwoven societies with strong institutions. We propose therefore to define a
syndrome of prosperity, rather than one for corruption, and to consider corruption as the primitive
state in social evolution, prevalent in societies that value more family ties than abstract law.
Evolutionary talking, the emergence of prosperous modern technological societies was based on
their rational knowledge and law. Cultures have to evolve in order to allow the emergence of this
new society, although cultures change slower than economies [35]. Despite the evident triviality of
this insight, economists have focused more in understanding the prevalence of corruption in society
rather than focusing on its absence (see the large body of literature mentioned in the introduction).
Finely describing the prosperity syndrome might help visionaries in different poor nations to find an
appropriate path, adapted to its culture and possibilities, to eventually achieve prosperity.
REFERENCES
1. Olken B, Pande R. Corruption in Developing Countries. Annu Rev Econom. 2012;4:
479–509. doi:10.1146/annurev-economics-080511-110917

2. Rose-Ackerman S. Corruption: A study in political economy. Academic Press; 2013.
3. Lambsdorff JG. The institutional economics of corruption and reform: theory,
evidence and policy. Cambridge University Press; 2007.
4. Tanzi H. Corruption around the world: Causes, consequences, scope, and cures. Staff
Pap Monet Fund. 1998; 559–594.
5. Svensson J. Eight Questions about Corruption. J Econ Perspect. 2005;19: 19–42.
doi:10.1257/089533005774357860
6. Donchev D, Ujhelyi G. What do corruption indices measure? Econ Polit. 2014;26:
309 – 331.
7. Mauro P. The Effects of Corruption on Growth, Investment, and Government
Expenditure: A Cross-Country Analysis. In: Elliot KA, editor. Corruption in the
global economy. Washington, DC: Institute for International Economics; 1997. pp.
83–107.
8. Wei S-J. How taxing is corruption on international investors? Rev Econ Stat.
2000;82: 1–11.
9. Haque ME, Kneller R. The Role of Public Investment and Growth: The Role of
Corruption [Internet]. Manchester, UK; 2008. Report No.: 098. Available:
http://www.socialsciences.manchester.ac.uk/cgbcr/discussionpape
10. Tanzi V, Davoodi H. Corruption, Public Investment, and Growth. IMF. 1997.
11. Tarhan S. Public investment and corruption in an endogeneous growth model.
Munich Personal RePEc Archive (MPRA). 2008.
12. Egger P, Winner H. How Corruption Influences Foreign Direct Investment: A Panel
Data Study. Econ Dev Cult Change. 2006;54: 459–486. doi:10.1086/497010
13. Busse M, Hefeker C. Political risk, institutions and foreign direct investment. Eur J
Polit Econ. 2007;23: 397–415.
14. Habib M, Zurawicki L. Country-level investments and the effect of corruption -

some empirical evidence. Int Bus Rev. 2001;10: 687–700. doi:10.1016/S0969-
5931(01)00038-5
15. Egger P, Winner H. Evidence on corruption as an incentive for foreign direct
investment. Eur J Polit Econ. 2005;21: 932–952.
16. Cuervo-Cazura A. Who cares about corruption? J Int Bus Stud. 2006;37: 807–822.
17. Brada JC, Drabek Z, Perez MF. The Effect of Home-country and Host-country
Corruption on Foreign Direct Investment. Rev Dev Econ. 2012;16: 640–663.
doi:10.1111/rode.12009
18. Mauro P. Corruption and Growth. Q J Econ. 1995;110: 681–712.
19. Podobnik B, Shao J, Njavro D, Ivanov PC, Stanley HE. Influence of corruption on
economic growth rate and foreign investments. Eur Phys J B-Condensed Matter
Complex Syst. 2008;63: 547–550.
20. Podobnik B, Baaquie BE, Bishop S, Njavro D, Li B. Growth versus government
management improvement during economic downturn. Sci Rep. 2013;3: 1612.
21. Mo PH. Corruption and economic growth. J Comp Econ. 2001;29: 66–79.
22. Gupta S, Davoodi HR, Alonso-Terme R. Does Corruption Affect Income Inequality
and Poverty? Econ Gov. 2002;3: 23–45. doi:10.1007/s101010100039
23. Horsewood N, Voicu AM. Does corruption hinder trade for the new EU members?
Economics. 2012;6. doi:10.5018/economics-ejournal.ja.2012-47
24. de Jong E, Bogmans C. Does corruption discourage international trade? Eur J Polit
Econ. Elsevier B.V.; 2011;27: 385–398. doi:10.1016/j.ejpoleco.2010.11.005
25. Dutt P, Traca D. Corruption and Bilateral Trade Flows: Extortion or Evasion? Rev
Econ Stat. 2010;92: 843–860.
26. Goel RK, Korhonen I. Exports and cross-national corruption: A disaggregated
examination. Econ Syst. 2011;35: 109–124.

27. Thede S, Gustafson N-A. The multifaceted impact of corruption on international
trade. World Econ. 2012;35: 651–666.
28. Getz KA, Volkema RJ. Culture, perceived corruption, and economics: A model of
predictors and outcomes. Bus Soc. 2001;40: 7–30.
29. De Sardan JP. A moral economy of corruption in Africa? J Mod Afr Stud. 1999;37:
25–52.
30. Paldam M. The cross-country pattern of corruption: economics, culture and the
seesaw dynamics. Eur J Polit Econ. 2002;18: 215–240.
31. Hall R, Jones CI. Why do some countries produce so much more output per worker
than others? Q J Econ. 1999;114: 83–116.
32. Welsch H. Corruption, growth, and the environment: a cross-country analysis.
Environ Dev Econ. 2004;9: 663 – 693. doi:10.1017/S1355770X04001500
33. Welsch H. The welfare costs of corruption. Appl Econ. 2008;40: 1839–1849.
doi:10.1080/00036840600905225
34. Husted BW, Instituto Tecnologico y de Estudios Superiores de Monterrey. Wealth,
Culture, and Corruption. J Int Bus Stud. 1999;30: 339–359.
35. Licht AN, Goldschmidt C, Schwartz SH. Culture rules: The foundations of the rule
of law and other norms of governance. J Comp Econ. 2007;35: 659–688.
doi:10.1016/j.jce.2007.09.001
36. de Sousa L. “I Don”t Bribe, I Just Pull Strings’: Assessing the Fluidity of Social
Representations of Corruption in Portuguese Society. Perspect Eur Polit Soc. 2008;9:
8–23. doi:10.1080/15705850701825402
37. Grießhaber N, Geys B. Civic engagement and corruption in 20 European
democracies. 2011. Report No.: SP II 2011-103.
38. Maesschalck J, Van de Walle S. Policy Failure and Corruption in Belgium: Is
Federalism to Blame? West Eur Polit. 2006;29: 999–1017.

39. Hakhverdian C, Mayne Q, Trust I, Approach MI, Est AM. Institutional Trust ,
Education , and Corruption : A Micro-Macro Interactive Approach The Harvard
community has made this article openly available . Please share how this access
benefits you . Your story matters . 2014;
40. Johnston M. Syndromes of corruption: wealth, power, and democracy. Cambridge:
University Press; 2005.
41. Abed GT, Davoodi HR. Corruption, structural reforms, and economic performance
in the transition economies [Internet]. 2000. Available:
http://papers.ssrn.com/sol3/papers.cfm?abstract_id=879906
42. Fosu AK, O’Connell SA. Explaining African economic growth: the role of anti-
growth syndromes. Annual World Bank Conference on Development Economics
2006: Growth and Integration. 2006. pp. 31–66.
43. Diener E, Diener M, Diener C. Factors predicting the subjective well-being of
nations. In: Diener E, editor. Culture and Well-Being: The Collected Works of Ed
Diener. Springer; 2009. pp. 43–70.
44. Chen MK. The effect of language on economic behavior: Evidence from savings
rates, health behaviors, and retirement assets. Am Econ Rev. 2013;103: 690–731.
doi:10.1257/aer.103.2.690
45. Jaffe K, Flórez A, Manzanares M, Jaffe R, Gomes CM, Rodríguez D, et al. On the
bioeconomics of shame and guilt. J Bioeconomics. 2014; 1–13. doi:10.1007/s10818-
014-9189-5
46. Cooter R, Ulen T. Law and economics [Internet]. New York: Addison Wesley; 2003.
Available: www.cooter-ulen.com
47. Clausen B, Kraay A, Nyiri Z. Corruption and Confidence in Public Institutions:
Evidence from a Global Survey. World Bank Econ Rev. 2011;25: 212–249.
doi:10.1093/wber/lhr018
48. Jaffe K. Science, religion and economic development. Interciencia. 2005;30: 370–
373.
49. Hidalgo CA, Hausmann R. The building blocks of economic complexity. Proc Natl
Acad Sci. 2009;106: 10570–10575.

50. Jaffe K, Rios A, Flórez A. Statistics shows that economic prosperity needs both high
scientific productivity and complex technological knowledge, but in different ways.
Interciencia. 2013;38: 150–156.
51. Jaffe K, Caicedo M, Manzanares M, Gil M, Rios A, Florez A, et al. Productivity in
physical and chemical science predicts the future economic growth of developing
countries better than other popular indices. PLoS One. 2013;8: e66239.
doi:10.1371/journal.pone.0066239
52. Bilsky W, Janik M, Schwartz SH. The structural organization of human values-
evidence from three rounds of the European Social Survey (ESS). J Cross Cult
Psychol. 2010;42: 759–776. doi:10.1177/0022022110362757
53. Kaufmann D, Kraay A, Mastruzzi M. The Worldwide Governance Indicators
Methodology and Analytical Issues [Internet]. 2010. Report No.: 5430. Available:
http://papers.ssrn.com/sol3/papers.cfm?abstract_id=1682130
54. Brownson RC, Fielding JE, Maylahn CM. Evidence-based public health: a
fundamental concept for public health practice. Annu Rev Public Health. 2009;30:
175–201. doi:10.1146/annurev.pu.30.031709.100001
55. Dasgupta P, David PA. Toward a new economics of science. Res Policy. 1994;23:
487–521.
56. Knack S, Keefer P. Institutions and economic performance: Cross-country tests
using alternative institutional measures. Econ Polit. 1995;7: 207–227.
57. Jaffe K. The Wealth of Nations: Complexity Science for an Interdisciplinary
Approach. New York: Amazon Books; 2014.
58. Kelly J, Palma PA. The syndrome of economic decline and the quest for change.
Unraveling Represent Democr Venez. 2004; 202–230.

1 Appendix
Table A1: List of participant countries in the six rounds of the ESS
Participating country 2002 2004 2006 2008 2010 2012 Albania (AL) No No No No No Yes Austria (AT) Yes Yes Yes No No No Belgium (BE) Yes Yes Yes Yes Yes Yes Bulgaria (BU) No No Yes Yes Yes Yes Switzerland (CH) Yes Yes Yes Yes Yes Yes Cyprus (CY) No No Yes Yes Yes Yes Czech Republic (CZ) Yes Yes No Yes Yes Yes Germany (DE) Yes Yes Yes Yes Yes Yes Denmark (DK) Yes Yes Yes Yes Yes Yes Estonia (EE) No Yes Yes Yes Yes Yes Spain (ES) Yes Yes Yes Yes Yes Yes Finland (FI) Yes Yes Yes Yes Yes Yes France (FR) Yes Yes Yes Yes Yes Yes Great Britain (GB) Yes Yes Yes Yes Yes Yes Greece (GR) Yes Yes No Yes Yes No Croatia (HR) No No No Yes Yes No Hungary (HU) Yes Yes Yes Yes Yes Yes Ireland (IE) Yes Yes Yes Yes Yes Yes Iceland (IL) Yes No No Yes Yes Yes Israel (IS)* No Yes No No No Yes Italy (IT) Yes No No No No Yes Lithuania (LT) No No No No Yes Yes Luxembourg (LU) Yes Yes No No No No Latvia (LV) No No No Yes No No Netherlands (NL) Yes Yes Yes Yes Yes Yes Norway (NO) Yes Yes Yes Yes Yes Yes Poland (PL) Yes Yes Yes Yes Yes Yes Portugal (PT) Yes Yes Yes Yes Yes Yes Romania (RO) No No No Yes No No Russia (RU) No No Yes Yes Yes Yes Sweden (SE) Yes Yes Yes Yes Yes Yes Slovenia (SI) Yes Yes Yes Yes Yes Yes Slovakia (SK) No Yes Yes Yes Yes Yes Turkey (TR) No Yes No Yes No No Ukraine (UA) No Yes Yes Yes Yes Yes Kosovo (XK) No No No No No Yes
Participant countries 22 25 23 29 27 29 * Israel was the only Non-European country included in the European Social Survey

Table A2: Statistical non-parametric correlations between GDP per capita and perceived corruption in
participant countries of ESS
2002 2004 2006 2008 2010 2012
Spearman
Correlation
-0.830** -0.872** -0.905** -0.923** -0.893** -0.902**
* Correlation is significant at p < 0.05; ** significant at p < 0.01; *** significant at p < 0.001
Table A3: Correlations between scientific productivity and perceived corruption, wealth and subjective
happiness in participant countries of the European Social Survey
S-Share Year Perceived
corruption
Per capita
GDP
Subjective
happiness
Chemistry
2002 -0.80** -0.87** -0.78** 2004 -0.71** -0.82** -0.71** 2006 -0.93** -0.85** -0.86** 2008 -0.77** -0.69** -0.66** 2010 -0.68* -0.63* -0.56* 2012 -0.55* -0.55* -0.58*
Materials Science
2002 -0.59* -0.71** -0.61** 2004 -0.67** -0.68** -0.73** 2006 -0.85** -0.78** -0.80** 2008 -0.67* -0.61* -0.61* 2010 -0.60* -0.60* -0.63* 2012 -0.50* -0.44* -0.44*
Mathematics
2002 -0.72** -0.81** -0.79** 2004 -0.55* -0.55* -0.52* 2006 -0.79** -0.67** -0.71** 2008 -0.62* -0.48* -0.44* 2010 -0.67** -0.53* -0.52* 2012 -0.51* -0.43* -0.37*
Physics and Astronomy
2002 -0.65** -0.78** -0.71** 2004 -0.60* -0.60* -0.71** 2006 -0.84** -0.70** -0.76** 2008 -0.66* -0.53* -0.55* 2010 -0.66* -0.59* -0.65** 2012 -0.58* -0.46* -0.53*
Health Professions
2002 0.68** 0.71** 0.65** 2004 0.56* 0.62* 0.58* 2006 0.89** 0.87** 0.87** 2008 0.77** 0.74** 0.66** 2010 0.84** 0.88** 0.78** 2012 0.78** 0.76** 0.76**
Nursing
2002 0.77** 0.81** 0.75** 2004 0.84** 0.85** 0.80** 2006 0.80** 0.81** 0.79** 2008 0.80** 0.87** 0.74** 2010 0.73** 0.82** 0.69**

2012 0.73** 0.77** 0.75** * Correlation is significant at p < 0.05; ** significant at p < 0.01; *** significant at p < 0.001

Table A4. The ten basic values in the ESS survey
VALUE and central goal Items that measure each value with their ESS labels
POWER Social status and prestige, control or dominance over people and resources.
1- It is important to him to be rich. He wants to have a lot of money and expensive things.
2- It is important to him to get respect from others. He wants people to do what he says.
ACHIEVEMENT Personal success through demonstrating competence according to social standards.
3- It is important to him to show his abilities. He wants people to admire what he does.
4- Being very successful is important to him. He hopes people will recognize his achievements.
HEDONISM Pleasure and sensuous gratification for oneself.
5- He seeks every chance he can to have fun. It is important to him to do things that give him pleasure.
6- Having a good time is important to him. He likes to "spoil" himself.
STIMULATION Excitement, novelty, and
challenge in life.
7- He likes surprises and is always looking for new things to do. He thinks it is important to do lots of different things in life.
8- He looks for adventures and likes to take risks. He wants to have an exciting life.
SELF DIRECTION Independent thought and action choosing, creating, exploring.
9- Thinking up new ideas and being creative is important to him. He likes to do things in his own original way.
10- It is important to him to make his own decisions about what he does. He likes to be free and not depend on others.
UNIVERSALISM Understanding, appreciation, tolerance and protection for the welfare of all people and for nature.
11- He thinks it is important that every person in the world should be treated equally. He believes everyone should have equal opportunities in life.
12- It is important to him to listen to people who are different from
him. Even when he disagrees with them, he still wants to understand them.
13- He strongly believes that people should care for nature. Looking after the environment is important to him.
BENEVOLENCE Preservation and enhancement of the welfare
of people with whom one is in frequent personal contact.
14- It is very important to him to help the people around him. He wants to care for their well-being.
15- It is important to him to be loyal to his friends. He wants to devote himself to people close to him.
TRADITION Respect, commitment and acceptance of the customs and ideas that one's culture or religion impose on the
individual.
16- It is important to him to be humble and modest. He tries not to draw attention to himself.
17- Tradition is important to him. He tries to follow the custom handed down by his religion or his family.
CONFORMITY Restraint of actions, inclinations, and impulses likely to upset or harm others and violate social expectations or norms.
18- It is important to him always to behave properly. He wants to avoid doing anything people would say is wrong.
19- He believes that people should do what they are told. He thinks people should follow rules at all times, even when no-one is watching.
SECURITY Safety, harmony and stability of society, of relationships, and of self.
20- It is important to him to live in secure surroundings. He avoids anything that might endanger his safety.
21- It is important to him that the government ensures his safety against all threats. He wants the state to be strong so it can defend its citizens.


![1 oSylkbal esa vkidk Lokxr gSA oSylkbal esa gekjk fe”ku gS& Spread Health Wealth and Happiness lcds thou esa vPNh lsgr] cf](https://static.fdocuments.ec/doc/165x107/5665b4941a28abb57c925c57/1-osylkbal-esa-vkidk-lokxr-gsa-osylkbal-esa-gekjk-feku-gs-spread-health.jpg)