
Chapter 3.3 Different patterns of cortical gray matter ... · MR preprocessing and analysis To...
20
114 Chapter 3.3 Different patterns of cortical gray matter loss in behavioral variant FTD and AD Christiane Möller MSc 1* , Anne Hafkemeijer MSc 2-4 , Yolande A L Pijnenburg MD PhD 1 , Serge A R B Rombouts PhD 2-4 , Jeroen van der Grond PhD 3 , Elise Dopper 1,3,5,6 , John van Swieten MD PhD 5,6 , Adriaan Versteeg 7 , Martijn Steenwijk MSc 7 , Frederik Barkhof MD PhD 7 , Philip Scheltens MD PhD 1 , Hugo Vrenken PhD 7,8 , Wiesje M van der Flier PhD 1,9 1 Alzheimer Center & Department of Neurology, Neuroscience Campus Amsterdam, VU University Medical Center, Amsterdam, the Netherlands, 2 Institute of Psychology, Leiden University, Leiden, the Netherlands, 3 Department of Radiology, Leiden University Medical Center, Leiden, the Netherlands, 4 Leiden Institute for Brain and Cognition, Leiden University, Leiden, the Netherlands, 5 Department of Clinical Genetics, Neuroscience Campus Amsterdam, VU University Medical Center, Amsterdam, the Netherlands, 6 Department of Neurology, Erasmus Medical Center, Rotterdam, the Netherlands, 7 Department of Radiology & Nuclear Medicine, 8 Department of Physics & Medical Technology, 9 Department of Epidemiology & Biostatistics, Neuroscience Campus Amsterdam, VU University Medical Center, Amsterdam, the Netherlands. Under review
Transcript of Chapter 3.3 Different patterns of cortical gray matter ... · MR preprocessing and analysis To...

114
Chapter 3.3 Different patterns of cortical gray matter loss in behavioral
variant FTD and AD
Christiane Möller MSc1*
, Anne Hafkemeijer MSc2-4
, Yolande A L
Pijnenburg MD PhD1, Serge A R B Rombouts PhD
2-4, Jeroen van der
Grond PhD3, Elise Dopper
1,3,5,6, John van Swieten MD PhD
5,6, Adriaan
Versteeg7, Martijn Steenwijk MSc
7, Frederik Barkhof MD PhD
7, Philip
Scheltens MD PhD1, Hugo Vrenken PhD
7,8, Wiesje M van der Flier
PhD1,9
1Alzheimer Center & Department of Neurology, Neuroscience Campus
Amsterdam, VU University Medical Center, Amsterdam, the
Netherlands, 2
Institute of Psychology, Leiden University, Leiden, the
Netherlands, 3Department of Radiology, Leiden University Medical
Center, Leiden, the Netherlands, 4Leiden Institute for Brain and
Cognition, Leiden University, Leiden, the Netherlands, 5Department of
Clinical Genetics, Neuroscience Campus Amsterdam, VU University
Medical Center, Amsterdam, the Netherlands, 6Department of
Neurology, Erasmus Medical Center, Rotterdam, the Netherlands, 7Department of Radiology & Nuclear Medicine,
8Department of Physics
& Medical Technology, 9Department of Epidemiology & Biostatistics,
Neuroscience Campus Amsterdam, VU University Medical Center,
Amsterdam, the Netherlands.
Under review

115
Abstract
Objectives: The ability to track regional atrophy changes over time may help refine
clinical diagnosis of behavioral variant frontotemporal dementia (bvFTD) and
Alzheimer’s disease (AD). We therefore examined the loss of cortical thickness over
time in AD, bvFTD and controls in a longitudinal study.
Methods: 19 AD, 10 bvFTD patients and 30 control subjects underwent cognitive
assessment and MRI twice with a mean interval of 2±0.4 years. We obtained
thicknesses from left and right frontal, parietal, temporal, occipital, insula, cingulate
lobe, as well as whole-brain thickness with the longitudinal FreeSurfer pipeline. Group
differences in progression of cortical thickness were assessed using 1) MANOVA with
diagnosis as independent variable and symmetrized percentage change in cortical
thickness per lobe and hemisphere as dependent variable; 2) whole-brain vertex-wise
general linear model. Age, sex, center, and disease duration were used as covariates.
Results: The groups did not differ in age, sex, center, level of education, or total
intracranial volume. BvFTD had a longer disease duration compared to AD. Both, AD
and bvFTD showed more cortical thinning per year and showed a steeper decline on
MMSE compared to controls with AD showing decline in memory and language.
Progression of cortical thickness showed comparable results in whole-brain and lobar
measurements: Compared to controls, AD patients progressed over the whole brain
with a clear posterior gradient, whereas bvFTD patients only showed progression in
frontal cortex en in anterior parts of the temporal lobes. Compared to each other, AD
patients showed cortical thinning in the insula, temporal and parietal regions, bvFTD
patients only progressed faster in a small frontal region.
Conclusions: Decrease of thickness was highest in AD and generalized throughout the
whole brain, whereas bvFTD had a more selective loss, predominantly in the frontal
and anterior temporal parts of the brain.
116
Introduction
Alzheimer’s disease (AD) and behavioral variant frontotemporal dementia (bvFTD) are
the two most prevalent early-onset dementias [1]. Patterns of gray matter (GM)
atrophy often overlap between AD and bvFTD. Especially early in the disease when
the typical patterns of AD and bvFTD are not yet visible, discrimination between the
different forms can be challenging.
Cross-sectionally, the anatomical differences between AD and bvFTD have been
studied extensively but less is known about clinical and anatomical evolution over
time. Serial MRI data have been used to quantify rates of cerebral change in AD and
bvFTD separately. Compared to controls, AD showed volume loss in temporal,
parietal and occipital cortices [2,3] and bvFTD showed volume changes in the anterior
cingulate, frontal cortex and insula [4,5]. Rates of atrophy have the potential to be
valuable biomarkers of disease progression, and the results of longitudinal studies
have been used as outcome measure in clinical trials with AD patients [6,7]. Patterns
of atrophy over time, however have only sparsely been compared between bvFTD and
AD. The results of the limited number of studies are not uniform. Some studies found
that FTD patients progressed faster than AD patients, especially in the frontal parts of
the brain [3,8]. Other studies could not support these findings [9-11]. Heterogeneity in
results could be explained by different methodological approaches, as some studies
either used whole brain atrophy only [10,12], a few predefined regions of interest
[3,8,9,11], or included the full clinical spectrum of FTLD [9,10,12].
In this study, we therefore examined the progression over time in cortical thickness in
a group of AD and bvFTD patients compared with controls in a whole brain vertex-
wise fashion and with regions of interest. Furthermore, we explored if cognitive
measurements progress in the same fashion.
Methods
Patients
In this two center study, we included 19 patients with probable AD and 10 patients
with bvFTD and 30 controls with repeated MRI, enrolled at the Alzheimer Center of
the VU University Medical center (VUmc) or the Alzheimer Center of the Erasmus
University Medical Center Rotterdam. All patients underwent a standardized one-day
assessment including medical history, informant-based history, physical and
neurological examination, blood tests, neuropsychological assessment, and MRI of
the brain. Diagnoses were made in a multidisciplinary consensus meeting according to
the core clinical criteria of the National Institute on Aging and the Alzheimer’s
Association workgroup for probable AD [13,14] and according to the clinical diagnostic
criteria of FTD for bvFTD [15]. To minimize center effects, all diagnoses were re-
evaluated in a panel including clinicians from both centers. In addition, we included
cognitively normal controls, who were recruited by advertisement in local
newspapers. Before inclusion in the present study, controls were screened for
memory complaints, family history of dementia, drugs- or alcohol abuse, major
psychiatric disorder, and neurological or cerebrovascular diseases. They underwent an
assessment including medical history, physical examination, neuropsychological
assessment, and MRI of the brain comparable to the work-up of patients.
117
Inclusion criteria for both cohorts were: (1) availability of two T1-weighted 3-
dimensional MRI (3DT1) scans without artifacts performed on the same scanner using
an identical imaging protocol, and (2) age between 50 and 80 years. Subjects were
excluded from the study when the imaging analyzing software failed to process MR
scans (n=6) or segmentation errors occurred which could not be edited manually (n=9)
(details see sections below). Level of education was rated on a seven-point scale [16].
Disease duration was defined as the time between first symptom onset and diagnosis,
as reported by the caregiver of the patient. The local medical ethics committee of
both centers approved the study. All patients gave written informed consent.
Neuropsychological assessment
Patients underwent neuropsychological assessment twice. To assess dementia
severity we used the Mini-Mental State Examination (MMSE). Cognitive functioning
was assessed using a standardized neuropsychological test battery covering five
major domains: memory (immediate recall, recognition and delayed recall of Dutch
version of the Rey Auditory Verbal Learning Test and total score of Visual Association
Test A), language (Visual Association Test picture naming and category fluency
(animals: 1 min)), visuospatial functioning (number location (subtests of Visual Object
and Space Perception Battery (VOSP))), attention (Trail Making Test part A (TMT A),
Digit Span forward, and Letter Digit Substitution Test (LDST)), and executive
functioning (Digit Span backwards, Trail Making Test part B (TMT B), letter fluency,
and Stroop Color-Word card subtask [17]). For a detailed description of
neuropsychological tests see Smits et al. [18]. For each cognitive task, z-scores were
calculated from the raw test scores by the formula z=(x-μ)/σ, where μ is the mean and
σ is the standard deviation of the baseline performance of the control group. The
value z = 0 therefore reflects the average baseline test performance of the healthy
controls in a given domain. For cognitive performances at follow-up, z-scores of
controls and patients were calculated relative to the baseline z-scores of controls.
Scores of TMT A, TMT B, and Stroop color-word card were inverted by computing (-
1)*z-score, because higher scores imply a worse performance. Next, composite z-
scores were calculated for each cognitive domain by averaging z-scores. Composite z-
scores were calculated when at least one neuropsychological task was available in
each cognitive domain.
MR image acquisition and review
All patients underwent two MR scans. Imaging at the VUmc was carried out on a 3T
scanner (Signa HDxt, GE Healthcare, Milwaukee, WI, USA), using an 8-channel head
coil with foam padding to restrict head motion. Patients and controls from the
Erasmus University Medical Center Rotterdam were all scanned at the Leiden
University Medical Center (LUMC). Imaging at LUMC was performed on a 3T scanner
(Achieva, Philips Medical Systems, Best, the Netherlands) using an 8-channel SENSE
head coil. The scan protocol included a whole-brain near-isotropic 3DT1-weighted
sequence for cortical segmentation. At VUmc this was a fast spoiled gradient echo
sequence (FSPGR; repetition time TR 7.8 ms, echo time TE 3 ms, inversion time TI 450
ms, flip angle 12º, 180 sagittal slices, voxel size 0.98x0.98x1 mm, total scan time 4.57
minutes). At LUMC this was a turbo field echo sequence (T1TFE; TR 9.8 ms, TE 4.6 ms,

118
flip angle 8°, 140 transversal slices, voxel size 0.88x0.88x1.2 mm, total scan time 4.57
minutes). In addition, the MRI protocol included a 3D Fluid Attenuated Inversion
Recovery (FLAIR) sequence, dual-echo T2-weighted sequence, and susceptibility
weighted imaging (SWI) which were reviewed for brain pathology other than atrophy
by an experienced radiologist.
MR preprocessing and analysis
To extract thickness estimates, images where automatically processed with the
longitudinal stream [19] in FreeSurfer 5.3 [20,21]. In general, FreeSurfer uses the
3DT1-weighted images to locate the pial and white matter surface of the cortex. The
distance between these surfaces gives the vertex-wise cortical thickness of cortical
areas (i.e. the perpendicular thickness at each location).
Specifically for the longitudinal analyses, an unbiased within-subject template space
and image from both time points [22] was created using a robust, inverse consistent
registration [23]. Several processing steps, such as skull stripping, Talairach
transforms, atlas registration as well as spherical surface maps and parcellations for
baseline and follow-up scan were then initialized with common information from the
within-subject template, significantly increasing reliability and statistical power [19].
Areas of cortical thickness were subsequently averaged in the four cortical lobes
(frontal, parietal, temporal, occipital) per hemisphere and time point with
mri_annotation2label [24]. As the insula and the cingulate cortex are important areas
in AD and bvFTD, thickness of cingulate cortex and insula were also extracted using
mri_annotation2label [25-29]. Symmetrized percent change (SPC) of thickness of the
four lobes and cingulate cortex and insula were obtained from the longitudinal two
stage model of FreeSurfer [30]. SPC is the rate with respect to the average thickness
(SPC = rate / avg), where rate is the difference in thickness per time unit, so (rate = (
vol2 - vol1 ) / (time2 - time1)), and avg is the average thickness at the midpoint of linear
fit (avg = 0.5 * (vol1 + vol2)). SPC already takes the time between baseline and follow-up
scan into account. This is a more robust measure than percentage change, because
thickness at time point 1 is more noisy than the average. Also SPC is symmetric, what
is not true for percentage change. All cortical segmentations were manually checked
and re-run after manual editing if errors occurred or excluded if errors could not be
edited.
Next to SPC per lobe, changes in whole brain cortical thickness were analyzed using
FreeSurfer’s vertex-wise general linear modeling testing for a main effect of group on
SPC in cortical thickness, taking follow-up time into account. This involved smoothing
of the cortical thickness maps using a Gaussian kernel with a full width half maximum
of 10-mm. Then the smoothed surface was entered as the dependent in the vertex-
wise GLM after which cluster-wise correction for multiple comparisons was performed
using Monte Carlo Z simulation while thresholding the vertex-wise statistical maps at
P<0.001, with a cluster-level threshold of P<0.05, using 5000 iterations. Mean age of
age at baseline and follow-up, sex and center were used as covariates.
Estimated Total Intracranial Volume (eTIV) as generated by FreeSurfer was used as an
estimate for intracranial volume (ICV) in this study. The eTIV measure from FreeSurfer
is in good agreement with ICV reference segmentation acquired from proton density

119
weighted images [31] and has previously been used in several studies for
normalization.
Statistical analysis
Statistical analyses were performed using SPSS 20.0 (SPSS Inc). ‘Follow-up time’ for
MRI and neuropsychological assessment was defined as the interval in years between
first (baseline) and second (follow-up) examination. Demographics between the
diagnostic groups were compared with ANOVAs, Kruskal-Wallis and Pearson’s χ2
tests
where appropriate.
Neuropsychological test performances between AD, bvFTD and controls at baseline
were compared with MANOVA with diagnosis as independent variable, composite z-
domains as dependent variable and sex, baseline age, level of education and disease
duration as covariates. Subsequently, ANOVA for repeated measures with time and
composite z-domain as within-subjects factors, diagnosis as between-subjects factor,
and mean age of age at baseline and follow-up, sex, level of education, disease
duration, and follow-up time as covariates was conducted. As posthoc test, we
conducted MANOVA with ‘annual rate of cognitive decline’ (rate=(follow-up z-domain
score - baseline z-domain score) / follow-up time) as dependent variable, diagnosis as
independent variable and age, sex, level of education, and disease duration as
covariates, to assess the annual rate of cognitive decline between groups for each z-
domain.
MANOVA with diagnosis as independent variable and lobe per hemisphere as
dependent variable were conducted to determine group differences in baseline
thickness. If main effects were significant, Bonferroni corrected posthoc comparisons
were conducted. Age at baseline, sex, disease duration, and center were used as
covariates.
Subsequently, we conducted MANOVA with diagnosis as independent variable and
SPC in cortical thickness per lobe and hemisphere as dependent variable to determine
group differences in progression of cortical thickness for each lobe. If main effects
were significant, Bonferroni corrected posthoc comparisons were conducted. Mean
age of age at baseline and follow-up, sex, disease duration, and center were used as
covariates. Statistical significance for all analyses was set at p<0.05.
Results
Demographics
Table 1 summarizes the baseline demographics of the diagnostic groups. In general,
patients had lower scores on the MMSE, and a shorter length of follow-up compared
to controls. There were no differences between the groups in age, sex, center, level of
education, or TIV. BvFTD had a longer disease duration compared to AD patients.
AD and bvFTD patients showed a steeper decline on MMSE compared to healthy
controls.
Neuropsychological performance
Table 1 summarizes the neuropsychological performances at baseline. MANOVA
revealed significant main effects of diagnosis for memory (F=61,161, p<0.001),
120
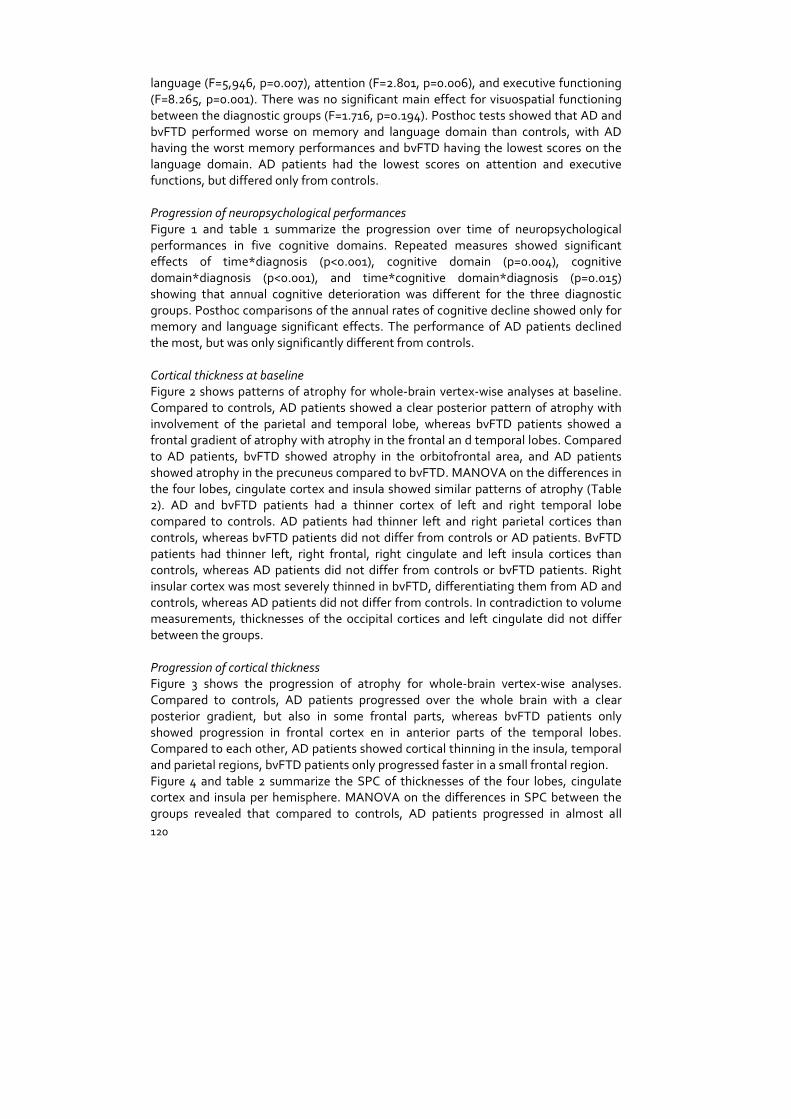
language (F=5,946, p=0.007), attention (F=2.801, p=0.006), and executive functioning
(F=8.265, p=0.001). There was no significant main effect for visuospatial functioning
between the diagnostic groups (F=1.716, p=0.194). Posthoc tests showed that AD and
bvFTD performed worse on memory and language domain than controls, with AD
having the worst memory performances and bvFTD having the lowest scores on the
language domain. AD patients had the lowest scores on attention and executive
functions, but differed only from controls.
Progression of neuropsychological performances
Figure 1 and table 1 summarize the progression over time of neuropsychological
performances in five cognitive domains. Repeated measures showed significant
effects of time*diagnosis (p<0.001), cognitive domain (p=0.004), cognitive
domain*diagnosis (p<0.001), and time*cognitive domain*diagnosis (p=0.015)
showing that annual cognitive deterioration was different for the three diagnostic
groups. Posthoc comparisons of the annual rates of cognitive decline showed only for
memory and language significant effects. The performance of AD patients declined
the most, but was only significantly different from controls.
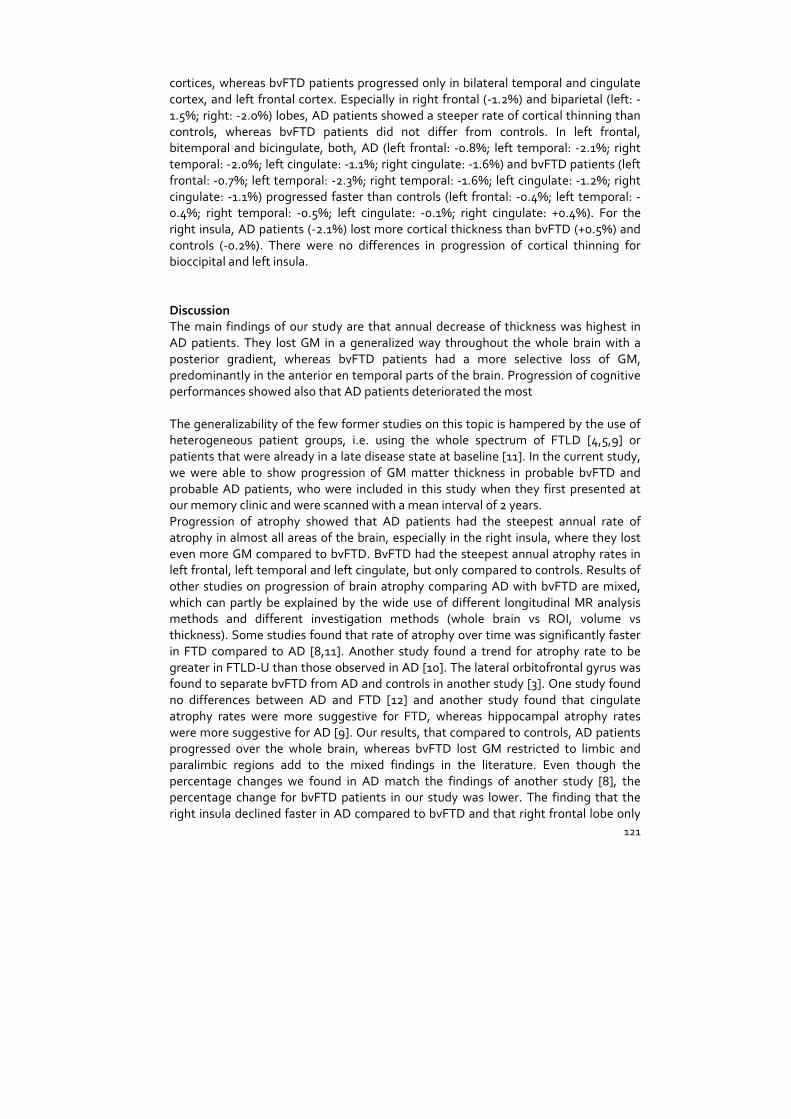
Cortical thickness at baseline
Figure 2 shows patterns of atrophy for whole-brain vertex-wise analyses at baseline.
Compared to controls, AD patients showed a clear posterior pattern of atrophy with
involvement of the parietal and temporal lobe, whereas bvFTD patients showed a
frontal gradient of atrophy with atrophy in the frontal an d temporal lobes. Compared
to AD patients, bvFTD showed atrophy in the orbitofrontal area, and AD patients
showed atrophy in the precuneus compared to bvFTD. MANOVA on the differences in
the four lobes, cingulate cortex and insula showed similar patterns of atrophy (Table
2). AD and bvFTD patients had a thinner cortex of left and right temporal lobe
compared to controls. AD patients had thinner left and right parietal cortices than
controls, whereas bvFTD patients did not differ from controls or AD patients. BvFTD
patients had thinner left, right frontal, right cingulate and left insula cortices than
controls, whereas AD patients did not differ from controls or bvFTD patients. Right
insular cortex was most severely thinned in bvFTD, differentiating them from AD and
controls, whereas AD patients did not differ from controls. In contradiction to volume
measurements, thicknesses of the occipital cortices and left cingulate did not differ
between the groups.
Progression of cortical thickness
Figure 3 shows the progression of atrophy for whole-brain vertex-wise analyses.
Compared to controls, AD patients progressed over the whole brain with a clear
posterior gradient, but also in some frontal parts, whereas bvFTD patients only
showed progression in frontal cortex en in anterior parts of the temporal lobes.
Compared to each other, AD patients showed cortical thinning in the insula, temporal
and parietal regions, bvFTD patients only progressed faster in a small frontal region.
Figure 4 and table 2 summarize the SPC of thicknesses of the four lobes, cingulate
cortex and insula per hemisphere. MANOVA on the differences in SPC between the
groups revealed that compared to controls, AD patients progressed in almost all
121
cortices, whereas bvFTD patients progressed only in bilateral temporal and cingulate
cortex, and left frontal cortex. Especially in right frontal (-1.2%) and biparietal (left: -
1.5%; right: -2.0%) lobes, AD patients showed a steeper rate of cortical thinning than
controls, whereas bvFTD patients did not differ from controls. In left frontal,
bitemporal and bicingulate, both, AD (left frontal: -0.8%; left temporal: -2.1%; right
temporal: -2.0%; left cingulate: -1.1%; right cingulate: -1.6%) and bvFTD patients (left
frontal: -0.7%; left temporal: -2.3%; right temporal: -1.6%; left cingulate: -1.2%; right
cingulate: -1.1%) progressed faster than controls (left frontal: -0.4%; left temporal: -
0.4%; right temporal: -0.5%; left cingulate: -0.1%; right cingulate: +0.4%). For the
right insula, AD patients (-2.1%) lost more cortical thickness than bvFTD (+0.5%) and
controls (-0.2%). There were no differences in progression of cortical thinning for
bioccipital and left insula.
Discussion
The main findings of our study are that annual decrease of thickness was highest in
AD patients. They lost GM in a generalized way throughout the whole brain with a
posterior gradient, whereas bvFTD patients had a more selective loss of GM,
predominantly in the anterior en temporal parts of the brain. Progression of cognitive
performances showed also that AD patients deteriorated the most
The generalizability of the few former studies on this topic is hampered by the use of
heterogeneous patient groups, i.e. using the whole spectrum of FTLD [4,5,9] or
patients that were already in a late disease state at baseline [11]. In the current study,
we were able to show progression of GM matter thickness in probable bvFTD and
probable AD patients, who were included in this study when they first presented at
our memory clinic and were scanned with a mean interval of 2 years.
Progression of atrophy showed that AD patients had the steepest annual rate of
atrophy in almost all areas of the brain, especially in the right insula, where they lost
even more GM compared to bvFTD. BvFTD had the steepest annual atrophy rates in
left frontal, left temporal and left cingulate, but only compared to controls. Results of
other studies on progression of brain atrophy comparing AD with bvFTD are mixed,
which can partly be explained by the wide use of different longitudinal MR analysis
methods and different investigation methods (whole brain vs ROI, volume vs
thickness). Some studies found that rate of atrophy over time was significantly faster
in FTD compared to AD [8,11]. Another study found a trend for atrophy rate to be
greater in FTLD-U than those observed in AD [10]. The lateral orbitofrontal gyrus was
found to separate bvFTD from AD and controls in another study [3]. One study found
no differences between AD and FTD [12] and another study found that cingulate
atrophy rates were more suggestive for FTD, whereas hippocampal atrophy rates
were more suggestive for AD [9]. Our results, that compared to controls, AD patients
progressed over the whole brain, whereas bvFTD lost GM restricted to limbic and
paralimbic regions add to the mixed findings in the literature. Even though the
percentage changes we found in AD match the findings of another study [8], the
percentage change for bvFTD patients in our study was lower. The finding that the
right insula declined faster in AD compared to bvFTD and that right frontal lobe only

122
declined faster in AD compared to controls seem not to fit other research results
either, as these are typical regions involved in bvFTD. A reason for the more
outspoken tissue loss in the right insula and right frontal lobe for AD patients could be
a floor effect for the bvFTD group as they display already most atrophy in this area at
baseline. An explanation for the finding that AD patients showed the steepest annual
rate of atrophy in almost all areas of the brain, could be the underlying pathology,
which may alter the speed of progression in our patients. It had been shown that tau-
positive FTD cases had a longer survival rate than FTLD-ubiquitin immunoreactive-
changes (FTLD-U) [32]. It could be possible that our bvFTD group consists of more
tau-positive cases, which may slow the progression of atrophy. In the same line of
argumentation, as FTD is a very heterogeneous disorder, the slower rate of
progression could be caused by the large amount of variation that has been observed
in this group even though most of our subjects fulfilled criteria for probable bvFTD [4].
Another reason why our AD patients showed higher rates of progression, could be the
fact that the majority of our patients are younger AD cases. Other studies reported
higher rates of atrophy in younger familial AD cases compared to older subjects [33-
35]. Another explanation could be the disease stage of our AD patients. It is possible
that while the rate of brain loss accelerates in the early phases of the disease, it may
slow as the disease progresses. Finally, it is possible that acceleration in the rate of GM
loss was also occuring in the bvFTD group but we have failed to detect it due to
limitations in statistical power.
Decline of cognitive performances followed the anatomical progression and showed
that again AD patients had the steepest decline, especially in in memory and
language. Given the fact that AD patients also showed the most progression in
atrophy these findings support the notion that functional and anatomical changes are
connected to each other, increasing the potential for MRI measures to predict clinical
decline. Other studies, however, found that bvFTD showed the fastest decline over
time [32,36]. A reason why our results do not agree with these findings could be that
the majority of our AD patients are younger AD cases, who decline faster than older
patients [37].
At baseline, we observed a posterior gradient of atrophy only for AD patients, with
parietal and occipital lobes being more atrophied than controls whereas left and right
cingulate gyrus were more suggestive for bvFTD. These results support the posterior
signature for AD and a damaged fronto-cingulate-insula pattern for bvFTD with the
insula making the best discrimination between the dementias. The atrophy patterns
we found for AD and bvFTD at baseline are in accordance with the literature [38-40].
Our measurements showed more atrophy in the frontal cortex for AD patients
compared with controls, which has also been found in other studies, especially in
younger AD patients [29,41]. Against our expectations bvFTD patients exhibited
already on baseline more atrophy in right and left insula and right temporal lobe
compared to AD patients. In turn, AD patients did not show any areas of more atrophy
compared to bvFTD. This is surprising as the baseline scan was conducted at the first
moment patients presented at our memory clinic and were thought to be in the
beginning of the disease process. Indeed, other literature reports that in the beginning
of the disease atrophy patterns of AD and bvFTD often overlap or hardly show any
atrophy [38,42]. One reason for these findings could be that clinical consensus criteria

123
for FTD have changed recently. A requirement for a diagnosis of probable bvFTD is
that GM atrophy supporting a diagnosis of bvFTD has to be visible [15]. As most of our
bvFTD patients have the diagnosis of probable bvFTD (n=8), the detection of atrophy
in insula and temporal lobe is not surprising. Another reason could be the fact that our
bvFTD patients are in a later disease stage than our AD patients (6.6 years vs. 3.3
years). BvFTD patients present with behavioral disturbances, which is not
immediately recognized by caregivers as a sign for dementia. As a consequence,
patients often spend years in the medical circuit before finding their way to a memory
clinic. However, the performances on the neuropsychological examination showed
that bvFTD did not score worse than AD patients. A question, that remains, is the fact
that AD patients perform worse on the cognitive tests even though bvFTD patients
had more atrophy. A possible answer could be that the areas affected in bvFTD
(cingulate, insula and frontal) are less involved in the cognitive processes covered by
our neuropsychological tests but are more involved in the frontal circuits, whose
failure lead to behavioral symptoms often seen in bvFTD [43,44]. The affected
temporal lobe may explain the lower scores on memory and language that are also
seen in AD [45,46].
Among the strengths of this study is the careful use of the longitudinal pipeline of
FreeSurfer, which has been shown to be reliable across sites regardless of MRI system
differences [47]. Moreover, we used a whole-brain vertex-wise and a ROI approach
within FreeSurfer, , which both show comparable results..
A possible limitation of this study is that we did not have pathological data available,
so the possibility of misdiagnosis cannot be excluded. Nevertheless, we used an
extensive standardized work-up and all 19 AD patients fulfilled clinical criteria of
probable AD, 8 bvFTD patients fulfilled the criteria for probable bvFTD and 2 patients
fulfilled criteria for possible bvFTD. Availability of pathological data would also enable
us to study the effects of the different underlying pathology (tau, TDP subtypes, etc.)
on progression of atrophy. This will be an important next step for future
investigations. Another limitation could be the fact that we had a relatively small
group of bvFTD patients, which could hamper the detection of any putative
differences with the other diagnostic groups because of low statistical power.
Nevertheless, as bvFTD is a quite rare diagnosis, the sample size corresponds with
that of other available longitudinal studies to date. Another limitation of this study is,
that we only had one follow-up scan available. With more than one follow-up scan, we
could have investigated if the longitudinal progression of atrophy follow a linear or a
non-linear trend, i.e. if a certain disease group progressed faster in the beginning or in
a later disease stage. Finally, our AD patients consists mainly of younger patients,
which may limit the generalizability of our findings.
To summarize, our study showed that, compared to controls, AD patients have the
steepest decline of GM atrophy and progressed throughout the whole brain, whereas
bvFTD patients showed a more selective decline limited to cingulate, frontal and
temporal regions. Cognitive decline of AD patients was in accordance with the
widespread GM loss.
124
Tables and Figures
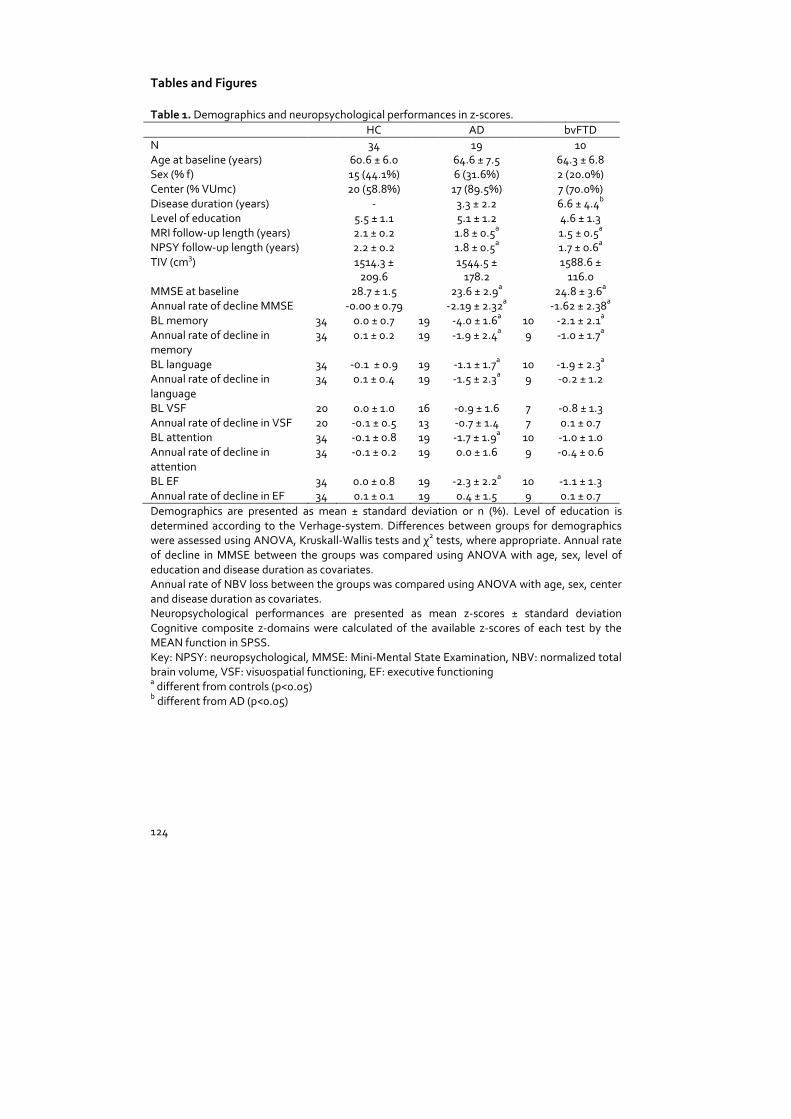
Table 1. Demographics and neuropsychological performances in z-scores.
HC AD bvFTD
N 34 19 10
Age at baseline (years) 60.6 ± 6.0 64.6 ± 7.5 64.3 ± 6.8
Sex (% f) 15 (44.1%) 6 (31.6%) 2 (20.0%)
Center (% VUmc) 20 (58.8%) 17 (89.5%) 7 (70.0%)
Disease duration (years) - 3.3 ± 2.2 6.6 ± 4.4b
Level of education 5.5 ± 1.1 5.1 ± 1.2 4.6 ± 1.3
MRI follow-up length (years) 2.1 ± 0.2 1.8 ± 0.5a 1.5 ± 0.5
a
NPSY follow-up length (years) 2.2 ± 0.2 1.8 ± 0.5a 1.7 ± 0.6
a
TIV (cm3) 1514.3 ±
209.6
1544.5 ±
178.2
1588.6 ±
116.0
MMSE at baseline 28.7 ± 1.5 23.6 ± 2.9a 24.8 ± 3.6
a
Annual rate of decline MMSE -0.00 ± 0.79 -2.19 ± 2.32a -1.62 ± 2.38
a
BL memory 34 0.0 ± 0.7 19 -4.0 ± 1.6a 10 -2.1 ± 2.1
a
Annual rate of decline in
memory
34 0.1 ± 0.2 19 -1.9 ± 2.4a 9 -1.0 ± 1.7
a
BL language 34 -0.1 ± 0.9 19 -1.1 ± 1.7a 10 -1.9 ± 2.3
a
Annual rate of decline in
language
34 0.1 ± 0.4 19 -1.5 ± 2.3a 9 -0.2 ± 1.2
BL VSF 20 0.0 ± 1.0 16 -0.9 ± 1.6 7 -0.8 ± 1.3
Annual rate of decline in VSF 20 -0.1 ± 0.5 13 -0.7 ± 1.4 7 0.1 ± 0.7
BL attention 34 -0.1 ± 0.8 19 -1.7 ± 1.9a 10 -1.0 ± 1.0
Annual rate of decline in
attention
34 -0.1 ± 0.2 19 0.0 ± 1.6 9 -0.4 ± 0.6
BL EF 34 0.0 ± 0.8 19 -2.3 ± 2.2a 10 -1.1 ± 1.3
Annual rate of decline in EF 34 0.1 ± 0.1 19 0.4 ± 1.5 9 0.1 ± 0.7
Demographics are presented as mean ± standard deviation or n (%). Level of education is
determined according to the Verhage-system. Differences between groups for demographics
were assessed using ANOVA, Kruskall-Wallis tests and χ2 tests, where appropriate. Annual rate
of decline in MMSE between the groups was compared using ANOVA with age, sex, level of
education and disease duration as covariates.
Annual rate of NBV loss between the groups was compared using ANOVA with age, sex, center
and disease duration as covariates.
Neuropsychological performances are presented as mean z-scores ± standard deviation
Cognitive composite z-domains were calculated of the available z-scores of each test by the
MEAN function in SPSS.
Key: NPSY: neuropsychological, MMSE: Mini-Mental State Examination, NBV: normalized total
brain volume, VSF: visuospatial functioning, EF: executive functioning a different from controls (p<0.05)
b different from AD (p<0.05)
125
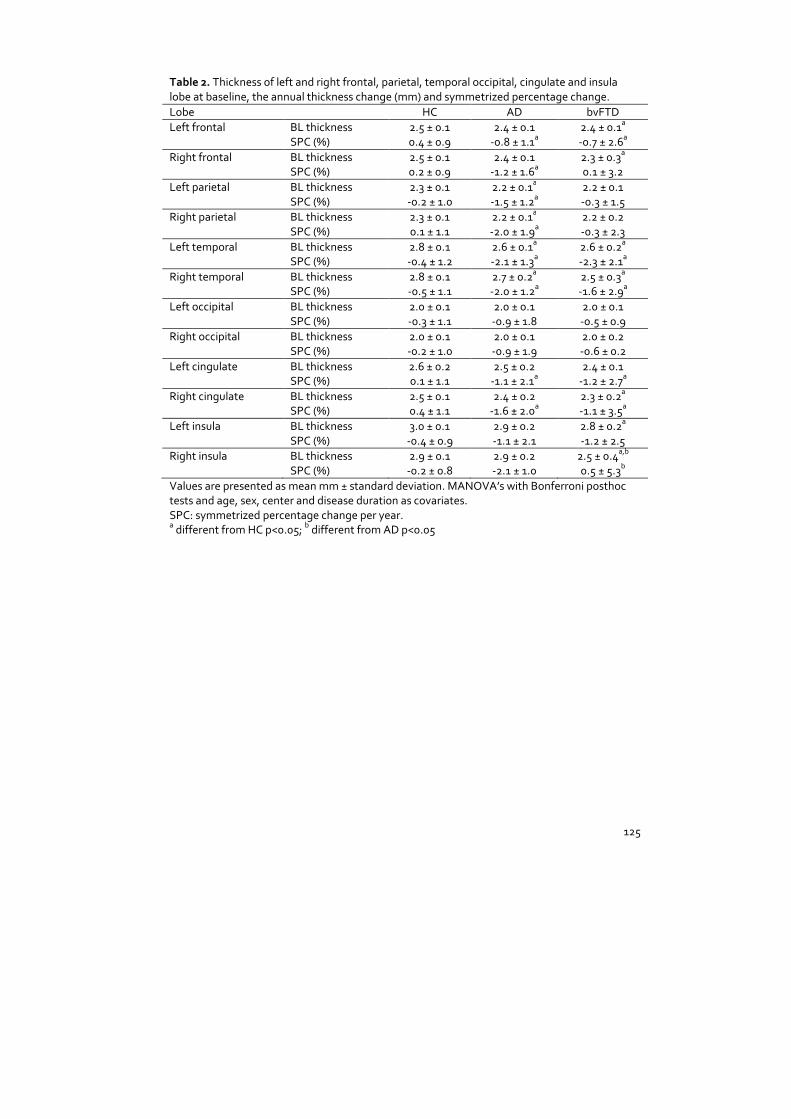
Table 2. Thickness of left and right frontal, parietal, temporal occipital, cingulate and insula
lobe at baseline, the annual thickness change (mm) and symmetrized percentage change.
Lobe HC AD bvFTD
Left frontal BL thickness 2.5 ± 0.1 2.4 ± 0.1 2.4 ± 0.1a
SPC (%) 0.4 ± 0.9 -0.8 ± 1.1a -0.7 ± 2.6
a
Right frontal BL thickness 2.5 ± 0.1 2.4 ± 0.1 2.3 ± 0.3a
SPC (%) 0.2 ± 0.9 -1.2 ± 1.6a 0.1 ± 3.2
Left parietal BL thickness 2.3 ± 0.1 2.2 ± 0.1a 2.2 ± 0.1
SPC (%) -0.2 ± 1.0 -1.5 ± 1.2a -0.3 ± 1.5
Right parietal BL thickness 2.3 ± 0.1 2.2 ± 0.1a 2.2 ± 0.2
SPC (%) 0.1 ± 1.1 -2.0 ± 1.9a -0.3 ± 2.3
Left temporal BL thickness 2.8 ± 0.1 2.6 ± 0.1a 2.6 ± 0.2
a
SPC (%) -0.4 ± 1.2 -2.1 ± 1.3a -2.3 ± 2.1
a
Right temporal BL thickness 2.8 ± 0.1 2.7 ± 0.2a 2.5 ± 0.3
a
SPC (%) -0.5 ± 1.1 -2.0 ± 1.2a -1.6 ± 2.9
a
Left occipital BL thickness 2.0 ± 0.1 2.0 ± 0.1 2.0 ± 0.1
SPC (%) -0.3 ± 1.1 -0.9 ± 1.8 -0.5 ± 0.9
Right occipital BL thickness 2.0 ± 0.1 2.0 ± 0.1 2.0 ± 0.2
SPC (%) -0.2 ± 1.0 -0.9 ± 1.9 -0.6 ± 0.2
Left cingulate BL thickness 2.6 ± 0.2 2.5 ± 0.2 2.4 ± 0.1
SPC (%) 0.1 ± 1.1 -1.1 ± 2.1a -1.2 ± 2.7
a
Right cingulate BL thickness 2.5 ± 0.1 2.4 ± 0.2 2.3 ± 0.2a
SPC (%) 0.4 ± 1.1 -1.6 ± 2.0a -1.1 ± 3.5
a
Left insula BL thickness 3.0 ± 0.1 2.9 ± 0.2 2.8 ± 0.2a
SPC (%) -0.4 ± 0.9 -1.1 ± 2.1 -1.2 ± 2.5
Right insula BL thickness 2.9 ± 0.1 2.9 ± 0.2 2.5 ± 0.4a,b
SPC (%) -0.2 ± 0.8 -2.1 ± 1.0 0.5 ± 5.3b
Values are presented as mean mm ± standard deviation. MANOVA’s with Bonferroni posthoc
tests and age, sex, center and disease duration as covariates.
SPC: symmetrized percentage change per year. a different from HC p<0.05;
b different from AD p<0.05

126
Figure 1. Progression of neuropsychological performances on memory, language, visuospatial functioning, attention and executive functioning between
baseline and follow-up assessment. Time between cognitive examinations were 2.2 years for healthy controls, 1.8 years for AD patients and 1.7 years for
bvFTD patients. Performances are displayed in z-scores which were calculated relative to baseline z-scores of controls.
ANOVA for repeated measures with time and composite z-domain as within-subjects factors, diagnosis as between-subjects factor, and age, sex, level of
education, disease duration, and follow-up time as covariates was conducted. As posthoc test, we conducted MANOVA with ‘annual rate of cognitive
decline’ (rate=(follow-up z-domain score - baseline z-domain score)/ follow-up time) as dependent variable, diagnosis as independent variable and age,
sex, level of education, and disease duration as covariates, to assess the annual rate of cognitive decline between groups for each z-domain. Repeated
measures showed significant effects of time*diagnosis (p<0.001), cognitive domain (p=0.004), cognitive domain*diagnosis (p<0.001), and time*cognitive
domain*diagnosis (p=0.015) showing that annual cognitive deterioration was different for the three diagnostic groups. Posthoc comparisons of the
annual rates of cognitive decline showed only for memory and language significant effects. The performance of AD patients decline the most, but was
only significantly different from controls.

127
Figure 2. Patterns of atrophy at baseline. (A) Blue areas show regions of less gray matter in AD
patients compared to controls. (B) Blue areas show regions of less gray matter in bvFTD
patients compared to controls. (C) Blue areas show regions of less gray matter in AD patients
compared to bvFTD patients. Red areas show regions of less gray matter in bvFTD patients
compared to AD patients.
(A)
(B)
(C)

128
Figure 3. Progression of atrophy. (A) Blue areas show regions of more cortical thinning in AD
patients compared to controls. (B) Blue areas show regions of more cortical thinning in bvFTD
patients compared to controls. (C) Blue areas show regions of more cortical thinning in AD
patients compared to bvFTD patients. Red areas show regions of more cortical thinning in
bvFTD patients compared to AD patients.
(A)
(B)
(C)

129
Figure 4. Loss of thickness in left and right frontal, parietal, temporal, occipital, cingulate and
insula for healthy controls, AD and bvFTD patients. MRI follow up time was 2.1 years for
controls, 1.8 years for AD and 1.5 years for bvFTD patients.
ANOVA for repeated measures with time, lobe and hemisphere as within-subjects factors,
diagnosis as between-subjects factor, and age, sex, TIV, disease duration, center and follow-up
time as covariates was conducted. Cortical thickness measurements of all left and right lobes
were dependent variables. As posthoc test, we conducted MANOVA with ‘annual rate of
atrophy’ (rate=(thickness follow-up MRI – thickness baseline MRI)/ follow-up time) as
dependent variable, diagnosis as independent variable and age, sex, TIV, disease duration, and
center as covariates to assess the difference in progression of atrophy between the groups for
each lobe, left and right separately. Repeated measures showed that regional distribution of
cortical thinning over time was different in the two hemispheres for the three diagnostic
groups. AD patients lost most of the cortical thickness in all cortices, except in left temporal and
left cingulate, where bvFTD (left temporal: 2.3%; left cingulate: 1.2%) patients lost most of
cortical thickness.

130
Especially in right frontal (1.2%) and biparietal (left: 1.5%; right: 2.0%) lobes, AD patients
showed a steeper rate of cortical thinning than controls, whereas bvFTD patients did not differ
from controls. In left frontal, bitemporal and bicingulate, both, AD (left frontal: 0.8%; left
temporal: 2.1%; right temporal: 2.0%; left cingulate: 1.1%; right cingulate: 1.6%) and bvFTD
patients (left frontal: 0.7%; left temporal: 2.3%; right temporal: 1.6%; left cingulate: 1.2%; right
cingulate: 1.1%) progressed harder than controls (left frontal: 0.4%; left temporal: 0.4%; right
temporal: 0.5%; left cingulate: 0.1%; right cingulate: +0.4%). For the right insula, AD patients
(2.1%) lost more cortical thickness than bvFTD (+0.5%)and controls (0.2%). There were no
differences in progression of cortical thinning for bioccipital and left insula.

131
Reference List
[1] Ratnavalli E, Brayne C, Dawson K, Hodges JR (2002) The prevalence of frontotemporal
dementia. Neurology 58, 1615-1621.
[2] Sluimer JD, van der Flier WM, Karas GB, van SR, Barnes J, Boyes RG, Cover KS, et al.
(2009) Accelerating regional atrophy rates in the progression from normal
aging to Alzheimer's disease. Eur Radiol 19, 2826-2833.
[3] Frings L, Yew B, Flanagan E, Lam BY, Hull M, Huppertz HJ, Hodges JR, Hornberger M
(2014) Longitudinal grey and white matter changes in frontotemporal
dementia and Alzheimer's disease. PLoS One 9, e90814-
[4] Whitwell JL, Anderson VM, Scahill RI, Rossor MN, Fox NC (2004) Longitudinal patterns
of regional change on volumetric MRI in frontotemporal lobar degeneration.
Dement Geriatr Cogn Disord 17, 307-310.
[5] Brambati SM, Renda NC, Rankin KP, Rosen HJ, Seeley WW, Ashburner J, Weiner MW,
Miller BL, Gorno-Tempini ML (2007) A tensor based morphometry study of
longitudinal gray matter contraction in FTD. Neuroimage 35, 998-1003.
[6] Jack CR, Jr., Slomkowski M, Gracon S, Hoover TM, Felmlee JP, Stewart K et al. (2003)
MRI as a biomarker of disease progression in a therapeutic trial of milameline
for AD. Neurology 60, 253-260.
[7] Fox NC, Black RS, Gilman S, Rossor MN, Griffith SG, Jenkins L, Koller M (2005) Effects of
Abeta immunization (AN1792) on MRI measures of cerebral volume in
Alzheimer disease. Neurology 64, 1563-1572.
[8] Krueger CE, Dean DL, Rosen HJ, Halabi C, Weiner M, Miller BL, Kramer JH (2010)
Longitudinal rates of lobar atrophy in frontotemporal dementia, semantic
dementia, and Alzheimer's disease. Alzheimer Dis Assoc Disord 24, 43-48.
[9] Barnes J, Godbolt AK, Frost C, Boyes RG, Jones BF, Scahill RI, Rossor MN, Fox NC (2007)
Atrophy rates of the cingulate gyrus and hippocampus in AD and FTLD.
Neurobiol Aging 28, 20-28.
[10] Whitwell JL, Jack CR, Jr., Parisi JE, Knopman DS, Boeve BF, Petersen RC, Ferman TJ,
Dickson DW, Josephs KA (2007) Rates of cerebral atrophy differ in different
degenerative pathologies. Brain 130, 1148-1158.
[11] Chan D, Fox NC, Jenkins R, Scahill RI, Crum WR, Rossor MN (2001) Rates of global and
regional cerebral atrophy in AD and frontotemporal dementia. Neurology 57,
1756-1763.
[12] Whitwell JL, Jack CR, Jr., Pankratz VS, Parisi JE, Knopman DS, Boeve BF, Petersen RC,
Dickson DW, Josephs KA (2008) Rates of brain atrophy over time in autopsy-
proven frontotemporal dementia and Alzheimer disease. Neuroimage 39,
1034-1040.
[13] McKhann G, Drachman D, Folstein M, Katzman R, Price D, Stadlan EM (1984) Clinical
diagnosis of Alzheimer's disease: report of the NINCDS-ADRDA Work Group
under the auspices of Department of Health and Human Services Task Force
on Alzheimer's Disease. Neurology 34, 939-944.
[14] McKhann GM, Knopman DS, Chertkow H, Hyman BT, Jack CR, Jr., Kawas CH et al.
(2011) The diagnosis of dementia due to Alzheimer's disease:
recommendations from the National Institute on Aging-Alzheimer's
Association workgroups on diagnostic guidelines for Alzheimer's disease.
Alzheimers Dement 7, 263-269.
[15] Rascovsky K, Hodges JR, Knopman D, Mendez MF, Kramer JH, Neuhaus J, et al. (2011)
Sensitivity of revised diagnostic criteria for the behavioural variant of
frontotemporal dementia. Brain 134, 2456-2477.

132
[16] Verhage F (1964) Intelligentie en leeftijd: onderzoek bij Nederlanders van twaalf tot
zevenenzeventig jaar., Van Gorcum, Assen.
[17] Stroop JR (1935) Studies of interference in serial verbal reactions. J Exp Psychol 18, 643-
662.
[18] Smits LL, Pijnenburg YA, Koedam EL, van der Vlies AE, Reuling IE, Koene T, Teunissen
CE, Scheltens P, van der Flier WM (2012) Early Onset Alzheimer's Disease is
Associated with a Distinct Neuropsychological Profile. J Alzheimers Dis 30, 101-
108.
[19] Reuter M, Schmansky NJ, Rosas HD, Fischl B (2012) Within-subject template estimation
for unbiased longitudinal image analysis. Neuroimage 61, 1402-1418.
[20] Dale AM, Fischl B, Sereno MI (1999) Cortical surface-based analysis. I. Segmentation and
surface reconstruction. Neuroimage 9, 179-194.
[21] Fischl B, Sereno MI, Dale AM (1999) Cortical surface-based analysis. II: Inflation,
flattening, and a surface-based coordinate system. Neuroimage 9, 195-207.
[22] Reuter M , Fischl B (2011) Avoiding asymmetry-induced bias in longitudinal image
processing. Neuroimage 57, 19-21.
[23] Reuter M, Rosas HD, Fischl B (2010) Highly accurate inverse consistent registration: a
robust approach. Neuroimage 53, 1181-1196.
[24] Desikan RS, Segonne F, Fischl B, Quinn BT, Dickerson BC, Blacker D, Buckner RL, Dale
AM, Maguire RP, Hyman BT, Albert MS, Killiany RJ (2006) An automated
labeling system for subdividing the human cerebral cortex on MRI scans into
gyral based regions of interest. Neuroimage 31, 968-980.
[25] Seeley WW, Crawford R, Rascovsky K, Kramer JH, Weiner M, Miller BL, Gorno-Tempini
ML (2008) Frontal paralimbic network atrophy in very mild behavioral variant
frontotemporal dementia. Arch Neurol 65, 249-255.
[26] Seeley WW (2010) Anterior insula degeneration in frontotemporal dementia. Brain
Struct Funct 214, 465-475.
[27] Pan PL, Song W, Yang J, Huang R, Chen K, Gong QY, Zhong JG, Shi HC, Shang HF (2012)
Gray matter atrophy in behavioral variant frontotemporal dementia: a meta-
analysis of voxel-based morphometry studies. Dement Geriatr Cogn Disord 33,
141-148.
[28] Lehmann M, Rohrer JD, Clarkson MJ, Ridgway GR, Scahill RI, Modat M, Warren JD,
Ourselin S, Barnes J, Rossor MN, Fox NC (2010) Reduced cortical thickness in
the posterior cingulate gyrus is characteristic of both typical and atypical
Alzheimer's disease. J Alzheimers Dis 20, 587-598.
[29] Möller C, Vrenken H, Jiskoot L, Versteeg A, Barkhof F, Scheltens P, van der Flier WM
(2013) Different patterns of gray matter atrophy in early- and late-onset
Alzheimer's disease. Neurobiol Aging 34, 2014-2022.
[30] Reuter M, Schmansky NJ, Rosas HD, Fischl B (2012) Within-subject template estimation
for unbiased longitudinal image analysis. Neuroimage 61, 1402-1418.
[31] Nordenskjold R, Malmberg F, Larsson EM, Simmons A, Brooks SJ, Lind L, Ahlstrom H,
Johansson L, Kullberg J (2013) Intracranial volume estimated with commonly
used methods could introduce bias in studies including brain volume
measurements. Neuroimage 83, 355-360.
[32] Rascovsky K, Salmon DP, Lipton AM, Leverenz JB, DeCarli C, Jagust WJ, Clark CM,
Mendez MF, Tang-Wai DF, Graff-Radford NR, Galasko D (2005) Rate of
progression differs in frontotemporal dementia and Alzheimer disease.
Neurology 65, 397-403.
[33] Sluimer JD, Vrenken H, Blankenstein MA, Fox NC, Scheltens P, Barkhof F, van der Flier
WM (2008) Whole-brain atrophy rate in Alzheimer disease: identifying fast
progressors. Neurology 70, 1836-1841.
133
[34] Wang D, Chalk JB, Rose SE, de ZG, Cowin G, Galloway GJ, Barnes D, Spooner D,
Doddrell DM, Semple J (2002) MR image-based measurement of rates of
change in volumes of brain structures. Part II: application to a study of
Alzheimer's disease and normal aging. Magn Reson Imaging 20, 41-48.
[35] Fox NC , Freeborough PA (1997) Brain atrophy progression measured from registered
serial MRI: validation and application to Alzheimer's disease. J Magn Reson
Imaging 7, 1069-1075.
[36] Smits LL, van Harten AC, Pijnenburg YA, Koedam EL, Bouwman FH, Sistermans N,
Reuling IE, Prins ND, Lemstra AW, Scheltens P, van der Flier WM (2014)
Trajectories of cognitive decline in different types of dementia. Psychol Med, 1-
9.
[37] van der Vlies AE, Koedam EL, Pijnenburg YA, Twisk JW, Scheltens P, van der Flier WM
(2009) Most rapid cognitive decline in APOE epsilon4 negative Alzheimer's
disease with early onset. Psychol Med 39, 1907-1911.
[38] Rohrer JD (2012) Structural brain imaging in frontotemporal dementia. Biochim Biophys
Acta 1822, 325-332.
[39] Rabinovici GD, Seeley WW, Kim EJ, Gorno-Tempini ML, Rascovsky K, Pagliaro TA,
Allison SC, Halabi C, Kramer JH, Johnson JK, Weiner MW, Forman MS,
Trojanowski JQ, Dearmond SJ, Miller BL, Rosen HJ (2007) Distinct MRI atrophy
patterns in autopsy-proven Alzheimer's disease and frontotemporal lobar
degeneration. Am J Alzheimers Dis Other Demen 22, 474-488.
[40] Raji CA, Lopez OL, Kuller LH, Carmichael OT, Becker JT (2009) Age, Alzheimer disease,
and brain structure. Neurology 73, 1899-1905.
[41] Frisoni GB, Pievani M, Testa C, Sabattoli F, Bresciani L, Bonetti M, Beltramello A,
Hayashi KM, Toga AW, Thompson PM (2007) The topography of grey matter
involvement in early and late onset Alzheimer's disease. Brain 130, 720-730.
[42] Whitwell JL , Jack CR, Jr. (2005) Comparisons between Alzheimer disease,
frontotemporal lobar degeneration, and normal aging with brain mapping. Top
Magn Reson Imaging 16, 409-425.
[43] Möller C, Dieleman N, van der Flier WM, Versteeg A, Pijnenburg Y, Scheltens P, Barkhof
F, Vrenken H (2014) More Atrophy of Deep Gray Matter Structures in
Frontotemporal Dementia Compared to Alzheimer's Disease. J Alzheimers Dis
[44] Cummings JL (1993) Frontal-subcortical circuits and human behavior. Arch Neurol 50,
873-880.
[45] Hurley RS, Bonakdarpour B, Wang X, Mesulam MM (2014) Asymmetric Connectivity
between the Anterior Temporal Lobe and the Language Network. J Cogn
Neurosci, 1-10.
[46] Smits LL, Tijms BM, Benedictus MR, Koedam EL, Koene T, Reuling IE, Barkhof F,
Scheltens P, Pijnenburg YA, Wattjes MP, van der Flier WM (2014) Regional
atrophy is associated with impairment in distinct cognitive domains in
Alzheimer's disease. Alzheimers Dement 10, S299-S305.
[47] Jovicich J, Marizzoni M, Sala-Llonch R, Bosch B, Bartres-Faz D, Arnold J et al. (2013)
Brain morphometry reproducibility in multi-center 3T MRI studies: a
comparison of cross-sectional and longitudinal segmentations. Neuroimage
83, 472-484.