
Centro de Investigacion en Matem´ aticas, A.C., Guanajuato ...
76
Transcript of Centro de Investigacion en Matem´ aticas, A.C., Guanajuato ...


.
Centro de Investigacion en Matematicas, A.C., Guanajuato, GT, Mexico. Julio, 2018.

Book of Abstracts
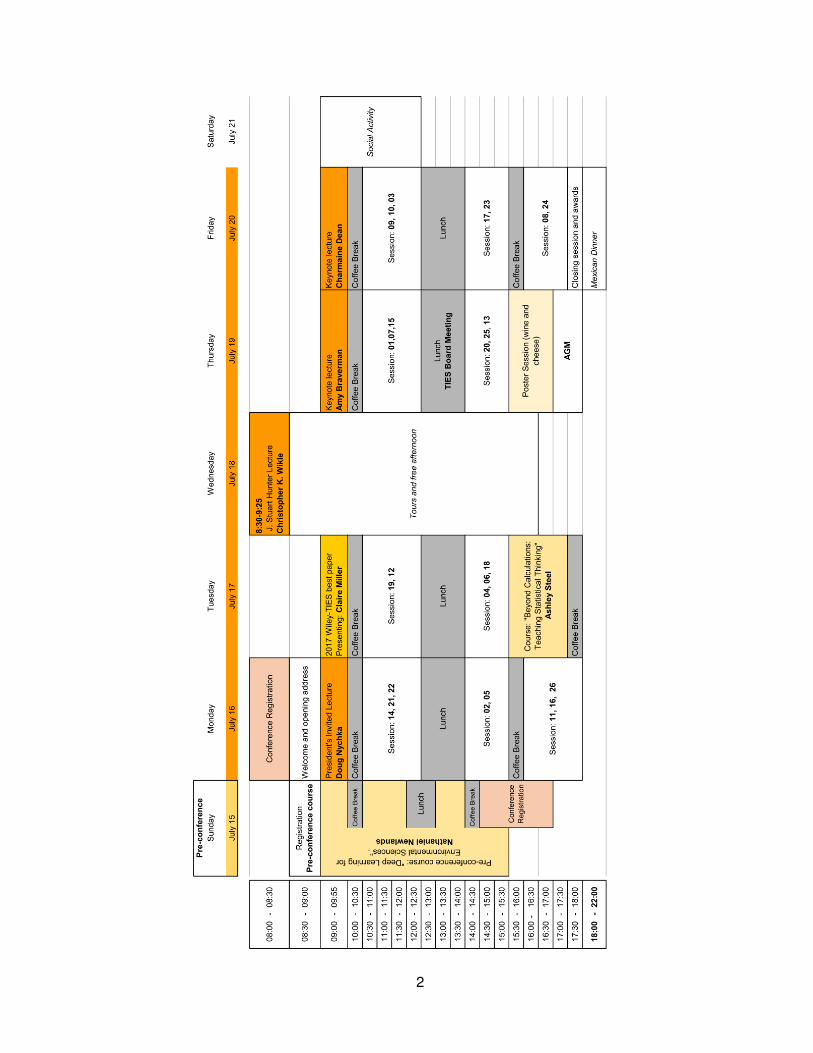
The 28th Annual Conference of
The International Environmetrics Society
TIES 2018
16–21 July 2018,
CIMAT, Guanajuato, MEXICO.
*

Committees
Scientific Committee
• Liliane Bel, France
• Edward L. Boone, USA
• Lelys Bravo, Venezuela
• Alex Brenning, Germany
• Singdhansu Chatterjee, USA
• Daniela Cocchi, Italy
• Abdel El Shaarawi, Canada/Egypt
• Sylvia Esterby, Canada
• Carolina Euan, Saudi Arabia
• Alessandro Fasso, Italy
• Yulia R. Gel, USA (Chair)
• Murali Haran, USA
• Amanda Hering, USA
• Gabriel Huerta, USA
• Ilian Iliev, USA
• Krishna Jandhyala, USA
• Petra Kuhnert, Australia
• Robert Lund, USA
• Slava Lyubchich, USA
• Jorge Mateu, Spain
• Wendy Meiring, USA
• Claire Miller, UK
• Nathaniel Newlands, Canada
• Nikunj Oza, USA
• Emilio Porcu, UK
• L. Leticia Ramirez-Ramirez, Mexico
• Eliane Rodrigues, Mexico
• Bruno Sanso, USA
• Katia Smirnova, USA
• Song Xi, USA/China
• Hao Zhang, USA
Local Committee
• Victor De Oliveira, UTSA
• J Andres Christen, CIMAT
• L. Leticia Ramırez-Ramırez, CIMAT(Chair)
• Rogelio Ramos Quiroga, CIMAT
• Eliane R. Rodrıgues, IMATE-UNAM
• Inder R. Tecuapetla-Gomez, CONACyT-CONABIO
• Belem Trejo-Valdivia, INP
1
2
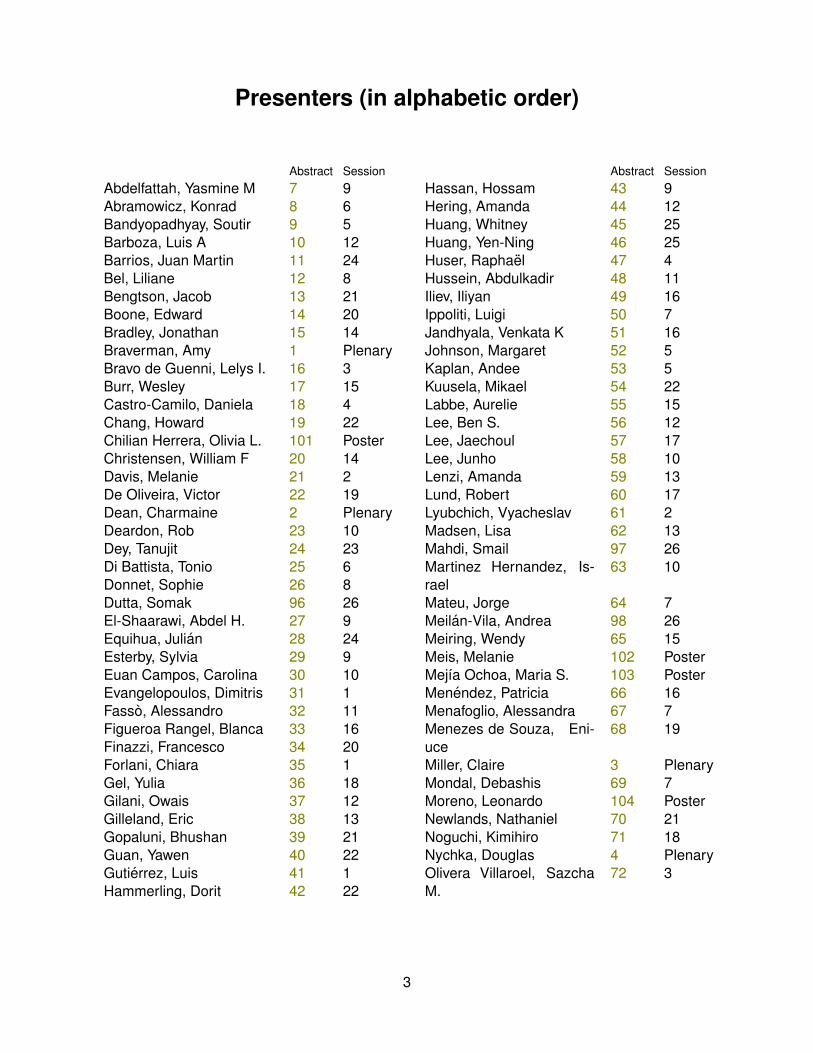
Presenters (in alphabetic order)
Abstract SessionAbdelfattah, Yasmine M 7 9Abramowicz, Konrad 8 6Bandyopadhyay, Soutir 9 5Barboza, Luis A 10 12Barrios, Juan Martin 11 24Bel, Liliane 12 8Bengtson, Jacob 13 21Boone, Edward 14 20Bradley, Jonathan 15 14Braverman, Amy 1 PlenaryBravo de Guenni, Lelys I. 16 3Burr, Wesley 17 15Castro-Camilo, Daniela 18 4Chang, Howard 19 22Chilian Herrera, Olivia L. 101 PosterChristensen, William F 20 14Davis, Melanie 21 2De Oliveira, Victor 22 19Dean, Charmaine 2 PlenaryDeardon, Rob 23 10Dey, Tanujit 24 23Di Battista, Tonio 25 6Donnet, Sophie 26 8Dutta, Somak 96 26El-Shaarawi, Abdel H. 27 9Equihua, Julian 28 24Esterby, Sylvia 29 9Euan Campos, Carolina 30 10Evangelopoulos, Dimitris 31 1Fasso, Alessandro 32 11Figueroa Rangel, Blanca 33 16Finazzi, Francesco 34 20Forlani, Chiara 35 1Gel, Yulia 36 18Gilani, Owais 37 12Gilleland, Eric 38 13Gopaluni, Bhushan 39 21Guan, Yawen 40 22Gutierrez, Luis 41 1Hammerling, Dorit 42 22
Abstract SessionHassan, Hossam 43 9Hering, Amanda 44 12Huang, Whitney 45 25Huang, Yen-Ning 46 25Huser, Raphael 47 4Hussein, Abdulkadir 48 11Iliev, Iliyan 49 16Ippoliti, Luigi 50 7Jandhyala, Venkata K 51 16Johnson, Margaret 52 5Kaplan, Andee 53 5Kuusela, Mikael 54 22Labbe, Aurelie 55 15Lee, Ben S. 56 12Lee, Jaechoul 57 17Lee, Junho 58 10Lenzi, Amanda 59 13Lund, Robert 60 17Lyubchich, Vyacheslav 61 2Madsen, Lisa 62 13Mahdi, Smail 97 26Martinez Hernandez, Is-rael
63 10
Mateu, Jorge 64 7Meilan-Vila, Andrea 98 26Meiring, Wendy 65 15Meis, Melanie 102 PosterMejıa Ochoa, Maria S. 103 PosterMenendez, Patricia 66 16Menafoglio, Alessandra 67 7Menezes de Souza, Eni-uce
68 19
Miller, Claire 3 PlenaryMondal, Debashis 69 7Moreno, Leonardo 104 PosterNewlands, Nathaniel 70 21Noguchi, Kimihiro 71 18Nychka, Douglas 4 PlenaryOlivera Villaroel, SazchaM.
72 3
3

Abstract SessionOpitz, Thomas 73 4Ortega, Joaquin 74 19Peterson, Geofreey 75 23Pirani, Monica 76 2Ramirez Ramirez, L. Leticia 77 8Reyes Cuellar, Perla 78 6Rodrigues, Eliane 79 3Russell, James 80 23Schliep, Erin 81 14Scott, E. Marian 82 20Shaby , Benjamin 83 18Smirnova, Ekaterina 84 19Steel, E. Ashley 6 Mini-courseSteel, E. Ashley 85 11Stroud, Jonathan 86 14Suarez Sierra, Biviana M. 87 9Sulik, John 88 21Tamayo y Ortiz, Marcela 99 26Tecuapetla-Gomez, Inder 89 24Thomas, Matthew 90 1Truong, Phuong 91 15Valentini, Pasquale 92 11Villase·or, Jose A 100 26Wickle, Christopher K 5 PlenaryWoody, Jonathan 93 17Xi, Dexen DZ 94 3Zhang, Hao 95 25
.
4

ABSTRACTS
Plenary Talks (5) from 1 to 5.Mini courses (1) from 6 to 6.Invited talks (89) from 7 to 95.Contributed talks (5) from 96 to 100.Posters (4): from 101 to 104.
Plenary Talks
1. Plenary Talk Session: Plenary
Uncertainty Quantification for Nasa’s Orbiting Carbon Observatory-2 MissionPresenting Author: Braverman, Amy.Institution: NASA JPL, USA.
Abstract:
Space-borne remote sensing instruments measure high-dimensional vectors of radiancesfor each ground footprint over which they observe. These observations are convertedinto estimates of geophysical quantities through complex processing algorithms calledretrievals. Many instruments use “optimal estimation” (OE) methods based on Bayes’Rule [1] to obtain the posterior distribution of the state given the radiances, and reportthe estimated posterior mean and variance as a shorthand description of this distribution.However, numerous computational compromises and imperfect knowledge about otherrequired inputs including the prior distribution, create uncertainties.Here we present a post-hoc methodology for assessing the biases and variances of indi-vidual estimates produced by OE. The method is based on simulations that characterizethe performance of OE, under different geophysical conditions, as functions of measuredradiances. The simulation results are used to fit a nonlinear regression model that pre-dicts bias and variance as a function of (dimension-reduced) radiance. We describe themethodology and its rationale, and illustrate using examples from NASA’s Orbiting CarbonObservatory 2 (OCO-2) instrument.
References:
[1] Rodgers, Clive D. 2000. Inverse Methods for Atmospheric Sounding, Theory and Practice. World Scientific, Singa-pore.
Co-authors:Jonathan Hobbs and Joaquim Teixeira, Jet Propulsion Laboratory, California Institute ofTechnology, USA.
5
Keywords: Uncertainty quantification, remote sensing, carbon cycle.
2. Plenary Talk Session: Plenary
Joint Outcome Modeling: a Review, and Application to Storm Cell ModelingPresenting Author: Dean, Charmaine.Institution: University of Waterloo, Canada.
Abstract:
In environmetrics, outcomes with a common correlation structure are regularly collected.However, joint outcome analysis is not routinely employed despite the fact that it has beenshown to improve efficiency and may be used to identify common underlying structures ofmultivariate outcomes. This talk first provides a general overview of a shared componentmodels and their utility through a series of applications including: disease mapping ofecological outcomes with a common latent spatial surface, correlated survival modelsfor duration and size of forest fires and repeated measurements of tree growth that isassociated with the time-to-event outcome, mortality.Storm cells are the smallest component of a storm-producing system. A cluster of suchcells is referred to as a storm and a storm system consists of a cluster of storms. This talkcontinues on to develop a joint model for these storm cells and their trajectories (duration,speed and direction) over space and time. Specifically, we extend the Neyman-Scottprocess, which is commonly employed for the analysis of clustered point processes, toaccount for the hierarchical clustering present in our data. We do this by allowing theparents to follow a doubly stochastic process, namely a log-Gaussian Cox process. Wethen incorporate the mark process through a four component model that distinguishesbetween the mechanisms that determine whether or not a storm cell is observed morethan once and storm cell trajectory. This is applied to storm cell data from the Bismarckradar station in North Dakota, USA.
3. 2017 Wiley-TIES best paper. Session: Plenary
Flow-directed Pca for Monitoring NetworksPresenting Author: Miller, Claire.Institution: School of Mathematics and Statistics, University of Glasgow, Glasgow, UK.
Abstract:
Measurements recorded over monitoring networks often possess spatial and temporalcorrelation inducing redundancies in the information provided. For river water quality mon-itoring in particular, flow-connected sites may likely provide similar information. This paperproposes a novel approach to principal components analysis to investigate reducing di-mensionality for spatiotemporal flow-connected network data in order to identify commonspatiotemporal patterns. The method is illustrated using monthly observations of total ox-idized nitrogen for the Trent catchment area in England. Common patterns are revealed
6
that are hidden when the river network structure and temporal correlation are not ac-counted for. Such patterns provide valuable information for the design of future samplingstrategies.
Co-authors:K. Gallacher, School of Mathematics and Statistics, University of Glasgow, UK.E. M. Scott R. Willows, School of Mathematics and Statistics, University of Glasgow, UK.R.Willows, School of Mathematics and Statistics, University of Glasgow, UK.L. Pope, Evidence Directorate, Environment Agency, UK.J. Douglass, Evidence Directorate, Environment Agency, UK.
Keywords: connected monitoring networks, flow direction, PCA.
4. President’s Invited Lecture. Session: Plenary
Nonstationary Spatial Data: Think Globally Act LocallyPresenting Author: Nychka, Douglas.Institution: National Center for Atmospheric Research, USA.
Abstract:
Large spatial data sets are now ubiquitous in environmental science. Fine spatial sam-pling or many observations across large domains provides a wealth of information and canoften address new scientific questions. However, the richness and scale of large datasetsoften reveal heterogeneity in spatial processes that add more complexity to a statisticalanalysis. A strategy for handling larger problems is to rely on separate local analyses ofthe data but with a view to combine the results into a seamless global model. In this talktwo examples are presented for handling the simulation and uncertainty quantification ofnon-stationary Gaussian processes. The global model in this case is a process convo-lution of a white noise field where the convolution function varies across space. Such amodel is difficult to implement explicitly for large spatial fields. In this case local fitting isused to estimate spatially varying covariance parameters and these are encoded into asparse Markov random field model for a global representation. This strategy makes it pos-sible to estimate and then simulate (unconditional) non-stationary Gaussian processes.A different approach can be exploited for conditional simulation of a spatial field to quan-tify the uncertainty of spatial predictions. If the local window for conditional simulationis chosen appropriately one can generate seamless conditional fields that approximatesolving the global problem. The unconditional method is illustrated for the emulation ofsurface temperature fields from an ensemble of climate model experiments (CommunityEarth System Model Large Ensemble) and the conditional method is used to generate anensemble from the analysis of space-time observations from ocean drifter buoys ( ARGOprofiling floats).
5. J. Stuart Hunter Lecture. Session: Plenary
7
Using ·deep· Models From Machine Learning for Parsimonious and Efficient Imple-mentation of Multiscale Spatio-temporal Statistical ModelsPresenting Author: Wickle, Christopher K.Institution: University of Missouri, USA.
Abstract:
Spatio-temporal data are ubiquitous in engineering and the sciences, and their study isimportant for understanding and predicting a wide variety of processes. One of the chiefdifficulties in modeling spatial processes that change with time is the complexity of thedependence structures that must describe how such a process varies, and the presenceof high-dimensional complex datasets and large prediction domains. It is particularly chal-lenging to specify parameterizations for nonlinear dynamical spatio-temporal models thatare simultaneously useful scientifically and efficient computationally. Statisticians havedeveloped some “deep” mechanistically-motivated models that can accommodate pro-cess complexity as well as the uncertainties in the predictions and inference. However,these models can be expensive and are typically application specific. On the other hand,the science, engineering, and machine learning communities have developed alternativeapproaches for nonlinear spatio-temporal modeling that includes complex, and deep de-pendence structures as well. These approaches can be quite flexible and sometimescan be implemented quite efficiently, but typically without formal uncertainty quantifica-tion. Here, we present a multi time-scale spatio-temporal dynamical model that places aspecial parsimonious class of deep recurrent neural networks known as echo state net-works in a statistical framework that can account for uncertainty. This is illustrated on amulti-scale process related to long lead-time forecasting of environmental responses.
Mini-Course
6. Mini-course Session: Mini-course
Beyond Calculations: Teaching Statistical ThinkingPresenting Author: Steel, E. Ashley.Institution: PNW Research Station, US Forest Service Fullerton, Aimee H. NorthwestFisheries Science Center NOAA Fisheries , USA.
Abstract:
To improve the application of statistics within the scientific process, we developed a coursefor senior undergraduates in Statistics and early graduate students from any science dis-cipline. The course serves as a bridge between learning and applying statistical tools; itfocuses on statistical thinking within an expanded domain of statistics that includes notonly calculations but also the beginning of the scientific process, e.g. asking a clear ques-tion and tying it correctly to analytical methods, and the end of the scientific process, e.g.
8
communicating results to the general public. In this 2-hour workshop, we share the suc-cesses and challenges of our course as well as slides, in-class activities, and r-labs tohelp others develop similar courses or enrich existing ones.
Co-authors:Peter Guttorp - [email protected] Liermann - [email protected]
Invited Talks
7. Invited Talk Session: 9
Specification and Prediction of Blue Nile Basin Precipitation From Global-scale SstUsing CcaPresenting Author: Abdelfattah, Yasmine M.Institution: The British University in Egypt, UK.
Abstract:
Canonical correlation analysis (CCA) is selected to describe the relationship betweenBlue Nile Basin (BNB) Precipitation and Global-scale sea surface temperature (SST) be-tween year 1998 and 2016. Both specification and predictive relations are studied. Theprediction of BNB precipitation magnitude are crucial in anticipating the social and eco-nomic changes that could occur in the Nile Basin. In particular, Ethiopia·s economicconditions would be affected but indeed influence its geopolitical relationship with the Nileriparian countries which are Egypt and Sudan especially after Ethiopia·s announcementof constructing the Grand Ethiopian Renaissance dam (GERD). This study includes nat-ural climate variability for the three Ethiopian seasons: Kirmet (rainy season), Belg (shortrain season) and Bega (dry season), which is regularly overlooked. The importance ofCCA is that it reveals the flow patterns behind the projection skill and quantifies its relativecontributions. East Central Tropical Pacific SST, Southern Oscillation Index and AtlanticMeridional Mode are considered as potential predictors. The result shows the spatial cor-relation patterns of different predictors with influence on the BNB are well recognized byCCA. Studying Bega, have given insights about the seasonal shifts that is causing BNBextreme precipitation events.
Co-authors:Abdel H. El-Shaarawi, Canadian National Water Research Institute, Burlington, Canadaand Cairo University, Giza, Egypt.Hala Abou-Ali, Cairo University and Economic Research Forum (ERF), Giza, Egypt.Nada Rostom, The British University in Egypt, Cairo, Egypt.
Keywords: Blue Nile Basin, Precipitation, Global-scale SST, Canonical correlation anal-ysis, Prediction.
9
8. Invited Talk Session: 6
Climate Message From the Past in Scandinavian Lakes Through Clustering of Mis-aligned Dependent Seasonal Patterns in Varved Lake SedimentPresenting Author: Abramowicz, Konrad.Institution: Umea University, Sweden.
Abstract:
An approach used to cluster time- and space- dependent functional data is presented. As-sume that for a given spatial location there is a lattice of time points (e.g., years), wherea function is observed in each time point. Further, assume that there are latent (unob-servable) groups of functions that vary slowly over time, and where different groupingsmay arise at different time scales (resolutions). Groups are characterised by distinct fre-quencies of the observed functions. We propose and discuss a non-parametric doubleclustering method, which identifies latent groups at different resolutions. Additionally, weconsider the aspect of dependency by simultaneously analysing time dependent curves atdifferent spatial locations. The introduced methodology is applied to sediment data fromthree varved lakes from different parts of Scandinavia, aiming at reconstructing winterclimatic regimes in the region.
Co-authors:Sara Sjostedt de Luna, Johan Strandberg and Lina Schelin.
Keywords: Dependence, Functional Data Analysis, Nonparametric Methods.
9. Invited Talk Session: 5
A Model for Large Multivariate Spatial DatasetsPresenting Author: Bandyopadhyay, Soutir.Institution: Colorado School of Mines, USA.
Abstract:
Multivariate spatial modeling is a rapidly growing field, but most extant models are infea-sible for use with massive spatial processes. In this work we introduced a highly flexible,interpretable and scalable multiresolution approach to multivariate spatial modeling. Re-lying on compactly supported basis functions and Gaussian Markov random field speci-fications for coefficients results in efficient and scalable calculation routines for likelihoodevaluations and co-kriging. We analytically show that special parameterizations approx-imate popular existing models. Moreover, the multiresolution approach allows for arbi-trary specification of scale dependence between processes. We illustrate our approachthrough Monte Carlo studies to illustrate implied stochastic behavior and test our abilityto recover scale dependence, and moreover examine a complex large bivariate observa-tional minimum and maximum temperature dataset over the western United States.
Co-authors:William Kleiber, University of Colorado, Boulder, CO, USA.Douglas Nychka, National Center for Atmospheric Research, Boulder, CO, USA.
10
Keywords: Coherence, Multiresolution, Sparse, Wendland.
10. Invited Talk Session: 12
Efficient Reconstructions of Common Era Climate Via Integrated Nested LaplaceApproximationsPresenting Author: Barboza, Luis A.Institution: Universidad de Costa Rica, Costa Rica.
Abstract:
A Paleoclimate Reconstruction on the Common Era (1-2000AD) was performed usinga Hierarchical Bayesian Model from three sources of data: proxy data from PAGES2kproject dataset, HadCRUT4 temperature data from the Climatic Research Unit at the Uni-versity of East Anglia and external forcing data from several sources. Instead of usingthe MCMC approach to solve for the latent variable [1], we used the INLA algorithm thatshows an improvement in terms of computational time. Also 4 different methods of di-mensionality reduction were compared in order to define several single series of reducedproxies. The use of external forcings was tested by replace them with a fixed numberof BSplines in the latent equation, but there is not a significant difference in terms of thepredictive ability for both approaches.
References:
[1] Barboza, L., Li, B., Tingley, M.P. and Viens, F.G. 2014. Reconstructing Past Temperatures from Natural Proxiesand Estimated Climate Forcings using Short- and Long-Memory Models. The Annals of Applied Statistics,8(4):1966·2001.
Co-authors:Julien Emile-Geay, University of Southern California, USA.Bo Li, University of Illinois at Urbana-Champaign, USA.
Keywords: INLA, Paleoclimate Reconstruction, Hierarchical Bayesian Model, PAGES2k.
11. Invited Talk Session: 24
Species:a Web Platform for the Exploratory Analysis of Species Occurrence DatabasesPresenting Author: Barrios, Juan Martin.Institution: Comision Nacional para el Conocimiento y Uso de la Biodiversidad (CONABIO),Mexico.
Abstract:
Repositories of biodiversity information have been growing rapidly due to the digitalizationof many biological collections around the globe, and to the success of local and worldwidecitizen science projects. In Mexico, the National Biodiversity Information System (SNIB)is the largest repository of biodiversity data, it has more than 10 million records of species
11
occurrence points which correspond to 85,000 species. The Global Biodiversity Infor-mation Facility (GBIF) is an international effort that has succeeded in bringing togetherbiodiversity data from many countries and institutions (the SNIB being one of them). Atthe moment, it hosts almost 1 billion records from over a thousand institutions. All thesedata contain a great deal of information about the world’s ecosystems, however, we arestill a long way from extracting it all.In this talk, we will present SPECIES, a web-based platform designed to extract knowl-edge from these large scale datasets of ecological data. The platform’s basic idea is thatthe spatial correlations among the registered species distributions, and abiotic factors,like climate and topographic features can help us to further understand the compositionof ecosystems.The platform integrates a set of tools for exploratory data analysis: data, a statisticalengine, and an information visualization front end. SPECIES is optimized to supportfast hypotheses prototyping and testing, it can analyse thousands of biotic and abioticvariables in minutes and present descriptive results to the user at different levels of detail.It is meant to be part of a researcher toolset that opens access to information hidden inlarge databases like SNIB or GBIF, that may guide ecologists toward new insights.
Co-authors:Raul Sierra-Alcocer, CONABIO, Mexico.Christopher R. Stephens, Centro de Ciencias de la Complejidad, UNAM, Mexico.Juan C. Salazar-Carrillo, CONABIO, Mexico.Pedro Romero-Martınez, CONABIO, Mexico.
Keywords: species co-occurrence analysis, biodiversity data, spatial data mining, soft-ware, ecology.
12. Invited Talk Session: 8
Predicting Plant Endemicity Based on Herbarium Data: Application to French DataPresenting Author: Bel, Liliane.Institution: AgroParisTech, France.
Abstract:
Evaluating formal threat criteria for every organism on earth is a tremendously resource-consuming task which will need many more years to accomplish at the actual rate. Wepropose here a method allowing for a faster and reproducible threat prediction for the360,000+ known species of plants. Threat probabilities are estimated for each knownplant species through the analysis of the data from the complete digitization of the largestherbarium in the world using machine learning algorithms, allowing for a major break-through in biodiversity conservation assessments worldwide. First, the full scientific namesfrom Paris herbarium database were matched against all the names from the internationalplant list using a text mining open source search engine called Terrier. The 6+ millions ofrecords represent 167,355 species level accepted names, i.e. 47% of a total of 356,106known vascular plants. A series of statistics related to the accepted names of each plant
12

were computed and served as predictors in a statistical learning model with a binaryoutput: ·Least Concern· (LC) versus ·not Least Concern·. The training data containedthe 15,824 usable entries from the International Union for Conservation of Nature globalRedlisting plants assessments. Random uniform forests were selected for their ability todeal with numerous missing values, the included estimation of the generalization errorand tuning parameters default settings robustness. For each accepted name, the proba-bility to be LC was estimated with a confidence interval and a global misclassification rateof 20%. Results are presented on the world map and according to different plant traits.
Co-authors:Jessica Tressou and Thomas Haevermans, MNHN, France.
Keywords: Statistical learning, Classification, Ecology, Big data.
13. Invited Talk Session: 21
Rich Data at Farmers EdgePresenting Author: Bengtson, Jacob.Institution: Farmers Edge, Canada.
Abstract:
An unfortunate truth: only 20% of a data scientist’s time is spent modelling, the other 80%is spent acquiring, cleaning, understanding, and combining data. However, if you wereto search for tutorials on how to do data science, you would find that most of them arefocused on the modelling phase (i.e. model selection, model tuning, variable selection,etc.). While this is certainly the more appealing aspect of data science, it has been ourexperience that this isn’t where most of a model’s accuracy comes from. We have ob-served that some of the greatest accuracy gains in predictive agricultural models are theresults of using rich (accurate, large, and diverse) data to generate unique and powerfulfeatures.At Farmers Edge, we combine field-centric data from soil samples, crop genetics, fieldmanagement information, weather stations, daily satellite imagery, and agronomy exper-tise, as well as regional data from external sources to create our model features. This hasbeen an especial benefit to our work in crop yield prediction. In this presentation, I willuse our crop yield prediction project to illustrate how our focus on the less appealing 80%of data science has contributed to the accuracy of our predictive agricultural models.
Keywords: Data Science, Big Data, Predictive Modelling.
14. Invited Talk Session: 20
Sampling Regimes for Dynamic ModelsPresenting Author: Boone, Edward.Institution: Virginia Commonwealth University, USA.
13
Abstract:
Complex dynamic models have been developed by mathematicians for decades to modelvarious phenomena. Systems of ordinary differential equations and partial differentialequations are typical modeling paradigms [1]. Historically, these models have been toocomplex to allow for even simple fitting routines to be employed. Due to increases incomputational speeds these models have been able to be fit to real world data and in-ferences drawn from these models [2]. In cases where high frequency sampling is beingused the data generated from the underlying processes clearly exhibit the dynamics thatresearchers desire to model. However, in many studies it is very difficult to sample athigh frequency due to costs associated with sampling. For example, in many ecologicalstudies remote sites must be visited to determine the species distribution. In this case,a single sample may take several days and a research team to collect. In this work weexplore the sampling frequency needed to accurately estimate the model parameters. Wealso consider using a sequential approach to determine the sampling frequency for futuresamples in order to improve parameter estimation accuracy. This will be demonstratedusing a simple predatory-prey model motivated by an ecological study in Australia.
References:
[1] Strogatz, S.H. (2015). Nonlinear dynamics and chaos : with applications to physics, biology, chemistry, and engi-neering. Boulder, CO :Westview Press, a member of the Perseus Books Group,
[2] Coelho F.C., Codeco C.T., Gomes M.G.M (2011) A Bayesian Framework for Parameter Estimation in DynamicalModels. PLoS ONE 6(5): e19616. https://doi.org/10.1371/journal.pone.0019616.
Co-authors:Rebecca Bergee, Virginia Commonwealth University, Richmond, VA, USA.Ben Stewart-Koster, Griffith University, Nathan, QLD, Australia.
Keywords: Sampling Design, Parameter Estimation, Dynamic Models, Sequential Sam-pling.
15. Invited Talk Session: 14
Hierarchical Models with Conditionally Conjugate Full-conditional Distributions forDependent Data From the Natural Exponential FamilyPresenting Author: Bradley, Jonathan.Institution: Florida State University, USA.
Abstract:
We introduce a Bayesian approach for analyzing (possibly) high-dimensional dependentdata that are distributed according to a member from the natural exponential family ofdistributions. This problem requires extensive methodological advancements, as jointlymodeling high-dimensional dependent data leads to the so-called “big n problem”. Thecomputational complexity of the “big n problem” is further exacerbated when allowing fornon-Gaussian data models, as is the case here. Thus, we develop new computation-ally efficient distribution theory for this setting. In particular, we introduce something we
14
call the “conjugate multivariate distribution”, which is motivated by the univariate distri-bution introduced in Diaconis and Ylvisaker (1979). Furthermore, we provide substantialtheoretical and methodological development including: results regarding conditional dis-tributions, an asymptotic relationship with the multivariate normal distribution, conjugateprior distributions, and full-conditional distributions for a Gibbs sampler. We demonstratethe proposed methodology through simulated examples and real-data analyses, includingapplication to environmental data obtained using the moderate resolution imaging spec-troradiometer.
Keywords: exponential family, high-dimensional, dependent data, conjugate multivariatedistribution.
16. Invited Talk Session: 3
Spatio-temporal Modeling of Risk to Environmental Hazards: Approaches, Exam-ples and ChallengesPresenting Author: Bravo de Guenni, Lelys Isaura.Institution: Northern Illinois University and Universidad Simon Bolıvar, USA and Venezuela.
Abstract:
Risk estimation to environmental hazards is a multidimensional problem encompassingseveral factors. It is the conjunction of the magnitude and probability of occurrence of apotentially damaging phenomenon with the widespread damage inflicted to exposed pop-ulations, ecosystems or infrastructure, usually measured from past events. The degree ofdamage normally depends on the exposed population, infrastructure and socio-economicconditions, which shape the human vulnerability as an intrinsic condition going beyondthe environmental hazard itself. Risk definition has taken several tints, depending on thedifferent application fields in social sciences, environmental sciences or finance. In theclimate context, according to [1], risk can be defined as the expected losses (of lives,persons injured, property damaged, and economic activity disrupted) due to a particu-lar hazard for a given area and reference period. In this presentation we discuss theimplementation of this concept through different applications. In this implementation wepropose an integrated framework which combines hazard probabilistic occurrence, expo-sure and vulnerability as the essential ingredients for risk configuration. We proposed aBayesian approach for the spatial-temporal estimation of risk and discuss the challengesassociated in the risk estimation process.
References:
[1] Downing, E. T., Olsthoorn, A. J. and Tol, R. S.J. (Eds). Climate, Change and Risk. Routledge, London. pp. 408.
Keywords: Hazard, Risk, Vulnerability, Bayesian approach.
17. Invited Talk Session: 15
15
Ground-level Particulate Matter Mass and Component Observation Imputation andCorrection Using Remote-sensingPresenting Author: Burr, Wesley.Institution: Trent University, Canada.
Abstract:
A country-wide Canadian study on the interactions between particulate matter and hu-man health effects is currently ongoing under the guidance and funding of Health Canadaand Environment and Climate Change Canada. As part of this study, we are imputingand error-correcting a large-scale database of hourly, daily, and monthly particulate mat-ter concentration measurements. In this talk we will discuss the use of remote sensingconcentration observations (satellite) as baseline and comparison observations for theimputation and correction of ground-level particulate matter mass and component obser-vations. The differing time and geographic scales for observation make this an interestingtime series and spectrum estimation problem, with a number of powerful applications.
Co-authors:Hwashin H. Shin, EHSRB, Health Canada, Ottawa, and Dept. of Mathematics & Statistics,Queen’s University, Canada.
Keywords: TIES2018, time series, particulate matter, remote sensing, imputation, inter-polation.
18. Invited Talk Session: 4
Local Likelihood Estimation of Complex Tail Dependence Structures, Applied toU.S. Precipitation ExtremesPresenting Author: Castro-Camilo, Daniela.Institution: King Abdullah University of Science and Technology, Saudi Arabia.
Abstract:
In order to model the complex non-stationary dependence structure of precipitation ex-tremes over the entire contiguous U.S., we propose a flexible local approach based onfactor copula models. Our sub-asymptotic spatial modeling framework yields non-trivialtail dependence structures, with a weakening dependence strength as events becomemore extreme, a feature commonly observed with precipitation data but not accounted forin classical asymptotic extreme-value models. To estimate the local extremal behavior, wefit the proposed model in small regional neighborhoods to high threshold exceedances,under the assumption of local stationarity. This allows us to gain in flexibility, while makinginference for such a large and complex dataset feasible. Adopting a local censored likeli-hood approach, inference is made on a fine spatial grid, and local estimation is performedtaking advantage of distributed computing resources and of the embarrassingly parallelnature of this estimation procedure. The local model is efficiently fitted at all grid points,and uncertainty is measured using a block bootstrap procedure. An extensive simula-tion study shows that our approach is able to adequately capture complex, non-stationary
16
dependencies, while our study of U.S. winter precipitation data reveals interesting differ-ences in local tail structures over space, which has important implications on regional riskassessment of extreme precipitation events.
Co-authors:Raphael Huser, King Abdullah University of Science and Technology, Saudi Arabia.
Keywords: Factor copula model, local likelihood, non-stationarity, spatial extremes, thresh-old exceedances.
19. Invited Talk Session: 22
Statistical Projections of Future Environmental Risks and Their Health Impacts Un-der a Changing ClimatePresenting Author: Chang, Howard.Institution: Emory University, USA.
Abstract:
Global climate change affects human health most notably by increasing the frequencyand intensity of dangerous heat waves, wildfires and hurricanes. In addition to extremeweather events, climate change can also lead to a myriad of persistent environmentalchanges that impact public health. Health impact assessment refers to the analytic frame-work for evaluating how a policy or program affects population health. It is frequently ap-plied in climate and public health research to quantify future health and economic burdensattributable to various consequences of climate change. Performing health impact assess-ment entails the integration of various data. For projecting future climate-related healthimpacts, analyses require three sources of information: (1) health effects of environmen-tal exposures, (2) projections of future exposures, and (3) distributions of exposures andeffects in the future population. Each information source is subject to uncertainty becauseof data availability and assumptions made for the future. Climate research is highly inter-disciplinary, bringing together tremendous amount of data, theory, and modeling efforts toprovide timely knowledge for one of the most pressing issues of our time. Statistical mod-eling techniques and probabilistic reasoning can plan an important role in ensuring thesefindings are informative, accurate, and reproducible. This presentation will discuss recentdevelopment in statistical methods for quantifying health impacts of climate change, aswell as related open problems in environmental epidemiology and exposure assessment.
Keywords: heat wave, air pollution, health impact, projection, climate change.
20. Invited Talk Session: 14
Extracting Consensus Estimates of Precipitation From Diverse Data Sources inHigh Mountain AsiaPresenting Author: Christensen, William F.Institution: Brigham Young University, USA.
17
Abstract:
With the exception of the earth·s polar regions, the High Mountain Asia region (includ-ing the Tibetan Plateau) contains more of the world·s perennial glaciers than any other.Sometimes called the “third pole” because of its massive storage of ice, High MountainAsia (HMA) provides water to one-fifth of the world·s population. Due to changes in pre-cipitation patterns and temperatures warming faster in HMA than the global average, theregion faces increased risk of flooding, crop damage, mudslides, economic instability, andlong-term water shortages for the communities down-river. In this talk, we discuss a large,interdisciplinary, multi-institutional research project for characterizing climate change inHMA. We illustrate the use of latent variable models for extracting consensus estimatesof spatiotemporally-correlated climate processes from a suite of climate model outputsand remote-sensing observations, and we discuss the uncertainty quantification neededto inform probability-based decision making.
Co-authors:C. Shane Reese, Michael F. Christensen and Brenton Mabey, Brigham Young University,USA.Summer Rupper, University of Utah, USA.
Keywords: Bayesian hierarchical modeling, latent variable modeling, factor analysis,glacier.
21. Invited Talk Session: 2
Addressing Geographic Confounding Through Spatial Propensity Score MatchingPresenting Author: Davis, Melanie.Institution: Ralph H. Johnson VAMC, Charleston, USA.
Abstract:
We introduce a spatial propensity score matching method to account for “geographic con-founding”, which occurs when observed or unobserved confounding factors vary by ge-ographic region. We augment the propensity score and outcome models with spatialrandom effects, which are assigned conditionally autoregressive priors to improve infer-ences by borrowing information across neighboring geographic regions. Through a seriesof simulation studies, we show that incorporating spatial information into the propensityscore analysis improves inferences. We also apply the method to two case studies. Inthe first case study, we examine racial disparities in specialty care among type 2 diabeticveterans. We construct multiple global estimates of the risk difference: an unadjustedestimate, an estimate based solely on patient-level matching, and an estimate that in-corporates both patient and spatial information. The unadjusted estimate suggests thatspecialty care is more prevalent among non-Hispanic blacks, while patient-level matchingindicates that it is less prevalent. Hierarchical spatial matching supports the latter conclu-sion, with a further increase in the magnitude of the disparity. In the second case study,we examine disparities in hospital stays by applying a spatial negative binomial hurdlemodel to a spatially matched sample of veterans. Results indicate that non-Hispanic black
18
veterans with type 2 diabetes have a lower risk of hospital admission and a greater num-ber of inpatient days. Overall, these results emphasize the need to address geographicconfounding in health disparity studies.
Co-authors:Brian Neelon, Medical University of South Carolina, Charleston, USA.
Keywords: Causal inference, geographic confounding, health disparities, propensity scorematching.
22. Invited Talk Session: 19
Models for Geostatistical Binary Data: Properties and ConnectionsPresenting Author: De Oliveira, Victor.Institution: Department of Management Science and Statistics, The University of Texasat San Antonio, USA.
Abstract:
This talk explores models for geostatistical data for situations in which the region wherethe phenomenon of interest varies is partitioned into two disjoint subregions. This is calleda binary map. The goals are threefold. First, a review is provided of the classes of modelsthat have been proposed so far in the literature for geostatistical binary data as well as adescription of their main features. A problems with the use of moment–based models ispointed out. Second, a generalization is provided of the clipped Gaussian random fieldthat eases regression function modeling, interpretation of the regression parameters, andestablishing connections with other models. The second–order properties of this modelare studied in some detail. Finally, connections between the aforementioned classes ofmodels are established, showing that some of these are reformulations (reparametriza-tions) of the other classes of models.
Keywords: Clipped Gaussian random field, Gaussian copula model, Generalized linearmixed model, Indicator kriging, Probit model.
23. Invited Talk Session: 10
Spatial Individual Level Infectious Disease Models Incorporating Aggregate LevelSpatial StructurePresenting Author: Deardon, Rob.Institution: University of Calgary, Canada.
Abstract:
Numerous examples exist of infectious disease models that incorporate spatial distanceand other covariates at the individual level. This has been most noticeable perhaps in agri-cultural case studies such as the UK 2001 foot and mouth disease epidemic. However,
19

both in agriculture and public health, many salient covariates that display spatial structureare collected at a regional level. Here, we extend individual level infectious disease mod-els of the type proposed by [1] to incorporate such spatially structured regional/aggregatelevel information. This is done primarily within the context of influenza data from Calgary,Alberta. We discuss issues of both inference and computation.
References:
[1] Deardon, R., Brooks, S., Grenfell, B., Keeling, M., Tildesley, M., Savill, N., Shaw, D., Woolhouse, M. 2010. Inferencefor individual-level models of infectious diseases in large populations. Statistica Sinica, 20:239-261.
Keywords: infectious diseases, transmission models, disease mapping, individual levelcovariates, aggregate level covariates, MCMC, spatial modeling.
24. Invited Talk Session: 23
Urban Green Spaces and HypertensionPresenting Author: Dey, Tanujit.Institution: Cleveland Clinic, USA.
Abstract:
Urban green spaces are known to have protective effect on human health. However, datafrom low and middle-income settings on the relationship between urban greenness andchronic conditions such as hypertension are lacking. We decided to investigate the as-sociation between urban green spaces and hypertension prevalence in a mega city fromSouth Asian region. Data set comprises of more than 2,000 individuals aged 20 years andabove. Both Bayesian and frequentist approaches are used to establish the relationshipbetween hypertension and the green spaces while adjusted for several biomarkers andsocio-economic variables.
Co-authors:Safraj Shahul Hameed, Mohammad Tayyab, Roopa Shivashankar, Shifalika Goenka, Va-madevan S. Ajay and Dorairaj Prabhakaran,Centre for Chronic Disease Control and Pub-lic Health Foundation of India, India.Mohammed K. Ali and K, M. Venkat Narayan, Rollins School of Public Health, Emory Uni-versity, USA.Atiqur Rahman, Jamia Milia Islamia University, India.Nikhil Tandon, All India Institute of Medical Sciences, India.
Keywords: Bayesian Hierarchical model, Geographical Information System, Variable se-lection.
25. Invited Talk Session: 6
Functional Tools for Increasing the Accuracy of Biodiversity Assessment
20
Presenting Author: Di Battista, Tonio.Institution: G. d’Annunzio University of Chieti-Pescara, Italy.
Abstract:
Biodiversity is recognized as one of the most important indicators for environmental as-sessment. However, no scientific consensus has been reached about how to properlymeasure and monitor it. This is mainly due to the multivariate nature of biodiversity. Toovercome this issue, we propose a new methodological approach for monitoring biodi-versity introducing a functional approach to diversity profiles. Indeed, the latter may benaturally considered as functional data because they are expressed as functions of thespecies abundance vector in a fixed domain. Specifically, several functional tools are de-veloped such as the derivatives, the radius of curvature, the curve length, the biodiversitysurface, and the volume under the surface. Each functional tool reflects a specific aspectof biodiversity. Thus, the combined use of them provides a useful method for identifyingareas of high environmental risk, with the potential to address the monitoring of environ-mental policies. The main purpose of this research is to provide specialists and scholarswith additional tools to improve the understanding of the dynamics of biodiversity.
Co-authors:Francesca Fortuna and Fabrizio Maturo, G. d·Annunzio University of Chieti-Pescara, Italy.
Keywords: FDA, diversity profile, functional tools.
26. Invited Talk Session: 8
Generalization of Block Models for Multipartite Networks. Application in EcologyPresenting Author: Donnet, Sophie.Institution: INRA, France.
Abstract:
Modeling relations between individuals is a classical question in social sciences, ecology,etc. In order to uncover a latent structure in the data, a popular appraoch consists in clus-tering individuals according to the observed patterns of interactions. To do so, Stochasticblock models (SBM) and Latent Block models (LBM) are standard tools for grouping theindividuals with respect to their comportment in a unique network. However, in an ecosys-temic approach, agents are not involved in a unique but in several networks, resulting intoa complexe multipartite network. We propose an extension of the LBM and SBM ableto handle a collection of networks sharing commun vertices/individuals, thus obtaining aclustering of the agents based on their connextion behavior in more than one network. Wepropose to estimate the parameters ·such as the marginal probabilities of assignment togroups (blocks) and the matrix of probabilities of connections between groups· through avariational Expectation-Maximization procedure. The number of groups is chosen thanksto the Integrated Completed Likelihood criterion, a penalized likelihood criterion. The per-tinence of our methodology is illustrated on two datasets, respectively issued from ecologyand ethnobiology.
21
Co-authors:Avner Bar-Hen, CNAM, France.Pierre Barbillon, Agroparistech, France.
Keywords: Latent block models, Stochastic Block Models, Variational EM, Ecology.
27. Invited Talk Session: 9
Spatial Temporal Modelling of Precipitation DataPresenting Author: El-Shaarawi, Abdel Hamid.Institution: Department of Statistics, Cairo University.National Water Research Institute, Burlington, Canada.
Abstract:
Inferences about the quantity and quality of precipitation falling over a region of interest,and during a specified time interval, are critical for environmental policy decision-making.In this paper, I will discuss two examples. The first is acid rain in Canada, which willexamine factors relating to quality of precipitation and the impact on aquatic life. Thesecond is precipitation in Africa, which will be concerned with quantity and impact on theenvironment and human use. These examples will be used to demonstrate the effectiverole of modelling in developing appropriate scenarios to manage the impact of acid rainin Canada and flooding and drought in Africa.
Keywords: Water Quality, Water Quantity, Acid Rain, Droughts, Gamma spatial temporalprocess.
28. Invited Talk Session: 24
Association Rule Learning for Species Co-ocurrence AnalysisPresenting Author: Equihua, Julian.Institution: Comision Nacional para el Conocimiento y Uso de la Biodiversidad (CONABIO),Mexico.
Abstract:
Data mining has proven to be wildly successful for extracting patterns from diverse datasets, especially in the realm of business intelligence. We will explore the potential of asso-ciation rule mining [1] on georeferenced species presence-only data for studying spatialco-ocurrence of fauna. First we develop the concept of spatial transactions to extendclassical association rule learning and market basket analysis to their spatial versions.As a case study we use these techniques on the National System for Information on Bio-diversity (SNIB, acronym in spanish) which comprises 10 million species presence-onlyobservations in Mexico. Of which around 7 million are validly georeferenced.We show that spatial association rule learning and spatial market basket analysis can beused to rapidly assess species co-occurrence relations at different spatial scales. Since
22
these relations are data driven some can be surprising to experts and may allow furtherexploration of unsuspected ecological relationships. Additionally, association rule learn-ing is considered as part of unsupervised learning but may be used under a supervisedframework to predict species occurrence. We show that spatial association rule learningmay be used to produce potential distribution maps for a species of interest based on theoccurrence of other species.
References:
[1] Agrawal, R.; Imieli·ski, T.; Swami, A. (1993). ”Mining association rules between sets of items in large databases”.Proceedings of the 1993 ACM SIGMOD international conference on Management of data - SIGMOD ’93. p. 207.
Co-authors:Michael Schmidt and Raul Sierra, CONABIO, Mexico.
Keywords: Association rule learning, Spatial data mining, Species co-occurence, Biodi-versity.
29. Invited Talk Session: 9
Changes in the Water Cycle: the Quantity - Quality LinkPresenting Author: Esterby, Sylvia.Institution: University of British Columbia Okanagan, Canada.
Abstract:
It is generally accepted that global warming and change of the hydrological cycle canbe expected to cause an increase in extreme climate events. This together with land usechange will result in more severe flooding, drought, and water quality degradation which inturn will impact aquatic ecosystems, water infrastructure, people and property. Historicalrecords of water quantity and quality can be used to determine the characteristics of thewater quantity or quality record appropriate to help answer a particular question. Forexample, modelling of average levels may be less relevant than modelling extremes, timeof occurrence or duration. Further, water quality is affected by changes in water level anddischarge. Statistical modelling of discharge, lake levels, and water quality parametershave been conducted using historical data from several Canadian sites. Temporal modelswhich account for components such as seasonal cycle and trends have been used.
Keywords: Water quality, discharge, lake level, temporal models, seasonality, extremes.
30. Invited Talk Session: 10
Bernoulli Vector Autoregressive Model with Applications to Spatio-temporal DroughtEvents in MexicoPresenting Author: Euan Campos, Carolina.Institution: King Abdullah University of Science and Technology, Saudi Arabia.
23
Abstract:
Categorical time series appear in many fields such as biology, industry, stocks marketsand environmental sciences. Even for univariate binary time series, the analysis is usu-ally more challenging than time series analysis for continuous variables. In a multivariatesetting, modeling the dynamics in multiple binary time series is not an easy task. Most ex-isting methods model the joint transition probabilities from marginals pairwisely. However,the resulting cross-dependency may not be flexible enough. In this paper, we propose avector autoregressive (VAR) model for multivariate binary time series. The model is con-structed by latent multivariate Bernoulli random vectors. The Bernoulli VAR model rep-resents the instantaneous dependency between components via latent processes, andthe autoregressive structure represents a switching between the hidden vectors depend-ing on the past. Our proposed model provides an intuitive interpretation when analyzingreal data sets. We derive the mean and matrix-valued autocovariance function for theBernoulli VAR model analytically and develop a Likelihood-based inference. Finally, we fitour model to the drought events from different regions in Mexico.
Co-authors:Ying Sun, King Abdullah University of Science and Technology, Saudi Arabia.
Keywords: Multivariate binary time series, Multivariate bernoulli, Categorical correlatedprocesses, Dependence vectors.
31. Invited Talk Session: 1
Investigation of Multi-pollutant Model Results in the Presence of Measurement Er-ror: a Simulation StudyPresenting Author: Evangelopoulos, Dimitris.Institution: King’s College London, UK.
Abstract:
Introduction: The presence of exposure measurement error is a limitation in environ-mental epidemiology. Although, there is an increasing interest in developing methodologyto address it, the gap between theory and practice is substantial. Biased estimates andeffect transfer are some issues that should be considered in an exposure-health outcomeassociation analysis, especially in the interpretation of multi-pollutant models [1]. We con-ducted a simulation study to assess and quantify these issues when estimating the effectsof PM2.5 and NO2.
Methods: A systematic review on the differences between ambient concentrations andpersonal exposures was conducted to understand the error structures of the pollutants.Because of their different properties (e.g. sources, propagation), we characterised thetype of errors as mixture of classical and Berkson but in different proportions for eachpollutant [2, 3]. Hypothetical ”true” concentrations were created and error was added
24

to create the apparent exposures. An all-cause mortality outcome was generated andmulti-pollutant Poisson models were fitted.
Results: Review results show that NO2 error is greater and more variant than PM2.5.Heterogeneity was observed based on the area, climate and participants’ age. Simulationresults indicate underestimation of the effects estimates that ranges (45-100%) dependingon the assumed settings of a hypothetical study, i.e. pollutant, area of study, magnitudeof error etc. Greater bias was observed when North America was the area of study,compared to Europe, and when the error variance was relatively high.
Conclusions: Our aim is to quantify the consequences of measurement error in air-pollution epidemiology and adjust for it to get improved health effect estimates. We usedplausible values for the simulation input variables and observed large underestimation ofthe mortality estimates when error-prone exposures were used. It is of great importanceto encourage future researchers to account for exposure misclassification for health im-pact assessment and policy making.
References:
[1] Dionisio, K. L., Baxter, L. K., & Chang, H. H. (2014). An empirical assessment of exposure measurement error andeffect attenuation in bipollutant epidemiologic models. Environmental health perspectives, 122(11), 1216.
[2] Carroll, R. J., Ruppert, D., Crainiceanu, C. M. & Stefanski, L. A. (2006). Measurement error in nonlinear models: amodern perspective.Chapman and Hall/CRC.
[3] Zeger, S. L., Thomas, D., Dominici, F., Samet, J. M., Schwartz, J., Dockery, D., & Cohen, A. (2000). Exposuremeasurement error in time-series studies of air pollution: concepts and consequences. Environmental healthperspectives, 108(5), 419.
Co-authors:Klea Katsouyanni and Heather Walton, King’s College London, UK .
Keywords: measurement error, misclassification, air pollution, personal exposure, multi-pollutant models, PM2.5, NO2, simulations.
32. Invited Talk Session: 11
Functional Spatio-temporal Modelling of Atmospheric Observation GapsPresenting Author: Fasso, Alessandro.Institution: University of Bergamo, Italy.
Abstract:
Statistical analysis of atmospheric profiles and their uncertainty may be conveniently de-veloped using methods for functional data analysis, [2, 3].This talk considers geographic gaps of the global radiosonde monitoring network providedby RAwinsonde OBservation program (www.raob.com). In particular, an observationalgap is defined as a 3D atmospheric region where the spatial prediction uncertainty is
25
high. To do this global bi-daily radiosonde profiles are modelled as a spatiotemporalprocess with functional values, and a functional kriging variance is used to identify thegaps. Adaptation of maximum likelihood for large data sets is obtained by a functionalextension of D-STEM package for spatiotemporal modelling based on the EM algorithm,[1].Since the variability of temperature and humidity is largely influenced by atmosphericvariability, the above approach is applied to the observation error, which is here giventhe difference between RAOB observation and a background proxy (O-B). In particular asbackground, the ERA-interim data provided by ECMWF are used.
References:
[1] Finazzi, F.and Fasso, A. 2014. D-STEM: A Software for the Analysis and Mapping of Environmental Space-TimeVariables. Journal of Statistical Software 62 (6), 1-29.
[2] Fasso, A., Ignaccolo, R., Madonna, F., Demoz, B. and Franco-Villoria M. 2014. Statistical modelling of collocationuncertainty in atmospheric thermodynamic profiles. Atmos. Meas. Tech. 7, 1803–1816.
[3] Ignaccolo, R., Franco-Villoria, M., Fasso, A. 2015. Modelling collocation uncertainty of 3D atmospheric profiles.Stochastic Environmental Research and Risk Assessment 29 (2), 417-429.
Keywords: Atmospheric profiles, EM algorithm, functional kriging.
33. Invited Talk Session: 16
Heterogeneous Forest Composition Responses to Temporal Environmental Changesin West-central MexicoPresenting Author: Figueroa Rangel, Blanca Lorena.Institution: University of Guadalajara, Mexico.
Abstract:
Mountain forests, created by a particular geological and climatic history in the Ameri-cas, represent one of the most distinctive ecosystems in the tropics. Mexico, due to itsgeographical location between the convergence of temperate and tropical elements, aswell as its diverse physiography and climate, contains ecosystems with heterogeneoustaxonomic composition as a result of environmental change along centurial to millennialscales. The long-term perspective in biodiversity conservation using palaeoecologicaland palaeoclimatological techniques are providing with crucial information for the under-standing of the temporal range and variability of ecological pattern and processes. Thisperception is contributing with means to anticipate future conditions of mountain forestecosystems, especially their response to climate change and anthropogenic disturbances.In order to discern changes in taxa diversity associated to environmental drivers, particu-larly climate change and human impact along centurial scales, we used paleoecologicaland ecological data from different forest types (cloud forest, pine forest, pine-oak forestand fir forest) along central Mexico. Sampling methods included pollen fossil, microfos-sil charcoal and geochemical proxies to reconstruct past plant assemblages. Statisticalmethods involved direct ordination techniques to discern environmental drivers and in-direct ordination to discriminate similarities or dissimilarities in taxa composition along
26

the different forests. Results revealed that, even when both climate change and anthro-pogenic activities have influenced vegetation along the last 1300 years, pine as well ascloud forest were very resilient; pine forest taxonomic composition has remained similarover hundreds of years, while cloud forest contracted during dry episodes, mostly in theLittle Ice Age (1350-1850). Ordination revealed that altitude was the main driver affectingdifferences in pollen taxonomic composition among the forests under study.
34. Invited Talk Session: 20
Multivariate Emulators for City-level Air Quality ManagementPresenting Author: Finazzi, Francesco.Institution: University of Bergamo, Italy.
Abstract:
Directive 2008/50/EC of the European Union regulates air quality in terms of pollutantconcentration thresholds not to be exceeded at relevant monitoring sites. In order to un-derstand what drives pollutant concentrations and to predict probabilities of compliance,environment protection agencies often make use of physical models called simulators.Given a set of drivers such as emissions and meteorological conditions, simulators areable to predict pollutant concentrations across space and over time. Due to the com-plexity of the physical model, however, the computational burden is usually high. In thiswork, we present an emulator which aims at replacing the simulator when probabilities ofcompliance at the monitoring sites are to be computed and when actions able to reducethe observed pollutant concentrations are to be defined. Extending the work in [1], theemulator is based on a multivariate spatial model able to handle missing data and it isimplemented within the D-STEM software [2]. The spatial model is estimated using thesimulator output obtained on the basis of a design of experiment. As a case study, resultsfor the city of Aberdeen (UK) are provided. In particular, it is shown how the emulator isused to directly estimate annual averages of pollutant concentrations under different sce-narios, without estimating the hourly time series given as output by the physical model.
References:
[1] Fricker, T.E., Oakley, J.E. and Urban N.M. 2013. Multivariate gaussian process emulators with nonseparable co-variance structures. Technometrics 55:47–56.
[2] Finazzi, F. and Fass·, A. 2014. D-STEM: a software for the analysis and mapping of environmental space-timevariables. Journal of Statistical Software 62:1–29.
Co-authors:Yoana Borisova, Univeristy of Glasgow, UK.Marian E. Scott, Univeristy of Glasgow, UK.Alan Hills, Scottish Environment Protection Agency, UK.Michela Cameletti, University of Bergamo, Italy.
Keywords: space-time models, atmospheric dispersion modelling, EM algorithm, DOE.
27
35. Invited Talk Session: 1
A Bayesian Space-time Model to Integrate Spatially Misaligned Air Pollution DataPresenting Author: Forlani, Chiara.Institution: Imperial College London, UK.
Abstract:
In air pollution studies, dispersion models are exploited to obtain estimates of concentra-tion at a grid level covering the entire spatial domain. Given that these estimates comefrom a model, they are then calibrated against measurements from monitoring stations.However, these different data sources are often misaligned in space and time. If misalign-ment is not considered, it can bias the results from the statistical inference.We aim at providing a comprehensive study which demonstrates how the combinationof multiple data sources such as dispersion model outputs and ground observations, in-cluding covariates as well, provides more accurate predictions of air pollution at the gridlevel. We consider NO2 concentration in Greater London, for the years 2007-2011, andcombine two different dispersion models, the Air Quality Unified Model (AQUM) and thePollution Climate Mapping (PCM) model. Different sets of fixed and random effects areadded to the formula in order to select the best model.Our proposed model is framed within calibration techniques for data fusion, but unlikethe other examples present in the literature, we take advantage of the Integrated NestedLaplace Approximation (INLA) and the Stochastic Partial Differential Equation (SPDE) ap-proach to jointly model the response (concentration level at monitoring stations) and thedispersion model outputs on different scales, accounting for different sources of uncer-tainty.Our spatio-temporal model allows us to reconstruct the latent fields of each model com-ponent, as well as to predict daily maps of pollution concentrations. We compare the pre-dictive capability of our proposed model with non-model-based approaches (e.g. bilinearinterpolation to align the covariates), showing that the joint model is the best alternative.
Co-authors:Marta Blangiardo, Imperial College London, UK.Michela Cameletti, Universita degli Studi di Bergamo, Italy.
Keywords: Air pollution, Bayesian model, INLA, Misalignment, NO2, SPDE.
36. Invited Talk Session: 18
Can We Weather Proof Our Insurance?Presenting Author: Gel, Yulia.Institution: University of Texas at Dallas, USA.
Abstract:
Last few years were particularly volatile for the insurance industry in North America andEurope, bringing a record number of claims due to severe weather. According to the 2013
28
World Bank study, annual average losses from natural disasters have increased from $50billion in the 1980s to about $200 billion nowadays. Adaptation to such changes requiresearly recognition of vulnerable areas and the extent of the future risk due to weather fac-tors. Despite the well documented impact of climate change on the insurance sector, thereexists a relatively limited number of studies addressing the effect of the so-called “nor-mal” extreme weather (i.e., higher frequency, lower individual but high cumulative impactevents) on the insurance dynamics. To reduce financial repercussions of such weatherevents, we develop a nonlinear attribution analysis of integer-valued insurance claimsand atmospheric variables [1]. Using data-driven nonparametric procedures, we identifytriggering thresholds, or tipping points, leading to an increase in number of claims. Wedevelop a new data-adaptive method to compare tails of observed and projected weathervariables, and employ its outcomes to assess future dynamics of insurance claims. Weillustrate our approach by application to modeling and forecasting of flood-related houseinsurance claims in Norway.
References:
[1] Lyubchich, V., Gel, Y.R. Can we weather proof our insurance? Environmetrics 28(2), 30–39..
Co-authors:Vyacheslav Lyubchich, University of Maryland Center for Environmental Science, USA.
Keywords: Climate change; climate adaptation; distribution tail; severe weather; weatherdamage.
37. Invited Talk Session: 12
Non-stationary Spatiotemporal Bayesian Data Fusion Model for Pollutants in theNear-road EnvironmentPresenting Author: Gilani, Owais.Institution: Bucknell University, USA.
Abstract:
Accurate maps of pollutants’ concentrations on a fine spatial and temporal resolution,particularly within the near-road environment, are important for regulatory purposes andfor assigning exposure to subjects in epidemiologic studies. However, due to practical andmonetary limitations, good quality data on concentrations of pollutants on a dense spatialand temporal scale are generally not available. Therefore, there is growing interest inutilizing outputs from deterministic computer models, such as the CMAQ model, to provideestimates of pollutant concentrations on a large spatial domain and on a dense temporalresolution. However, these models often have systematic biases associated with themdue to simplifications of the complex atmospheric processes and uncertain model inputs,and therefore need to be calibrated in space and time. To address the joint goals ofcalibrating numerical model outputs and providing more accurate predictions of pollutantsat unsampled locations, various statistical modeling techniques have been developed.These models can be classified into two general categories: regression-based approach,and joint modeling or data fusion approach.
29

Recent studies suggest that the adverse health impacts of exposure to traffic-related pol-lutants are greater when the exposure occurs closer to major roads and highways as com-pared to background levels of pollutants. A particular challenge presented when modelingpollutant concentrations in the near-road environment is of non-stationarity. Specifically,the residual correlation between pollutant concentrations at sites across major highwaysin an urban setting might be dependent on local characteristics, such as wind speedand direction. In this talk, we present a non-stationary spatiotemporal data fusion modelfor two traffic related air pollutants, nitrogen oxide (NOx) and particulate matter (PM2.5),in a near-road environment. The model is used to calibrate output from a dispersionmodel (RLINE) and to provide predictions at unsampled locations while capturing non-stationarity using a recently developed method that includes covariates in the covariancefunction.
Co-authors:Veronica Berrocal and Stuart Batterman, University of Michigan , USA.
Keywords: Non-stationary, near-road environment, nitrogen oxides, particulate matter,RLINE model output, covariates in covariance function, mobile air pollution lab.
38. Invited Talk Session: 13
Forecast Verification for Solar Power ForecastsPresenting Author: Gilleland, Eric.Institution: National Center for Atmospheric Research, USA.
Abstract:
Solar power forecasting is dependent on many aspects of weather, such as radiation,cloud amount, precipitation, dust. Therefore, while it is important to verify power forecasts,it is also important to verify the underlying weather forecasts in order to better diagnoseproblems that may arise, and potentially identify sources of error. This presentation willreview verification methods that have been employed in this setting in the past, and iden-tify additional techniques that could improve information about forecast performance withthe aim of aiding users in the solar power realm.
Keywords: Solar power forecast verification, TIES2018, comparative forecast verifica-tion.
39. Invited Talk Session: 21
Deep Reinforcement Learning As a Precision Agriculture Tool in Wheat FarmingPresenting Author: Gopaluni, Bhushan.Institution: University of British Columbia, Canada.
Abstract:
30
An important aspect of precision agriculture as an alternative farming technology is tominimize the use of chemicals to mitigate their eventual impact on the environment andhuman health. Canada is one of the largest producers of wheat in the world. Severalfarms in Canada are already using some form of precision agricultural technology to pro-duce highly nutrient crops for consumption within the country and internationally. Thequality of the wheat crop depends on a variety of factors that include the weather (solarradiation, temperature, etc.) and the soil composition (amount of water, nitrogen and othernutrients at a particular location). We call these factors inputs to the farm. The relationshipbetween these inputs and the eventual quality of the crop is highly nonlinear, uncertainand extremely difficult to quantify or model. In this study, we develop a novel farmingstrategy using a machine learning technique called Deep Reinforcement Learning (DRL).DRL is an iterative learning algorithm that allows an external controller to interact withthe farm and determine the optimal inputs to produce wheat crop with a desired quantityat the required quality. This algorithm does not require an explicit quantitative model butinstead it iteratively learns the impact of inputs on the crop quality. The DRL algorithmis modified to treat the quality of the crop as an objective function that is maximized byappropriately manipulating the soil composition of water, nitrogen, and phosphorus. Theradiation and temperature on the farm are treated as external constraints over which wehave no control. The wheat growth and development are simulated using the “wheat mod-ule” in a well-known simulation package called APSIM. The simulations are conducted fora period of a year. The DRL algorithm is implemented using Python code.
Co-authors:Seoeun Kim, University of British Columbia, Canada.
Keywords: Precision agriculture, Canadian wheat, Reinforcement Learning, Deep Q-Learning.
40. Invited Talk Session: 22
Multivariate Spectral Downscaling for Multiple Air PollutantsPresenting Author: Guan, Yawen.Institution: SAMSI, USA.
Abstract:
Fine particulate matter (PM2.5) is a mixture of air pollutants that, at a high concentrationlevel, has adverse effects on human health. The speciated fine PM have complex spatial-temporal and cross dependence structures that should be accounted for in estimating thespatial-temporal distribution of each component. Two major sources of air quality dataare used: monitoring data and the Community Multiscale Air Quality (CMAQ) model. Themonitoring stations provide fairly accurate measurements of the pollutants, however theyare sparse in space and take measurements at a coarse time resolution, typically 1-in-3or 1-in-6 days. On the other hand, the CMAQ model provides daily concentration levels ofeach component with complete spatial coverage on a grid; these model outputs, however,need to be evaluated and calibrated to the monitoring data.
31

In this talk, I will provide a brief introduction to the data and present a statistical methodto combine these two data sources for estimating speciated PM2.5 concentration. Ourmethod models the complex relationships between monitoring data and the CMAQ outputat different spatial resolutions, and we model the spatial dependence and cross depen-dence among the components of speciated PM2.5. We apply the method to compare theCMAQ model output with speciated PM 2.5 measurements in the United States in 2011.
41. Invited Talk Session: 1
A Time Dependent Bayesian Nonparametric Model for Air Quality AnalysisPresenting Author: Gutierrez, Luis.Institution: Pontificia Universidad Catolica de Chile, Chile.
Abstract:
Air quality monitoring is based on pollutants concentration levels, typically recorded inmetropolitan areas. These exhibit spatial and temporal dependence as well as season-ality trends, and their analysis demands flexible and robust statistical models. Here wepropose to model the measurements of particulate matter, composed by atmospheric car-cinogenic agents, by means of a Bayesian nonparametric dynamic model which accom-modates the dependence structures present in the data and allows for fast and efficientposterior computation. Lead by the need to infer the probability of threshold crossingat arbitrary time points, crucial in contingency decision making, we apply the model tothe time–varying density estimation for a PM2.5 dataset collected in Santiago, Chile, andanalyze various other quantities of interest derived from the estimate.
Co-authors:Ramses H. Mena, IIMAS-UNAM, Mexico.Matteo Ruggiero, University of Torino and Collegio Carlo Alberto, Italy.
Keywords: Dirichlet process, density estimation, dependent process, stick–breaking con-struction, particulate matter.
42. Invited Talk Session: 22
The Samsi Working Group on Climate-change Detection and Attribution: an Overviewand New Modeling DirectionsPresenting Author: Hammerling, Dorit.Institution: National Center for Atmospheric Research, USA.
Abstract:
Regression-based detection and attribution methods continue to take a central role inthe study of climate change and its causes. We will discuss the activities of the SAMSIworking group on detection and attribution in general, with a focus on the development of atestbed which can be used to compare methods and the ongoing work on an extension of
32
a Bayesian hierarchical approach to this problem, which allows us to address several openmethodological questions. Specifically, we take into account the uncertainties in the truetemperature change due to imperfect measurements, the uncertainty in the true climatesignal under different forcing scenarios due to the availability of only a small number ofclimate model simulations, and the uncertainty associated with estimating the climate-variability covariance matrix. We will illustrate the methods with test cases and a realisticapplication.
43. Invited Talk Session: 9
Likelihood and Bayesian Inference for Regression Models Under Type I CensoringPresenting Author: Hassan, Hossam.Institution: Department of Mathematics, Faculty of Science, Cairo University, Egypt.
Abstract:
Exposure to toxic contaminants in the environment harm human and animal health as wellas disturb the integrity and function of the impacted ecosystem. The impact could be lo-cal, regional and global. The concentration of a toxic substance in environmental samplesfrequently recorded as non-detect either below or above detection limits or thresholds. Wediscuss inferences based on exact and modified likelihood methods and provide approx-imate Bayesian inferences for regression model under normality. We demonstrate theprocedure using Niagara River monitoring data.
Co-authors:Abdel H. El-Shaarawi, National Water Research Institute, Burlington, Ontario, Canada.Department of Mathematics, Faculty of Science, Cairo University, Egypt.
Keywords: Type I censoring, Likelihood, Modified Likelihood, Water Quality, Toxic Con-taminants, EM algorithm.
44. Invited Talk Session: 12
Mixture of Regression Models for Large Spatial Data SetsPresenting Author: Hering, Amanda.Institution: Baylor University, USA.
Abstract:
When a spatial regression model that links a response variable to a set of explanatoryvariables is desired, it is unlikely that the same regression model holds throughout thedomain when the spatial domain and dataset are both large and complex. The locationswhere the trend changes may not be known, and we present here a mixture of regres-sion models approach to identifying the locations wherein the relationship between thepredictors and the response is similar; to estimating the model within each group; and toestimating the number of groups. An EM algorithm for estimating this model is presented
33
along with a criterion for choosing the number of groups. Performance of the estimatorsand model selection is demonstrated through simulation. An example with groundwa-ter depth and associated predictors generated from a large physical model simulationdemonstrates the fit and interpretation of the proposed model.
Co-authors:Karen Kazor, Colorado School of Mines, USA.
Keywords: Markov process; Mixture of regression models; Nonstationarity; Spatial trends.
45. Invited Talk Session: 25
Estimating Precipitation Extremes Using Log-histosplinePresenting Author: Huang, Whitney.Institution: Statistical and Applied Mathematical Sciences Institute (SAMSI) and UNCChapel Hill, USA.
Abstract:
One of the commonly used approaches to modeling univariate extremes is the peaks-over-threshold (POT) method. The POT method models exceedances over a (sufficientlyhigh/low) threshold as a generalized Pareto distribution (GPD). This method requires theselection of a threshold that might affect the estimates. Here we propose an alternativemethod, the “Log-Histospline (LHSpline)”, to explore modeling the tail behavior and theremainder of the density in one step using the full range of the data. LHSpline appliesa smoothing spline model to a finely binned histogram of the log transformed data toestimate its log density. By construction, a LHSpline estimation is constrained to havepolynomial tail behavior, a feature commonly observed in daily rainfall observations. Weillustrate LHSpline method by analyzing precipitation data collected in Houston, Texas.
References:
[1] Huang, W. K., Nychka, D. W., and Zhang, H. 2018. Modeling Precipitation Extremes using Log-Histospline. arXivpreprint arXiv:1802.09387 95:5849·5856.
Co-authors:Doug Nychka, National Center for Atmospheric Research, USA.Hao Zhang, Purdue University, USA.
Keywords: Log Density; Boundary Correction; Smoothing Splines; Peaks-Over-Threshold;Extreme Precipitation.
46. Invited Talk Session: 25
Bayesian Applications in Climate Data AnalysisPresenting Author: Huang, Yen-Ning.Institution: Department of Statistics, Indiana University, USA.
34
Abstract:
The vast growth of spatiotemporal data collection has increased the need for researchersworking in environmental studies to develop efficient methodologies to perform statisticalinference. In this talk, we discuss computational challenges in Bayesian statistics andprovide an overview of recent advances in analyzing large spatiotemporal data sets. Weillustrate the use of Bayesian methods with applications to climate data.
Keywords: Spatial model, Bayesian methods, Computational statistics.
47. Invited Talk Session: 4
Penultimate Modeling of Spatial Extremes: Statistical Inference for Max-infinitelyDivisible ProcessesPresenting Author: Huser, Raphael.Institution: King Abdullah University of Science and Technology (KAUST), Saudi Arabia.
Abstract:
Extreme-value theory for stochastic processes has motivated the statistical use of max-stable models for spatial extremes. However, fitting such asymptotic models to maximaobserved over finite blocks is problematic when the asymptotic stability of the dependencedoes not prevail in finite samples. This issue is particularly serious when data are asymp-totically independent, such that the dependence strength weakens and eventually van-ishes as events become more extreme. We here aim to provide flexible sub-asymptoticmodels for spatially indexed block maxima, which more realistically account for discrep-ancies between data and asymptotic theory. We develop models pertaining to the widerclass of max-infinitely divisible processes, extending the class of max-stable processeswhile retaining dependence properties that are natural for maxima: max-id models arepositively associated, and they yield a self-consistent family of models for block maximadefined over any time unit. We propose two parametric construction principles for max-id models, emphasizing a point process-based generalized spectral representation, thatallows for asymptotic independence while keeping the max-stable extremal-t model asa special case. Parameter estimation is efficiently performed by pairwise likelihood, andwe illustrate our new modeling framework with an application to Dutch wind gust maximacalculated over different time units.
Co-authors:Thomas Opitz, INRA, France.Emeric Thibaud, EPFL, Switzerland.
Keywords: asymptotic dependence and independence, block maximum approach, ex-treme event, max-infinitely divisible process, sub-asymptotic modeling.
48. Invited Talk Session: 11
35
Some Models for Zero-inflated and Bivariate Count Time Series with Applicationson Health Care DataPresenting Author: Hussein, Abdulkadir.Institution: University of Windsor, Canada.
Abstract:
In this talk, we propose models for bivariate time series of counts and count series withexcess zeros. The models are parameter-driven, build on the bivariate Poisson distribu-tion. We discuss a hybrid Bayesian-Frequentist method to carry out the inferences. Weillustrate the methods on emergency depart visits due to two types of asthma as well ason hospital admission and discharge data.
49. Invited Talk Session: 16
Spatio-temporal Clustering of Water Quality TrendsPresenting Author: Iliev, Iliyan.Institution: University of Southern Mississippi, USA.
Abstract:
The Chesapeake Bay Program, initiated in 1983, is a regional partnership between sev-eral state governments, federal agencies, and advisory groups that is involved in thecleanup and restoration of the Bay. To study the ecological trends in the area, we proposea new data-driven procedure for optimal selection of tuning parameters in dynamic clus-tering algorithms, using the notion of a stability probe. We refer to the new procedure asDownhill Riding (DR) because of the dynamics of the clustering stability probe. We studythe finite sample performance of DR when clustering benchmark Iris data and synthetictimes series, and illustrate the methods using data on water quality in the ChesapeakeBay.
Co-authors:Xin Huang, University of Texas at Dallas, USA.Vyacheslav Lyubchich, University of Maryland Center for Environmental Science, USA.Yulia R. Gel, University of Texas at Dallas, USA.
Keywords: Automatic parameter selection, clustering stability, dynamic clustering.
50. Invited Talk Session: 7
Simple Models for Complex Spatial and Spatio-temporal DataPresenting Author: Ippoliti, Luigi.Institution: University G.d’Annunzio of Chieti-Pescara, Italy.
Abstract:
36
This work is concerned with the specification of a simple hierarchical generalized spatio-temporal model which warrants consideration when data sets with different types of spatialcomplexities are available. Especially under Gaussian assumptions, the model is simpleto estimate and particularly useful when reliable estimates of the parameters of a covari-ance function are difficult to obtain. Details on data analysis in several research fields willbe given in an extended version of the present abstract.
References:
[1] Bookstein, F.L. (1989). Principle Warps: thin plate splines and the decomposition of deformations. IEEE TransationPattern Analysis and Machine Intelligence 16, 460–468
[2] Gelfand, A. (2012). Hierarchical modeling for spatial data problems. Spatial Statistics 1, 30–39.
[3] Rosenberg, S. (1997). The Laplacian on a Riemannian Manifold. Cambridge University Press.
Co-authors:L. Fontanella and P. Valentini , University G. d’Annunzio, Chieti-Pescara, Italy.R. Ignaccolo, University of Torino, Italy.
Keywords: Spatio-temporal models; Spatial predictions; Principal splines; Laplace-Beltramioperator.
51. Invited Talk Session: 16
Change-point Analysis of Well-log Data Under Frequency DomainPresenting Author: Jandhyala, Venkata K.Institution: Department of mathematics and Statistics, Washington State University,USA.
Abstract:
Well logging is an important tool for geologists and environmentalists and for those insearch of oil reserves, mineral deposits, and various types of other resources beneaththe earth. Scientists first begin by drilling a hole into the ground and take a log of the datawhile drilling so as to understand the geological factors present in the hole. It turns outthat jump discontinuities occur in the data whenever the probe comes across a new typeof rock. The determination of locations where the rock formation changes is important inthe search for oil reserves. The purpose of this study is to provide a new methodologyof how one can consistently estimate a change-point in time series data. In contrastwith previous studies, the suggested methodology employs only the empirical spectraldensity and its first moment. This is accomplished when both the means and variancesbefore and after the unidentified time point are unknown. Then, the well-known Gauss-Newton algorithm is applied to estimate and provide asymptotic results for the parametersinvolved. Simulations carried out under different distributions, sizes and unknown timepoints confirm the validity and accuracy of the methodology. The developed methodologyis applied to Well-Log data of O Ruanaidh and Fitzgerald (1996) to identify change-points.The application also illustrates the robustness of the methodology in the presence of evenextreme outliers.
37
Co-authors:Abdel H. El-shaarawi, American University of Cairo, Cairo, Egypt.
52. Invited Talk Session: 5
Multisensor Fusion of Remotely Sensed Vegetation Indices Using Space-time Dy-namic Linear ModelsPresenting Author: Johnson, Margaret.Institution: North Carolina State University and Statistical and Applied MathematicalSciences Institute, USA.
Abstract:
Characterizing growth cycle events in vegetation, such as spring green-up, from massivespatiotemporal remote sensing datasets is desirable for a wide area of applications. Forexample, the timings of plant life cycle events are very sensitive to weather conditions,and are often used to assess the impacts of changes in weather and climate. Likewise,quantifying and predicting changes in crop greenness can have a large impact on agricul-tural strategies. However, due to the current limitations of imaging spectrometers, remotesensing datasets of vegetation with high temporal frequency of measurements have lowerspatial resolution, and vice versa. In this research, we propose a space-time dynamic lin-ear model to fuse high temporal frequency data (MODIS) with high spatial resolution data(Landsat) to create high spatiotemporal resolution data products of a vegetation green-ness index. The model incorporates the spatial misalignment of the data and modelsdependence within and across landcover types with a latent multivariate Matern process.To handle the massive size of the data, we introduce a fast estimation procedure and amoving window Kalman smoother to produce a daily, 30 meter resolution data productwith associated uncertainty.
Co-authors:Brian Reich, Joshua Gray and Marschall Furman, North Carolina State University, USA.
Keywords: remote sensing, spatiotemporal, data fusion.
53. Invited Talk Session: 5
A Fast Sampler for Data Simulation From Markov Random FieldsPresenting Author: Kaplan, Andee.Institution: Duke University, USA.
Abstract:
For spatial and network data, a model may be formulated on the basis of a Markov ran-dom field (MRF) structure and the specification of a conditional distribution for each ob-servation. This piece-wise conditional approach often provides an attractive alternative to
38
directly specifying a full joint data distribution, which may be difficult for large correlateddata. At issue, fast simulation of data from such MRF models is often an important consid-eration, particularly when repeated generation of large numbers of data sets is required(e.g., for approximating reference distributions for statistics). However, the standard Gibbsstrategy for simulating data from a spatial MRF models involves individual-site updatesfrom conditional distributions, which is often challenging and computationally slow evenfor one complete iteration of relatively small sample size. As a remedy, we describe a fastway to simulate from MRF models, based on the concept of ”concliques”, (i.e., groups ofnon-neighboring observations). The proposed simulation scheme is computationally fastdue to its ability to lower the number of steps necessary to complete one iteration of aGibbs sampler. We motivate the simulation method, formally establish its validity, and as-sess its computational performance through numerical studies, where speed advantagesare shown. In addition to numerical evidence, we also present formal results that show theproposed Gibbs sampler for simulating MRF data is geometrically ergodic (i.e., exhibitsfast convergence rates) for simulating data from many commonly used spatial MRF mod-els. Such general convergence results are typically unusual for spatial data generationbut made possible here through the proposed sampling scheme.
Co-authors:Mark Kaiser, Iowa State University, USA.Soumen Lahiri, North Carolina State University, USA.Dan Nordman, Iowa State University, USA .
Keywords: Resampling, Markov Random Field models, Gibbs Sampling.
54. Invited Talk Session: 22
Recent Progress on Statistical Analysis of Oceanographic Data From Argo ProfilingFloatsPresenting Author: Kuusela, Mikael.Institution: Statistical and Applied Mathematical Sciences Institute (SAMSI) and TheUniversity of North Carolina at Chapel Hill. On behalf of the SAMSI Statistical Oceanog-raphy Working Group, USA.
Abstract:
Argo floats measure ocean temperature, salinity and currents down to 2, 000 m depth on aglobal scale. While Argo provides unique information about the climate and dynamics ofthe subsurface ocean, the statistical analysis of the resulting data set is challenging dueto its complex structure and large size. The SAMSI Statistical Oceanography WorkingGroup has brought together statisticians and oceanographers to develop new statisticaltechniques for analyzing Argo data, with a particular focus on ocean heat content esti-mation, flow mapping and biogeochemical observations. In this talk, I will first provide anoverview of these activities and then focus on the ocean heat content project where westudy the sensitivity of the Argo ocean heat content estimates to the underlying statisti-cal assumptions. I will present preliminary results indicating that care is needed in thestatistical modeling in order to avoid biases in these estimates.
39
Keywords: Argo floats, climatology, statistical oceanography, spatio-temporal interpola-tion, ocean heat content, flow mapping, biogeochemistry, local kriging, trend estimation.
55. Invited Talk Session: 15
Predicting Geo-localized Accidents on a Road Network From Gps-derived Covari-atesPresenting Author: Labbe, Aurelie.Institution: HEC Montreal, Canada.
Abstract:
In the field of road safety, accidents typically occur on roadways, which constrain theevents to lie along a linear network. In the past years, substantial research efforts havebeen devoted to the analysis of point processes with the development of methods forpoint patterns of events that occur on a network of lines. In such models, one can as-sume that crash coordinates are produced by a Poisson point process whose domaincorresponds to edges in the road network. This talk focuses on the analysis of geo-localized accident data in the context of a smart city initiative launched by the city ofQuebec aiming to predict crash intensity on the road network based on covariates de-rived from GPS data. Data originate from three sources: i) a geo-localized traffic accidentdatabase whose entries are based on police reports, ii) GPS trajectories obtained froma study on 4,000 drivers involving 55,000 trips and iii) the structure of the road networkobtained from OpenStreetMap (OSM). Our work reviews the main challenges posed bythe integration of those three sources of data in order to fit point process models on theroad network: the sparsity of the GPS data and the resulting need to define an imputationstrategy for covariates values on the network, limitations imposed by the importation ofOSM data and spatial dependence between neighboring points.
Co-authors:Luc Villandre, Alexandra Schmidt
Keywords: Point process models, linear networks, traffic safety.
56. Invited Talk Session: 12
A Fast Particle-based Approach for Computer Model CalibrationPresenting Author: Lee, Ben Seiyon.Institution: The Pennsylvania State University, USA.
Abstract:
Complex computer models play a prominent role in climate science, particularly in pro-jecting future climate. These models have key parameters that need to be inferred (”cal-ibrated”) based on observational data. We describe a sequential Monte Carlo methodthat is well suited for calibration problems for which standard Markov chain Monte Carlo
40
methods and model emulation approaches are computationally burdensome. The moti-vating scientific problem for our work is a computer model for projecting the future of theAntarctic ice sheet.
57. Invited Talk Session: 17
Extreme U.s. Temperature Changepoints and TrendsPresenting Author: Lee, Jaechoul.Institution: Boise State University, USA.
Abstract:
Extreme temperatures have profound societal, ecological, and economic impacts. Whilemost scientists concur that average temperatures in the contiguous United States since1900 have warmed on aggregate, there is no a priori reason to believe that temporaltrends in averages and extremes will exhibit the same patterns during this period. Indeed,under minor regularity conditions, the sample mean and maximum of stationary time se-ries are statistically independent in large samples. This talk presents trend estimationmethods for monthly maximum and minimum temperature time series observed in the48 conterminous United States over the last century. Previous authors have suggestedthat minimum temperatures are warming faster than maximum temperatures in the UnitedStates; such an aspect can be rigorously investigated via the methods discussed in thisstudy. Here, statistical models with extreme value and changepoint features are used toestimate trends and their standard errors. A spatial smoothing is then done to extractgeneral structure. The results show that monthly maximum temperatures are not oftengreatly changing — perhaps surprisingly, there are many stations that show some cooling.In contrast, the minimum temperatures show significant warming. Overall, the southeast-ern United States shows the least warming (even some cooling), and the western UnitedStates, northern Midwest, and New England have experienced the most warming.
Co-authors:Shanghong Li and Robert Lund, Clemson University, USA.
Keywords: Changepoint analysis, Generalized extreme value distribution, Genetic algo-rithm, Minimum description length, Time series.
58. Invited Talk Session: 10
Spatial Cluster Detection of Regression Coefficients in a Mixed Effect ModelPresenting Author: Lee, Junho.Institution: King Abdullah University of Science and Technology, Saudi Arabia.
Abstract:
Identifying clusters of spatial units in a regression coefficient is a useful tool to discerndistinctive relationship between a response and covariates relative to the background.
41

Here, we consider detecting a potential cluster in the regression setting based on hypoth-esis testing. Most of the existing methods assume independent spatial units. However,in many environmental applications, the response variables are spatially correlated. Wepropose a mixed effect model for spatial cluster detection, taking spatial correlation intoaccount. Compared to a fixed effect model, the introduced random effect explains theextra variability among the spatial responses beyond the cluster effect, and thus reducesthe false discovery rate. The developed method can find multiple clusters, which couldoverlap with one another, as well with a sequential searching scheme. The performanceof our proposed methods is evaluated by simulation studies in terms of true and falsepositive rates of a potential cluster. For applications, our methodology is applied to partic-ulate matter (PM2.5) concentration data in the North East U.S. with relevant meteorologicaldrivers or aerosol optical depth (AOD), and the identified spatial clusters are useful in fa-cilitating air quality management.
Co-authors:Ying Sun, King Abdullah University of Science and Technology, Saudi Arabia.Howard Chang, Emory University, USA.
Keywords: Hypothesis testing, Mixed effect model, Regression, Spatial cluster detection,Spatial regression, Spatial scan statistic.
59. Invited Talk Session: 13
Spatio-temporal Models for Probabilistic Wind Vector Forecasting in Saudi ArabiaPresenting Author: Lenzi, Amanda.Institution: King Abdullah University of Science and Technology, Saudi Arabia.
Abstract:
Saudi Arabia has recently begun promoting renewable energy heavily with the potentialto replace fossil fuels for domestic power generation. The optimal planning and designof wind farm networks requires accurate and reliable predictions of wind energy togetherwith a quantification of uncertainties. Based on a dataset of hourly wind speed at 28stations in Saudi Arabia, we build spatio-temporal models for short-term probabilistic pre-diction of wind vectors. Traditionally, wind speed and wind direction have been addressedindependently, without taking dependencies into account. However, in many situations it isimportant to use the full information about the bivariate structure of wind. We compare theperformance of a spatio-temporal model for wind speed directly with a coregionalizationmodel for the wind vector. In both cases, the linear predictor is a function of covariates,a smooth function to capture the daily seasonality in wind and a latent Gaussian field tomodel the spatial and temporal dependencies. To meet the computational requirements,we take a Bayesian framework and obtain fast and accurate forecasts not only at locationswhere recent data are available but also at stations without observations. We validate spa-tially out-of-sample forecasts on simulated high-resolution data from a computer model.Based on this case study, we provide a detailed analysis on how increasing the numberof locations can improve the forecast performance.
42
Co-authors:Marc G. Genton, King Abdullah University of Science and Technology, Saudi Arabia.
Keywords: Integrated nested Laplace approximation, Probabilistic forecast, Spatio-temporalmodeling, Wind vector.
60. Invited Talk Session: 17
Multiple Changepoint Detection in Environmental Time SeriesPresenting Author: Lund, Robert.Institution: Department of Mathematical Sciences, Clemson University, USA.
Abstract:
This talk presents methods to estimate the number of changepoint time(s) and their loca-tions in time-ordered data sequences when prior information is known about some of thechangepoint times. A Bayesian version of a penalized likelihood objective function is de-veloped from minimum description length (MDL) information theory principles. Optimizingthe objective function yields estimates of the changepoint number(s) and location(s). OurMDL penalty depends on where the changepoint(s) lie, but not solely on the total numberof changepoints (such as classical AIC and BIC penalties). The techniques allow for auto-correlation in the observations and mean shifts at each changepoint time. This scenarioarises in climate time series where a “metadata” record exists documenting some, butnot necessarily all, of station move times and instrumentation changes. Applications toclimate time series are presented throughout.
61. Invited Talk Session: 2
Characterizing Spatio-temporal Variability of Agricultural Yields on a Global ScalePresenting Author: Lyubchich, Vyacheslav.Institution: UMCES, USA.
Abstract:
Investigating yield patterns across temporal and spatial scales and identifying the rele-vant ecological and socioeconomic drivers are critical for developing strategies for sus-tainable intensification of agricultural production in the future. Analysis of synchronousand asynchronous production fluctuations helps to choose mutually beneficial long-termtrade partners, when shortage of production makes one trader become a buyer, whereasthe trader’s asynchronous partners experience surplus and wish to sell. This data-drivenstrategy facilitates the effective distribution of products and, at the larger scale, diminishesthe countries’ disparities in access to food resources, and supports global food security.To identify the spatial (a)synchrony, we propose to employ
• TRend based clUstering algorithm for Spatio-Temporal data stream, TRUST [1], en-hanced with automatic procedures for selecting hyper-parameters [3, 5]
43
• non-parametric approach for testing synchronism of trends in multiple time series [4]
• two-way joining approach (see [2] and references therein).
Using the yield data by Food and Agriculture Organization of the United Nations, wecharacterize spatio-temporal dynamics of the yields, with implications of redistribution ofproduction among asynchronous countries.
References:
[1] Ciampi, A., Appice, A. and Malerba, D. 2010. Discovering Trend-Based Clusters in Spatially Distributed DataStreams. In proceedings of the International Workshop of Mining Ubiquitous and Social Environments. Barcelona,Spain, pp. 107–122.
[2] Ciampi, A., Gonzalez Marcos, A. and Castejon Limas, M. 2005. Correspondence analysis and 2-way clustering.SORT 29(1): 27–42.
[3] Huang, X., Iliev, I. R., Lyubchich, V. and Gel, Y. R. 2017. Riding down the bay: Space-time clustering of ecologicaltrends. Environmetrics: e2455.
[4] Lyubchich, V. and Gel, Y. R. 2016. A local factor nonparametric test for trend synchronism in multiple time series.Journal of Multivariate Analysis 150: 91–104.
[5] Schaeffer, E. D., Testa, J. M., Gel, Y. R. and Lyubchich, V. 2016. On information criteria for dynamic spatio-temporalclustering. In Banerjee, A., Ding, W., Dy, J. G., Lyubchich, V. and Rhines, A., editors, Proceedings of the 6thInternational Workshop on Climate Informatics: CI2016. pp. 5–8.
Co-authors:Xin Zhang and Matthew Lisk, University of Maryland Center for Environmental Science,USA.
Keywords: Trend, Synchronism, Yield, Agricultural production.
62. Invited Talk Session: 13
Estimating Binomial Index N with Application to Bird and Bat Mortality at Wind andSolar Power FacilitiesPresenting Author: Madsen, Lisa.Institution: Oregon State University, USA.
Abstract:
Estimating the total number of bird or bat fatalities N at wind- or solar-power facilitiesinvolves scaling observed counts of carcasses X to account for imperfect detection prob-ability p. A simple model isX ∼ Binomial(N, p). If p is known, then the Horwitz-Thompson-like estimator X/p is unbiased for N . In practice, both p and N are unknown parameters.We assume p is estimated from independent trials. We describe methodology that com-bines models for scavenging, searcher efficiency, and incomplete coverage to estimatep. We employ a parametric bootstrap to produce an estimated sampling distribution ofN = X/p that accounts for the binomial variation in X as well as the uncertainty in theestimate of p.
Co-authors:
44
Dan Dalthorp and Manuela Huso, US Geologic Survey, USA.
Keywords: Detection Probability, Endangered Species, Solar Energy, Wind Energy.
63. Invited Talk Session: 10
Robust Depth-based Estimation of the Functional Autoregressive Model with Ap-plication to Co2 DataPresenting Author: Martinez Hernandez, Israel.Institution: King Abdullah University of Science and Technology (KAUST), Saudi Arabia.
Abstract:
We propose a robust estimator for functional autoregressive models. This estimator, theDepth-based Least Squares (DLS) estimator, down-weights the influence of outliers byusing the functional outlyingness as a centrality measure. The DLS estimator consists oftwo steps: identifying the outliers with a two-stage functional boxplot, then down-weightingthe outliers using the functional outlyingness. Through a Monte Carlo study, we show thatthe DLS estimator performs better than the PCA and robust PCA estimators, which arethe most commonly used. To illustrate a practical application, the DLS estimator is usedto analyze a dataset of ambient CO2 concentrations in California.
Co-authors:Marc G. Genton, King Abdullah University of Science and Technology, Saudi Arabia.Graciela Gonzalez-Farıas, Centro de Investigacion en Matematicas A.C. (CIMAT), Mex-ico.
Keywords: Functional autoregression model, Functional data analysis, Functional timeseries, Influence function, Robust estimator.
64. Invited Talk Session: 7
Linear Models for Complex Spatial Point Process DependenciesPresenting Author: Mateu, Jorge.Institution: University Jaume I, Spain.
Abstract:
Several methods to analyse structural differences between groups of replicated spatio-temporal point patterns are presented. We calculate a number of functional descriptors ofeach spatio-temporal pattern to investigate departures from completely random patterns,both among subjects and groups. We develop strategies for analysing the effects of sev-eral factors marginally within each factor level, and the effects due to interaction betweenfactors.The statistical distributions of our functional descriptors and of our proposed tests areunknown, and thus we use bootstrap and permutation procedures to estimate the null
45
distribution of our statistical test. A simulation study provides evidence of the validity andpower of our procedures. Several applications in environmental and engineering problemswill be presented.
Co-authors:Jonatan Gonzalez-Monsalve, University Jaume I of Castellon, Spain.
Keywords: K-function; Non-parametric test; Permutation test; Spatio-temporal point pat-terns; Subsampling.
65. Invited Talk Session: 15
A Study of Snow Water Equivalent in the Sierra Nevada Mountains of California,Using Snow Pillow DataPresenting Author: Meiring, Wendy.Institution: University of California, Santa Barbara, USA.
Abstract:
The Sierra Nevada Mountain snowpack is one of the primary water resources for Cali-fornia. Precipitation occurs predominately in the winter and spring months in this region.In recent decades, snow pillow records provide a set of spatially-located functional datadescribing the snowpack accumulation and melt patterns in each year at each snow pillowlocation. We present a functional data analysis study of space-time variation in the annualsnowpack accumulation and melt patterns, associated with spatial location attributes andlarge-scale climate indices.
Co-authors:Eduardo L. Montoya, California State University Bakersfield, USA.Jeff Dozier, University of California Santa Barbara, USA.
Keywords: Snowpack, water, functional data analysis, amplitude and phase variation.
66. Invited Talk Session: 16
Detection and Quantification of Regime Shifts in Ecological Time Series Using Dy-namic ModelsPresenting Author: Menendez, Patricia.Institution: Australian Institute of Marine Science, Austalia.
Abstract:
In ecology there are a great number of situations in which changes in a response variablemeasured over time are of interest and thus need to be quantified. Typically, the under-lying processes behind such measurements change over time and linear models are inmost cases not adequate for representing the trends. Time series structural models area powerful tool to describe each of the components of an ecological time series such as
46
trends, cycles and seasonal components over time. They can easily handle both regularlyand irregularly spaced designs and can be efficiently implemented even when large datasets are involved. Here, we introduce the use of time series structural models and theirstate space representation to not only estimate time series components over time butalso to quantify changes in regime shifts measured by time series trends. Those changescan be of different natures and magnitudes, for instance they can be brief and transient,instantaneous and permanent or gradual over time depending on the time series understudy. In situations, where a change in the underlying processes triggers a change inthe time series level at an unknown time point, we propose a method to estimate thosepoints. Two examples will be discussed: the first will focus on the crown-of-thorns starfish(COTS), which have a voracious appetite for corals. Once they reach outbreak propor-tions, these populations can decimate a healthy reef within a matter of months. Therefore,it is important to understand their basic movement patterns in captivity over time under dif-ferent conditions. In the second example, the model will be applied to identify and quantifyrapid shifts in climate conditions over the last 20,000 years based on temperature proxyrecords of ratios of oxygen isotopes trapped in the layers of a number of Greenland icecores.
Co-authors:Fernando Tusell, Facultad de CC.EE. y Empresariales Edificio, Spain.Michaela Miller and Cherie Motti, Australian Institute of Marine Science, Australia.
Keywords: Time series, structural models, state space models, change, Great BarrierReef, COTS, climate change.
67. Invited Talk Session: 7
A Geostatistical Approach to the Analysis of Spatial Tensor DataPresenting Author: Menafoglio, Alessandra.Institution: MOX, Dipartimento di Matematica, Politecnico di Milano, Italy.
Abstract:
The increasing availability of spatial complex data has fostered the development of Ob-ject Oriented Spatial Statistics (O2S2, [1]), an innovative system of ideas and methodsthat allows for the analysis of general types of data when their spatial dependence isan important issue. The foundational idea of O2S2 is to interpret data as objects: theatom of the geostatistical analysis is the entire object, which is seen as an indivisibleunit rather than a collection of features. In this view, the observations are interpreted asrandom points within a space of objects - called feature space - whose dimensionalityand geometry should properly represent the data features and their possible constraints.In this communication, following [2] and its recent extensions, we focus on the problemof analysing a set of spatial tensor data. These are georeferenced data whose featurespace is a Riemannian manifold. Riemannian manifolds are non-Euclidean spaces, whichcan be locally approximated through a Hilbert space. In this setting, the linear geostatis-tics paradigm cannot be directly applied, as the feature space is not close with respectto the Euclidean geometry (e.g., a linear combination of elements in the manifold does
47
not necessarily belong to the manifold). We shall discuss the use of a system of tangentspace approximations to locally describe the manifold through linear spaces, where thelinear object-oriented methods can be applied. Here, we develop estimation methodsand a consistent Kriging technique for tensor data. Although the presented approach iscompletely general, for illustrative purposes we will give emphasis to the case of pos-itive definite matrices. The latter case finds application in the analysis and predictionof measures of association, such as the covariance matrices between temperature andprecipitation measured in the Quebec region of Canada which are used to illustrate themethodological developments.
Co-authors:Davide Pigoli, Department of Mathematics, King·s College London, United Kingdom.Piercesare Secchi, MOX, Dipartimento di Matematica, Politecnico di Milano, Italy.
Keywords: Object oriented data analysis, spatial statistics, covariance matrices, tangentspace approximation.
68. Invited Talk Session: 19
Plant Disease Detection From Spectral Reflectance Using a Hybrid ModelPresenting Author: Menezes de Souza, Eniuce .Institution: State University of··Maringa, Brazil.
Abstract:
The Eucalyptus plantations represent an activity that generates millions of jobs in thevarious segments of the planted forest base in several countries, especially Brazil. Theproductivity of forest plantations is reduced by foliar bacteriosis, a disease characterizedby lesions on leaves. Detecting disease from leaf reflectance, which is measured alongwavelengths, has been a promising approach. This study investigates the reflectancemeasurements in order to determine which wavelengths are most sensitive to the bacte-ria infection of E. grandis x E. urophylla hybrids, proposing early diagnosis. Consideringthe variable binary response, the possibility of predicting infection from the logistic modelwas investigated. Due to the low predictive quality of this model, a hybrid logistic modelwas constructed, where the covariates are the wavelet coefficients of details and thesmooth scale coefficients of the reflectance covariates. From the non-decimated discretewavelet transform it was possible to extract information about the disease at different lev-els of resolution and to predict the diagnosis. The models were evaluated in this firstmoment according to the Pseudo R2 of Mc Fadden. We evaluated the smooth (scale)and the detail (wavelet) coefficients to investigate which are more informative for plantdisease detection. Furthermore, the wavelengths that are sufficient for the diagnosis arealso identified.AcknowledgementsThe authors acknowledge the National Council for Scientific and Technological Develop-ment (CNPq) for the financial support 475968/2013-1.
References:
48

[1] Huang, J. F. and Blackburn, G. A. 2011. Optimizing predictive models for leaf chlorophyll concentration based oncontinuous wavelet analysis of hyperspectral data, International Journal of Remote Sensing, 32:24, 9375–9396.
[2] Mahlein A. K.; Oerke E. C. 2012. Steiner U. and Dehne H.W. Recent advances in sensing plant diseases forprecision crop protection. European Journal of Plant Pathology, 133: 197–209.
[3] Vidakovic, B. 2008. Statistical Modeling by Wavelets, Wiley.
Co-authors:Marcia Lorena Alves dos Santos, Department of Statistics, State University of Maringa,Brazil.Jose Raimundo de Souza Passos, Institute of Biosciences, Department de Biostatisticsand Sao Paulo State University (UNESP), Botucatu, Brazil.Joao Ricardo Favan and Andre S. Jim, PhD Student Forest Science, UNESP, Botucatu,Brazil.Edson Luiz Furtado, Department of Plant Protection, UNESP, Botucatu - Brazil.
Keywords: Non-decimated Wavelet Transform, Reflectance, Plant Disease Diagnosis.
69. Invited Talk Session: 7
Spatial-temporal Gaussian State-space ModelsPresenting Author: Mondal, Debashis.Institution: Oregon State University, USA.
Abstract:
In this talk, based on the recent work [1], we present a scalable and matrix-free h-likelihood method for spatial-temporal Gaussian state-space models. The state vectorsare assumed to follow spatial-temporal Gaussian autoregressions that are consistent withthe conditional formulation of autonormal spatial fields. The h-likelihood method providesthe same inference as that obtained from the Kalman filter and residual maximum likeli-hood analysis. However, for data from a large number of spatial sites, we show that ourmethod has significant computational advantages. Furthermore, we provide details of theinference in small time steps and indicate how our method can be adapted to other com-plex spatial-temporal dynamical models based on stochastic partial differential equations.The method applies to data with both regularly and irregularly sampled spatial locations.We demonstrate the usefulness of our method with applications from environmental sci-ences and indicate some future directions.
References:
[1] Mondal, D. and Wang, C. 2018. A matrix-free method for spatial-temporal Gaussian state-space models. To appearin Statstica Sinica. doi:10.5705/ss.202017.0217
Co-authors:Chunxiao Wang, Oregon State University, USA.
Keywords: Advection-diffusion, Discrete cosine transform, Gaussian Markov randomfield, H-likelihood, Incomplete Cholesky, Lanczos algorithm, Residual likelihood, Total ni-trogen in the atmosphere, Trust region
49
70. Invited Talk Session: 21
Forecasting of Grape Powdery Mildew Disease Risk in Vineyards Using a BayesianLearning Network ModelPresenting Author: Newlands, Nathaniel.Institution: Science and Technology, Agriculture and Agri-Food Canada, Canada.
Abstract:
Vineyards suffer substantial grape yield losses from damaging diseases, such as powderymildew (Erysiphe necator) - a polycyclic, airborne disease. The severity and transmissionof this grapevine disease depends on a complex interaction of genetic (pathogen andhost) and environmental factors, including crop management practices. Climate changeand variability is also contributing uncertainty in managing this disease by raising tem-peratures affecting winter chill requirements, lengthening growing seasons in northernclimates, producing more days without frost, and causing more intense heatwave andrainfall events. It remains unclear how to best protect and minimize the impact of thisdisease in commercial vineyards. We present a Bayesian learning network model forforecasting disease risk in time and space. This approach combines diverse types ofdata, and complex causal relationship between variables. We present findings from vali-dating this model against for grapevine disease data collected within Quebec vineyards.Key scientific recommendations and challenges associated with its use as a precisionviticulture tool are discussed.
Co-authors:Weixun Lu, Department of Geography, University of Victoria, Canada.Odile Carisse, Science and Technology, Agriculture and Agri-Food Canada.David E. Atkinson, Department of Geography, University of Victoria, Canada.
Keywords: Agriculture, Bayesian, Disease, Forecasting, Machine-learning, Viticulture.
71. Invited Talk Session: 18
Improved Short-term Point and Interval Forecasts of the Daily Maximum Tropo-spheric Ozone Levels Via Singular Spectrum AnalysisPresenting Author: Noguchi, Kimihiro.Institution: Department of Mathematics, Western Washington University, USA.
Abstract:
We propose a general method for producing reliable short-term point and interval fore-casts of daily maximum tropospheric ozone concentrations, a time series with a signifi-cant seasonal component and correlated errors in both mean and volatility. Our methodcombines symmetrizing data transformation and time series modeling techniques calledsingular spectrum analysis (SSA) and autoregressive (AR) models. Specifically, we trans-form the underlying distribution of the data to a symmetric distribution by applying the logand Yeo-Johnson transformation for accurate positive point forecasts. Moreover, we con-sider seasonality in both mean and volatility of the time series, and empirical quantile
50
estimation for better interval forecasts. The accuracy of the proposed method is veri-fied rigorously at selected sites in the United States with differing latitudes, geography,and degrees of anthropogenic activities. The results indicate that the proposed methodseems to outperform the standard method that does not consider data transformation andseasonality in volatility.
References:
[1] Hansen, B. and Noguchi, K. 2017. Improved short-term point and interval forecasts of the daily maximum tropo-spheric ozone levels via singular spectrum analysis. Environmetrics 28:e2479.
Co-authors:Benjamin Hansen, Faculty of Science and Engineering, University of Groningen, TheNetherlands.
Keywords: Data transformation, Seasonality, Time series analysis, Volatility.
72. Invited Talk Session: 3
Increases in the Extreme Rainfall Events: Using the Weibull DistributionPresenting Author: Olivera Villaroel, Sazcha Marcelo.Institution: Universidad Autonoma Metropolitana - Unidad Cuajimalpa, Mexico.
Abstract:
The frequency of extreme weather events, such as severe floods, storms, hurricanes, anddroughts, seems to have increased in recent years. The analysis of trends and otherchanges in the distribution of these phenomena uses the extreme value theory (EVT).Thus, this study proposes the use of the Weibull distribution for the evaluation of extremeevents in precipitation. A correct assessment of probabilities of extreme precipitationevents and their changes is important for stakeholders, particularly in agriculture, infras-tructure, tourism, and insurance. This paper provides a simple approach to show thetrends in extreme precipitation in the western part of Mexico. The methodology has anadditional virtue as it enables the calculation of probabilities of change in extreme events.With this, it is feasible to develop new methodologies for better understanding of climatechange.
Co-authors:Heard Christopher, Universidad Autonoma Metropolitana - Unidad Cuajimalpa; Mexico.
Keywords: Extreme weather event, Precipitation, Climate change, Weibull distribution,Mexico
73. Invited Talk Session: 4
Modeling Nonparametric Covariate Effects on Extremal Dependence: an Applica-tion to Air Pollution in France
51
Presenting Author: Opitz, Thomas.Institution: Biostatistics and Spatial Processes, INRA, Avignon, France.
Abstract:
The probability and structure of co-occurrences of extreme values in multivariate datamay critically depend on auxiliary information provided by covariates. We here develop aflexible generalized additive modeling framework based on high threshold exceedancesfor estimating covariate-dependent joint tail characteristics for regimes of asymptotic de-pendence and asymptotic independence. The framework is based on suitably definedmarginal pretransformations and projections of the random vector along the directions ofthe unit simplex, which lead to convenient univariate representations of multivariate ex-ceedances based on the exponential distribution. We illustrate this modeling frameworkon a large dataset of nitrogen dioxide measurements recorded in France between 1999and 2012, where we use the generalized additive framework for modeling marginal distri-butions and tail dependence in monthly maxima. Results imply asymptotic independenceof data observed at different stations. We find that the estimated strength of residual taildependence decreases as a function of spatial distance. Some differences arise in thepatterns for different years and for different types of stations (traffic vs. Background).
References:
[1] Mhalla, L., Opitz, T. and Chavez-Demoulin, V. 2018. Exceedance-based nonlinear regression of tail dependence.arXiv:1802.01535,https: // arxiv. org/ abs/ 1802. 01535 .
Co-authors:Linda Mhalla, Geneva University, Switzerland.Valerie Chavez-Demoulin, UNIL, Lausanne, Switzerland.
Keywords: Asymptotic independence, Extreme value theory, Generalized additive mod-els, Penalized likelihood, Tail dependence.
74. Invited Talk Session: 19
Stationarity Intervals for Random Waves: Time Series Clustering and FunctionalData AnalysisPresenting Author: Ortega, Joaquin.Institution: CIMAT, Mexico.
Abstract:
In this talk, we look at the problem of detecting stationary time intervals for random waves.The problem is of interest because a model frequently used in this context is that wavesbehave like a stationary Gaussian process. Determining time periods during which theoscillatory characteristics of the sea surface are stable is important for the analysis of thewave climate in a region and detecting recurrent spectral states may be of interest in theproblem of extracting energy from waves. We adopt a time series clustering approach to
52

determine intervals of similar behavior. The algorithm is based on the use of estimatedspectral densities, which are considered as functional data, as the basic characteristic ofstationary time series for clustering purposes. A robust algorithm for functional data isthen applied to the set of spectral densities. Data-dependent trimming techniques andrestrictions on the cluster scatter parameters reduce the effect of noise in the data andhelp to prevent the identification of non-interesting or spurious clusters. The procedure istested in a simulation study and is also applied to a real data-set.
Co-authors:Diego Rivera-Garcıa, CIMAT, A.C., Mexico.Luıs A. Garcıa-Escudero, Universidad de Valladolid, Spain.Agustın Mayo Iscar, Universidad de Valladolid, Spain.
Keywords: Random sea waves, Time series clustering, Functional data, Robust cluster-ing, Trimming methods, Stationary Gaussian processes, Spectral densities
75. Invited Talk Session: 23
Improved Air Quality Saved Lives: a Mediation on Particulate MattersPresenting Author: Peterson, Geoffrey “Colin”.Institution: U.S. Environmental Protection Agency, USA and Oak Ridge Institute for Sci-ence and Education, USA.
Abstract:
Background: In the United States, cardiovascular mortality rates have declined alongwith improvements in air quality. Between 1990 and 2010, cardiovascular mortality de-creased by 45.66% (standard error SE=0.02%) while fine particulate matter (PM2.5) ex-posures decreased by 29.5% (SE=0.2%). We investigate the extent to which reductionsin cardiovascular mortality rates can be attributed to reductions in PM2.5.Methods: We obtained cardiovascular standardized mortality rates (SMR) for 2132 coun-ties from the US National Center for Health Statistics between 1990 and 2010. We use theCommunity Multiscale Air Quality model to calculate population-weighted annual averagePM2.5 concentrations for each county. We adapt mediation analysis to calculate the tem-poral trends in PM-related cardiovascular mortality rates, and consider both a fixed andrandom effects model to account for spatial confounding. We examine which PM compo-nents and their emission sources contribute most to PM2.5-related mortality.Results: Between 1990 and 2010, cardiovascular SMR related to total PM2.5 decreasedby 12.3 (SE=0.4) deaths per 100,000 person-years, approximately 6.5% (SE=0.2%) of theoverall decrease in cardiovascular SMR. Reduction in particulate sulfate levels, driven byreductions in sulfur dioxide emissions, mediated 10.8 (SE=0.6) cardiovascular SMR. Perunit mass of emissions, reduction in elemental carbon is most efficient at 1.20 (SE=0.10)cardiovascular SMR per metric kiloton. Emissions of elemental carbon from mobile ve-hicles have significantly decreased, while emissions from wildland fires and other areasources have increased.Conclusions: Particulate sulfates contribute the most to total PM2.5-related cardiovas-cular mortality, but reductions in carbon was more efficient at reducing PM2.5-related
53
cardiovascular mortality.Disclaimer: Statements in this abstract do not necessarily reflect the views or policies ofthe U.S. EPA.
Co-authors:Anne Corrigan, U.S. Environmental Protection Agency, USA and Oak Ridge Institute forScience and Education, USA.Christian Hogrefe, Rohit Mathur, Lucas Neas and Ana Rappold, U.S. Environmental Pro-tection Agency, USA.
Keywords: Environmental Epidemiology, Spatiotemporal, Mediation, PM 2.5, Cardiovas-cular Mortality.
76. Invited Talk Session: 2
Improving Inference in Area-referenced Environmental Health StudiesPresenting Author: Pirani, Monica.Institution: Imperial College London, UK.
Abstract:
Study designs where data are aggregated into geographical areas are extremely popu-lar in environmental epidemiology. These studies are commonly based on administrativedatabases and, providing a complete spatial coverage, are particularly appealing to makeinference on the entire population. The ecological nature of these studies, however, doesnot allow the direct inclusion of individual-level risk factor data. In the presence of unmea-sured potential confounding factors, risk effect estimates are prone to bias. Here, we showhow to improve inference drawn from area-referenced environmental health-effect stud-ies. We propose a Bayesian hierarchical approach that augments measured area-levelcovariates with an ecological propensity score estimated upon geolocated individual-leveldata from sample surveys collected within the appropriate temporal exposure window.Propensity score refers to a class of methods that are used as a device to alleviate thebias in estimating the exposure effect, reducing the likelihood of confounding in analyzingobservational data. We use the propensity score methodology in the context of area-based regression adjustment, where it acts as a proxy for the unmeasured ecologicalconfounders. In contrast to the main literature on propensity score for confounding adjust-ment where the exposure of interest is confined to a binary domain, we generalize its useto cope with ecological studies characterized by a continuous exposure. Additionally, weinvestigate the problem of incomplete spatial coverage of the individual-level data uponwhich the generalized ecological propensity score is constructed and we explore the biasand uncertainty resulting from inappropriate assumptions about the missingness mecha-nisms when the true mechanisms are missing at random and missing not at random. Theapproach is illustrated using simulated examples and a real application investigating therisk of lung cancer mortality associated to nitrogen dioxide in England (UK).
Co-authors:Alexina Mason, London School of Hygiene and Tropical Medicine, UK.Anna Hansell, Imperial College London, UK.
54
Sylvia Richardson, University of Cambridge, UK.Marta Blangiardo, Imperial College London, UK.
Keywords: Area-referenced studies, Bayesian inference, Data integration, Incompletespatial coverage, Uncertainty.
77. Invited Talk Session: 8
Combining Different Information Sources for Forecasting Emerging Climate Sensi-tive Mosquito-borne DiseasesPresenting Author: Ramirez Ramirez, L. Leticia .Institution: CIMAT, Mexico.
Abstract:
In December 2013 and April 2015 the first cases of chikungunya and zika were reportedin the Caribbean and Brazil, respectively and since then, these viruses rapidly spreadacross the continent, attracting a lot of attention from governments and health care pro-fessionals. Since data of new diseases in a region was scared, we exploit different sourceof information such as the originated from surveillance systems, and non-traditional infor-mation sources (like online and social media) to propose a forecasting model. In this workwe present a forecasting model for chikungunya but the ideas can be implemented for anyemerging infectious disease. This model incorporates information of the number of casesat the beginning of an outbreak (surveillance information) and the activity reported byGoogle Dengue Trend (GDT). We used GDT in this case, due to the fact that chikungunyavirus is transmitted by the same type of mosquito as dengue, so GDT can shed somelight on the mosquito population and the mosquito-human interaction in the neighboringcountries. The two information sources are incorporated as exogenous variates of a timeseries model to predict the epidemic curve.
Co-authors:Yulia Gel, UTD, USA.Slava Lyubchich, Univ. Maryland, USA.
Keywords: Infectious disease, UQ, inference, prediction.
78. Invited Talk Session: 6
Spatial-temporal Modeling of Land Surface Phenology of Kansas Farm LandsPresenting Author: Reyes Cuellar, Perla.Institution: Kansas State University, USA.
Abstract:
Monitoring land cover dynamics is increasingly used for environmental evaluation, ter-ritory planning, and insurance policies. Land surface phenology (LSP) is the study of
55
the spatio-temporal development of vegetated land surface in relation to climate as re-vealed by satellite sensors. Here, we model the Normalized Difference Vegetation Index(NDVI). NDVI is calculated from the visible and near-infrared light reflected by vegetation.Values close to zero or 1, mean no vegetation or high density of green leaves, respec-tively. The concept of deriving phenological metrics is based on identifying critical pointsin the seasonal NDVI trajectory that corresponds to, for example, the start-of-spring oremergence in case of annual crops. The high degree of phenological variability betweenyears demonstrates the necessity of distinguishing temporal variability from phenologicalchange. Thus, there is a need for an approach to detect long-term phenological changesbased on the time series, not just dates of specific events.We apply Nonparametric Bayesian functional models to NDVI image composites from2010 to 2016 for a collection of farm fields in Kansas to identify typical temporal trendsthat can be associated with the diverse ecosystems. These typical trends may be used forclarification and to detect a long-term phenological change in satellite image time series.
Co-authors:Sebastian Varela, Kansas State University, USA.
Keywords: Land Surface Phenology, Nonparametric Bayesian, NDVI, Spatial-TemporalModels.
79. Invited Talk Session: 3
An Application to Ozone Data of a Non-homogeenous Poisson Model with SpatialAnisotropy and Change-pointsPresenting Author: Rodrigues, Eliane.Institution: Universidad Nacional Autonoma de Mexico, Mexico.
Abstract:
A non-homogeneous Poisson model is used to study the rate at which ozone exceedancesof a given threshold occur. We also allow the presence of change-points in the model.An anisotropic spatial component is imposed on the vector of the parameters of the Pois-son rate function as well as on the vector of possible change-points. Parameters will beestimated using the Bayesian point of view via a Metropolis-Hastings algorithm within theGibbs sampling. The model is applied to ozone data obtained from ten stations fromMexico City’s monitoring network. Each station will have its own Poisson model assignedto it and their interaction will be via the spatial model applied jointly to the parameters ofthe rate functions and change-points. In the application we consider the maximum dailyozone measurements obtained from 01 January 1990 to 31 December 2010. Results sug-gest that two change-points are present. They also indicate that the behaviour of the ratefunction is decreasing with smaller rates as we go towards the end of the observationalperiod.
Co-authors:Geoff Nicholls, University of Oxford, UK.Mario H. Tarumoto, Universidade Estadual “Julio de Mesquita Filho”, Brazil.
56
Guadalupe Tzintzun, Instituto Nacional de Ecologıa y Cambio Climatico - SEMARNAT,Mexico.
Keywords: Air pollution, rate of ozone exceedances, Bayesian inference, Markov chainMonte Carlo algorithms.
80. Invited Talk Session: 23
Modeling Collective Animal Movement Through Interactions in Behavioral StatesPresenting Author: Russell, James.Institution: Muhlenberg College, USA.
Abstract:
Abstract Animal movement often exhibits changing behavior because animals often al-ternate between exploring, resting, feeding, or other potential states. Changes in thesebehavioral states are often driven by environmental conditions or the behavior of nearbyindividuals. We propose a model for dependence among individuals· behavioral states.We couple this state switching with complex discrete-time animal movement models toanalyze a large variety of animal movement types. To demonstrate this method of cap-turing dependence, we study the movements of ants in a nest. The behavioral interactionstructure is combined with a spatially varying stochastic differential equation model toallow for spatially and temporally heterogeneous collective movement of all ants withinthe nest. Our results reveal behavioral tendencies that are related to nearby individuals,particularly the queen, and to different locations in the nest.
Co-authors:Ephraim M. Hanks, Andreas P. Modlmeier, David P. Hughes, Pennsylvania State Univer-sity, USA.
Keywords: Animal Movement, Potential Functions, Motility Surface, CTCRW, behavioralstates.
81. Invited Talk Session: 14
Velocities for Spatiotemporal Point PatternsPresenting Author: Schliep, Erin.Institution: University of Missouri, USA.
Abstract:
We propose a novel inferential metric of spatiotemporal point patterns using spatial andtemporal gradients of the intensity surface. For a given location in space and time, thegradients describe the instantaneous rate of change for the point pattern in a specifieddirection (space) and time. The ratio is these gradients is the velocity, which is calculatedthrough the gradient behavior of the non-stationary intensity surface driving the spatiotem-poral point pattern. Since the intensity surface is a realization of a stochastic process, the
57

gradients require directional derivative stochastic processes. We investigate changes invelocities across space and time, where the direction of the minimum velocity provides theslowest rate (e.g., kilometers per hour) to move in order to maintain a constant intensity.The approach has wide application in estimating the velocity of a disease epidemic or aspecies distribution across a region as a response to a changing environment.
Keywords: Point patterns, velocity, gradients, space-time model.
82. Invited Talk Session: 20
Modelling the Environmental Impacts of AquaculturePresenting Author: Scott, E. Marian.Institution: University of Glasgow, UK.
Abstract:
Aquaculture accounts for nearly half of the global fish supply, is an expanding industryaround the globe, and impacts the seabed, which is a diverse and complex environment.Current farming techniques deposit a range of wastes on the seabed which are dispersed,creating a zone of impact that is monitored to ensure that agreed quality standards aremet.· Monitoring tends to be limited in space and time, typically using grab samples andcores and this must be supplemented by modelling. In Scotland, the main modelling toolis DEPOMOD. · It predicts the impact of marine cage fish farming on the seabed, lookingat the impacts on sediment dwelling animals given farm (configuration, feeding rate) andenvironmental information (bathymetry, water currents).· · The model has 4 components:grid generation, particle tracking, resuspension and benthic modules. It includes a termdescribing turbulence, using a 3-D random walk. We report on preliminary modellingresults exploring the uncertainty and sensitivity of the modelled impacts to variations inthe model input parameters.
Co-authors:Michael Currie and Claire Mille, University of Glasgow, UK.
Keywords: Aquaculture, sensitivity and uncertainty analysis.
83. Invited Talk Session: 18
An Exponential·gamma Mixture Model for Extreme Santa Ana WindsPresenting Author: Shaby , Benjamin.Institution: Penn State University, USA.
Abstract:
We analyze the behavior of extreme winds occurring in Southern California during theSanta Ana wind season using a latent mixture model. This mixture representation isformulated as a hierarchical Bayesian model and fit using Markov chain Monte Carlo.
58
The two·stage model results in generalized Pareto margins for exceedances and gener-ates temporal dependence through a latent Markov process. This construction inducesasymptotic independence in the response, while allowing for dependence at extreme, butsubasymptotic, levels. We compare this model with a frequentist analogue where infer-ence is performed via maximum pairwise likelihood. We use interval censoring to accountfor data quantization and estimate the extremal index and probabilities of multiday occur-rences of extreme Santa Ana winds over a range of high thresholds.
Co-authors:Gregory P. Bopp, Penn State University, USA.
Keywords: asymptotic independence, Bayesian hierarchical model, extreme value the-ory, generalized Pareto distribution, Santa Ana winds.
84. Invited Talk Session: 19
Functional Analysis of Spatial Aggregation Regions of Jeffrey Pine Beetle-attackWithin the Lake Tahoe BasinPresenting Author: Smirnova, Ekaterina.Institution: University of Montana, USA.
Abstract:
Modeling the location, characteristics, and dynamics of clusters that occur during ecolog-ical outbreaks is an important topic in environmental sciences. Motivated by the 1991 to1996 Jeffrey pine beetle (JPB) forest epidemic attack in the Lake Tahoe Basin, we proposemethods that describe the location, shape, and characteristics of spatial clusters formedby infected trees. Our purpose is to introduce a novel functional representation approachto describe the complex shape and characteristics of spatial clusters. For each cluster,we separate the domain into g non-overlapping cones located at the cluster center, anddescribe the contour as a distance function at the angle theta that defines each cone.Additional information about the cluster (e.g. number of affected trees) can be collectedand represented as a function of the cone-specific angle. By expressing the complexJPB-attacked cluster regions as functions of the direction from the cluster center, we de-velop a method for modeling the association between the shape and size of clusters andvarious forest attributes. This approach allows to use functional data modeling to quantifythe directions of beetle expansion.
85. Invited Talk Session: 11
Visualizing and Understanding Riverine Thermal Landscapes in a Changing Cli-matePresenting Author: Steel, E. Ashley.Institution: PNW Research Station, US Forest Service Fullerton, Aimee H. NorthwestFisheries Science Center NOAA Fisheries , USA.
59
Abstract:
Thermal landscapes include minute-to-minute fluctuations and meter-to-meter diversity;both of which are likely to shift with future changes in climate. We designed a water tem-perature monitoring network on the Snoqualmie River with 40+ stations recording watertemperature every 30-min and we now have 6 full years of data. Using spatial streamnetwork models, these data are providing visualizations of how water temperatures fluc-tuate over time and space. By modeling facets of the thermal regime of importance toparticular species and life-stages, we can map and estimate where and when suitablehabitat conditions occur. For example, we modeled facets of the thermal regime of impor-tance to native Chinook salmon and Bull Trout as well as to non-native Largemouth Bassduring the record-breaking droughts and high temperatures that occurred in 2015 acrossthe Pacific Northwest, USA. Modeled output provides an opportunistic glimpse into howfishes may respond to future thermal landscapes.
Co-authors:Amy Marsha, University of Washington and PNW Research Station, US Forest Service
Keywords: climate change, river network, spatial stream network model, thermal regime,time series.
86. Invited Talk Session: 14
Extended Ensemble Kalman Filters for High-dimensional Hierarchical State-spaceModelsPresenting Author: Stroud, Jonathan.Institution: Georgetown University, USA.
Abstract:
The ensemble Kalman filter (EnKF) is a computational technique for approximate infer-ence on the state vector in spatio-temporal state-space models. It has been successfullyused in many real-world nonlinear data-assimilation problems with very high dimensions,such as weather forecasting. However, the EnKF is most appropriate for additive Gaus-sian state-space models with linear observation equation and without unknown param-eters. Here, we consider a broader class of hierarchical state-space models, which in-cludes two additional layers: The parameter layer allows handling of unknown variablesthat cannot be easily included in the state vector, while the transformation layer can beused to model non-Gaussian observations. For Bayesian inference in such hierarchi-cal state-space models, we propose a general class of extended EnKFs, which approxi-mate inference on the state vector in suitable existing Bayesian inference techniques (e.g.,Gibbs sampler or particle filter) using the EnKF or the related ensemble Kalman smoother.Extended EnKFs enable approximate, computationally feasible filtering and smoothing inmany high-dimensional, nonlinear, and non-Gaussian spatio-temporal models with un-known parameters. We highlight several interesting examples, including assimilation ofheavy-tailed and discrete data, and filtering and smoothing inference on model parame-ters.
60

Co-authors:Matthias Katzfuss, Texas A & M University, USA.Christopher Wikle, University of Missouri, USA.
Keywords: extended EnKF, non-Gaussian, data assimilation, smoothing.
87. Invited Talk Session: 9
Comparing Ozone and Pm10 Air Quality in Mexico City and Bogota Using Non-homogeneous Poisson ModelsPresenting Author: Suarez Sierra, Biviana Marcela.Institution: Universidad Nacional de Colombia, Colombia.
Abstract:
In this work we consider a non-homogeneous Poisson process with a Weibull type ratefunction in order to estimate the probability of having a certain number of ozone and PM10
exceedances of threshold of interest in a given time interval. Versions of the model whereno change-points are allowed and also where they are allowed are considered. Resultsare applied to data from Bogota’s and Mexico City’s monitoring network. Based on theresults obtained we compare the air quality between the two cities. The comparison ismade in terms of the behaviour of the rate function of the Poisson process.
Co-authors:Eliane Rodrigues, Universidad Nacional Autonoma de Mexico, Mexico.
Keywords: Non-homogeneous Poisson process, Bayesian inference, Markov chain MonteCarlo algorithm, Bogota, Mexico City.
88. Invited Talk Session: 21
Encoding Dependence in Bayesian Causal NetworksPresenting Author: Sulik, John.Institution: University of Guelph, Canada.
Abstract:
Bayesian (belief, learning, or causal) networks (BNs) represent complex, uncertain spatio-temporal dynamics by propagation of conditional probabilities between identifiable “states”with a testable causal interaction model. Typically, they assume random variables are dis-crete in time and space, with a static network structure that may evolve over time, accord-ing to a prescribed set of changes over a successive set of discrete model time-slices(i.e., snap-shots). But the observations that are analyzed are not necessarily indepen-dent and are auto-correlated due to their positions in space and time. Such BN modelsare not truly spatial-temporal, as they do not allow for autocorrelation in the prediction ofthe dynamics of a sequence of data. We begin by discussing Bayesian causal networks
61

and explore how such data dependencies could be embedded into BN models from theperspective of fundamental assumptions governing space-time dynamics. We show howthe joint probability distribution for BNs can be decomposed into partition functions withspatial dependence encoded, analogous to Markov Random Fields (MRFs). In this way,the strength and direction of spatial dependence both locally and non-locally could bevalidated against cross-scale monitoring data, while enabling BNs to better unravel thecomplex dependencies between large numbers of covariates, increasing their usefulnessin environmental risk prediction and decision analysis.
Co-authors:Nathaniel Newlands, Agriculture and Agri-Food Canada, Canada.
Keywords: Bayesian, Bayes, causal, spatial, probabilistic, dependence, GIS, network.
89. Invited Talk Session: 24
Time Delay Estimation Under Sparsity with Application to Satellite Imagery TimeSeriesPresenting Author: Tecuapetla-Gomez, Inder.Institution: CONACyT-CONABIO, Mexico.
Abstract:
Time delay estimation can be thought as the problem of approximating the apparent shiftbetween an emmited signal (typically known as reference signal) and another one whichis received in a different point in time and space (delayed signal). In this talk we proposea time delay estimator which deals with the case in which the reference signal exhibitssparsity. The first step to get our estimator consists of finding a highly sparse representa-tion of the reference signal with respect to a (sparse) matrix defined through the delayedsignal; lasso-regression is instrumental in establishing this representation. Our estimatoris the solution of the canonical Pearson-based time delay estimation problem applied tothe highly sparse version of the reference signal and the (original) delayed one. We willdiscuss some finite-sample and asymptotic properties of our estimator and show throughsimulations that by taking into account the sparsity of the reference signal we can outper-form the canonical Pearson-based method; as a by-product, we found that our method isable to estimate appropriately a time delay even when 25% of missing values is reportedin the delayed signal. Some results of applying our estimator to data cubes of precipita-tion and the normalized difference vegetation index (NDVI) derived from satellite imagesof the Mexican territory will also be discussed.
Keywords: Time delay estimation, Pearson correlation, lasso regression, missing values,satellite imagery, time series, stationary processes, precipitation, NDVI.
90. Invited Talk Session: 1
Global Air Pollution and Health: Revealing the Differences in the Quality of the AirThat We Breathe
62
Presenting Author: Thomas, Matthew.Institution: University of Bath, UK.
Abstract:
In May 2018, the World Health Organization (WHO) released new estimates of global airquality showing that air pollution levels are dangerously high in many parts of the world.Major sources of air pollution include the inefficient use of energy by households, industry,the agriculture and transport sectors, and coal-fired power plants. In some regions, sandand desert dust, waste burning, and deforestation are additional sources of air pollution.The new estimates reveal an alarming toll of 7 million deaths every year can be associatedwith exposure to outdoor and household air pollution, and that 90% of people worldwidebreathe polluted air.More than 4,300 cities in 108 countries are now included in WHO·s ambient air qualitydatabase, making this the world·s most comprehensive database on ambient air pollu-tion. However, although air pollution monitoring is increasing, there remain areas forwhich information isn·t available and estimates of exposures are required for all areas.In this presentation we will discuss how we have been working with the WHO to developthe Data Integration Models for Air Quality (DIMAQ). This combines information from anumber of different sources to allow exposures to be estimated worldwide. By integratingmeasurements from ground monitoring with information from satellites, population esti-mates, land-use and other factors to allow us to provide estimates of air quality for everycountry and region, including those where there is little, or no, monitoring. We describethe progression of the development of a series of models from spatial to spatial-temporaland their implementation on a global scale.We will present the findings from the most current analysis of the state of global air quality,using the current version of DIMAQ, including an examination of global, regional andcountry-level exposures and health burdens. We see show that there is great variabilityin air pollution across the world, with some areas experiencing levels that are more than5 times higher than the guidelines.
91. Invited Talk Session: 15
Nonlinear Area-to-point Regression Kriging for Spatial-temporal Mapping of MalariaRiskPresenting Author: Truong, Phuong.Institution: Department of Earth observation science, Faculty of geo-information scienceand earth observation, University of Twente, The Netherlands.
Abstract:
Mapping spatial-temporal variations of malaria risk serves a very useful purpose of im-proving public health intervention and protection. Smooth disease risk mapping can helpto reduce errors and biases due to demographic heterogeneity in predicting malaria riskusing the reported number of malaria cases in space and time. This study presents a newstatistical model that is expanded from the existing area-to-point (ATP) kriging models in
63
spatial statistics to map spatial-temporal variations of malaria risk in southern Vietnam.The essence of the new model is a Poisson regression ATP model that has fixed effectsand random effects. The fixed effects link disease data and environmental data at vari-ous measurement and observation scales. The fixed effects are instead approximated bymaximum-entropy approximation. This advancement is to minimize the ecological biaseswhen disease data are only available from national routine surveillance at small areas.The random effects which are spatial-temporally auto-correlated are predicted by usingsimple ATP kriging. The results of mapping malaria risk at district level using data atprovincial level are validated using areal cross-validation. Compare to the results from thesame case study but using common ATP log-linear model, the new model is superior interms of minimizing prediction biases. The case study of mapping malaria risk demon-strates the superiority of the new model in mapping disease risk using data at differentscales. Moreover, the model allows the uncertainty about the mapping outcome to bequantified.
Keywords: Disease risk mapping, small area estimation, malaria risk, ATP kriging, spatial-temporal epidemiology.
92. Invited Talk Session: 11
A Hierarchical Bayesian Spatio-temporal Model to Estimate the Short-term Effectsof Air Pollution on Human HealthPresenting Author: Valentini, Pasquale.Institution: University ”G. d’Annunzio” of Chieti-Pescara, Italy.
Abstract:
We introduce a hierarchical spatio-temporal regression model to study the spatial andtemporal association existing between health data and air pollution. The model is devel-oped for handling measurements belonging to the exponential family of distributions andallows the spatial and temporal components to be modelled conditionally independentlyvia random variables for the (canonical) transformation of the measurements mean func-tion. A temporal autoregressive convolution with spatially correlated and temporally whiteinnovations is used to model the pollution data. This modelling strategy allows to predictpollution exposure for each district and afterwards these predictions are linked with thehealth outcomes through a spatial dynamic regression model.
References:
[1] Peng, R.D. and Dominici, F. and Louis, T.A.: Model choice in time series studies of air pollution and mortality. J. R.Stat. Soc. Ser. A. Stat. Soc., 169, 179–203 (2006)
[2] Rushworth, A. and Lee, D. and Mitchell, R.: A spatio-temporal model for estimating the long-term effects of airpollution on respiratory hospital admissions in Greater London. Spat. Spatiotemporal. Epidemiol. 10, 29–38(2014)
[3] Sigrist, F., K·nsch, H.R., Stahel, W.A.: A dynamic nonstationary spatio-temporal model for short term prediction ofprecipitation. Ann. Appl. Stat.,6, 1452–1477 (2012)
[4] Shaddick, G. and Zidek, J.: Spatio-Temporal Methods in Environmental Epidemiology, Chapman Hall/CRC (2015).
64
Co-authors:Fontanella Lara, DSGS, University ”G.d’Annunzio” of Chieti-Pescara, Italy.Ippliti Luigi, DeC, University ”G.d’Annunzio” of Chieti-Pescara, Italy.
Keywords: Hierarchical model, spatio-temporal model, MCMC
93. Invited Talk Session: 17
A Statistical Analysis of Snow Depth TrendsPresenting Author: Woody, Jonathan.Institution: Mississippi State University, USA.
Abstract:
Attempts to assess snow depth trends over various regions of North America have beenattempted. Previous studies estimated trends by applying various statistical approachesto snow depth data, snow fall data, or their climatological proxies such as snow waterequivalents. This talk begins with considerations of how changepoints may effect statis-tical inference in environmental data, with particular consideration applied towards snowdepth observations. A detailed statistical methodology for assessing trends in daily snowdepths that accounts for changepoints is considered. Changepoint times are estimated byapplying a genetic algorithm to a minimum description length penalized likelihood score.A storage model balance equation with periodic features that allows for changepoints isused to extract standard errors of the estimated trends.
Keywords: Snow depth trend, Changepoint detection, stochastic model.
94. Invited Talk Session: 3
Joint Models for the Duration and Size of Fires in British Columbia, CanadaPresenting Author: Xi, Dexen DZ .Institution: Western University, Canada.
Abstract:
The goal of our research is to understand the complex relationship between the durationand size of forest fires so as to better predict these important characteristics of fires notonly for the purpose of fire management but also for a fundamental understanding offire science [1]. In our case, we jointly model time spent (duration) in days and areaburned (size) in hectares from ground attack to final control of a fire as a bivariate survivaloutcome using a joint modeling framework that connects the two outcomes with a sharedrandom effect. The talk will focus on discussing: (a) the robustness of joint models, wherethe true model is a copula, (b) how duration and size are related through an analysisof the historical data in British Columbia, Canada, (c) the implementation of the optimalframework developed as a component in the fire prediction system that is concurrentlyunder development by Natural Resources Canada.
References:
65
[1] Taylor, S. W., Woolford, D. G., Dean, C., & Martell, D. L. (2013). Wildfire Prediction to Inform Management: Statis-tical Science Challenges.Statistical Science, 586-615.
Co-authors:Charmaine B. Dean, University of Waterloo, Canada.Steve W. Taylor, Pacific Forestry Centre, Canada.
Keywords: Joint modelling, Copulas, Fire duration, Fire size, Wildfire science.
95. Invited Talk Session: 25
Theoretical Studies in the Big Data Era for Spatial StatisticsPresenting Author: Zhang, Hao .Institution: Purdue University, USA.
Abstract:
One of the areas where big data are collected is in spatial statistics. Algorithms andprediction have been the focus in many of the studies and have produced new method-ologies. While there have been good developments in computational methods to handlethe big data, there have relatively less theoretical developments. This is partially due tothe fact that it is difficult to develop useful theoretical results. In this talk, I will make thecase for the need in more theoretical studies and provide some perspectives to broadenthe scope of theoretical studies.
Contributed Talks
96. Contributed Talk Session: 26
Matrix-free Conditional Simulations of Lattice Random FieldsPresenting Author: Dutta, Somak.Institution: Iowa State University, USA.
Abstract:
We develop an exact matrix-free method for conditional simulations for hidden Gaussianrandom field models. For regular arrays, we exploit the analytic structure of the precisionmatrix using the two-dimensional discrete cosine transformation and employ the Lanczosalgorithm to solve system of linear equations. As a key ingredient, we use a sparse incom-plete Cholesky factor of the dense precision matrix as the preconditioner in the Lanczosalgorithm and bring down the computation cost to O(rc log rc), for an r × c array. Wedemonstrate the usefulness of our method by computing exceedance regions in mappingground water arsenic concentration in Bangladesh and by performing spatial interpolationin climate downscaling.
66
Co-authors:Debashis Mondal , Oregon State University.
Keywords: Arsenic mapping, Discrete cosine transformation, Climate Downscaling, Frac-tional Laplacian differencing, Incomplete Cholesky, Lanczos algorithm, Matern covari-ance, Spatial contour, Sublattice scale.
97. Contributed Talk Session: 26
Modeling Drought Index Attributes and Sea Water Temperature From Copula andTransmuted Marginal DistributionsPresenting Author: Mahdi, Smail.Institution: University of West Indies, Cave Hill Campus, Barbados.
Abstract:
In this paper, we present results on the modeling of the joint distribution of drought at-tributes (severity, duration, interval time,..) as defined, for instance, in Shiau and Modar-res (2009) and Chen et al. (2011), combined with sea water temperature values. Monthlytemperature and rainfall data from the Caribbean region are considered and correspond-ing drought attributes are computed from the SPI (standardization precipitation index)advocated in Mc Kee et al. (1993). For the characterization of the dependence structure,Elliptical (Gaussian and Student) and Archimedean copulas are considered; their good-ness of fit are adequately compared. Similarly, transmuted distribution functions followingthe application of the quadratic rank transmutation map (QRTM) advocated in Shaw andBuckley (2009), as already applied in Mahdi (2017), are considered for the fitting of theunderlying marginal distribution functions. Forecast of drought events and multivariatereturn periods from the derived joint distribution are also discussed.
References:
[1] Chen, Lu, Singh, Vijay P. and Guo, Shenglian. Drought analysis based on copula (2011). Symposium of Data-Driven Approaches to Droughts. (2011).
[2] Mahdi, S. ·Goodness of fit application with Weibull and Rayleigh type distributions·. Poster, Barbados Science andTechnology Symposium, (2017).
[3] Mc Kee TB, Doesken J., Kleist J., The relationship of drought frequency and duration to time scales. Proceedingsof the 8th conference on applied climatology Boston, 179-184. AMS (1993).
[4] Shiau, J.T & Modarres, R. Copula-based drought severity-duration-frequency analysis in Iran. Meteorological Ap-plications, 16:481-489. (2009).
Keywords: Drought index, copula, forecast, return period.
98. Contributed Talk Session: 26
A Goodness-of-fit Test for Spatial TrendsPresenting Author: Meilan-Vila, Andrea.
67
Institution: Universidade da Coruna, Spain.
Abstract:
A common task in statistics is to determine whether a parametric model is an appropriaterepresentation of a dataset. As part of this determination, it is advisable to formally testthe model, by treating the parametric model as the null hypothesis against an alternativemodel and evaluating the probability of obtaining the observed data under the null hy-pothesis. The choice of the alternative hypothesis model is crucial in this determination.Nonparametric models may be a choice for modeling the alternative hypothesis, sincethese models are quite flexible and, furthermore, they do not require assumptions (orweak assumptions) about the underlying function. In the literature, under the assumptionof independence of the observations, some authors have developed goodness-of-fit testsfor parametric models that rely on a smooth alternative estimated by a nonparametricregression method. This work is framed in the context of spatial stochastic processes,which consists of collections of random variables indexed on a certain domain of Rd, witha well-defined joint distribution. The observed data tend to exhibit an important feature:close observations tend to be more similar than observations which are far apart. There-fore, such observations cannot be treated as independent and the dependence structureshould be taken into account in any descriptive or inferential procedure. In particular, fromthe perspective of regression models (trend surfaces), the dependence structure shouldbe considered and properly introduced into the model. The aim of this work is to proposeand analyze the behavior of a test statistic to assess a parametric trend surface. Finitesample performance of the test is addressed by simulation, introducing a bootstrap cali-bration procedure. A real data analysis is provided to illustrate the proposed methodology.
Co-authors:Mario Francisco-Fernandez, Universidade da Coruna Crujeiras, Spain.Rosa M., Universidad de de Santiago de Compostela, Spain.
Keywords: Model checking, Spatial trend, Smoothing, Least squares.
99. Contributed Talk Session: 26
Exposure to Pm 2.5 in Mexico City·s Metropolitan Area and Its Association withObesityPresenting Author: Tamayo y Ortiz, Marcela.Institution: National Institute of Public Health (NIPH), Cuernavaca, Mexico.
Abstract:
In Mexico City’s Metropolitan Area (MCMA), home to over twenty million persons, air qual-ity usually surpasses the standards for PM 2.5, and obesity is highly prevalent. Recentstudies suggest inflammation as a possible link between PM 2.5 exposure and this dis-ease, however epidemiologic research on this subject is scarce and has not been studiedin a representative sample of the MCMA. We used data from the 2006 and 2012 MexicanSurveys of Health and Nutrition that have a multistage probabilistic sampling design, to
68
estimate the association between PM 2.5 exposure and obesity in a representative sam-ple of adults, adolescents 10-18 years old and children 2-9 years old from the MCMA. Theyearly average PM 2.5 exposure was calculated for each participant·s block address us-ing satellite data, calibrated with the air quality network of ground air monitors. We usedthe sampling weights and clusters of the survey to estimate logistic regression modelsthat were adjusted for age, sex, SES and tobacco (except in children); estimation wasdone with STATA svy program. Prevalence (% (95% C.I) of obesity was 29.9% (27.7-32.3) in 2006 and of 31.5% (28.5-34.6) in 2012 for adults; of 16.6% (13.5-20.3) in 2006and of 15.9% (13.5-18.4) in 2012 for adolescents, and of 21.3% (17.7-25.5) in 2006 andof 18.8% (16.4-21.5) in 2012 for children. An increase of 10 µg/m3 in the annual expo-sure to PM 2.5 was associated with obesity in adults for 2012, OR=2.73 (p=0.05, 95%C.I. 0.96-7.70) and in adolescents, for 2006 OR=3.40 (0.008; 1.39-8.26) and for 2012,OR=3.79 (0.01; 1.40-10.23). Results were inconclusive for children. Although obesity isa multifactorial disease, PM 2.5 might be an environmental risk factor contributing to thisworld-wide epidemic.
Co-authors:Tellez-Rojo, NIPH, Mexico.P Rojas Saunero, Hospital Italiano de Buenos Aires, Argentina.SJ Rothenberg, NIPH, Mexico.A Just, Icahn Schoool of Medicine at Mount Sinai, NY, USA.I Kloog, Ben-Gurion University of the Negev Berseba, Israel.JL Texcalac, M Romero, M Hurtado-Diaz, O Chilian-Herrera and LF Bautista-Arredondo,NIPH, Mexico.J Schwartz, Harvard T.H. Chan School of Public Health, Boston, USA.H Riojas, NIPH, Mexico.
100. Contributed Talk Session: 26
A Goodness of Fit Test for Extreme Value Distributions and Its Application for Mod-eling Maximum Concentrations of Air PollutantsPresenting Author: Villase·or, Jose A.Institution: Colegio de Postgraduados, Mexico.
Abstract:
A goodness-of-fit test is proposed for the Gumbel extreme value distribution hypothesis,which can also be used for testing the Frechet and Weibull distribution hypotheses aftertransforming the observations to Gumbel variables. The test statistic is the ratio of twoestimators for the population variance of the Gumbel distribution, similarly to Shapiro-Wilkstatistic for testing normality. Monte Carlo simulation results provide evidence that the newtest is competitive with Anderson-Darling test. This test is applied to a data set containingmonthly maximum ozone levels registered in the southwest of Mexico City during theSpring seasons from 2008 to 2016 for modeling the distribution function of such maxima.
Co-authors:
69

Gonzalez, Elizabeth. Colegio de Postgraduados, Mexico.
Keywords: Air pollution at Mexico City, Gumbel distribution, tests of hypotheses.
Posters
101. Poster Session: Poster
Estimation of Historic Pm2.5 Concentrations Using the Pm2.5-pm10 Ratio in MexicoCity Metropolitan AreaPresenting Author: Chilian Herrera, Olivia Lingdao.Institution: National Institute of Public Health, Mexico.
Abstract:
The Air Quality Monitoring System is the main source of particulate matter data in theMexico City (MC) and Metropolitan Area (MA). The monitoring system’s gradual develop-ment has produced variable coverage data throughout space and time, making difficult touse it for epidemiological studies. The WHO suggests to use the PM2.5-PM10 ratio (PMR)for PM2.5 estimation when only PM10 data is available.The aim was to estimate PM2.5 concentrations in the MC and MA using the PMR for 2003to 2016, in order to increase space-time coverage data for epidemiological studies.The monitoring stations (MS) that measured simultaneously PM2.5 and PM10 were iden-tified year by year. For each, the hourly PMR were estimated. Then, monthly and annualhourly PMR average were obtained. The hourly PM2.5 missing values in this MS wereimputed by dividing the PM10 hourly data available between the annual hourly PMR av-erage.In the MS that measured only PM10, PM2.5 monthly data was imputed using the monthlyPMR average considering the location of the MS. The PM2.5 annual averages for eachMS, for MC and MA were estimated. Pearson’s correlation analysis and statistical sig-nificance tests were carried out between imputed and measured data. Procedures weredone using R 3.4.1. and Stata 14.Higher annual hourly PMR average was observed in MC than in MA (54 vs 50%, p <0.000), and similar to the PMR suggested by the WHO (50%). PM2.5 was estimated for 101MS which measured PM10 only, and for 5 MS which measured both. High concordancewas observed between hourly data measured vs estimated for MS located in MC (R2 =0.83) and in MA (R2 = 0.73). Most PM2.5 annual averages were no statistically different(data imputed included vs only measured data).Our results show that the PMR is an adequate method to robustly estimate space-timePM2.5 when only PM10 data is available. This study establishes a precedent for otherurban areas where monitoring systems are growing and information of PM2.5 might notbe available.
Co-authors:
70
JL Texcalac-Sangrador, M Tamayo-Ortiz, SJ Rothenberg, R Lopez-Ridaura R and MMTellez-Rojo, National Institute of Public Health, Cuernavaca, Morelos, Mexico.
102. Poster Session: Poster
Climate Forcing and Extreme Events. Parana and Uruguay River’s Case of StudyPresenting Author: Meis, Melanie.Institution: Atmospheric and Oceanic Department of the Universidad de Buenos Aires,Argentina.
Abstract:
Due to climate change and its impact in the precipitation, it is necessary to continuethe studies of extreme events. This work focuses on the ones that take place in river’sdischarges. We propose to analyse extreme streamflow events in the La Plata Basin,particularly in Parana and Uruguay rivers. We start by obtaining the diphase betweenNI·O 3.4, SOI indices and seasonal discharges. We leverage these results and computethe probability of joint occurrence of extreme events and the corresponding return period.Moreover, we estimate the probability of extreme streamflow events, given values of theindex from previous period.
Co-authors:Maria Paula Llano.
Keywords: climate forcing, copulas, extreme events, discharge.
103. Poster Session: Poster
Mapping Review of Experts on Air Quality and HealthPresenting Author: Mejıa Ochoa, Maria Salome.Institution: Universidad de Antioquia, Colombia.
Abstract:
Introduction: In the municipalities that are part of the metropolitan area of Valle de Aburrawhere the air pollution has showed from March to April in the last two years episodes of bigimpact characterizing for daily concentration by PM2,5 was 88,5 ·g/m3 on average. Theenvironmental and health Institutions and the citizens in general have been recognizingthe impact that has the poor air quality over the public health. The purpose to generatescientific evidence about this problematic, since December 2016, “Area Metropolitanadel Valle de Aburra” agreement with Antioquia’s University department of national publichealth by the contract CCT1088. Antioquia’s University developed the project about airpollution and their health effects in people from Valle de Aburra- Medellin in 2008-2016.In order to know the correlation between the polluting behavior and some events healthsentinels.
71
Objetive: Within the framework of this, the Mapping Review of experts on air quality andhealth was developed, whose main objective was to identified the researcher, groups andnetworks that have studied the relationship between health and air pollution, to push for-ward the construction of a database from which we can start the processes of generationof collaborative work networks around a research agenda on the subject in the metropoli-tan area of Valle de Aburra.Methods: A systematic review type Mapping Review in Colombia, Brazil, Chile, Mexico,Spain and the United States. Two search strategies were designed with inclusion andexclusion criteria that allowed the identification of different professionals. The analysis ofresults was supported through coded matrices.Results: A database was built in which 137 professionals, 81 institutions and 53 activeresearch groups were included in the 2008-2016 period. In addition, some of the researchpriorities were identified according to some of the professionals identified and selected inthe mapping.Conclusions: The capacity and human resources in which the country and the region hasto advance research in the problem are evident, where the Universities stood out as themain knowledge managers in this field and research priorities coincide in a significant waramong the different areas of knowledge.
Co-authors:Tatiana Mosquera Rivas and Juan Gabriel Pineros Jimenez, Universidad Nacional de LaPlata, Argentina.
Keywords: Search strategy, Mapping Review, Air Pollution, Health, air and health.
104. Poster Session: Poster
A Spatio-temporal Study of Maximum Extremes Rainfalls in Guanajuato State, Mex-icoPresenting Author: Moreno, Leonardo.Institution: Fcea, Udelar, Uruguay.
Abstract:
A topic of current interest are extreme climatic events. An increasing concern with the cli-mate variability due to the large impact that it causes on the population and the Economyis perceived. The aim is to establish a space-time model for the values of daily rainfallin the State of Guanajuato, Mexico, from meteorological stations located in the region.While the natural path for spatial extension of the theory of extremes value are max-stable processes and inference on that family of processes is currently inflexible and ithas a large computational cost. Lack of space stationarity is explored. Finite dimensionalfit through extreme copulas and its extension to higher dimensions is provided by regularvines. This research shows the close relation between the finite dimensional distributionsof max-stable processes and extreme copulas. Predictions are compared, using differentmax-stable processes and r-vines, where the last provide a possible solution to the prob-lem of non-stationarity. New conclusions about the behavior of maximum rainfalls in theregion are stated. Global predictions show that severe flooding could in the State affect.
72

Co-authors:Leonardo Moreno, Facultad de Ciencias Economicas, UDELAR, Uruguay.Ortega, Joaquın. Centro de Investigacion en Matematicas, CIMAT, Guanajuato, Mexico
Keywords: Multivariate extremes, Max-stable processes, Extreme-value copula, RegularVines.
73