Cationes base en la lluvia de Los Andes Venezolanos en la ...
12
Artículo de Investigación. Revista Ciencia e Ingeniería. Vol. 34, No. 3, pp. 153-164, agosto-noviembre, 2013. ISSN 1316-7081. ISSN Elect. 2244-8780 Universidad de los Andes (ULA) Revista Ciencia e Ingeniería. Vol. 34, No. 3, agosto-noviembre, 2013 Cationes base en la lluvia de Los Andes Venezolanos en la Hechicera, Venezuela Base cations in rainwater from a Venezuelan Andes urban site at la Hechicera, Venezuela Calderón, Silvia Margarita 1* ; Calderón, M Nayret Y. 1 ; Larez, Francis 1 ; Iglesias, S. Edinzo 1 ; Ramírez, Oneida 2 ; Hernández, Julio 2 ; Sosa, Daisy 2 ; Anderez, José María 1 ; Hoffmann, Pedro 1 ; Krejci, Radovan 3 1 Laboratorio para la Caracterización Físico-Química y Modelado de la Atmósfera (FIQMA), Universidad de Los Andes. Mérida, Venezuela 2 Escuela de Ingeniería Química, Universidad de Los Andes. Mérida, Venezuela 3 Stockholm University, Department of Applied Environmental Sciences (ITM), SE- 106 91 Stockholm, Sweden *[email protected] Resumen Son escasos los estudios sobre química atmosférica para Sur América, especialmente para Venezuela. Aquí se muestra el análisis de la composición química de muestras de lluvia recolectadas diariamente en La Hechicera (Mérida, Venezuela) bajo la modalidad sólo lluvia. El muestreo (Marzo-Junio 2011) cumplió con los criterios internacionales para la cobertura de precipitación (82.4 %) y completitud de la composición química para Ca +2 y Mg +2 (77.2 %, n=73), Na + (60.4 %, n=34) y K + (63.3%, n=38). En todas las muestras, las concentraciones de Ca +2 y Mg +2 estuvieron por debajo de los límites de de- tección (Ca +2 <1.8 μeq L -1 ; Mg +2 < 0.4 μeq L -1 ). Las concentraciones ponderadas por volumen para K + y Na + fueron res- pectivamente 0.04 ± 0.01 ppm (1.0 μeq L -1 ) y 0.14 ± 0.04 ppm (6.2 μeq L -1 ); para flujos de deposición húmeda equivalentes a 49 ± 46 mg m -2 año -1 (130 μg m -2 año -1 ) y 177 ± 168 mg m -2 año -1 (480 μg m -2 día -1 ). Los valores de pH y conductividad fueron usados para estimar la fracción desconocida de la composición química, y la fracción ácida, estimándose valores promedios de 31.7% ± 22.9 % para la fracción ácida; y 2.9 ppm ± 2.6 ppm para la concentración iónica. Esto indicó que un 92.0 % ± 15.3 % de la composición química es desconocida. Los bajos valores para la concentración de cationes base, sodio y conductividad de las muestras sugieren una atmósfera limpia con emisiones naturales. La correlación positiva entre los ions K + y H + , y Na + y H + sugieren a la quema de biomasa (madera, vegetación) como principal fuente. Los bajos valo- res para los flujos de deposición húmeda para los cationes base representan un problema a futuro, pues si la deposición atmosférica no compensa los iones lixiviados, los suelos merideños pudieran perder sus nutrientes y la capacidad para ser cosechados. Palabras clave: lluvia ácida; deposición húmeda; neutralización de acidez libre; conductividad calculada; concentración ponderada por volumen. Abstract Atmospheric chemistry studies are scarce for South-American, especially for Venezuela. We studied the rainwater chemistry of La Hechicera (Mérida, Venezuela) using 24-h samples collected using a wet-only rain collector from March, 2011 to June, 2011. Samples were analyzed using atomic absorption spectroscopy for base cations (K + , Ca +2 and Mg +2 ) and sodium (Na + ), pH and conductivity using the international suggested standards methods. We reached a precipitation coverage of 82.4 % and a total precipitation of 77.2 % for calcium and magnesium; 60.4% for sodium and 63.3% for potassium. Calci- um and magnesium concentrations were under detection limits (n=73; <1.8 μeq L -1 and < 0.4 μeq L -1 for calcium and magnesium respectively). For potassium and sodium we found volume-weighted average concentrations of 0.04 ± 0.01 ppm (1.0 μeq L -1 ) and 0.14 ± 0.04 ppm (6.2 μeq L -1 ), and wet depositions fluxes of 49 ± 46 mg m -2 year -1 (130 μg m -2 day -1 ) and 177 ± 168 mg m -2 year -1 (480 μg m -2 day -1 ), respectively. We used pH and conductivity values to estimate the ionic mass concentrations and the acid fraction of samples. Average values were 31.7% ± 22.9 % for the acid fraction and 2.9 ppm ± 2.6 ppm for the ionic mass concentration. This suggested that 92.0 % ± 15.3 % of the rain composition was unknown. Even though the low levels for base cation concentrations and conductivity, and the low acid fractions and the low ionic mass
Transcript of Cationes base en la lluvia de Los Andes Venezolanos en la ...

Artículo de Investigación. Revista Ciencia e Ingeniería. Vol. 34, No. 3, pp. 153-164, agosto-noviembre, 2013.
ISSN 1316-7081. ISSN Elect. 2244-8780 Universidad de los Andes (ULA)
Revista Ciencia e Ingeniería. Vol. 34, No. 3, agosto-noviembre, 2013
Cationes base en la lluvia de Los Andes Venezolanos en la
Hechicera, Venezuela
Base cations in rainwater from a Venezuelan Andes urban site at
la Hechicera, Venezuela
Calderón, Silvia Margarita 1*
; Calderón, M Nayret Y.1; Larez, Francis
1; Iglesias, S. Edinzo
1; Ramírez, Oneida
2;
Hernández, Julio 2; Sosa, Daisy
2; Anderez, José María
1; Hoffmann, Pedro
1; Krejci, Radovan
3
1Laboratorio para la Caracterización Físico-Química y Modelado de la Atmósfera (FIQMA),
Universidad de Los Andes. Mérida, Venezuela 2Escuela de Ingeniería Química, Universidad de Los Andes. Mérida, Venezuela
3 Stockholm University, Department of Applied Environmental Sciences (ITM), SE- 106 91 Stockholm, Sweden
Resumen
Son escasos los estudios sobre química atmosférica para Sur América, especialmente para Venezuela. Aquí se muestra el
análisis de la composición química de muestras de lluvia recolectadas diariamente en La Hechicera (Mérida, Venezuela)
bajo la modalidad sólo lluvia. El muestreo (Marzo-Junio 2011) cumplió con los criterios internacionales para la cobertura
de precipitación (82.4 %) y completitud de la composición química para Ca+2
y Mg+2
(77.2 %, n=73), Na+ (60.4 %, n=34)
y K+ (63.3%, n=38). En todas las muestras, las concentraciones de Ca
+2 y Mg
+2 estuvieron por debajo de los límites de de-
tección (Ca+2
<1.8 µeq L-1
; Mg+2
< 0.4 µeq L-1
). Las concentraciones ponderadas por volumen para K+ y Na
+ fueron res-
pectivamente 0.04 ± 0.01 ppm (1.0 µeq L-1
) y 0.14 ± 0.04 ppm (6.2 µeq L-1
); para flujos de deposición húmeda equivalentes
a 49 ± 46 mg m-2
año-1
(130 µg m-2
año-1
) y 177 ± 168 mg m-2
año-1
(480 µg m-2
día-1
). Los valores de pH y conductividad
fueron usados para estimar la fracción desconocida de la composición química, y la fracción ácida, estimándose valores
promedios de 31.7% ± 22.9 % para la fracción ácida; y 2.9 ppm ± 2.6 ppm para la concentración iónica. Esto indicó que
un 92.0 % ± 15.3 % de la composición química es desconocida. Los bajos valores para la concentración de cationes base,
sodio y conductividad de las muestras sugieren una atmósfera limpia con emisiones naturales. La correlación positiva entre
los ions K+ y H
+, y Na
+ y H
+ sugieren a la quema de biomasa (madera, vegetación) como principal fuente. Los bajos valo-
res para los flujos de deposición húmeda para los cationes base representan un problema a futuro, pues si la deposición
atmosférica no compensa los iones lixiviados, los suelos merideños pudieran perder sus nutrientes y la capacidad para ser
cosechados.
Palabras clave: lluvia ácida; deposición húmeda; neutralización de acidez libre; conductividad calculada; concentración
ponderada por volumen.
Abstract
Atmospheric chemistry studies are scarce for South-American, especially for Venezuela. We studied the rainwater chemistry
of La Hechicera (Mérida, Venezuela) using 24-h samples collected using a wet-only rain collector from March, 2011 to
June, 2011. Samples were analyzed using atomic absorption spectroscopy for base cations (K+, Ca
+2 and Mg
+2) and sodium
(Na+), pH and conductivity using the international suggested standards methods. We reached a precipitation coverage of
82.4 % and a total precipitation of 77.2 % for calcium and magnesium; 60.4% for sodium and 63.3% for potassium. Calci-
um and magnesium concentrations were under detection limits (n=73; <1.8 µeq L-1
and < 0.4 µeq L-1
for calcium and
magnesium respectively). For potassium and sodium we found volume-weighted average concentrations of 0.04 ± 0.01 ppm
(1.0 µeq L-1
) and 0.14 ± 0.04 ppm (6.2 µeq L-1
), and wet depositions fluxes of 49 ± 46 mg m-2
year-1
(130 µg m-2
day-1
) and
177 ± 168 mg m-2
year-1
(480 µg m-2
day-1
), respectively. We used pH and conductivity values to estimate the ionic mass
concentrations and the acid fraction of samples. Average values were 31.7% ± 22.9 % for the acid fraction and 2.9 ppm ±
2.6 ppm for the ionic mass concentration. This suggested that 92.0 % ± 15.3 % of the rain composition was unknown. Even
though the low levels for base cation concentrations and conductivity, and the low acid fractions and the low ionic mass

Calderón y col.
Revista Ciencia e Ingeniería. Vol. 34, No. 3, agosto-noviembre, 2013
154
concentrations in our samples indicated a clean atmosphere, mainly affected by natural emissions. Positive correlation fac-
tors between K+ and H
+ and Na
+ and H
+ suggested the biomass burning as a possible source for these ions. The low levels
of base cations in rain represent a future problem because if atmospheric deposition cannot compensate the cation losses,
Mérida’s soils can become deficient in nutrients.
Key words: Acid rain; wet deposition, free acidity, conductivity calculation; volume weighted average concentration.
1 Introducción
Atmospheric deposition is fundamental for the equilib-
rium of biogeochemical cycles. The weathering of soil par-
ent rock material releases minerals from soils, leaving them
free to be transported to the atmosphere as airborne particles
(soil dust). When soil dust is scavenged by water droplets,
minerals in their ionic form can be deposited over terrestrial
an aquatic surfaces by rain, mist, fog, snow or ice, or simply
by mechanical processes such as sedimentation or intercep-
tion. Both pathways are identified as wet and dry deposition
respectively (J. H. Seinfeld, 1997). Wet deposition has been
widely studied in the last decades, mainly due to its nega-
tive role (acid rain, euthrophication, nuclear rain, etc.)
However its positive side effects can be seen when nutri-
ents, such as potassium and calcium, are deposited over
poor soils (Montes and San Jose, 1989) or aminoacids over
lakes where fishery occurs (Méndez, 2009)
This study pretended to know more about the wet dep-
osition flux at La Hechicera, Mérida, Venezuela. It was fo-
cused on potassium, magnesium, calcium and sodium rain-
water concentrations. The first three ions are grouped and
identified as base cations, because they help to regulate the
soil pH, buffer the acid inputs from precipitation and plant
decomposition, and provide the plant macronutrients
(Green, et al., 2004). Atmospheric deposition and weather-
ing are the major inputs to the soil base cation pool, mean-
while harvesting and leaching are the sinks. Weathering is a
very slow process, therefore if deposition cannot compen-
sate the cation losses, soils can become deficient in nutri-
ents (Akselsson, et al., 2007), especially if rains and soils
are acidic. Hydrogen ions can break the electrostatic attrac-
tions that keep bonded the base cations to the clay particles
and organic matter, leaving them free to be leached from the
soil matrix (Green, et al., 2004)
Base cations also play an important role regulating the
pH of rainwater and together with ammonium and hydrogen
ions are the most important contributors to the positive ionic
charge and electrical conductivity of rainwater (Hedin and
Likens, 1996). Nitric and sulphuric acids, formed in the
presence of water and nitrogen and sulphur oxides from the
combustion emissions of biofuels (wood, vegetation, etc.)
or fosil fuels, can be neutralized by base cations in
raindrops. As an example of this process, Tirupati, an indus-
trialized city of India, showed alkaline rains with pH rang-
ing from 6.13 to 7.74 not due to lack of acidity but rather
due to an excess of basic cations, especially calcium, com-
ing from alkaline soil dust (Chandra Mouli, et al., 2005).
Another example can be seen in rains from Maracaibo city,
Venezuela; where ammonium (industrial and natural emis-
sions), calcium and magnesium (from marine and crustal
sources) neutralize sulfate, nitrate and chloride ions (from
industrial emissions), leaving just 5 % of free acidity in rain
(Sánchez, et al., 2009).
Base cations are essential nutrients for plant develop-
ment and growth. Their ionic forms allow the root devel-
opment and chlorophyll production (Navarro and Navarro,
2003). In soils, together with sodium, they define the soil
resistance to acidification, its ionic exchange capacity and
its base saturation (Akselsson, et al., 2007). Studies on Cen-
tral Amazonian forests showed that fine root growth is re-
stricted by both soil pH and low Ca. Higher fine root pro-
duction was observed after addition of CaCl2 and CaCO3
using ingrowth bags (Luizão et al., 2007)
If base cations are present in rainwater with specific ra-
tios and correlations between them, it is possible to identify
the emission sources affecting a monitoring place. For ex-
ample, marine sources can be identified if ions such as so-
dium, chloride, magnesium and potassium, are present with
ratios between them of 1.8 for Cl-/Na
+, 0.04 for K
+/Na
+ and
Mg+2
/Na+, 0.12 for Ca
+2/Na
+ (Chandra Mouli, et al., 2005);
and also if they show good correlations with chloride con-
centrations (r2 > 0.60 at 95% confidence level) (Tiwari, et
al., 2007) If crustal emissions are present there must be
good correlations between one another for Ca+2
, Na+, Mg
+2
and K+ (Tiwari, et al., 2007). Crustal emissions are an im-
portant source when a factor analysis reveals good correla-
tions between concentrations of K+, Al
+3, Cr
+2, Mg
+2, Ca
+2,
Ni+2
, Sr+2
, Ti+, NO3
- and SO4
-2. This has been observed in
rainwater samples collected close to unpaved roads
(Türküm, et al., 2008;Artiñano, et al., 2009). Good correla-
tions with Na+, Ca
+2, Mg
+2, NH4
+, Cl
-, and SO4
-2 concentra-
tions are expected for marine sources (Jacobson, 2002). A
good correlation between Ca+2
and Mg+2
suggests crustal
sources such as unpaved roads, wind blown dust from bare
soils and ploughing (Zunckel, et al., 2003). Sources for each
ion can be numerous, and each one has specific ratios for
ionic concentrations in atmospheric samples. In the case of
sodium, its non-marine sources can be ethanol and wood
burning with a Cl-/Na
+ ratio of 0.26 and cement particles
from construction areas (Dos Santos, et al., 2007). In the
case of potassium, its crustal sources can be potassium feld-
spar (KAlSi3O8) from granite rocks and potassium oxide
K2O (Jacobson;Adams, 1995), fertilizers (Muriate of Potash

Cationes base en la lluvia de los Andes Venezolanos… 155
Revista Ciencia e Ingeniería. Vol. 34, No. 3, agosto-noviembre, 2013
KCl, Sulfate of Potash K2SO4; Potassium Magnesium Sul-
fate K2SO4.2MgSO4; Nitrate of Potash KNO3; potassium
phosphate KH2PO4; potassium carbonate K2CO3; potassium
hydroxide KOH; potassium thiosulfate K2S2O3), marine
spray and wood burning. Potassium is also a tracer of wood
burning emissions (J. H. Seinfeld, 1997), also has been de-
tected together with calcium ions after episodes of vegeta-
tion burning (Sanhueza, et al., 1992) Potassium can be
scavenged from coarse particles from soil weathering and
from fine particles in wood combustion gases (Zunckel, et
al., 2003). In general, sources of the same nature can be ex-
pected for calcium and magnesium. Minerals in soil dust
containing calcium and magnesium can be calcite (CaCO3),
dolomite (CaMg(CO3)2), gypsum (CaSO4–2H2O) and ep-
somite (MgSO4-7H2O) (Jacobson, 2002). Other calcium
sources can be biomass and vegetation burning, but in this
case calcium concentrations in rainwater are well correlated
to the other basic cations and also to organic acids such as
formic acid (Sanhueza, et al., 2003), and NO3- and SO4
-2
concentrations (Jacobson, 2002).
Although the available literature offers thousands of
papers about the chemical composition of rainwater for
North America, Asia and Europe, there are very few studies
about rain chemistry in Venezuela. Those available are fo-
cused on highly industrialized cities or pristine or rural
places in preserved areas such as national parks. In general,
almost nothing is known about the atmospheric chemistry
for the rest of the country. We studied the chemical compo-
sition of rainwater samples collected at La Hechicera, Ven-
ezuela in order to continue a previous study on acid wet
deposition, the first one for our city. Our inter-annual com-
parison study at this monitoring site showed acidity and
conductivity levels similar to those observed in pristine are-
as of high altitude in tropical regions. Weighted average pH
values were 4.97 (n=34, 2007-2008) and 5.07 (n=42, 2011),
while the weighted average conductivity was 5.13 ± 0.12 µS
cm-1
(n=42, 2011). The average acid wet deposition flux
was 122 ± 114 g ha-1
year-1
, reflecting the highly variable
annual precipitation rates during years.
Our study gained an initial understanding of rainwater
chemistry in order to know more about the influence of an-
thropogenic activities over the atmosphere and soils, espe-
cially about the processes affecting the base cation pool of
soils. This is particularly important because Mérida’s econ-
omy is mainly based on agriculture, and their soils are acid-
ic with low cation exchange capacities and base saturation
values, showing a remarkable susceptibility to acid rain and
base cation deposition, especially due to the high annual
precipitation rates.
2 Methodology
2.1 Sampling Monitoring Site
The sampling campaign was conducted at a urban site
at high altitude in La Hechicera, Mérida, Venezuela (N08
37.728; W71 09.005; 1,880 masl). The monitoring site is
inside La Hechicera Campus of Universidad de Los Andes,
~3.6 km in straight line from Mérida downtown (Figure 1).
The site is surrounded by green areas (with pine forests), it
has paved and unpaved roads with low traffic rates. Alt-
hough there are not emission inventories for Mérida State,
our site could be affected by combustion emissions from
vehicles and vegetation burning, chemicals from laboratory
hoods, fertilizers and other substances coming from agricul-
tural activities and dairy cattle at Santa Rosa (< 1 Km in
straight line from the site). The campus is practically en-
closed by mountains from La Culata mountain chain. As
winds blow typically from there, natural emissions from
vegetation and soil weathering are likely. These mountains
belong to the La Culata National Park. There are evidences
of a particular microclimate for this area, especially because
shows higher precipitation rates compared to the city. (Red
de Estaciones Bioclimaticas, 2007). The relation between
pH and precipitation rates from our previous study did not
show signals of long-range transport of air masses from
more polluted areas. More details about Mérida State can be
found elsewhere (Calderón, et al., 2013).
Fig. 1. Rose Wind for La Hechicera meteorological station (2000, 2002-2004) relative to the sampling site, labeled as LAB FIQMA
(WRPlot View Lakes Environmental Software, 2011; Google Earth, 2012;
Red de Estaciones Bioclimáticas, 2007)
We used a wet-only rain sampler designed, tested and
donated to our research group by the Stockholm University.
The rain sampler was positioned and operated following the
recommendations presented by the Global Atmospheric
Watch- Precipitation Programme from the World Meteoro-
logical Organization (WMO/GAW-PC) (World Meteoro-
logical Organization, 2004).
2.2 Sampling Campaign, Sampling Collection, preparation
and Analysis
24-hour samples were collected from March 1st, 2011
and June 16th
, 2011. The completeness criterions
(WMO/GAW-PC) for precipitation monitoring were over
passed for a quarter period with values of 82.4% (World
Meteorological Organization, 2004). We collected a total of
Calderón y col.
Revista Ciencia e Ingeniería. Vol. 34, No. 3, agosto-noviembre, 2013
156
73 rain samples, 15 of them were contaminated (mainly
with insects), leaving a total of 58 valid samples, from
which just 43 samples had enough volume for pH and con-
ductivity measurements. The Total Precipitation (TP), vari-
able that represents the completeness of precipitation depth
associated with valid chemical analysis and valid sample
collection (World Meteorological Organization 2004) was
77.2 % for calcium and magnesium; 60.4% for sodium and
63.3% for potassium. TP values were lower for sodium and
potassium because some samples could not be analyzed
immediately after defrosting and were lost. In all cases TP
values were over 60% as required for a quarter period
(World Meteorological Organization, 2004)
Daily precipitation rates were estimated using the col-
lection surface area, sample weights and monitoring time.
Hourly precipitation rates were estimated using the time
during which the collector was opened. There were not ac-
tive meteorological stations around our lab during our sam-
pling period.
Immediately after collection and thermal equilibration,
samples were weighted and frozen in high density polyeth-
ylene (HDPE) bottles without filtration or biocide addition.
Sample weights were measured using an electronic scale
with 0.01 g of tolerance and 3,100 g of capacity (PA3102
Pioneer, Ohaus, USA). The collector surface at the rain
sampler was rinsed with deionized (DI) water every day be-
fore collecting a new sample. Pure ethanol (Riedel de Haën,
Germany) was used to clean any carbonaceous deposits at
the rain collector before rinsing with DI if necessary.
All materials were washed with distilled water and
rinsed with DI water (~1.0 µS cm-1
). The use of fresh DI
water was impossible; however the conductivity was
checked every day and water was not used when it over-
passes the limit of 1.0 µS cm-1
. Contamination levels were
tested using lab and field blanks prepared with DI water
from rinses of laboratory materials, containers and the rain-
water collector surface. Lab and field blanks were analyzed
every 5 or 7 days and processed identically to the samples.
Samples were analyzed for duplicate or triplicate when
possible. All sampling and analytical procedures were done
as possible in accordance with WMO/GAW criteria and
standards. The protocols followed for conductivity and pH
measurements can be found elsewhere (Calderón, et al.,
2013). Basic cations were measured by atomic absorption
(AAS) and atomic emission spectrometry (AES) using a
Spectrophotometer (VARIAN, SpectrAA55B, EE.UU). In-
dividual calibration curves with five points were prepared
by sequential dilution from 1000 ppm certified standard so-
lutions (UltraScientific, USA) by weighting using a micro-
analytical scale (Tolerance 0.0001 g, Denver Instrument
Company AA-160). Three standard check solutions per ion
were prepared from 1000 ppm certified standard solutions
from a different supplier (MERCK, Germany). Standard
check solutions (0.25 ppm and 0.5 ppm for sodium and po-
tassium, 0.1 and 0.25 ppm for calcium and magnesium)
were always ± 20 % around the expected values. In order to
avoid interferences, a solution of Cesium-Lanthanum (1
ppm CsCl2 and 0.5 ppm La2O3 from ) was added to all cal-
ibration and check solutions, samples and blanks as sug-
gested by WMO/GAW-PC (World Meteorological Organi-
zation, 2004). All solutions were prepared using fresh
deionized water. Calcium and Magnesium were measured
by AAS using an acetylene/nitrous oxide flame with indi-
vidual hollow cathode lamps (VARIAN, EE.UU) at 422.7
nm and 285.2 nm, respectively. Sodium and potassium were
measured by AES at 589 nm and 766.5 nm using an
air/acetylene flame. Correlation coefficients for all calibra-
tion curves were higher than 0.999. Detection limits were
estimated using the IUPAC method (Harris, 2001) and their
values were 0.035 ppm, 0.005 ppm, 0.009 ppm and 0.0024
ppm for calcium, magnesium, potassium and sodium, re-
spectively.
2.3 Statistical Analyzes and Calculations
Results from sample replicates were compared and av-
eraged to find random errors associated with procedures. In
the case of sodium and potassium, blank concentrations
were subtracted from sample concentrations in order to iso-
late the atmospheric sources. This procedure was not neces-
sary for calcium and magnesium. The normality of the data
was verified using probability plots. Correlation coefficients
and comparison analyses were calculated with a 95 % con-
fidence level.
Deposition fluxes (D± D) were calculated using vol-
ume weighted average concentrations and the mean precipi-
tation depth ( p ) with their errors using equations present-
ed everywhere (Calderón, et al., 2013).
3 Results
3.1 Descriptive Statistics
During 108 days of monitoring we collected 73 rain-
water samples. The average daily precipitation rate was
16.4 ± 15.6 mm d-1
. Quartiles for this variable were [5.4,
11.5, 20.9] mm d-1
with a median absolute deviation of 7.2
mm d-1. The sampling site has a rainy weather during the
whole year with two peaks; one between April and May and
one between October to November (Ferrer and López,
2004). We chose to monitor the first peak especially be-
cause there are frequent vegetation burning episodes or for-
est fires at this time of the year. Quartiles for sample pH and
conductivity were [5.24, 5.09, 4.82] and [3.79, 5.10, 11.14]
µS cm-1
with an absolute median deviation of 2.58 µS cm-1
and a maximum value of 31.29 µS cm-1
. Levels for acidity
and conductivity were similar to those measured in remote
areas (affected just by natural emission sources and/or few
antropogenic sources) as explained in previous studies
(Calderón, et al., 2013)
Sodium, potassium and hydrogen ions concentrations

Cationes base en la lluvia de los Andes Venezolanos… 157
Revista Ciencia e Ingeniería. Vol. 34, No. 3, agosto-noviembre, 2013
are shown in Figure 2, together with the conductivity of the
rainwater samples and the daily precipitation rate for every
Julian day. There were not visible correlations between
concentrations, as it is expected when there are common
sources for ions. For example when fertilizers
(e.g.potassium-magnesium sulfate) are used around sam-
pling sites, raindrops could contain them from scavenging
of airborne particles; and we should find that the higher the
concentration of potassium the higher the concentration for
magnesium is in the rain samples.
All rainwater samples (n=73), even those contaminated
with insects or particles, and lab and field blanks, had con-
centrations of Ca+2
and Mg+2
under the detection limit
(<0.035 ppm equivalent to 1.75 µeq L-1
for Ca+2
and <0.005
ppm equivalent to 0.41 µeq L-1
for Mg+2
). In order to con-
firm this, a couple of samples were sent to a different labor-
atory for atomic absorption analyzes. Concentrations were
under 0.101 ± 0.003 ppm for calcium and 0.0028 ppm ±
0.0001 ppm for magnesium. This confirmed our laboratory
results.
It is hard to explain the low levels of calcium and
magnesium in our samples. We were expecting to find cal-
cium in our samples because it is known that calcium is a
major component in mineral soils in tropical mountain eco-
systems such as those at the Andean ecosystems. Due to the
higher precipitation rates and annual rainfall, Ca+2
should
be present in rain droplets after particle scavenging during
the erosion-leaching-dissolution-reprecipitation cycle
(González and Aristizábal, 2012) Calcium volume-weighted
mean average concentrations ranging from 14.6 µeq L-1
to
17.3 µeq L-1
were measured in rain from a bulk sampler at
three sites in the Colombian Andes close to Manizales city
(Colombia) Authors indicated that volcano ashes could be a
source for calcium due to the proximity of Nevado del Ruiz
volcano(González and Aristizábal, 2012). If we consider
that the cloud formation is taking place in a mountain re-
gion where glacier rocks are highly resistance to weather-
ing, there will not be enough minerals for rain scavenging.
After comparisons between this study and ours, we could
suggest that rain itself does not contain much Ca+2
and Mg+2
and the main source is dust and dry deposition.
34 samples were analyzed for sodium, ten of them
showed concentrations under the detection limit (<0.0024
ppm). Three samples showed concentrations out of the in-
terval of three times the interquartile range (IQR). This
could suggest long-range transport of air masses from sodi-
um sources (e.g. Maracaibo’s Lake); however there is no
way to know more without air trajectories or concentrations
for anions, such as chloride ions. We determined a median
and median absolute deviation equal to 0.040 ± 0.027 ppm.
25th
and 75th
percentiles were 0.023 ppm and 0.090 ppm,
with minimum and maximum values of 0.0103 ppm and
0.440 ppm. Sodium concentrations are low as expected for
continental areas due to the long distance between the sea
and our sampling site.
38 samples were analyzed for potassium, six of them
were under the detection limit (<0.009 ppm) and just one
was out of the 3*IQR interval. The median and absolute
deviation was 0.090 ± 0.055 ppm. 25th and 75th percentiles
were 0.049 ppm and 0.360 ppm, with minimum and maxi-
mum values of 0.0103 ppm and 1.375 ppm.
60 80 100 120 140 160 1800
0.5
Co
nce
ntr
atio
n
Na+ (ppm)
60 80 100 120 140 160 1800
1
2
K+ (ppm)
60 80 100 120 140 160 1800
0.05
0.1
H+(mmol L
-1)
60 80 100 120 140 160 1800
1020304050
Co
nd
uct
ivit
y
( S cm-1
)
60 80 100 120 140 160 1800
20406080
100
Julian Day
Pre
cip
itat
ion
p (mm day-1
)
Julian Day
Fig. 2 Variation of cation concentration, conductivity and daily
precipitation during the sampling period (March to June, 2011)
These results were very similar to those found at El Ti-
ro (Ecuador), a meteorological station (2825 mosl, 1500
mm) in the Podocarpus National Park at the eastern Andes
Cordillera at 100 Km from the coast; where the median,
minimum and maximum values were 0.09 ppm, <0.09 ppm
and 1.17 ppm for K+; and 0.10 ppm, 0.10 ppm and 0.40
ppm for Na+. After a detailed chemical characterization of
fogwater and rainwater samples in conjunction with a study
of air trajectories, they found signature ions from anthropo-
genic emissions just in fogwater (hydrogen, ammonium,
nitrate and sulfate ions). Rainwater was less loaded with
compounds from ground-based emissions because
raindroplets were formed at very higher altitude compared
to fog droplets (Beiderwieden E. , 2005)
Figure 3 shows the box plots for each ion concentra-
tion as well as for pH and conductivity. Concentrations and
conductivity values show right-tailed log-normal distribu-
tions.

Calderón y col.
Revista Ciencia e Ingeniería. Vol. 34, No. 3, agosto-noviembre, 2013
158
Fig. 3 Distribution of cation concentrations and conductivity of rainwater samples from La Hechicera, Venezuela
3.2 Completeness of the rain chemical composition
The rain chemistry from our study lacks of data for
other important ions such as ammonium, phosphate, nitrate
and sulfate. They are signature ions for emissions coming
from agriculture and cattle activities, and for NOx and SO2
from combustions emissions, respectively. All of these
sources were possibly affecting our sampling site, but with-
out more information are impossible to distinguish.
We used two different approaches in order to assess
the completeness of the rain chemical composition of our
samples, as well as the weight of the unknown species over
the total concentration. A first method is based on the be-
havior of ions in diluted solutions (e.g. 10-3
M) such as rain-
water samples. In this case each ion in solution contributes
to the total conductivity in a proportion equal to its concen-
tration and its limiting ionic molar conductivity or ionic mo-
lar conductivity at infinite dilution according to equation 1.
Using the ionic molar conductivity at infinite dilution at 25 oC for the typical ions found in rainwater, we can predict the
sample conductivities and compare it with measured values.
The completeness of the rain chemical composition is as-
sessed through the difference between measured and calcu-
lated conductivities. Acceptable differences (~ complete
rain chemical composition) are ± 50% for measured con-
ductivities under 5 µS cm-1
and ± 30% for measured con-
ductivities higher than 5 µS cm-1
but lower than 30 µS cm-1
(World Meteorological Organization, 2004). In our study
we predicted samples conductivities using the sample pH,
the molar conductivity at infinite dilution and measured
concentrations for hydrogen, sodium and potassium ions.
We also used the sample pH to estimate carbonate ion con-
centrations in accordance with WMO/GAW methods
(World Meteorological Organization, 2004). There was a
strong and positive correlation factor (r2=0.885, p<0.05) be-
tween measured and calculated values (Fig. 4). With few
exceptions, all samples were between the acceptable dis-
crepancies or under their lower limit as expected when the
rain chemical composition is incomplete. This is an im-
portant result because over predictions could be a signal of
contaminated samples.
Fig. 4 Measured and calculated conductivities of rainwater samples from
La Hechicera, Venezuela
Our second assessment of the rain chemistry com-
pleteness was based in the method proposed by Kramer et
al. (1996) to estimate the sample ionic concentration and the
sample acid fraction using just the sample pH and conduc-
tivity. This method uses the same principle of proportionali-
ty between the sample conductivity, the limiting ionic molar
conductivity and concentrations of ions. As explained in
Kramer et al. (1996), if we eliminate the hydrogen ion con-
tribution to the total conductivity, the residual must be pro-
portional to an equivalent solute concentration and a
weighted mean equivalent conductivity of all ions in solu-
tion, except hydrogen ions. The authors found that the ionic
molar fractions were acceptable weighting factors. This was
also true for weighted mean equivalent conductivities of
cations and anions individually. Using the experimental
ionic concentrations in rainwater samples from several stud-
ies, they found similar weighted mean equivalent conduc-
tivities for sampling sites with similar geographic and at-
mospheric conditions. They actually suggested that the
mean equivalent conductivity do not change significantly
with changing ionic composition (Krämer, et al., 1996)
In order to prove if the Kramer’s estimation method
was consistent and applicable to Venezuelan sampling sites;
we used results for the chemical composition of rainwater
samples collected at sites with similar geography, clima and
meteorological conditions. In our case those sites were at
pristine areas in La Gran Sabana (Bolívar State, Venezuela)
Parupa, Kanavayen and La Paragua (Sanhueza, et al., 2005)
We calculated average weighted mean equivalent conduc-
tivities equal to 0.0685 µScm-1
µeq-1
L, 0.0598 µScm-1
µeq-1
L
and 0.0698 µScm-1
µeq-1
L for solution, cations and anions,
respectively. Our values were comparable to those found by
Kramer et al. (1996) for mountain regions with rural back-
ground. We actually confirmed that small changes in rain
composition produce very small changes in the weighted
mean equivalent conductivities (solution, anionic and cati-
onic)(Krämer, et al., 1996).
Cationes base en la lluvia de los Andes Venezolanos… 159
Revista Ciencia e Ingeniería. Vol. 34, No. 3, agosto-noviembre, 2013
Heq
eqHH
Leq
eqIon (1)
mass
eqHH
ppmmassIon (2)
eqCateqHH
eqAneqCat
An
HAF (3)
The acid fraction represents the free acidity, including
the hydrogen ions coming from atmospheric CO2 absorp-
tion, therefore the sample ionic concentration (eq.1) in-
cludes the carbonate species (HCO3- and CO3
-2). An acid
fraction of 20% indicates that 20% of the dissolved species
are free acids (Krämer, et al., 1996)
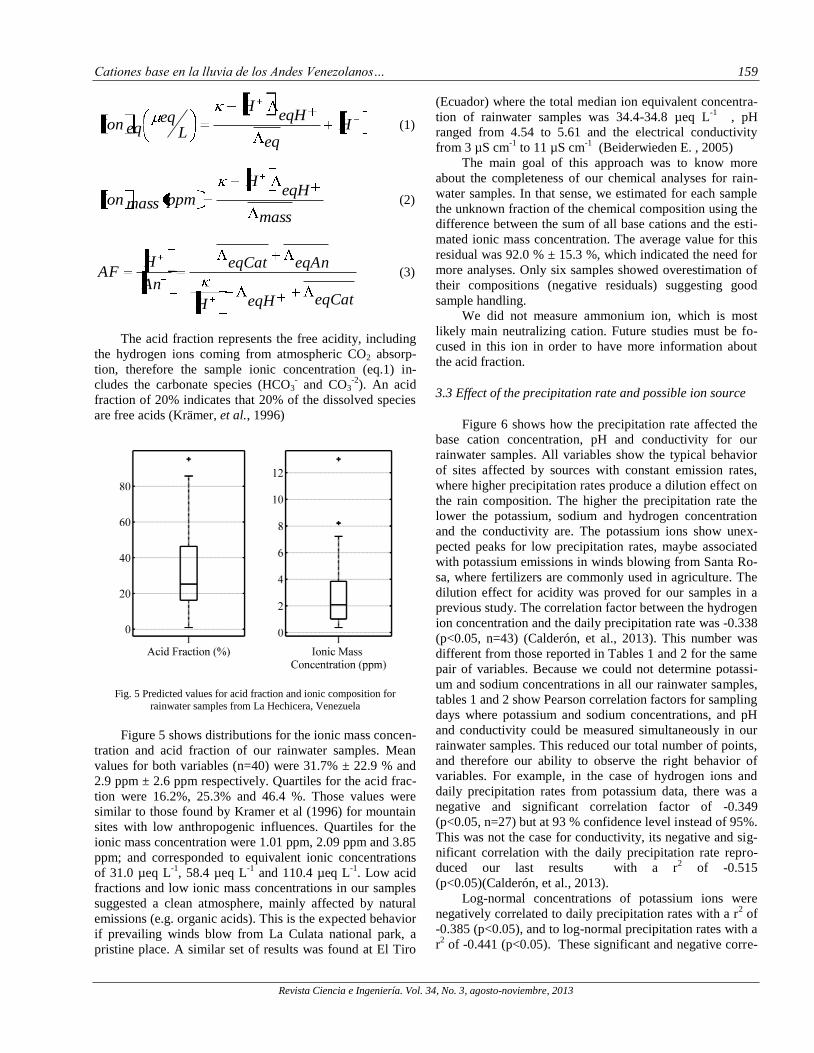
Fig. 5 Predicted values for acid fraction and ionic composition for
rainwater samples from La Hechicera, Venezuela
Figure 5 shows distributions for the ionic mass concen-
tration and acid fraction of our rainwater samples. Mean
values for both variables (n=40) were 31.7% ± 22.9 % and
2.9 ppm ± 2.6 ppm respectively. Quartiles for the acid frac-
tion were 16.2%, 25.3% and 46.4 %. Those values were
similar to those found by Kramer et al (1996) for mountain
sites with low anthropogenic influences. Quartiles for the
ionic mass concentration were 1.01 ppm, 2.09 ppm and 3.85
ppm; and corresponded to equivalent ionic concentrations
of 31.0 µeq L-1
, 58.4 µeq L-1
and 110.4 µeq L-1
. Low acid
fractions and low ionic mass concentrations in our samples
suggested a clean atmosphere, mainly affected by natural
emissions (e.g. organic acids). This is the expected behavior
if prevailing winds blow from La Culata national park, a
pristine place. A similar set of results was found at El Tiro
(Ecuador) where the total median ion equivalent concentra-
tion of rainwater samples was 34.4-34.8 µeq L-1
, pH
ranged from 4.54 to 5.61 and the electrical conductivity
from 3 µS cm-1
to 11 µS cm-1
(Beiderwieden E. , 2005)
The main goal of this approach was to know more
about the completeness of our chemical analyses for rain-
water samples. In that sense, we estimated for each sample
the unknown fraction of the chemical composition using the
difference between the sum of all base cations and the esti-
mated ionic mass concentration. The average value for this
residual was 92.0 % ± 15.3 %, which indicated the need for
more analyses. Only six samples showed overestimation of
their compositions (negative residuals) suggesting good
sample handling.
We did not measure ammonium ion, which is most
likely main neutralizing cation. Future studies must be fo-
cused in this ion in order to have more information about
the acid fraction.
3.3 Effect of the precipitation rate and possible ion source
Figure 6 shows how the precipitation rate affected the
base cation concentration, pH and conductivity for our
rainwater samples. All variables show the typical behavior
of sites affected by sources with constant emission rates,
where higher precipitation rates produce a dilution effect on
the rain composition. The higher the precipitation rate the
lower the potassium, sodium and hydrogen concentration
and the conductivity are. The potassium ions show unex-
pected peaks for low precipitation rates, maybe associated
with potassium emissions in winds blowing from Santa Ro-
sa, where fertilizers are commonly used in agriculture. The
dilution effect for acidity was proved for our samples in a
previous study. The correlation factor between the hydrogen
ion concentration and the daily precipitation rate was -0.338
(p<0.05, n=43) (Calderón, et al., 2013). This number was
different from those reported in Tables 1 and 2 for the same
pair of variables. Because we could not determine potassi-
um and sodium concentrations in all our rainwater samples,
tables 1 and 2 show Pearson correlation factors for sampling
days where potassium and sodium concentrations, and pH
and conductivity could be measured simultaneously in our
rainwater samples. This reduced our total number of points,
and therefore our ability to observe the right behavior of
variables. For example, in the case of hydrogen ions and
daily precipitation rates from potassium data, there was a
negative and significant correlation factor of -0.349
(p<0.05, n=27) but at 93 % confidence level instead of 95%.
This was not the case for conductivity, its negative and sig-
nificant correlation with the daily precipitation rate repro-
duced our last results with a r2 of -0.515
(p<0.05)(Calderón, et al., 2013).
Log-normal concentrations of potassium ions were
negatively correlated to daily precipitation rates with a r2 of
-0.385 (p<0.05), and to log-normal precipitation rates with a
r2 of -0.441 (p<0.05). These significant and negative corre-

Calderón y col.
Revista Ciencia e Ingeniería. Vol. 34, No. 3, agosto-noviembre, 2013
160
lations were not seen for hourly precipitation rates; however
they confirmed the dilution effect mentioned before.
The opposite applied to sodium ions, their log-normal
concentrations were negative and significant correlated (r2=
-0.486, p<0.05, n=20) to hourly precipitation rates but not to
daily precipitation rates. This was difficult to explain espe-
cially due to the small number of points. However we could
think that sodium is not entirely coming from a local source,
and therefore its concentration depends strongly on wind
speed and direction and on the time at which the collector
was opened.
Rather weak relation between precipitation rate and
cation concentrations show that the main source is not
through rain itself, but through dry deposition, which is then
washed by rain from surfaces.
Log-normal concentrations of potassium and sodium
ions were positively correlated to conductivity with Pearson
correlation factors of 0.45 (p<0.05, n=27) and 0.51 (p<0.05,
n=20), respectively. This was expected because the higher
the ionic concentration in solution the higher its ability to
conduct electricity is. Because all ions do not transfer elec-
tricity at the same rate, the Pearson correlation factors for
potassium and sodium ions were half the value of those ob-
served for hydrogen ions (r2=0.89 and r
2=0.94; p <0.05).
Hydrogen ions are better conductors.
An interesting correlation was observed between H+
and K+ ions, and H
+ and Na
+ ions. Even when K
+ and Na
+
concentrations did not show a linear correlation between
them (not even their log-normal values), maybe due to the
small number of points analyzed (n=17, p>0.05); each one
of the ions showed individually, a positive correlation factor
with H+ ions, r2=0.40 (n=27, p<0.05) for potassium and
r2=0.47 (n=20, p<0.05) for sodium. Without more infor-
mation about which anions were present in our rainwater
samples, it was difficult to precise explanations for this be-
havior. However it is known that potassium phosphate
(KH2PO4) is used as a fertilizer, and its dissolution would
produce hydrogen and potassium ions. Also cropping and
grassland preparation can produce high levels of K+ in rain
(Zunckel, et al., 2003) In the case of Na+ it is more difficult
to find acidic sources. Biomass burning is an important
source of organic acids and particles that maybe after rain
scavenging releases K+ and Na
+ originally present in vege-
tation(Zunckel, et al., 2003)
Table 1. Pearson Correlation Factors (p <0,05) for
potassium concentrations
Variables r2 (n =27)
dp vs. hp 0.846
κ vs. dp -0.515
dp vs log10(K+) -0.385
log10 (dp) vs K+ -0.403
log10 (dp) vs log10(K+) -0.441
κ vs. hp -0.427
H+ vs κ 0.890
H+
vs K+ 0.430
H+
vs log10 (dp) -0.392
H+
vs log10 (hp) -0.488
H+
vs log10(K+) -0.385
pH vs κ -0.694
pH vs log10 (dp) 0.382
pH vs log10 (hp) 0.396
Table 2. Pearson Correlation Factors (p <0,05) for
sodium concentrations
Variables r2 (n =20)
dp vs. hp 0.755
κ vs. dp -0.413
hp vs Na+ -0.435*
hp vs log10(Na+) -0.486
log10 (dp) vs Na+ -0.378*
log10 (dp) vs log10(Na+) -0.411*
log10 (hp) vs Na+ -0.571
log10 (hp) vs log10(Na+) -0.594
H+
vs log10(Na+) 0.405*
κ vs. hp -0.427
H+ vs κ 0.940
H+
vs Na+ 0.474
H+
vs log10 (hp) -0.418*
H+
vs log10(K+) -0.385
pH vs κ -0.681
κ vs. log10 (dp) -0.453
κ vs. log10 (hp) -0.511
κ vs. log10 (Na+) 0.510
*Significant at α=0,1
Fig. 6 Relations between cation concentrations and conductivity of
rainwater samples and daily precipitation rates
Cationes base en la lluvia de los Andes Venezolanos… 161
Revista Ciencia e Ingeniería. Vol. 34, No. 3, agosto-noviembre, 2013
3.4 Wet Deposition fluxes
Volume-weighted average concentrations were 0.039 ±
0.008 ppm (1.0 µeq L-1
) for potassium and 0.143 ± 0.037
ppm (6.22 µeq L-1
) for sodium. VWAC’s at La Paragua,
Guri and Parupa in La Gran Sabana (Bolívar State) were
1.08 µeq L-1
, 0.23 µeq L-1
and 1.05 µeq L-1
for potassium
and 3.5 µeq L-1
, 1.34 µeq L-1 and 2.71 µeq L
-1 for sodi-
um. Authors associated these levels of ions in rain with little
anthropogenic influence by comparison with the rain chem-
istry of remote continental sites at Europe and North Amer-
ica(Sanhueza, et al., 1992). These sites at the Venezuelan
savannah region have similar altitude, geological character-
istics and annual precipitation compared to our site. In the
Koppen climatic classification, it is classified as tropical
humic monsoonic (Sanhueza, et al., 1992), while our site is
temperate humid tropical (Rubel, 2010), however our sam-
ples were comparable to those from these sites in terms of
their acidity and conductivity levels too. There are not
more Venezuelan studies to compare with.
Wet depositions fluxes were 49 ± 46 mg m-2
year-1
(130 µg m-2
day-1
) and 177 ± 168 mg m-2
year-1
for potassi-
um and sodium respectively (480 µg m-2 day-1). At the
time of this study we could not find more wet deposition
fluxes at similar site to compare with. Bulk deposition flux-
es for these ions were measured between 1981 and 1983 at
Calabozo, Venezuela. This region belongs to the Orinoco
Llanos, and it has a different climate with mean annual rain-
fall of 1228 mm and mean annual temperature of 26 oC.
Mean average values were 361.3 mg m-2
year-1
and 594.5
mg m-2
year-1
for potassium and sodium respectively
(Montes and San Jose, 1989). These fluxes are higher than
ours values. Authors indicated that biomass burning to ob-
tain palatable and nutritional food-stuffs for cattle, was the
most important source of K+ and Na
+. They found relatively
higher concentrations of phosphate, sulfate, calcium, mag-
nesium, potassium and sodium in the particulate matter col-
lected (Montes and San Jose, 1989).
4 Conclusions
Results from base cations, pH and conductivity of
rainwater samples suggested that La Hechicera is not par-
ticularly affected by antropogenic emissions from vehicles,
agricultural or cattle activities from the surrounding areas. If
rain is formed at high altitudes in La Culata mountain chain,
where the atmosphere is not loaded with anthropogenic
emissions from the ground, the in-cloud scavenging gives to
the future rain droplets a natural chemical composition. If
then rainclouds travel from this direction to our site, and
very few pollutants are available from ground-based emis-
sions, after the below-cloud scavenging, rain will contains
just the natural compounds expected from a mountain site,
and washed from surfaces containing the dry deposition.
This is certainly a good finding however it is necessary to
carry out a detailed chemical characterization of fog and
rainwater samples when “natural” conditions still prevail at
the atmosphere in order to identify possible future impact of
anthropogenic emissions.
The low rainwater concentrations of base cations, es-
pecially calcium and magnesium, represent a future prob-
lem. Without enough base cations to neutralize the free
acidity in rain, an increment in the anthropogenic emissions
coming from growing residential areas, will affect not only
the rain acidity but also the quality of soils. If we remember
soil weathering is a very slow process, therefore if deposi-
tion cannot compensate the cation losses, soils can become
deficient in nutrients.
Acknowledgments
This research has been sponsored by Consejo de Desa-
rrollo Científico Humanístico, Tecnológico y de las Artes
de la Universidad de Los Andes Project I-1067-07-08-A.
The authors are grateful by the donations and advising gi-
ving by the University of Stockholm, Laboratorio de Fenó-
menos Interfaciales, Reología y Procesos (FIRP-ULA), the
Laboratorio de Mezclado, Separación y Síntesis Industrial
(LMSSI-ULA) and Laboratorio de Espectroscopía Molecu-
lar de la Universidad de Los Andes. They made possible
this research.
References
Adams M, (1995), Fundamentos de Química de Suelos.
1era ed. Publicaciones del Consejo de Desarrollo Científico
y Humanístico de la Universidad Central de Venezuela. Ca-
racas, Venezuela. pp. 105-120, 280-290.
Akselsson C, Westling O, Sverdrup H, Holmqvist J, Thelin
G, Uggla E and Malm G, 2007, Impact of Harvest Intensity
on Long-Term Base Cation Budgets in Swedish Forest
Soils, Water Air and Soil Pollution, Vol. 7, No. pp. 201-
210.
Artiñano B, Salvador P and Pujadas M, 2009, Estudio de la
contaminación por partículas atmosféricas en Madrid(I):
contribución de las fuentes, Física de la tierra Vol. 21, No.
pp. 41-49. Se encuentra en
http://revistas.ucm.es/index.php/FITE/article/view/FITE090
9110041A/11397. Fecha de consulta: Diciembre 2010
Beiderwieden E. TW, O. Klemm, 2005, Chemical charac-
terization of fog and rain water collected at the eastern An-
des cordillera, Hydrol. Earth Sys. Sci. Discuss., Vol. 2, No.
pp. 863-885.
Calderón S, Calderón N, Iglesias E, Ramírez O, Hernández
J, Sosa D, Anderez JM, Hoffmann P and Krejci R, 2013,
Acidez en la lluvia de Los Andes venezolanos en La
Hechicera, Venezuela, Ciencia e Ingeniería, Vol. 34, No. 2,
pp. 93-102.
Chandra Mouli P, Venkata Mohan S and Reddy SJ, 2005,
Rainwater chemistry at a regional representative urban site:
influence of terrestrial sources on ionic composition, At-
mospheric Environment, Vol. 39, No. 6, pp. 999-1008.

Calderón y col.
Revista Ciencia e Ingeniería. Vol. 34, No. 3, agosto-noviembre, 2013
162
Dos Santos M, Illanes CF, Fornaro A and Pedrotti JJ, 2007,
Acid Rain in Downtown São Paulo City, Brazil, Water Air
and Soil Pollution, Vol. 7, No. pp. 85-92.
Ferrer G and López R, 2004, Topsoil loss compost addition
and crop yield in an inceptisol of the venezuelan Andes,
Revista Geográfica Venezolana, Vol. 45, No. 2, pp. 153-
164.
González CM and Aristizábal BH, 2012, Acid rain and par-
ticulate matter dynamics in a mid-sized Andean city: The
effect of rain intensity on ion scavenging, Atmospheric En-
vironment, Vol. 60, No. pp. 164-171.
Green GP, Bestland EA and Walker GS, 2004, Distinguish-
ing sources of base cations in irrigated and natural soils: ev-
idence from strontium isotopes, Biogeochemistry, Vol. 68,
No. pp. 199-225.
Harris DC, (2001), Análisis Químico Cuantitativo. Segunda
ed. Editorial Reverté, S.A., Barcelona, España. pp.28-66.
Hedin LO and Likens GE, 1996, Atmospheric Dust and Ac-
id Rain, Scientific American, Vol. 275, No. pp. 88-92.
Google Inc. (2012), Google Earth (Versión 7.0.2.8415)
[Software] Se encuentra en:
http://www.google.com/earth/download/ge/agree.html
J. H. Seinfeld and S Pandis (1997) Atmospheric Chemistry
and Physics: Air Pollution to Climate. ed. Wiley, John &
Sons, Incorporated. New York, USA. pp. 1360.
Jacobson M, (2002), Atmospheric Pollution history of sci-
ence and regulation. ed. Cambridge University Press. New
York, NY USA. pp. 4-12.
Krämer M, Schüle M and Schütz L, 1996, A method to de-
termine rainwater solutes from pH and conductivity meas-
urements, Atmospheric Environment, Vol. 30, No. 19, pp.
3291-3300.
Lakes Environmental Software (2011), WRPLOT VIEW
(Versión 7.0.0) [Software] Se encuentra en:
http://www.weblakes.com/products/wrplot/index.html
Luizão FJ, Luizão RCC and Proctor J, 2007, Soil acidity
and nutrient deficiency in central Amazonian heath forest
soils, Plant Ecology, Vol. 195, No. 2, pp. 209-224.
Méndez A. Los nutrientes del agua de lluvia podrían ex-
plicar la alta productividad de la Ría. Se encuentra en:
http://www.farodevigo.es/gran-vigo/2009/03/24/granvigo-
nutrientes-agua-lluvia-explicar-alta-
productividad/309304.html. Fecha de consulta: 30 de Mar-
zo del 2012
Montes R and San Jose JJ, 1989, Chemical Composition
and Nutrient Loading by Precipitation in the Trachypogon
Savannas of the Orinoco Ilanos, Venezuela, Biogeochemis-
try, Vol. 7, No. 3, pp. 241-256.
Navarro S and Navarro G, (2003), Química agrícola: el sue-
lo y los elementos químicos esenciales para la vida vegetal.
Segunda ed. Grupo Mundi Prensa. Madrid, España., pp.295-
318.
Laboratorio de Geofísica de la Universidad de Los Andes
(LAGULA) Red De Estaciones Bioclimaticas ULA (2007).
Datos Meteorológicos para la Estación La Hechicera Méri-
da. (Lagula) Data from Se encuentra en
http://www.cecalc.ula.ve/redbc Fecha de consulta: Diciem-
bre 2009
Rubel F, M. Kottek, 2010, Observed and projected climate
shifts 1901-2100 depicted by world maps of the Köppen-
Geiger climate classification, Meteorologische Zeitschrift,
Vol. 19, No. pp. 135-141.
Sánchez L, Morales J, Velázquez H, Portillo D, Cano Y,
Montilla B, Iriarte N and Mesa J, 2009, Composición Iónica
y niveles de acidez de las lluvias en Maracaibo, Venezuela,
entre 1989-2001, Rev. Int. Contam. Ambient. , Vol. 25, No.
3, pp. 169-179.
Sanhueza E, Alfonzo Y and Santana M, 2003, Compuestos
orgánicos volátiles en la atmósfera de la Gran Sabana. II:
HCHO, HCOOH y CH3COOH en lluvias, Interciencia, Vol.
28, No. 1, pp. 29-35.
Sanhueza E, Santana M, Donoso L and Pacheco M, 2005,
Química atmosférica en la Gran Sabana III: Composición
iónica y características ácido-básicas de las lluvias, Inter-
ciencia, Vol. 30, No. 10, pp.
Tiwari S, Kulshrestha UC and Padmanabhamurty B, 2007,
Monsoon rain chemistry and source apportionment using
receptor modeling in and around National Capital Region
(NCR) of Delhi, India, Atmospheric Environment, Vol. 41,
No. 27, pp. 5595-5604.
Türküm A, Pekey B, Pekey H and Tuncel G, 2008, Com-
parison of sources affecting chemical compositions of aero-
sol and rainwater at different locations in Turkey, Atmos-
pheric Research, Vol. 89, No. 4, pp. 306-314.
World Meteorological Organization GAW, 2004, Manual
for the GAW Precipitation Chemistry Programme, GAW
Precipitation Chemistry Science Advisory Group WMO
Vol. 160, No. 1251, pp. 1-182
Zunckel M, Saizar C and Zarauz J, 2003, Rainwater compo-
sition in northeast Uruguay, Atmospheric Environment,
Vol. 37, No. 12, pp. 1601-1611.
Recibido: 07 de mayo de 2012
Recibido: 20 de marzo de 2013
Calderón, Silvia Margarita: Ing. Químico de la Universi-
dad de Los Andes (1998), profesora asociada de la Escuela
de Ing.Química de la ULA (1999), PhD en Ing.Química en
University of South Florida, EUA (2006.)
Calderón Malavé, Nayret: Ing.Químico de la Universidad
de Los Andes (2012), tesista del Laboratorio FIQMA-ULA.
Correo electrónico: [email protected]
Iglesias Sánchez, Edinzo: Ing. Químico de la Universidad
de Los Andes (1993), profesor titular de la Escuela de Ing.
Química de la ULA (1993), PhD en Ing.Química en Univer-
sity of South Florida, EUA (2006). Correo electróni-
Cationes base en la lluvia de los Andes Venezolanos… 163
Revista Ciencia e Ingeniería. Vol. 34, No. 3, agosto-noviembre, 2013
Larez, Francis: Ing. Químico de la Universidad de Los An-
des (2012), tesista del Laboratorio FIQMA-ULA. Correo
electrónico: [email protected]
Ramírez, Oneida: Asistente de Laboratorio de la Escuela
de Ing. Química de la Universidad de Los Andes, Estudian-
te de la Licenciatura en Química de la ULA. Correo elec-
trónico: [email protected]
Hernández, Julio: Asistente de Laboratorio de la Escuela
de Ing. Química de la Universidad de Los Andes. Correo
electrónico: [email protected]
Sosa, Daisy: Asistente de Laboratorio de la Escuela de Ing.
Química de la Universidad de Los Andes, Estudiante de la
Licenciatura en Farmacia de la ULA. Correo electróni-
Anderez, José María: Ingeniero Químico de la Universidad
de Los Andes(1976), profesor titular de la Escuela de Ing.
Química de la ULA(1977-), MSc en Ciencias en ULA
(1984), Secretario de la Universidad de Los Andes (2008).
Correo electrónico:[email protected]
Hoffmann, Pedro: profesor titular del Departamento de
Física de la Universidad de Los Andes (1975), Dipl.
Phys.(MSc) en la Fac.de Física de la Universidad Técnica
de Darmstadt , Alemania (1974), Dr. rer. nat. (PhD) en la
Universidad de Siegen, Alemania (1986). Correo electróni-
Krejci, Radovan: Investigador del Departamento de Cien-
cias Ambientales Aplicadas en la Universidad de Estocol-
mo, Suecia (2008), Ph.D. en Meteorología Química de la
Universidad de Estocolmo, Suecia (2002). Correo electró-
nico: [email protected]

Calderón y col.
Revista Ciencia e Ingeniería. Vol. 34, No. 3, agosto-noviembre, 2013
164