
Cámara Comercio Cantabria. Como sacar el máximo partido a LinkedIn de Esmeralda Diaz Aroca

1
Cáncer renal. ¿Cómo sacar el
máximo partido a los
diferentes fármacos
disponibles?
Noviembre de 2009
Daniel Castellano
Servicio de Oncología Médica
Hospital 12 de Octubre
Presidente SOGUG
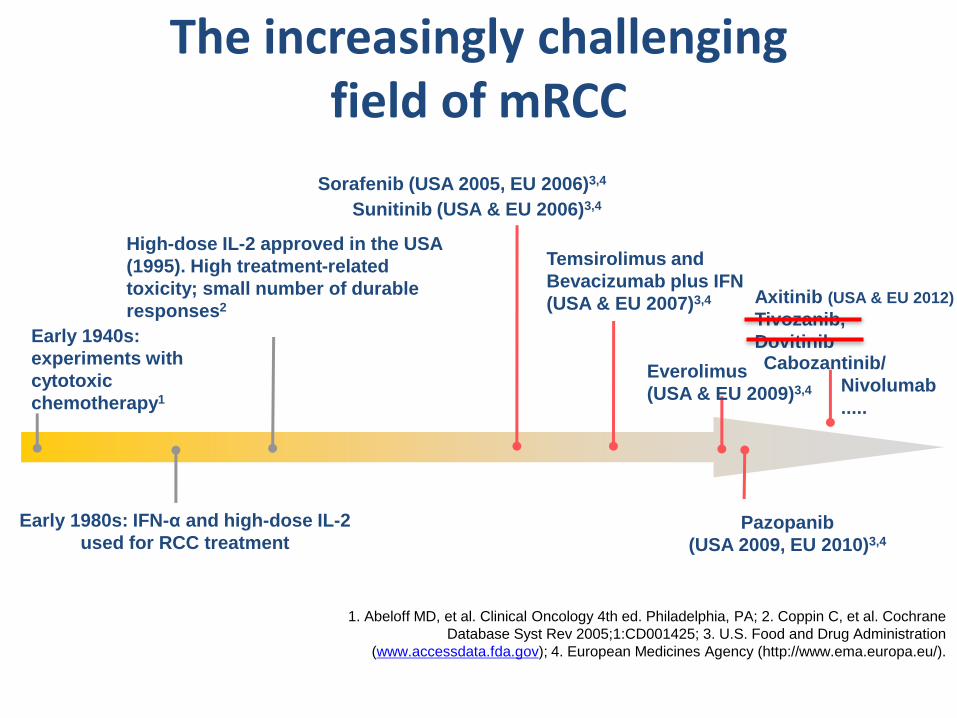
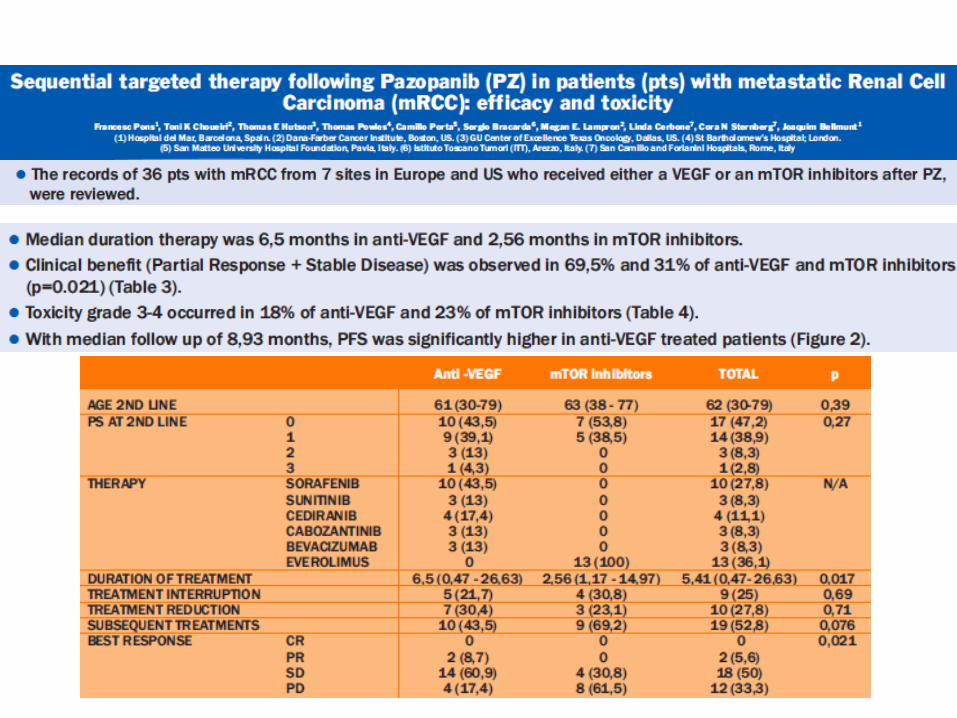
The increasingly challenging field of mRCC
Early 1940s:
experiments with
cytotoxic
chemotherapy1
Early 1980s: IFN-α and high-dose IL-2
used for RCC treatment
High-dose IL-2 approved in the USA
(1995). High treatment-related
toxicity; small number of durable
responses2
Sorafenib (USA 2005, EU 2006)3,4
Temsirolimus and
Bevacizumab plus IFN
(USA & EU 2007)3,4
Everolimus
(USA & EU 2009)3,4
Pazopanib
(USA 2009, EU 2010)3,4
Sunitinib (USA & EU 2006)3,4
Axitinib (USA & EU 2012)
Tivozanib,
Dovitinib Cabozantinib/
Nivolumab
.....
1. Abeloff MD, et al. Clinical Oncology 4th ed. Philadelphia, PA; 2. Coppin C, et al. Cochrane
Database Syst Rev 2005;1:CD001425; 3. U.S. Food and Drug Administration
(www.accessdata.fda.gov); 4. European Medicines Agency (http://www.ema.europa.eu/).
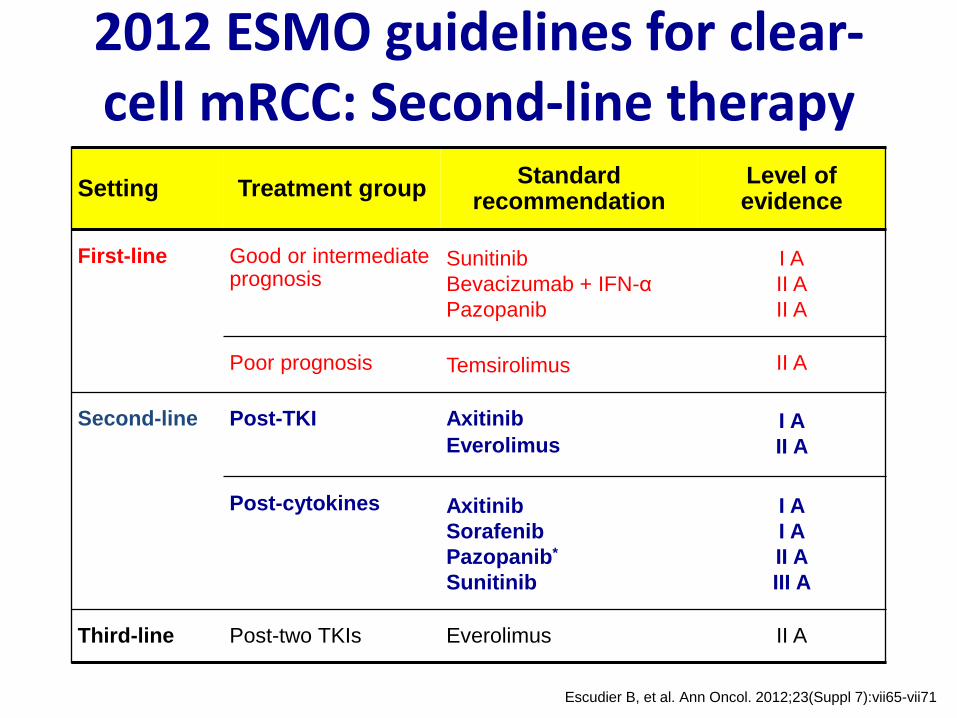
2012 ESMO guidelines for clear-cell mRCC: Second-line therapy
Escudier B, et al. Ann Oncol. 2012;23(Suppl 7):vii65-vii71
Setting Treatment group Standard
recommendation Level of evidence
First-line
Good or intermediate prognosis
Sunitinib
Bevacizumab + IFN-α
Pazopanib
I A
II A
II A
Poor prognosis Temsirolimus II A
Second-line
Post-TKI Axitinib
Everolimus I A
II A
Post-cytokines Axitinib
Sorafenib
Pazopanib*
Sunitinib
I A
I A
II A
III A
Third-line Post-two TKIs Everolimus II A

¿Cómo sacar el máximo partido a los
diferentes fármacos disponibles?
• Relacionados con:
– Tumor
– Paciente
– Manejo del Fármaco
– Estrategia terapéutica

¿Cómo sacar el máximo partido a los
diferentes fármacos disponibles?
• Relacionados con:
– Tumor
– Paciente
– Manejo del Fármaco
– Estrategia terapéutica
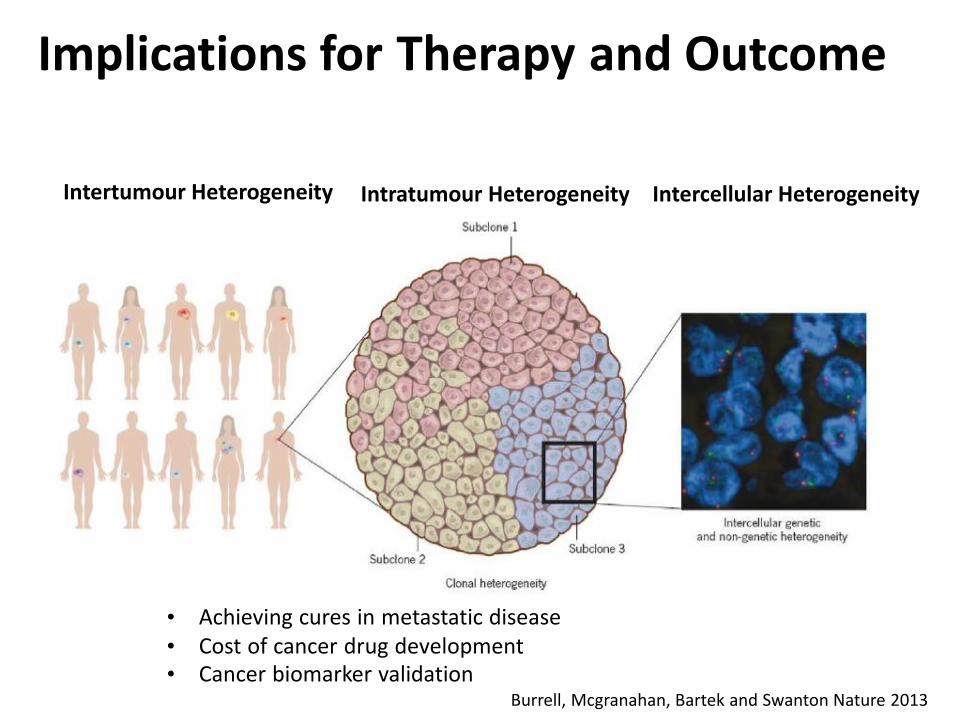
Implications for Therapy and Outcome
Burrell, Mcgranahan, Bartek and Swanton Nature 2013
Intertumour Heterogeneity Intratumour Heterogeneity Intercellular Heterogeneity
• Achieving cures in metastatic disease • Cost of cancer drug development • Cancer biomarker validation
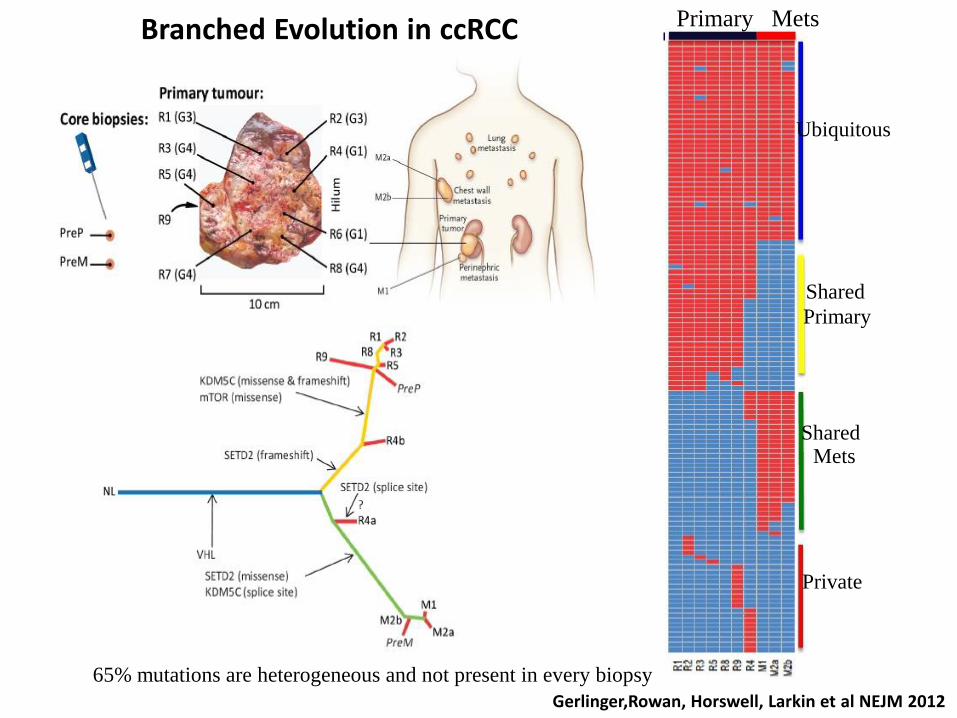
65% mutations are heterogeneous and not present in every biopsy
Ubiquitous
Shared
Primary
Shared Mets
Private
Primary Mets
Gerlinger,Rowan, Horswell, Larkin et al NEJM 2012
Branched Evolution in ccRCC
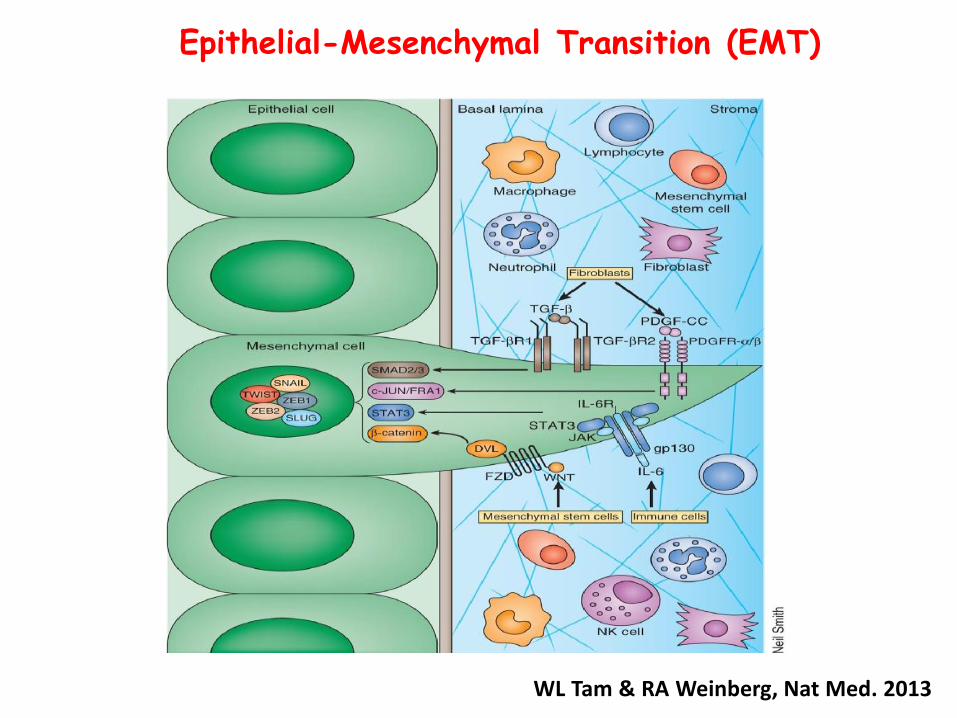
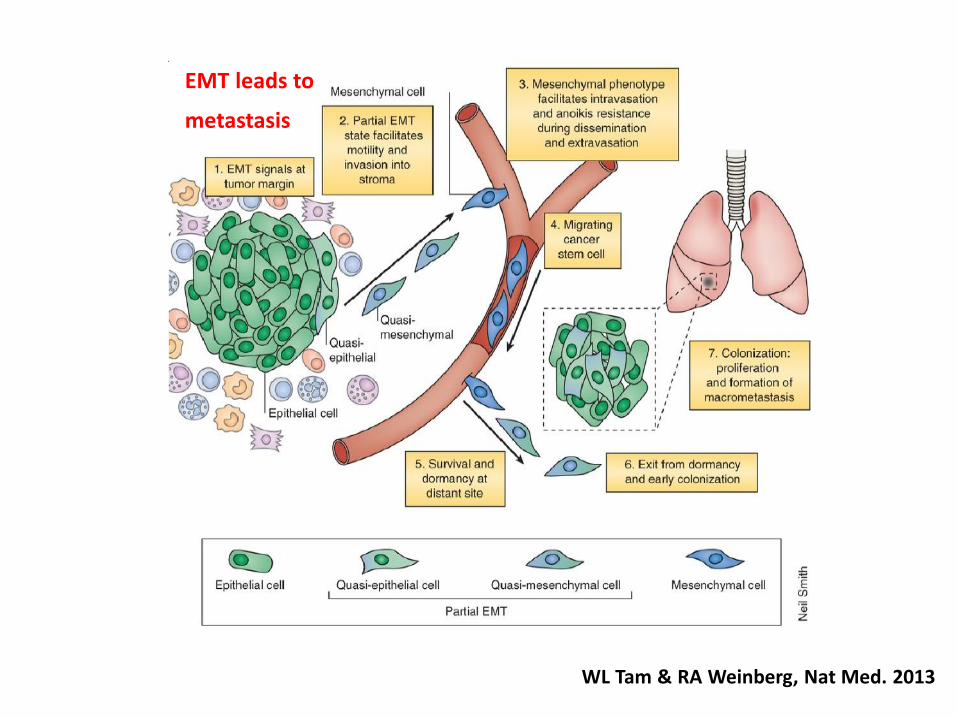
WL Tam & RA Weinberg, Nat Med. 2013
Epithelial-Mesenchymal Transition (EMT)
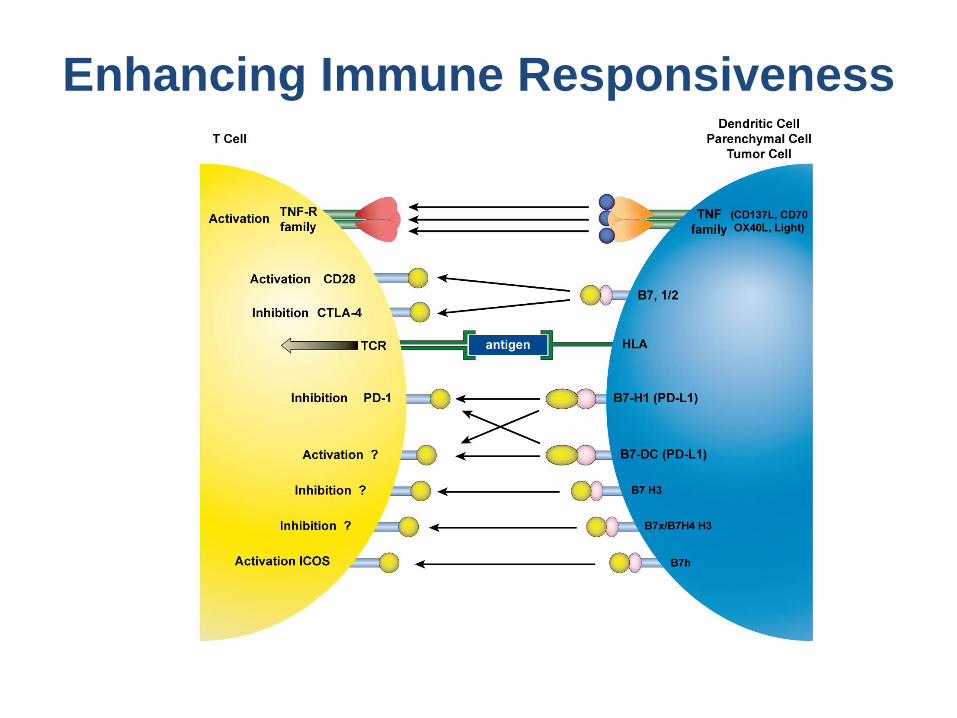
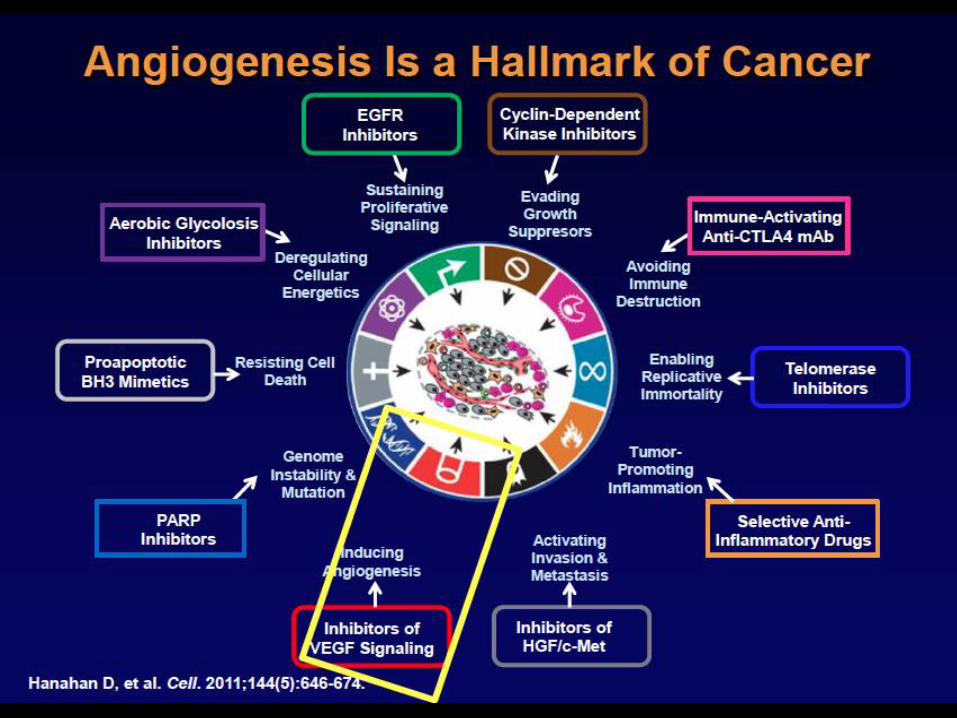
Enhancing Immune Responsiveness
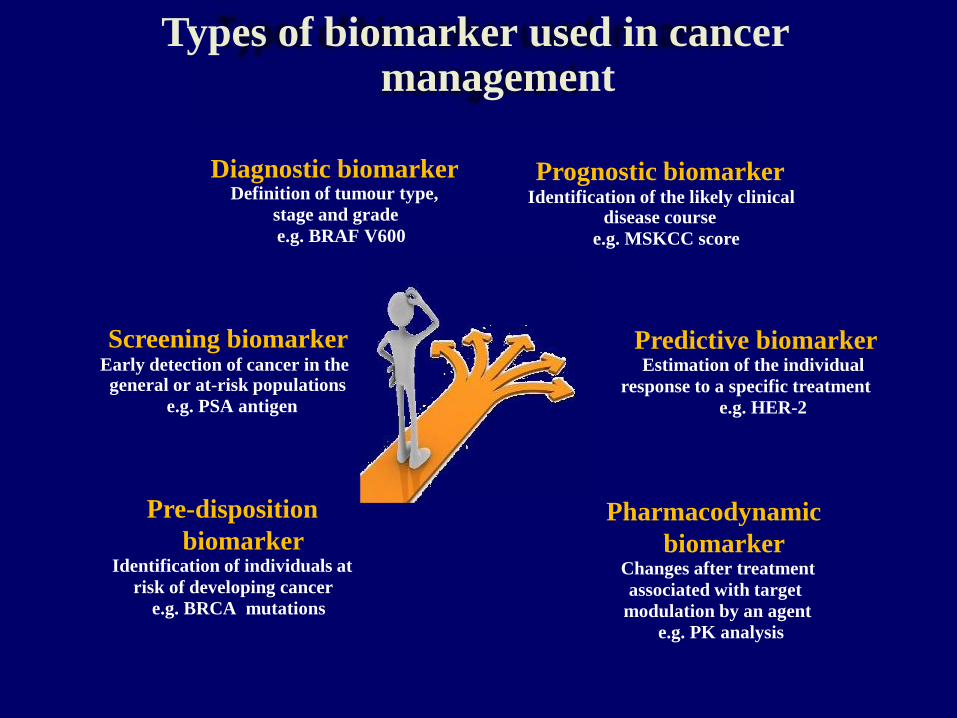
Types of biomarker used in cancer management
Diagnostic biomarker Definition of tumour type,
stage and grade
e.g. BRAF V600 Screening biomarker Early detection of cancer in the general or at-risk populations
e.g. PSA antigen Pre-disposition
biomarker Identification of individuals at
risk of developing cancer
e.g. BRCA mutations
Prognostic biomarker Identification of the likely clinical disease course
e.g. MSKCC score Predictive biomarker Estimation of the individual
response to a specific treatment
e.g. HER-2 Pharmacodynamic
biomarker Changes after treatment
associated with target
modulation by an agent
e.g. PK analysis
Predictive factors for targeted therapy in RCC
None (yet)
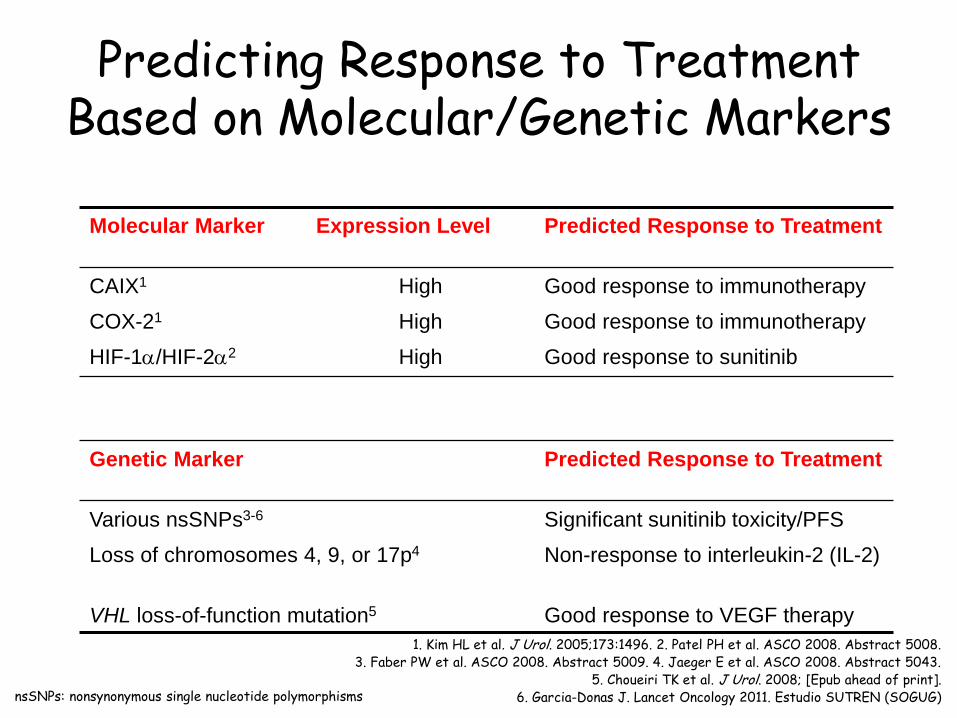
Predicting Response to Treatment Based on Molecular/Genetic Markers
Molecular Marker Expression Level Predicted Response to Treatment
CAIX1 High Good response to immunotherapy
COX-21 High Good response to immunotherapy
HIF-1/HIF-22 High Good response to sunitinib
Genetic Marker Predicted Response to Treatment
Various nsSNPs3-6 Significant sunitinib toxicity/PFS
Loss of chromosomes 4, 9, or 17p4 Non-response to interleukin-2 (IL-2)
VHL loss-of-function mutation5 Good response to VEGF therapy
nsSNPs: nonsynonymous single nucleotide polymorphisms
1. Kim HL et al. J Urol. 2005;173:1496. 2. Patel PH et al. ASCO 2008. Abstract 5008. 3. Faber PW et al. ASCO 2008. Abstract 5009. 4. Jaeger E et al. ASCO 2008. Abstract 5043.
5. Choueiri TK et al. J Urol. 2008; [Epub ahead of print]. 6. Garcia-Donas J. Lancet Oncology 2011. Estudio SUTREN (SOGUG)

¿Cómo sacar el máximo partido a los
diferentes fármacos disponibles?
• Relacionados con:
– Tumor
– Paciente
– Manejo del Fármaco
– Estrategia terapéutica
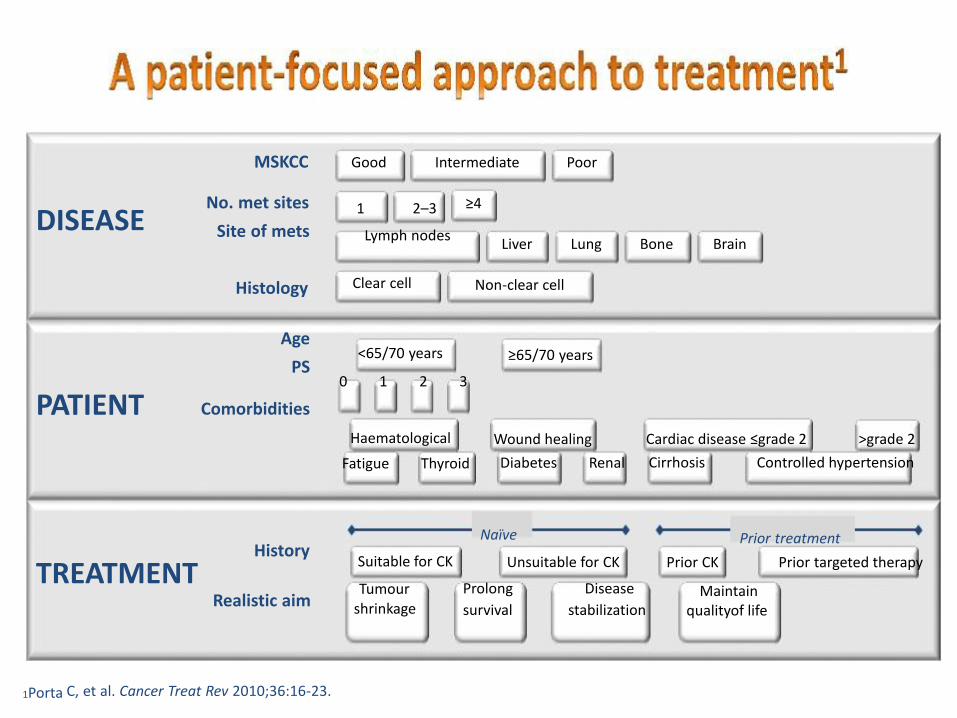
1Porta C, et al. Cancer Treat Rev 2010;36:16-23.
DISEASE
Good Intermediate Poor MSKCC
≥4 1 2–3
Lymph nodes Liver Lung Bone Brain
No. met sites
Site of mets
PATIENT
Histology Age
PS Comorbidities
Non-clear cell ≥65/70 years
Wound healing
Diabetes Renal
Clear cell <65/70 years
0 1 2 3
Haematological
Fatigue Thyroid
Cardiac disease ≤grade 2 >grade 2
Cirrhosis Controlled hypertension
TREATMENT Suitable for CK
Tumour shrinkage
Naïve
Unsuitable for CK
Prolong Disease
survival stabilization
History Realistic aim
Prior treatment
Prior CK Prior targeted therapy
Maintain qualityof life
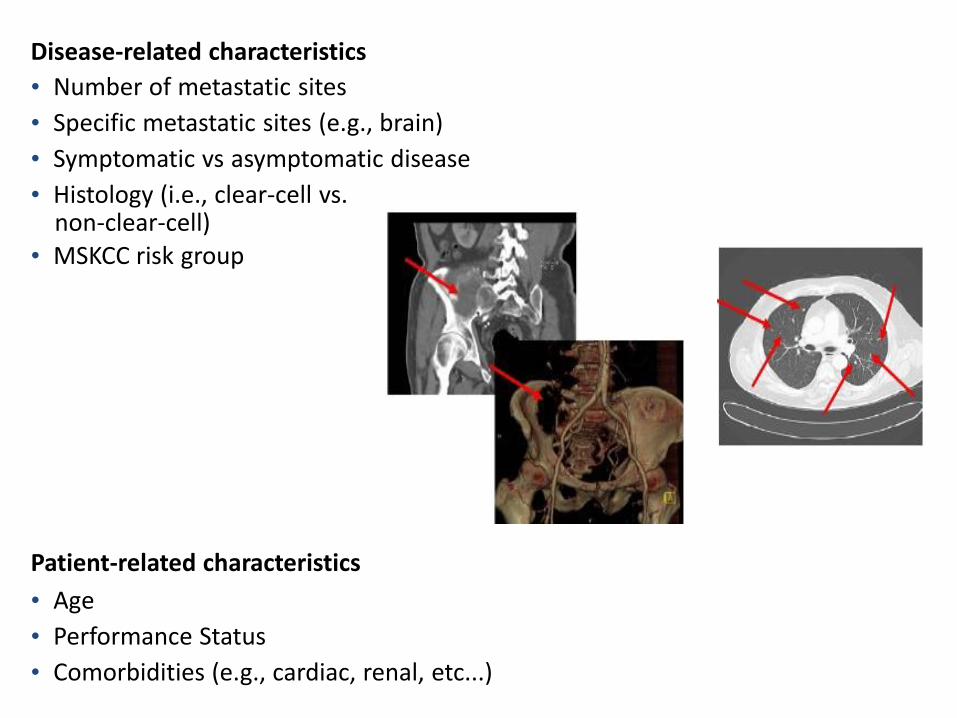
Disease-related characteristics
• Number of metastatic sites
• Specific metastatic sites (e.g., brain)
• Symptomatic vs asymptomatic disease
• Histology (i.e., clear-cell vs. non-clear-cell) • MSKCC risk group
Patient-related characteristics
• Age
• Performance Status
• Comorbidities (e.g., cardiac, renal, etc...)

¿Cómo sacar el máximo partido a los
diferentes fármacos disponibles?
• Relacionados con:
– Tumor
– Paciente
– Manejo del Fármaco
– Estrategia terapéutica
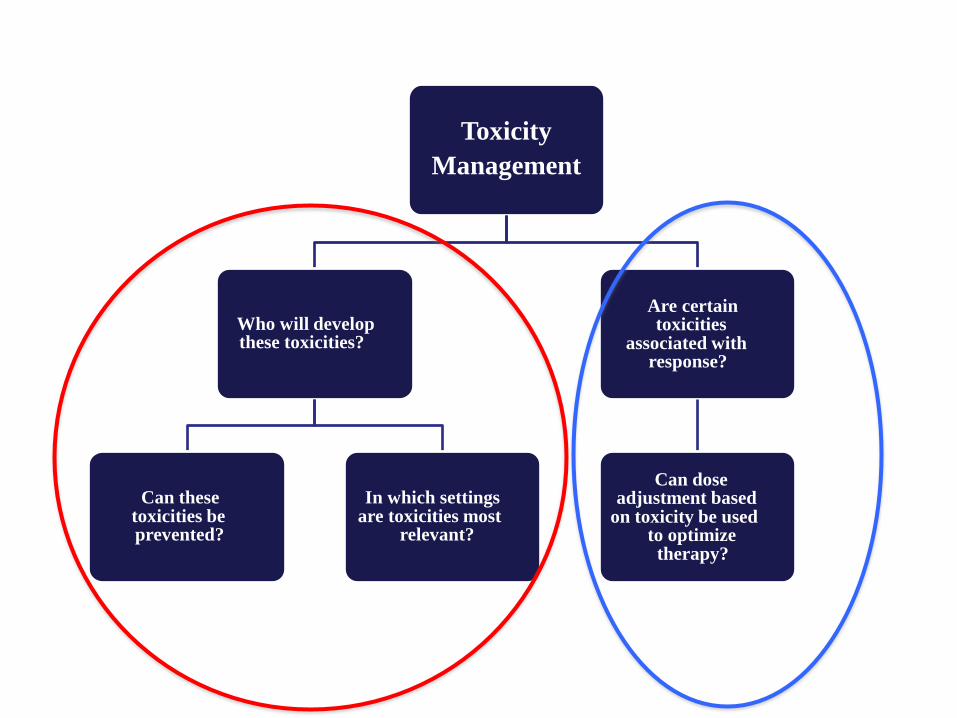
Toxicity
Management
Who will develop these toxicities?
Can these toxicities be prevented?
In which settings are toxicities most relevant?
Are certain toxicities associated with response?
Can dose adjustment based on toxicity be used to optimize therapy?
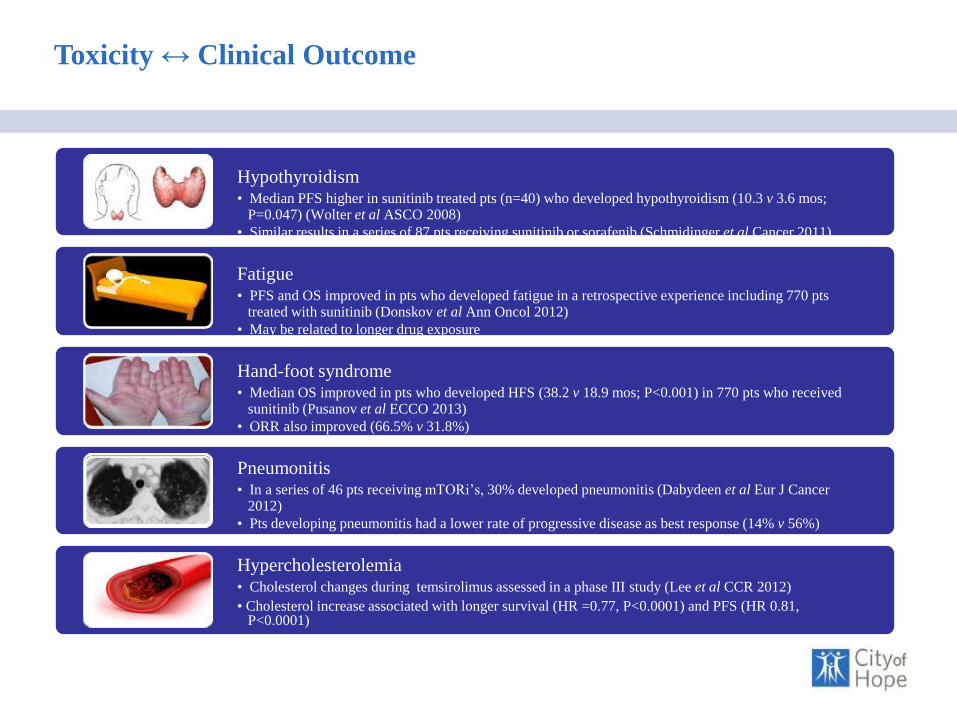
Toxicity ↔ Clinical Outcome
Hypothyroidism • Median PFS higher in sunitinib treated pts (n=40) who developed hypothyroidism (10.3 v 3.6 mos; P=0.047) (Wolter et al ASCO 2008)
• Similar results in a series of 87 pts receiving sunitinib or sorafenib (Schmidinger et al Cancer 2011) Fatigue • PFS and OS improved in pts who developed fatigue in a retrospective experience including 770 pts treated with sunitinib (Donskov et al Ann Oncol 2012)
• May be related to longer drug exposure Hand-foot syndrome • Median OS improved in pts who developed HFS (38.2 v 18.9 mos; P<0.001) in 770 pts who received sunitinib (Pusanov et al ECCO 2013)
• ORR also improved (66.5% v 31.8%) Pneumonitis • In a series of 46 pts receiving mTORi’s, 30% developed pneumonitis (Dabydeen et al Eur J Cancer 2012)
• Pts developing pneumonitis had a lower rate of progressive disease as best response (14% v 56%) Hypercholesterolemia • Cholesterol changes during temsirolimus assessed in a phase III study (Lee et al CCR 2012)
• Cholesterol increase associated with longer survival (HR =0.77, P<0.0001) and PFS (HR 0.81, P<0.0001)
“Working Group Toxicidades”
Trabajo en Equipo
Apple store: formato iPhone y iPad
Google store: formato Android
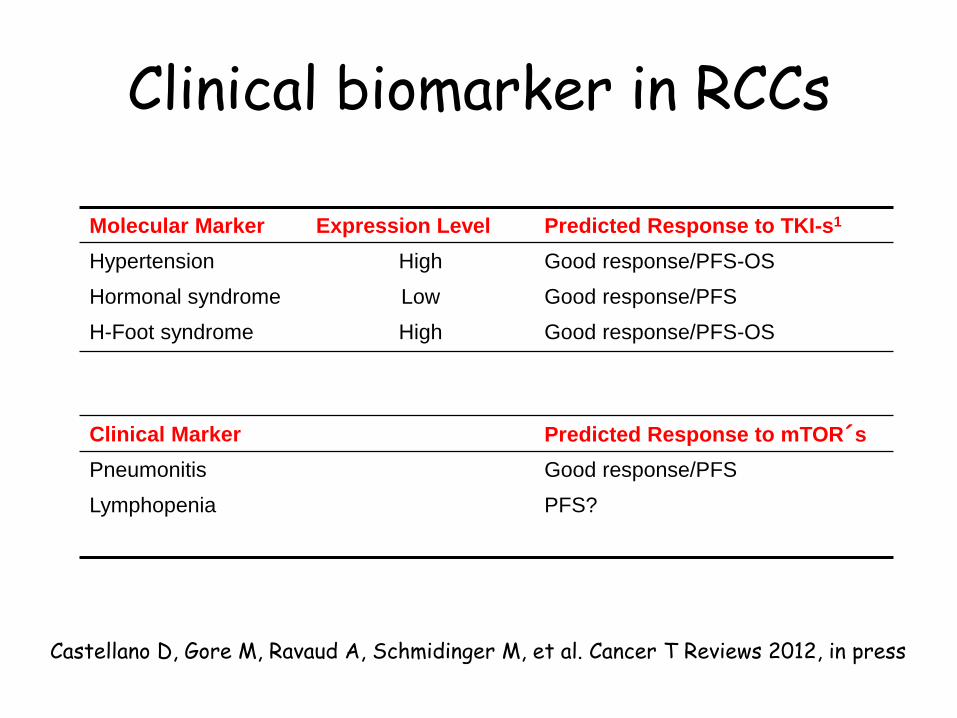
Clinical biomarker in RCCs
Molecular Marker Expression Level Predicted Response to TKI-s1
Hypertension High Good response/PFS-OS
Hormonal syndrome Low Good response/PFS
H-Foot syndrome High Good response/PFS-OS
Clinical Marker Predicted Response to mTOR´s
Pneumonitis Good response/PFS
Lymphopenia PFS?
Castellano D, Gore M, Ravaud A, Schmidinger M, et al. Cancer T Reviews 2012, in press
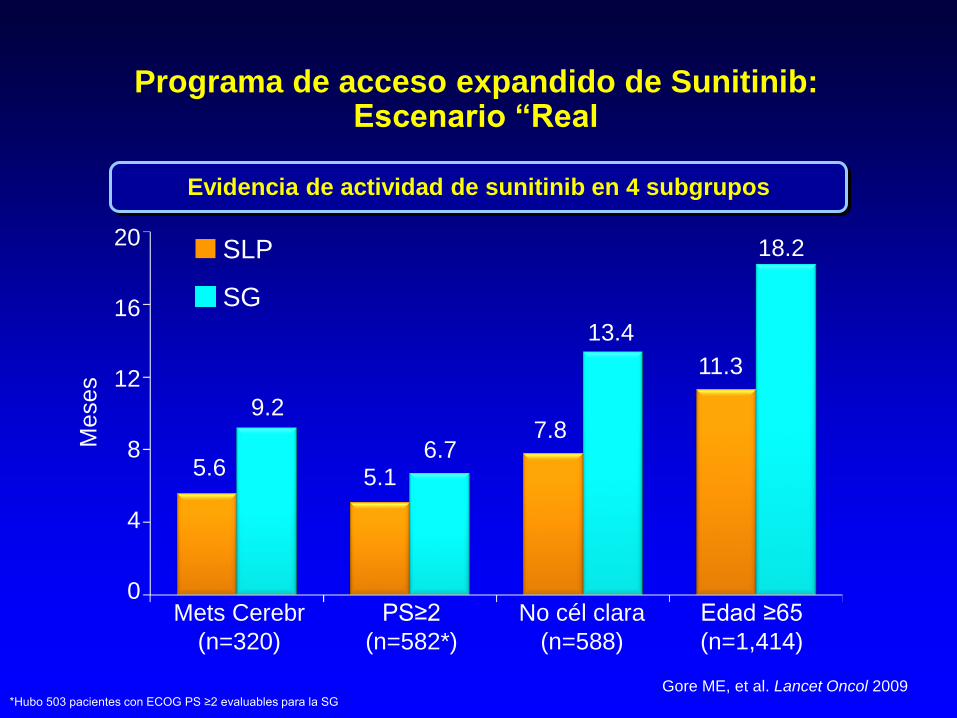
Programa de acceso expandido de Sunitinib: Escenario “Real
Evidencia de actividad de sunitinib en 4 subgrupos
Gore ME, et al. Lancet Oncol 2009
SLP
SG
Meses
5.6
9.2
5.1 6.7
7.8
13.4
11.3
18.2
*Hubo 503 pacientes con ECOG PS ≥2 evaluables para la SG
Mets Cerebr PS≥2 No cél clara Edad ≥65
(n=320) (n=582*) (n=588) (n=1,414)
20
16
12
8
4
0
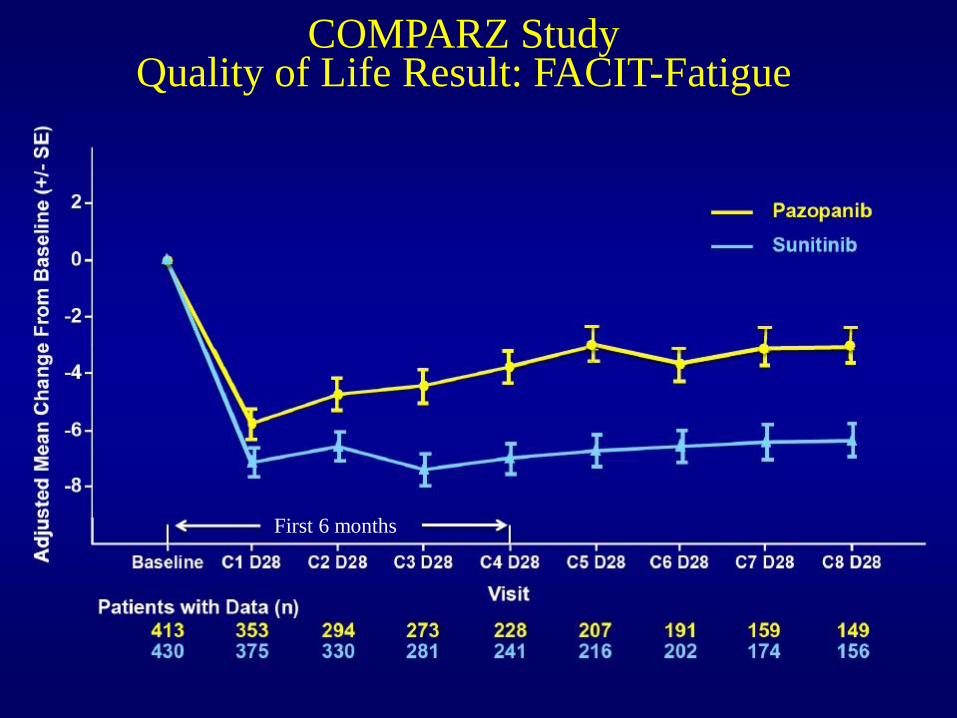
COMPARZ Study Quality of Life Result: FACIT-Fatigue
First 6 months
Pati
ents
(%
)
90 80 70 60 50 40 30 20 10 0
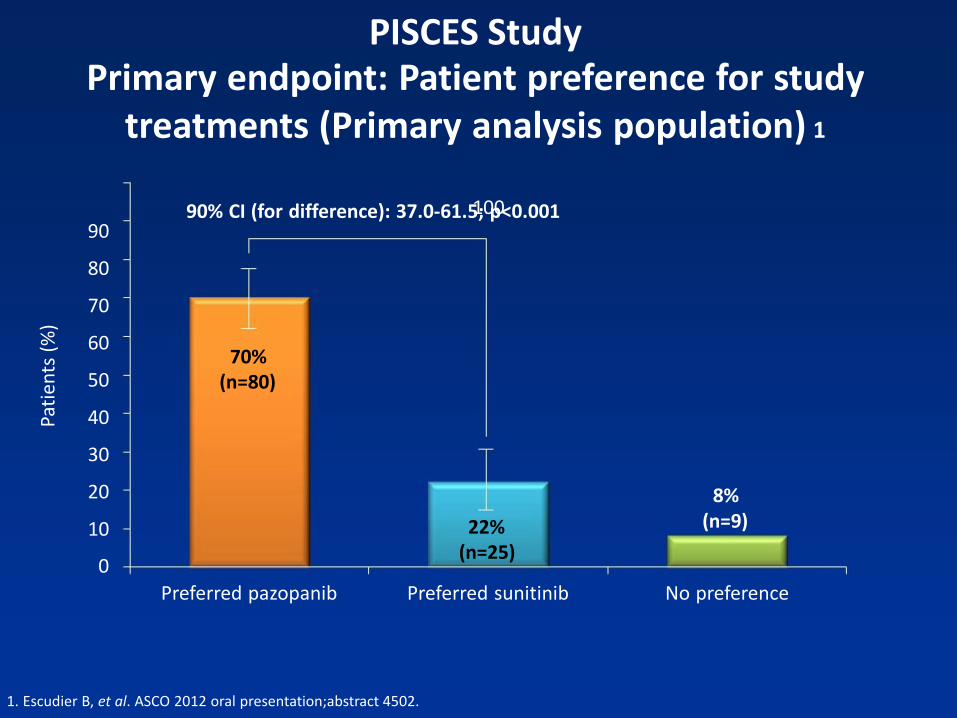
PISCES Study Primary endpoint: Patient preference for study
treatments (Primary analysis population) 1
100
Preferred pazopanib Preferred sunitinib No preference
90% CI (for difference): 37.0-61.5; p<0.001 70% (n=80) 22% (n=25)
8% (n=9)
1. Escudier B, et al. ASCO 2012 oral presentation;abstract 4502.
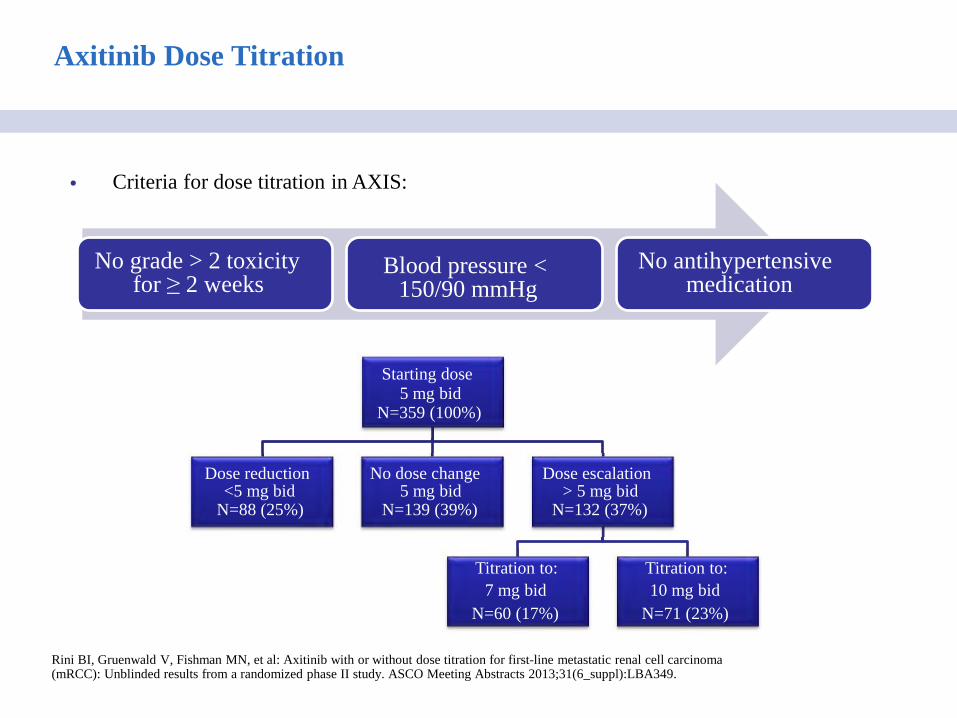
Axitinib Dose Titration
Rini BI, Gruenwald V, Fishman MN, et al: Axitinib with or without dose titration for first-line metastatic renal cell carcinoma (mRCC): Unblinded results from a randomized phase II study. ASCO Meeting Abstracts 2013;31(6_suppl):LBA349.
No grade > 2 toxicity for ≥ 2 weeks
No antihypertensive medication
• Criteria for dose titration in AXIS:
Blood pressure < 150/90 mmHg Starting dose 5 mg bid N=359 (100%)
Dose reduction <5 mg bid N=88 (25%)
No dose change 5 mg bid N=139 (39%)
Dose escalation > 5 mg bid N=132 (37%)
Titration to:
7 mg bid
N=60 (17%)
Titration to:
10 mg bid
N=71 (23%)
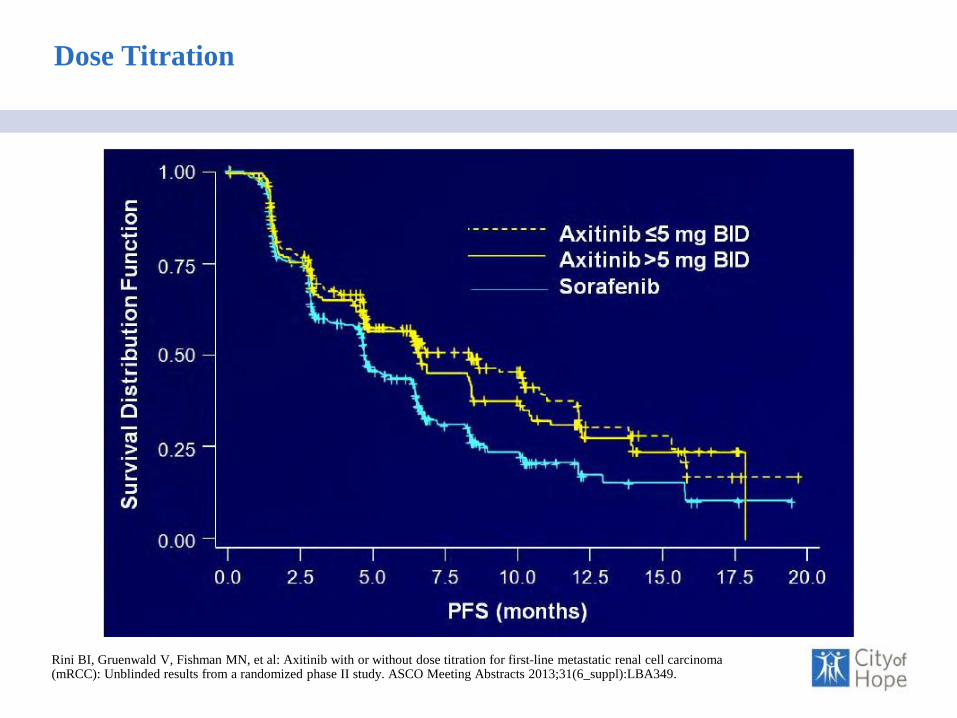
Dose Titration
Rini BI, Gruenwald V, Fishman MN, et al: Axitinib with or without dose titration for first-line metastatic renal cell carcinoma (mRCC): Unblinded results from a randomized phase II study. ASCO Meeting Abstracts 2013;31(6_suppl):LBA349.
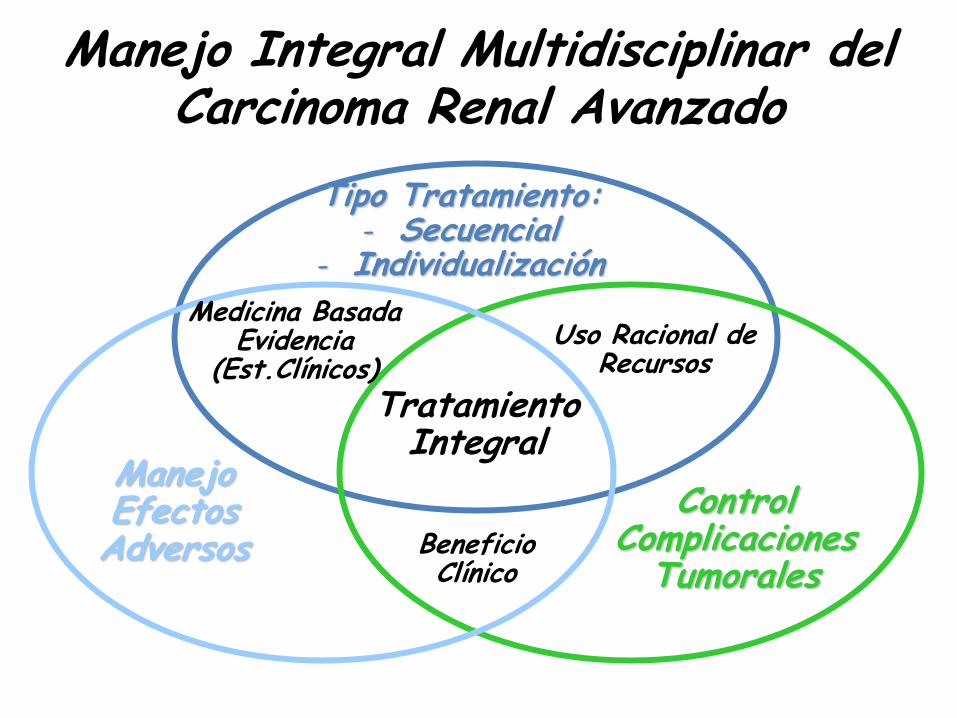
Tipo Tratamiento: - Secuencial
- Individualización
Control Complicaciones
Tumorales
Tratamiento Integral
Manejo Efectos Adversos
Medicina Basada Evidencia
(Est.Clínicos) Uso Racional de
Recursos
Beneficio Clínico
Manejo Integral Multidisciplinar del Carcinoma Renal Avanzado

¿Cómo sacar el máximo partido a los
diferentes fármacos disponibles?
• Relacionados con:
– Tumor
– Paciente
– Manejo del Fármaco
– Estrategia terapéutica
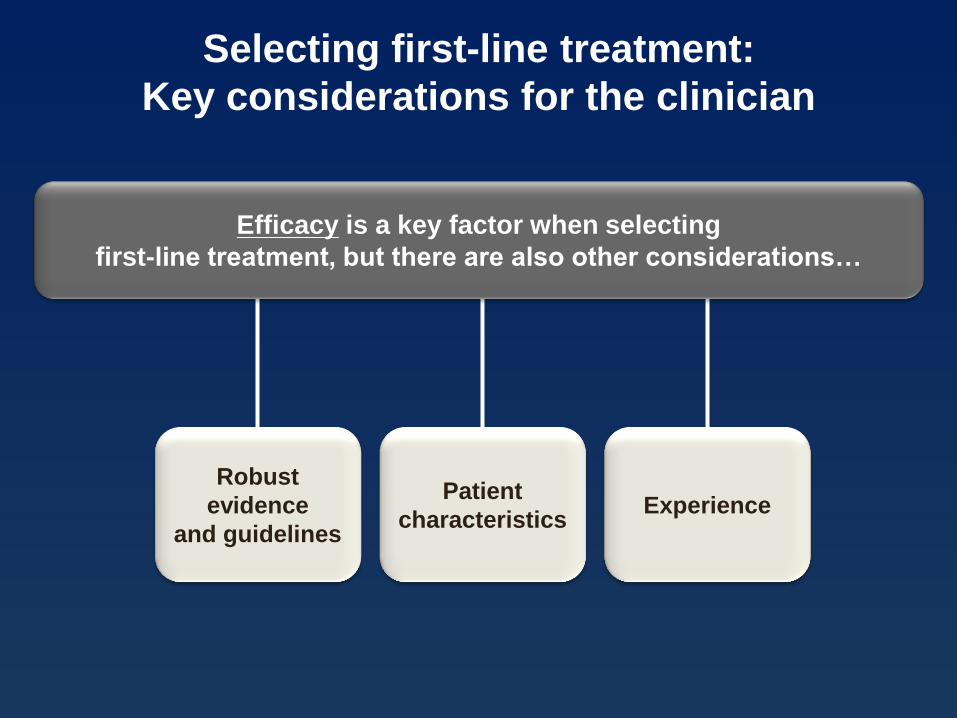
Selecting first-line treatment:
Key considerations for the clinician
Robust
evidence
and guidelines
Patient
characteristics Experience
Efficacy is a key factor when selecting
first-line treatment, but there are also other considerations…
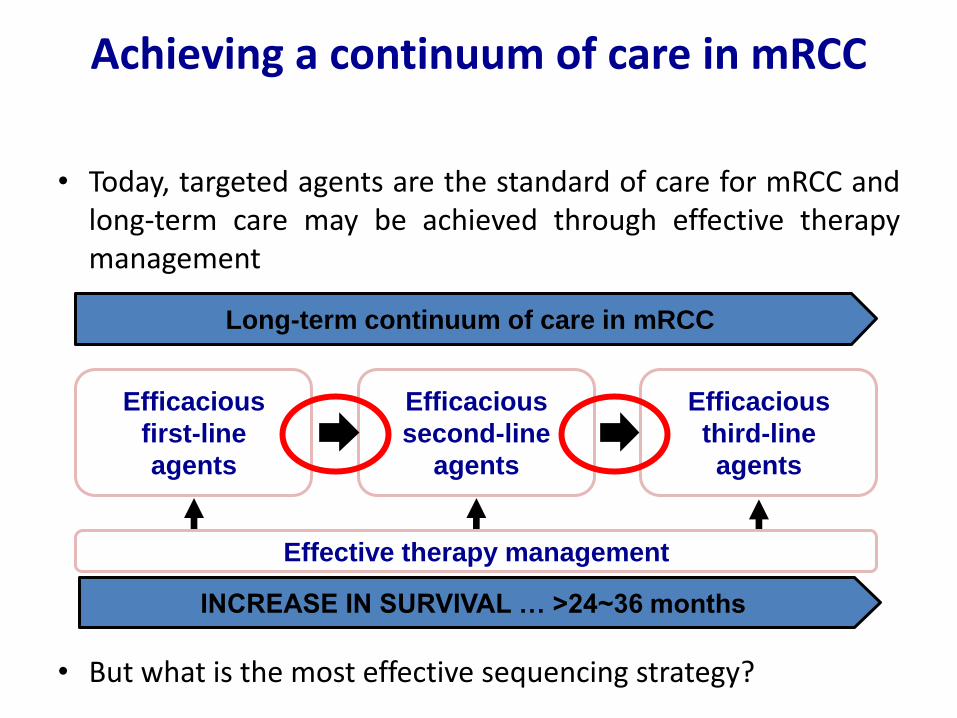
Achieving a continuum of care in mRCC
• Today, targeted agents are the standard of care for mRCC and long-term care may be achieved through effective therapy management
• But what is the most effective sequencing strategy?
Long-term continuum of care in mRCC
Efficacious
first-line
agents
Efficacious
second-line
agents
Efficacious
third-line
agents
Effective therapy management
INCREASE IN SURVIVAL … >24~36 months
No. en riesgo
Sunitinib: 375 240 156 54 10 1
IFN-α: 375 124 46 15 4 0
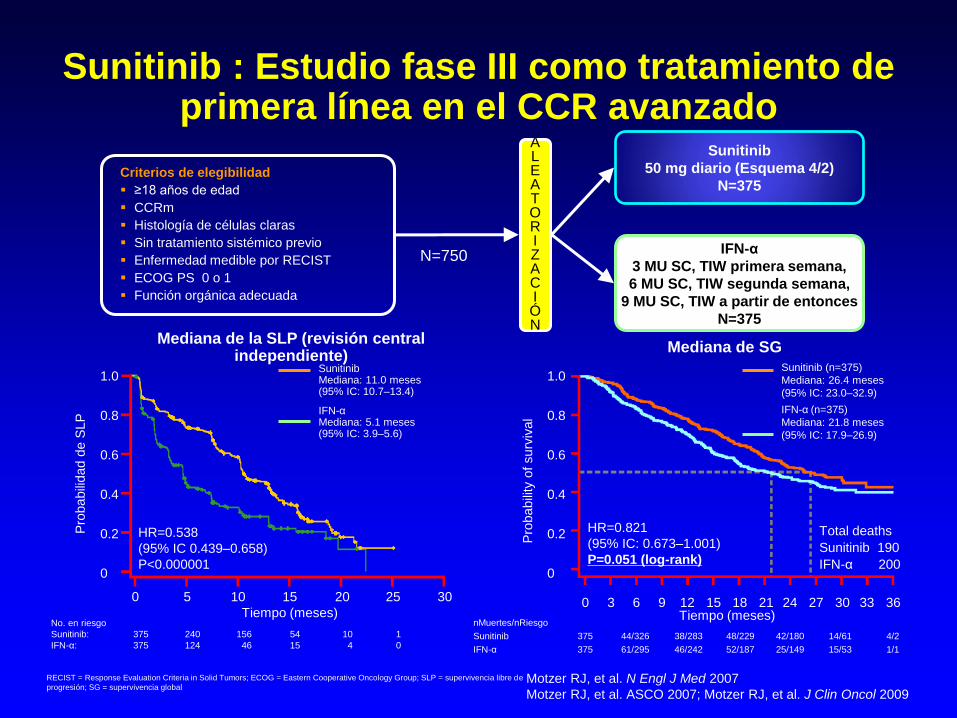
Sunitinib : Estudio fase III como tratamiento de primera línea en el CCR avanzado
Sunitinib
50 mg diario (Esquema 4/2)
N=375
IFN-α
3 MU SC, TIW primera semana,
6 MU SC, TIW segunda semana,
9 MU SC, TIW a partir de entonces
N=375
Criterios de elegibilidad
≥18 años de edad
CCRm
Histología de células claras
Sin tratamiento sistémico previo
Enfermedad medible por RECIST
ECOG PS 0 o 1
Función orgánica adecuada
N=750
ALEATOR I ZAC I ÓN
Motzer RJ, et al. N Engl J Med 2007
Motzer RJ, et al. ASCO 2007; Motzer RJ, et al. J Clin Oncol 2009
0 5 10 15 20 25 30
Tiempo (meses)
HR=0.538
(95% IC 0.439–0.658)
P<0.000001
Sunitinib Mediana: 11.0 meses (95% IC: 10.7–13.4)
IFN-α Mediana: 5.1 meses (95% IC: 3.9–5.6)
1.0
0.8
0.6
0.4
0.2
0
Pro
babili
dad d
e S
LP
Mediana de SG Mediana de la SLP (revisión central
independiente)
Pro
babili
ty o
f surv
ival
HR=0.821
(95% IC: 0.673–1.001)
P=0.051 (log-rank)
Sunitinib (n=375)
Mediana: 26.4 meses
(95% IC: 23.0–32.9)
IFN-α (n=375)
Mediana: 21.8 meses
(95% IC: 17.9–26.9)
Total deaths
Sunitinib 190
IFN-α 200
0 3 6 9 12 15 18 21 24 27 30 33 36
1.0
0.8
0.6
0.4
0.2
0
nMuertes/nRiesgo
Sunitinib 375 44/326 38/283 48/229 42/180 14/61 4/2
IFN-α 375 61/295 46/242 52/187 25/149 15/53 1/1
Tiempo (meses)
RECIST = Response Evaluation Criteria in Solid Tumors; ECOG = Eastern Cooperative Oncology Group; SLP = supervivencia libre de
progresión; SG = supervivencia global
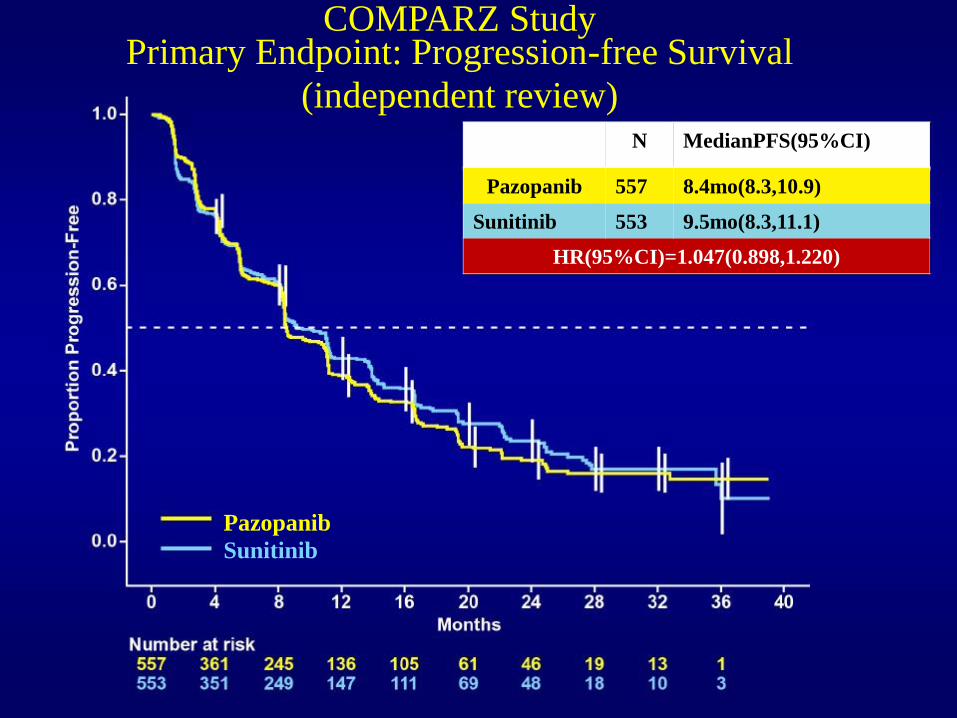
N MedianPFS(95%CI)
Pazopanib 557 8.4mo(8.3,10.9)
Sunitinib 553 9.5mo(8.3,11.1)
HR(95%CI)=1.047(0.898,1.220)
COMPARZ Study Primary Endpoint: Progression-free Survival
(independent review)
Pazopanib
Sunitinib
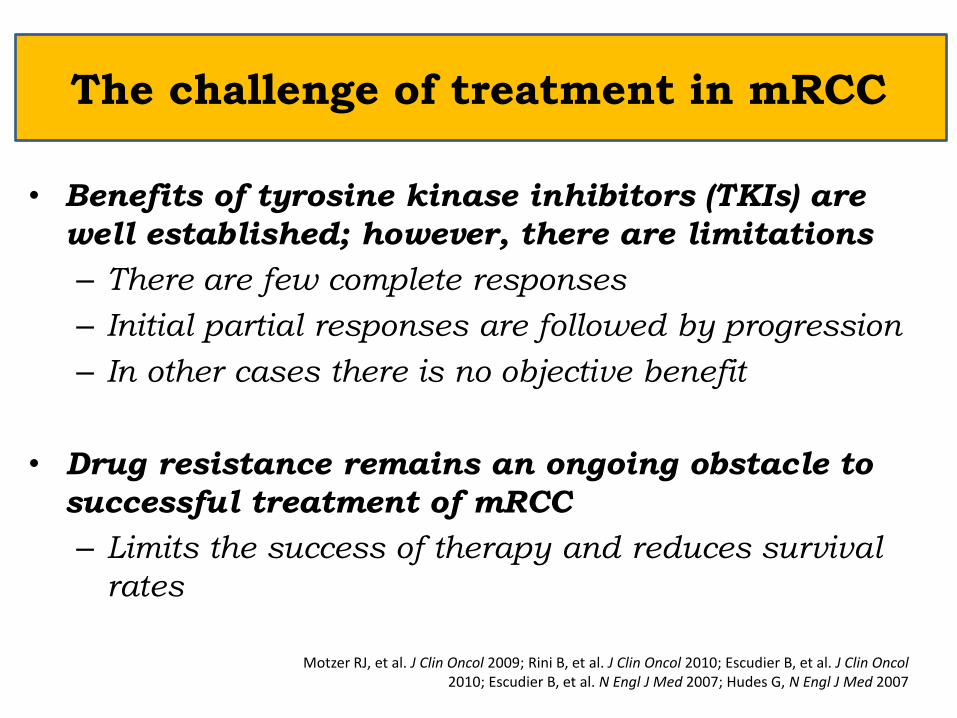
The challenge of treatment in mRCC
• Benefits of tyrosine kinase inhibitors (TKIs) are
well established; however, there are limitations
– There are few complete responses
– Initial partial responses are followed by progression
– In other cases there is no objective benefit
• Drug resistance remains an ongoing obstacle to
successful treatment of mRCC
– Limits the success of therapy and reduces survival
rates
Motzer RJ, et al. J Clin Oncol 2009; Rini B, et al. J Clin Oncol 2010; Escudier B, et al. J Clin Oncol 2010; Escudier B, et al. N Engl J Med 2007; Hudes G, N Engl J Med 2007
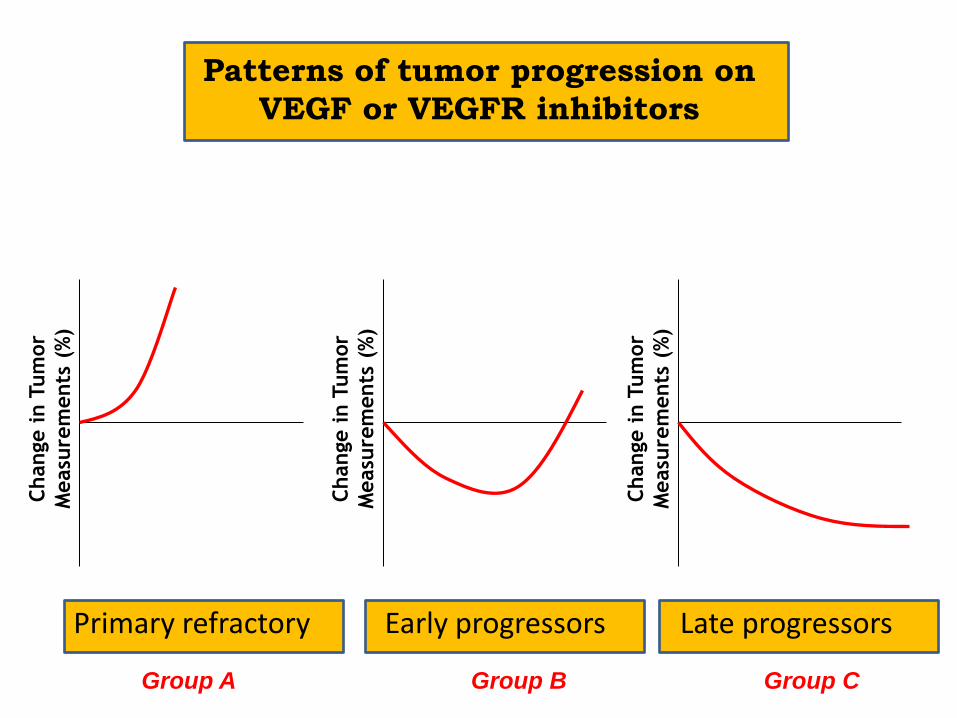
Patterns of tumor progression on
VEGF or VEGFR inhibitors
Change i
n T
um
or
Measu
rem
ents
(%
)
Change i
n T
um
or
Measu
rem
ents
(%
)
Change i
n T
um
or
Measu
rem
ents
(%
)
Primary refractory Early progressors Late progressors
Group A Group B Group C
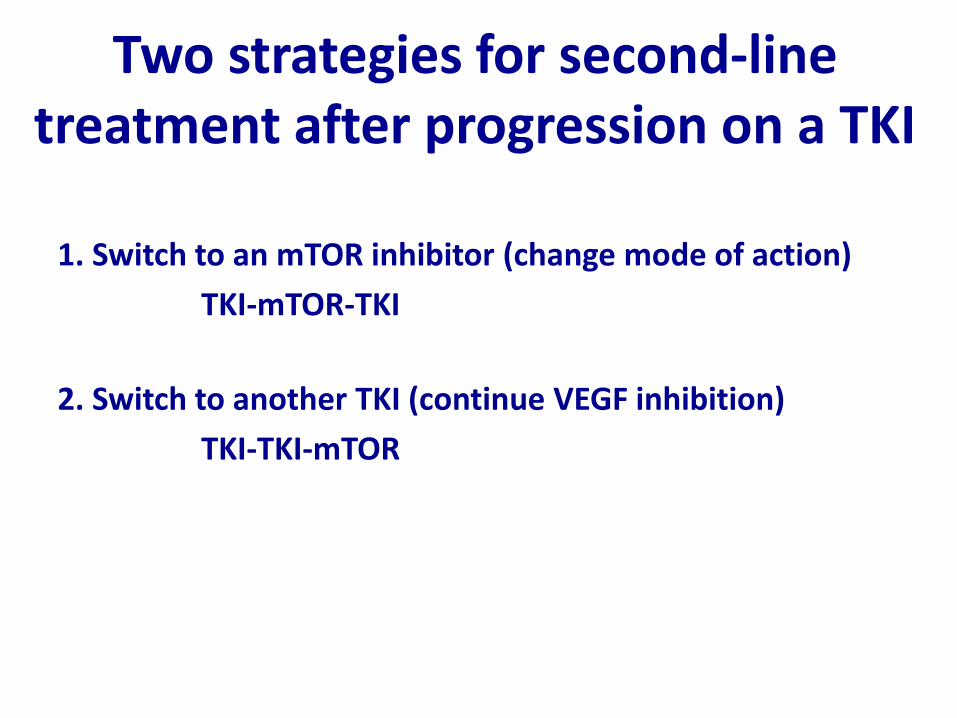
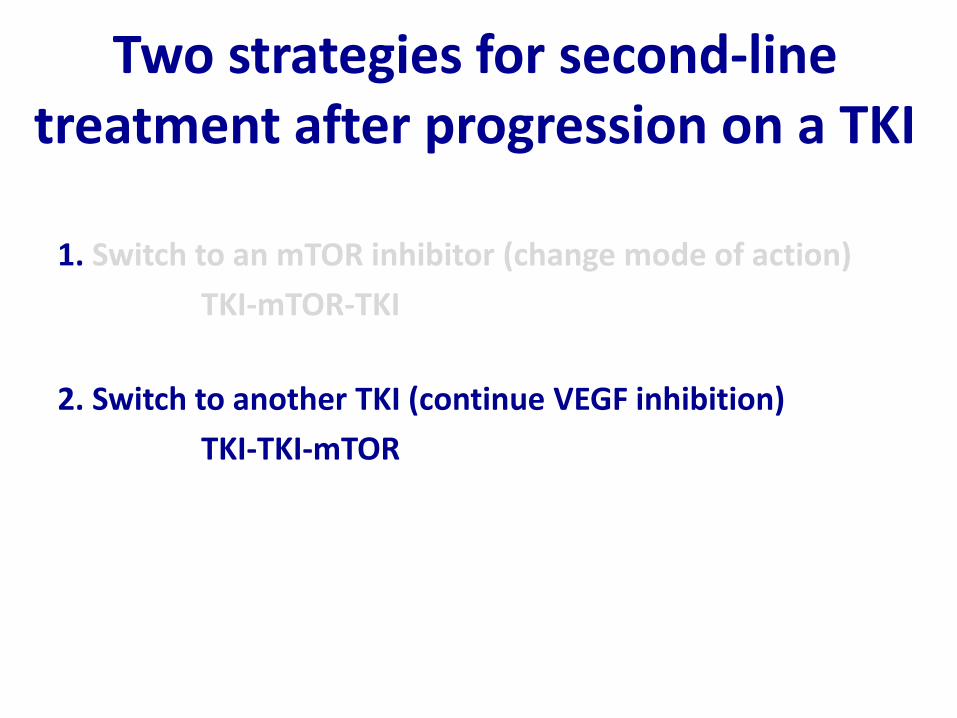
Two strategies for second-line treatment after progression on a TKI
1. Switch to an mTOR inhibitor (change mode of action)
TKI-mTOR-TKI
2. Switch to another TKI (continue VEGF inhibition)
TKI-TKI-mTOR
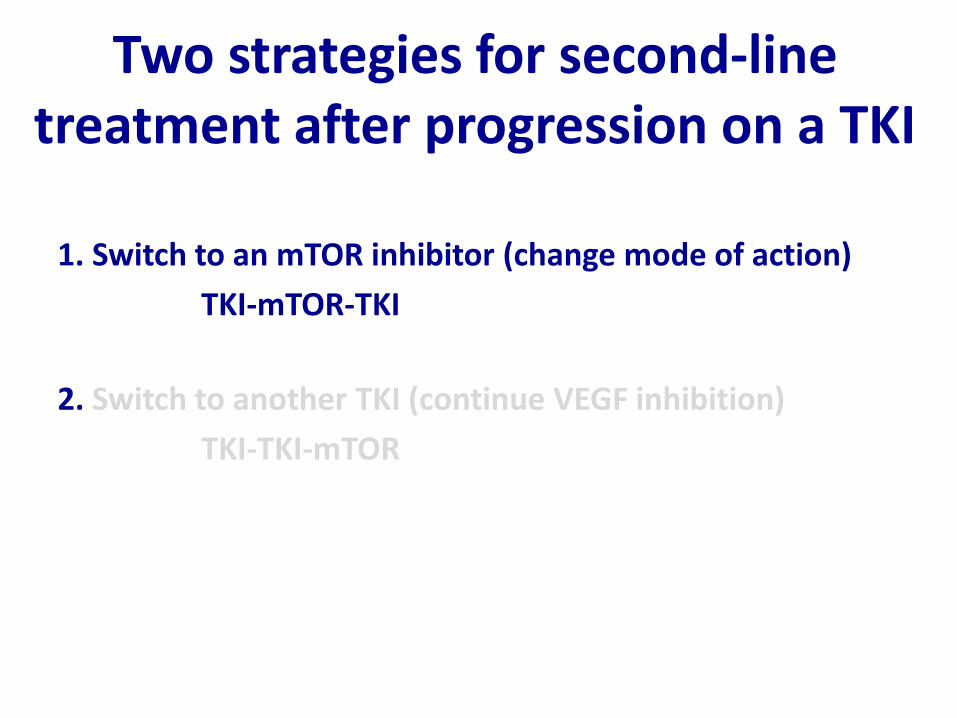
Two strategies for second-line treatment after progression on a TKI
1. Switch to an mTOR inhibitor (change mode of action)
TKI-mTOR-TKI
2. Switch to another TKI (continue VEGF inhibition)
TKI-TKI-mTOR
40
Everolimus + BSC (n=272)
Placebo + BSC (n=138)
Si hay progresión
A L E A T O R I Z A C I Ó
NN
2:1
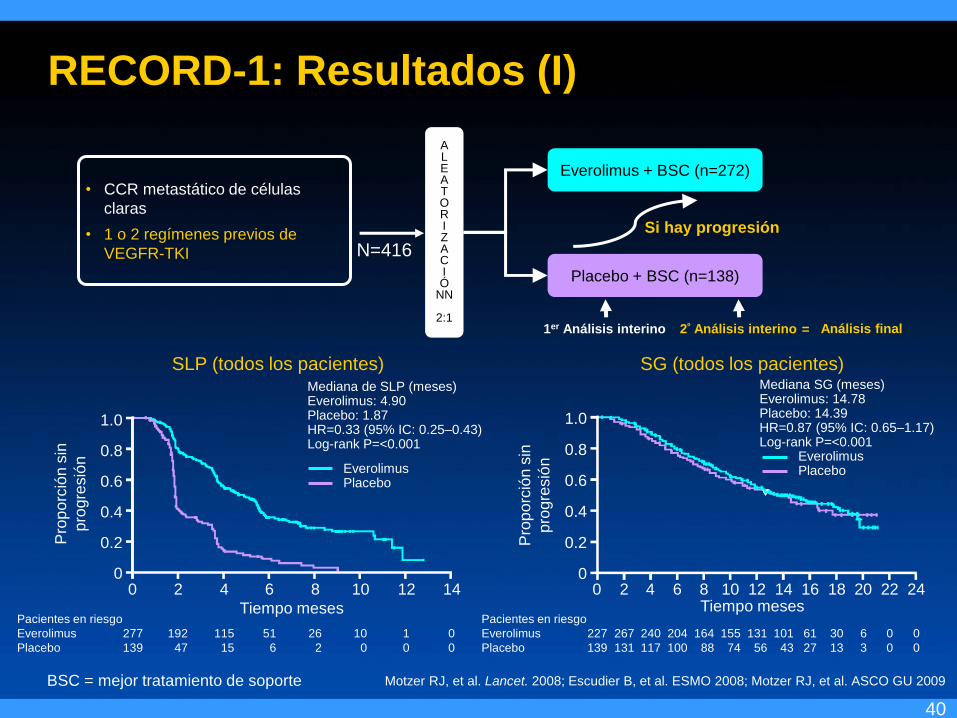
• CCR metastático de células
claras
• 1 o 2 regímenes previos de
VEGFR-TKI
1er Análisis interino 2º Análisis interino Análisis final =
N=416
Motzer RJ, et al. Lancet. 2008; Escudier B, et al. ESMO 2008; Motzer RJ, et al. ASCO GU 2009
RECORD-1: Resultados (I)
SLP (todos los pacientes)
1.0
0.8
0.6
0.4
0.2
0
Pro
po
rció
n s
in
pro
gre
sió
n
Tiempo meses
0 2 4 6 8 10 12 14
Pacientes en riesgo
Everolimus 277 192 115 51 26 10 1 0
Placebo 139 47 15 6 2 0 0 0
Mediana de SLP (meses) Everolimus: 4.90 Placebo: 1.87 HR=0.33 (95% IC: 0.25–0.43) Log-rank P=<0.001
Everolimus Placebo
SG (todos los pacientes)
1.0
0.8
0.6
0.4
0.2
0 0 2 4 6 8 10 12 14 16 18 20 22 24
Pacientes en riesgo
Everolimus 227 267 240 204 164 155 131 101 61 30 6 0 0
Placebo 139 131 117 100 88 74 56 43 27 13 3 0 0
Mediana SG (meses) Everolimus: 14.78 Placebo: 14.39 HR=0.87 (95% IC: 0.65–1.17) Log-rank P=<0.001 Everolimus Placebo
Pro
po
rció
n s
in
pro
gre
sió
n
Tiempo meses
BSC = mejor tratamiento de soporte
41
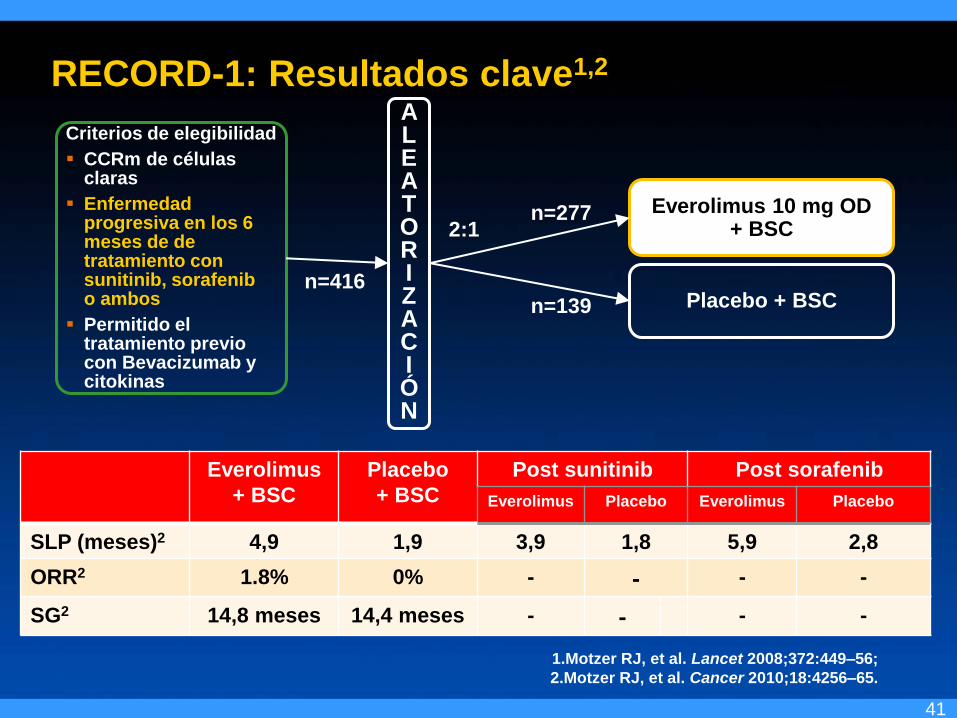
RECORD-1: Resultados clave1,2
Criterios de elegibilidad
CCRm de células claras
Enfermedad progresiva en los 6 meses de de tratamiento con sunitinib, sorafenib o ambos
Permitido el tratamiento previo con Bevacizumab y citokinas
A L E A T O R I Z A C I Ó N
n=416
Everolimus 10 mg OD + BSC
Placebo + BSC
1.Motzer RJ, et al. Lancet 2008;372:449–56;
2.Motzer RJ, et al. Cancer 2010;18:4256–65.
Everolimus
+ BSC
Placebo
+ BSC
Post sunitinib Post sorafenib
Everolimus Placebo Everolimus Placebo
SLP (meses)2 4,9 1,9 3,9 1,8 5,9 2,8
ORR2 1.8% 0% - - - -
SG2 14,8 meses 14,4 meses - - - -
2:1
n=139
n=277
42
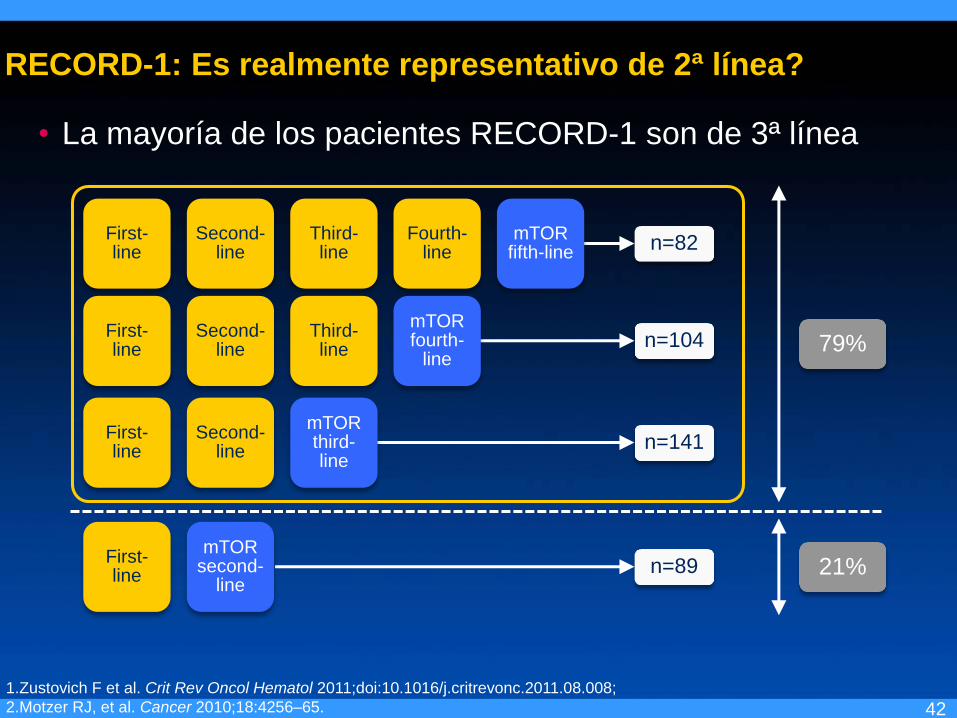
RECORD-1: Es realmente representativo de 2ª línea?
• La mayoría de los pacientes RECORD-1 son de 3ª línea
1.Zustovich F et al. Crit Rev Oncol Hematol 2011;doi:10.1016/j.critrevonc.2011.08.008;
2.Motzer RJ, et al. Cancer 2010;18:4256–65.
First- line
Second- line
Third- line
Fourth-line n=82
n=104
n=141
n=89
First- line
Second- line
Third- line
First- line
Second- line
First- line
79%
21%
mTOR fifth-line
mTOR fourth-
line
mTOR third- line
mTOR second-
line
Two strategies for second-line treatment after progression on a TKI
1. Switch to an mTOR inhibitor (change mode of action)
TKI-mTOR-TKI
2. Switch to another TKI (continue VEGF inhibition)
TKI-TKI-mTOR
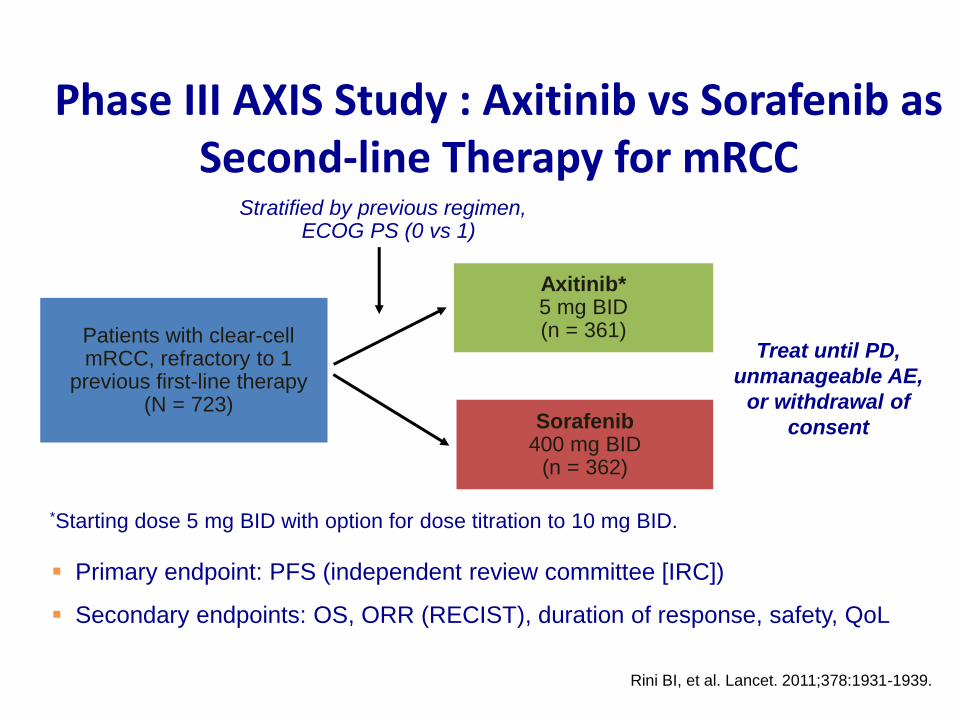
Treat until PD,
unmanageable AE,
or withdrawal of
consent
Axitinib* 5 mg BID (n = 361)
Primary endpoint: PFS (independent review committee [IRC])
Secondary endpoints: OS, ORR (RECIST), duration of response, safety, QoL
Patients with clear-cell mRCC, refractory to 1
previous first-line therapy (N = 723)
Sorafenib 400 mg BID
(n = 362)
Stratified by previous regimen, ECOG PS (0 vs 1)
*Starting dose 5 mg BID with option for dose titration to 10 mg BID.
Rini BI, et al. Lancet. 2011;378:1931-1939.
Phase III AXIS Study : Axitinib vs Sorafenib as Second-line Therapy for mRCC
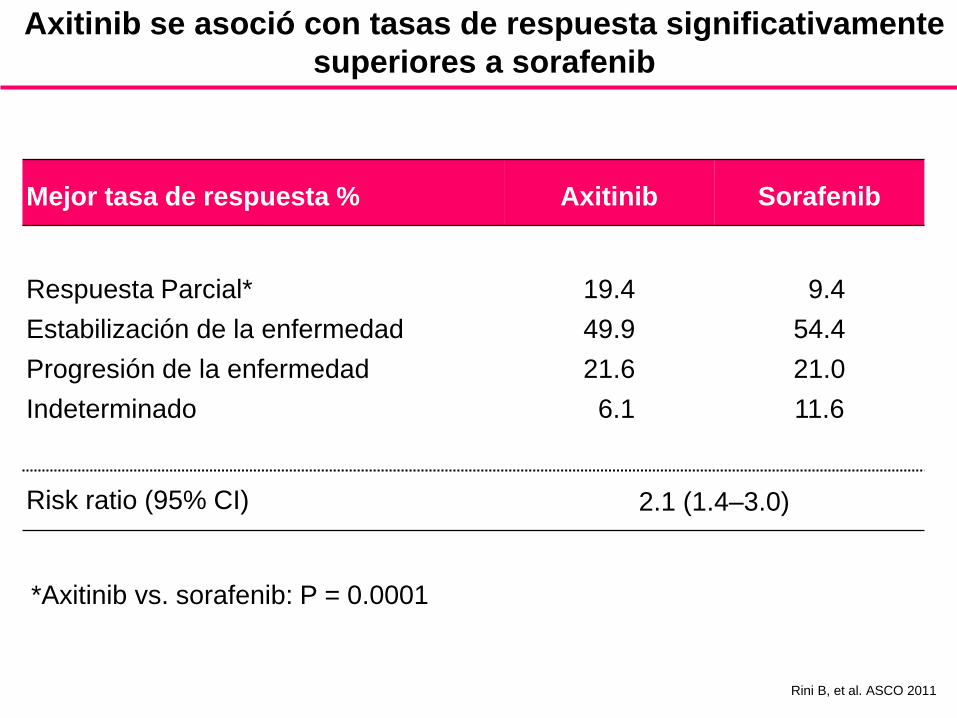
Axitinib se asoció con tasas de respuesta significativamente
superiores a sorafenib
Mejor tasa de respuesta % Axitinib Sorafenib
Respuesta Parcial*
Estabilización de la enfermedad
Progresión de la enfermedad
Indeterminado
19.4
49.9
21.6
6.1
9.4
54.4
21.0
11.6
Risk ratio (95% CI) 2.1 (1.4–3.0)
*Axitinib vs. sorafenib: P = 0.0001
Rini B, et al. ASCO 2011
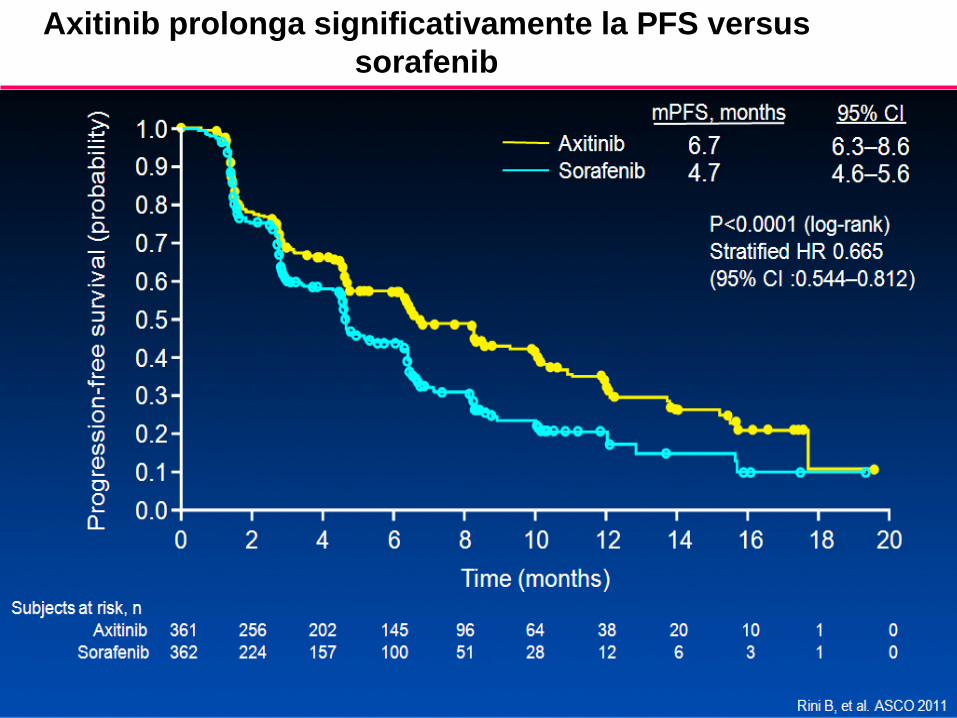
Axitinib prolonga significativamente la PFS versus
sorafenib
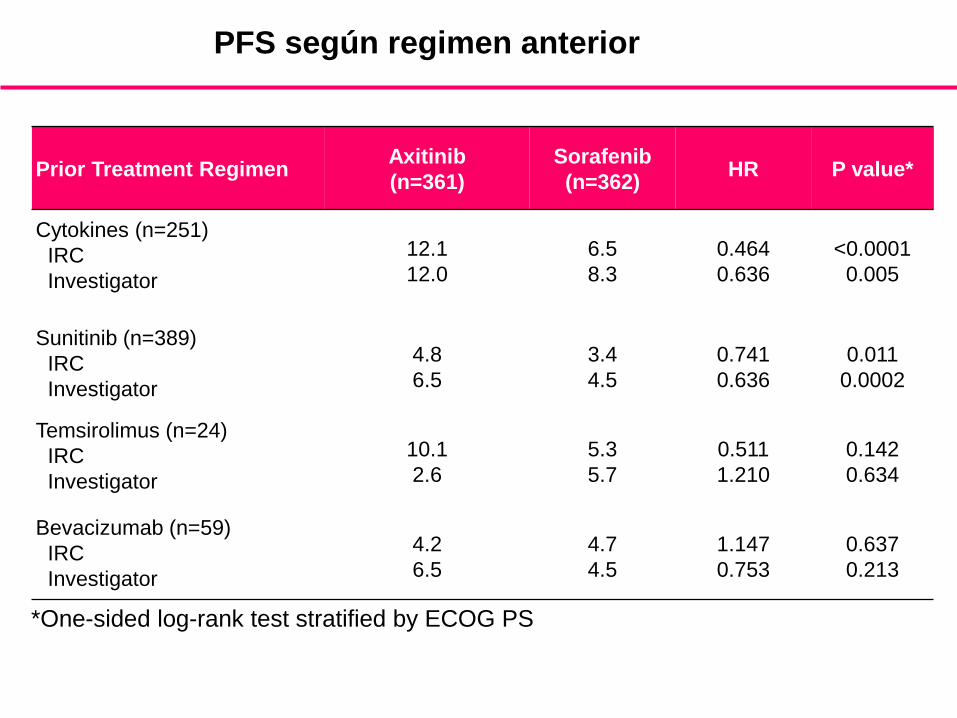
PFS según regimen anterior
Prior Treatment Regimen Axitinib
(n=361)
Sorafenib
(n=362) HR P value*
Cytokines (n=251)
IRC
Investigator
12.1
12.0
6.5
8.3
0.464
0.636
<0.0001
0.005
Sunitinib (n=389)
IRC
Investigator
4.8
6.5
3.4
4.5
0.741
0.636
0.011
0.0002
Temsirolimus (n=24)
IRC
Investigator
10.1
2.6
5.3
5.7
0.511
1.210
0.142
0.634
Bevacizumab (n=59)
IRC
Investigator
4.2
6.5
4.7
4.5
1.147
0.753
0.637
0.213
*One-sided log-rank test stratified by ECOG PS
Rini B, et al. ASCO 2011
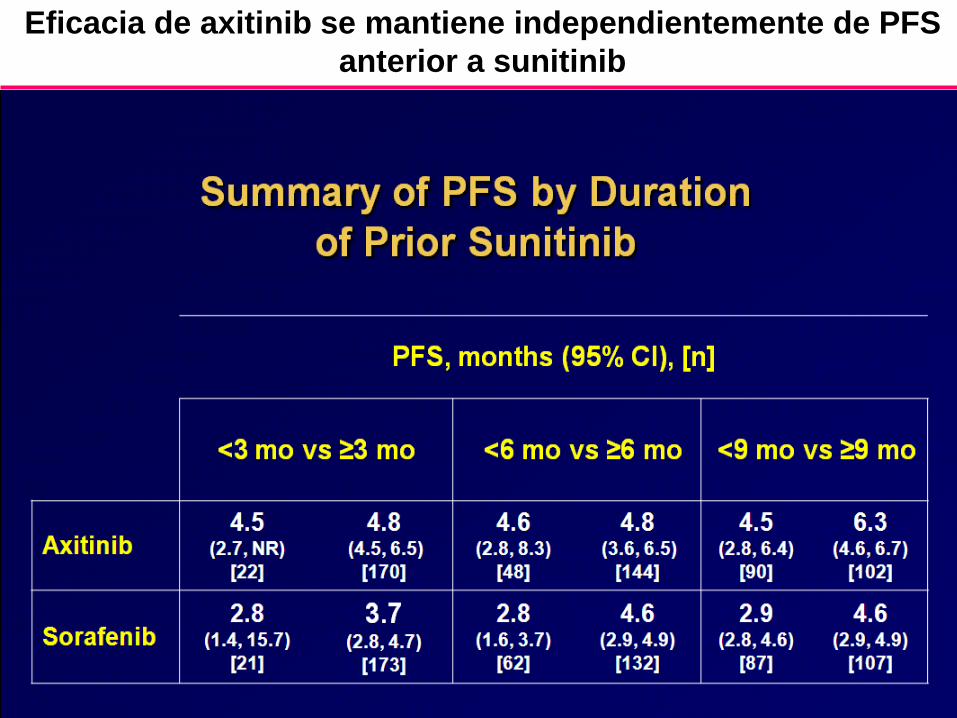
Eficacia de axitinib se mantiene independientemente de PFS
anterior a sunitinib
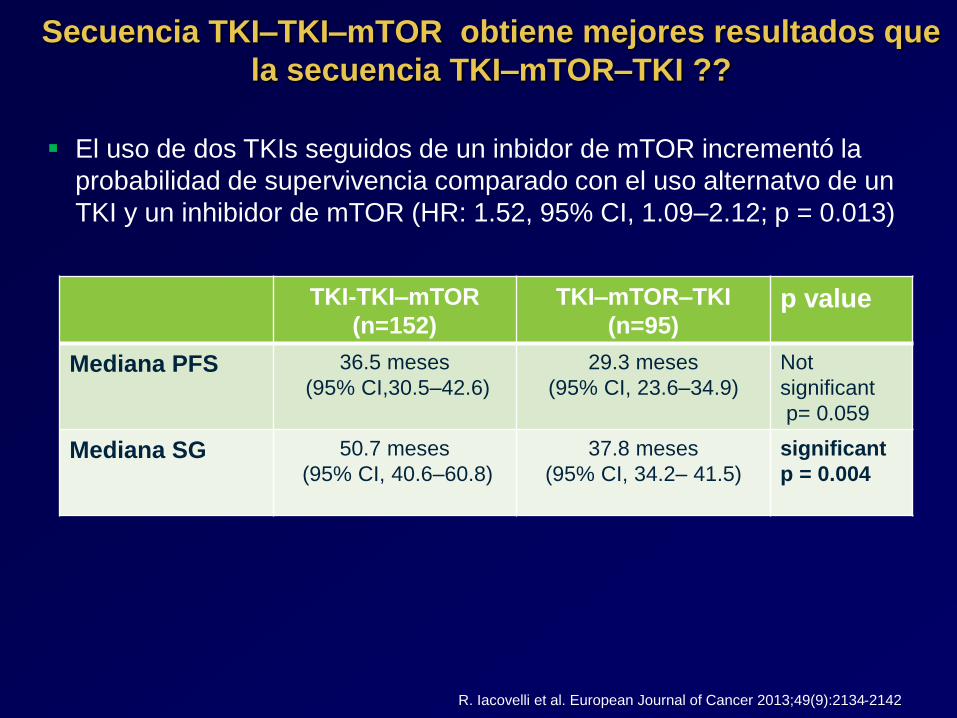
TKI-TKI–mTOR
(n=152)
TKI–mTOR–TKI
(n=95) p value
Mediana PFS
36.5 meses
(95% CI,30.5–42.6)
29.3 meses
(95% CI, 23.6–34.9)
Not
significant
p= 0.059
Mediana SG 50.7 meses
(95% CI, 40.6–60.8)
37.8 meses
(95% CI, 34.2– 41.5)
significant
p = 0.004
El uso de dos TKIs seguidos de un inbidor de mTOR incrementó la
probabilidad de supervivencia comparado con el uso alternatvo de un
TKI y un inhibidor de mTOR (HR: 1.52, 95% CI, 1.09–2.12; p = 0.013)
Secuencia TKI–TKI–mTOR obtiene mejores resultados que
la secuencia TKI–mTOR–TKI ??
R. Iacovelli et al. European Journal of Cancer 2013;49(9):2134-2142
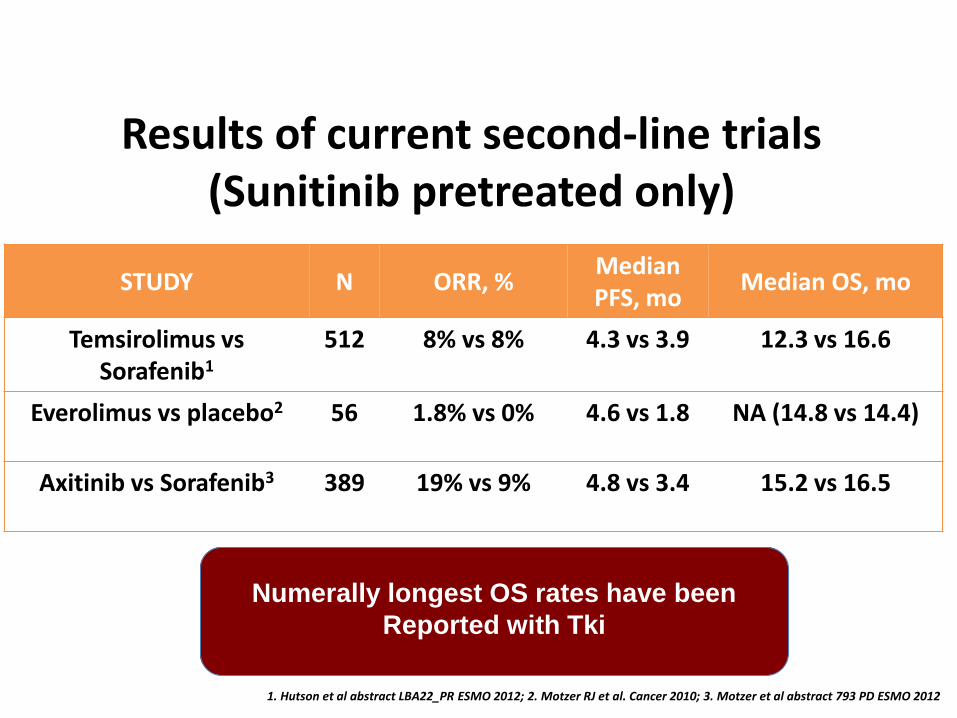
STUDY N ORR, % Median PFS, mo
Median OS, mo
Temsirolimus vs Sorafenib1
512 8% vs 8% 4.3 vs 3.9 12.3 vs 16.6
Everolimus vs placebo2 56 1.8% vs 0% 4.6 vs 1.8 NA (14.8 vs 14.4)
Axitinib vs Sorafenib3 389 19% vs 9% 4.8 vs 3.4 15.2 vs 16.5
Results of current second-line trials (Sunitinib pretreated only)
Numerally longest OS rates have been
Reported with Tki
1. Hutson et al abstract LBA22_PR ESMO 2012; 2. Motzer RJ et al. Cancer 2010; 3. Motzer et al abstract 793 PD ESMO 2012
Third-line therapy
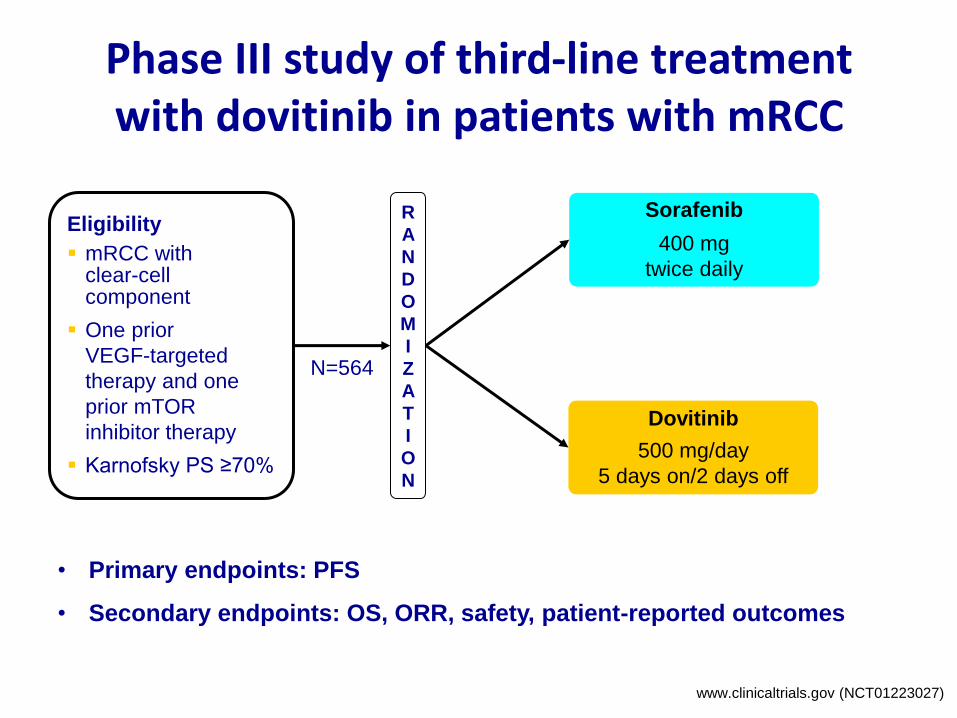
Phase III study of third-line treatment with dovitinib in patients with mRCC
• Primary endpoints: PFS
• Secondary endpoints: OS, ORR, safety, patient-reported outcomes
Eligibility
mRCC with clear-cell component
One prior
VEGF-targeted
therapy and one
prior mTOR
inhibitor therapy
Karnofsky PS ≥70%
Sorafenib
400 mg
twice daily
Dovitinib
500 mg/day
5 days on/2 days off
R
A
N
D
O
M
I
Z
A
T
I
O
N
N=564
www.clinicaltrials.gov (NCT01223027)
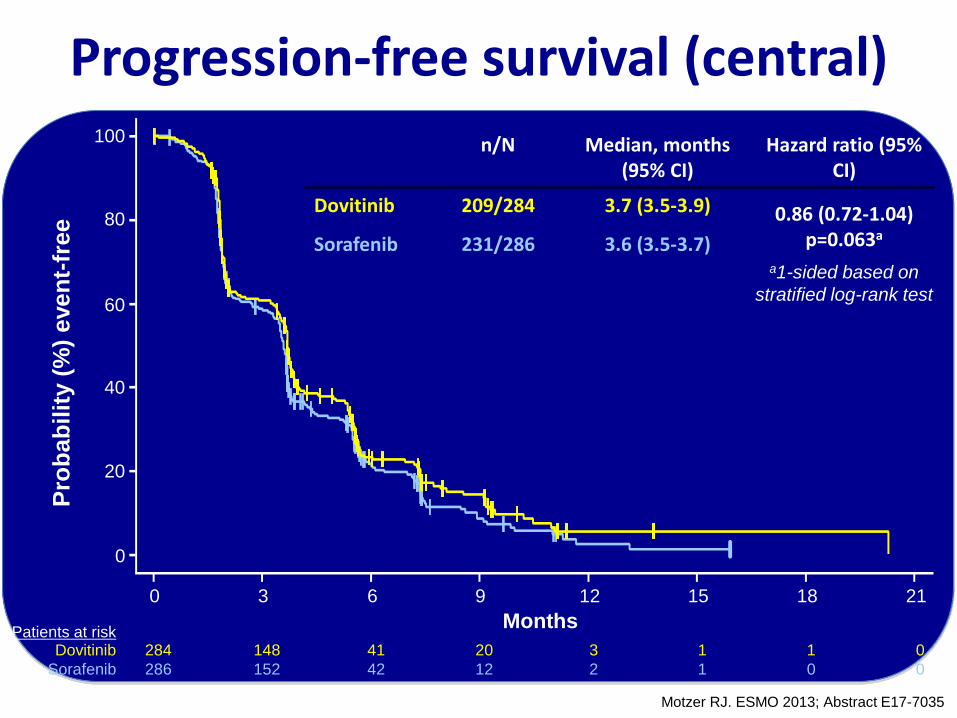
Progression-free survival (central) 100
80
60
40
20
0
0 3 6 9 12 15 18 21
Months
Pro
bab
ilit
y (
%)
even
t-fr
ee
284 148 41 20 3 1 1 0 Dovitinib
286 152 42 12 2 1 0 0 Sorafenib
n/N Median, months (95% CI)
Hazard ratio (95% CI)
Dovitinib 209/284 3.7 (3.5-3.9) 0.86 (0.72-1.04) p=0.063a
Sorafenib 231/286 3.6 (3.5-3.7)
Patients at risk
a1-sided based on
stratified log-rank test
Motzer RJ. ESMO 2013; Abstract E17-7035
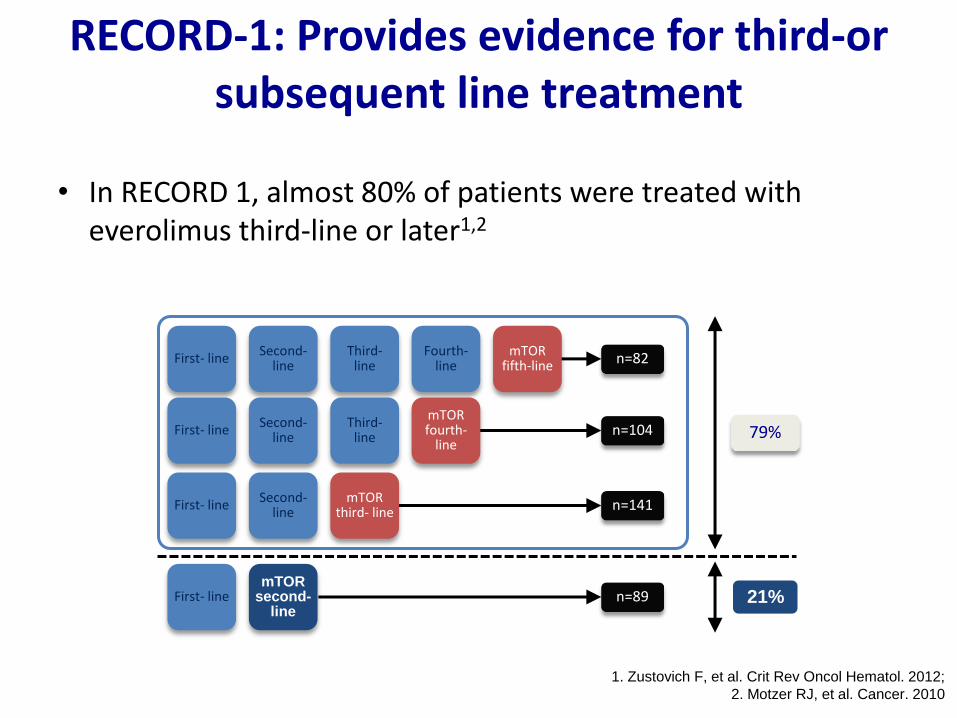
RECORD-1: Provides evidence for third-or subsequent line treatment
• In RECORD 1, almost 80% of patients were treated with everolimus third-line or later1,2
First- line Second-
line Third-
line Fourth-
line n=82
n=104
n=141
n=89
First- line Second-
line Third-
line
First- line Second-
line
First- line
79%
21%
mTOR fifth-line
mTOR fourth-
line
mTOR third- line
mTOR second-
line
1. Zustovich F, et al. Crit Rev Oncol Hematol. 2012;
2. Motzer RJ, et al. Cancer. 2010
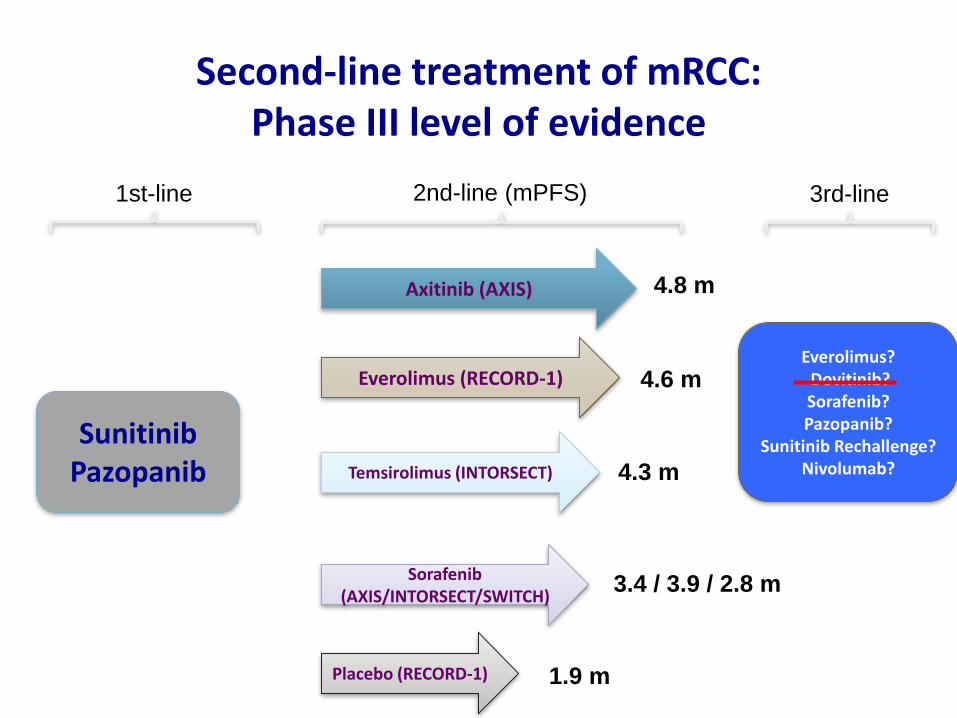
Second-line treatment of mRCC: Phase III level of evidence
Sunitinib Pazopanib
1st-line 2nd-line (mPFS)
Axitinib (AXIS)
Everolimus (RECORD-1)
Sorafenib (AXIS/INTORSECT/SWITCH)
Temsirolimus (INTORSECT)
4.8 m
4.6 m
3.4 / 3.9 / 2.8 m
4.3 m
Placebo (RECORD-1) 1.9 m
3rd-line
Everolimus? Dovitinib? Sorafenib? Pazopanib?
Sunitinib Rechallenge? Nivolumab?

57
Cáncer renal. ¿Cómo sacar el
máximo partido a los
diferentes fármacos
disponibles?
Noviembre de 2009


![CH 377 Sacar partido Twitter [Marzo][2013].pdf](https://static.fdocuments.ec/doc/165x107/5529bef8550346556e8b457f/ch-377-sacar-partido-twitter-marzo2013pdf.jpg)