ARTÍCULO / ARTICLE VULNERABILIDAD DEL ECOSISTEMA … · vegetal y los elementos antrópicos...
18
ARTÍCULO / ARTICLE VULNERABILIDAD DEL ECOSISTEMA COMO CONSTRUCCIÓN SOCIOCULTURAL. UNA APLICACIÓN PRÁCTICA ECOSYSTEM VULNERABILITY AS A SOCIOCULTURAL CONSTRUCTION. A PRACTICAL APPLICATION Ana Lid del Ángel Pérez 1 , Gabriel Díaz Padilla 1 , José AlfredoVillagómez-Cortés 3 , Carlos Mallen Rivera 2 , Rafael Alberto Guajardo Panes 1 RESUMEN El objetivo del presente trabajo fue desarrollar y validar una metodología que permita analizar el paisaje mediante la combinación de técnicas de evaluación puntuales en campo y de interpolación espacial, para identificar zonas con vulnerabilidad territorial específicas, categorizadas con índices de fragilidad. El método comprende cuatro etapas: juicio de expertos para definir variables que determinan la fragilidad en un paisaje; georreferenciación y levantamiento de información directa a través de la lectura del paisaje en puntos equidistantes; categorización del índice de fragilidad; y aplicación de técnicas de análisis espacial para la generación de un mapa continuo (raster o matricial) de la territorialidad del Índice de Fragilidad del Paisaje (IFP). Se calculó el índice de fragilidad en el transecto del área que va desde el Cofre de Perote hasta el litoral veracruzano del Golfo de México, se regionalizó como niveles de fragilidad paisajística con base en los percentiles de una distribución Weibull, y se cuantificó la fragilidad actual del paisaje para diversos usos del suelo. A partir del método cartográfico es factible realizar el monitoreo de un área geográfica a través del tiempo, y la detección de su posible vulnerabilidad. Esta herramienta puede ser útil para la gestión territorial y la del desarrollo rural. Palabras claves: Análisis espacial, ecosistemas, índice de fragilidad del paisaje, gestión territorial, paisaje, sostenibilidad. ABSTRACT The aim of this study was to develop and validate a methodological tool to analyze the landscape by combining specific in-field assessment techniques and spatial interpolation techniques, so as to identify specific areas with territorial vulnerability categorized by fragility indexes. The methodology comprises four stages: expert judgment to define the variables that determine fragility in a landscape; georeferencing and gathering information through direct landscape readings at equidistant points; categorization of the fragility indexes, application of spatial analysis techniques for the generation of a continuous (raster or matrix) map of the territoriality of the Landscape Fragility Index (LFI). Fragility indexes were calculated in the transect area from the Cofre de Perote to the coast of the state of Veracruz. Levels of landscape frailty were regionalized based on Weibull distribution percentiles, and current landscape fragility was assessed for different land uses. In conclusion, a methodology for generating cartographic LFIs was developed and validated which allows monitoring of a geographic area over time and the detection of potential vulnerability. This tool can be useful for land management and rural development. Key words: Ecosystems, landscape, landscape fragility index, spatial analysis, sustainability, territorial management. Fecha de recepción / date of receipt:10 de julio de 2012. Fecha de aceptación / date of acceptance: 11 de diciembre de 2012 1 CE. Cotaxtla. CIR-Golfo Centro-INIFAP. Correo-e: [email protected] 2 Centro Nacional en Investigación Disciplinaria en Conservación y Mejoramiento de Ecosistemas Forestales (CENID-COMEF). INIFAP 3 Facultad de Medicina Veterinaria y Zootecnia. Universidad Veracruzana.
Transcript of ARTÍCULO / ARTICLE VULNERABILIDAD DEL ECOSISTEMA … · vegetal y los elementos antrópicos...

ARTÍCULO / ARTICLE
VULNERABILIDAD DEL ECOSISTEMA COMO CONSTRUCCIÓN SOCIOCULTURAL. UNA APLICACIÓN PRÁCTICA
ECOSYSTEM VULNERABILITY AS A SOCIOCULTURAL CONSTRUCTION. A PRACTICAL APPLICATIONAna Lid del Ángel Pérez1, Gabriel Díaz Padilla1, José AlfredoVillagómez-Cortés3, Carlos Mallen Rivera2, Rafael Alberto Guajardo Panes1
RESUMEN
El objetivo del presente trabajo fue desarrollar y validar una metodología que permita analizar el paisaje mediante la combinación de técnicas de evaluación puntuales en campo y de interpolación espacial, para identificar zonas con vulnerabilidad territorial específicas, categorizadas con índices de fragilidad. El método comprende cuatro etapas: juicio de expertos para definir variables que determinan la fragilidad en un paisaje; georreferenciación y levantamiento de información directa a través de la lectura del paisaje en puntos equidistantes; categorización del índice de fragilidad; y aplicación de técnicas de análisis espacial para la generación de un mapa continuo (raster o matricial) de la territorialidad del Índice de Fragilidad del Paisaje (IFP). Se calculó el índice de fragilidad en el transecto del área que va desde el Cofre de Perote hasta el litoral veracruzano del Golfo de México, se regionalizó como niveles de fragilidad paisajística con base en los percentiles de una distribución Weibull, y se cuantificó la fragilidad actual del paisaje para diversos usos del suelo. A partir del método cartográfico es factible realizar el monitoreo de un área geográfica a través del tiempo, y la detección de su posible vulnerabilidad. Esta herramienta puede ser útil para la gestión territorial y la del desarrollo rural.
Palabras claves: Análisis espacial, ecosistemas, índice de fragilidad del paisaje, gestión territorial, paisaje, sostenibilidad.
ABSTRACT
The aim of this study was to develop and validate a methodological tool to analyze the landscape by combining specific in-field assessment techniques and spatial interpolation techniques, so as to identify specific areas with territorial vulnerability categorized by fragility indexes. The methodology comprises four stages: expert judgment to define the variables that determine fragility in a landscape; georeferencing and gathering information through direct landscape readings at equidistant points; categorization of the fragility indexes, application of spatial analysis techniques for the generation of a continuous (raster or matrix) map of the territoriality of the Landscape Fragility Index (LFI). Fragility indexes were calculated in the transect area from the Cofre de Perote to the coast of the state of Veracruz. Levels of landscape frailty were regionalized based on Weibull distribution percentiles, and current landscape fragility was assessed for different land uses. In conclusion, a methodology for generating cartographic LFIs was developed and validated which allows monitoring of a geographic area over time and the detection of potential vulnerability. This tool can be useful for land management and rural development.
Key words: Ecosystems, landscape, landscape fragility index, spatial analysis, sustainability, territorial management.
Fecha de recepción / date of receipt:10 de julio de 2012. Fecha de aceptación / date of acceptance: 11 de diciembre de 20121 CE. Cotaxtla. CIR-Golfo Centro-INIFAP. Correo-e: [email protected] Centro Nacional en Investigación Disciplinaria en Conservación y Mejoramiento de Ecosistemas Forestales (CENID-COMEF). INIFAP3 Facultad de Medicina Veterinaria y Zootecnia. Universidad Veracruzana.

Del Ángel et al., Vulnerabilidad del ecosistema como...
47
INTRODUCCIÓN
La disminución de la cantidad y calidad de los recursos naturales en México tiene como consecuencia un deterioro en la calidad de vida de la población. Este problema se agrava con la globalización de las relaciones multilaterales que fortalecen la demanda de bienes y servicios provenientes de los países que ya no disponen de muchos de esos recursos, pero que presionan a los que aún los tienen. Este es el caso de las masas forestales de Latinoamérica, llamadas pulmones del mundo y que la comunidad internacional tiende a considerar como bienes públicos globales. Es evidente, que la demanda creciente sobre la producción de bioenergía implica cambios potenciales en el uso del suelo en los frágiles ecosistemas tropicales, los cuales afectarán no solo a los recursos naturales, sino también a la obtención de alimentos, e impactarán en forma negativa las formas tradicionales de acceso a los mismos.
El panorama actual parece señalar que no es factible considerar el crecimiento local sin tomar en cuenta las fuerzas externas y las demandas de un mercado mundial, que impacta en las políticas de desarrollo internas. Lo anterior genera nuevas formas de subordinación, y aumenta la brecha entre los países pobres y los ricos, y como señala Gros (2003): la globalización en curso parece debilitar la capacidad de los estados para controlar sus espacios nacionales. Así, en el escenario latinoamericano, inmerso en una globalización hegemónica, es perceptible la magnificación de una valorización económica como criterio prevalente sobre los bienes y servicios ambientales, y un persistente olvido del vínculo entre naturaleza, cultura y sociedad. Por otra parte, si bien la delimitación territorial de las naciones avanza, la multilateralidad de las relaciones internacionales reconfigura nuevas formas de apropiación y expoliación de recursos naturales. Lo anterior es auspiciado por la disparidad de consumo entre las naciones, por lo que las políticas de desarrollo sustentable nacionales permanecerán como una quimera, si los países dueños de ellos no establecen políticas de desarrollo independientes, coherentes con su carácter multicultural y ecosistémico, de orden sustentable y participativo, lo cual no es del interés de las políticas de globalización.
Por otra parte, las consideraciones de valor económico en la contabilidad de los recursos naturales y las formas de aprovechamiento que se fundamentan en la producción por unidad de superficie favorecen los valores económicos y el crecimiento de las rentabilidades privadas, que a su vez, originan una serie de efectos, en demérito de los ecosistemas y de la sociedad en su conjunto, los cuales pagan la cuenta de tales impactos.
Actualmente, la problemática ambiental ha evidenciado que el desarrollo tecnológico y la globalización no han logrado equilibrar algunos aspectos prioritarios para la vida: la igualdad social, el bienestar y la conservación de la naturaleza. Los resultados de esta desigualdad se observan en una mayor fragilidad y menor resiliencia de los ecosistemas y los paisajes. Estas características
INTRODUCTION
The decrease of the quantity and quality of natural resources in Mexico results in a deterioration of the quality of life of the population. This problem is aggravated by the globalization of the multilateral relations that fortify the demand of goods and services originating from the countries that no longer have many of those resources, but which put pressure on the ones that still have them. This it is the case of the forest masses of Latin America, known as the world’s lungs, which the international community tends to consider as global public goods. It is evident that the growing demand on the production of bioenergy entails potential changes in the use of the soil in the fragile tropical ecosystems, which will affect not only the natural resources but also the obtainment of foods and will have a negative impact on the traditional forms of access to these.
The current scenario seems to indicate that local growth cannot be considered without taking into account the external forces and the demands of a world market, which impacts the domestic development policies. This generates new forms of subordination and enlarges the gap between the poor countries and the rich, and as Gros (2003) points out: the globalization under way appears to weaken the capacity of the states to control their national spaces. Thus, in the Latin-American setting, immersed in a hegemonic globalization, it can perceived an aggrandizement of economic valuation as the predominant criterion regarding the environmental goods and services, as well as a persistent oversight of the relationship between nature, culture, and society. On the other hand, despite the progress in the territorial delimitation of the nations, the multilaterality of the international relationships brings about new forms of appropriation and pillaging of natural resources. All of the above is promoted by the disparity of consumption among nations, for which reason the national sustainable development policies will remain a fantasy unless the countries that own the natural resources establish sustainable and participatory independent development policies that are coherent with their multicultural and ecosystemic nature, which are not of the interest of the globalization policies.
On the other hand, the considerations of economic value in the accounting of the natural resources and the forms of exploitation that are supported in the production by unit of surface favor the economic values and the growth of private profitabilities, which in turn originate a series of effects at the expense of the ecosystems and of society as a whole, both of which pay for these impacts.
At present, the environmental problems have shown that the technological development and the globalization have failed to balance certain aspects that are critical for life: social equality, welfare and the preservation of the nature. The results of this inequality are apparent in a greater fragility and lesser resilience of the ecosystems and the landscapes. These characteristics cannot be ignored in the territorial planning, in the accounting

Rev. Mex. Cien. For. Vol. 4 Núm. 16
48
no pueden ser ignoradas en la planeación territorial, en la contabilización de las posibilidades de uso o cambio de uso del suelo, ni en la generación de políticas de desarrollo sustentables. Por ello, como ruta viable para alcanzarlo, México debe considerar primordialmente la valoración de sus recursos naturales, pero con fundamento no solo en el valor económico o ecológico, sino en ambos, en función de su valor biocultural, entendido este como un vínculo complejo entre cultura y ambiente, pues no es posible ignorar el hecho de que su uso por parte de los grupos humanos que habitan y aprovechan los ecosistemas ha permitido la acumulación de conocimientos sobre la biología de las especies y los procesos ecológicos locales (Reyes-García y Martí, 2007). Una de las mejores formas de entender y considerar las posibilidades de intervención y gestión territorial de un área o paisaje es a través de su morfología, y tomar en cuenta que sus componentes son básicamente cuatro: el relieve, el agua, la cubierta vegetal y los elementos antrópicos (Muñóz- Pedreros, 2004).
En el contexto geográfico, un paisaje es una unidad espacial de fenómenos interdependientes (Sauer, 1925; Troll, 2010); el concepto denota la importancia de la unión de los elementos físicos y culturales, ya que un sitio, en su plena connotación, es una expresión cualitativa de lugar en términos de área física como la suma de todos los recursos que el hombre tiene a su disposición, los cuales puede desarrollar, ignorar, o sustraer mediante su uso o explotación. El paisaje es sometido a la transformación humana, y esta se constituye en su más importante factor morfológico, por lo que como señaló Delgado (2010) es precisamente en este aspecto en el que se requiere efectuar trabajo de campo para capturar lo esencial de su composición.
Se aplica el concepto de paisaje cultural de Garcés (2009) que representa una obra conjunta de hombre y naturaleza e ilustra la relación intensa y vital de la sociedad que modifica su ambiente con fines productivos; es decir, un conjunto integrado, superpuesto y acumulado de capas antrópicas de ocupación sobre paisajes naturales; compuesto por formas, estructuras y unidades, y sujeto a desarrollos y cambios, en los que se verifican las complejas interdependencias entre ambiente natural y cultura, y que, con el tiempo, configura una construcción cultural del paisaje.
El presente trabajo aborda la fragilidad del paisaje desde una perspectiva mixta de análisis, esto es mediante la categorización de variables cuantitativas y cualitativas de acuerdo con el grado con que afectan la fragilidad del paisaje, y el empleo de Sistemas de Información Geográfica (SIG), los cuales se han convertido en una herramienta importante para los estudios del medio ambiente y del paisaje. Se efectúa el inventario y monitoreo del paisaje, a partir de imágenes de sensores remotos (fotografías aéreas, imágenes de radar e imágenes de satélite), las que se analizan, procesan y organizan mediante SIG, en los cuales los análisis espaciales (dimensión fractal, conectividad y vecindad entre otros) y temporales (análisis de series de tiempo) aplicados a las imágenes de sensores remotos y las bases de
of the possibilities of use or change of use of the soil, or in the generation of sustainable development policies. For this reason, as a viable route to attain such policies, Mexico should consider first and foremost the appraisal of its natural resources, based not only on the economic or ecological value, but on both, in terms of their biocultural value, understood as a complex link between culture and environment, since it cannot be ignored that its use by the human groups that inhabit and exploit the ecosystems has allowed the accumulation of knowledge of the biology of the local species and ecological processes (Reyes-García and Martí, 2007). One of the best ways to understand and to consider the intervention possibilities and the territorial management of an area or landscape is through its morphology, taking into account its components, which are basically four: the relief, the water, the vegetable cover, and the anthropic elements (Muñóz- Pedreros, 2004).
In the geographical context, a landscape is a spatial unit of interdependent phenomena (Sauer, 1925; Troll, 2010); the concept indicates the importance of the union of the cultural and physical elements, since a site, in its full connotation, is a qualitative expression of place, in terms of physical area, understood as the sum of all the resources that man has at his service, which he can develop, ignore, or extract by using or exploiting it. The landscape is subjected to human transformation, and this is its most important morphological factor; therefore, as Delgado (2010) pointed out, it is precisely this aspect which requires field work in order to capture the essential elements of its composition.
We apply here the concept of cultural landscape of Garcés (2009), which represents a joint work of man and nature and illustrates the vital and intense relationship between society and the natural environment that is modified by it for production purposes; that is to say, an integrated assembly of superimposed, accumulated anthropic layers of occupation on natural landscapes, consisting of forms, structures and units; subjected to developments and changes in which the complex interdependencies between the natural environment and culture are verified, and which, in time, forms a cultural construction of the landscape.
The present paper examines the fragility of the landscape from a mixed perspective of analysis, i.e., by means of the categorization of qualitative and quantitative variables according to the degree with which they affect the fragility of the landscape, as well as the use of Geographical Information Systems (GIS), which have become an important tool for the studies on the environment and of the landscape. The inventory and monitoring of the landscape are carried out based on images of remote sensors (air photographs, and radar and satellite images) that are analyzed, processed and organized by means of GIS, whose spatial (fractal dimension, connectivity and proximity, among others) and temporal (time series) analyses applied to the images of remote sensors and spatial databases (maps) provide a powerful tool for the study of the evolutionary behavior of the landscape (Zonneveld, 1972). The

Del Ángel et al., Vulnerabilidad del ecosistema como...
49
management of the data obtained in the field is incorporated to a vectorial and raster GIS, which allows the appraisal, cartographic representation and expression of the median values pertaining to the units. The use of GIS makes it possible to carry out the geospatial analysis of the information in a quick and simple way, and thus allows the viewing of territorial patterns of behavior of the variable(s) of interest, in this case the fragility of a landscape, which increases its vulnerability. Therefore, the objective of the present paper is to develop and validate a simple, practical methodological tool for analyzing the landscape, through the combination of a series of precise evaluation techniques applied infield and spatial interpolation techniques for generating vulnerability areas with a characteristic territoriality categorized according to their fragility index.
MATERIAL AND METHODS
The methodology comprises four phases: I) creation of an expert judgment panel to define variables determining the fragility of a landscape; II) gathering of information and georeferencing by direct landscape readings at equidistant points; III) categorization of the fragility index; and IV) application of spatial analysis techniques in order to generate a continuous (raster or dot-matrix) map of the territoriality of the Landscape Fragility Index (LFI).
I) Judgment by experts and generation of algorithms to calculate the Landscape Fragility Index (LFI)
A group dynamic was established in an interdisciplinary expert panel discussion. This technique has been applied in various types of studies that require setting classification parameters and assessment indicators for both disciplinary and interdisciplinary research (Barlow and Dietz, 1998; Pérez, 2000; Towers, 2008). The experts considered for inclusion were researchers or educators with a background in geographical information systems, forest engineering, agronomy, soils, agroecosystems, sociology, economy and statistics, and with experience in dealing with issues related to sustainable development or the preservation of the environment. The intention was to obtain an approximation to the use of the soil in a specific work area through the determination of a series of variables that allow a more accurate definition of landscape fragility from the point of view of each of various disciplines, which also integrate different dimensions of analysis, and through the use of scales of contribution to the fragility for each one of the selected variables.
At the core of the discussion was the determination of key characteristics by means of variables that define a fragile landscape or ecosystem, introducing at the same time the various uses of the soil, with indicators of environmental fragility through the combination of ecosystemic and human factors as a measure of the environmental traces (Torrealba, 2011). The indicators included descriptors whose statistical analysis generated various indices, which in
datos espaciales (mapas) brindan una poderosa herramienta para el estudio del comportamiento evolutivo del paisaje (Zonneveld, 1972). La gestión de los datos obtenidos en campo se incorpora a un SIG vectorial y raster, el cual permite la valoración, la representación cartográfica y la expresión de los valores medios correspondientes a las unidades. La utilización de los SIG hace posible de una manera rápida y sencilla el análisis geoespacial de la información, y con ello la visualización de patrones territoriales del comportamiento de la(s) variable(s) de interés, en este caso la fragilidad de un paisaje, que al mismo tiempo lo hace más vulnerable. Por tanto, el objetivo del presente trabajo fue desarrollar y validar una herramienta metodológica práctica y sencilla para analizar el paisaje, mediante la combinación de una serie de técnicas de evaluación puntuales realizadas en campo y técnicas de interpolación espacial para generar zonas de vulnerabilidad con territorialidad característica y categorizadas en índices de fragilidad.
MATERIALES Y MÉTODOS
La metodología comprende cuatro etapas: I) formación de una mesa de juicio de expertos para definir variables que determinan la fragilidad en un paisaje; II) levantamiento de información y georreferenciación de manera directa, a través de un tipo de lectura del paisaje de puntos equidistantes; III) categorización del índice de fragilidad; y IV) aplicación de técnicas de análisis espacial para la generación de un mapa continuo (raster o matricial) de la territorialidad del Índice de Fragilidad del Paisaje (IFP).
I) Juicio de expertos y generación de algoritmos de cálculo del Índice de Fragilidad del Paisaje (IFP)
Se estableció una dinámica de grupo en una mesa de discusión interdisciplinaria de expertos. Esta técnica se ha aplicado en diversos tipos de estudios que requieren fijar parámetros de clasificación e indicadores de evaluación, tanto en investigaciones disciplinarias como interdisciplinarias (Barlow y Dietz, 1998; Pérez, 2000; Torres, 2008). El principio de inclusión consideró ser investigadores o académicos con experiencia y formación en sistemas de información geográficos, ingeniería forestal, agronomía, suelos, agroecosistemas, sociología, economía y estadística vinculados con temáticas de desarrollo sostenible, ambiente o conservación. La intención fue obtener una aproximación al uso del suelo en un área de trabajo determinada, a través de la definición de una serie de variables que permitan definir, en forma más precisa, la fragilidad del paisaje desde el punto de vista de cada disciplina, que además integran diferentes dimensiones de análisis, así como las escalas de aporte a la fragilidad para cada una de las variables seleccionadas.
El eje central de discusión fue la determinación de características clave a través de variables que definen un paisaje o ecosistema frágil, que al mismo tiempo presente los diversos usos del suelo con indicadores de fragilidad ambiental mediante la
Rev. Mex. Cien. For. Vol. 4 Núm. 16
50
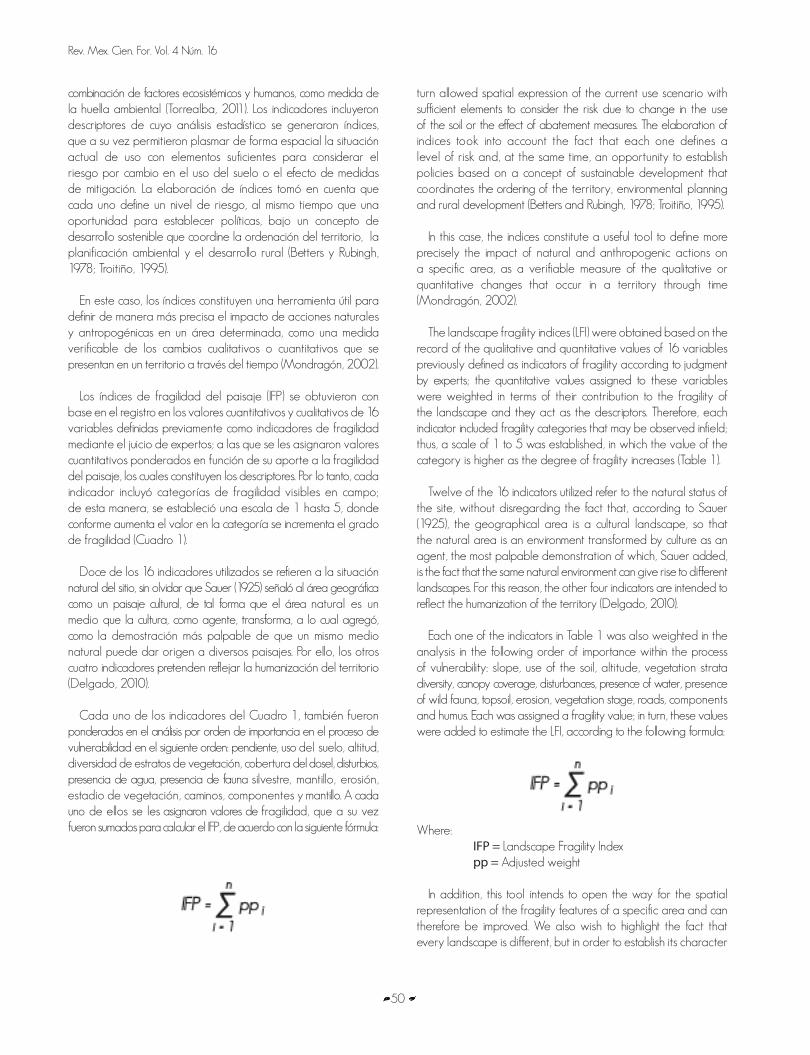
combinación de factores ecosistémicos y humanos, como medida de la huella ambiental (Torrealba, 2011). Los indicadores incluyeron descriptores de cuyo análisis estadístico se generaron índices, que a su vez permitieron plasmar de forma espacial la situación actual de uso con elementos suficientes para considerar el riesgo por cambio en el uso del suelo o el efecto de medidas de mitigación. La elaboración de índices tomó en cuenta que cada uno define un nivel de riesgo, al mismo tiempo que una oportunidad para establecer políticas, bajo un concepto de desarrollo sostenible que coordine la ordenación del territorio, la planificación ambiental y el desarrollo rural (Betters y Rubingh, 1978; Troitiño, 1995).
En este caso, los índices constituyen una herramienta útil para definir de manera más precisa el impacto de acciones naturales y antropogénicas en un área determinada, como una medida verificable de los cambios cualitativos o cuantitativos que se presentan en un territorio a través del tiempo (Mondragón, 2002).
Los índices de fragilidad del paisaje (IFP) se obtuvieron con base en el registro en los valores cuantitativos y cualitativos de 16 variables definidas previamente como indicadores de fragilidad mediante el juicio de expertos; a las que se les asignaron valores cuantitativos ponderados en función de su aporte a la fragilidad del paisaje, los cuales constituyen los descriptores. Por lo tanto, cada indicador incluyó categorías de fragilidad visibles en campo; de esta manera, se estableció una escala de 1 hasta 5, donde conforme aumenta el valor en la categoría se incrementa el grado de fragilidad (Cuadro 1).
Doce de los 16 indicadores utilizados se refieren a la situación natural del sitio, sin olvidar que Sauer (1925) señaló al área geográfica como un paisaje cultural, de tal forma que el área natural es un medio que la cultura, como agente, transforma, a lo cual agregó, como la demostración más palpable de que un mismo medio natural puede dar origen a diversos paisajes. Por ello, los otros cuatro indicadores pretenden reflejar la humanización del territorio (Delgado, 2010).
Cada uno de los indicadores del Cuadro 1, también fueron ponderados en el análisis por orden de importancia en el proceso de vulnerabilidad en el siguiente orden: pendiente, uso del suelo, altitud, diversidad de estratos de vegetación, cobertura del dosel, disturbios, presencia de agua, presencia de fauna silvestre, mantillo, erosión, estadio de vegetación, caminos, componentes y mantillo. A cada uno de ellos se les asignaron valores de fragilidad, que a su vez fueron sumados para calcular el IFP, de acuerdo con la siguiente fórmula:
turn allowed spatial expression of the current use scenario with sufficient elements to consider the risk due to change in the use of the soil or the effect of abatement measures. The elaboration of indices took into account the fact that each one defines a level of risk and, at the same time, an opportunity to establish policies based on a concept of sustainable development that coordinates the ordering of the territory, environmental planning and rural development (Betters and Rubingh, 1978; Troitiño, 1995).
In this case, the indices constitute a useful tool to define more precisely the impact of natural and anthropogenic actions on a specific area, as a verifiable measure of the qualitative or quantitative changes that occur in a territory through time (Mondragón, 2002).
The landscape fragility indices (LFI) were obtained based on the record of the qualitative and quantitative values of 16 variables previously defined as indicators of fragility according to judgment by experts; the quantitative values assigned to these variables were weighted in terms of their contribution to the fragility of the landscape and they act as the descriptors. Therefore, each indicator included fragility categories that may be observed infield; thus, a scale of 1 to 5 was established, in which the value of the category is higher as the degree of fragility increases (Table 1).
Twelve of the 16 indicators utilized refer to the natural status of the site, without disregarding the fact that, according to Sauer (1925), the geographical area is a cultural landscape, so that the natural area is an environment transformed by culture as an agent, the most palpable demonstration of which, Sauer added, is the fact that the same natural environment can give rise to different landscapes. For this reason, the other four indicators are intended to reflect the humanization of the territory (Delgado, 2010).
Each one of the indicators in Table 1 was also weighted in the analysis in the following order of importance within the process of vulnerability: slope, use of the soil, altitude, vegetation strata diversity, canopy coverage, disturbances, presence of water, presence of wild fauna, topsoil, erosion, vegetation stage, roads, components and humus. Each was assigned a fragility value; in turn, these values were added to estimate the LFI, according to the following formula:
Where: IFP = Landscape Fragility Indexpp = Adjusted weight
In addition, this tool intends to open the way for the spatial representation of the fragility features of a specific area and can therefore be improved. We also wish to highlight the fact that every landscape is different, but in order to establish its character

Del Ángel et al., Vulnerabilidad del ecosistema como...
51
Donde: IFP = Índice de fragilidad del paisajepp = Peso ponderado
Cabe agregar que esta herramienta pretende abrir el camino para la representación espacial de las características de fragilidad de un área determinada, y por tanto es factible de mejorar. Se destaca también el hecho de que cada paisaje es diferente, pero con el propósito de establecer su carácter como un sistema interrelacionado con sucesos de orden natural y cultural, se hizo necesario seleccionar algunos rasgos sobresalientes y relacionados.
II) Georreferenciación y lectura de paisaje
Se determinó una zona de trabajo para aplicar la metodología y establecer los puntos de georreferenciación y estaciones de muestreo. Para lo anterior, se recomienda efectuar el trazo de una malla sistemática y equidistante de puntos sobre una imagen del área de trabajo en la cual se dispersaron estos de manera espacial. El objetivo es diseñar un transecto de la zona, que de acuerdo con Garitacelaya et al. (2006) es una banda de muestreo diseñada y dimensionada en función de cada masa, sobre la que se procede a la toma de los datos que se han definido previamente. Al igual que otros métodos de inventario, se basa en el análisis detallado de una determinada superficie, considerada representativa de una zona más amplia a la que se extrapolan los datos. Algunas referencias sobre el diseño de transectos (Eberhardt, 1978; Gregoire y Valentine, 2003; Grosenbaugh, 1958), así como de su utilización en estudios del medio natural como método de toma de datos de campo destacan la estimación de la cobertura de especies de carácter arbustivo o la abundancia y fundamentalmente de fauna, ya que el método se ajusta perfectamente a su movilidad.
Dentro del entorno de sistemas de información geográfica y estudios de terreno existe un método conocido como mapeo de zonas centrales, mismo que se utilizó para efectuar la lectura de paisaje, la cual define un área principal o de influencia, o actividad para un organismo, objeto, o recurso (Bolstad, 2005). Normalmente involucra la identificación de características del área a partir de un conjunto de puntos, los cuales pueden ser usados para definir un polígono o varios, mediante técnicas espaciales, y es muy usada para realizar análisis de patrones de la actividad humana o conocimiento de organismos vivientes en un área geográfica.
as a system interrelated with natural and cultural events, it was necessary to select certain salient related characteristics.
II) Georeferencing and landscape reading
A work area was determined for the application of the methodology and for establishing the points for georeferencing and the sampling stations. For this purpose, it is recommended to draw on an image of the work area a systematic, equidistant grid showing the spatial distribution of these points and stations. The objective is to design a transect of the area, which, according to Garitacelaya et al. (2006) is a sampling band designed and measured in terms of each mass, about which previously defined data are collected. Just like other inventory methods, it is based on the detailed analysis of a particular surface considered to be representative of a larger area to which the data are extrapolated. Some references on transect design (Eberhardt, 1978; Gregoire and Valentine, 2003; Grosenbaugh, 1958), as well as on its utilization in studies of the natural environment as an infield data collection method, highlight the estimation of the abundance or coverage of bushy species, and primarily of the fauna, since the method adjusts perfectly to its mobility.
Within the field of geographical information systems and studies of land there is a method known as central zone mapping, which was utilized to perform the reading of the landscape, whereby a main area or area of influence or activity for an organism, object, or resource is defined (Bolstad, 2005). Normally it involves the identification of characteristics of the area based on an array of points that can be used to define one or several polygonal zones by means of spatial techniques, and is widely used for carrying out analyses of human activity patterns or knowledge of living organisms in a given geographical area.
Each sampling station considered a diameter of 25 meters; in these stations, information regarding the indicators of the landscape’s fragility index was collected in each of the cardinal directions from the center (Figure 1). The surface of the sampling point was sampled from the center to the periphery of the studied area; therefore, each sampling station comprised a surface of approximately 1 963 m2. The systematic grid for the in-field data collection was drawn on a Google image (2010) and consisted of 147 points evenly separated by a distance of 2.5 kilometers from which significant information for the determination of the LFI was obtained. After the infield recording of the values, a spreadsheet with the LFI values was devised.
III) Categorization of the landscape fragility index (LFI)
Given the changeability or the dynamics of the variables, categories or boundaries between classes were established. As a tool to support this decision, the goodness of fit of the data with theoretical distributions was assessed, thereby simplifying the data. In this way, odds were analyzed, percentiles of interest were defined, and

Rev. Mex. Cien. For. Vol. 4 Núm. 16
52
Cuadro 1. Indicadores y descriptores para el análisis de paisaje. Table 1. Indicators and descriptors for landscape analysis.
Indicadores Descriptores Indicadores Descriptores
Altitud (msnm)
(>altitud>fragilidad)
1) < 500
2) 501- 1 000
3) 1 001- 1 500
4) 1 501- 2 000
5) < 2 000
Nivel de Humanización 1:
Uso del suelo
1) Forestal
2) Agrícola
3) Ganadero
4) Urbano
Pendiente (%)
(>pendiente>fragilidad)
1) < 15
2) 16 - 30
3) 31 – 45
4) 46 - 60
5) 61 – 75
6) > 76
Nivel de Humanización 2:
Caminos
1) Veredas
2) Brechas
3) Carretera
Erosión
(>fragilidad)
Se registra presencia
1) Baja
2) Moderada
3) Alta
Nivel de Humanización 3:
Construcciones
1) Material local
2) Material concreto
Pedregosidad (%)
1) <10, baja
2) 11-20, moderada
3) 21-30, alta
4) >30, grave
Nivel de Humanización
4: Disturbios> fragilidad
(drenajes, canales, basureros,
vertederos)
1) Poca, 1 vez
2) Moderada, de 2 a 3
3) Alta, mas de 4
Cobertura dosel (%)
(<cobertura>fragilidad)
1) > 86
2) 71 – 85
3) 51 – 70
4) 36 - 50
5) < 35
Presencia de agua1) Con línea verde
2) Sin línea verde
Diversidad de estratos de
vegetación
(<número de
estratos>fragilidad)
1) Dosel
2) Mesobosque
3) Sotobosque
Presencia de fauna silvestre1) Presencia
2) Ausencia
Clase de exposición1) Umbría (norte)
2) Solana (sur)Mantillo, cm
1) >8 .1
2) 6.1-8
3) 4.1-6
4) 2.1-4
5) <2
Componentes La inclusión de componentes
depende del paisaje
Estadio de vegetación 1) Maduro
2) Reiniciación
3) Claros
4) Exclusión
5) Nada

Del Ángel et al., Vulnerabilidad del ecosistema como...
53
La estación de muestreo consideró un diámetro de 25 metros, en ellas se recabó información hacia cada uno de los puntos cardinales de los indicadores correspondientes al índice de fragilidad del paisaje (Figura 1). La superficie del punto de muestreo fue del centro del punto a la periferia del área considerada, por lo que cada estación de muestreo se conformó de una superficie aproximada de 1 963 m2. La malla sistemática para el levantamiento de la información en campo se trazó sobre una imagen de Google (2010) y consistió en 147 puntos separados a una distancia de 2.5 kilómetros en los cuales se obtuvo información de importancia para la calificación del IFP. Después del registro de los valores en campo se elaboró una hoja de cálculo con los valores de IFP.
III) Categorización del índice de fragilidad del paisaje (IFP)
Dada la variabilidad o dinámica de las variables, se establecieron categorías o límites entre clases. Como una herramienta de apoyo para esta decisión se evaluó la bondad de ajuste de los datos con distribuciones teóricas, con lo que se simplificaron los datos. De esta forma se analizaron probabilidades, se definieron percentiles de interés, y se determinaron los intervalos de clase necesarios para una correcta categorización de los valores. La categorización del IFP permitió evaluar la bondad de ajuste con respecto a varias distribuciones: normal, gama, Weibull y log-normal. Para valorar la bondad de ajuste se aplicó la prueba de Anderson Darling, recomendada por Díaz (2009) como una prueba potente para este fin. Su cálculo se realizó con Minitab versión 15 (2009). Entre más alto es el valor A2 Anderson-Darling, la distribución presenta un menor ajuste de los datos (Cuadro 2).
the class intervals required for a correct categorization of the values were determined. The categorization of the LFI allowed assessment of the goodness of fit with regard to several distributions: normal, range, Weibull and log-normal. In order to assess the goodness of fit, the Anderson Darling test, recommended as a powerful test for this purpose by Díaz (2009), was applied. Its calculation was carried out using the Minitab version 15 software (2009). The higher the Anderson-Darling A2 value, the lesser adjustment of the data occurs in the distribution (Table 2).
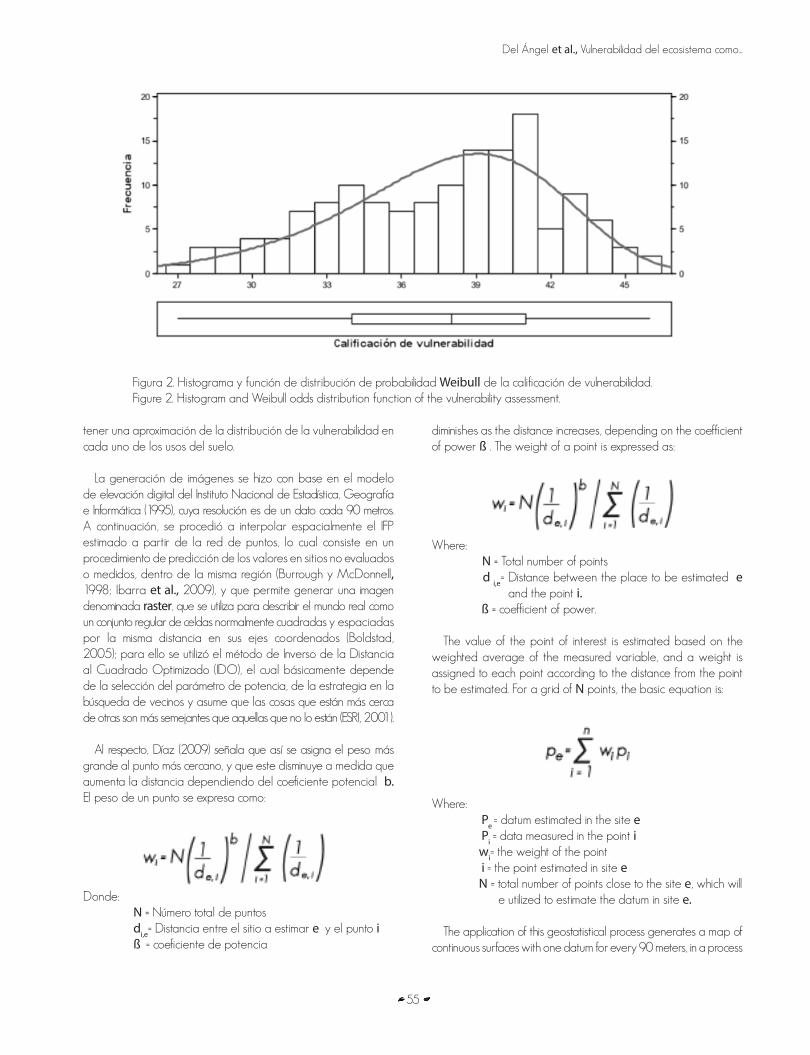
The assymetry was negative (-0.34), which is indicative of a higher concentration toward the higher values, and the dispersion of the data or frequencies was moderately slanted to the right (Figure 2). Although in some cases position measures (deciles, quartiles, or percentiles) and a normal distribution are assumed, the goodness of fit of this and other distributions must be assessed; subsequently, based on the values of the distribution parameters, the required position measures must be determined.
Stratification of the various LFIs was based on percentiles 20, 40, 60 and 80. Thus, for example, percentile 20 corresponds to the distribution in which 20% of the data are below that percentage, and consequently 80% are above.
When the goodness of fit was assessed by means of the Anderson Darling test (Díaz, 2009), the critical A2 values for the normal, log-normal and Weibull distributions were 1,48, 2,138 and 0,877, respectively. In this case, the value of p for the normal and log-normal distributions was less than 0.005, while for the Weibull distribution it was 0.024; thus, for a percentage of error below
Figura 1. Representación esquemática de la distribución espacial de la red de puntos muestreados en la Cuenca Coatepec-La Antigua. Veracruz (2009).
Figure 1. Schematic representation of the spatial distribution of the grid of points sampled in the Coatepec-La Antigua Basin. Veracruz (2009).

Rev. Mex. Cien. For. Vol. 4 Núm. 16
54
Cuadro 2. Estadísticas descriptivas de la calificación de fragilidad (IFP).
Table 2. Descriptive statistics of the fragility rate (LFI) determination.
Estadísticas descriptivas
Media 37.57 Mínimo 27.00
Desviación estándar 4.45 Q - 20 34.02
Varianza 19.84 Q - 40 36.95
Sesgo (asimetría) -0.34 Q - 60 39.16
Curtosis (apuntamiento) -0.68 Q - 80 41.42
N 144 Máximo 46.00
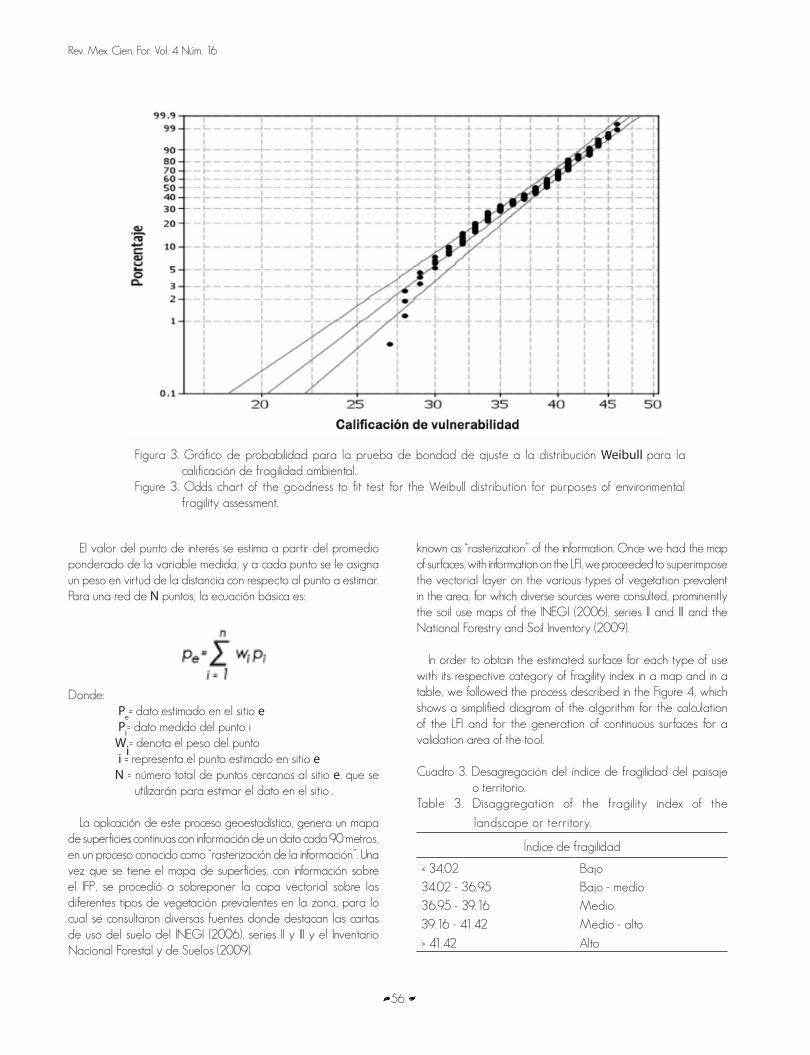
5%, the decision was made to reject the null hypothesis that the data were adjusted to the normal and log-normal distributions. When assuming that the data are better adjusted to a Weibull distribution, the descriptive statistics for the vulnerability index can be obtained, and the percentiles for the said distribution can be calculated (Figure 3).
The criteria for the categorization of the fragility index disaggregation levels were based on the Weibull distribution quantiles, as shown on Table 3.
IV) Application of spatial analysis techniques for the generation of a continuous (raster or dot-matrix) map of the territoriality of the LFI
With the idea of quantifying the LFI by use of soil, the estimated LFI and the use of the soil in the area (Use of the soil of the National Forestry Inventory (Conafor-Semarnat, 2009)) were superimposed on the GIS in order to have an approximation of the distribution of the vulnerability for each of the uses of the soil.
The images were generated based on the digital elevation model of the National Institute of Statistics, Geography and Information Technology (1995), in which the resolution is one datum for every 90 meters. Subsequently, the estimated LFI was spatially interpolated from the grid of points, which is a procedure for the prediction of the values in unassessed or unmeasured sites
La asimetría fue negativa, (-0.34), lo que indicó una mayor concentración de valores hacia los más altos, y la dispersión de los datos o frecuencias estuvo moderadamente sesgada a la derecha (Figura 2). Si bien en algunos de los casos se utilizan las medidas de posición (deciles, cuartiles o percentiles) y se asume una distribución normal, es necesario valorar la bondad de ajuste de esta y otras distribuciones y, posteriormente, con base en los valores de los parámetros de la distribución delimitar los requeridos de las medidas de posición.
La estratificación de los diferentes IFP se hizo a partir de los percentiles 20, 40, 60 y 80. Así, por ejemplo, el percentil 20 corresponde a la distribución en la cual 20 %, de los datos son menores a ese porcentaje y, en consecuencia, 80% de ellos están por encima de ese valor.
Al considerar la bondad de ajuste con la prueba de Anderson Darling (Díaz, 2009), los valores críticos A2 para las distribuciones normal, lognormal y Weibull fueron 1.48, 2.138 y 0.877, respectivamente. En este caso, el valor de p para la distribución normal y lognormal fue menor a 0.005, en tanto que para la distribución Weibull fue de 0.024, por lo que se decidió, con un porcentaje de error menor a 5%, rechazar la hipótesis nula de que los datos se ajustaban a la distribución normal y lognormal. Al asumir que los datos se ajustan mejor a una distribución Weibull, se pueden obtener los estadísticos descriptivos para el índice del factor de vulnerabilidad y calcular los percentiles correspondientes a dicha distribución (Figura 3).
within the same region (Burrough and McDonnell, 1998; Ibarra et al., 2009), and which allows the generation of an image known as raster, utilized to describe the real world as a regular set of normally square cells spaced at an equal distance on their coordinate axes (Boldstad, 2005). For this purpose the optimized inverse distance square (IDS) method was utilized; this method basically depends on the selection of the parameter of power, on the strategy used in the search for neighbors and assumes that things that are nearer others resemble these more than those that are further away (ESRI, 2001).
In this regard, Díaz (2009) points out that the largest weight is therefore assigned to the nearest point, and that this weight
Con base en los cuantiles de la distribución Weibull se tomaron los criterios para categorizar los niveles de desagregación del índice de fragilidad, los cuales se muestran en el Cuadro 3.
IV) Aplicación de técnicas de análisis espacial para la generación de un mapa continuo (raster o matricial) de la territorialidad del IFP
Con la idea de cuantificar el IFP por uso de suelo se sobrepuso en el SIG, el IFP calculado y el uso del suelo en la zona (Uso del suelo del Inventario Nacional Forestal (Conafor-Semarnat, 2009), para
Del Ángel et al., Vulnerabilidad del ecosistema como...
55
tener una aproximación de la distribución de la vulnerabilidad en cada uno de los usos del suelo.
La generación de imágenes se hizo con base en el modelo de elevación digital del Instituto Nacional de Estadística, Geografía e Informática (1995), cuya resolución es de un dato cada 90 metros. A continuación, se procedió a interpolar espacialmente el IFP estimado a partir de la red de puntos, lo cual consiste en un procedimiento de predicción de los valores en sitios no evaluados o medidos, dentro de la misma región (Burrough y McDonnell, 1998; Ibarra et al., 2009), y que permite generar una imagen denominada raster, que se utiliza para describir el mundo real como un conjunto regular de celdas normalmente cuadradas y espaciadas por la misma distancia en sus ejes coordenados (Boldstad, 2005); para ello se utilizó el método de Inverso de la Distancia al Cuadrado Optimizado (IDO), el cual básicamente depende de la selección del parámetro de potencia, de la estrategia en la búsqueda de vecinos y asume que las cosas que están más cerca de otras son más semejantes que aquellas que no lo están (ESRI, 2001).
Al respecto, Díaz (2009) señala que así se asigna el peso más grande al punto más cercano, y que este disminuye a medida que aumenta la distancia dependiendo del coeficiente potencial b. El peso de un punto se expresa como:
Donde: N = Número total de puntos di,e= Distancia entre el sitio a estimar e y el punto i ß = coeficiente de potencia
diminishes as the distance increases, depending on the coefficient of power ß . The weight of a point is expressed as:
Where: N = Total number of points d i,e= Distance between the place to be estimated e and the point i. ß = coefficient of power.
The value of the point of interest is estimated based on the weighted average of the measured variable, and a weight is assigned to each point according to the distance from the point to be estimated. For a grid of N points, the basic equation is:
Where: Pe = datum estimated in the site e Pi = data measured in the point iwi= the weight of the point i = the point estimated in site eN = total number of points close to the site e, which will e utilized to estimate the datum in site e.
The application of this geostatistical process generates a map of continuous surfaces with one datum for every 90 meters, in a process
Figura 2. Histograma y función de distribución de probabilidad Weibull de la calificación de vulnerabilidad. Figure 2. Histogram and Weibull odds distribution function of the vulnerability assessment.
Rev. Mex. Cien. For. Vol. 4 Núm. 16
56
El valor del punto de interés se estima a partir del promedio ponderado de la variable medida, y a cada punto se le asigna un peso en virtud de la distancia con respecto al punto a estimar. Para una red de N puntos, la ecuación básica es:
Donde: Pe= dato estimado en el sitio e
Pi= dato medido del punto i
Wi= denota el peso del punto i = representa el punto estimado en sitio e N = número total de puntos cercanos al sitio e, que se utilizarán para estimar el dato en el sitio .
La aplicación de este proceso geoestadístico, genera un mapa de superficies continuas con información de un dato cada 90 metros, en un proceso conocido como “rasterización de la información”. Una vez que se tiene el mapa de superficies, con información sobre el IFP, se procedió a sobreponer la capa vectorial sobre los diferentes tipos de vegetación prevalentes en la zona, para lo cual se consultaron diversas fuentes donde destacan las cartas de uso del suelo del INEGI (2006), series II y III y el Inventario Nacional Forestal y de Suelos (2009).
known as “rasterization” of the information. Once we had the map of surfaces, with information on the LFI, we proceeded to superimpose the vectorial layer on the various types of vegetation prevalent in the area, for which diverse sources were consulted, prominently the soil use maps of the INEGI (2006), series II and III and the National Forestry and Soil Inventory (2009).
In order to obtain the estimated surface for each type of use with its respective category of fragility index in a map and in a table, we followed the process described in the Figure 4, which shows a simplified diagram of the algorithm for the calculation of the LFI and for the generation of continuous surfaces for a validation area of the tool.
Cuadro 3. Desagregación del índice de fragilidad del paisaje o territorio.
Table 3. Disaggregation of the fragility index of the
landscape or territory.
Índice de fragilidad
< 34.02 Bajo34.02 - 36.95 Bajo - medio
36.95 - 39.16 Medio
39.16 - 41.42 Medio - alto
> 41.42 Alto
Figura 3. Gráfico de probabilidad para la prueba de bondad de ajuste a la distribución Weibull para la calificación de fragilidad ambiental.
Figure 3. Odds chart of the goodness to fit test for the Weibull distribution for purposes of environmental fragility assessment.

Del Ángel et al., Vulnerabilidad del ecosistema como...
57
Con la finalidad de obtener la superficie estimada para cada tipo de uso con su respectiva categoría del índice de fragilidad en un mapa y en formato tabular se siguió el proceso descrito en la Figura 4 en la que se presenta un diagrama simplificado del algoritmo de cálculo del IFP y de la generación de superficies continuas para una zona de validación de la herramienta.
RESULTADOS Y DISCUSIÓN
La Figura 5 muestra la zona de estudio seleccionada para validar la metodología, que se localiza entre 97°07’34” y 96°19’23” de longitud oeste y 19°30’50” y 19°16’44” de latitud norte del ecuador, y comprende al transecto altitudinal de Cofre del Perote a las cercanías de la ciudad de Veracruz. Asimismo, se observa la malla sistémica que señala la ubicación del transecto altitudinal, mismo que varía de este a oeste, y la dispersión espacial de los puntos de muestreo de campo (círculos), los cuales captaron prácticamente toda la variabilidad del paisaje.
Se definió la variación altitudinal de la zona de validación mediante estratos cada 500 metros sobre el nivel medio del mar, (Figura 5), en ella se aprecia que va del noroeste al suroeste, con su punto mínimo altitudinal en el municipio de La Antigua en la línea costera del Golfo de México, y el máximo en el Cofre de Perote. La delimitación espacial de zonas hipsométricas proporcionó información sobre la relación altura sobre el nivel medio del mar y el área que esta ocupa respecto a su distribución en el terreno, lo que permitió cuantificar y cualificar el relieve del terreno, diferenciado por colores en la Figura 5.
Uso del suelo
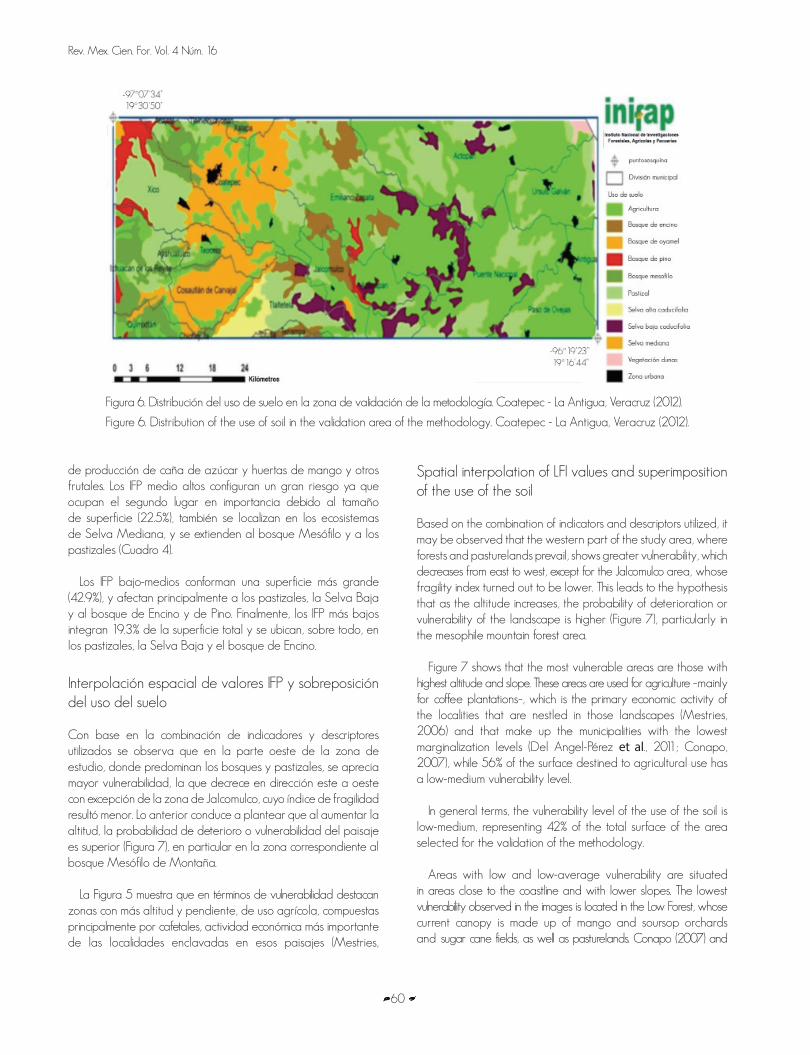
La Figura 6, muestra la delimitación espacial de los diferentes tipos de vegetación presente en la zona. Sobresale la superficie agrícola; sin embargo, habría que señalar que gran parte corresponde a cultivo de café bajo sombra diversa o simplificada, pero para fines de clasificación se consideró como agrícola. Esta forma de uso del suelo se inserta en áreas del bosque mesófilo de montaña, disturbados desde la instalación de las huertas de café a mediados del siglo XVIII (Guadarrama, 2008), así como cultivos hortofrutícolas y recientemente caracterizadas por una elevada densidad de población, que denota el cambio de uso del suelo y la presión sobre el paisaje, principalmente por deforestación (Del Angel-Pérez et al., 2011).
Dada la importancia del bosque mesófilo de montaña en las funciones hidrológicas, estos disturbios definen una baja calidad de los servicios ambientales, donde la demanda de agua supera la oferta regional (Del Angel-Pérez et al., 2011) y su impacto en la economía regional y la calidad de vida de las poblaciones ha provocado fuertes movimientos migratorios (Mestries, 2006) que determinan una gran vulnerabilidad ecológica y social.
RESULTS AND DISCUSSION
Figure 5 shows the study area selected to validate the methodology, located between 97°07’34” and 96°19’23” West longitude and 19°30’50” and 19°16’44” north latitude, and comprises the altitude transect of the Cofre de Perote to the outskirts of the city of Veracruz. Likewise, it shows the systemic grid that indicates the location of the altitudinal transect, which varies from east to west, and the spatial dispersion of the field sampling points (circles), which captured virtually all the variability of the landscape.
The altitudinal variation of the validation area was defined by means of strata every 500 meters above the medium sea level, (Figure 5); it can be observed how it goes from the northwest to the southwest, with its minimum altitude point located in the municipality of La Antigua on the coastline of the Gulf of Mexico, and its maximum altitude point on the Cofre de Perote. The spatial delimitation of hypsometric areas provided information about the relationship between the altitude above the medium sea level and the distribution of the area on the land, which allowed the quantification and qualification of the relief of the land, differentiated by colors in Figure 5.
Use of the soil
Figure 6 shows the spatial delimitation of the various types of vegetation occurring in the area. The agricultural surface is prominent; nevertheless, much of this is devoted to the cultivation of coffee under diverse or simplified shade, but for classification purposes was considered as agricultural. This form of use of the soil has been inserted in the mesophile forest areas of the mountain, which have been disturbed since coffee orchards were first planted in the middle of the 18th century (Guadarrama, 2008), and also by fruit and vegetable crops, recently characterized by a high population density indicative of the change of use of the soil and of the pressure exerted on the landscape, chiefly through deforestation (Del Angel-Pérez et al., 2011).
Given the importance of the hydrological disturbances of the mesophile mountain forests, these disturbances define the environmental services as low-quality, with the demand of water surpassing the regional supply (Del Angel-Pérez et al., 2011), and their impact on the regional economy and the life quality of the population has caused strong migratory movements (Mestries, 2006) that determine a great social and ecological vulnerability.
Likewise, there are areas that were deforested for the establishment of pasturelands, not only in the mesophile forest but also in original areas of high, medium, and low deciduous forests, which may be seen in the lowest parts (Figure 6). In this regard, the socioeconomic analysis performed by Del Angel-Pérez et al. (2011) in the same area indicates that the change of use of the soil in different historic moments

Rev. Mex. Cien. For. Vol. 4 Núm. 16
58
Asimismo existen zonas que fueron deforestadas para el establecimiento de pastizales, no solo en el bosque mesófilo, sino también en áreas originales de selva baja, media y alta de tipo caducifolio, apreciadas en las partes más bajas (Figura 6). Al respecto, el análisis socioeconómico efectuado por Del Angel-Pérez et al. (2011) en la misma zona indica que el cambio de uso del suelo en diferentes momentos históricos llevó a intensos procesos de fragmentación de las masas forestales, sobre todo en las áreas de bosque, las cuales aparecen en las imágenes subsecuentes como las más frágiles, y que al mismo tiempo constituyen las zonas de mayor densidad poblacional, con alta gmarginación, y poblaciones con los ingresos más bajos.
La información muestra que con la metodología es factible definir y actualizar de forma precisa el uso del suelo, ya que la malla de puntos georreferenciados mantuvo una equidistancia muy cercana. En el Cuadro 4 se resume la desagregación de los niveles de vulnerabilidad de acuerdo al uso actual del suelo.
Figura 4. Diagrama simplificado de algoritmos empleados en la modelación espacial del Índice de Fragilidad del Paisaje (IFP).
Figure 4. Simplified diagram of the algorithms employed in the spatial modeling of the Landscape Fragility Index (LFI).
led to intense processes of fragmentation of the forest masses, above all in the woods areas, which appear in the following images as the most fragile, and which at the same time are the areas where population density is highest, with a high degree of marginalization and populations with the lowest incomes.
The information shows that with this method it is possible to accurately define and update the use of the soil, since the grid of georeferenced points maintain a very close equidistance. Table 4 summarizes the disaggregation of the vulnerability levels according to the current use of the soil.
The most fragile landscapes, with the highest LFI, and therefore the most vulnerable, are those constituted by High and Low Forest; although the estimates are low percentage-wise (2.8%), in reality they correspond only to havens, for a great part of these ecosystems has been transformed into areas for livestock raising and for sugar cane production, as well as into orchards of mango and other fruit trees. Medium high LFIs constitute a great risk since they occupy the second place in importance due to the size of their surface (22.5%); besides, they are also are located in the ecosystems of Medium Forest and extend to the mesophile forests and to the pasturelands (Table 4).

Del Ángel et al., Vulnerabilidad del ecosistema como...
59
Cuadro 4. Desagregación de niveles de vulnerabilidad por uso de suelo en la zona de estudio. Coatepec – La Antigua. Veracruz (2012). Table 4. Vulnerability levels disaggregation by use of soil in the area of study. Coatepec – La Antigua. Veracruz (2012).
Uso de suelo Superficie (ha) y nivel de vulnerabilidad (IFP)
Bajo(ha)
%Bajo-medio
(ha)%
Medio(ha)
%Medio-alto
(ha)%
Alto(ha)
%Total general
(ha)
Agricultura 22 221 24.1 52 229 56.5 6 794 7.4 10 595 11.5 548 0.6 92 386
Bosque de encino 3 683 44.4 2 664 32.1 1 802 21.7 150 1.8 0.349 0.0 8 300Bosque de oyamel
22 8.1 226 84.7 18 6.9 1 0.3 267
Bosque de pino 352 7.3 2 474 51.2 1 540 31.9 462 9.6 4 829
Bosque mesófilo 14 0.1 1 564 13.4 1 894 16.2 7 979 68.4 222 1.9 11 673
Pastizal 8 477 17.6 22 988 47.7 9 494 19.7 7 177 14.9 76 0.2 48 212
Selva alta 721 22.8 1 366 43.1 1 079 34.1 3 166
Selva baja 5 214 40.4 7 275 56.3 426 3.3 12 915
Selva mediana 1 0.0 540 2.0 3 560 13.0 19 212 70.3 4 016 14.7 27 330Vegetación de dunas
386 61.3 244 38.7 630
Zona urbana 649 29.4 726 32.9 137 6.2 694 31.5 2 208
Total general 41 020 19.36 90 931 42.9 26 388 12.5 47 635 22.5 5 942 2.8 211 916
Low-medium LFIs correspond to a larger surface (42.9%), which affects chiefly the pasturelands, the Low Forest and the red oak and pine woods. Finally, the lowest LFIs account for 19.3% of the total surface and they are located, above all, in the pasturelands, the Low Forest and the red oak woods.
Figura 5. Ubicación geográfica de la zona de validación de la metodología, en la región Coatepec-La Antigua, así como la cota de malla de muestro y la variación altitudinal. Veracruz (2012).
Figure 5. Geographical location of the method validation area in the Coatepec-La Antigua region, sampling grid and altitudinal variation. Veracruz (2012).
Los paisajes más frágiles, con IFP más altos, y por lo tanto los más vulnerables son los constituidos por Selva Baja y Alta, aunque las estimaciones son porcentualmente bajas (2.8%), en realidad solo constituyen sus reductos, pues gran parte de estos ecosistemas se han transformado en áreas ganaderas,
Rev. Mex. Cien. For. Vol. 4 Núm. 16
60
Figura 6. Distribución del uso de suelo en la zona de validación de la metodología. Coatepec - La Antigua, Veracruz (2012).
Figure 6. Distribution of the use of soil in the validation area of the methodology. Coatepec - La Antigua, Veracruz (2012).
de producción de caña de azúcar y huertas de mango y otros frutales. Los IFP medio altos configuran un gran riesgo ya que ocupan el segundo lugar en importancia debido al tamaño de superficie (22.5%), también se localizan en los ecosistemas de Selva Mediana, y se extienden al bosque Mesófilo y a los pastizales (Cuadro 4).
Los IFP bajo-medios conforman una superficie más grande (42.9%), y afectan principalmente a los pastizales, la Selva Baja y al bosque de Encino y de Pino. Finalmente, los IFP más bajos integran 19.3% de la superficie total y se ubican, sobre todo, en los pastizales, la Selva Baja y el bosque de Encino.
Interpolación espacial de valores IFP y sobreposición del uso del suelo
Con base en la combinación de indicadores y descriptores utilizados se observa que en la parte oeste de la zona de estudio, donde predominan los bosques y pastizales, se aprecia mayor vulnerabilidad, la que decrece en dirección este a oeste con excepción de la zona de Jalcomulco, cuyo índice de fragilidad resultó menor. Lo anterior conduce a plantear que al aumentar la altitud, la probabilidad de deterioro o vulnerabilidad del paisaje es superior (Figura 7), en particular en la zona correspondiente al bosque Mesófilo de Montaña.
La Figura 5 muestra que en términos de vulnerabilidad destacan zonas con más altitud y pendiente, de uso agrícola, compuestas principalmente por cafetales, actividad económica más importante de las localidades enclavadas en esos paisajes (Mestries,
Spatial interpolation of LFI values and superimposition of the use of the soil
Based on the combination of indicators and descriptors utilized, it may be observed that the western part of the study area, where forests and pasturelands prevail, shows greater vulnerability, which decreases from east to west, except for the Jalcomulco area, whose fragility index turned out to be lower. This leads to the hypothesis that as the altitude increases, the probability of deterioration or vulnerability of the landscape is higher (Figure 7), particularly in the mesophile mountain forest area.
Figure 7 shows that the most vulnerable areas are those with highest altitude and slope. These areas are used for agriculture –mainly for coffee plantations–, which is the primary economic activity of the localities that are nestled in those landscapes (Mestries, 2006) and that make up the municipalities with the lowest marginalization levels (Del Angel-Pérez et al., 2011; Conapo, 2007), while 56% of the surface destined to agricultural use has a low-medium vulnerability level.
In general terms, the vulnerability level of the use of the soil is low-medium, representing 42% of the total surface of the area selected for the validation of the methodology.
Areas with low and low-average vulnerability are situated in areas close to the coastline and with lower slopes. The lowest vulnerability observed in the images is located in the Low Forest, whose current canopy is made up of mango and soursop orchards and sugar cane fields, as well as pasturelands. Conapo (2007) and

Del Ángel et al., Vulnerabilidad del ecosistema como...
61
2006), y coinciden con la existencia de municipios con los más bajos niveles de marginación (Del Angel-Pérez et al., 2011; Conapo, 2007); mientras que, 56% de la superficie destinada al uso agrícola se localiza en un nivel bajo-medio de vulnerabilidad.
En términos generales, la vulnerabilidad del uso del suelo se ubica en un nivel bajo-medio, que representa 42% de la superficie total de la zona seleccionada para la validación de la metodología.
Las zonas con vulnerabilidad baja-media y baja se sitúan en áreas cercanas a la línea costera y con pendientes menores. La vulnerabilidad más baja que se observa en las imágenes se localiza en Selva Baja, cuyo dosel actual se compone por huertas de mango, guanábana y caña, así como por pastizales. De alguna manera la Conapo (2007) y Del Angel-Pérez (2011) señalan que se conforman con municipios dedicados a actividades vinculadas con caña de azúcar, huertas de frutales y ganadería, con menores niveles de marginación, comparativamente con los de las zonas más vulnerables de la parte alta.
CONCLUSIONES
Se desarrolló una metodología cartográfica para la generación de índices de fragilidad de un paisaje (IFP), la cual constituye una herramienta obtenida por y para el trabajo interdisciplinario que genera la situación actual de un área y permite su monitoreo a través del tiempo, ya que al sobreponer capas de uso del suelo muestra la vulnerabilidad de un territorio.
Figura 7. Niveles de vulnerabilidad en la zona de validación de la metodología. Coatepec – La Antigua con base en los percentiles de vulnerabilidad (2012).
Figure 7. Vulnerability levels in the area of validation of the methodology. Coatepec – La Antigua, based on the percentiles of vulnerability (2012).
Del Angel-Pérez (2011) point out that these areas are somehow constituted by municipalities dedicated to the cultivation of sugar cane and fruit orchards and to livestock breeding, having lower levels of marginalization than those located in the most vulnerable areas of the higher part.
CONCLUSIONS
A cartographic method for the generation of landscape fragility indices (LFI) was developed; this method constitutes a tool obtained through and for the interdisciplinary work generated by the current situation of a given area and allows its monitoring through time, superimposing layers of use of the soil to show the vulnerability of the territory.
The combination of information captured through field work in strategic sampling stations and the secondary information obtained and grouped by means of a process of interpolation using the Optimized Inverse Distance model allowed estimation of the fragility index in a transect from the Chest of Perote to the coast of Veracruz in the Gulf of Mexico. The fragility index was regionalized as landscape fragility levels based on the percentiles of a Weibull distribution, and the current fragility of the landscape according to the various uses of the soil was quantified. The process described provides methodological elements to carry out territorial management and rural development work, using as point of departure the landscape of an area of interest.
Rev. Mex. Cien. For. Vol. 4 Núm. 16
62
La combinación de información captada en estaciones de muestreo estratégico mediante trabajo de campo, y la información secundaria obtenida y agrupada mediante un proceso de interpolación con el modelo de Inverso de la Distancia Optimizado permitió estimar el índice de fragilidad, en un transecto desde el Cofre de Perote hasta el litoral veracruzano del Golfo de México. El índice de fragilidad se regionalizó como niveles de fragilidad paisajística con base en los percentiles de una distribución Weibull, y se cuantificó la fragilidad actual del paisaje en los diversos usos a que se destina al suelo. El proceso descrito provee elementos metodológicos para realizar trabajos de gestión territorial y desarrollo rural, a partir del factor paisaje de una zona de interés.
Con base en los resultados del trabajo, se sugiere como plan de acción desarrollar actividades o programas encaminados a la conservación en las áreas de fragilidad baja, y la restauración en zonas de media a alta fragilidad. Sin embargo, lo anterior deberá fundamentarse en planes de acción integrales basados en un desarrollo sostenible que considere la fragilidad del paisaje en los diferentes ecosistemas presentes en una zona, así como los usos e intereses de la población que los habita. Específicamente, en el caso de la Selva Mediana, la cual cuenta con una superficie aproximada de 23 228 ha en condiciones de vulnerabilidad que va de media-alta a alta, deberán ejecutarse acciones de conservación. Una situación similar aplica para los bosques mesófilos y la selva alta. En contraste, las zonas a las que se pueden destinar acciones de restauración son las de bosque de Encino.
REFERENCIAS
Barlow, S. and W. Dietz. 1998. Obesity evaluation and treatment: Expert committee recommendations. Pediatrics, 102(3): 1-11.
Betters, D. R. and J. L. Rubingh. 1978. Suitability analysis and wildland classification: an approach. Aspen Bibliography. Paper 4821. http://digitalcommons.usu.edu/aspen _ bib/4821 (20 de junio de 2012).
Bolstad, P. 2005. GIS fundamentals, Second Edition. Eider Press. Ashland, OH USA. 541 p.
Burrough, P. A. and R. A. McDonnell. 1998. Principles of geographical information systems, 2nd Edition. Oxford University Press. Oxford, UK. 352 p.
Comisión Nacional Forestal-Secretaría del Medioambiente y Recursos Naturales (Conafor-Semarnat). 2009. Inventario Nacional Forestal y de Suelos. http://148.223.105.184/infys/ http://www.paot.org.mx/paot _ docs/pdf/inventario_nal.pdf (12 enero de 2011).
Consejo Nacional de Población (Conapo). 2007. Índices de marginación 2005, México, D.F. México. 307p.
Delgado, R. 2010. La construcción social del paisaje de la Sabana de Bogotá 1880 – 1890. Monografía para optar al título de Magíster en Historia. Universidad Nacional de Colombia, Bogotá. 153 p. http://www.bdigital.unal.edu.co/2703/1/468427.2010.pdf (23 de junio de 2012).
Del Angel-Pérez, A. L., G. Díaz-Padilla, R., Guajardo-Panez, B.C. Linares-Bravo. 2011a. Landscapes and fragile economy: Ecosystems and agroecosystems in the Coatepec-La Antigua Basin, Veracruz Mexico. Tropical and Subtropical Agrosystems14 (2):629-642.
Del Angel-Pérez, A., J. Villagómez-Cortés y G. Díaz-Padilla. 2011b. Valoración Socioeconómica del pago por Servicios Ambientales Hidrológicos en Veracruz (Coatepec y San Andres Tuxtla). Revista Mexicana de Ciencias Forestales 2 (6):95-111.
Based on the results of the work, a suggested action plan is to develop activities or programs aiming at preservation in the areas of low fragility, and at restoration in areas of medium to high fragility. Nevertheless, these should be supported by integral action plans based on a sustainable development that considers the fragility of the landscape in the various ecosystems occurring in a given area, as well as the uses and interests of the population that inhabits them. Preservation actions should be carried out specifically in the medium forest, which occupies a surface of approximately 23 228 has in conditions of medium to high vulnerability. A similar situation applies to mesophile and high forests. Conversely, restoration actions can be carried out in the red oak woods.
End of the English version
Díaz, P. G. 2009. Variación espacio temporal de la precipitación pluvial en México: Una aproximación a la evaluación de impactos. Tesis doctoral. Instituto Tecnológico de Sonora. Ciudad Obregón, Son. México.152 p.
Eberhardt, L. L. 1978. Transect Methods for Population Studies. The Journal of Wildlife Management. 42(1):1-31.http://www.jstor.org/stable/3800685. (24 de junio de 2010).
Environmental Systems Research Institute (ESRI). 2001. ArcGisTM Geostatistical Analyst: Statistical tools for data exploration, Modeling and advanced surfaced generation. An ESRI® White paper. Redlands, CA USA. 19 p. http://www.esri.com/library/whitepapers/pdfs/geostat.pdf (18 de junio de 2012).
Garcés F., E. 2009. Tierra del Fuego (Chile) y los paisajes culturales extremos. Apuntes Vol. 22 (1) 82-93. http://www.scielo.org.co/pdf/apun/v22n1/v22n1a07.pdf (23 de junio de 2012).
Garitacelaya S., J., N. Gómez C., M, López F. y C. Avilés R. 2006. Teoría y práctica del transecto como método de inventario para El Sabinar (Juniperus thurifera) In: Memorias del III Coloquio Internacional sobre sabinares y enebrales (género Juniperus): Ecología y gestión forestal sostenible, mesa 3. 24-26 de mayo, Universidad de Valladolid (Campus de Soria). Cabrejas del Pinar, España. 17 p. http://www.pfcyl.es/sites/default/files/eventos/114.pdf (25 de noviembre de 2010).
Google (2010). Google Earth 6. http://www.google.com/intl/es/earth/index.html (2 de febrero de 2010).
Gregoire, T. G. and Valentine, H. T. 2003 Line intersect sampling: Ell-shaped transects and multiple intersections. Environmental and Ecological Statistics10 (2): 263-279. http://www.fs.fed.us/ne/newtown _ square/publications/other_publishers/OCR/ne _ 2003gregoire01.pdf (28 de junio de 2012).
Del Ángel et al., Vulnerabilidad del ecosistema como...
63
Gros, C. 2003. Etnicidad, violencia y ciudadanía: algunos comentarios sobre el caso latinoamericano. In: Puyana, A. y G. Farfán (coord.). Desarrollo, equidad y ciudadanía: Las políticas sociales en América Latina. Plaza y Valdés. México. pp. 243-260. http://books.google.com.mx/books?id=1DPQWFEzLLAC&pg=PA243&dq=christian+gros+desarrollo+equidad+ciudadania&hl=en&sa=X&ei=Grb0T5GDLuSg2AWsq7zJBg&ved=0CC4Q6AEwAA#v=onepage&q=christian%20gros%20desarrollo%20equidad%20ciudadania&f=false (26 de junio de 2012)
Grosenbaugh, L. R. 1958. Point-sampling and line-sampling: Probability theory, geometric implications, synthesis. Southern Forest Experiment Station, USDA Forest Service. http://www.srs.fs.usda.gov/pubs/misc/op_160.pdf (28 de junio de 2012).
Guadarrama O., H. 2008. Café y sociedad en Huatusco, Veracruz: formación de la cultura cafetalera (1870-1930). In: Córdova S., S. (2005). Café y sociedad en Huatusco, Veracruz: formación de la cultura cafetalera (1870-1930). CONACULTA-Universidad Autónoma de Chapingo. México, D. F. México. pp.177-182. http://dspace.leon.uia.mx:8080/jspui/123456789/65581
Ibarra C., D., J. A. Ruiz C., D. R. González E., J. G. Flores y G. Díaz P. 2009. Distribución espacial del pH de los suelos agrícolas de Zapopan, Jalisco, México. Agricultura Técnica en México 35(3): 267-276.
Instituto Nacional de Estadística, Geografía e Informática (INEGI). 1995. Modelo de elevación digital raster de 1 dato cada 90 m. México, D.F. México. http://www.inegi.org.mx/geo/contenidos/datosrelieve/continental/Descarga.aspx (11 de junio de 2011].
Mestries, F. 2006. Entre la migración internacional y la diversificación de cultivos. Los pequeños productores de café en dos localidades de Veracruz. Sociológica 21(60): 75-108.
MINITAB. 2009. Statistical and Process Management Software for Six Sigma and Quality Improvement. Minitab Inc. Versión 15. State University Pennsylvania. Philadelphia, PA USA.
Mondragón P. R. 2002. ¿Qué son los indicadores? Notas. Revista de Información y Análisis, No. 19: 52-58. http://www.inegi.org.mx/inegi/contenidos/espanol/prensa/contenidos/articulos/economicas/indicadores.pdf (20 de junio de 2012).
Muñóz- Pedreros, A. 2004. La evaluación del paisaje: una herramienta de gestión ambiental. Revista Chilena de Historia Natural 77 (1): 139-156.
Pérez J., R. 2000. La evaluación de programas educativos: Conceptos básicos, planteamientos Generales y problemática. Revista de Investigación Educativa 18(2): 261-287. http://www.doredin.mec.es/documentos/007200230097.pdf (20 de junio de 2012).
Reyes-García V. y N. Martí Sanz. 2007. Etnoecología: punto de encuentro entre naturaleza y cultura. Ecosistemas 16 (3): 46-55.
Sauer, C. 1925. The Morphology of Landscape. Univ. Calif. Publ. In: Castro H., G. (trad.). Geography 2: 19-53. www.colorado.edu/geography/giw/sauer-co/ (23 de junio de 2012).
Torrealba S., I. 2011. Sustentabilidad, historia ambiental y transdisciplinariedad. Revista sustentabilidad. http://www.sustentabilidades.org/revista/publicacion-04-2011/sustentabilidad-historia-ambiental-y-transdisciplinariedad (20 de junio de 2012).
Torres E., M. 2008. Metodología para definir funciones profesionales. Rev Cubana Salud Pública. 34(4). http://scielo.sld.cu/scielo.php?script=sci_arttext&pid=S0864-34662008000400017&lng=es. (20 de junio de 2012).
Troitiño, V., M. A. 1995. La protección y ordenación de la Sierra de Gredos: Crónica de un confrico no resuelto. In: Gredos, territorio, sociedad y cultura. Institución Gran Duque de Alba- Fundación Marcelo Gómez Matías. Ciudad, España. pp. 227-276.
Troll, C. 2010. Ecología del paisaje. Investigación ambiental. Ciencia y Política Pública. Vol. 2(1):94-105. http://www.revista.ine.gob.mx/article/viewDownloadInterstitial/105/75 (23 de junio de 2012).
Zonneveld, I. S. 1972. Land Evaluation and Land(scape) Science: Lectures on Land(scape) Science, Land(scape) Survey, and Land Evaluation (pragmatic Land Classification). International Institute for Aerial Survey and Earth Sciences (ITC), Texbook VII. Enschede, Netherlands. 134 p.