Article Thermal Performance of Single-Storey Air-welled ...
36
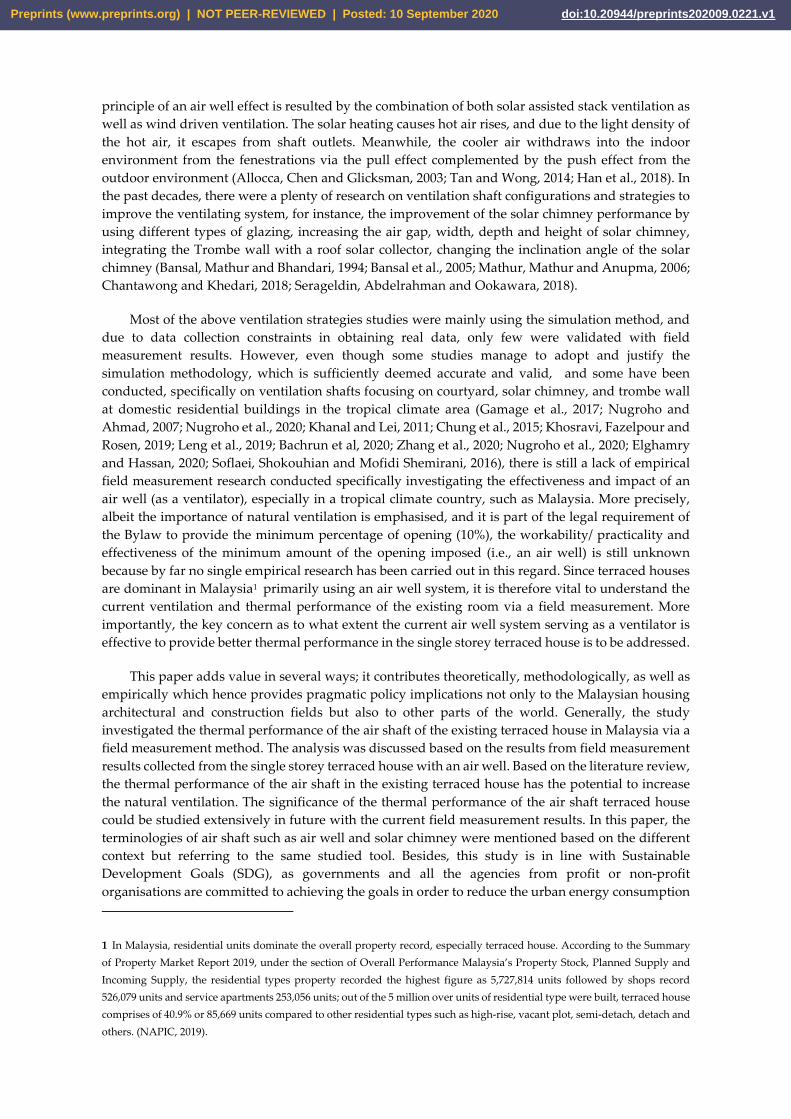
Article Thermal Performance of Single-Storey Air-welled Terraced House in Malaysia: A Field Measurement Approach Pau Chung Leng 1 *, Mohd Hamdan Ahmad 2, Dilshan Remaz Ossen 3 , Gabriel H.T.Ling 4 , Eeydzah Aminudin 5 , Weng Howe Chan 6 1 Faculty of Built Environment & Surveying, Universiti Teknologi Malaysia, Johor 81300 Malaysia; [email protected] 2 Faculty of Built Environment & Surveying, Universiti Teknologi Malaysia, Johor 81300 Malaysia; b- [email protected] 3 Department of Architecture Engineering, Kingdom University, Riffa 40434, Bahrain; [email protected] 4 Faculty of Built Environment & Surveying, Universiti Teknologi Malaysia, Johor 81300 Malaysia; [email protected] 5 School of Civil Engineering, Faculty of Engineering, Universiti Teknologi Malaysia, Johor 81300, Malaysia; [email protected] 6 School of Computing, Faculty of Engineering, Universiti Teknologi Malaysia, Johor 81300, Malaysia; [email protected] * Correspondence: [email protected]; Tel.: +607-5537389 (F.L.) Abstract: The provision requirement of 10% openings of the total floor area stated in the Uniform Building by Law 1984 Malaysia has been practiced by designers for building plan submission approval. However, the effectiveness of thermal performance in landed residential buildings, despite the imposition by the by-law, has never been empirically measured and proven. Although terraced houses in Malaysia have dominated 40.9% of the total property transaction in 2019, such mass production with typical designs hardly provides its occupants with thermal comfort due to the static outdoor air condition and lack of external windows, where the conventional ventilation technique does not work well, even for houses with an air well system. Consequently, the occupants need to rely on mechanical cooling, which is a high energy-consuming component contributing to outdoor heat dissipation and therefore urban heat island effect. Thus, encouraging more effective natural ventilation to eliminate excessive heat from the indoor environment is critical. Since most of the research focuses on simulation modelling lacking sufficient empirical validation, this paper drawing on field measurement investigates natural ventilation performance in terraced housing with an air well system. More importantly, the key concern as to what extent the current air well system serving as a ventilator is effective to provide better thermal performance in the single storey terraced house is to be addressed. By adopting an existing single storey air welled terrace house, the existing indoor environmental conditions and thermal performance were monitored and measured using scientific equipment, namely HOBO U12 air temperature and air humidity, the HOBO U12 anemometer and the Delta Ohm HD32.3 Wet Bulb Globe Temperature meter for a six-month duration. The findings show that the air temperature of the air well ranged from 27.48°C to 30.92°C, while the mean relative humidity were from 72.67% to 79.25%. The mean air temperature for a test room (single sided ventilation room) ranged from 28.04°C to 30.92°C with a relative humidity of 70.16% to 76%. These empirical findings are of importance, offering novel policy insights and suggestions to potentially revising the existing building code standard and by laws; since the minimum provision of 10% openings has been revealed to be less effective to provide a desired thermal performance and comfort, mandatory compliance with, and the necessity for, the bylaw requirement should be revisited and further studied. Keywords: air shaft, solar chimney, air well, field measurement, natural ventilation, tropical climate, terrace house, passive cooling design Preprints (www.preprints.org) | NOT PEER-REVIEWED | Posted: 10 September 2020 doi:10.20944/preprints202009.0221.v1 © 2020 by the author(s). Distributed under a Creative Commons CC BY license.
Transcript of Article Thermal Performance of Single-Storey Air-welled ...
Article
Thermal Performance of Single-Storey Air-welled
Terraced House in Malaysia: A Field Measurement
Approach Pau Chung Leng 1*, Mohd Hamdan Ahmad 2, Dilshan Remaz Ossen 3, Gabriel H.T.Ling 4,
Eeydzah Aminudin 5, Weng Howe Chan 6
1 Faculty of Built Environment & Surveying, Universiti Teknologi Malaysia, Johor 81300 Malaysia;
[email protected] 2 Faculty of Built Environment & Surveying, Universiti Teknologi Malaysia, Johor 81300 Malaysia; b-
[email protected] 3 Department of Architecture Engineering, Kingdom University, Riffa 40434, Bahrain; [email protected] 4 Faculty of Built Environment & Surveying, Universiti Teknologi Malaysia, Johor 81300 Malaysia;
[email protected] 5 School of Civil Engineering, Faculty of Engineering, Universiti Teknologi Malaysia, Johor 81300, Malaysia;
[email protected] 6 School of Computing, Faculty of Engineering, Universiti Teknologi Malaysia, Johor 81300, Malaysia;
* Correspondence: [email protected]; Tel.: +607-5537389 (F.L.)
Abstract: The provision requirement of 10% openings of the total floor area stated in the Uniform
Building by Law 1984 Malaysia has been practiced by designers for building plan submission
approval. However, the effectiveness of thermal performance in landed residential buildings,
despite the imposition by the by-law, has never been empirically measured and proven. Although
terraced houses in Malaysia have dominated 40.9% of the total property transaction in 2019, such
mass production with typical designs hardly provides its occupants with thermal comfort due to
the static outdoor air condition and lack of external windows, where the conventional ventilation
technique does not work well, even for houses with an air well system. Consequently, the occupants
need to rely on mechanical cooling, which is a high energy-consuming component contributing to
outdoor heat dissipation and therefore urban heat island effect. Thus, encouraging more effective
natural ventilation to eliminate excessive heat from the indoor environment is critical. Since most of
the research focuses on simulation modelling lacking sufficient empirical validation, this paper
drawing on field measurement investigates natural ventilation performance in terraced housing
with an air well system. More importantly, the key concern as to what extent the current air well
system serving as a ventilator is effective to provide better thermal performance in the single storey
terraced house is to be addressed. By adopting an existing single storey air welled terrace house, the
existing indoor environmental conditions and thermal performance were monitored and measured
using scientific equipment, namely HOBO U12 air temperature and air humidity, the HOBO U12
anemometer and the Delta Ohm HD32.3 Wet Bulb Globe Temperature meter for a six-month
duration. The findings show that the air temperature of the air well ranged from 27.48°C to 30.92°C,
while the mean relative humidity were from 72.67% to 79.25%. The mean air temperature for a test
room (single sided ventilation room) ranged from 28.04°C to 30.92°C with a relative humidity of
70.16% to 76%. These empirical findings are of importance, offering novel policy insights and
suggestions to potentially revising the existing building code standard and by laws; since the
minimum provision of 10% openings has been revealed to be less effective to provide a desired
thermal performance and comfort, mandatory compliance with, and the necessity for, the bylaw
requirement should be revisited and further studied.
Keywords: air shaft, solar chimney, air well, field measurement, natural ventilation, tropical
climate, terrace house, passive cooling design
Preprints (www.preprints.org) | NOT PEER-REVIEWED | Posted: 10 September 2020 doi:10.20944/preprints202009.0221.v1
© 2020 by the author(s). Distributed under a Creative Commons CC BY license.

1. Introduction
Natural ventilation in a building occurs when the pressure differences generated by wind or
buoyancy forces which undertake single or multiple openings in the building envelope. It is an
important and significant sustainable building design strategy for human being as one of the basic
living environment criteria (Linden, 1999; Kleiven, 2003; Kubota, Chyee and Ahmad, 2009; Tan and
Wong, 2014; Han et al., 2018). Following the Malaysia Uniform Building By Law 1984, under the
Uniform Building By Law 39, the requirement of minimum 10% of the total floor area of residential
and business spaces has to be fulfilled by all the submission to the local authorities as a requirement
for approval in order to commence a construction process on the ground. The similar requirement
has been stated in the Building & Construction Act of Singapore as well as in other countries, such as
Australia and some others Commonwealth Countries. Hence, it is plausible that natural ventilation
is important and necessary to be included as a habitable building design strategy under the
circumstances that mechanical ventilation system does not provided.
As the standard of living has enhanced, the coziness of residential and working conditions have
been recognized to be one of the important factors for occupants’ life at present (Han et al., 2018). In
Malaysia, terraced houses have a limited amount of exposed building envelope due to the constraint
of design layout with adjacency party walls. The constraints have limited the natural ventilation
strategy to be applied on the external fenestration. Hence, mechanical ventilation systems have
become the choice of occupants in terrace house as substitution to solve the thermal comfort problem.
Mechanical ventilation systems require high electricity to run, for instance, in some cities air-
conditioning requirements take full capacity of electricity grids (Linden, 1999; Khanal and Lei, 2011).
According to Toe and Kubota (2015) final energy use in residential and commercial sectors in
Malaysia has been increased more than sevenfold between 1980 and 2007 at a higher rate than total
amount of energy demand growth rate based on the Ministry of Energy, Water and Communications
Malaysia National Energy Balance 2007 report. In residential buildings, a large portion of electricity
consumption was attributed by the air conditioning systems as the ownership of the air-conditioner
expanded from approximately 12,000 to 764,000 households from 1970’s to 2000’s (Malaysia, 2000;
Mahlia et al., 2004; Toe and Kubota, 2015).
In general, the mechanical ventilation system has been used to manage air quality and the indoor
ventilation rate. An air conditioning system or also known as HVAC system applying the forced
ventilation supplies fresh air and regulates the supplied air temperature and humidity for an indoor
environment (Han et al., 2017, 2018). The phenomenon of highly dependent of mechanical ventilation
system by buildings’ occupant has critically depleted natural resources and increased the greenhouse
gases. Back to the basic, natural ventilation is still an ideal alternative for residential buildings.
In recent years, the natural ventilation topic has attracted a strong growing interest due to its
potential benefits over mechanical ventilation systems in terms of economic, energy consumption
and environmental advantages (Khanal and Lei, 2011). There were also some trials to enhance the
performance of natural ventilation by using renewable energy, whereas some authors have
categorized it as a hybrid ventilation (Han et al., 2018). This has proven that research on natural
ventilation is widely explored for the purpose of achieving the reduction of use of air-conditioning
systems for the ventilation purpose. An application of natural ventilation to provide thermal comfort
is a sustainable approach as the method applied uses renewable energy resources, such as solar
energy, and minimizes the usage of energy consumption in buildings (Baharvand, 2014)
The thermal performance of an indoor environment under a hot climatic condition is highly
affected by various passive design techniques, for instance: space dimensions, facade colors,
fenestration ratio, glazing type; and vertical and horizontal shading devices (Ali Ahmed, 2012). The
Preprints (www.preprints.org) | NOT PEER-REVIEWED | Posted: 10 September 2020 doi:10.20944/preprints202009.0221.v1
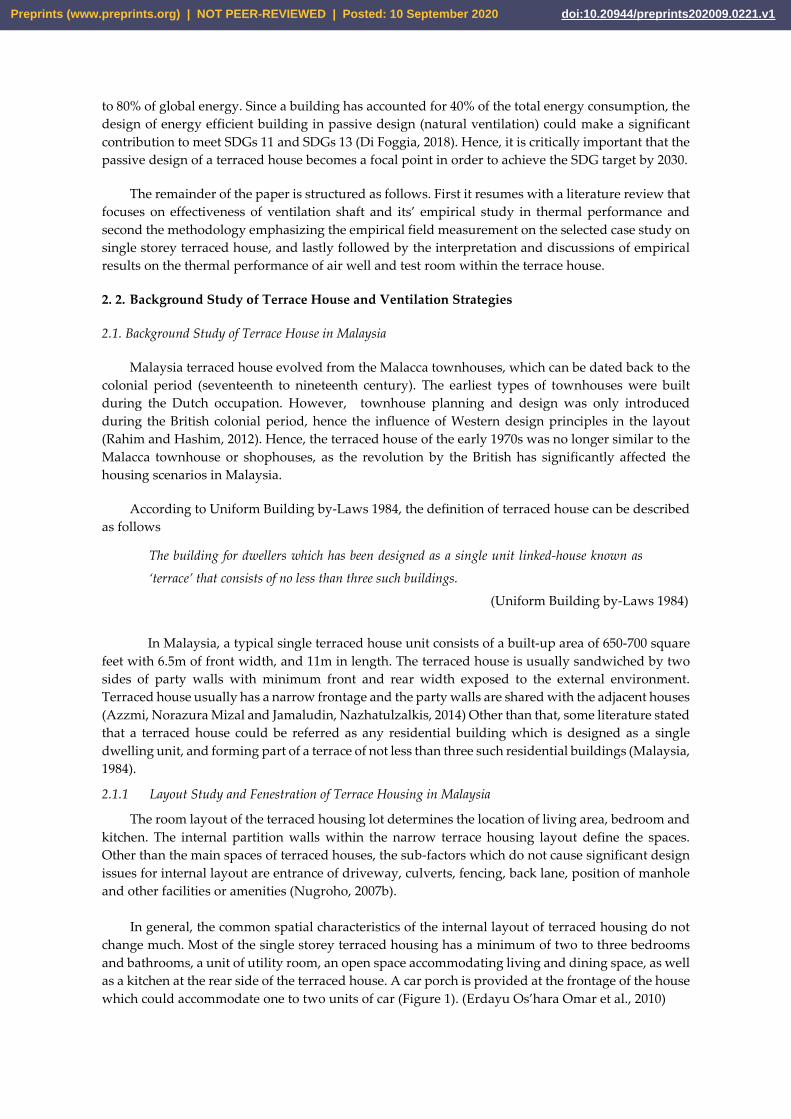
principle of an air well effect is resulted by the combination of both solar assisted stack ventilation as
well as wind driven ventilation. The solar heating causes hot air rises, and due to the light density of
the hot air, it escapes from shaft outlets. Meanwhile, the cooler air withdraws into the indoor
environment from the fenestrations via the pull effect complemented by the push effect from the
outdoor environment (Allocca, Chen and Glicksman, 2003; Tan and Wong, 2014; Han et al., 2018). In
the past decades, there were a plenty of research on ventilation shaft configurations and strategies to
improve the ventilating system, for instance, the improvement of the solar chimney performance by
using different types of glazing, increasing the air gap, width, depth and height of solar chimney,
integrating the Trombe wall with a roof solar collector, changing the inclination angle of the solar
chimney (Bansal, Mathur and Bhandari, 1994; Bansal et al., 2005; Mathur, Mathur and Anupma, 2006;
Chantawong and Khedari, 2018; Serageldin, Abdelrahman and Ookawara, 2018).
Most of the above ventilation strategies studies were mainly using the simulation method, and
due to data collection constraints in obtaining real data, only few were validated with field
measurement results. However, even though some studies manage to adopt and justify the
simulation methodology, which is sufficiently deemed accurate and valid, and some have been
conducted, specifically on ventilation shafts focusing on courtyard, solar chimney, and trombe wall
at domestic residential buildings in the tropical climate area (Gamage et al., 2017; Nugroho and
Ahmad, 2007; Nugroho et al., 2020; Khanal and Lei, 2011; Chung et al., 2015; Khosravi, Fazelpour and
Rosen, 2019; Leng et al., 2019; Bachrun et al, 2020; Zhang et al., 2020; Nugroho et al., 2020; Elghamry
and Hassan, 2020; Soflaei, Shokouhian and Mofidi Shemirani, 2016), there is still a lack of empirical
field measurement research conducted specifically investigating the effectiveness and impact of an
air well (as a ventilator), especially in a tropical climate country, such as Malaysia. More precisely,
albeit the importance of natural ventilation is emphasised, and it is part of the legal requirement of
the Bylaw to provide the minimum percentage of opening (10%), the workability/ practicality and
effectiveness of the minimum amount of the opening imposed (i.e., an air well) is still unknown
because by far no single empirical research has been carried out in this regard. Since terraced houses
are dominant in Malaysia1 primarily using an air well system, it is therefore vital to understand the
current ventilation and thermal performance of the existing room via a field measurement. More
importantly, the key concern as to what extent the current air well system serving as a ventilator is
effective to provide better thermal performance in the single storey terraced house is to be addressed.
This paper adds value in several ways; it contributes theoretically, methodologically, as well as
empirically which hence provides pragmatic policy implications not only to the Malaysian housing
architectural and construction fields but also to other parts of the world. Generally, the study
investigated the thermal performance of the air shaft of the existing terraced house in Malaysia via a
field measurement method. The analysis was discussed based on the results from field measurement
results collected from the single storey terraced house with an air well. Based on the literature review,
the thermal performance of the air shaft in the existing terraced house has the potential to increase
the natural ventilation. The significance of the thermal performance of the air shaft terraced house
could be studied extensively in future with the current field measurement results. In this paper, the
terminologies of air shaft such as air well and solar chimney were mentioned based on the different
context but referring to the same studied tool. Besides, this study is in line with Sustainable
Development Goals (SDG), as governments and all the agencies from profit or non-profit
organisations are committed to achieving the goals in order to reduce the urban energy consumption
1 In Malaysia, residential units dominate the overall property record, especially terraced house. According to the Summary
of Property Market Report 2019, under the section of Overall Performance Malaysia’s Property Stock, Planned Supply and
Incoming Supply, the residential types property recorded the highest figure as 5,727,814 units followed by shops record
526,079 units and service apartments 253,056 units; out of the 5 million over units of residential type were built, terraced house
comprises of 40.9% or 85,669 units compared to other residential types such as high-rise, vacant plot, semi-detach, detach and
others. (NAPIC, 2019).
Preprints (www.preprints.org) | NOT PEER-REVIEWED | Posted: 10 September 2020 doi:10.20944/preprints202009.0221.v1
to 80% of global energy. Since a building has accounted for 40% of the total energy consumption, the
design of energy efficient building in passive design (natural ventilation) could make a significant
contribution to meet SDGs 11 and SDGs 13 (Di Foggia, 2018). Hence, it is critically important that the
passive design of a terraced house becomes a focal point in order to achieve the SDG target by 2030.
The remainder of the paper is structured as follows. First it resumes with a literature review that
focuses on effectiveness of ventilation shaft and its’ empirical study in thermal performance and
second the methodology emphasizing the empirical field measurement on the selected case study on
single storey terraced house, and lastly followed by the interpretation and discussions of empirical
results on the thermal performance of air well and test room within the terrace house.
2. 2. Background Study of Terrace House and Ventilation Strategies
2.1. Background Study of Terrace House in Malaysia
Malaysia terraced house evolved from the Malacca townhouses, which can be dated back to the
colonial period (seventeenth to nineteenth century). The earliest types of townhouses were built
during the Dutch occupation. However, townhouse planning and design was only introduced
during the British colonial period, hence the influence of Western design principles in the layout
(Rahim and Hashim, 2012). Hence, the terraced house of the early 1970s was no longer similar to the
Malacca townhouse or shophouses, as the revolution by the British has significantly affected the
housing scenarios in Malaysia.
According to Uniform Building by-Laws 1984, the definition of terraced house can be described
as follows
The building for dwellers which has been designed as a single unit linked-house known as
‘terrace’ that consists of no less than three such buildings.
(Uniform Building by-Laws 1984)
In Malaysia, a typical single terraced house unit consists of a built-up area of 650-700 square
feet with 6.5m of front width, and 11m in length. The terraced house is usually sandwiched by two
sides of party walls with minimum front and rear width exposed to the external environment.
Terraced house usually has a narrow frontage and the party walls are shared with the adjacent houses
(Azzmi, Norazura Mizal and Jamaludin, Nazhatulzalkis, 2014) Other than that, some literature stated
that a terraced house could be referred as any residential building which is designed as a single
dwelling unit, and forming part of a terrace of not less than three such residential buildings (Malaysia,
1984).
2.1.1 Layout Study and Fenestration of Terrace Housing in Malaysia
The room layout of the terraced housing lot determines the location of living area, bedroom and
kitchen. The internal partition walls within the narrow terrace housing layout define the spaces.
Other than the main spaces of terraced houses, the sub-factors which do not cause significant design
issues for internal layout are entrance of driveway, culverts, fencing, back lane, position of manhole
and other facilities or amenities (Nugroho, 2007b).
In general, the common spatial characteristics of the internal layout of terraced housing do not
change much. Most of the single storey terraced housing has a minimum of two to three bedrooms
and bathrooms, a unit of utility room, an open space accommodating living and dining space, as well
as a kitchen at the rear side of the terraced house. A car porch is provided at the frontage of the house
which could accommodate one to two units of car (Figure 1). (Erdayu Os’hara Omar et al., 2010)
Preprints (www.preprints.org) | NOT PEER-REVIEWED | Posted: 10 September 2020 doi:10.20944/preprints202009.0221.v1
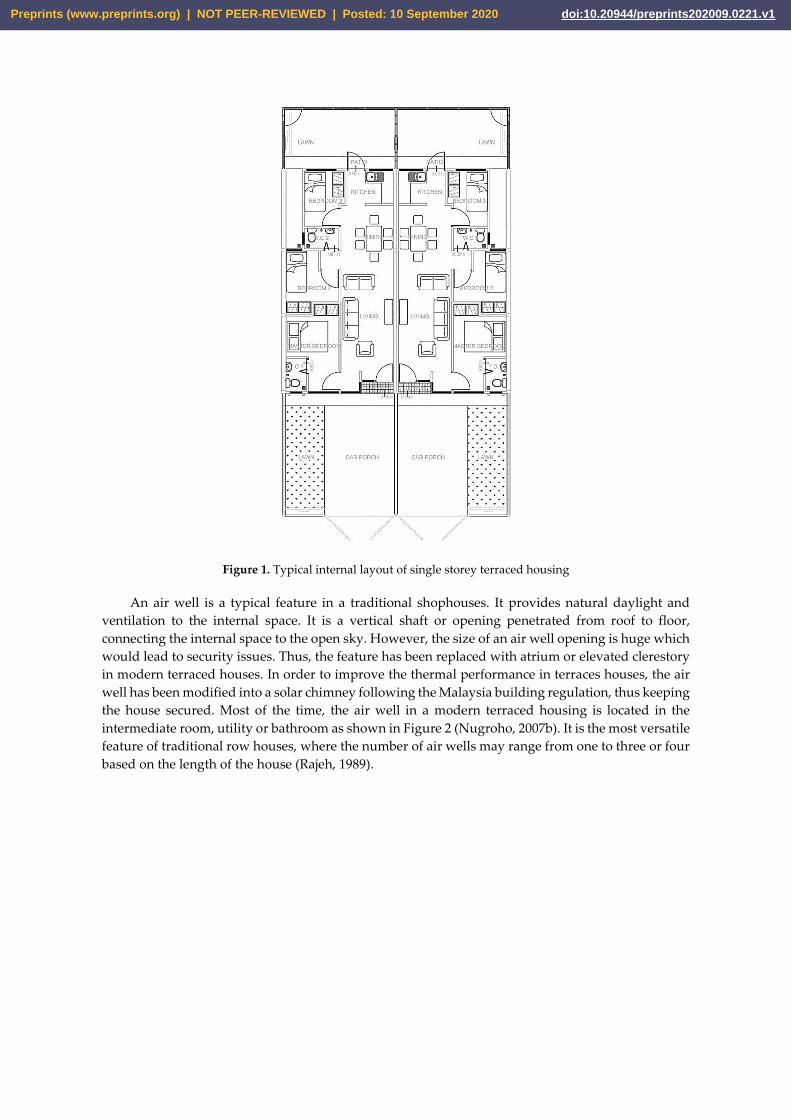
Figure 1. Typical internal layout of single storey terraced housing
An air well is a typical feature in a traditional shophouses. It provides natural daylight and
ventilation to the internal space. It is a vertical shaft or opening penetrated from roof to floor,
connecting the internal space to the open sky. However, the size of an air well opening is huge which
would lead to security issues. Thus, the feature has been replaced with atrium or elevated clerestory
in modern terraced houses. In order to improve the thermal performance in terraces houses, the air
well has been modified into a solar chimney following the Malaysia building regulation, thus keeping
the house secured. Most of the time, the air well in a modern terraced housing is located in the
intermediate room, utility or bathroom as shown in Figure 2 (Nugroho, 2007b). It is the most versatile
feature of traditional row houses, where the number of air wells may range from one to three or four
based on the length of the house (Rajeh, 1989).
Preprints (www.preprints.org) | NOT PEER-REVIEWED | Posted: 10 September 2020 doi:10.20944/preprints202009.0221.v1
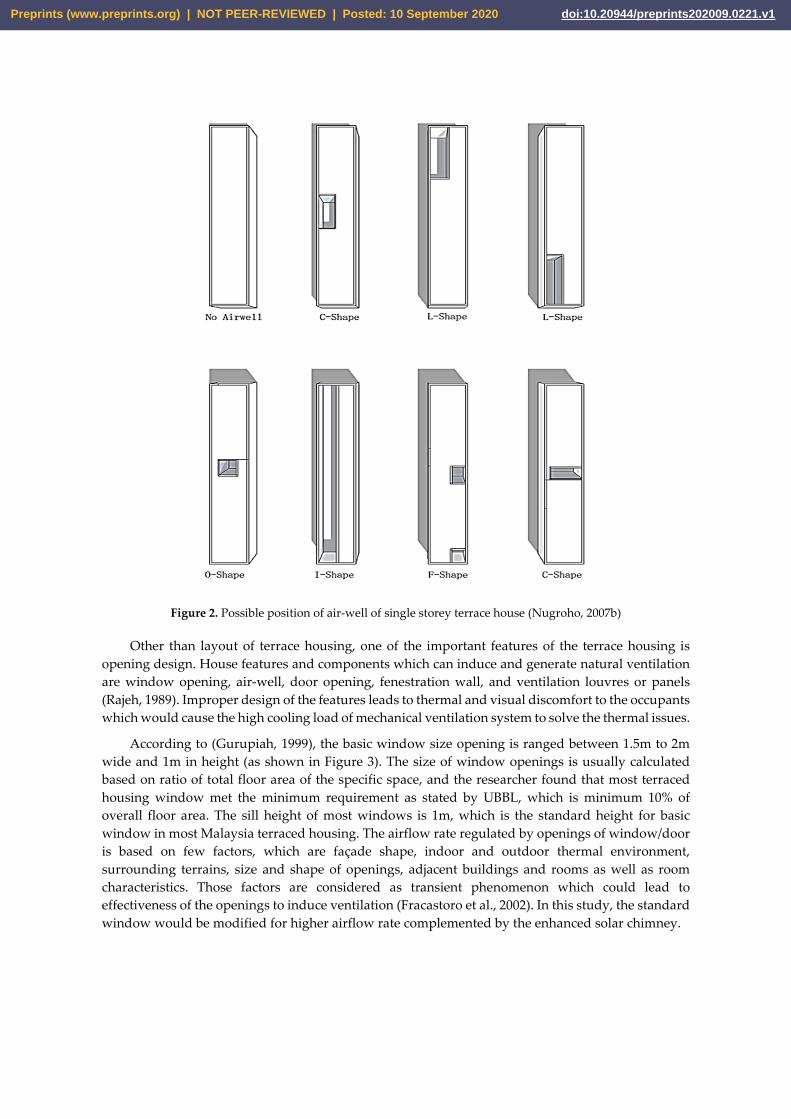
Figure 2. Possible position of air-well of single storey terrace house (Nugroho, 2007b)
Other than layout of terrace housing, one of the important features of the terrace housing is
opening design. House features and components which can induce and generate natural ventilation
are window opening, air-well, door opening, fenestration wall, and ventilation louvres or panels
(Rajeh, 1989). Improper design of the features leads to thermal and visual discomfort to the occupants
which would cause the high cooling load of mechanical ventilation system to solve the thermal issues.
According to (Gurupiah, 1999), the basic window size opening is ranged between 1.5m to 2m
wide and 1m in height (as shown in Figure 3). The size of window openings is usually calculated
based on ratio of total floor area of the specific space, and the researcher found that most terraced
housing window met the minimum requirement as stated by UBBL, which is minimum 10% of
overall floor area. The sill height of most windows is 1m, which is the standard height for basic
window in most Malaysia terraced housing. The airflow rate regulated by openings of window/door
is based on few factors, which are façade shape, indoor and outdoor thermal environment,
surrounding terrains, size and shape of openings, adjacent buildings and rooms as well as room
characteristics. Those factors are considered as transient phenomenon which could lead to
effectiveness of the openings to induce ventilation (Fracastoro et al., 2002). In this study, the standard
window would be modified for higher airflow rate complemented by the enhanced solar chimney.
Preprints (www.preprints.org) | NOT PEER-REVIEWED | Posted: 10 September 2020 doi:10.20944/preprints202009.0221.v1
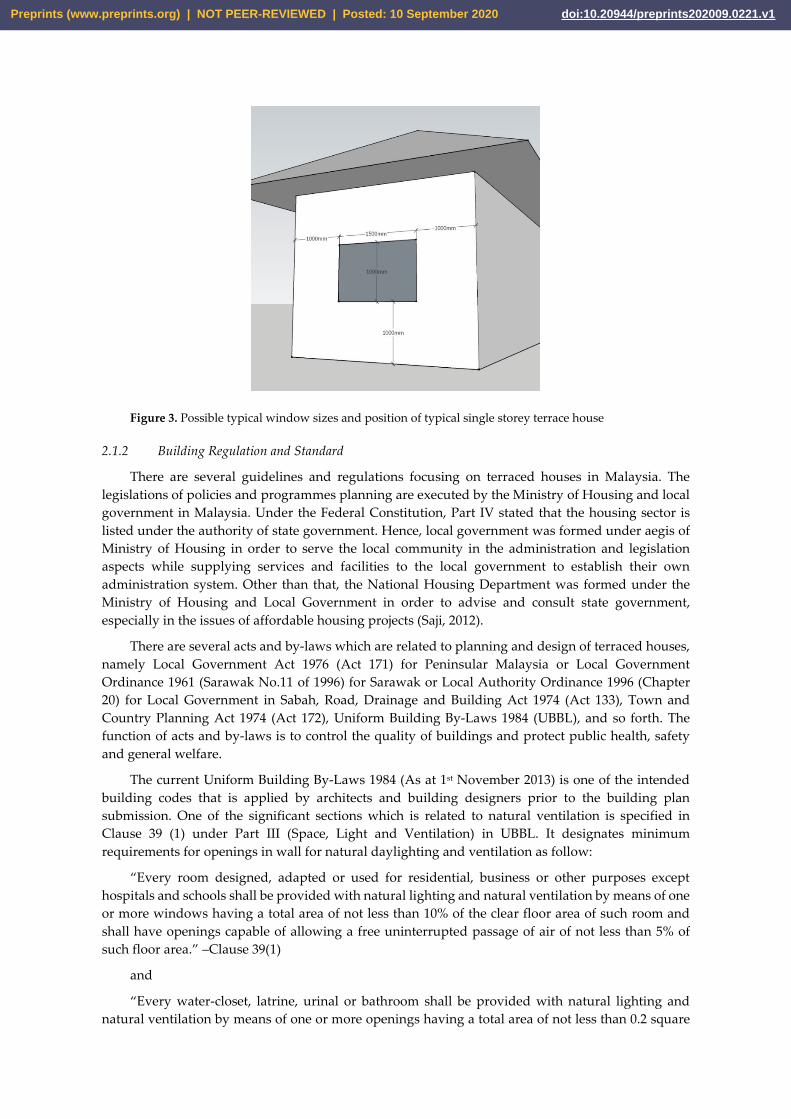
Figure 3. Possible typical window sizes and position of typical single storey terrace house
2.1.2 Building Regulation and Standard
There are several guidelines and regulations focusing on terraced houses in Malaysia. The
legislations of policies and programmes planning are executed by the Ministry of Housing and local
government in Malaysia. Under the Federal Constitution, Part IV stated that the housing sector is
listed under the authority of state government. Hence, local government was formed under aegis of
Ministry of Housing in order to serve the local community in the administration and legislation
aspects while supplying services and facilities to the local government to establish their own
administration system. Other than that, the National Housing Department was formed under the
Ministry of Housing and Local Government in order to advise and consult state government,
especially in the issues of affordable housing projects (Saji, 2012).
There are several acts and by-laws which are related to planning and design of terraced houses,
namely Local Government Act 1976 (Act 171) for Peninsular Malaysia or Local Government
Ordinance 1961 (Sarawak No.11 of 1996) for Sarawak or Local Authority Ordinance 1996 (Chapter
20) for Local Government in Sabah, Road, Drainage and Building Act 1974 (Act 133), Town and
Country Planning Act 1974 (Act 172), Uniform Building By-Laws 1984 (UBBL), and so forth. The
function of acts and by-laws is to control the quality of buildings and protect public health, safety
and general welfare.
The current Uniform Building By-Laws 1984 (As at 1st November 2013) is one of the intended
building codes that is applied by architects and building designers prior to the building plan
submission. One of the significant sections which is related to natural ventilation is specified in
Clause 39 (1) under Part III (Space, Light and Ventilation) in UBBL. It designates minimum
requirements for openings in wall for natural daylighting and ventilation as follow:
“Every room designed, adapted or used for residential, business or other purposes except
hospitals and schools shall be provided with natural lighting and natural ventilation by means of one
or more windows having a total area of not less than 10% of the clear floor area of such room and
shall have openings capable of allowing a free uninterrupted passage of air of not less than 5% of
such floor area.” –Clause 39(1)
and
“Every water-closet, latrine, urinal or bathroom shall be provided with natural lighting and
natural ventilation by means of one or more openings having a total area of not less than 0.2 square
Preprints (www.preprints.org) | NOT PEER-REVIEWED | Posted: 10 September 2020 doi:10.20944/preprints202009.0221.v1
meter per water-closet, urinal latrine or bathroom and such openings shall be capable of allowing a
free uninterrupted passage of air.” – Clause 39(4)
Other than that, UBBL has included air well guidelines in Clause 40 as follow:
“ (1)(a) The minimum size of each air-well where provided in all buildings shall be as follows:
For buildings up to 2 storeys in height, 7 square metres;
For buildings up to 4 storeys in height, 9 square metres;
For buildings up to 6 storeys in height, 11 square metres;
For buildings up to 8 storeys in height, 13 square metres;
For buildings more than 8 storeys in height, 15 square metres;
(b) The minimum width of such air-wells in any direction shall be 2.5 metres
(2)(a) The minimum size of each air-well for lavatories, water-closets and bathrooms shall be as follows:
For buildings up to 2 storeys in height, 3.5 square metres;
For buildings up to 4 storeys in height, 4 square metres;
For buildings up to 6 storeys in height, 4.5 square metres;
For buildings up to 8 storeys in height, 5 square metres;
For buildings more than 8 storeys in height, 5.5 square metres;
(b) The minimum width of such air-wells in any direction shall be 2 metres.”
In general, UBBL designates minimum requirements for openings on wall to induce natural
ventilation and daylighting. The purpose of opening requirements is to enhance natural ventilation
in enclosed space and ensure that the windows or openings protect the indoor and occupants from
direct sun and rain. The requirements stated in UBBL are not specified in terms of dimension, design
or position in order to allow the flexibility and creativity of architects to be played in design.
Other than UBBL, Malaysian Standard MS1525:2007 (Malaysia, 2007)- Code of Practice on
Energy Efficiency and Use of Renewable Energy for Non-Residential Buildings, Malaysian Standard
MS2680:2017 (Malaysia, 2017) – Code of Practice on Energy Efficiency and Use of Renewable Energy
for Residential Buildings, has further mentioned about the thermal comfort and visual comfort
guidelines, building design and energy efficiency guidelines. The standard could be complemented
with the UBBL to be applied as design reference for architects.
2.2 Ventilation Strategies
Ventilation and thermal performance play important roles in domestic building designs,
especially in residential buildings. In the previous section of literature review, ventilation strategies
of naturally ventilated terraced houses were discussed. In general, two types of ventilation strategies
were discussed by researchers, which are cross ventilation and single-sided ventilation (Allocca et
al., 2003; Stabat et al., 2012b). (Mohit and Mahfoud, 2015) have carried out a survey on Malaysian
preferences on residential types. He found out that terraced house, especially double storey terraced
house, could not satisfy the occupants’ needs for thermal and natural lighting comfort. Thus, most of
the occupants go for mechanical ventilation system to solve the ventilation problem (Tetsu Kubota et
al., 2011).
2.2.1 Previous Study on Air Shaft
(Nugroho et al., 2007) have carried out the preliminary study about thermal comfort in single
storey terraced house in Malaysia context. The findings of the study show that the design of the single
storey house in Malaysia is not effective in providing the thermal comfort through natural ventilation.
In their study, the field measurement to investigate the thermal comfort and thermal performance in
Preprints (www.preprints.org) | NOT PEER-REVIEWED | Posted: 10 September 2020 doi:10.20944/preprints202009.0221.v1
the test room is insufficient to achieve thermal comfort. The single-sided ventilation system in the
test room (master bedroom of the terraced house) reduces the effectiveness of the ventilation in the
room. Furthermore, the paper has stated about the proposed solar chimney to induce natural
ventilation.
The study supports the use of solar chimney as a passive cooling tool which can improve the
indoor thermal condition in hot humid climate. Other than that, (Leng et al., 2015; Punyasompun.S et
al., 2009; Tan and Wong, 2012) support the application of solar chimney in tropical climate. The
findings show that the application of ventilation shaft in buildings could enhance the natural
ventilation. (Agung Murti Nugroho and Ahmad, 2014) have carried out an experimental study on a
single storey terraced house in Malang, Indonesia with solar chimney cum vertical landscape. The
findings show that the mean air temperature of the indoor environment is within the acceptable
comfort range. The combination of both solar chimney and vertical landscape could reduce the use
of mechanical ventilation system in domestic buildings, as well as provide natural passive cooling
effect to the indoor environment.
There are plenty of ways to resolve the problem of thermal comfort in terraced houses. One of
the practical ways to generate natural ventilation in terraced houses is modified air well to solar
chimney (Nugroho, 2007b). In hot humid climate, solar chimney can function as both thermal comfort
and natural daylight tool for the terraced house. Hence, the following sections would further explore
the possibilities of using the solar chimney for ventilation and also the variables in order to improve
the thermal and ventilation performance in Malaysian terraced houses.
The solar chimney (SC) concept has been one of the widely applied natural ventilation tool for
several decades, especially in domestic buildings. The function of solar chimney has been applied to
buildings in order to induce the air movement via air pressure and air temperature gradient from the
inlet of building and pass through the occupied zone. The cool air replaced the hot air via air
convection and the hot air is released through the solar chimney outlet due to the temperature
differences (Punyasompun.S et al., 2009). The basic solar chimney composed of glass, enclosed
extruded concrete wall, absorber and air gap. The concept of applying the solar heat gain to generate
passive cooling has been getting more attention by designers and researchers, especially in the hot
climate regions. There are various literature and research efforts published in order to refine solar
chimney and specify for each of the climatic condition, the building type, as well as the controlling
factors such as inlet and outlet configurations, materials, room depth, forms and so forth.
Wei et al. (2011) have carried out a series of connected solar chimney on roof with inclination
angle as well as a vertical section facing south wall. In the findings, the researchers stated that the
optimal ratio of length to width was found to be 12:1 while the optimal inclination angle to be 4° via
mathematical modelling. In another case, Amori and Mohammed (2012) have studied the effects of
integrating the phase change material (paraffin) with solar chimney on its thermal behaviour.
Computational Fluid Dynamic (CFD) analysis was used to predict the thermal performance as well
as the two-dimensional fluid flow. The findings show that the phase change material extended the
ventilation hours during night time by discharging the storage energy from 13:00hr to 22:00hr for 9
hours. N.K.Bansal et al. (1993) have developed a numerical model for solar chimney in order to
enhance the effect of thermally induced ventilation in buildings. Sizes of the openings of solar
chimney and the values of the discharge coefficient were chosen as the variables of the experiment.
The findings show that air velocity of 140 mᶟ/hr to 330mᶟ/hr were induced by solar radiation of
200W/m² and 1000W/m² respectively with 2.25m² solar collector areas in the solar chimney.
Kasaeian et al. (2014b) have constructed a fundamental numerical model for solar chimney in
Tehran. The results findings show that the optimum solar chimney configuration for Tehran should
be as follow: collector inlet of 6cm, solar chimney height of 3m, and solar chimney diameter of 10cm
where the velocity of air could speed up to 4 to 25% in different cases. The solar chimney height
and diameter are critical physical variables to determine the efficiency of solar chimney. Mathur et
al. (2006b) have investigated the effects of solar chimney’s depth and the inlet height on air change
Preprints (www.preprints.org) | NOT PEER-REVIEWED | Posted: 10 September 2020 doi:10.20944/preprints202009.0221.v1
rate. The results show that the air change rate increased with the depth of solar chimney, and is in
direct proportion to the solar irradiance. Chungloo and Limmeechokchai (2007) have investigated
the timber structure room. The research study examined the solar chimney effect as well as wetted
roof. Results show that the timber material caused the room temperature to drop by 1.0 to 1.3°C
during hot afternoons.
3. Methodology
The analyzed measured data for this paper was taken at year 2013 to 2014. However, regardless
of the time of measurement, the significance of the data is to evaluate the effectiveness of the air well
in terraced housing as thermal performance moderating tool. Furthermore, the measured data is
valid as the deviation range of the air temperature is insignificant and consistent. Literature has
supported the fact that very slight change in variation of average air temperature throughout 10 years
in Kuching with increment of 0.39°C from 2005 to 2015 (Rostam Afshar, 2018). It is also clear that
through the 30 years (2005-2040) forecasts study, the air temperature rises linearly within the range
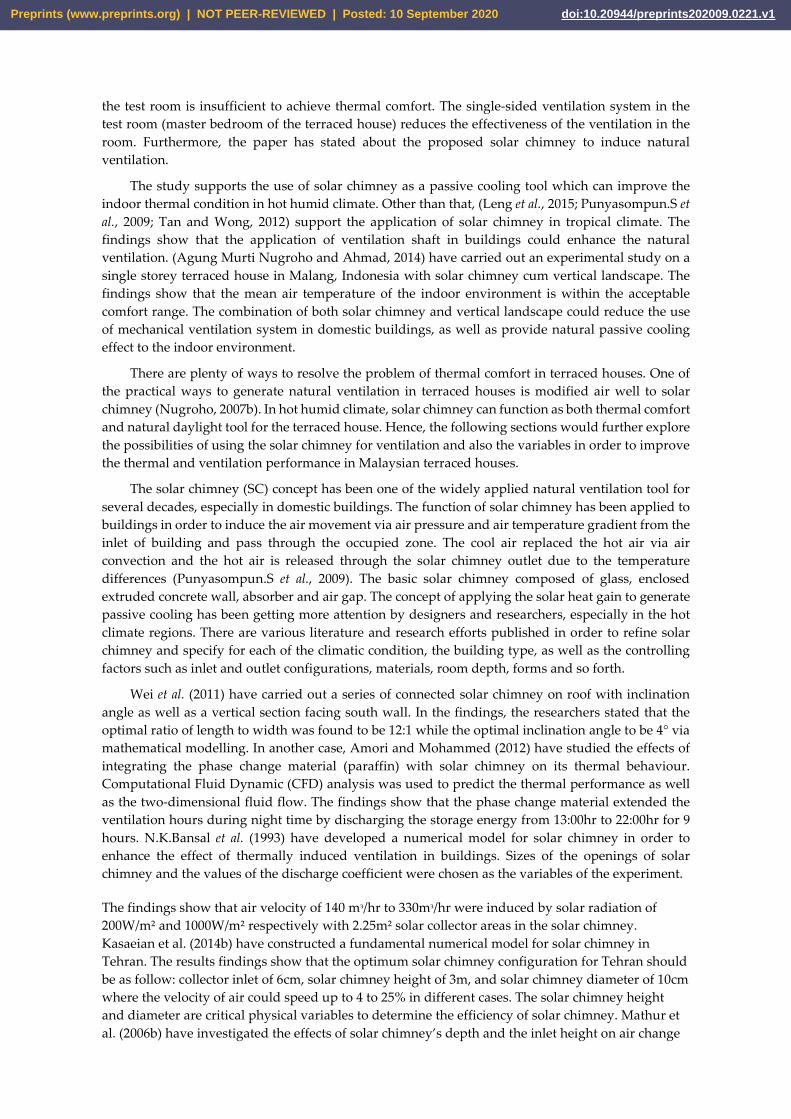
of 26°C to 28.5°C. According to the ten years’ climatic data of Kuching, Sarawak from 2006 to 2019
recorded by Malaysia Meteorological Centre, the average annual outdoor air temperature ranged
from 26.2°C to 27.3°C while the annual mean maximum air temperature ranged from 31.3°C to
32.5°C. In the other hand, the annual mean minimum air temperature ranged from 22.9°C to 23.8°C
while the average wind speed ranged from 5.9m/s to 7m/s. The deviation of the maximum and
minimum for the average annual temperature from 2006 to 2019 is 4.03°C while the deviation of the
max and min for the annual average max temperature throughout the years is 3.69°C (as shown in
Figure 4)
Figure 4. The historical data on annual average outdoor air temperature and wind speed in Kuching
from 2006 to 2019
3.1 Climate Condition of Malaysia
Malaysia, one of the South-East Asian countries, is located in a tropical region close to the
equator. In geographical aspect, it consists of two distinct regions separated by the South China Sea.
The coordinate of the country lies between 1° and 7° of North latitude, and 100° to 119° East longitude.
5.4
5.6
5.8
6
6.2
6.4
6.6
6.8
7
0
5
10
15
20
25
30
35
2006 2007 2008 2009 2010 2011 2012 2013 2014 2015 2016 2017 2018 2019
An
nu
al A
vera
ge W
ind
Sp
eed
(m
/s)
An
nu
al A
vera
ge O
utd
oo
r A
ir T
emp
erat
ure
(°C
)
Year
Kuching: Historical Average Outdoor Temperature & Wind Speed Data from Year 2006 to 2019
T (Average annual temperature °C) TM (Annual average maximum temperature °C)
Tm (Average annual minimum temperature °C) V (Annual average wind speed m/s)
Preprints (www.preprints.org) | NOT PEER-REVIEWED | Posted: 10 September 2020 doi:10.20944/preprints202009.0221.v1
As a tropical climate country, high temperatures and relative humidity with light and variable wind
conditions, as well as long hours of sunshine throughout the year with heavy rainfall, and overcast
sky along the year, have become the characteristics of Malaysia climate (Bakar, 2002; Makaremi et al.,
2012). This section reviews Malaysia climatic condition prior to the climatic analysis of this case study.
3.2 Analysis of Climatic Data at Kuching, Sarawak, East Malaysia
Kuching is the capital city of Sarawak, located at the south of Sarawak state, East Malaysia. The
data set analysis of this section is based on the measurement from Kuching meteorological station
with the coordinates of 1.467° North and 110.317° East located at Kuching Airport, Sarawak. Weather
analytics is a weather data service provider incorporated with the local meteorological centre and the
provided data has been validated (Weather Analytics, 2013).
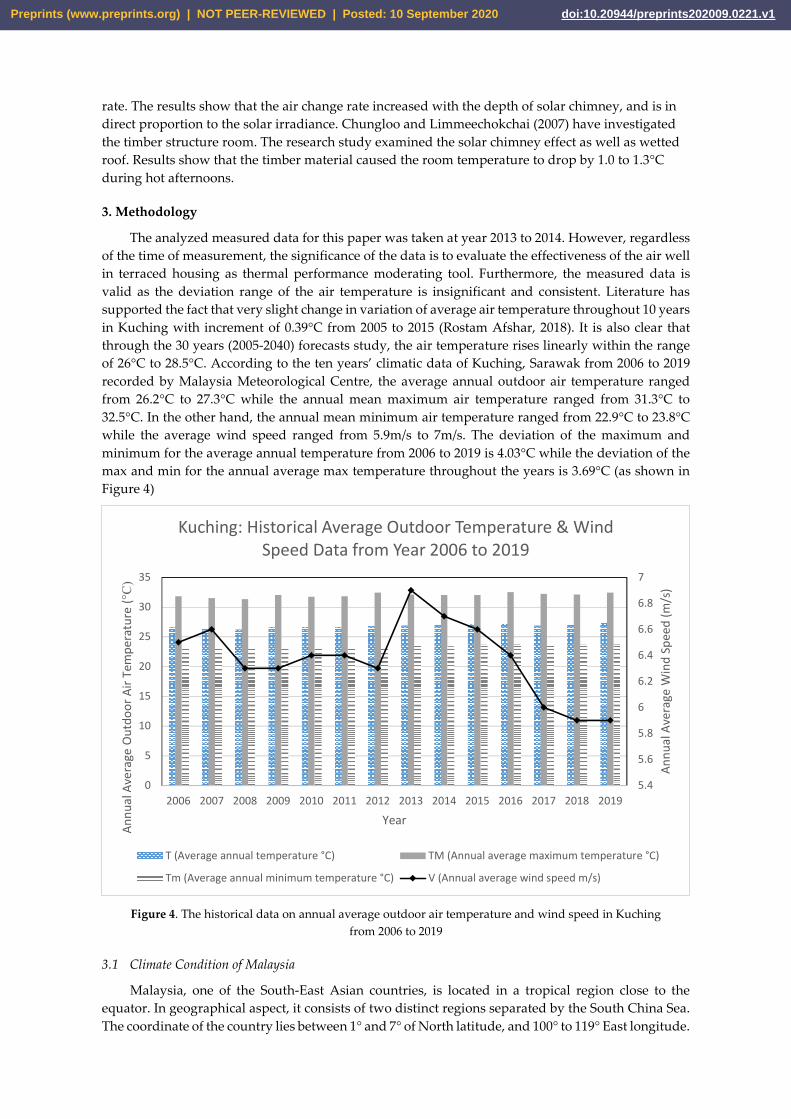
3.2.1 Wind Climate
Figure 5. The frequency of wind direction and monthly mean wind speed of year 2013 in Kuching,
Sarawak. (Source: Kuching Meteorological Station)
Figure 5 shows the frequency of wind direction and monthly mean wind velocity in
Kuching. From the record, the wind velocity falls around 1 m/s most of the time throughout the year
2013 and the prevailing wind direction mostly from south-eastery direction. According to the data
obtained from Malaysia meteorological department, Kuching receives winds from all the directions
in different time of the year. Located at the intermediate location of the Monsoon pathway, Kuching
receives northerly wind that prevails from November to April while the southerly wind prevails from
May to September. Both of the dominant prevailing winds are affected by the Northeast and
Southwest Monsoon season which pass by Malaysia from November to March and May to September
respectively. Figure 6 shows the wind rose for Kuching, Sarawak which indicates the frequency of
the wind direction. From December to end of March, the wind blows from west to north direction
while during April to November, the southerly wind is the most dominant direction which happened
most frequent throughout year 2013.
0
0.5
1
1.5
2
2.5
0
100
200
300
1 2 3 4 5 6 7 8 9 10 11 12
MONTH
WIN
D S
PEE
D (
M/S
)
WIN
D D
IREC
TIO
N (
°)
Kuching: Monthly Mean Wind Direction (°) and Wind Speed (m/s) year 2013
Wind Direction (Monthly Mode) Wind Speed (Average Monthly)
Preprints (www.preprints.org) | NOT PEER-REVIEWED | Posted: 10 September 2020 doi:10.20944/preprints202009.0221.v1

Figure 6. Wind rose in Kuching, Sarawak for year 2013 (Source: Kuching Meteorological Station)
The average monthly wind speed ranged from 0.45m/s to 5.2m/s according to Figure 7 while
average hourly wind speed ranged from 0.98m/s to 2.02m/s (Figure 7). The highest wind speed
occurred in August with the value of 11.3m/s while the lowest is recorded at 0 m/s (measured 12
meters above ground level). From the diagrams above, the wind direction and wind speed fluctuated
throughout the year. The inconsistent wind speed would be one of the factors affecting thermal
comfort of the terraced house occupants. The mean air speed of Northeast Monsoon season was
slightly higher compared to Southwest Monsoon period except August and September. This could
be due to the occasional weather phenomenon. The wind velocity and wind direction study are
important as the average data indicated the overall wind flow in microclimatic context.
Figure 7. Comparison of the monthly wind speed year 2013 (Source: Kuching Meteorological
Station)
3.2.2 Solar Radiation
The monthly solar radiation for Malaysia is approximately around 4.21kWh/m² to 5.56kWh/m²
in total and it increased during the Northeast monsoon season and decreased during the Southwest
monsoon season (Mekhilef, 2010; Sarawak Energy, 2013). According to recorded data by Haris (2010)
quoted by Mekhilef (2010), yearly average solar radiation of Kuching is the lowest among other cities
in Malaysia, which is 1470Wh/m² while the highest value recorded as 1900Wh/m² at Kota Kinabalu,
1809Wh/m² at Bayan Lepas and 1785Wh/m² at George Town. From Figure 8, the highest average
20200
150
190140
140150
140
150
150
260
0
100
200
300Jan
Feb
Mar
Apr
May
Jun
Jul
Aug
Sep
Oct
Nov
Dec
Kuching: Monthly Frequency of Wind Direction year 2013
Preprints (www.preprints.org) | NOT PEER-REVIEWED | Posted: 10 September 2020 doi:10.20944/preprints202009.0221.v1
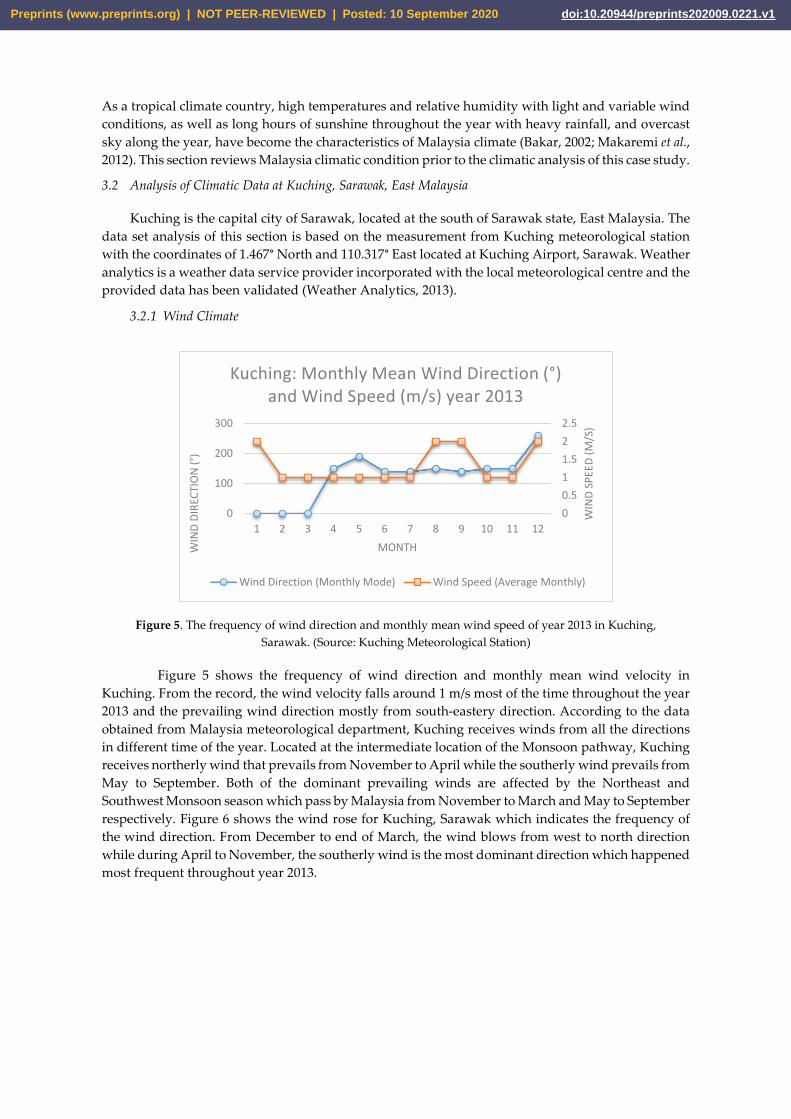
value recorded as 1271.18Wh/m², which happened in June 2013 while the max value of solar radiation
happened in March and April with the value of 2692Wh/m². Compared to the yearly average solar
radiation, the highest mean solar radiation of year 2013 is 13.52% lower.
Figure 8. Comparison of monthly mean and max solar radiation (2013) (Source: Kuching
meteorological station
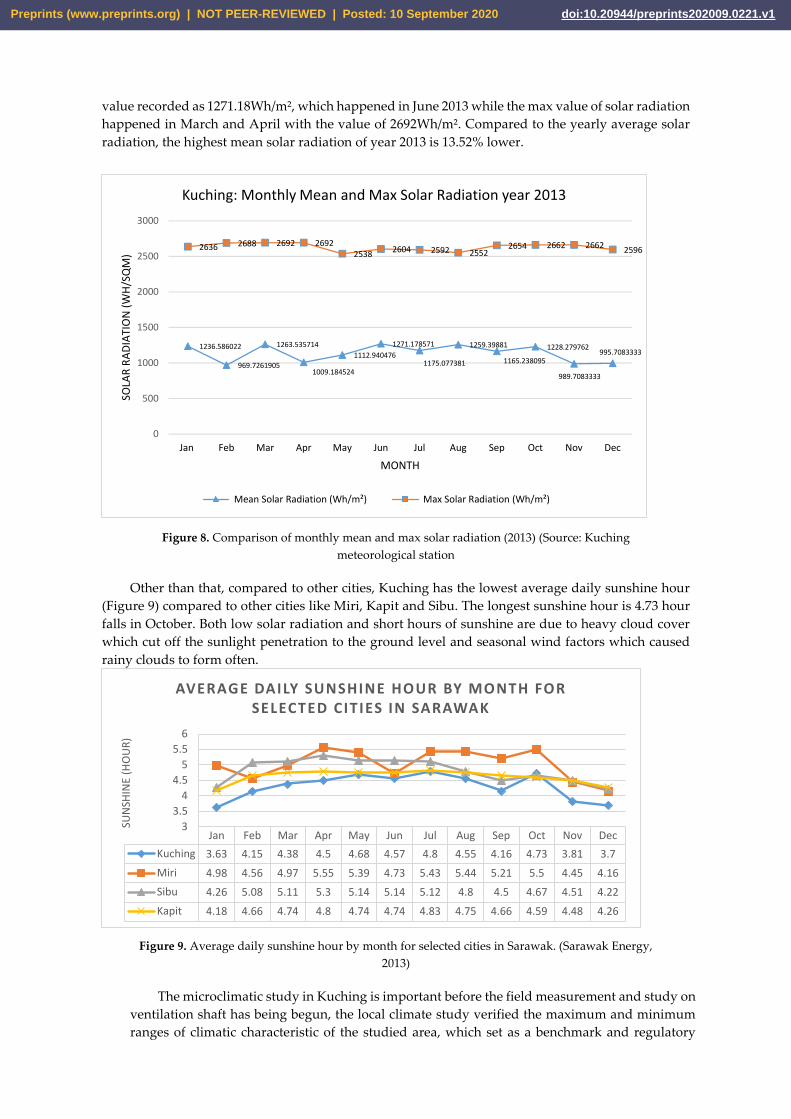
Other than that, compared to other cities, Kuching has the lowest average daily sunshine hour
(Figure 9) compared to other cities like Miri, Kapit and Sibu. The longest sunshine hour is 4.73 hour
falls in October. Both low solar radiation and short hours of sunshine are due to heavy cloud cover
which cut off the sunlight penetration to the ground level and seasonal wind factors which caused
rainy clouds to form often.
Figure 9. Average daily sunshine hour by month for selected cities in Sarawak. (Sarawak Energy,
2013)
The microclimatic study in Kuching is important before the field measurement and study on
ventilation shaft has being begun, the local climate study verified the maximum and minimum
ranges of climatic characteristic of the studied area, which set as a benchmark and regulatory
1236.586022
969.7261905
1263.535714
1009.184524
1112.940476
1271.178571
1175.077381
1259.39881
1165.238095
1228.279762
989.7083333
995.7083333
2636 2688 2692 26922538
2604 2592 25522654 2662 2662
2596
0
500
1000
1500
2000
2500
3000
Jan Feb Mar Apr May Jun Jul Aug Sep Oct Nov Dec
SOLA
R R
AD
IATI
ON
(W
H/S
QM
)
MONTH
Kuching: Monthly Mean and Max Solar Radiation year 2013
Mean Solar Radiation (Wh/m²) Max Solar Radiation (Wh/m²)
Jan Feb Mar Apr May Jun Jul Aug Sep Oct Nov Dec
Kuching 3.63 4.15 4.38 4.5 4.68 4.57 4.8 4.55 4.16 4.73 3.81 3.7
Miri 4.98 4.56 4.97 5.55 5.39 4.73 5.43 5.44 5.21 5.5 4.45 4.16
Sibu 4.26 5.08 5.11 5.3 5.14 5.14 5.12 4.8 4.5 4.67 4.51 4.22
Kapit 4.18 4.66 4.74 4.8 4.74 4.74 4.83 4.75 4.66 4.59 4.48 4.26
3
3.5
4
4.5
5
5.5
6
SUN
SHIN
E (H
OU
R)
AVERAGE DAILY SUNSHINE HOUR BY MONTH FOR SELECTED CIT IES IN SARAWAK
Preprints (www.preprints.org) | NOT PEER-REVIEWED | Posted: 10 September 2020 doi:10.20944/preprints202009.0221.v1

range for the output of the air well study. Comparative analysis for the field measurement and
microclimatic data determines the thermal performance of the indoor environment of case study
building.
3.2. Selection of Case Study House
In order to study the thermal performance of single storey terraced house, a case study house
with air well has been selected. The selection of the terraced house type is based on the classification
data of terraced house. Classification of terraced house types in Malaysia was sorted as shown in
Figure 10 (Toe, 2008). The sample of the classified terraced houses in Malaysia ranged from the
earliest modern terraced houses to the new terraced houses of 2012-2016. Out of 219 floor plans, 1%
of the designs are from the 1960s, 21% are from the 1970s, 8% are from the 1980s, 17% are from the
1990s and 53% of the designs are from the year 2000 onwards. The classification was focused on the
internal layout and total floor area (gross floor area) of collected floor plans. Figure 10 shows the four
types of single storey terraced houses and five types of double story terraced houses layout plan and
its classification (Toe, 2008) . From the classification chart (Figure 10), the case study house in this
research study was classified as typical layout group with total floor area ranging from 85-90m². Thus,
the selected terraced house could represent the typical unit in Malaysia as a case study building for
stack ventilation study in a typical single storey terraced house (Leng Pau Chung, 2016).
Figure 10. Classification of typical Malaysian terraced houses by internal layout (Toe, 2008)
3.2. Selection of Case Study House
Preprints (www.preprints.org) | NOT PEER-REVIEWED | Posted: 10 September 2020 doi:10.20944/preprints202009.0221.v1
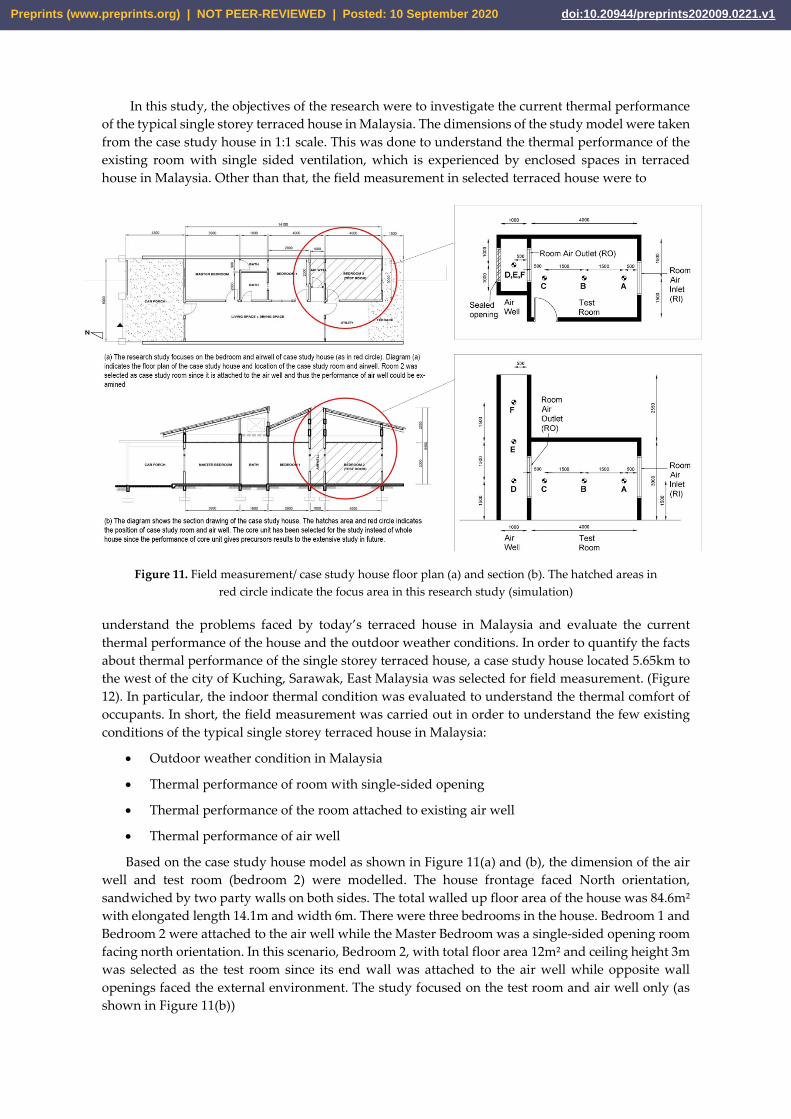
In this study, the objectives of the research were to investigate the current thermal performance
of the typical single storey terraced house in Malaysia. The dimensions of the study model were taken
from the case study house in 1:1 scale. This was done to understand the thermal performance of the
existing room with single sided ventilation, which is experienced by enclosed spaces in terraced
house in Malaysia. Other than that, the field measurement in selected terraced house were to
Figure 11. Field measurement/ case study house floor plan (a) and section (b). The hatched areas in
red circle indicate the focus area in this research study (simulation)
understand the problems faced by today’s terraced house in Malaysia and evaluate the current
thermal performance of the house and the outdoor weather conditions. In order to quantify the facts
about thermal performance of the single storey terraced house, a case study house located 5.65km to
the west of the city of Kuching, Sarawak, East Malaysia was selected for field measurement. (Figure
12). In particular, the indoor thermal condition was evaluated to understand the thermal comfort of
occupants. In short, the field measurement was carried out in order to understand the few existing
conditions of the typical single storey terraced house in Malaysia:
Outdoor weather condition in Malaysia
Thermal performance of room with single-sided opening
Thermal performance of the room attached to existing air well
Thermal performance of air well
Based on the case study house model as shown in Figure 11(a) and (b), the dimension of the air
well and test room (bedroom 2) were modelled. The house frontage faced North orientation,
sandwiched by two party walls on both sides. The total walled up floor area of the house was 84.6m²
with elongated length 14.1m and width 6m. There were three bedrooms in the house. Bedroom 1 and
Bedroom 2 were attached to the air well while the Master Bedroom was a single-sided opening room
facing north orientation. In this scenario, Bedroom 2, with total floor area 12m² and ceiling height 3m
was selected as the test room since its end wall was attached to the air well while opposite wall
openings faced the external environment. The study focused on the test room and air well only (as
shown in Figure 11(b))
Preprints (www.preprints.org) | NOT PEER-REVIEWED | Posted: 10 September 2020 doi:10.20944/preprints202009.0221.v1
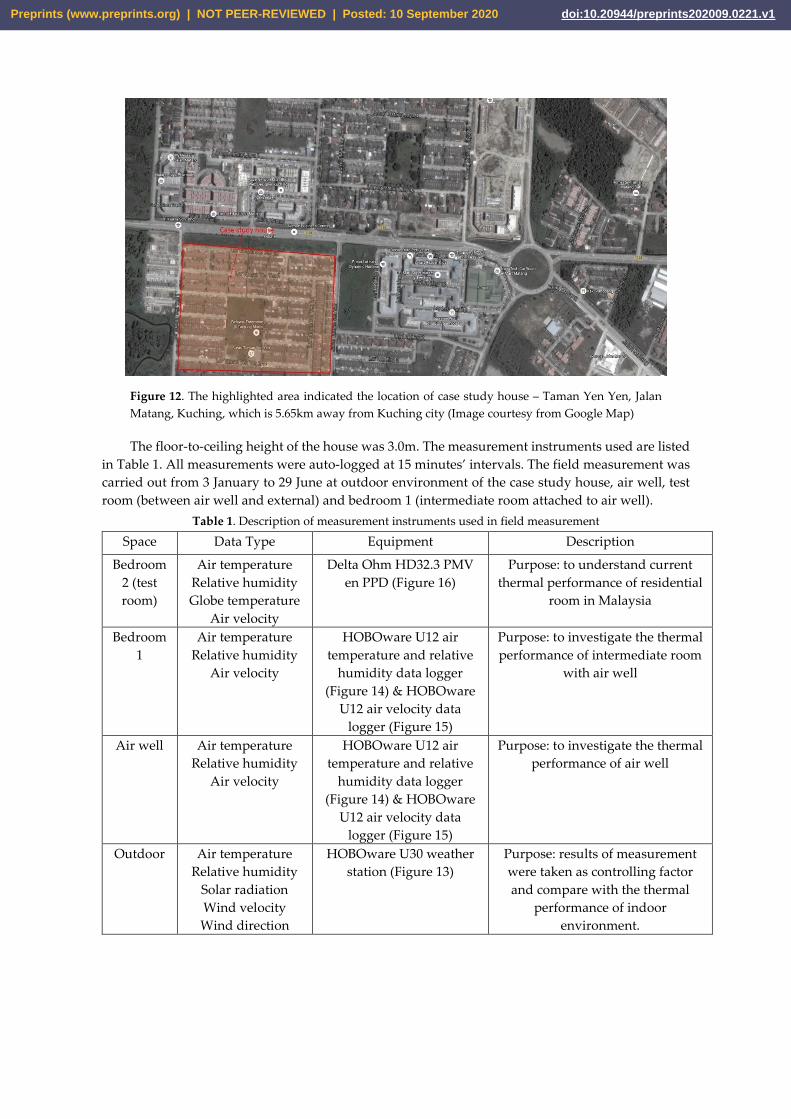
Figure 12. The highlighted area indicated the location of case study house – Taman Yen Yen, Jalan
Matang, Kuching, which is 5.65km away from Kuching city (Image courtesy from Google Map)
The floor-to-ceiling height of the house was 3.0m. The measurement instruments used are listed
in Table 1. All measurements were auto-logged at 15 minutes’ intervals. The field measurement was
carried out from 3 January to 29 June at outdoor environment of the case study house, air well, test
room (between air well and external) and bedroom 1 (intermediate room attached to air well).
Table 1. Description of measurement instruments used in field measurement
Space Data Type Equipment Description
Bedroom
2 (test
room)
Air temperature
Relative humidity
Globe temperature
Air velocity
Delta Ohm HD32.3 PMV
en PPD (Figure 16)
Purpose: to understand current
thermal performance of residential
room in Malaysia
Bedroom
1
Air temperature
Relative humidity
Air velocity
HOBOware U12 air
temperature and relative
humidity data logger
(Figure 14) & HOBOware
U12 air velocity data
logger (Figure 15)
Purpose: to investigate the thermal
performance of intermediate room
with air well
Air well Air temperature
Relative humidity
Air velocity
HOBOware U12 air
temperature and relative
humidity data logger
(Figure 14) & HOBOware
U12 air velocity data
logger (Figure 15)
Purpose: to investigate the thermal
performance of air well
Outdoor Air temperature
Relative humidity
Solar radiation
Wind velocity
Wind direction
HOBOware U30 weather
station (Figure 13)
Purpose: results of measurement
were taken as controlling factor
and compare with the thermal
performance of indoor
environment.
Preprints (www.preprints.org) | NOT PEER-REVIEWED | Posted: 10 September 2020 doi:10.20944/preprints202009.0221.v1
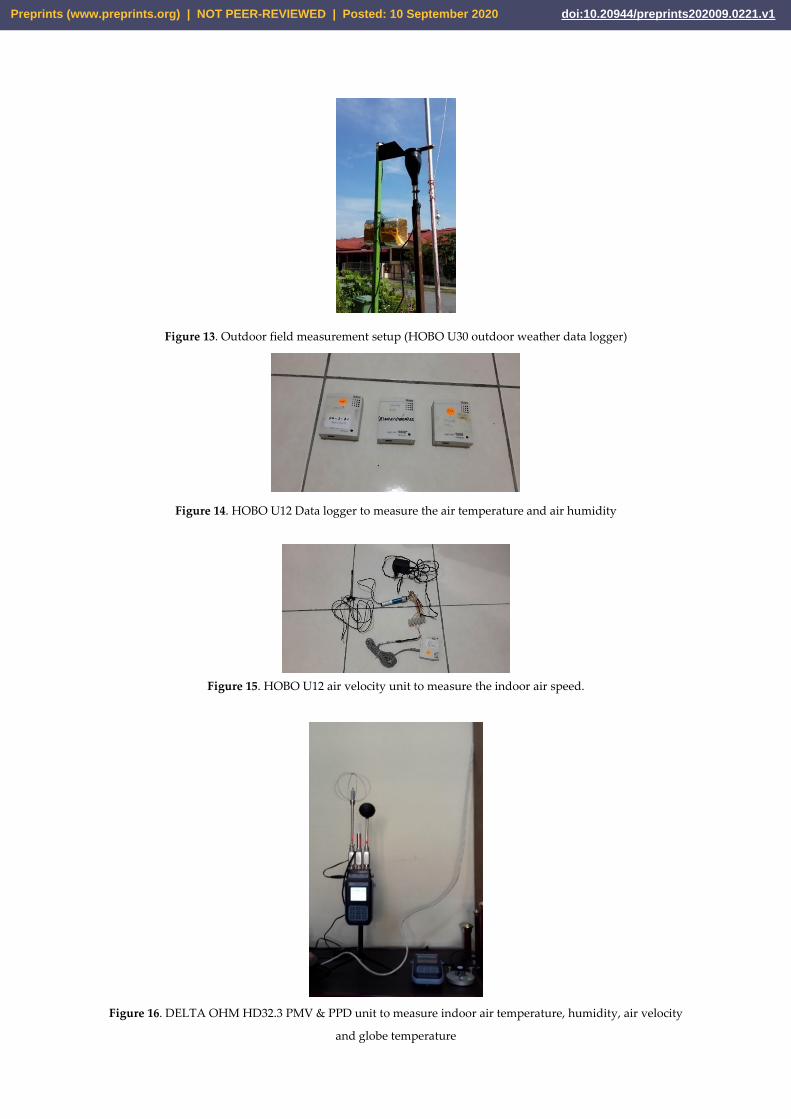
Figure 13. Outdoor field measurement setup (HOBO U30 outdoor weather data logger)
Figure 14. HOBO U12 Data logger to measure the air temperature and air humidity
Figure 15. HOBO U12 air velocity unit to measure the indoor air speed.
Figure 16. DELTA OHM HD32.3 PMV & PPD unit to measure indoor air temperature, humidity, air velocity
and globe temperature
Preprints (www.preprints.org) | NOT PEER-REVIEWED | Posted: 10 September 2020 doi:10.20944/preprints202009.0221.v1
4. Results and Findings
4.1 Performance of Typical Single Storey Terraced House in Malaysia: Field Measurement at Case Study
House in Kuching, Sarawak
The field measurement was carried out from 3 January to 29 June (178 days) at a single storey
terraced house in Kuching, Sarawak, Malaysia. A 3m x 3m bedroom with external window and
opposite wall attached to an air well was installed with experimental instruments. The measured
data including air temperature, air humidity, indoor air velocity, and radiant heat temperature.
However, the focus parameters in this research are air temperature and indoor air velocity. This
section will discuss about the overall field measurement results (measured outdoor macroclimatic
data, test room field measurement results, and existing air well air temperature) and followed by
results of selected days (hottest and coldest days throughout the measurement period).
4.1.1 Selected hot days (10 to 24 June 2014) [>27.88°C]
Selected hot days throughout the measurement period were chosen based on the max mean air
temperature. According to the data, 10 to 24 June 2014 marked the hottest week throughout the 2nd
quarter of 2014. The average air temperature was 27.88ºC hence the selected week is above average
air temperature throughout the field measurement. The hot days happened from May to June, which
was around South West Monsoon season. The hottest air temperature obtained throughout the field
measurement was 42.99ºC on 19 June at 17:00. The mean air temperature for the selected days ranged
from 27.81ºC on 13 June to 33.55ºC on 19 June 2014. The average deviation of the mean air
temperature from field measurement and meteorological data for the selected days is 2.074ºC.
According to the meteorological data and measured data during the hot period (10 June to 24
June 2014), the minimum temperature difference was 0.51ºC on 13 June 2014 while the maximum
temperature deviation was 3.14ºC on 19 June 2014. The minimum difference of 1.84% and maximum
difference of 9.35% between both measured and meteorological data shows the differences are
insignificant for extreme hot days. On the other hand, the average relative humidity for the selected
hot period was marked as 91.41%. The relative humidity was inversely proportional to the air
temperature. The highest mean air temperature day (19 June 2014) was recorded as the lowest mean
relative humidity day with the value of 66.24% while the lowest mean air temperature day (13 June
2014) was marked as the highest mean relative humidity day with the value of 86.34% throughout
the selected hot period. In order to understand the temperature variation of hot day, 19 June 2014 is
selected to be analyzed.
Preprints (www.preprints.org) | NOT PEER-REVIEWED | Posted: 10 September 2020 doi:10.20944/preprints202009.0221.v1
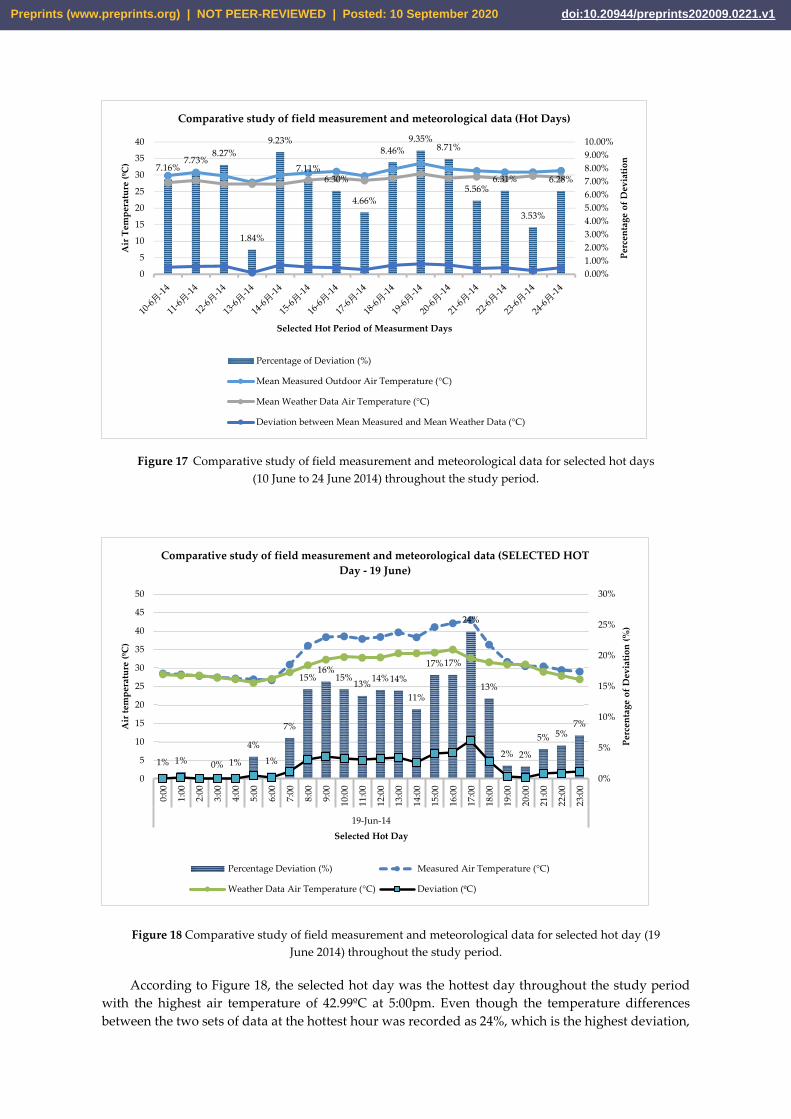
Figure 17 Comparative study of field measurement and meteorological data for selected hot days
(10 June to 24 June 2014) throughout the study period.
Figure 18 Comparative study of field measurement and meteorological data for selected hot day (19
June 2014) throughout the study period.
According to Figure 18, the selected hot day was the hottest day throughout the study period
with the highest air temperature of 42.99ºC at 5:00pm. Even though the temperature differences
between the two sets of data at the hottest hour was recorded as 24%, which is the highest deviation,
7.16%7.73%
8.27%
1.84%
9.23%
7.11%6.30%
4.66%
8.46%
9.35%8.71%
5.56%6.31%
3.53%
6.28%
0.00%
1.00%
2.00%
3.00%
4.00%
5.00%
6.00%
7.00%
8.00%
9.00%
10.00%
0
5
10
15
20
25
30
35
40
Selected Hot Period of Measurment Days
Per
cen
tag
e o
f D
evia
tio
n
Air
Tem
per
atu
re (
ºC)
Comparative study of field measurement and meteorological data (Hot Days)
Percentage of Deviation (%)
Mean Measured Outdoor Air Temperature (°C)
Mean Weather Data Air Temperature (°C)
Deviation between Mean Measured and Mean Weather Data (°C)
1% 1% 0% 1%
4%
1%
7%
15%16%
15%13%
14% 14%
11%
17%17%
24%
13%
2% 2%
5% 5%7%
0%
5%
10%
15%
20%
25%
30%
0
5
10
15
20
25
30
35
40
45
50
0:0
0
1:0
0
2:0
0
3:0
0
4:0
0
5:0
0
6:0
0
7:0
0
8:0
0
9:0
0
10:0
0
11:0
0
12:0
0
13:0
0
14:0
0
15:0
0
16:0
0
17:0
0
18:0
0
19:0
0
20:0
0
21:0
0
22:0
0
23:0
0
19-Jun-14
Selected Hot Day
Pe
rce
nta
ge
of
Dev
iati
on
(%
)
Air
te
mp
erat
ure
(ºC
)
Comparative study of field measurement and meteorological data (SELECTED HOT
Day - 19 June)
Percentage Deviation (%) Measured Air Temperature (°C)
Weather Data Air Temperature (°C) Deviation (ºC)
Preprints (www.preprints.org) | NOT PEER-REVIEWED | Posted: 10 September 2020 doi:10.20944/preprints202009.0221.v1
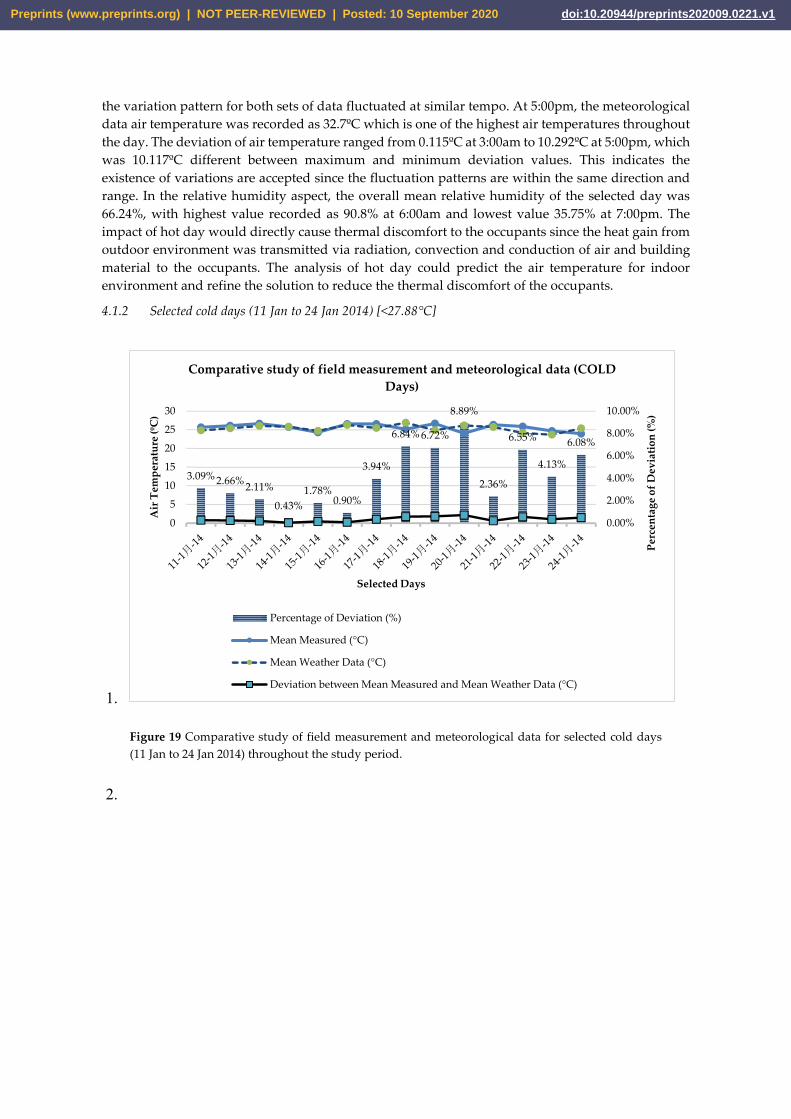
the variation pattern for both sets of data fluctuated at similar tempo. At 5:00pm, the meteorological
data air temperature was recorded as 32.7ºC which is one of the highest air temperatures throughout
the day. The deviation of air temperature ranged from 0.115ºC at 3:00am to 10.292ºC at 5:00pm, which
was 10.117ºC different between maximum and minimum deviation values. This indicates the
existence of variations are accepted since the fluctuation patterns are within the same direction and
range. In the relative humidity aspect, the overall mean relative humidity of the selected day was
66.24%, with highest value recorded as 90.8% at 6:00am and lowest value 35.75% at 7:00pm. The
impact of hot day would directly cause thermal discomfort to the occupants since the heat gain from
outdoor environment was transmitted via radiation, convection and conduction of air and building
material to the occupants. The analysis of hot day could predict the air temperature for indoor
environment and refine the solution to reduce the thermal discomfort of the occupants.
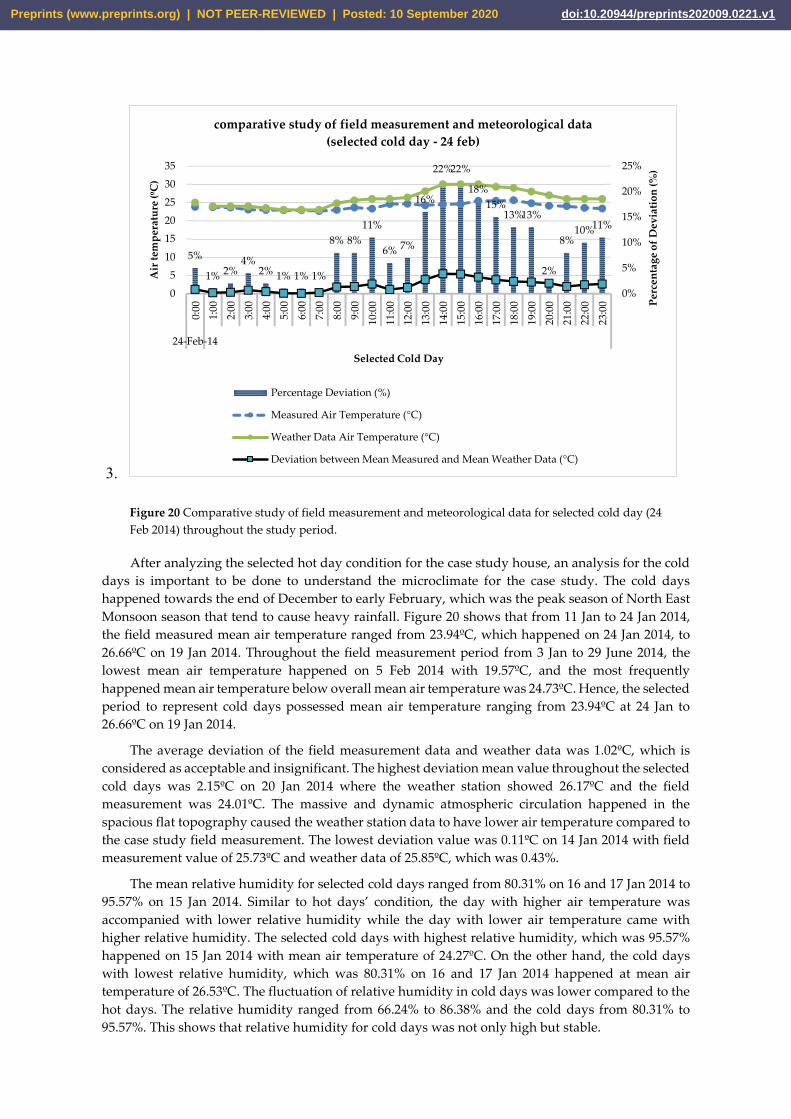
4.1.2 Selected cold days (11 Jan to 24 Jan 2014) [<27.88°C]
1.
Figure 19 Comparative study of field measurement and meteorological data for selected cold days
(11 Jan to 24 Jan 2014) throughout the study period.
2.
3.09% 2.66%2.11%
0.43%
1.78%0.90%
3.94%
6.84% 6.72%
8.89%
2.36%
6.55%
4.13%
6.08%
0.00%
2.00%
4.00%
6.00%
8.00%
10.00%
0
5
10
15
20
25
30
Selected Days
Pe
rce
nta
ge
of
De
via
tio
n (
%)
Air
Te
mp
erat
ure
(ºC
)
Comparative study of field measurement and meteorological data (COLD
Days)
Percentage of Deviation (%)
Mean Measured (°C)
Mean Weather Data (°C)
Deviation between Mean Measured and Mean Weather Data (°C)
Preprints (www.preprints.org) | NOT PEER-REVIEWED | Posted: 10 September 2020 doi:10.20944/preprints202009.0221.v1
3.
Figure 20 Comparative study of field measurement and meteorological data for selected cold day (24
Feb 2014) throughout the study period.
After analyzing the selected hot day condition for the case study house, an analysis for the cold
days is important to be done to understand the microclimate for the case study. The cold days
happened towards the end of December to early February, which was the peak season of North East
Monsoon season that tend to cause heavy rainfall. Figure 20 shows that from 11 Jan to 24 Jan 2014,
the field measured mean air temperature ranged from 23.94ºC, which happened on 24 Jan 2014, to
26.66ºC on 19 Jan 2014. Throughout the field measurement period from 3 Jan to 29 June 2014, the
lowest mean air temperature happened on 5 Feb 2014 with 19.57ºC, and the most frequently
happened mean air temperature below overall mean air temperature was 24.73ºC. Hence, the selected
period to represent cold days possessed mean air temperature ranging from 23.94ºC at 24 Jan to
26.66ºC on 19 Jan 2014.
The average deviation of the field measurement data and weather data was 1.02ºC, which is
considered as acceptable and insignificant. The highest deviation mean value throughout the selected
cold days was 2.15ºC on 20 Jan 2014 where the weather station showed 26.17ºC and the field
measurement was 24.01ºC. The massive and dynamic atmospheric circulation happened in the
spacious flat topography caused the weather station data to have lower air temperature compared to
the case study field measurement. The lowest deviation value was 0.11ºC on 14 Jan 2014 with field
measurement value of 25.73ºC and weather data of 25.85ºC, which was 0.43%.
The mean relative humidity for selected cold days ranged from 80.31% on 16 and 17 Jan 2014 to
95.57% on 15 Jan 2014. Similar to hot days’ condition, the day with higher air temperature was
accompanied with lower relative humidity while the day with lower air temperature came with
higher relative humidity. The selected cold days with highest relative humidity, which was 95.57%
happened on 15 Jan 2014 with mean air temperature of 24.27ºC. On the other hand, the cold days
with lowest relative humidity, which was 80.31% on 16 and 17 Jan 2014 happened at mean air
temperature of 26.53ºC. The fluctuation of relative humidity in cold days was lower compared to the
hot days. The relative humidity ranged from 66.24% to 86.38% and the cold days from 80.31% to
95.57%. This shows that relative humidity for cold days was not only high but stable.
5%
1% 2%4%
2% 1% 1% 1%
8% 8%
11%
6% 7%
16%
22%22%
18%
15%13%13%
2%
8%10%11%
0%
5%
10%
15%
20%
25%
0
5
10
15
20
25
30
35
0:0
0
1:0
0
2:0
0
3:0
0
4:0
0
5:0
0
6:0
0
7:0
0
8:0
0
9:0
0
10
:00
11
:00
12
:00
13
:00
14
:00
15
:00
16
:00
17
:00
18
:00
19
:00
20
:00
21
:00
22
:00
23
:00
24-Feb-14
Selected Cold Day
Pe
rce
nta
ge
of
De
via
tio
n (
%)
Air
te
mp
era
ture
(ºC
)
comparative study of field measurement and meteorological data
(selected cold day - 24 feb)
Percentage Deviation (%)
Measured Air Temperature (°C)
Weather Data Air Temperature (°C)
Deviation between Mean Measured and Mean Weather Data (°C)
Preprints (www.preprints.org) | NOT PEER-REVIEWED | Posted: 10 September 2020 doi:10.20944/preprints202009.0221.v1
When the study specified selected cold day, as shown in Figure 19, the fluctuation pattern of
the graph shows a more dynamic pattern compared to the selected days graph as shown in Figure
20. Selected cold day is represented by 24 Jan 2014. In general, the measured data were lower than
the weather station air temperature value. The deviation of both set data was 2.21ºC with 8.87%. The
measured mean air temperature ranged from 22.681ºC at 7:00am and 25.635ºC at 6:00pm while the
weather station data air temperature ranged from 23ºC at 5:00am, 6:00am and 7:00am to 30ºC at
2:00pm, 3:00pm and 4:00pm. The data from the weather station was more general compared to the
field measurement data. The percentage differences between both sets of data ranged from 1% to
22%. The deviation gaps were larger when the air temperature got higher, which was in the afternoon.
The field measurement data shows more stable and consistent pattern while the weather station data
possesses more significant fluctuation range. The field measurement data was recorded based on
microclimate condition, since the field measurement instruments were located at human level height.
Furthermore, relative humidity for the cold day recorded was 60.44% at 2:00pm and 95.96% at
7:00am. The relative humidity from 12:00am to 8:00am on 24 Jan 2014 was above 89% but it gradually
dropped after 9:00am till 8:00pm. When night fell, the relative humidity increased from 72.99% at
7:00pm, 78.52% at 8:00pm, 81.34% at 9pm, 82.75% at 10pm and 83.89% at 11pm. Diurnal air
temperature and diurnal relative humidity maintained the high temperature low humidity
relationship even though it was categorised as cold day. The impact of cold day to the indoor
environment was not as critical as hot day since thermal performance of hot days would cause
significant impact on thermal comfort of occupants in the tropics.
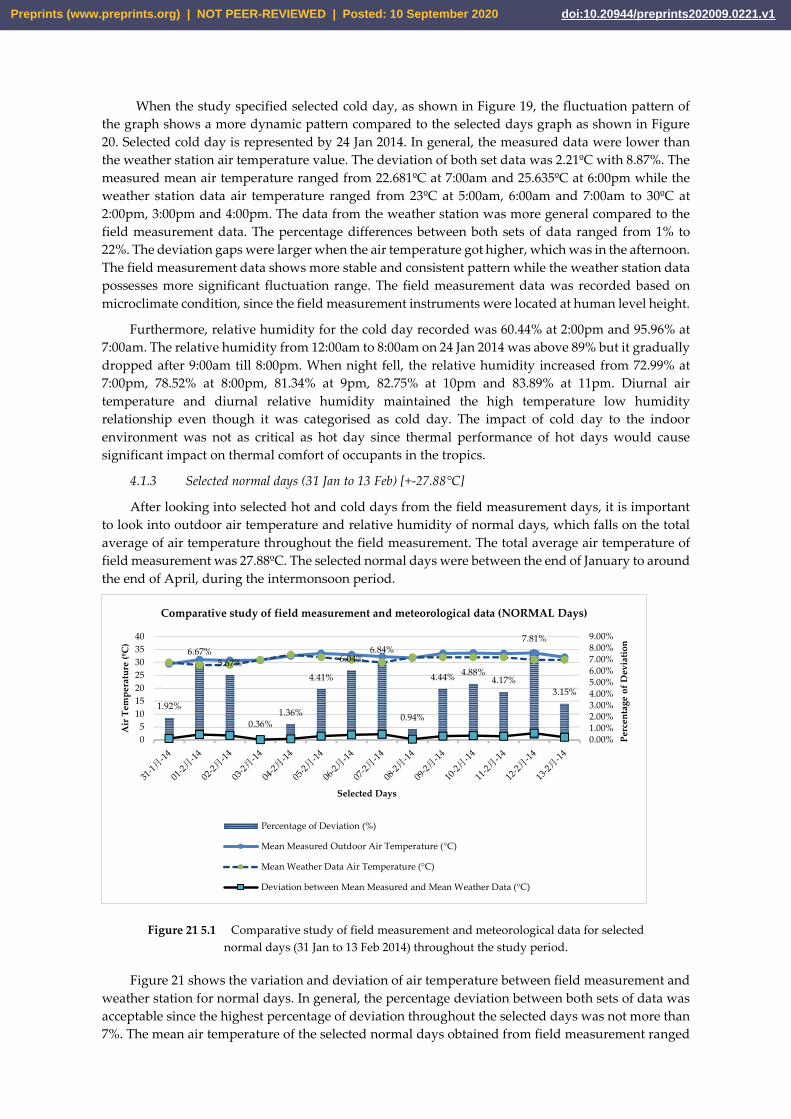
4.1.3 Selected normal days (31 Jan to 13 Feb) [+-27.88°C]
After looking into selected hot and cold days from the field measurement days, it is important
to look into outdoor air temperature and relative humidity of normal days, which falls on the total
average of air temperature throughout the field measurement. The total average air temperature of
field measurement was 27.88ºC. The selected normal days were between the end of January to around
the end of April, during the intermonsoon period.
Figure 21 5.1 Comparative study of field measurement and meteorological data for selected
normal days (31 Jan to 13 Feb 2014) throughout the study period.
Figure 21 shows the variation and deviation of air temperature between field measurement and
weather station for normal days. In general, the percentage deviation between both sets of data was
acceptable since the highest percentage of deviation throughout the selected days was not more than
7%. The mean air temperature of the selected normal days obtained from field measurement ranged
1.92%
6.67%5.67%
0.36%1.36%
4.41%
6.04%6.84%
0.94%
4.44%4.88%
4.17%
7.81%
3.15%
0.00%1.00%2.00%3.00%4.00%5.00%6.00%7.00%8.00%9.00%
0
5
10
15
20
25
30
35
40
Selected Days
Pe
rce
nta
ge
of
Dev
iati
on
Air
Tem
per
atu
re (
ºC)
Comparative study of field measurement and meteorological data (NORMAL Days)
Percentage of Deviation (%)
Mean Measured Outdoor Air Temperature (°C)
Mean Weather Data Air Temperature (°C)
Deviation between Mean Measured and Mean Weather Data (°C)
Preprints (www.preprints.org) | NOT PEER-REVIEWED | Posted: 10 September 2020 doi:10.20944/preprints202009.0221.v1
from 25.34ºC on 31 Jan to 28.53ºC on 12 Feb 2014 while the data from the meteorological centre ranged
from 25.38ºC to 28.04ºC on 3 February and 11 February 2014 respectively. The average deviation for
both sets of data was 0.64ºC, which was not significant and acceptable. During the normal days, the
highest deviation percentage between both sets of data was found on 13 Feb 2014 with deviation of
6.36% while the closest value was found on 4 Feb 2014 with deviation of 0.03%. However, the highest
percentage of deviation on 13 Feb was only 1.67ºC while the lowest percentage deviation was 0.007ºC
on 4 Feb 2014. It can be inferred that the measured data is reliable and similar to the weather station
data.
For the relative humidity, the highest relative humidity and lowest relative humidity value were
81.53% and 67.28% respectively. The highest relative humidity happened on 31 Jan while the lowest
on 5 Feb 2014. The average relative humidity from 31 Jan to 13 Feb was recorded as 77.27%. Mean
relative humidity for selected normal days was similar to the range suggested by Malaysia (2013b).
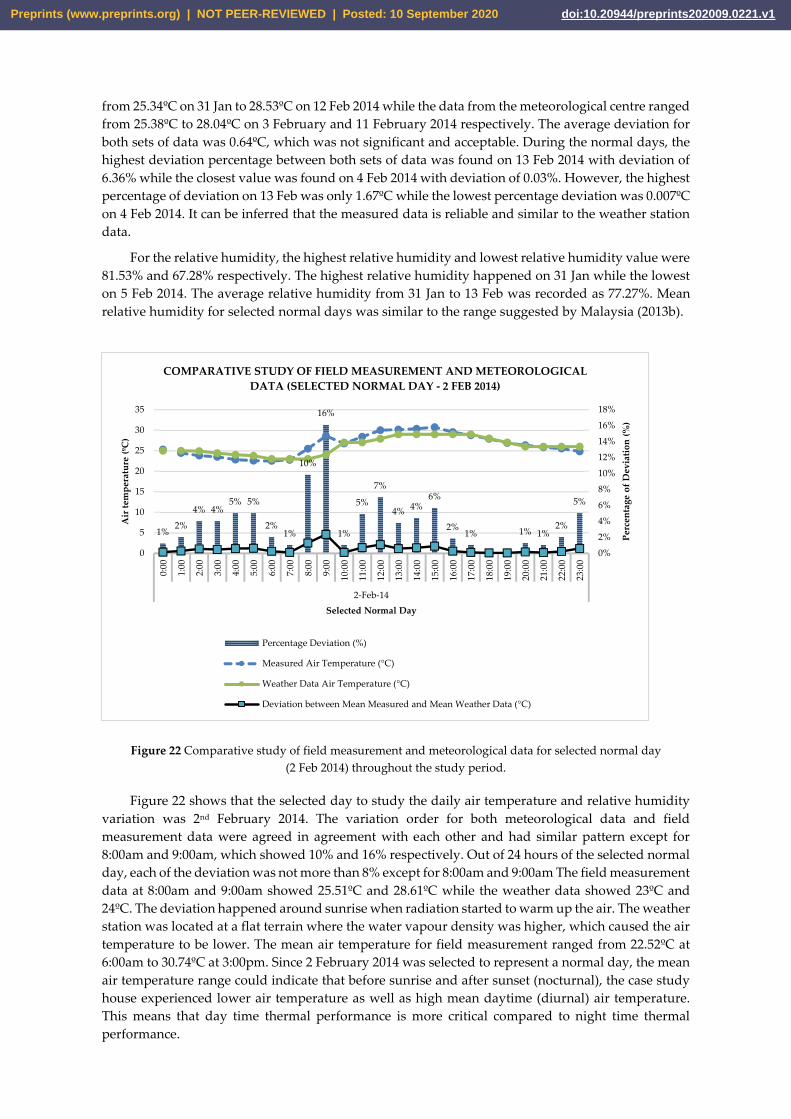
Figure 22 Comparative study of field measurement and meteorological data for selected normal day
(2 Feb 2014) throughout the study period.
Figure 22 shows that the selected day to study the daily air temperature and relative humidity
variation was 2nd February 2014. The variation order for both meteorological data and field
measurement data were agreed in agreement with each other and had similar pattern except for
8:00am and 9:00am, which showed 10% and 16% respectively. Out of 24 hours of the selected normal
day, each of the deviation was not more than 8% except for 8:00am and 9:00am The field measurement
data at 8:00am and 9:00am showed 25.51ºC and 28.61ºC while the weather data showed 23ºC and
24ºC. The deviation happened around sunrise when radiation started to warm up the air. The weather
station was located at a flat terrain where the water vapour density was higher, which caused the air
temperature to be lower. The mean air temperature for field measurement ranged from 22.52ºC at
6:00am to 30.74ºC at 3:00pm. Since 2 February 2014 was selected to represent a normal day, the mean
air temperature range could indicate that before sunrise and after sunset (nocturnal), the case study
house experienced lower air temperature as well as high mean daytime (diurnal) air temperature.
This means that day time thermal performance is more critical compared to night time thermal
performance.
1%2%
4% 4%5% 5%
2%1%
10%
16%
1%
5%
7%
4%4%
6%
2%1% 1% 1%
2%
5%
0%
2%
4%
6%
8%
10%
12%
14%
16%
18%
0
5
10
15
20
25
30
35
0:00
1:00
2:00
3:00
4:00
5:00
6:00
7:00
8:00
9:00
10:0
0
11:0
0
12:0
0
13:0
0
14:0
0
15:0
0
16:0
0
17:0
0
18:0
0
19:0
0
20:0
0
21:0
0
22:0
0
23:0
0
2-Feb-14
Selected Normal Day
Per
cen
tag
e o
f D
evia
tio
n (
%)
Air
tem
per
atu
re (
ºC)
COMPARATIVE STUDY OF FIELD MEASUREMENT AND METEOROLOGICAL
DATA (SELECTED NORMAL DAY - 2 FEB 2014)
Percentage Deviation (%)
Measured Air Temperature (°C)
Weather Data Air Temperature (°C)
Deviation between Mean Measured and Mean Weather Data (°C)
Preprints (www.preprints.org) | NOT PEER-REVIEWED | Posted: 10 September 2020 doi:10.20944/preprints202009.0221.v1
Relative humidity for normal day could range from 63.24% to 93.18%. The lower relative
humidity happened at the hottest hour which was 3:00pm while the highest relative humidity
happened at one of the coldest hour which was 7:00am. A difference of 29.94% between highest and
lowest air humidity shows that the occupants in tropical climate experience dynamic changes of
thermal comfort within 24 hours, from daytime to night time throughout the year. This demonstrates
that the thermal comfort could be an issue for a free running building especially during day time
since the climate is hot and humid throughout the year.
In the next section, an analysis of outdoor air temperature would be detailed through the
discussion on daily max and daily mean for air temperature, relative humidity, solar radiation, wind
velocity and wind direction.
4.2 Field study results: outdoor climate
This section examines the four different main climatic parameters, namely air temperature, solar
radiation, relative humidity and wind velocity. In this case, daily maximum temperature was selected
to discuss, since the maximum daily air temperature is important as worst case scenario boundary
condition for modelling simulation.
4.2.1 Daily Maximum
Daily maximum of parameters is considered to be more important compared to daily minimum.
Under the hot and humid tropical climate condition, extreme and high air temperature, relative
humidity, solar radiation, high intensity of outdoor wind during certain period of time especially
Monsoon seasons and so forth could directly and indirectly affect the indoor thermal performance.
Hence, this sub-section discusses about the daily max of the following selected parameters.
4.2.1.1 Air temperature
Figure 23 shows the daily maximum for outdoor air temperature throughout the field
measurement days. The maximum air temperature of each day was recorded in order to investigate
the extreme condition of microclimate throughout the field measurement. The overall daily
maximum air temperature ranged from 25.35ºC to 42.99ºC at 20 January and 19 June respectively.
The air temperature difference of 41.11% between maximum and minimum values shows that
microclimate change significantly according to the monsoon seasons. North East monsoon, which
usually happens around January, causes high volume of rainfall and directly lowers the air
temperature. According to McGinley (2011), Sarawak receives minimal rainfall in June and July
annually. Without adequate rainfall, the phenomenon directly causes draught around the coast due
to high intensity of solar radiation and hot air convection. Therefore, June and July are considered as
critical months for thermal comfort. Furthermore, haze pollution which happens from June onwards
would be one of the reasons causing extreme high temperature around mid-year (Roger C Ho et al.,
2014).
Preprints (www.preprints.org) | NOT PEER-REVIEWED | Posted: 10 September 2020 doi:10.20944/preprints202009.0221.v1

Figure 23 Daily max outdoor air temperature throughout the field measurement (3 Jan to 29 June
2014)
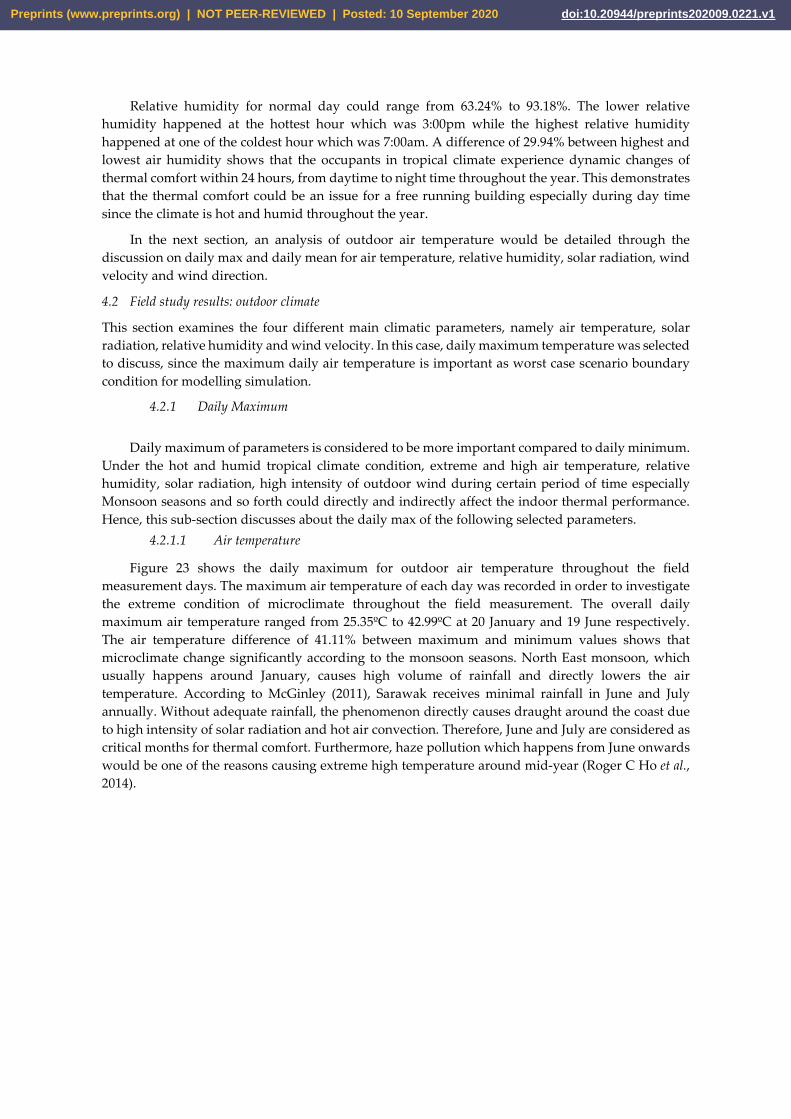
4.2.1.2 Solar Radiation
The daily max of solar radiation for Kuching throughout the field measurement ranged from
86W/m² at 6:00pm on 27 May 2014 to 1022W/m² at 1:00pm on 3 March 2014. The solar radiation
directly influenced the air temperature through conduction and air convection. The air temperature
for the studied day could be deduced from the daily max solar radiation. According to Makowski
(2009), since the solar flux only influences the diurnal daylighting, it affects significantly on daily max
air temperature compared to daily min air temperature while the nocturnal air temperature variation
is affected by thermal radiative exchanges. Night time surface air radiative cooling relies on the
atmosphere capacity to absorb and conduct the thermal radiation towards the earth surface. In this
case, daily max study was significant to understand the effect of diurnal condition especially daily
max air temperature and solar radiation in order to deduce the extreme thermal condition for indoor
environment.
Figure 23 indicates the daily maximum solar radiation throughout the field measurement. In
comparable to Figure 24 the highest daily maximum air temperature was 42.99°C on 19 June while
the highest daily maximum solar radiation was 1022W/m² on 3 Mac 2014. The maximum air
temperature for 3 Mac 2014 was 27.88°C even though it had the highest daily maximum solar
radiation. In general, high solar radiation is accompanied by high air temperature.
This rare case could be due to other factors such as high cloud cover rate, high evaporation rate
on the measuring area, high wind velocity and others. According to Graham (1999), low and thick
cloud (example: stratocumulus) could reduce the earth surface and air temperature since it reflects
the solar radiation while high and thin cloud (example: cirrus cloud) allows direct sunlight to
penetrate through which causes high air temperature. The high and thin clouds also trap heat and
infra-red radiated from earth surface.
Other than that, clear moving air, humidity, and clouds also balance the air temperature on
earth. In order to explain the condition that high solar radiation could slightly increase the air
temperature, three randomly selected days with high solar radiation throughout the field
measurement are discussed briefly. The chosen dates are 5 Mac 2014 with air temperature of 30.91°C
at 1:00pm; 28 April 2014 with air temperature of 36.17°C at 1:00pm and 18 June 2014 with air
temperature of 41.19°C at 2:00pm. The solar radiation value was 1019 W/m², 981 W/m² and 903W/m²
respectively. From the selected field measurement results, it can be deduced that high solar radiation
cause high air temperature in general, due to the high reflectivity rate of emitted radiation from solar
radiation to earth surface.
42.992
0
5
10
15
20
25
30
35
40
45
50
03-1月-14 03-2月-14 03-3月-14 03-4月-14 03-5月-14 03-6月-14
Air
Te
mp
era
ture
(°C
)
Measurement Day
Kuching: Daily Max Outdoor Air Temperature (°C) from 3 Jan to 29 Jun
2014
Preprints (www.preprints.org) | NOT PEER-REVIEWED | Posted: 10 September 2020 doi:10.20944/preprints202009.0221.v1
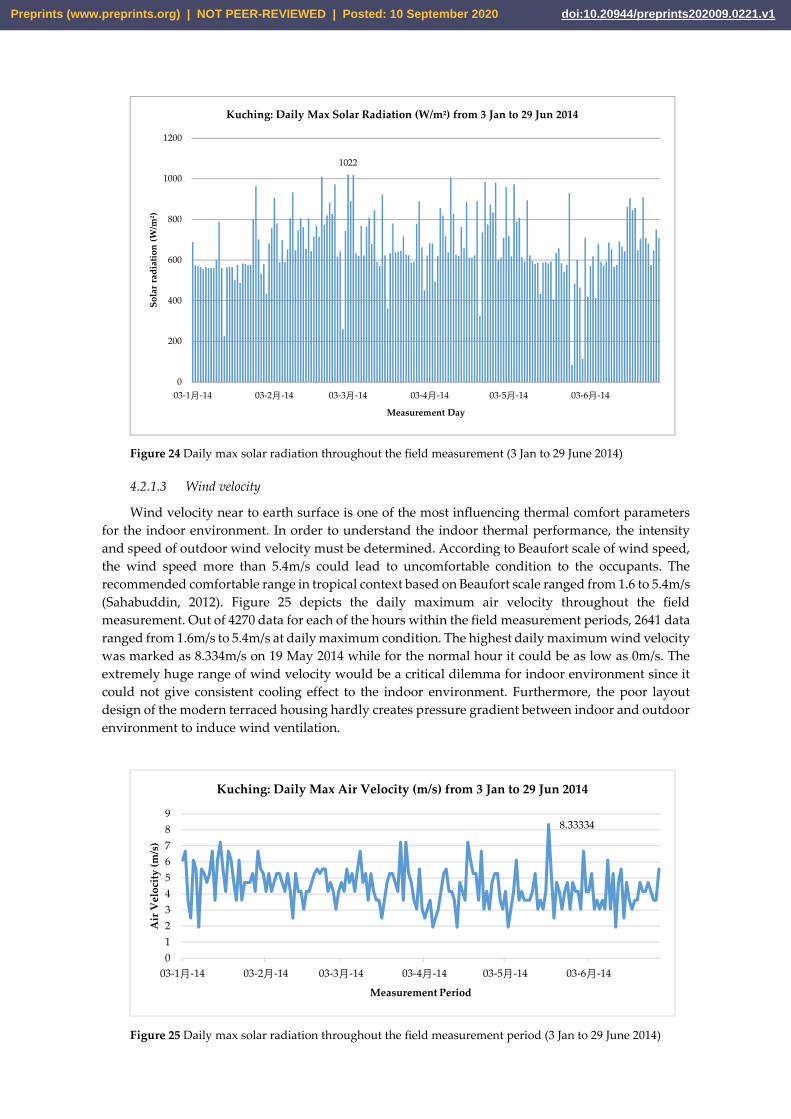
Figure 24 Daily max solar radiation throughout the field measurement (3 Jan to 29 June 2014)
4.2.1.3 Wind velocity
Wind velocity near to earth surface is one of the most influencing thermal comfort parameters
for the indoor environment. In order to understand the indoor thermal performance, the intensity
and speed of outdoor wind velocity must be determined. According to Beaufort scale of wind speed,
the wind speed more than 5.4m/s could lead to uncomfortable condition to the occupants. The
recommended comfortable range in tropical context based on Beaufort scale ranged from 1.6 to 5.4m/s
(Sahabuddin, 2012). Figure 25 depicts the daily maximum air velocity throughout the field
measurement. Out of 4270 data for each of the hours within the field measurement periods, 2641 data
ranged from 1.6m/s to 5.4m/s at daily maximum condition. The highest daily maximum wind velocity
was marked as 8.334m/s on 19 May 2014 while for the normal hour it could be as low as 0m/s. The
extremely huge range of wind velocity would be a critical dilemma for indoor environment since it
could not give consistent cooling effect to the indoor environment. Furthermore, the poor layout
design of the modern terraced housing hardly creates pressure gradient between indoor and outdoor
environment to induce wind ventilation.
Figure 25 Daily max solar radiation throughout the field measurement period (3 Jan to 29 June 2014)
1022
0
200
400
600
800
1000
1200
03-1月-14 03-2月-14 03-3月-14 03-4月-14 03-5月-14 03-6月-14
So
lar
rad
iati
on
(W
/m²)
Measurement Day
Kuching: Daily Max Solar Radiation (W/m²) from 3 Jan to 29 Jun 2014
8.33334
0
1
2
3
4
5
6
7
8
9
03-1月-14 03-2月-14 03-3月-14 03-4月-14 03-5月-14 03-6月-14
Air
Vel
oci
ty (
m/s
)
Measurement Period
Kuching: Daily Max Air Velocity (m/s) from 3 Jan to 29 Jun 2014
Preprints (www.preprints.org) | NOT PEER-REVIEWED | Posted: 10 September 2020 doi:10.20944/preprints202009.0221.v1
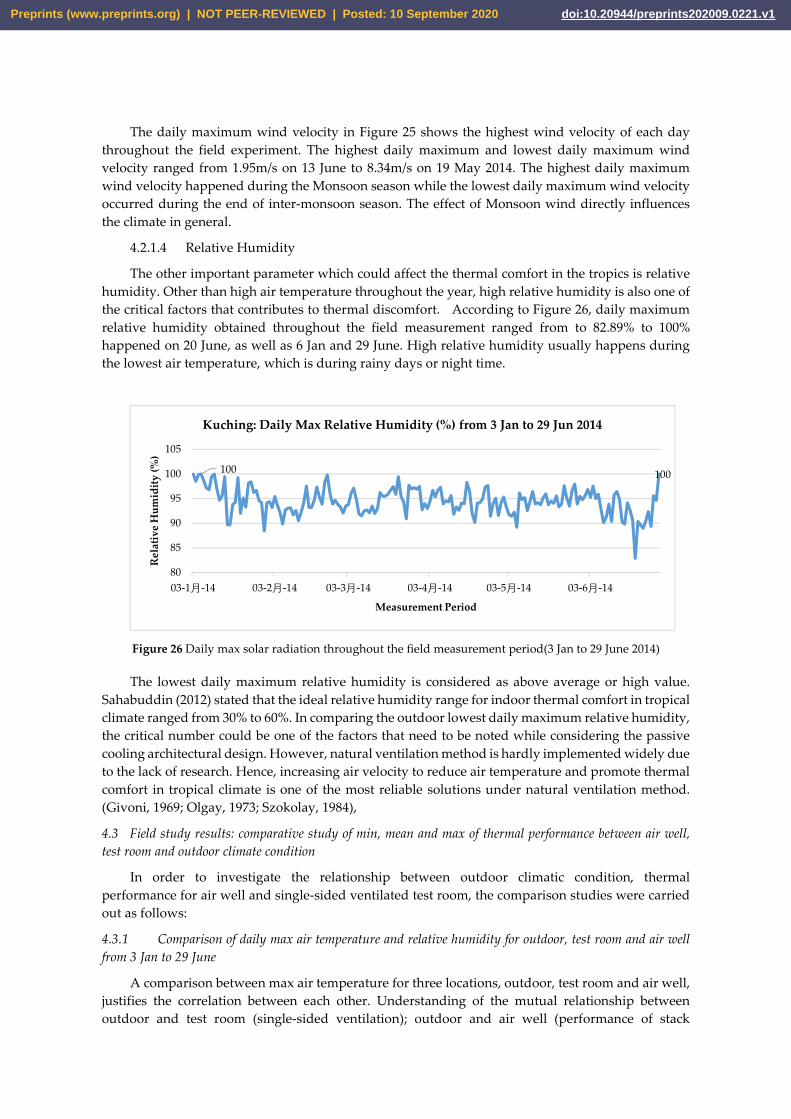
The daily maximum wind velocity in Figure 25 shows the highest wind velocity of each day
throughout the field experiment. The highest daily maximum and lowest daily maximum wind
velocity ranged from 1.95m/s on 13 June to 8.34m/s on 19 May 2014. The highest daily maximum
wind velocity happened during the Monsoon season while the lowest daily maximum wind velocity
occurred during the end of inter-monsoon season. The effect of Monsoon wind directly influences
the climate in general.
4.2.1.4 Relative Humidity
The other important parameter which could affect the thermal comfort in the tropics is relative
humidity. Other than high air temperature throughout the year, high relative humidity is also one of
the critical factors that contributes to thermal discomfort. According to Figure 26, daily maximum
relative humidity obtained throughout the field measurement ranged from to 82.89% to 100%
happened on 20 June, as well as 6 Jan and 29 June. High relative humidity usually happens during
the lowest air temperature, which is during rainy days or night time.
Figure 26 Daily max solar radiation throughout the field measurement period(3 Jan to 29 June 2014)
The lowest daily maximum relative humidity is considered as above average or high value.
Sahabuddin (2012) stated that the ideal relative humidity range for indoor thermal comfort in tropical
climate ranged from 30% to 60%. In comparing the outdoor lowest daily maximum relative humidity,
the critical number could be one of the factors that need to be noted while considering the passive
cooling architectural design. However, natural ventilation method is hardly implemented widely due
to the lack of research. Hence, increasing air velocity to reduce air temperature and promote thermal
comfort in tropical climate is one of the most reliable solutions under natural ventilation method.
(Givoni, 1969; Olgay, 1973; Szokolay, 1984),
4.3 Field study results: comparative study of min, mean and max of thermal performance between air well,
test room and outdoor climate condition
In order to investigate the relationship between outdoor climatic condition, thermal
performance for air well and single-sided ventilated test room, the comparison studies were carried
out as follows:
4.3.1 Comparison of daily max air temperature and relative humidity for outdoor, test room and air well
from 3 Jan to 29 June
A comparison between max air temperature for three locations, outdoor, test room and air well,
justifies the correlation between each other. Understanding of the mutual relationship between
outdoor and test room (single-sided ventilation); outdoor and air well (performance of stack
100 100
80
85
90
95
100
105
03-1月-14 03-2月-14 03-3月-14 03-4月-14 03-5月-14 03-6月-14
Re
lati
ve
Hu
mid
ity
(%
)
Measurement Period
Kuching: Daily Max Relative Humidity (%) from 3 Jan to 29 Jun 2014
Preprints (www.preprints.org) | NOT PEER-REVIEWED | Posted: 10 September 2020 doi:10.20944/preprints202009.0221.v1
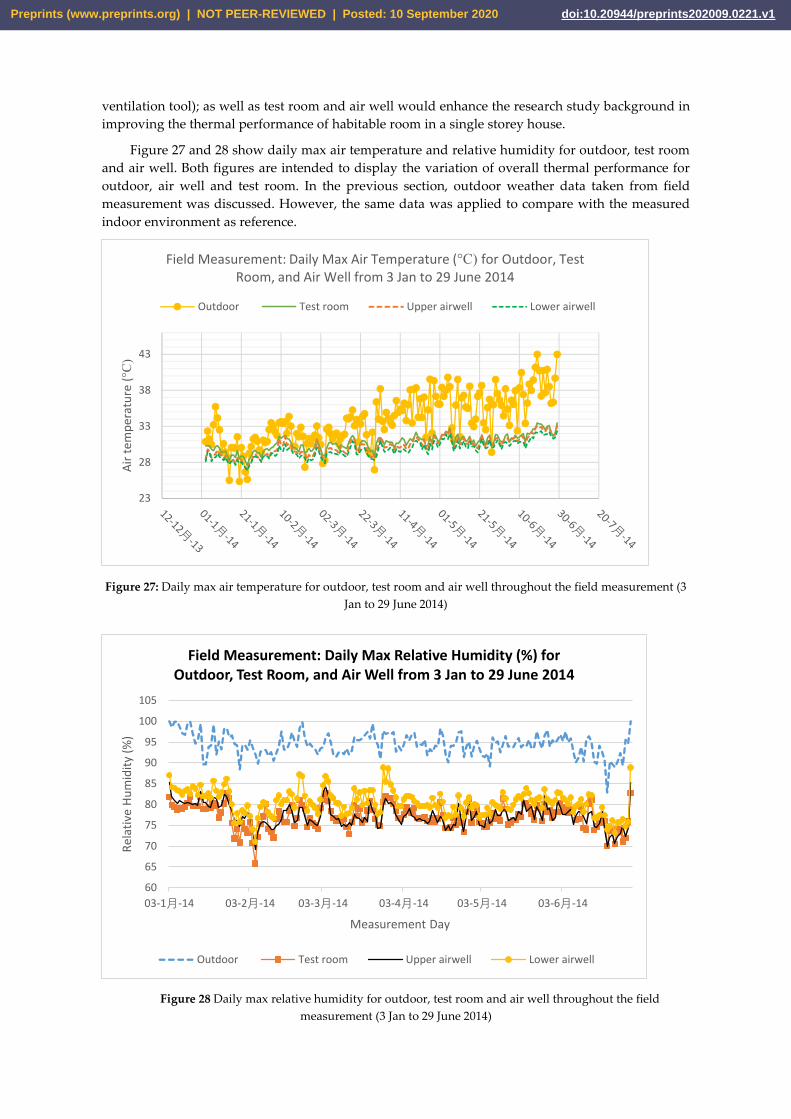
ventilation tool); as well as test room and air well would enhance the research study background in
improving the thermal performance of habitable room in a single storey house.
Figure 27 and 28 show daily max air temperature and relative humidity for outdoor, test room
and air well. Both figures are intended to display the variation of overall thermal performance for
outdoor, air well and test room. In the previous section, outdoor weather data taken from field
measurement was discussed. However, the same data was applied to compare with the measured
indoor environment as reference.
Figure 27: Daily max air temperature for outdoor, test room and air well throughout the field measurement (3
Jan to 29 June 2014)
Figure 28 Daily max relative humidity for outdoor, test room and air well throughout the field
measurement (3 Jan to 29 June 2014)
23
28
33
38
43
Air
tem
per
atu
re (
°C)
Field Measurement: Daily Max Air Temperature (°C) for Outdoor, Test Room, and Air Well from 3 Jan to 29 June 2014
Outdoor Test room Upper airwell Lower airwell
60
65
70
75
80
85
90
95
100
105
03-1月-14 03-2月-14 03-3月-14 03-4月-14 03-5月-14 03-6月-14
Rel
ativ
e H
um
idit
y (%
)
Measurement Day
Field Measurement: Daily Max Relative Humidity (%) for Outdoor, Test Room, and Air Well from 3 Jan to 29 June 2014
Outdoor Test room Upper airwell Lower airwell
Preprints (www.preprints.org) | NOT PEER-REVIEWED | Posted: 10 September 2020 doi:10.20944/preprints202009.0221.v1
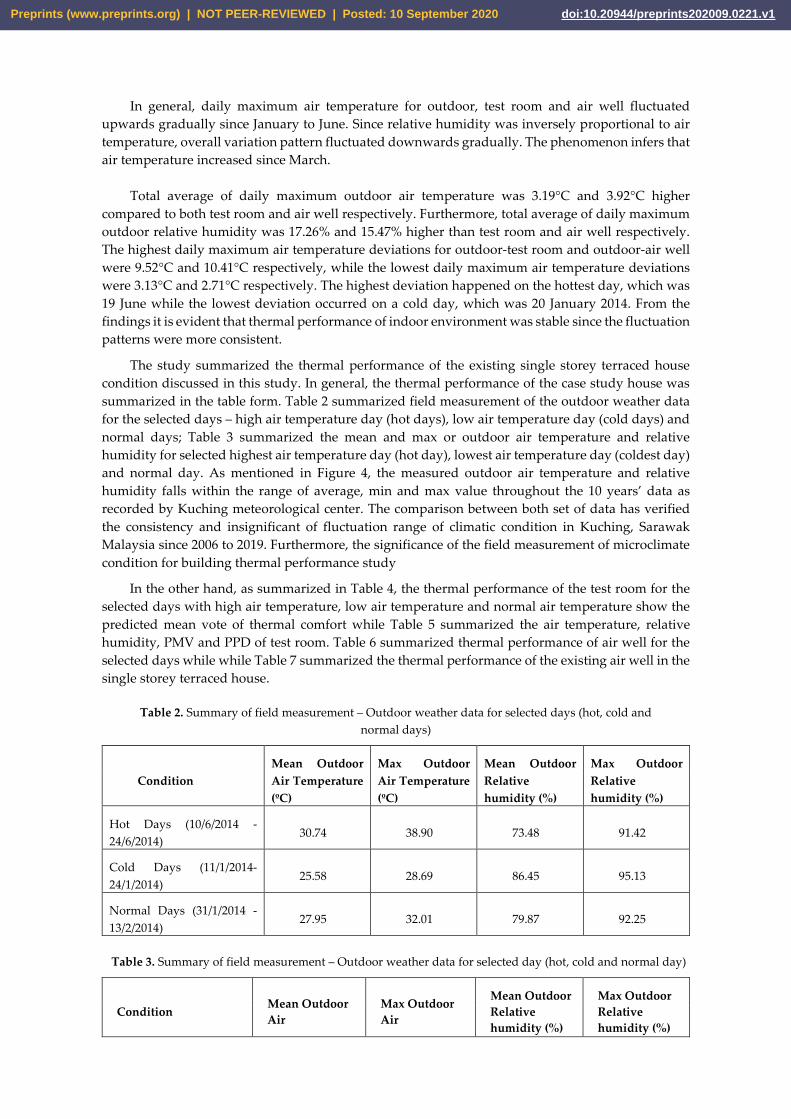
In general, daily maximum air temperature for outdoor, test room and air well fluctuated
upwards gradually since January to June. Since relative humidity was inversely proportional to air
temperature, overall variation pattern fluctuated downwards gradually. The phenomenon infers that
air temperature increased since March.
Total average of daily maximum outdoor air temperature was 3.19°C and 3.92°C higher
compared to both test room and air well respectively. Furthermore, total average of daily maximum
outdoor relative humidity was 17.26% and 15.47% higher than test room and air well respectively.
The highest daily maximum air temperature deviations for outdoor-test room and outdoor-air well
were 9.52°C and 10.41°C respectively, while the lowest daily maximum air temperature deviations
were 3.13°C and 2.71°C respectively. The highest deviation happened on the hottest day, which was
19 June while the lowest deviation occurred on a cold day, which was 20 January 2014. From the
findings it is evident that thermal performance of indoor environment was stable since the fluctuation
patterns were more consistent.
The study summarized the thermal performance of the existing single storey terraced house
condition discussed in this study. In general, the thermal performance of the case study house was
summarized in the table form. Table 2 summarized field measurement of the outdoor weather data
for the selected days – high air temperature day (hot days), low air temperature day (cold days) and
normal days; Table 3 summarized the mean and max or outdoor air temperature and relative
humidity for selected highest air temperature day (hot day), lowest air temperature day (coldest day)
and normal day. As mentioned in Figure 4, the measured outdoor air temperature and relative
humidity falls within the range of average, min and max value throughout the 10 years’ data as
recorded by Kuching meteorological center. The comparison between both set of data has verified
the consistency and insignificant of fluctuation range of climatic condition in Kuching, Sarawak
Malaysia since 2006 to 2019. Furthermore, the significance of the field measurement of microclimate
condition for building thermal performance study
In the other hand, as summarized in Table 4, the thermal performance of the test room for the
selected days with high air temperature, low air temperature and normal air temperature show the
predicted mean vote of thermal comfort while Table 5 summarized the air temperature, relative
humidity, PMV and PPD of test room. Table 6 summarized thermal performance of air well for the
selected days while while Table 7 summarized the thermal performance of the existing air well in the
single storey terraced house.
Table 2. Summary of field measurement – Outdoor weather data for selected days (hot, cold and
normal days)
Condition
Mean Outdoor
Air Temperature
(ºC)
Max Outdoor
Air Temperature
(ºC)
Mean Outdoor
Relative
humidity (%)
Max Outdoor
Relative
humidity (%)
Hot Days (10/6/2014 -
24/6/2014) 30.74 38.90 73.48 91.42
Cold Days (11/1/2014-
24/1/2014) 25.58 28.69 86.45 95.13
Normal Days (31/1/2014 -
13/2/2014) 27.95 32.01 79.87 92.25
Table 3. Summary of field measurement – Outdoor weather data for selected day (hot, cold and normal day)
Condition Mean Outdoor
Air
Max Outdoor
Air
Mean Outdoor
Relative
humidity (%)
Max Outdoor
Relative
humidity (%)
Preprints (www.preprints.org) | NOT PEER-REVIEWED | Posted: 10 September 2020 doi:10.20944/preprints202009.0221.v1
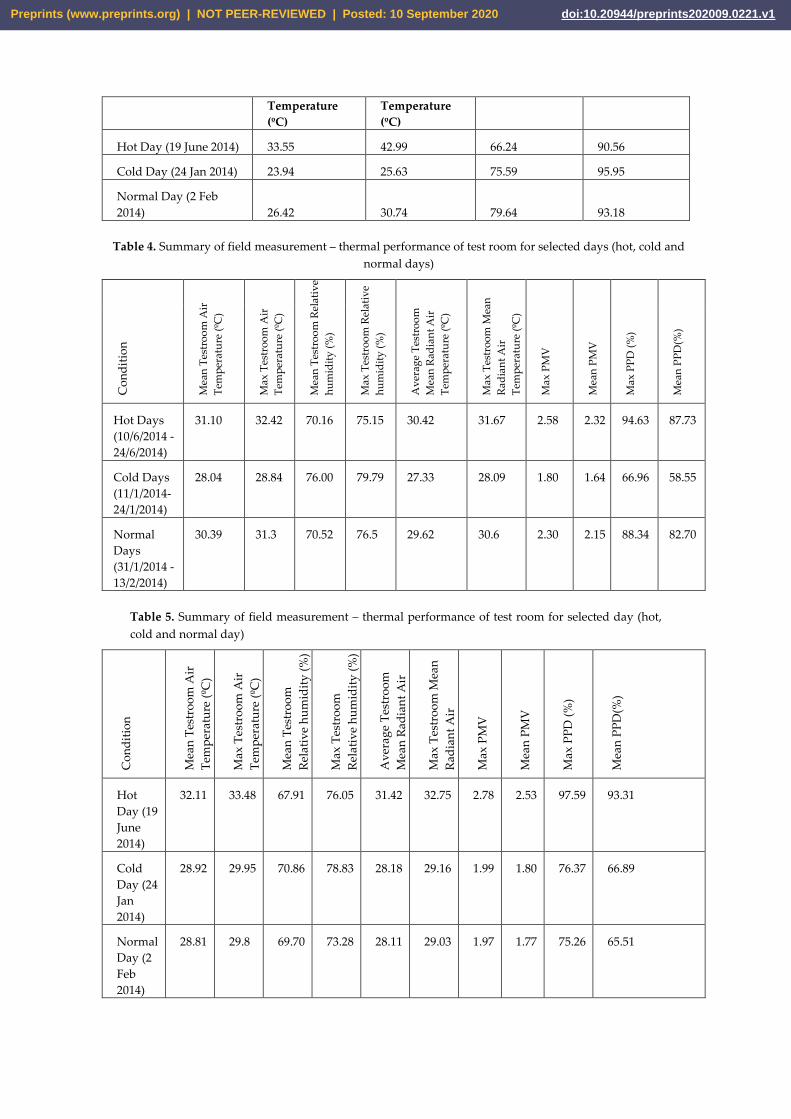
Temperature
(ºC)
Temperature
(ºC)
Hot Day (19 June 2014) 33.55 42.99 66.24 90.56
Cold Day (24 Jan 2014) 23.94 25.63 75.59 95.95
Normal Day (2 Feb
2014) 26.42 30.74 79.64 93.18
Table 4. Summary of field measurement – thermal performance of test room for selected days (hot, cold and
normal days)
Co
nd
itio
n
Mea
n T
estr
oo
m A
ir
Tem
per
atu
re (
ºC)
Ma
x T
estr
oo
m A
ir
Tem
per
atu
re (
ºC)
Mea
n T
estr
oo
m R
ela
tiv
e
hu
mid
ity
(%
)
Ma
x T
estr
oo
m R
ela
tiv
e
hu
mid
ity
(%
)
Av
era
ge
Tes
tro
om
Mea
n R
ad
ian
t A
ir
Tem
per
atu
re (
ºC)
Ma
x T
estr
oo
m M
ean
Ra
dia
nt
Air
Tem
per
atu
re (
ºC)
Ma
x P
MV
Mea
n P
MV
Ma
x P
PD
(%
)
Mea
n P
PD
(%)
Hot Days
(10/6/2014 -
24/6/2014)
31.10 32.42 70.16 75.15 30.42 31.67 2.58 2.32 94.63 87.73
Cold Days
(11/1/2014-
24/1/2014)
28.04 28.84 76.00 79.79 27.33 28.09 1.80 1.64 66.96 58.55
Normal
Days
(31/1/2014 -
13/2/2014)
30.39 31.3 70.52 76.5 29.62 30.6 2.30 2.15 88.34 82.70
Table 5. Summary of field measurement – thermal performance of test room for selected day (hot,
cold and normal day)
Co
nd
itio
n
Mea
n T
estr
oo
m A
ir
Tem
per
atu
re (
ºC)
Ma
x T
estr
oo
m A
ir
Tem
per
atu
re (
ºC)
Mea
n T
estr
oo
m
Rel
ati
ve
hu
mid
ity
(%
)
Ma
x T
estr
oo
m
Rel
ati
ve
hu
mid
ity
(%
)
Av
era
ge
Tes
tro
om
Mea
n R
ad
ian
t A
ir
Tem
per
atu
re (
ºC)
Ma
x T
estr
oo
m M
ean
Rad
ian
t A
ir
Tem
per
atu
re (
ºC)
Ma
x P
MV
Mea
n P
MV
Ma
x P
PD
(%
)
Mea
n P
PD
(%)
Hot
Day (19
June
2014)
32.11 33.48 67.91 76.05 31.42 32.75 2.78 2.53 97.59 93.31
Cold
Day (24
Jan
2014)
28.92 29.95 70.86 78.83 28.18 29.16 1.99 1.80 76.37 66.89
Normal
Day (2
Feb
2014)
28.81 29.8 69.70 73.28 28.11 29.03 1.97 1.77 75.26 65.51
Preprints (www.preprints.org) | NOT PEER-REVIEWED | Posted: 10 September 2020 doi:10.20944/preprints202009.0221.v1
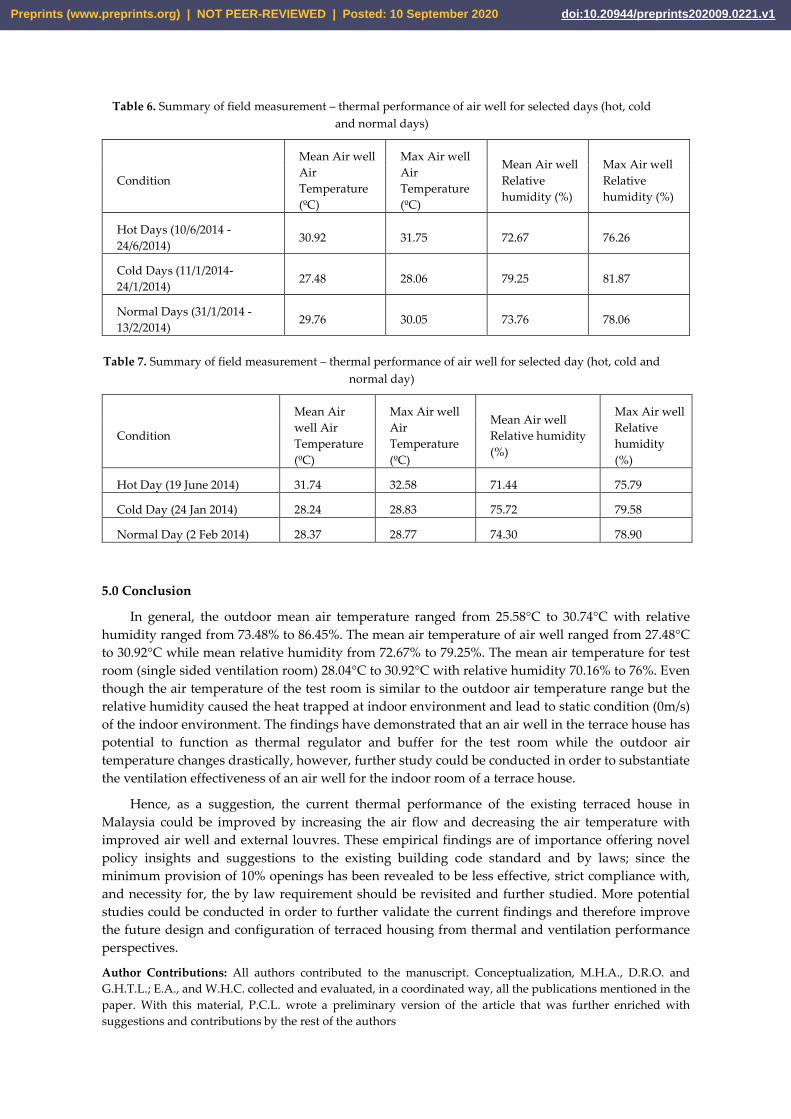
Table 6. Summary of field measurement – thermal performance of air well for selected days (hot, cold
and normal days)
Condition
Mean Air well
Air
Temperature
(ºC)
Max Air well
Air
Temperature
(ºC)
Mean Air well
Relative
humidity (%)
Max Air well
Relative
humidity (%)
Hot Days (10/6/2014 -
24/6/2014) 30.92 31.75 72.67 76.26
Cold Days (11/1/2014-
24/1/2014) 27.48 28.06 79.25 81.87
Normal Days (31/1/2014 -
13/2/2014) 29.76 30.05 73.76 78.06
Table 7. Summary of field measurement – thermal performance of air well for selected day (hot, cold and
normal day)
Condition
Mean Air
well Air
Temperature
(ºC)
Max Air well
Air
Temperature
(ºC)
Mean Air well
Relative humidity
(%)
Max Air well
Relative
humidity
(%)
Hot Day (19 June 2014) 31.74 32.58 71.44 75.79
Cold Day (24 Jan 2014) 28.24 28.83 75.72 79.58
Normal Day (2 Feb 2014) 28.37 28.77 74.30 78.90
5.0 Conclusion
In general, the outdoor mean air temperature ranged from 25.58°C to 30.74°C with relative
humidity ranged from 73.48% to 86.45%. The mean air temperature of air well ranged from 27.48°C
to 30.92°C while mean relative humidity from 72.67% to 79.25%. The mean air temperature for test
room (single sided ventilation room) 28.04°C to 30.92°C with relative humidity 70.16% to 76%. Even
though the air temperature of the test room is similar to the outdoor air temperature range but the
relative humidity caused the heat trapped at indoor environment and lead to static condition (0m/s)
of the indoor environment. The findings have demonstrated that an air well in the terrace house has
potential to function as thermal regulator and buffer for the test room while the outdoor air
temperature changes drastically, however, further study could be conducted in order to substantiate
the ventilation effectiveness of an air well for the indoor room of a terrace house.
Hence, as a suggestion, the current thermal performance of the existing terraced house in
Malaysia could be improved by increasing the air flow and decreasing the air temperature with
improved air well and external louvres. These empirical findings are of importance offering novel
policy insights and suggestions to the existing building code standard and by laws; since the
minimum provision of 10% openings has been revealed to be less effective, strict compliance with,
and necessity for, the by law requirement should be revisited and further studied. More potential
studies could be conducted in order to further validate the current findings and therefore improve
the future design and configuration of terraced housing from thermal and ventilation performance
perspectives.
Author Contributions: All authors contributed to the manuscript. Conceptualization, M.H.A., D.R.O. and
G.H.T.L.; E.A., and W.H.C. collected and evaluated, in a coordinated way, all the publications mentioned in the
paper. With this material, P.C.L. wrote a preliminary version of the article that was further enriched with
suggestions and contributions by the rest of the authors
Preprints (www.preprints.org) | NOT PEER-REVIEWED | Posted: 10 September 2020 doi:10.20944/preprints202009.0221.v1
Funding: This research publication was funded by UTM Transdisciplinary Research Grant, grant number
Q.J130000.3552.07G55
Acknowledgments: The authors wish to deliver the appreciation to Building Science Laboratory, Faculty of Built
Environment and Surveying, Universiti Teknologi Malaysia for the field measurement instruments as well as
the owner of case study house—Leng Wee Woon & Liew Thai Jin for the permission to set up field measurement
for the study
Conflicts of Interest: The authors declare no conflict of interest. The funders had no role in the design of the
study; in the collection, analyses, or interpretation of data; in the writing of the manuscript, or in the decision to
publish the results.
References
1. A. Abdul Malik, and Young, A. (1993). Thermal comfort study as an aid to determine energy savings in
building in Malaysia. Paper presented at the Proc. Energex 93, Seoul.
2. Abraham Seno Bachrun, Christy Vidiyanti. Lokman Hakim Ismail, I. A. W. (2020) ‘House’s Solar Chimney
A Numerical Analysis on the Thermal Performance in Jakarta’, Sinergi, Vol. 24(No.3), pp. 245–252.
3. Dimoudi. (2014). Solar Chimney in Buildings - The State of the Art. Advances in Building Energy Research,
3:1, 21-44.
4. Gamage, W. et al. (2017) ‘Effectiveness of air-well type courtyards on moderating thermal environments in
tropical Chinese Shophouse’, Architectural Science Review, 60(6), pp. 493–506. doi:
10.1080/00038628.2017.1383230.
5. A.P. Gagge, J. A. J. S., Y. Nishi. (1971). An effective temperature scale based on a simple model of human
physiological regulatory response. ASHRAE Transactions, 77-1(19971), 247-262.
6. Abdul Rahman, S. (1999). Air flow and Thermal Comfort Studies in Naturally Ventilated Classrooms In a
school. . Universiti Teknologi Malaysia.
7. Abdul Rahman, S. and Kannan, K. S. (1997a, November 3-6). A study of thermal comfort in naturally
ventilated classrooms: towards new indoor temperature standards. Paper presented at the Proceedings of
the Asia-Pacific Conference on the Built Environment, Petaling Jaya, Malaysia, 137-149.
8. Abdul Rahman, S. and Kannan, K. S. (1997b). A study of thermal comfort in naturally ventilated
classrooms: towards new indoor temperature standards. Paper presented at the Proceedings of the Asia-
Pacific Conference on the Built Environment, November 3-6, Petaling Jaya, Malaysia, pp. 137-149.
9. Agung Murti Nugroho, and Ahmad, M. H. (2014). Passive Cooling Performance of a Solar Chimney and
Vertical Landscape Applications in Indonesian Terraced House. Jurnal Teknologi, 70(70), 99-104.
10. Agung Murti Nugroho, Mohd Hamdan Ahmad, and Hiung, T. J. (2006). Evaluation of parametrics for the
development of vertical solar chimney ventilation in hot and humid climate. Paper presented at the 2nd
International Network for Tropical Architecture Conference, Christian Wacana University, Jogjakarta, 160-
170.
11. Nugroho, Agung Murti et al. (2020) ‘Courtyard as Tropical Hot Humid Passive Design Strategy: Case Study
of Indonesian Contemporary Houses in Surabaya Indonesia’, Journal of Design and Built Environment,
20(2(2020)), pp. 1–12.
12. Ali, A. A. M. (2013). Using simulation for studying the influence of horizontal shading device protrusion
on the thermal performance of spaces in residential buildings. Alexandria Engineering Journal, 52(4), 787-
796.
13. Ali, M. (2004). Dynamic thermal performance of construction materials in the design of a terrace house in
Klang Valley, Malaysia for satisfactory thermal comfort. Universiy of Malaya, Kuala Lumpur, Malaysia.
14. Allocca, C., Chen, Q. and Glicksman, L. R. (2003). Design analysis of single-sided natural ventilation.
Energy and Buildings, 35(8), 785-795.
15. Al-Obaidi, M. A. A. H. and Woods, P. (2006). Investigations on effect of the orientation on thermal comfort
in terraced housing in Malaysia. International Journal of Low-Carbon Technologies, 1(2), 167-176.
16. Alonso, G., Pérez-Grande, I. and Meseguer, J. (2014). Galloping instabilities of Z-shaped shading louvers.
Indoor and Built Environment.
17. Al-Tamimi, N. A. M., Fadzil, S. F. S. and Harun, W. M. W. (2011). The Effects of Orientation, Ventilation,
and Varied WWR on the Thermal Performance of Residential Rooms in the Tropics. Journal of Sustainable
Development, 4(2), 142-149.
Preprints (www.preprints.org) | NOT PEER-REVIEWED | Posted: 10 September 2020 doi:10.20944/preprints202009.0221.v1
18. Auliciems, A. and Szokolay, S. V. (2007). Thermal Comfort. In PLEA (Ed.), PLEA Notes. University of
Queensland Department of Architecture.
19. Awbi, H. (2010). Basic concepts for natural ventilation of buildings. On CISBE BSG Seminar: Natural and
mix-mode ventilation modelling. Berkshire, United Kingdom: University of Reading.
20. Awbi, H. B. (1991). Ventilation of building. London: E&FN Spoon.
21. Aynsley R.M, Melbourne. W. and Vickery, A. B. J. (1977). Architectural aerodynamics. London Applied
science Publishers.
22. Soflaei, F., Shokouhian, M. and Mofidi Shemirani, S. M. (2016) ‘Investigation of Iranian traditional
courtyard as passive cooling strategy (a field study on BS climate)’, International Journal of Sustainable
Built Environment, 5(1). doi: 10.1016/j.ijsbe.2015.12.001.
23. Azni Z.A., Samirah A.R. and S. S. (2005). Natural Cooling and Ventilation of Contemporary Residential
Homes in Malaysia: Impact on Indoor Thermal Comfort. Paper presented at the 2005 World Sustainable
Building Conference (SBO5). , Tokyo, Japan.
24. Bansal, N. K., Mathur, J., Mathur, S. and Jain, M. (2005). Modeling of window-sized solar chimneys for
ventilation. Building and Environment, 40(10), 1302-1308.
25. Bansal, N. K., Mathur, R. and Bhandari, M. S. (1994). A study of solar chimney assisted wind tower system
for natural ventilation in buildings. Building and Environment, 29(4), 495-500.
26. Barozzi, G., Imbabi, M., Nobile, E. and Sousa. (1992). Physical and numerical modeling of a solar chimney
based ventilation system for buildings. Building and Environment, 27(4), 433-445.
27. Barry, R. G. and Chorley, R. J. (1998). Atmosphere, Weather & Climate (Vol. 7th Edition). London:
Routledge.
28. Bassiouny, R. and Korah, N. S. A. (2009). Effect of solar chimney inclination angle on space flow pattern
and ventilation rate. Energy and Buildings, 41(2), 190-196.
29. Brooks, C. E. P. (1950). Climate in Everyday Life. London: Ernest Bemm.
30. BSI, B. S. I. (2008). Indoor Environmental Input Parameters for Design and Assessment of Energy
Performance of Buildings Addressing Indoor Air Quality, Thermal Environment, Lighting and Acoustics.,
BS EN 15251:2007. London.
31. BSI. (2006). BS EN ISO 7730:2005 Ergonomics of the Thermal Environment – Analytical Determination and
Interpretation of Thermal Comfort Using Calculation of the PMV and PPD Indices and Local Thermal
Comfort Criteria. London.: British Standards Institute.
32. Burt. C, and Button, W. (1969). Window and environment. United Kingdom: Pilkington Brothers Limited.
33. Busch, J. F. (1992). A tale of two populations: thermal comfort in air-conditioned and naturally ventilated
offices in Thailand. Energy and Buildings, 18(3-4), 235-249.
34. Chan, S. C., Che-Ani, A. I. and Nik Ibrahim, N. L. (2014). Passive designs in sustaining natural ventilation
in school office buildings in Seremban, Malaysia. International Journal of Sustainable Built Environment(0).
35. Chander, R. (1979). Housing needs in Peninsular Malaysia, 1970-1990. In S. H. a. H. S. Tan (Ed.), Public and
Private Housing in Malaysia (pp. 5-22). Kuala Lumpur: Heinemann Educational Books (Asia) Ltd.
36. Di Foggia, G. (2018) ‘Energy efficiency measures in buildings for achieving sustainable development goals’,
Heliyon, 4(11), p. e00953. doi: https://doi.org/10.1016/j.heliyon.2018.e00953.
37. Duan, S., Jing, C., and Long, E. (2015). Transient flows in displacement ventilation enhanced by solar
chimney and fan. Energy and Buildings, 103, 124-130.
38. Dufton, A. F. (1929). The eupatheoscope
39. Elghamry, R. and Hassan, H. (2020) ‘An experimental work on the impact of new combinations of solar
chimney, photovoltaic and geothermal air tube on building cooling and ventilation’, SOLAR ENERGY.
THE BOULEVARD, LANGFORD LANE, KIDLINGTON, OXFORD OX5 1GB, ENGLAND: PERGAMON-
ELSEVIER SCIENCE LTD, 205, pp. 142–153. doi: 10.1016/j.solener.2020.05.049.
40. Ellis, F. P. (1953). Thermal comfort in warm and humid atmospheres: observations on groups and
individuals in Singapore. Journal of Hygiene,, 51( 386-403).
41. EnergyPlus. (2013). EnergyPlus Thermal Comfort. Thermal Comfort Model Retrieved 17 December 2013,
2013, from http://www.designbuilder.co.uk/helpv2/Content/Thermal_Comfort.htm
42. Farea, T. G., Ossen, D. R., Alkaff, S. and Kotani, H. (2015). CFD modeling for natural ventilation in a
lightwell connected to outdoor through horizontal voids. Energy and Buildings, 86(0), 502-513.
43. Fazeli, A. (2014). Environmental Fluids Mechanics. Atmospheric boundary-layer profiles, from
http://egeology.blogfa.com/post-95.aspx
Preprints (www.preprints.org) | NOT PEER-REVIEWED | Posted: 10 September 2020 doi:10.20944/preprints202009.0221.v1
44. Feriadi, H. and Wong, N. H. (2004). Thermal comfort for naturally ventilated houses in Indonesia. Energy
and Buildings, 36(7), 614-626.
45. Frederikus Wenehenubun, Andy Saputra, and Sutanto, H. (2015). An experimental study on the
performance of Savonius wind turbines related with the number of blades. Paper presented at the 2nd
International Conference on Sustainable Energy Engineering and Application, ICSEEA 2014, Jakarta,
Indonesia.
46. Gontikaki, M. (2010). Optimization of a solar chimney to enhance natural ventilation and heat harvesting
in a multi-storey office building. Technical University of Eindhoven, Netherlands.
47. Gratia, E. and De Herde, A. (2007). Are energy consumptions decreased with the addition of a double-skin?
Energy and Buildings, 39(5), 605-619.
48. Gurupiah, M. R. (1999). daylighting Considerations in the Design of Living Dining Room Spaces in Single
Storey Terrace Houses in Malaysia. Universiti Teknologi Malaysia, Malaysia.
49. H.B.Awbi. (1996). Air movement in naturally-ventilated buildings. Renew. Energy, 8(1996), 241-247.
50. Hughes, B. R. and Ghani, S. (2010). A numerical investigation into the effect of Windvent louvre external
angle on passive stack ventilation performance. Building and Environment, 45(4), 1025-1036.
51. Hui, S. K. (1998). Natural ventilation of low cost dwellings in the hot humid tropics Malaysia. Universiti
Teknologi Malaysia, Skudai.
52. Humphrey, M. A. (1978). Outdoor Temperatures and Comfort Indoors: Building Research Station,
Department of Environmento. Document Number)
53. Humphrey, M. A. (1994). Fields studies and climate chamber experiments in thermal comfort research.
Building Research Establishment paper 52(72), pp. 52-69.
54. Humphreys, M. A. and J.F. Nicol. (1998). Understanding the adaptive approach to thermal comfort.
ASHRAE Transactions, , 104 (Part 1b), 991-1004.
55. Ismail Said, Raja Nafidah, R.S.S, and Rajeh, M. (1999). Reintroduction of Ventilation Components for
Terrace Houses in Malaysia. Paper presented at the 3rd International Symposium on Asia Pacific
Architecture, Manoa, Honolulu, Hawaii.
56. Ismail, A. M. (1996a). Wind driven natural ventilation in high-rise office building with special reference to
hot-humid climate of Malaysia. University of Wales College of Cardiff, Cardiff.
57. Ismail, M., Mohd Sofian, N. Z. and Abdullah, A. M. (2010). Indoor Air Quality in Selected Samples of
Primary Schools in Kuala Terengganu, Malaysia. Environment Asia, 3(special ), 103-108.
58. Karava, P., Stathopoulos, T. and Athienitis, A. K. (2011). Airflow assessment in cross-ventilated buildings
with operable façade elements. Building and Environment, 46(1), 266-279.
59. Karyono, T. H. (2000). Report on thermal comfort and building energy studies in Jakarta—Indonesia.
Building and Environment, 35(1), 77-90.
60. Kasaeian, A., Ghalamchi, M., and Ghalamchi, M. (2014a). Simulation and optimization of geometric
parameters of a solar chimney in Tehran. Energy Conversion and Management, 83(0), 28-34.
61. Koo, S. Y., Yeo, M. S., and Kim, K. W. (2010). Automated blind control to maximize the benefits of daylight
in buildings. Building and Environment, 45(6), 1508-1520.
62. Kubota, T., Chyee, D. T. H., and Ahmad, S. (2009). The effects of night ventilation technique on indoor
thermal environment for residential buildings in hot-humid climate of Malaysia. Energy and Buildings,
41(8), 829-839.
63. Kubota, T. & Toe, D. H. C. (2008) ‘Passive cooling of residential buildings in hot-humid climate of Malaysia:
night ventilation technique.’, in Proceedings in the 9th SENVAR + 2nd ISESEE 2008 conference. Shah Alam:
University Publication Centre, pp. 153–162.
64. Kubota, T., Miura, M., Tominaga, Y., and Mochida, A. (2008). Wind tunnel tests on the relationship between
building density and pedestrian-level wind velocity: Development of guidelines for realizing acceptable
wind environment in residential neighborhoods. Building and Environment, 43(10), 1699-1708.
65. Kukreja, C. P. (1978.). Tropical Architecture. : McGraw- Hill.
66. Kurazumi, Y., Tsuchikawa, T., Kondo, E., Horikoshi, T., and Matsubara, N. (2010). Conduction-corrected
modified effective temperature as the indices of combined and separate effect of environmental factors on
sensational temperature. Energy and Buildings, 42(4), 441-448.
67. Leng, P. C., Ahmad, M. H., Ossen, D. R., and Hamid, M. (2015). Effective Solar Chimney Cross Section
Ventilation Performance in Malaysia Terraced House. Procedia - Social and Behavioral Sciences, 179(0),
276-289.
Preprints (www.preprints.org) | NOT PEER-REVIEWED | Posted: 10 September 2020 doi:10.20944/preprints202009.0221.v1
68. Leon, M. A., and Kumar, S. (2007). Mathematical modeling and thermal performance analysis of unglazed
transpired solar collectors. Solar Energy, 81(1), 62-75.
69. Li, Z. (2007). Characteristics of Buoyancy Driven Natural Ventilation through Horizontal Openings.
Aalborg University, Denmark.
70. Madros, H. (1998, 9-10 July). Comfort Level in low cost housing in Johor Bahru. Paper presented at the
Conference on Low and Low-Medium Cost Housing Development, Kuching, Sarawak, Malaysia.
71. Mahmoud, N. H., El-Haroun, A. A., Wahba, E., and Nasef, M. H. (2012). An experimental study on
improvement of Savonius rotor performance. Alexandria Engineering Journal, 51(1), 19-25
72. Malaysia, D. o. S. (2002). Malaysian Standard - Code of practice on wind loading for building structure MS
1553 2002(Amendment 1:2013) (Vol. ICS:91.090). Malaysia: Department of Malaysian Standard.
73. Malaysia, D. o. S. (2007). Code of Practice on Energy Efficiency and use of Renewable Energy for Non-
Residential Buildings (First Version) MS 1525:2007 (Vol. ICS: 9104001). Malaysia.
74. Malaysia Meterorological Department. (2014). Rangkaian Stesen. Retrieved 2 March, 2014, from
<http://www.met.gov.my/index.php?option=com_ content&task =view&id= 1311&Itemid=1046&la
75. Mohd Peter Davis, Mazlin Ghazali, and Nordin, N. A. (2006). Thermal Comfort Honeycopmb Housing:
The Affordable Alternative To Terrace Housing. Serdang, Selangor: Institute of Advanced Technology,
University Putra Malaysia.
76. Mohit, M. A. and Mahfoud, A. K. A. (2015). Appraisal of residential satisfaction in double-storey terrace
housing in Kuala Lumpur, Malaysia. Habitat International, 49, 286-293.
77. NAPIC, N. P. I. C. M. (2019) Residential Property Transactions Data 2019. Putrajaya. Available at:
file:///D:/Download to D/080420DD&SSRes2019.pdf.
78. N.K. Bansal, R. Mathur, and Bhandari, M. S. (1994). A study of solar chimney assisted wind tower system
for natural ventilation in buildings. Building and Environment, 29 (4), 495-500.
79. N.K.Bansal, Rajesh Mathur, and M.S.Bhandari. (1993). Solar chimney for enhanced stack ventilation.
Building and Environment, 28(3), 373-377.
80. Ong, K. S. and Chow, C. C. (2003). Performance of a solar chimney. Solar Energy, 74(1), 1-17.
81. Orosa, J. A. (2009). Research on the Origins of Thermal Comfort. European Journal of Scientific Research,
34(4)(2009), 561-567.
82. Ossen, D. R. (2005a). Optimum Overhang Geometry for Controlling Fenestration Heat Gain and Building
Energy Saving in Tropics. Universiti Teknologi Malaysia, Malaysia.
83. Rahim, Z. A. and Hashim, A. H. (2012). Adapting to Terrace Housing Living in Malaysia. Procedia - Social
and Behavioral Sciences, 36(0), 147-157.
84. Rajeh, M. (1989). Natural Ventilation in Terrace Housing of Malaysia: Effect of Air Well on Air Flow and
Air Velocity. University of Queensland, Australia.
85. Rostam Afshar, N. (2018) ‘Climate change impact on water resources availability in Kuching, Sarawak’,
International Journal of Innovative Technology and Exploring Engineering (IJITEE), 7(5), pp. 30–34.
86. Saji, N. B. (2012). A review of Malaysian terraced house design and the tendency of changing. Journal of
Sustainable Development, 5(5), 140-149.
87. Sandberg, M. and Moshfegh, B. (1998). Ventilated-solar roof air flow and heat transfer investigation.
Renewable Energy, 15(1–4), 287-292.
88. Sarawak Energy, M. (2013). Solar Energy. Research & Development Retrieved 13 July, 2015, from
http://www.sarawakenergy.com.my/index.php/r-d/solar-energy
89. Seo Ryeung Ju, Saniah Ahmad Zaki, and Choi, Y. K. (2011). Contextual Modernization; New Town
Planning in Petaling Jaya, of Malaysia. Journal of Asian Architecture and Building Engineering, 93-100.
90. Szokolay, S. (2008). Introduction to Architectural Science. (Vol. 2): Architectural Press.
91. Szokolay, S. V. (1980). Environmental science handbooks for architecture and builders. New York: : John
Wiley & Sons Inc. and Lancaster, England: Construction Press Ltd.
92. T. Horikoshi, T. T., Y. Kurazumi, N. Matsubara. (1995). Mathematical expression of combined and separate
effect of air temperature, humidity, air velocity and thermal radiation on thermal comfort. Archives of
Complex Environmental Studies (ACES), 7(3-4) (1995), 9-12.
93. Tetsu Kubota, and Ahmad, S. (2006). Wind Environment Evaluation of Neighborhood Areas in Major
Towns of Malaysia. Journal of Asian Architecture and Building Engineering, 5(1 May 2006), 8.
Preprints (www.preprints.org) | NOT PEER-REVIEWED | Posted: 10 September 2020 doi:10.20944/preprints202009.0221.v1
94. Tetsu Kubota, Sangwoo Jeong, Doris Hooi Chyee, T. and Ossen, D. R. (2011). Energy Consumption and Air
Conditioning Usage in Residential Building of Malaysia. Journal of International Development of
Cooperation, 17.3, 61-69.
95. Thomson, P. D., and O'Brian, R. (1980). Weather: Times Life Books.
96. Toe, D. H. C. (2008). Night Ventilation Technique for Terraced Houses in Hot-Humid Climate of Malaysia.
Unpublished Open Access, Universiti Teknologi Malaysia, Skudai, Malaysia.
97. Toe, D. H. C. (2013a). Application of Passive Cooling Technique to Improve Indoor Thermal Comfort of
Modern Urban Houses in Hot-Humid Climate of Malaysia. Unpublished Open Access, Hiroshima
University, Hiroshima, Japan.
98. Tong Yang, and J.Clements-Croome, D. (Eds.). (2012) Encyclopedia of Sustainability Science and
Technology. SpingerLink.
99. Wang Liping, and Hien, W. N. (2007). Applying Natural Ventilation for Thermal Comfort in Residential
Buildings in Singapore. Architectural Science Review, 50.3, 224-233.
100. Wang, L. (2010). Design of double skin (envelope) as a solar chimney: Adapting natural ventilation in
double envelope for mild or warm climates. University of Southern California, U.S.
101. Wong, N. H., Feriadi, H., Lim, P. Y., Tham, K. W., Sekhar, C., and Cheong, K. W. (2002). Thermal comfort
evaluation of naturally ventilated public housing in Singapore. Building and Environment, 37(12), 1267-
1277.
102. Wong, N. H., Tan, A. Y. K., Ang, K. S., Mok, S., and Goh, A. (2012). Performance evaluation of solar chimney
system in the tropics. Paper presented at the ICSDC 2011: Integrating Sustainability Practices in the
Construction Industry - Proceedings of the International Conference on Sustainable Design and
Construction 2011, 299-305.
103. Yau, Y. H., and Pean, H. L. (2011). The climate change impact on air conditioner system and reliability in
Malaysia—A review. Renewable and Sustainable Energy Reviews, 15(9), 4939-4949.
104. Yeang, K. (1980). Notes on Factors Influencing the Design of Terrace Houses. Majalah Arkitek, 21-25.
105. Zainal, M., and Adnan, H. (1997). Thermal comfort and indoor air quality (IAQ) in factory environment.
Paper presented at the Proceedings of the Asia-Pacific Conference on the Built Environment, November 3-
6, Petaling Jaya, Malaysia, pp. 121-135.
106. Zainal, M., and Keong, C. C. (1996). Thermal comfort and energy conservation in factory buildings. Paper
presented at the Proceedings of the 7th International Conference on Indoor Air Quality and Climate
(INDOOR AIR ’96) from July 21-26.
107. Agung Murti Nugroho and Mohd Hamdan Ahmad, D. R. O. (2007) ‘A Preliminary Study of Thermal
Comfort in Malaysia’s Single Storey Terraced Houses’, Journal of Asian Architecture and Building
Engineering, 6:1, pp. 175–182. Available at:
https://www.tandfonline.com/doi/pdf/10.3130/jaabe.6.175?needAccess=true (Accessed: 1 September 2019).
108. Chung, L. P. et al. (2015) ‘Effective Solar Chimney Cross Section Ventilation Performance in Malaysia
Terraced House’, Procedia - Social and Behavioral Sciences. Elsevier, 179, pp. 276–289. doi:
10.1016/j.sbspro.2015.02.431.
109. Gamage, A. et al. (2017) ‘Effectiveness of air-well type courtyards on moderating thermal environments in
tropical Chinese Shophouse’, ARCHITECTURAL SCIENCE REVIEW. doi: 10.1080/00038628.2017.1383230.
110. Khanal, R. and Lei, C. (2011) ‘Solar chimney—A passive strategy for natural ventilation’, Energy and
Buildings. Elsevier, 43(8), pp. 1811–1819. doi: 10.1016/J.ENBUILD.2011.03.035.
111. Khosravi, M., Fazelpour, F. and Rosen, M. A. (2019) ‘Improved application of a solar chimney concept in a
two-story building: An enhanced geometry through a numerical approach’, Renewable Energy. Pergamon,
143, pp. 569–585. doi: 10.1016/j.renene.2019.05.042.
112. Leng, P. C. et al. (2019) ‘The impact of air well geometry in a Malaysian single storey terraced house’,
Sustainability (Switzerland), 11(20), p. 5730. doi: 10.3390/su11205730.
113. Zhang, L. et al. (2020) ‘Trombe wall for a residential building in Sichuan-Tibet alpine valley – A case study’,
Renewable Energy, 156, pp. 31–46. doi: https://doi.org/10.1016/j.renene.2020.04.067
Preprints (www.preprints.org) | NOT PEER-REVIEWED | Posted: 10 September 2020 doi:10.20944/preprints202009.0221.v1


![Thermal Comfort Booklet Spanish[1]](https://static.fdocuments.ec/doc/165x107/557201804979599169a1b9ed/thermal-comfort-booklet-spanish1.jpg)